Pt. 300, App. C - gpo.gov entry ‘‘Ruston Foundry, Alexandria, LA., effective ... Environmental...
23
225 Environmental Protection Agency Pt. 300, App. C TABLE 2—FEDERAL FACILITIES SECTION—Continued St Site name City/County Notes(a) WA ....................... Naval Air Station, Whidbey Island (Ault) ............................... Whidbey Island. WA ....................... Naval Undersea Warfare Station (4 Areas) .......................... Keyport. WA ....................... Old Navy Dump/Manchester Lab (USEPA/NOAA) ............... Manchester. WA ....................... Puget Sound Naval Shipyard Complex ................................. Bremerton. WV ....................... Allegany Ballistics Laboratory (USNAVY) ............................. Mineral. WV ....................... West Virginia Ordnance (USARMY) ...................................... Point Pleasant ....................... P WY ....................... F.E. Warren Air Force Base .................................................. Cheyenne. 1 Only the Vieques portions of the AFWTA are included in Appendix B to Part 300, the National Priorities List. The Culebra portions of the AFWTA (that were included in the NPL proposal AFWTA on August 13, 2004) are not included at this time due to ongoing negotiations between the Commonwealth of Puerto Rico and the Department of the Army. Notes: (a) A=Based on issuance of health advisory by Agency for Toxic Substances and Disease Registry (if scored, HRS score need not be >28.50). C=Sites on construction completion list. S=State top priority (included among the 100 top priority sites regardless of score). P=Sites with partial deletion(s). [62 FR 15576, Apr. 1, 1997] EDITORIAL NOTE: For FEDERAL REGISTER citations affecting part 300, appendix B, see the List of CFR Sections Affected, which appears in the Finding Aids section of the printed vol- ume and on GPO Access. EDITORIAL NOTE: At 71 FR 36019, June 23, 2006, the amendment to Table 1 of Appendix B to Part 300 could not be incorporated because of inaccurate amendatory language. EFFECTIVE DATE NOTES: 1. At 75 FR 26137, May 11, 2010, Table 1 of Appendix B to part 300 was amended by removing ‘‘Asbestos Dump, Millington, NJ’’ from the table, effective July 12, 2010. 2. At 75 FR 27199, May 14, 2010, Table 1 of Appendix B to part 300 was amended by removing the entry ‘‘Ruston Foundry, Alexandria, LA., effective July 13, 2010. 3. At 75 FR 33729, June 15, 2010, Table 1 of Appendix B to part 300 was amended by revising the entry under ‘‘Many Diversified Interests, Inc., Texas’’, effective Aug. 14, 2010, For the con- venience of the user, the revised text is set forth as follows: APPENDIX B TO PART 300—NATIONAL PRIORITIES LIST TABLE 1—GENERAL SUPERFUND SECTION State Site name City/county Notes (a) * * * * * * * TX .............................. Many Diversified Interests, Inc ....................................................... Houston ..................... P * * * * * * * (a) * ** * P = Sites with partial deletion(s). APPENDIX C TO PART 300—SWIRLING FLASK DISPERSANT EFFECTIVENESS TEST, REVISED STANDARD DISPERS- ANT TOXICITY TEST, AND BIOREMEDI- ATION AGENT EFFECTIVENESS TEST TABLE OF CONTENTS 1.0 Introduction 2.0 Swirling Flask Dispersant Effectiveness Test 3.0 Revised Standard Dispersant Toxicity Test 4.0 Bioremediation Agent Effectiveness Test 5.0 Bioremediation Agent Toxicity Test 6.0 Summary Technical Product Test Data Format References LIST OF ILLUSTRATIONS Figure Number 1 Swirling Flask Test Apparatus LIST OF TABLES Table Number 1 Major Ion Composition of ‘‘Instant Ocean’’ Synthetic Sea Salt 2 Test Oil Characteristics VerDate Mar<15>2010 09:25 Jul 28, 2010 Jkt 220169 PO 00000 Frm 00235 Fmt 8010 Sfmt 8002 Y:\SGML\220169.XXX 220169 WReier-Aviles on DSKGBLS3C1PROD with CFR
Transcript of Pt. 300, App. C - gpo.gov entry ‘‘Ruston Foundry, Alexandria, LA., effective ... Environmental...

225
Environmental Protection Agency Pt. 300, App. C
TABLE 2—FEDERAL FACILITIES SECTION—Continued
St Site name City/County Notes(a)
WA ....................... Naval Air Station, Whidbey Island (Ault) ............................... Whidbey Island.WA ....................... Naval Undersea Warfare Station (4 Areas) .......................... Keyport.WA ....................... Old Navy Dump/Manchester Lab (USEPA/NOAA) ............... Manchester.WA ....................... Puget Sound Naval Shipyard Complex ................................. Bremerton.WV ....................... Allegany Ballistics Laboratory (USNAVY) ............................. Mineral.WV ....................... West Virginia Ordnance (USARMY) ...................................... Point Pleasant ....................... P WY ....................... F.E. Warren Air Force Base .................................................. Cheyenne.
1 Only the Vieques portions of the AFWTA are included in Appendix B to Part 300, the National Priorities List. The Culebra portions of the AFWTA (that were included in the NPL proposal AFWTA on August 13, 2004) are not included at this time due to ongoing negotiations between the Commonwealth of Puerto Rico and the Department of the Army.
Notes: (a) A=Based on issuance of health advisory by Agency for Toxic Substances and Disease Registry (if scored, HRS score need
not be >28.50). C=Sites on construction completion list. S=State top priority (included among the 100 top priority sites regardless of score). P=Sites with partial deletion(s).
[62 FR 15576, Apr. 1, 1997]
EDITORIAL NOTE: For FEDERAL REGISTER citations affecting part 300, appendix B, see the List of CFR Sections Affected, which appears in the Finding Aids section of the printed vol-ume and on GPO Access.
EDITORIAL NOTE: At 71 FR 36019, June 23, 2006, the amendment to Table 1 of Appendix B to Part 300 could not be incorporated because of inaccurate amendatory language.
EFFECTIVE DATE NOTES: 1. At 75 FR 26137, May 11, 2010, Table 1 of Appendix B to part 300 was amended by removing ‘‘Asbestos Dump, Millington, NJ’’ from the table, effective July 12, 2010.
2. At 75 FR 27199, May 14, 2010, Table 1 of Appendix B to part 300 was amended by removing the entry ‘‘Ruston Foundry, Alexandria, LA., effective July 13, 2010.
3. At 75 FR 33729, June 15, 2010, Table 1 of Appendix B to part 300 was amended by revising the entry under ‘‘Many Diversified Interests, Inc., Texas’’, effective Aug. 14, 2010, For the con-venience of the user, the revised text is set forth as follows:
APPENDIX B TO PART 300—NATIONAL PRIORITIES LIST
TABLE 1—GENERAL SUPERFUND SECTION
State Site name City/county Notes (a)
* * * * * * * TX .............................. Many Diversified Interests, Inc ....................................................... Houston ..................... P
* * * * * * *
(a) * * * * P = Sites with partial deletion(s).
APPENDIX C TO PART 300—SWIRLING FLASK DISPERSANT EFFECTIVENESS TEST, REVISED STANDARD DISPERS-ANT TOXICITY TEST, AND BIOREMEDI-ATION AGENT EFFECTIVENESS TEST
TABLE OF CONTENTS
1.0 Introduction 2.0 Swirling Flask Dispersant Effectiveness
Test 3.0 Revised Standard Dispersant Toxicity
Test 4.0 Bioremediation Agent Effectiveness
Test 5.0 Bioremediation Agent Toxicity Test
6.0 Summary Technical Product Test Data Format
References
LIST OF ILLUSTRATIONS
Figure Number
1 Swirling Flask Test Apparatus
LIST OF TABLES
Table Number
1 Major Ion Composition of ‘‘Instant Ocean’’ Synthetic Sea Salt
2 Test Oil Characteristics
VerDate Mar<15>2010 09:25 Jul 28, 2010 Jkt 220169 PO 00000 Frm 00235 Fmt 8010 Sfmt 8002 Y:\SGML\220169.XXX 220169WR
eier
-Avi
les
on D
SK
GB
LS3C
1PR
OD
with
CF
R

226
40 CFR Ch. I (7–1–10 Edition) Pt. 300, App. C
3 Oil Standard Solutions: Concentrations in Final DCM Extractions
4 Synthetic Seawater [Toxicity Test] 5 Test Oil Characteristics: No. 2 Fuel Oil 6 Analytes Listed Under the Corresponding
Internal Standard Used in Calculating RRFs
7 Primary Ions Monitored for Each Target Analyte During GC/MS Analysis
8 Analytes and Reference Compounds 9 Operating Conditions and Temperature
Program of GC/MS 10 Two-Way ANOVA Table 11 Product Test Data, Total Aromatics 12 Summary Statistics for Product Test
Data, Total Aromatics 13 Example Two-Way ANOVA Table 14 Pairwise Protected LSD Mean Separa-
tion
1.0 Introduction
1.1 Scope and Application. The methods de-scribed below apply to ‘‘dispersants, surface washing agents, surface collecting agents, bioremediation agents, and miscellaneous oil spill control agents’’ involving subpart J (Use of Dispersants and Other Chemicals) in 40 CFR part 300 (National Oil and Hazardous Substances Pollution Contingency Plan). They are revisions and additions to the EPA’s Standard Dispersant Effectiveness and Toxicity Tests (1). The new Swirling Flask Dispersant Effectiveness Test is used only for testing dispersants. The Revised Stand-ard Dispersant Toxicity Test is used for test-ing dispersants, as well as surface washing agents, surface collecting agents, and mis-cellaneous oil spill control agents. The bio-remediation agent effectiveness test is used for testing bioremediation agents only.
1.2 Definitions. The definitions of dispersants, surface washing agents, surface collecting agents, bioremediation agents, and miscellaneous oil spill control agents are provided in 40 CFR 300.5.
2.0 Swirling Flask Dispersant Effectiveness Test
2.1 Summary of Method. This protocol was developed by Environment Canada to provide a relatively rapid and simple testing proce-dure for evaluating dispersant effectiveness (2). It uses a modified Erlenmeyer flask to which a side spout has been added for remov-ing subsurface samples of water near the bot-tom of the flask without disturbing a surface oil layer. Seawater and a surface layer of oil are added to the flask. Turbulent mixing is provided by placing the flask on a standard shaker table at 150 rpm for 20 minutes to in-duce a swirling motion to the liquid con-tents. Following shaking, the flask is imme-diately removed from the shaker table and maintained in a stationary position for 10 minutes to allow the oil that will reform a slick to return to the water’s surface. A sam-ple of water for chemical analysis is then re-moved from the bottom of the flask through the side spout, extracted with methylene chloride (dichloromethane-DCM), and ana-lyzed for oil content by UV-visible absorp-tion spectrophotometry at wavelengths of 340, 370, and 400 nm (2).
2.2 Apparatus. 2.2.1 Modified Erlenmeyer Flask. Use 125-
ml glass Erlenmeyer flasks that have been modified to include an attachment of a glass side spout that extends from the bottom of the flask upward to the neck region, as shown in Figure 1.
2.2.2 Shaker Table. Use a shaker table with speed control unit with variable speed (40–400 rpm) and an orbital diameter of approxi-mately 0.75 inches (2 cm) to provide turbu-lence to solutions in test flasks.
2.2.3 Spectrophotometer. Use a UV-visible spectrophotometer capable of measuring ab-sorbance at 340, 370, and 400 nm. A Hitachi Model U–2000 or equivalent is acceptable for this purpose.
2.2.4 Glassware. Glassware should consist of 5-, 10-, 25-, 100-, and 500-ml graduated cyl-inders; 125-ml separatory funnels with Teflon stopcocks; and 10-, 100-, and 1,000-ml volu-metric flasks and micropipettes.
VerDate Mar<15>2010 09:25 Jul 28, 2010 Jkt 220169 PO 00000 Frm 00236 Fmt 8010 Sfmt 8002 Y:\SGML\220169.XXX 220169WR
eier
-Avi
les
on D
SK
GB
LS3C
1PR
OD
with
CF
R

227
Environmental Protection Agency Pt. 300, App. C
2.3 Reagents. 2.3.1 Synthetic seawater. The synthetic sea salt ‘‘Instant Ocean,’’ manu-factured by Aquarium Systems of Mentor, OH, can be used for this purpose. The syn-thetic seawater solution is prepared by dis-solving 34 g of the salt mixture in 1 liter of distilled water (i.e., a salinity of 34 ppt). Table 1 provides a list of the ion composition of the seasalt mixture.
TABLE 1—MAJOR ION COMPOSITION OF ‘‘INSTANT OCEAN’’ SYNTHETIC SEA SALT
Major Ion % Total Weight
Ionic Con-centration at 34 ppt salinity (mg/1)
Chloride (C1¥) ................................ 47.470 18,740 Sodium (NA=) .................................. 26.280 10,454 Sulfate (SO4¥) ............................... 6.602 2,631 Magnesium (Mg==) .......................... 3.230 1,256 Calcium (Ca==) ................................ 1.013 400
TABLE 1—MAJOR ION COMPOSITION OF ‘‘IN-STANT OCEAN’’ SYNTHETIC SEA SALT—Con-tinued
Major Ion % Total Weight
Ionic Con-centration at 34 ppt salinity (mg/1)
Potassium (K=) ................................ 1.015 401 Bicarbonate (HCO3¥) ..................... 0.491 194 Boron (B) ......................................... 0.015 6.0 Strontium (Sr==) ............................... 0.001 7.5
SOLIDS TOTAL ........................... 86.11% 34,089.50 Water ............................................... 13.88
TOTAL ......................................... 99.99%
Following the preparation, the saltwater so-lution is allowed to equilibrate to the ambi-ent temperature of the laboratory and should be in the range of 22±3 °C.
2.3.2 Test oil. Two EPA/American Petro-leum Institute (API) standard reference oils,
VerDate Mar<15>2010 09:25 Jul 28, 2010 Jkt 220169 PO 00000 Frm 00237 Fmt 8010 Sfmt 8002 Y:\SGML\220169.XXX 220169 EC
02A
U92
.017
</G
PH
>
WR
eier
-Avi
les
on D
SK
GB
LS3C
1PR
OD
with
CF
R

228
40 CFR Ch. I (7–1–10 Edition) Pt. 300, App. C
Prudhoe Bay and South Louisiana crude, should be used for this test. These oils can be obtained from the Resource Technology Cor-poration, 2931 Soldier Springs Road, P.O. Box 1346, Laramie, WY 82070, (307) 742–5452. These oils have been thoroughly homogenized, as well as characterized physically and chemi-cally for previous EPA and API studies. Var-ious selected parameters are presented in table 2.
TABLE 2—TEST OIL CHARACTERISTICS
Prudhoe Bay crude oil
South Louisiana crude oil
Specific gravity 1 ....... 0.894 kg/1 .......... 0.840 kg/1 API gravity 1 ............. 26.8 degrees ...... 37.0 degrees Sulfur ........................ 1.03 wt% ............ 0.23 wt% Sulfur compounds,
profile..............................
Nitrogen .................... 0.20 wt% ............ 0.031 wt% Vanadium ................. 21 mg/1 .............. 0.95 mg/1 Nickel ....................... 11 mg/1 .............. 1.1 mg/1 Simulated distillation
profile..............................
Infrared spectrum ..... .............................UV fluorescence
spectrum..............................
Pour Point ................ +25 °F ................ 0 °F Viscosity
at 40 °C ................ 14.09 cST ........... 3.582 cST at 100 °C .............. 4.059 cST ........... 1.568 cST
Index ........................ 210 ..................... (2)
1 At 15 °C 2 Not calculable when viscosity at 100 °C is less than 2.0.
2.3.3 Methylene Chloride (Dichloromethane- DCM), pesticide quality. For extraction of all sample water and oil-standard water sam-ples.
2.4 Pretest preparation. 2.4.1 Preparation and analysis of oil standards. 2.4.1.1 Standard solutions of oil for calibrating the UV-visible spectrophotometer are prepared with the specific reference oils and dispersant used for a particular set of experimental test runs. For experiments with no dispersant, only oil is used to make the standard solution. For experiments with the oil plus dispersant, the standard is made with a 1:10 (v:v) mixture of the dispersant to the test oil (i.e., a dispers-ant-to-oil ratio of 1:10). This ratio is used in the test tank with dispersant added. The presence of water and certain dispersants in DCM extracts can affect absorbance readings in a spectrophotometer. All standard solu-tions of oil (and dispersant, if present) should be prepared in a stepwise manner that reflects the analytical protocol used for the experimental water samples.
2.4.1.2 To prepare the standards, prepare a parent oil-DCM standard by mixing 1 part oil (plus 1/10 part premixed dispersant, if appli-cable) to 9 parts DCM (i.e., 1:10 dilution of the oil v:v). Add a specific volume of the par-ent oil-DCM standard to 30 ml of synthetic seawater in a separatory funnel. Extract the oil-water mixture with 5-ml volumes of DCM after 15 seconds of vigorous shaking followed
by a 2 minute stationary period to allow for phase separation for each extraction. Repeat the extraction using a total of three 5-ml portions of DCM. Adjust the final DCM vol-ume for the combined extracts to 20 ml with DCM in a 25-ml graduated cylinder.
2.4.1.3 The quantities of oil used to achieve the desired concentrations in the final 20-ml DCM extracts for the standard oil-solutions are summarized in table 3. Spe-cific masses for oil amounts in standards are determined as volumes of oil multiplied by the density of the oil.
2.4.2 Linear stability calibration of UV-Visi-ble spectrophotometer.
2.4.2.1 Before DCM-extracts of dispersed oil-water samples can be analyzed for their oil content, the UV-visible spectrophotom-eter must meet an instrument stability cali-bration criterion. This criterion is deter-mined with the six oil standards identified in table 3. Determine the absorbance of stand-ards at each of the three analytical wave-lengths (i.e., 340, 370, and 400 nm). Determine the response factors (RFs) for the test oil at each of the three analytical wavelengths using the following equation: RFx=C/Ax (1) where: RFx=Response factor at wavelength x (x=340,
370, or 400 nm) C=Oil concentration, in mg of oil/ml of DCM
in standard solution Ax=Spectrophotometric absorbance of wave-
length x
TABLE 3—OIL STANDARD SOLUTIONS: CONCENTRATIONS IN FINAL DCM EXTRACTIONS 1
Final oil con-centration (mg/ml of
DCM)
Final extract volume
(ml of DCM)
Total amount of oil
in standard (mg)
Volume of parent oil-
DCM std (μl) added to saltwater
4 .0 20.0 80 .0 890 2 .0 20.0 40 .0 440 1 .0 20.0 20 .0 220 0 .50 20.0 10 .0 110 0 .10 20.0 2 .0 22 0 .05 20.0 1 .0 11
1 Assuming an oil density of 0.9 g/ml and an extraction effi-ciency of 100% for oil from the 30-ml of seawater.
2.4.2.2 Instrument stability for the initial calibration is acceptable when the RFs for the five highest standard extracts of oil are <20% different from the overall mean value for the five standards. If this criterion is sat-isfied, analysis of sample extracts can begin. RFs for the lowest concentration (0.05 mg oil/ml DCM) are not included in the consider-ation because the absorbance is close to the detection limit of the spectrophotometer (with associated high variability in the value) for the 1-cm path-length cell used for measurements. Absorbances ≥3.5 are not in-cluded because absorbance saturation occurs at and above this value.
VerDate Mar<15>2010 09:25 Jul 28, 2010 Jkt 220169 PO 00000 Frm 00238 Fmt 8010 Sfmt 8002 Y:\SGML\220169.XXX 220169WR
eier
-Avi
les
on D
SK
GB
LS3C
1PR
OD
with
CF
R

229
Environmental Protection Agency Pt. 300, App. C
2.4.2.3 If one or more of the standard oil extracts do not meet this linear-stability cri-terion, then the ‘‘offending’’ standard(s) can be prepared a second time (i.e., extraction of the specified amount of oil from 30-ml or sea-water for the ‘‘offending’’ standard according to the pretest preparation procedure). If re-placement of the reanalyzed standard solu-tion(s) in the standard curve meets the lin-ear-stability criterion (i.e., no RF >20% dif-ferent from the overall mean), then analysis of sample extracts can begin.
2.4.2.4 If the initial-stability criterion is still not satisfied, analysis of sample extract cannot begin and the source of the problem (e.g., preparation protocol for the oil stand-ards, spectrophotometer stability, etc.) must be corrected.
2.4.2.5 The initial six-point calibration of the UV-visible spectrophotometer at the oil concentrations identified is required at least once per test day.
2.5 Test procedure. 2.5.1 Preparation of premixed dispersant oil. Prepare a premixed dispersant oil by mixing 1 part dispersant to 10 parts oil. Store this mixture in a glass container. The dispersant effectiveness test procedures are listed in steps 1–20:
1. Prepare 4 replicates (same test oil and dispersant), one control (i.e., no dispersant), and one method blank and run at the same time on the shaker table.
2. Add 120±2 ml of synthetic seawater to each of the modified 125-ml glass Erlenmeyer flasks. Measure and record the water tem-perature.
3. Place the flasks securely into the at-tached slot on the shaker table.
4. Carefully add 100 μl of an oil-dispersant solution onto the center of the water’s sur-face using a positive displacement pipette.
5. Agitate the flasks for 20±1 minutes at 150±10 rpm on the shaker table.
6. After the 20±1 minutes shaking, remove the flasks from the shaker table and allow them to remain stationary for 10±1 minutes for oil droplet ‘‘settling.’’
7. At the conclusion of the 10-minute set-tling period, carefully decant a 30-ml sample through the side spout of the test flasks into a 50-ml graduated cylinder.
NOTE: Discard the first 1–2 ml of sample water to remove nonhomogeneous water-oil initially contained in the spout.
8. Transfer the samples from the graduated cylinder into a 125- or 250-ml glass sepa-ratory funnel fitted with a Teflon stopcock.
9. Add 5 ml of pesticide-quality DCM to the separatory funnel and shake vigorously for 15 seconds. Release the pressure carefully from the separatory funnel through the stop-cock into a fume hood.
10. Allow the funnel to remain in a sta-tionary position for 2 minutes to allow phase-separation of the water and DCM.
11. Drain the DCM layer from the sepa-ratory funnel into a glass-stoppered, 25-ml graduated glass cylinder.
12. Repeat the DCM-extraction process two additional times.
13. Combine the three extracts in the grad-uated cylinder and adjust the final volume to 20-ml with additional DCM.
14. Analyze the samples using a UV-spec-trophotometer at 340, 370, and 400 nm-wave-lengths and determine the quantity of oil as follows:
Cx=(Ax)x(RFx)x(VDCM)x(Vtw/Vew) (2) where: Cx=Total mass of dispersed oil in swirling
flask at wavelength x (x=340, 370, or 400 nm)
Ax=Spectrophotometric absorbance at wave-length x
RFx=Mean response factor at wavelength x (determined from equation 1)
VDCM=Final volume of DCM-extract of water sample (20 ml)
Vtw=Total water volume in swirling flask vessel (120 ml)
Vew=Volume of water extracted for dispersed oil content (30 ml) 15. Obtain three concentration values for
oil in each experimental water sample (340, 370, and 400 nm).
16. Determine the mean of three values as follows:
Cmean=(C340+C370+C400)/3 (3) NOTE: Means will be used for all dispersion-
performance calculations. Samples where one of the values for C340, C370, or C400 is more than 30% different from Cmean will be flagged. Whenever oil measurements are flagged as having a concentration based on one wave-length as >30% different from Cmean, raw data will be evaluated to establish that the meas-urements are valid. In addition, attempts will be made to correlate the difference to oil type, dispersant test, or dispersant used. If no errors or correlations are apparent and >10% of all oil measurements are flagged, the mean concentration data will be used in the calculation for dispersant performance and the subject data will be flagged.
17. Determine the dispersant performance (i.e., percent of oil that is dispersed, or EFF) based on the ratio of oil dispersed in the test system to the total oil added to the system as follows:
EFF (in %)=(Cmean/CTOT)×100 (4) where: Cmean=Mean value for total mass of dispersed
oil in the swirling flask determined by spectrophotometric analysis
CTOT=Total mass of oil initially added to the experimental swirling flask 18. Calculate EFF using equation 4 for cou-
pled experiments with and without dispers-ant (EFFc and EFFd, respectively). EFFc is the effectiveness of the control and rep-resents natural dispersion of the oil in the
VerDate Mar<15>2010 09:25 Jul 28, 2010 Jkt 220169 PO 00000 Frm 00239 Fmt 8010 Sfmt 8002 Y:\SGML\220169.XXX 220169WR
eier
-Avi
les
on D
SK
GB
LS3C
1PR
OD
with
CF
R

230
40 CFR Ch. I (7–1–10 Edition) Pt. 300, App. C
test apparatus. EFFd is the measured uncor-rected value.
19. Calculate the final dispersant perform-ance of a chemical dispersant agent after correcting for natural dispersion using equa-tion 5.
EFFD=EFFd—EFFc (5) where: EFFD=% dispersed oil due to dispersant only EFFd=% dispersed oil with dispersant added EFFc= % dispersed oil with no dispersant
added 20. Calculate the average dispersant effec-
tiveness value by summing the corrected val-ues (EFFD) for each of the four replicates for each of the two test oils and dividing this sum by eight.
2.6 Performance criterion. The dispersant product tested will remain in consideration for addition to the NCP Product Schedule if the average dispersant effectiveness, as cal-culated in section 2.5 above, is at least 45% (i.e., 50%±5%).
2.7 Quality Control (QC) procedures for measurements of oil concentrations. 2.7.1 UV- visible spectrophotometric measurements. At least 5% of all UV-visible spectrophotometric measurements will be performed in duplicate as a QC check on the analytical measurement method. The ab-sorbance values for the duplicates should agree within ±5% of their mean value.
2.7.2 Method blanks. Analytical method blanks involve an analysis of seawater blanks (i.e., seawater but no oil or dispersant in a swirling flask vessel) through testing and analytical procedures (3, pp 79–80). Meth-od blanks are analyzed with a frequency of at least 1 for every 12 experimental swirling flask samples. Oil concentrations in method blanks must be <5% of that occurring for 100% dispersion of oil in testing apparatus.
3.0 Revised standard dispersant toxicity test
3.1 Summary of method. The standard tox-icity test for dispersants and other products involves exposing two species (Menidia beryllina (silversides) and Mysidopsis bahia (mysid shrimp)) to five concentrations of the test product and No. 2 fuel oil alone and in a 1:10 mixture of product to oil. To aid in com-paring results from assays performed by dif-ferent workers, reference toxicity tests are conducted using dodecyl sodium sulfate (DSS) as a reference toxicant. The test length is 96 hours for Menidia and 48 hours for Mysidopsis. LC50 s are calculated based on mortality data at the end of the exposure period (for method of calculation, see section 3.6 below).
3.2 Selection and preparation of test mate-rials.
3.2.1 Test organisms. 3.2.1.1 Menidia beryllina. Obtain fish
(silversides) from a single source for each se-ries of toxicity tests. In-house cultures are
recommended wherever it is cost-effective; however, organisms are available from com-mercial suppliers. Information on the source of test organisms and any known unusual condition to which fish were exposed before use should be included in the data report. Use of animals previously treated with pes-ticides or chemotherapeutic agents should be avoided. Organisms should not be used if they appear to be unhealthy, discolored, or show signs of stress. Use 7-day old larval fish. Fish should be cultured in accordance with the methods outlined in Middaugh, et al. (5). There should be no need to acclimate organisms to the 25±1 °C temperature rec-ommended for the toxicity tests if labora-tory stock cultures of Menidia are main-tained at the recommended culture tempera-ture of 25±1 °C. If test organisms must be ob-tained from a commercial source, it may be-come necessary to acclimate test fish to the test temperature of 25±1 °C, a pH of 8.0±0.2, and 20±2 ppt salinity since changes in tem-perature may occur during shipping. Elimi-nate groups of fish having a mortality of more than 10% during the first 48 hours, and more than 5% thereafter. During acclima-tion, organisms should be maintained on a diet of freshly hatched Artemia (brine shrimp) nauplii. Feed the fish daily to satia-tion during the acclimation period, and once daily during the 96-hour test. Care should be taken daily to remove excess food and fecal material from beakers during the test. Use only those organisms that feed actively and that appear to be healthy. Organisms should be free of disease, external parasites, and any signs of physical damage or stress. Discard any fish injured or dropped while handling.
3.2.1.2 Mysidopsis bahia. Several methods for culturing Mysidopsis bahia (mysid shrimp) may be used and are noted in appen-dix A of Methods for Measuring the Acute Toxicity of Effluents and Receiving Waters to Freshwater and Marine Organisms (6). To ensure uniformity of mysids, recently hatched mysids should be collected daily from stock cultures and identified by the date of hatch. Mysids used in 48-hour tests should be from a single day’s collection, but may have an age range of 5–7 days old. In cases where in-house cultures of mysids are unavailable, organisms may be purchased from a commercial source. Information on the source of test organisms should be sub-mitted in the data report.
3.2.2 Preparation of experimental water. Fil-tered natural seawater is recommended for use since it represents a natural source of saltwater containing an inherent population of microorganisms. Synthetic seawater for-mulated according to the following method can serve as an acceptable alternative to fil-tered, natural seawater for toxicity tests performed in laboratories in which natural seawater is unavailable.
VerDate Mar<15>2010 09:25 Jul 28, 2010 Jkt 220169 PO 00000 Frm 00240 Fmt 8010 Sfmt 8002 Y:\SGML\220169.XXX 220169WR
eier
-Avi
les
on D
SK
GB
LS3C
1PR
OD
with
CF
R
231
Environmental Protection Agency Pt. 300, App. C
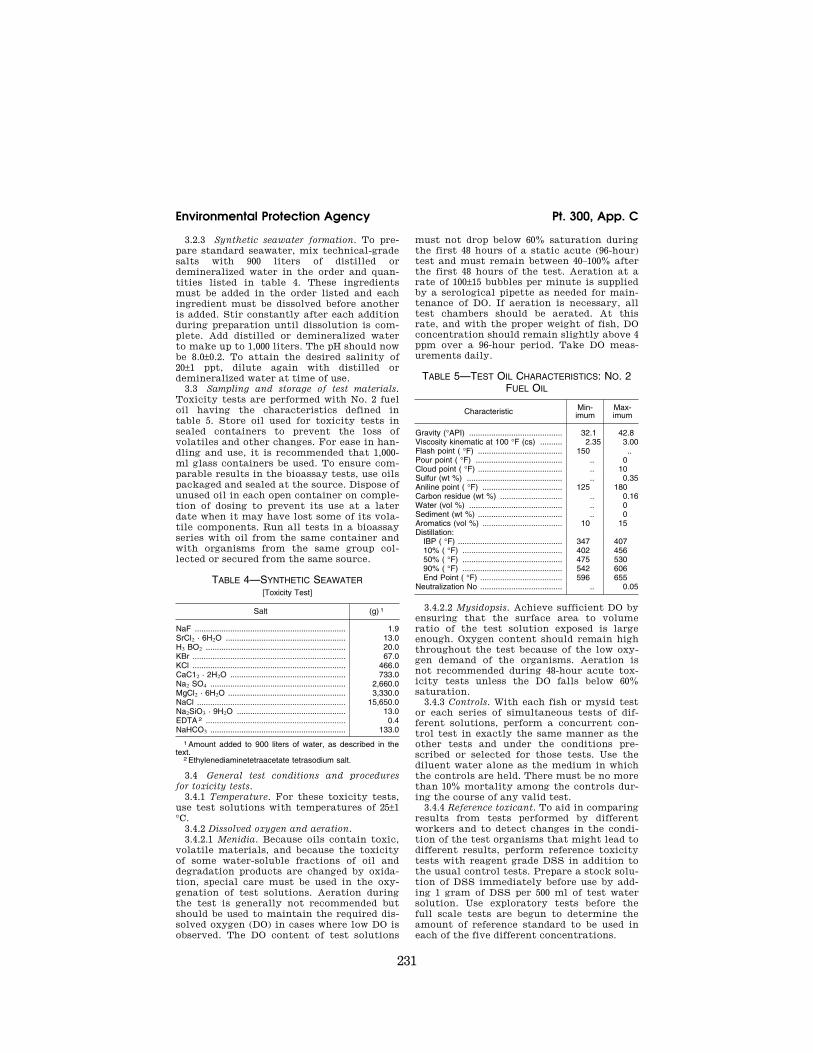
3.2.3 Synthetic seawater formation. To pre-pare standard seawater, mix technical-grade salts with 900 liters of distilled or demineralized water in the order and quan-tities listed in table 4. These ingredients must be added in the order listed and each ingredient must be dissolved before another is added. Stir constantly after each addition during preparation until dissolution is com-plete. Add distilled or demineralized water to make up to 1,000 liters. The pH should now be 8.0±0.2. To attain the desired salinity of 20±1 ppt, dilute again with distilled or demineralized water at time of use.
3.3 Sampling and storage of test materials. Toxicity tests are performed with No. 2 fuel oil having the characteristics defined in table 5. Store oil used for toxicity tests in sealed containers to prevent the loss of volatiles and other changes. For ease in han-dling and use, it is recommended that 1,000- ml glass containers be used. To ensure com-parable results in the bioassay tests, use oils packaged and sealed at the source. Dispose of unused oil in each open container on comple-tion of dosing to prevent its use at a later date when it may have lost some of its vola-tile components. Run all tests in a bioassay series with oil from the same container and with organisms from the same group col-lected or secured from the same source.
TABLE 4—SYNTHETIC SEAWATER [Toxicity Test]
Salt (g) 1
NaF .................................................................... 1.9 SrCl2 · 6H2O ...................................................... 13.0 H3 BO2 ............................................................... 20.0 KBr ..................................................................... 67.0 KCl ..................................................................... 466.0 CaC12 · 2H2O .................................................... 733.0 Na2 SO4 ............................................................. 2,660.0 MgCl2 · 6H2O ..................................................... 3,330.0 NaCl ................................................................... 15,650.0 Na2SiO3 · 9H2O ................................................. 13.0 EDTA 2 ............................................................... 0.4 NaHCO3 ............................................................. 133.0
1 Amount added to 900 liters of water, as described in the text.
2 Ethylenediaminetetraacetate tetrasodium salt.
3.4 General test conditions and procedures for toxicity tests.
3.4.1 Temperature. For these toxicity tests, use test solutions with temperatures of 25±1 °C.
3.4.2 Dissolved oxygen and aeration. 3.4.2.1 Menidia. Because oils contain toxic,
volatile materials, and because the toxicity of some water-soluble fractions of oil and degradation products are changed by oxida-tion, special care must be used in the oxy-genation of test solutions. Aeration during the test is generally not recommended but should be used to maintain the required dis-solved oxygen (DO) in cases where low DO is observed. The DO content of test solutions
must not drop below 60% saturation during the first 48 hours of a static acute (96-hour) test and must remain between 40–100% after the first 48 hours of the test. Aeration at a rate of 100±15 bubbles per minute is supplied by a serological pipette as needed for main-tenance of DO. If aeration is necessary, all test chambers should be aerated. At this rate, and with the proper weight of fish, DO concentration should remain slightly above 4 ppm over a 96-hour period. Take DO meas-urements daily.
TABLE 5—TEST OIL CHARACTERISTICS: NO. 2 FUEL OIL
Characteristic Min-imum
Max-imum
Gravity (°API) .......................................... 32 .1 42 .8 Viscosity kinematic at 100 °F (cs) .......... 2 .35 3 .00 Flash point ( °F) ...................................... 150 .. Pour point ( °F) ....................................... .. 0 Cloud point ( °F) ...................................... .. 10 Sulfur (wt %) ........................................... .. 0 .35 Aniline point ( °F) .................................... 125 180 Carbon residue (wt %) ............................ .. 0 .16 Water (vol %) .......................................... .. 0 Sediment (wt %) ...................................... .. 0 Aromatics (vol %) .................................... 10 15 Distillation:
IBP ( °F) ............................................... 347 407 10% ( °F) ............................................. 402 456 50% ( °F) ............................................. 475 530 90% ( °F) ............................................. 542 606 End Point ( °F) ..................................... 596 655
Neutralization No ..................................... .. 0 .05
3.4.2.2 Mysidopsis. Achieve sufficient DO by ensuring that the surface area to volume ratio of the test solution exposed is large enough. Oxygen content should remain high throughout the test because of the low oxy-gen demand of the organisms. Aeration is not recommended during 48-hour acute tox-icity tests unless the DO falls below 60% saturation.
3.4.3 Controls. With each fish or mysid test or each series of simultaneous tests of dif-ferent solutions, perform a concurrent con-trol test in exactly the same manner as the other tests and under the conditions pre-scribed or selected for those tests. Use the diluent water alone as the medium in which the controls are held. There must be no more than 10% mortality among the controls dur-ing the course of any valid test.
3.4.4 Reference toxicant. To aid in comparing results from tests performed by different workers and to detect changes in the condi-tion of the test organisms that might lead to different results, perform reference toxicity tests with reagent grade DSS in addition to the usual control tests. Prepare a stock solu-tion of DSS immediately before use by add-ing 1 gram of DSS per 500 ml of test water solution. Use exploratory tests before the full scale tests are begun to determine the amount of reference standard to be used in each of the five different concentrations.
VerDate Mar<15>2010 09:25 Jul 28, 2010 Jkt 220169 PO 00000 Frm 00241 Fmt 8010 Sfmt 8002 Y:\SGML\220169.XXX 220169WR
eier
-Avi
les
on D
SK
GB
LS3C
1PR
OD
with
CF
R
232
40 CFR Ch. I (7–1–10 Edition) Pt. 300, App. C
3.4.5 Number of organisms. At a minimum, 20 organisms of a given species are exposed for each test concentration. For the toxicity test procedures using Menidia, place 10 fish in each of two jars. For the toxicity tests using Mysidopsis, place 10 larvae in each of two containers.
3.4.6 Transfer of organisms. Organisms should be handled as little as possible in order to minimize stress. Transfer Menidia and Mysidopsis from the acclimatization aquaria to the test chambers with a pipette or a wide-bore, smooth glass tube (4 to 8 mm internal diameter) fitted with a rubber bulb. Dip nets should be avoided when handling larval fish and mysids. Do not hold fish out of the water longer than necessary and dis-card any specimen accidentally dropped or otherwise mishandled during transfer.
3.4.6.1 Mysidopsis. To have the mysids ready for study, mysids may be sorted 24 hours prior to initiation of the 48-hour test. Trans-fer the mysids to a beaker containing a small volume of water; this vessel serves as a holding chamber during randomized trans-fer of the organisms to test solutions. Mysids are randomly selected from the batch of mysids in the holding chamber, and trans-ferred to 50-ml beakers containing a small volume of seawater. One mysid is added per beaker using a small piece of flexible 500-μm screening until all of the beakers contain one mysid. The process of random selection and sorting is continued until the appro-priate number of mysids has been delivered to each of the 50-ml beakers. The mysids are gently released from the 50-ml beakers into larger beakers filled with an appropriate vol-ume of 20-ppt seawater (25 °C) to bring the total volume to 200 ml. The beakers are ran-domly placed into a temperature-controlled water bath to acclimate overnight at 25 °C. The mysids are transferred to larger beakers (1-liter) for the 48-hour test after the addi-tion of 800 ml of the test solution. A total of 10 mysids per beaker are used for 48-hour acute toxicity tests. A minimum of two rep-licate chambers are used for each test con-centration and control.
3.4.6.2 Menidia and Mysidopsis are fed 50 brine shrimp nauplii/organism daily during the 96-hour and 48-hour tests. Excess food should be removed daily by aspirating with a pipette.
3.4.7 Test duration and observations. 3.4.7.1 Menidia. Observe the number of dead fish in each test container and record at the end of each 24-hour period. Fish are considered dead upon cessation of respiratory and all other overt movements, whether spontaneous or in response to mild mechanical prodding. Re-move dead fish as soon as observed. Also note and report when the behavior of test fish deviates from that of control fish. Such behavioral changes would include variations in opercular movement, coloration, body ori-entation, movement, depth in container,
schooling tendencies, and others. Abnormal behavior of the test organisms (especially during the first 24 hours) is a desirable pa-rameter to monitor in a toxicity test be-cause changes in behavior and appearance may precede mortality. Toxicants can re-duce an organism’s ability to survive natural stresses. In these cases, the mortality is not directly attributed to the toxicant, but most certainly is an indirect effect. Reports on be-havioral changes during a toxicity test can give insight into the non-acute effects of the tested material. At the end of the 96-hour pe-riod, terminate the fish tests and determine the LC50 values. The acute toxicity test is terminated after four days of exposure. The number of surviving fish are counted and re-corded for each chamber in accordance with standard EPA methods (6). The LC50 is cal-culated using survival data from the test in accordance with the methods described in the guidelines (6).
3.4.7.2 Mysidopsis. Terminate the mysid test after 48 hours of incubation. To count the dead animals accurately, place the expo-sure vessels on a light table such that light passes through the bottom of the vessel. Most of the dead mysids will be on the bot-tom of the beaker and can readily be seen against the background of the light table. Also search the top of the liquid for mysids trapped there by surface tension. Exercise caution when determining death of the ani-mals. Occasionally, an animal appears dead, but closer observation shows slight move-ment of an appendage or a periodic spasm of its entire body. For these tests, animals ex-hibiting any movement when touched with a pipette tip are considered alive. Account for all test animals to ensure accuracy since Mysidopsis bahia may disintegrate or be can-nibalized by other mysids. Consider individ-uals not accounted for as dead. At the end of 48 hours of exposure, terminate the mysid assay and determine the LC50 values in ac-cordance with the methods described in the guidelines (6).
3.4.8 Physical and chemical determinations. 3.4.8.1 Menidia. Determine the temperature, DO, and pH of the test solutions before the fish are added and at 24-, 48-, 72-, and 96-hour exposure intervals. It is necessary to take measurements from only one of the rep-licates of each of the toxicant series.
3.4.8.2 Mysidopsis. Determine the tempera-ture, DO, and pH of the test solutions before the nauplii are added and at the 24- and 48- hour exposure interval. Measure DO and pH in only one of the replicates of each of the toxicant series.
3.4.9 Testing laboratory. An ordinary heat-ed or air-conditioned laboratory room with thermostatic controls suitable for maintain-ing the prescribed test temperatures gen-erally will suffice to conduct the toxicity tests. Where ambient temperatures cannot
VerDate Mar<15>2010 09:25 Jul 28, 2010 Jkt 220169 PO 00000 Frm 00242 Fmt 8010 Sfmt 8002 Y:\SGML\220169.XXX 220169WR
eier
-Avi
les
on D
SK
GB
LS3C
1PR
OD
with
CF
R

233
Environmental Protection Agency Pt. 300, App. C
be controlled to 25±1 °C, use water baths with the necessary temperature controls.
3.4.10 Test containers. For tests with fish or mysids, use 1-liter glass beakers meas-uring approximately 10 cm in diameter. In conducting the test, add to each beaker 1 liter of the test solution or seawater formu-lation aerated to saturation with DO. To add the liter volume easily and accurately, use a large volume (1-liter) graduated cylinder. Process all required glassware before each test. Immerse in normal hexane for 10 min-utes. Follow this with a thorough rinse with hot tap water; three hot detergent scrubs; an additional hot tap-water rinse; and three rinses with distilled water. Oven or air dry the glassware in a reasonably dust-free at-mosphere.
3.5 Preparation of test concentrations. 3.5.1Menidia. Place test jars (approximately 22.5 cm in height, 15 cm in diameter, 11 cm in di-ameter at the mouth) containing 2 liters of synthetic seawater on a reciprocal shaker. The shaker platform should be adapted to hold firmly six of the toxicity test jars. Add the desired amount of the petroleum product (if applicable) under test directly to each test jar. Dispense the appropriate amount of toxicant (if applicable) into the jars with a pipette. Tightly cap the test jars and shake for 5 minutes at approximately 315 to 333 2- cm (0.75-inch) strokes per minute in a recip-rocal shaker or at approximately 150 to 160 rpm on orbital shakers. At the completion of shaking, remove the jars from the shaker and dispense 1 liter of the mixture to each of the 1-liter glass beakers. Randomly place beakers in a constant-temperature water bath or room, take water quality measure-ments, add fish, and initiate aeration.
3.5.2 Mysidopsis. 3.5.2.1 To prepare test solutions for products and oil/product mix-tures, blend or mix the test solutions with an electric blender having: speeds of 10,000 rpm or less; a stainless-steel cutting assembly; and a 1-liter borosilicate jar. To minimize foaming, blend at speeds below 10,000 rpm.
3.5.2.2 For the product test solution, add 550 ml of the synthetic seawater to the jar, then with the use of a gas-tight calibrated glass syringe with a Teflon-tipped plunger, add 0.55 ml of the product and mix for 5 sec-onds.
3.5.2.3 For the oil test solution, add 550 ml of the synthetic seawater to the jar. Then with the use of a gas-tight calibrated glass syringe equipped with a Teflon-tipped plung-er, add 0.55 ml of the oil and mix for 5 sec-onds.
3.5.2.4 For the oil/product mixture, add 550 ml of the synthetic seawater to the mixing jar. While the blender is in operation, add 0.5 ml of the oil under study with the use of a calibrated syringe with a Teflon-tipper plunger and then 0.05 ml of the product as in-dicated above. Blend for 5 seconds after addi-tion of product. These additions provide test
solutions of the product, oil, and the oil/ product mixture at concentrations of 1,000 ppm.
3.5.2.5 Immediately after the test solu-tions are prepared, draw up the necessary amount of test solution with a gas-tight Tef-lon-tipped glass syringe of appropriate size and dispense into each of the five containers in each series. If the series of five concentra-tions to be tested are 10, 18, 32, 56, and 100 ppm, the amount of the test solution in the order of the concentrations listed above would be as follows: 10, 18, 32, 56, and 100 ml.
3.5.2.6 Each time a syringe is to be filled for dispensing to the series of test con-tainers, start the mixer and withdraw the de-sired amount in the appropriate syringe while the mixer is in operation. Turn off im-mediately after the sample is taken to limit the loss of volatiles.
3.5.2.7 Use exploratory tests before the full-scale test is set up to determine the con-centration of toxicant to be used in each of the five different concentrations. After add-ing the required amounts of liquid, bring the volume in each of the test containers up to 800 ml with the artificial seawater. To ensure keeping each of the series separate, des-ignate on the lid of each container the date, the material under test, and its concentra-tion.
3.5.2.8 When the desired concentrations are prepared, gently release into each beaker the 10 test Mysidopsis (previously transferred into 200 ml of medium). This provides a vol-ume of 1 liter in each test chamber. A pair of standard cover glass forceps with flat, bent ends is an ideal tool for handling and tipping the small beaker without risk of contami-nating the medium.
3.5.2.9 After adding the test animals, incu-bate the test beakers at 25±1 °C for 48 hours. Recommended lighting is 2,000 lumens/m2 (200 ft-c) of diffused, constant, fluorescent il-lumination.
3.5.2.10 Wash the blender thoroughly after use and repeat the above procedures for each series of tests. Wash the blender as follows: rinse with normal hexane; pour a strong so-lution of laboratory detergent into the blender to cover the blades; fill the container to about half of its volume with hot tap water; operate the blender for about 30 sec-onds at high speed; remove and rinse twice with hot tap water, mixing each rinse for 5 seconds at high speed; and then rinse twice with distilled water, mixing each rinse for 5 seconds at high speed.
3.6 Calculating and reporting. At the end of the test period, the toxicity tests are termi-nated and the LC50 values are determined.
3.6.1 Calculations. The LC50 is the con-centration lethal to 50% of the test popu-lation. It can be calculated as an inter-polated value based on percentages of orga-nisms surviving at two or more concentra-tions, at which less than half and more than
VerDate Mar<15>2010 09:25 Jul 28, 2010 Jkt 220169 PO 00000 Frm 00243 Fmt 8010 Sfmt 8002 Y:\SGML\220169.XXX 220169WR
eier
-Avi
les
on D
SK
GB
LS3C
1PR
OD
with
CF
R

234
40 CFR Ch. I (7–1–10 Edition) Pt. 300, App. C
half survived. The LC50 can be estimated with the aid of computer programs or graph-ic techniques (log paper). The 95% confidence intervals for the LC50 estimate should also be determined.
3.6.2 Reporting. The test product and oil and their source and storage are described in the toxicity test report. Note any observed changes in the experimental water or the test solutions. Also include the species of fish used; the sources, size, and condition of the fish; data of any known treatment of the fish for disease or infestation with parasites before their use; and any observations on the fish behavior at regular intervals during the tests. In addition to the calculated LC50 val-ues, other data necessary for interpretation (e.g., DO, pH, other physical parameters, and the percent survival at the end of each day of exposure at each concentration of toxicant) should be reported.
3.7 Summary of procedures. 3.7.1 Menidia: 1. Prepare adequate stocks of the appro-
priate standard dilution water. 2. Add 2 liters of the standard dilution
water to the test jars. Each test consists of 5 replicates of each of 5 concentrations of the test material, a control series of 5 beakers, and a standard reference series of 5 different concentrations for a total of 35 beakers. Si-multaneous performance of toxicity tests on the oil, product, and oil/product mixture re-quires a total of 105 beakers.
3. Add the determined amount (quarter points on the log scale) of test material to the appropriate jars. Preliminary tests will be necessary to define the range of definitive test concentrations.
4. Cap the jars tightly with the Teflon- lined screw caps and shake for 5 minutes at 315 to 333 2-cm (0.75-inch) strokes per minute on a reciprocal shaker.
5. Remove the jars from the shaker, take water quality data, dispense 1 liter of solu-tion to the 1-liter glass beaker, and add 10 acclimated fish per beaker.
6. Aerate with 100±15 bubbles per minute through a 1-ml serological pipette, as needed, to maintain DO above 4.0 mg/l.
7. Observe and record mortalities, water quality, and behavioral changes every 24 hours.
8. After 96 hours, terminate the test, and calculate LC50 values and corresponding con-fidence limits.
3.7.2 Mysidopsis: 1. Initiate the procedure for hatching the
Mysidopsis in sufficient time before the tox-icity test is to be conducted so that 5–7 day old larvae are available.
2. With the use of a small pipette, transfer 10 Mysidopsis into small beakers, each con-taining 200 ml of the proper synthetic sea-water.
3. To prepare the test stock product and oil solutions, add 550 ml of the artificial sea-water to the prescribed blender jar. By
means of a gas-tight glass syringe with a Teflon-tipped plunger, add 0.55 ml of the product (or oil) and mix at 10,000 rpm for 5 seconds. To prepare the test stock oil/prod-uct mixture, add 550 ml of the standard sea-water to the blender jar. While the blender is in operation (10,000 rpm), add 0.5 ml of the oil, then 0.05 ml of the product with the use of a calibrated syringe with a Teflon-tipped plunger. Blend for 5 seconds after adding the product. One ml of these stock solutions added to the 100 ml of standard seawater in the test containers yields a concentration of 10 ppm product, oil, or oil/product combina-tion (the test will be in a ratio of 1 part prod-uct to 10 parts of oil).
4. Each test consists of 5 replications of each of 5 concentrations of the material under study, a control series of 5 beakers and a standard reference series of 5 different con-centrations, for a total of 35 beakers. Simul-taneous performance of toxicity tests on the oil, product, and oil/product mixture requires a total of 105 beakers. Immediately after pre-paring the test solution of the product or oil/ product solution, and using an appropriately sized syringe, draw up the necessary amount of test solution and dispense into each of the five containers in each series. Each time a syringe is to be filled for dispensing to the series of test containers, start the mixer and withdraw the desired amount in the appro-priate syringe while the mixer is in oper-ation. Turn mixer off immediately after the sample is taken to limit the loss of volatiles. After adding the required amount of the test oil/product or product mixture, bring the volume of liquid in each of the test con-tainers up to 800 ml with the artificial sea-water. When the desired concentrations have been prepared, gently release into each beak-er the 10 mysids previously transferred into 200 ml of medium. This provides a volume of 1 liter in each test chamber.
5. Wash the blender as prescribed for each series of tests.
6. Incubate the test beakers at 25±1 °C for 48 hours with the prescribed lighting.
7. Terminate the experiment after 48 hours, observe and record the mortalities, and de-termine the LC50 s and corresponding con-fidence limits.
4.0 Bioremediation agent effectiveness test
4.1 Summary of method. The bioremedi-ation agent effectiveness testing protocol is designed to determine a product’s ability to biodegrade oil by quantifying changes in the oil composition resulting from biodegrada-tion. The protocol tests for microbial activ-ity and quantifies the disappearance of satu-rated hydrocarbons and polynuclear aro-matic hydrocarbons (PAHs). The sample preparation procedure extracts the oil phase into dichloromethane (DCM), with a subse-quent solvent exchange into hexane. To ef-fectively accomplish the goals of the testing
VerDate Mar<15>2010 09:25 Jul 28, 2010 Jkt 220169 PO 00000 Frm 00244 Fmt 8010 Sfmt 8002 Y:\SGML\220169.XXX 220169WR
eier
-Avi
les
on D
SK
GB
LS3C
1PR
OD
with
CF
R

235
Environmental Protection Agency Pt. 300, App. C
1 Although any of these biomarkers can be used to conduct this test, it is recommended that hopane be used.
protocol, it is necessary to normalize the concentration of the various analytes in oil to a non-biodegradable marker, either C2-or C3-phenanthrene, C2-chrysene, or hopane 1 (7). The test method targets the relatively easy to degrade normal alkanes and the more re-sistant and toxic PAHs. It normalizes their concentrations to C2-or C3-phenanthrene, C2- chrysene, or C3017a(H), 21b (H)-hopane on an oil weight basis (mg marker/kg oil, mg tar-get analyte/kg oil). The analytical technique uses a high resolution gas chromatograph/ mass spectrometer (GC/MS) because of its high degree of chemical separation and spec-tral resolution. GC/MS has long been used to study the weathering and fate of oil spilled into the environment. For quantitative anal-yses, the instrument is operated in the selec-tive ion detection (SIM) mode at a scan rate of greater than 1.5 scans per second to maxi-mize the linear quantitative range and preci-sion of the instrument. The sample prepara-tion method does not exclude analysis of se-lected samples by GC/MS in the full scanning mode of operation to qualitatively assess changes in the oil not accounted for by the SIM approach. Performed concurrently with the chemical analysis described above is a microbiological analysis. The micro-biological analysis is performed to determine and monitor the viability of the microbial cultures being studied. Under this procedure, microbial enumerations of hydrocarbon degraders are performed at each sampling event using a microtiter Most Probable Number (MPN) determination.
4.2 Apparatus. The following materials and equipment are required for the protocol: Appropriate flasks and other glassware; ster-ile tubes; graduated cylinders (100-ml); de-ionized water; p-iodonitrotetrazolium violet dye; weighing pans or paper; 250-ml borosilicate glass Erlenmeyer flasks with screw tops; Pasteur pipettes; laboratory notebook; microtiter MPN plates (24-well) multi-channel pipetting device; dilution tube and caps; autoclave; environmental room or incubator; balance accurate to 0.1 mg (XD– 400); GC/MS instrument equipped with a DB– 5 capillary column (30 m, 0.25-mm I.D., and 0.25-μm film thickness) and a split/splitless injection port operating in the splitless mode, such as Hewlett-Packard 5890/5971 GC/ MS (recommended for use); and an autosampler for testing multiple samples.
4.3 Reagents and culture medium. 4.3.1Preparation of seawater. All products are test-ed in clean natural seawater. Clean natural seawater means that the source of this sea-water must not be heavily contaminated with industrial or other types of effluent. For example, seawater should not be ob-
tained from a source near shipping channels or discharges of industrial or municipal wastewater, or with high turbidity. The sea-water is used within seven days of collection. No microbial inoculum is added.
4.3.2 Preparation of oil. A medium weight crude oil, Alaska North Slope (ANS), is arti-ficially weathered by heating to 521 °F to re-move the light end hydrocarbons prior to ex-perimental start-up (ANS 521). The method is described in the Draft International Stand-ard ISO/DIS 8708 ‘‘Crude Petroleum Oil—De-termination of Distillation Characteristics Using 15 Theoretical Plates Columns’’ by the International Organization for Standardiza-tion (8). The ANS521 crude oil can be ob-tained from the National Environmental Technology Applications Center’s (NETAC) Bioremediation Products Evaluation Center (BPEC), University of Pittsburgh Applied Research Center, 615 William Pitt Way, Pittsburgh, PA, 15238, (412) 826–5511. The crude oil is heated to 190 °C (374 °F) under at-mospheric pressure. The system is then cooled and placed under vacuum (or under an atmospheric pressure of 20 mm Hg) for the final distillation to an atmospheric equiva-lent boiling point of 272 °C (521 °F).
4.3.3 Preparation of mineral nutrient solu-tion. If a commercial product is strictly a microbial agent and does not contain its own nutrients, a mineral nutrient solution will be provided if requested by the product man-ufacturer or vendor. If a commercial product contains its own nutrients, no further nutri-ents will be added. The nutrient solution is a modified salt solution and is described below.
4.3.3.1 Nutrient preparation: 1. N&P Salts. The following salts are added
to distilled water and made up to a 1,000-ml volume. Adjust final pH to 7.8. The solution is sterilized by autoclaving at 121 °C at 15 psig for 20 minutes or by filtering through a sterile 0.22 μm membrane filter. Na2 HPO4.2H2—18.40 g KNO3—76.30 g
2. MgSO4.7H2 O solution. Dissolve 22.50 g in 1,000 ml distilled water. The solution is steri-lized by autoclaving at 121 °C at 15 psig for 20 minutes.
3. CaCl2 solution. Dissolve 27.50 g in 1,000 ml of distilled water. The solution is steri-lized by autoclaving at 121 °C at 15 psig for 20 minutes.
4. FeCl3•6H2 O solution. Dissolve 0.25 g in 1,000 ml of distilled water. The solution is sterilized by autoclaving at 121 °C at 15 psig for 20 minutes.
5. Trace Element Solution. The following salts are added to distilled water and made up to a 1,000-ml volume. The solution is sterilized by autoclaving at 121 °C at 15 psig for 20 minutes. MnSO4.H2 O—30.2 mg H3 BO3—57.2 mg
VerDate Mar<15>2010 09:25 Jul 28, 2010 Jkt 220169 PO 00000 Frm 00245 Fmt 8010 Sfmt 8002 Y:\SGML\220169.XXX 220169WR
eier
-Avi
les
on D
SK
GB
LS3C
1PR
OD
with
CF
R
236
40 CFR Ch. I (7–1–10 Edition) Pt. 300, App. C
ZnSO4.7H2 O—42.8 mg (NH4)6Mo7(O2)4—34.7 mg
The pH of the nutrient solution is adjusted with a pH meter calibrated at room tempera-ture (approximately 25 °C) using commercial buffers of pH 4.0, 7.0, and 10.0 (Fisher Sci-entific), as appropriate, prior to use. The pH is adjusted with concentrated HCl or 10 M NaOH, as appropriate.
4.3.3.2 Final concentrations: Ten (10) ml of solution 1 and 2 ml of solutions 2–5 are added to non-sterile seawater and made up to a 1,000-ml volume immediately prior to test start-up. This seawater/mineral nutrient so-lution is used for all flasks containing prod-
ucts requiring nutrient supplements and for the flasks containing no commercial addi-tive. Seawater without the above nutrient solutions is used for products containing their own source of nutrients.
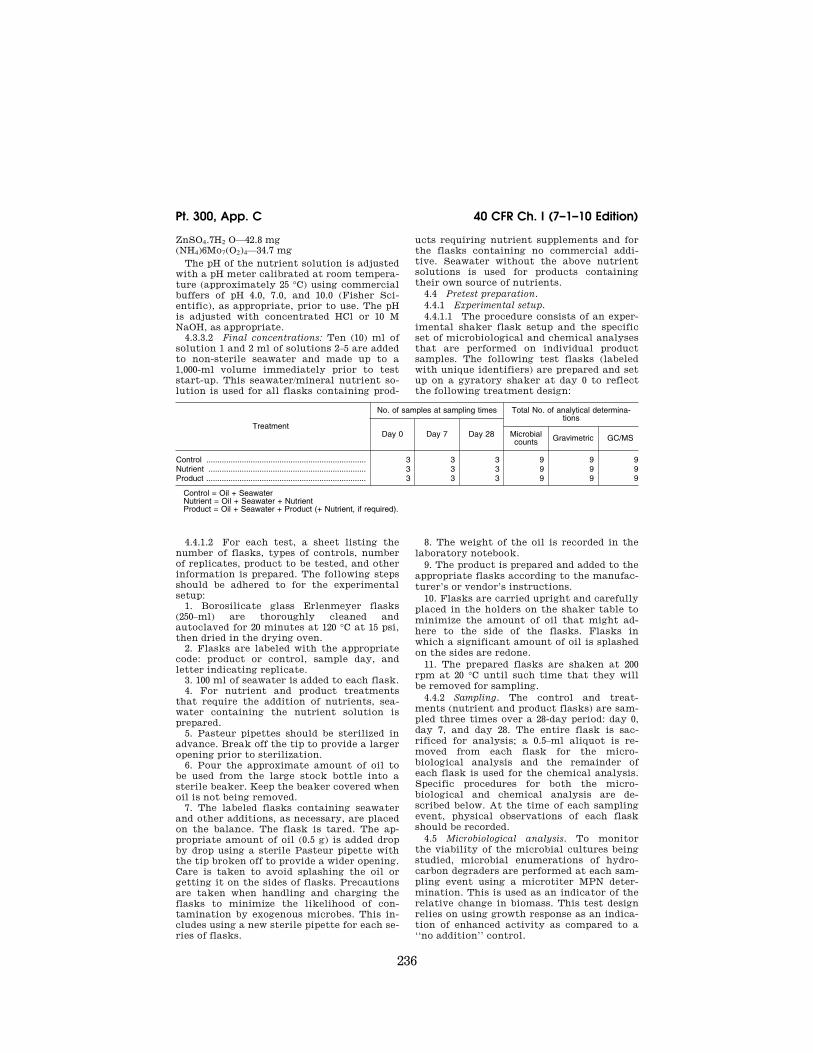
4.4 Pretest preparation. 4.4.1 Experimental setup. 4.4.1.1 The procedure consists of an exper-
imental shaker flask setup and the specific set of microbiological and chemical analyses that are performed on individual product samples. The following test flasks (labeled with unique identifiers) are prepared and set up on a gyratory shaker at day 0 to reflect the following treatment design:
Treatment
No. of samples at sampling times Total No. of analytical determina-tions
Day 0 Day 7 Day 28 Microbial counts Gravimetric GC/MS
Control ........................................................................ 3 3 3 9 9 9 Nutrient ....................................................................... 3 3 3 9 9 9 Product ........................................................................ 3 3 3 9 9 9
Control = Oil + Seawater Nutrient = Oil + Seawater + Nutrient Product = Oil + Seawater + Product (+ Nutrient, if required).
4.4.1.2 For each test, a sheet listing the number of flasks, types of controls, number of replicates, product to be tested, and other information is prepared. The following steps should be adhered to for the experimental setup:
1. Borosilicate glass Erlenmeyer flasks (250–ml) are thoroughly cleaned and autoclaved for 20 minutes at 120 °C at 15 psi, then dried in the drying oven.
2. Flasks are labeled with the appropriate code: product or control, sample day, and letter indicating replicate.
3. 100 ml of seawater is added to each flask. 4. For nutrient and product treatments
that require the addition of nutrients, sea-water containing the nutrient solution is prepared.
5. Pasteur pipettes should be sterilized in advance. Break off the tip to provide a larger opening prior to sterilization.
6. Pour the approximate amount of oil to be used from the large stock bottle into a sterile beaker. Keep the beaker covered when oil is not being removed.
7. The labeled flasks containing seawater and other additions, as necessary, are placed on the balance. The flask is tared. The ap-propriate amount of oil (0.5 g) is added drop by drop using a sterile Pasteur pipette with the tip broken off to provide a wider opening. Care is taken to avoid splashing the oil or getting it on the sides of flasks. Precautions are taken when handling and charging the flasks to minimize the likelihood of con-tamination by exogenous microbes. This in-cludes using a new sterile pipette for each se-ries of flasks.
8. The weight of the oil is recorded in the laboratory notebook.
9. The product is prepared and added to the appropriate flasks according to the manufac-turer’s or vendor’s instructions.
10. Flasks are carried upright and carefully placed in the holders on the shaker table to minimize the amount of oil that might ad-here to the side of the flasks. Flasks in which a significant amount of oil is splashed on the sides are redone.
11. The prepared flasks are shaken at 200 rpm at 20 °C until such time that they will be removed for sampling.
4.4.2 Sampling. The control and treat-ments (nutrient and product flasks) are sam-pled three times over a 28-day period: day 0, day 7, and day 28. The entire flask is sac-rificed for analysis; a 0.5–ml aliquot is re-moved from each flask for the micro-biological analysis and the remainder of each flask is used for the chemical analysis. Specific procedures for both the micro-biological and chemical analysis are de-scribed below. At the time of each sampling event, physical observations of each flask should be recorded.
4.5 Microbiological analysis. To monitor the viability of the microbial cultures being studied, microbial enumerations of hydro-carbon degraders are performed at each sam-pling event using a microtiter MPN deter-mination. This is used as an indicator of the relative change in biomass. This test design relies on using growth response as an indica-tion of enhanced activity as compared to a ‘‘no addition’’ control.
VerDate Mar<15>2010 09:25 Jul 28, 2010 Jkt 220169 PO 00000 Frm 00246 Fmt 8010 Sfmt 8002 Y:\SGML\220169.XXX 220169WR
eier
-Avi
les
on D
SK
GB
LS3C
1PR
OD
with
CF
R

237
Environmental Protection Agency Pt. 300, App. C
4.5.1 Media preparation. Media for micro-bial enumerations are carefully prepared ac-cording to manufacturer’s or other instruc-tions and sterilized using appropriate meth-ods.
4.5.1.1 General media treatment: Buy Bushnell-Haas (B-H) broth in quantities to last no longer than one year. Use media on a first-in, first-out basis. When practical, buy media in quarter-pound multiples, rather than one-pound multiples to keep supply sealed as long as possible. Keep an inventory of media, including kind, amount, lot num-ber, expiration date, date received, and date opened. Check inventory before reordering media. Discard media that are caked, discol-ored, or show other deterioration.
4.5.1.2 Sterile saline (pH adjusted): 1. Weigh 30 g of NaCl. 2. Dissolve in enough water to make 1,000
ml. 3. Adjust pH to 8.0 with NaOH (10M and
0.5M). 4. Sterilize by autoclaving for 15 minutes
at 15 psig. 4.5.1.3 Standard nutrient concentrate (add 1
ml to each 100 ml of Bushnell-Haas medium for MPNs):
1. Weigh compounds listed below, dissolve in DIH2 O, dilute to 1 liter. Potassium Phosphate, monobasic KH2 PO4—
0.633 g Potassium Phosphate, dibasic K2 HPO4—1.619
g Sodium Phosphate, dibasic Na2 HPO4—2.486 g Ammonium Chloride NH4 Cl—3.850 g Magnesium Sulfate, heptahydrate MgSO4·7H2
O—4.500 g Calcium Chloride, dihydrate CaCl2·2H2 O—
7.290 g Ferric Chloride, hexahydrate FeCl3·6H2 O—
0.250 g Trace Elements
Manganese Sulfate, monohydrate MnSO2·H2 O—6.04 mg
Boric Acid H3 Bo3—11.44 mg Zinc Sulfate, heptahydrate ZnSO4·7H2 O—8.56
mg Ammonium Moybdate, tetrahydrate
(NH4)6Mo7 O24·4H2 O—6.94 mg 2. Adjust pH to 6.0. 3. Stir solution for approximately 3 hours,
then filter through a Buchner funnel using #1 paper, which will retain approximately 3.8 g of insolubles.
4. Then filter through a 0.45 micron filter into sterile bottles.
5. Cap bottles, label, and store in refrig-erator until used.
4.5.1.4 Quality assurance/Quality control (QA/QC):
1. Periodically check the effectiveness of sterilization using commercially available tapes or Bacillus stearothermophilus spore sus-pensions, following the instructions with these products.
2. Maintain a media log book that includes the dates, kinds and amounts of media made, pH, and any problems or observations.
3. Before use, check plates and tubes for signs of contamination, drying, or other problems.
4.5.1.5 Safety/Special precautions: 1. Note any safety or other precautions for
particular media. 2. Note precautions to be followed when
using the autoclave. 3. Use gloves and other protective clothes
when handling media. 4. Use care in handling hot media. 4.5.2 Microbial enumeration. Standardized
techniques for performing Most Probable Number microbial enumerations are de-scribed below.
4.5.2.1 Dilutions: 1. Prior to sacrificing each flask, remove
0.5 ml of water from each flask and add it to a tube of 4.5 ml sterile phosphate buffer (1:10 dilution) as prepared in the Standard Methods for the Examination of Water and Wastewater (9). Using sterile technique, mix and perform serial dilutions (0.5 ml of previous dilution to 4.5 ml of sterile phosphate buffer) to 10¥9 di-lution. 4.5.2.2 Inoculating MPN plates (oil degrader):
1. Prepare sufficient sterile 0.4 M NaCl (23.4 g NaCl/1,000 ml B-H) and B-H at pH 7.0 to fill the number of wells required for the test (1.75 ml/well).
2. Using sterile technique, add 1.75 ml of B- H broth to each well.
3. Label the top of the plate with the prop-er dilution for each row.
4. Add 0.1 ml of fluid from each dilution tube to each well in the appropriate row, starting with the most dilute.
5. After adding the fluid to all the wells, add 20 μl of sterilized No. 2 fuel oil to the top of each well.
6. Incubate each plate at 20 °C. 7. After 14 days of incubation, add 100 μl of
p-iodotetrazolium violet dye (50 mg/10 ml of D.I. water) to each well to determine growth.
8. View plates against a white background to determine if color is present. Develop-ment of a purple or pink color upon standing for 45 minutes constitutes a positive test.
9. Record the number of positive wells and the dilutions at which they occur.
10. Enter data into a computerized enu-meration method using ‘‘MPN Calculator’’ software program (version 2.3 or higher) by Albert J. Klee, U.S. EPA Office of Research and Development, Risk Reduction Engineer-ing Laboratory, Cincinnati, OH.
4.5.2.3 Quality assurance/Quality control: 1. Check pH of medium before preparing
wells (pH should be approximately 8.0). Ad-just pH, if necessary, with dilute NaOH.
2. Keep prepared tetrazolium violet dye so-lution in the refrigerator in an amber bottle when not in use.
VerDate Mar<15>2010 09:25 Jul 28, 2010 Jkt 220169 PO 00000 Frm 00247 Fmt 8010 Sfmt 8002 Y:\SGML\220169.XXX 220169WR
eier
-Avi
les
on D
SK
GB
LS3C
1PR
OD
with
CF
R

238
40 CFR Ch. I (7–1–10 Edition) Pt. 300, App. C
3. Have all laboratory personnel periodi-cally run MPNs on the same sample to test precision.
4.5.2.4 Safety/Special precautions: 1. Use sterile technique in preparing solu-
tions, dilutions, plates, and MPN wells. 2. Do not pipette potentially hazardous so-
lutions by mouth. 3. Autoclave all plates and wells before dis-
carding. 4.6 Chemical analysis of oil composition. 4.6.1 Sample procedure. After 0, 7, and 28
days of incubation on a rotary shaker, the appropriate flasks are sacrificed and ex-tracted with dichloromethane and spiked with a surrogate recovery standard. A 10-ml aliquot of the DCM layer is used for the gravimetric analysis. If significant bio-degradation is evident in the results of the gravimetric analysis, then a solvent ex-change into hexane takes place prior to the GC/MS analysis. Follow steps 1–19 below when preparing for the chemical analysis.
1. After 0, 7, and 28 days of rotary shaking and incubating at 20 °C, the reaction vessels are sacrificed. Prior to the chemical anal-ysis, a 0.5-ml sample of the aqueous phase is removed for the microbiological analysis (see Microbial Enumeration above).
2. A surrogate recovery standard is pre-pared in the following manner: 1,000 mg of d10-phenanthrene and 1,000 mg of 5a-andro-stane are measured into a 500-ml volumetric flask and DCM is added to the mark to produce a 2,000-ng/μl stock solution.
3. A 100-μl aliquot of the surrogate solution is added to each test flask. The final con-centration of surrogates in each flask is ap-proximately 4 ng/μl of solvent in the final ex-tract. The aliphatics and marker data should be corrected for percent recovery of the 5a- androstane surrogate and the aromatics for the d10-phenanthrene surrogate.
4. The contents of the flask are placed into a 250-ml separatory funnel.
5. Measure a total volume of 50 ml DCM for use in the extraction. Use 3 10-ml fractions to rinse the flask into the funnel and trans-fer the remaining aliquot of DCM to the fun-nel.
6. Stopper and mix vigorously by shaking (approximately 50 times) while ventilating properly.
7. Each funnel is set aside to allow the DCM and water layers to partition. This may take 5–10 minutes for some products, or up to 3 hours if the product has caused the forma-tion of an emulsion.
8. Drain the first 10 ml of the DCM (bot-tom) layer, collect, cap, uniquely label, and use for gravimetric analysis (see below). Drain the remaining 40 ml and dry it by pass-ing it through a funnel packed with anhy-drous sodium sulfate.
9. Assemble a Kuderna-Danish (KD) con-centrator by attaching a Snyder column to an evaporation flask with a graduated con-
centrator tube. Align vertically and par-tially immerse concentrator tube in a water bath (10). Set the water bath to the appro-priate temperature to maintain proper dis-tillation.
10. Collect the de-watered extract into the KD concentrator.
11. Evaporate DCM to approximately 10 ml, then add approximately 50 ml of the ex-change solvent (hexane) and concentrate the volume to 10 ml.
12. Rinse the flask into the concentrator tube with 50 ml hexane and concentrate to 10 ml. Repeat one more time with 50 ml of hexane.
13. Remove concentrator tube with the re-covered 10 ml of sample volume. The heavier residual material should be present as a pre-cipitate (bottom layer).
14. Centrifuge to aid the separation of the hexane from the precipitant fraction.
15. Place hexane-soluble fraction (top layer)—approximately 1.0 ml—into a GC/MS vial for analysis (see GC/MS Analysis Proce-dure below). If column fouling and deteriora-tion of separation characteristics occur, an alumina column sample cleanup method can be considered (see Alternative GC/MS Sam-ple Cleanup Procedure below).
16. Analyze by GC/MS using the conditions determined by the U.S. EPA Risk Reduction Engineering Laboratory, Water and Haz-ardous Waste Treatment Research Division, in Cincinnati, OH, which follows U.S. EPA Method 8270 (see GC/MS Analysis Procedure below).
17. Calculate surrogate recovery. If surro-gate recovery is less than 85 percent for the marker relative to the surrogate recovery standard (d10-phenanthrene), then the water layer should be extracted again using three separate extractions with DCM. Pool the three extractions with original extract and concentrate to 10 ml, and reanalyze by GC/ MS.
18. Drain the seawater into a storage sam-ple vial/container.
19. Seal the vial with a Teflon-lined cap and store frozen. This water layer is kept in case additional extractions are necessary.
4.6.2 Gravimetric analysis. The initial means to evaluate the effectiveness of a bioremedi-ation agent for oil spill response is through gravimetric analysis. A statistically signifi-cant difference (p < 0.05) in analytical weight of the oil from the control system as com-pared to the analytical weight of the oil treated with a bioremediation agent indi-cates biodegradation has successfully oc-curred. Hence, the disappearance of oil should be accompanied by significant de-creases in total oil residue weight of extract-able materials versus a control. If no signifi-cant decrease in oil residue weight is ob-served, the need to perform further chemical analysis should be evaluated. Follow steps 1– 3 to conduct the gravimetric analysis.
VerDate Mar<15>2010 09:25 Jul 28, 2010 Jkt 220169 PO 00000 Frm 00248 Fmt 8010 Sfmt 8002 Y:\SGML\220169.XXX 220169WR
eier
-Avi
les
on D
SK
GB
LS3C
1PR
OD
with
CF
R

239
Environmental Protection Agency Pt. 300, App. C
1. The 10 ml of DCM extract (from Sample Procedure step 8 above) is placed in a small vial and concentrated to dryness by nitrogen blowdown techniques using a steady stream of nitrogen (pre-purified gas). If the oil is se-verely biodegraded, a larger volume of DCM (>10 ml) may be necessary for the gravimetric analysis.
2. The residue is weighed 3 times for the gravimetric weight of oil. Record the weight of the oil.
3. Compare statistically (p < 0.05) the weight of the product treatment versus the weight of the control from each respective time period. If a significant decrease is ob-served in the sampling (flask containing bio-remediation agent) weight, then proceed with the remainder of the sample procedure.
4.6.3 GC/MS analysis. Often, analysis of saturated and aromatic hydrocarbons by capillary gas chromatography of DCM ex-tracts leads to column fouling and deteriora-tion of separation characteristics. An alter-native, simple ‘‘one-step’’ alumina sample cleanup procedure can be performed on oil before injection; this cleanup removes both asphaltenes and polar compounds and can be applied to DCM extracts as well. This proce-dure is described in steps 1–11 below.
4.6.3.1 Alternative GC/MS sample cleanup procedure:
1. Weigh 4.0 g alumina (neutral, 80–200 mesh) into scintillation vials covered loosely with aluminum foil caps. Prepare one scin-tillation vial per sample. Heat for 18 hours at 300 °C or longer. Place in a desiccator of sili-ca until needed.
2. Add 5.0 ml of DCM to a glass luerlok multi-fit syringe (e.g., BD #2471) with stop-cock (e.g., Perfectum #6021) in closed posi-tion, stainless steel syringe needle (18 gauge), and PTFE frits. Clamp in a vertical position.
3. Transfer 4.0 g of prepared alumina to a plastic weighing boat and fill syringe slowly while applying continuous vibration (e.g., Conair # HM 11FF1).
4. Add a second PTFE frit and push into place on top of the alumina bed.
5. Drain 5.0 ml DCM to the top level of the column frit to await sample addition and dis-card DCM.
6. Weigh 50 mg ±0.1 mg ANS521 oil into a tared vial.
7. Premeasure 10 ml of DCM into a grad-uated cylinder. Add 0.2 to 0.3 ml of the DCM to the tared oil vial. Mix and transfer sol-vent to the column bed with a Pasteur pi-pette. Open stopcock and collect in a 10-ml volumetric flask. Repeat until approxi-mately 1.0 ml (do not exceed 1.0 ml) of DCM has rinsed the vial and inner walls of the sy-ringe body into the 10-ml flask.
8. Transfer balance of DCM from the grad-uated cylinder to the column and regulate the solvent flow rate to approximately 1 to 2
ml/minute. Collect all eluent in the 10-ml flask.
9. Transfer a known volume of eluent to another scintillation vial and blow down to dryness (nitrogen).
10. Determine and record weight. 11. Dissolve in 1.0 ml hexane for the GC/MS
analysis procedure (see below). 4.6.3.2 GC/MS analysis procedure: Immediately prior to injection, an internal
standard solution of four deuterated com-pounds is spiked into the sample extracts and injected. Samples are quantified using the internal standard technique (10) for both the aliphatic and aromatic fractions of the oil extracts in order to provide sufficient in-formation that the oil is being degraded. To help ensure that the observed decline in tar-get analytes is caused by biodegradation rather than by physical loss from mis-handling or inefficient extraction, it is nec-essary to normalize the concentrations of the target analytes via a ‘‘conserved internal marker.’’ Conserved internal markers that have been found useful for quantification are C2- or C3-phenanthrene, C2-chrysene, and C3017a(H),21b(H)-hopane. Deuterated internal standards are used to calculate the relative response factor (RRF) for the target analyte(s). To compute the ‘‘normalized con-centrations,’’ the target analyte concentra-tion at a given sampling time is simply di-vided by the selected conserved analyte con-centration at the same sampling time (11). Conduct the GC/MS analysis using the fol-lowing procedure.
1. One (1) ml of the hexane extract (from Sample Procedure step 15 above) is placed into a 1.5-ml vial for use on the autosampler of the GC/MS instrument.
2. To this solution, 20 μl of a 500-ng/μl solu-tion of the internal standards is added and the vial is capped for injection. The final concentration of the internal standards in each sample is 10 ng/μl. This solution con-tains 4 deuterated compounds: d8-naph-thalene, d10-anthracene, d12-chrysene, and d12-perylene.
3. At the start of any analysis period, the mass spectrometer (MS) is tuned to PFTBA by an autotune program, such as the Hew-lett-Packard quicktune routine, to reduce operator variability. Set the GC/MS in the SIM mode at a scan rate of 1.5 scans/second to maximize the linear quantitative range and precision of the instrument. Set all other conditions to those specified in Instru-ment Configuration and Calibration section below.
4. An instrument blank and a daily stand-ard are analyzed prior to analysis of un-knowns. Internal standards are combined with the sample extracts and coinjected with each analysis to monitor the instrument’s performance during each run.
5. Information that should be included on the acquisition form include operator’s name
VerDate Mar<15>2010 09:25 Jul 28, 2010 Jkt 220169 PO 00000 Frm 00249 Fmt 8010 Sfmt 8002 Y:\SGML\220169.XXX 220169WR
eier
-Avi
les
on D
SK
GB
LS3C
1PR
OD
with
CF
R

240
40 CFR Ch. I (7–1–10 Edition) Pt. 300, App. C
and signature, date of extraction, date and time of autotune, date of injection(s), instru-ment blank, daily standard mix injection, GC column number, and standards for the 5- point calibration curve.
6. If the instrument is operated for a period of time greater than 12 hours, the tune will be checked and another daily standard ana-lyzed prior to continuing with analyses.
TABLE 6—ANALYTES LISTED UNDER THE CORRESPONDING INTERNAL STANDARD USED FOR CALCULATING RRFS
Internal Standard d8-naphthalene d10-anthracene d12-chrysene d12-perylene
Alkanes ........................................ nC10–nC15 ......... nC16–nC23 ... nC24-nC29 .... nC30-nC35. Pristane ......... ........................ C3017b(H), 21a(H)-hopane. Phytane ......... ........................5a-androstane ........................
Aromatics ..................................... Naphthalene ........ Dibenzothioph-ene.
Fluoranthene Benzo(b)fluoranthene.
Fluorene ........ Pyrene ........... Benzo(k)fluoranthene. Anthracene .... Chrysene ....... Benzo(e)pyrene. Phenanthrene ........................ Benzo(a)pyrene.
Perylene. Indeno(g,h,i)pyrene. Dibenzo(a,h) anthracene. Benzo(1,2,3-cd)perylene.
7. The MS is calibrated using a modified version of EPA Method 8270 (10). Specifically, the concentrations of internal standards are 10 ng/μl instead of 40 ng/μl. A five-point cali-bration curve is obtained for each compound listed in table 6 prior to sample analysis at 1, 5, 10, 25, and 50 ng/μl. A 5-point calibration must be conducted on a standard mix of com-pounds to determine RRFs for the analytes. The standard mix (excluding the marker) for this calibration curve may be obtained from Absolute Standards, Inc., 498 Russell St., New Haven, CT, 06513, (800) 368–1131. If C3017b(H),21a(H)-hopane is used, it may be ob-tained from Dr. Charles Kennicutt II, Geo-chemical and Environmental Research Group, Texas A&M University, 833 Graham Rd., College Station, TX, 77845, (409) 690–0095.
8. Calculate each compound’s relative re-sponse factor to its corresponding deuterated internal standard indicated above, using the following equation:
RRF=(Ax Cis)/(Ais Cx)(6)
where:
RRF=relative response factor Ax=peak area of the characteristic ion for
the compound being measured (analyte) Ais=peak area of the characteristic ion for
the specific internal standard Cx=concentration of the compound being
measured (ng/μl) Cis=concentration of the specific internal
standard (10 ng/μl). (This concentration is a constant in this equation for the calibra-tion curve.) 9. Identify each analyte based on the inte-
grated abundance from the primary char-acteristic ion indicated in table 7.
10. Quantitate each analyte using the in-ternal standard technique. The internal standard used shall be the one nearest the
retention time of that of a given analyte (Table 8).
TABLE 7—PRIMARY IONS MONITORED FOR EACH TARGET ANALYTE DURING GC/MS ANALYSIS
Compound Ion
n-alkanes (C10–C35) ......................................................... 85 Pristane ............................................................................ 85 Phytane ............................................................................ 85 Naphthalene .................................................................... 128 C1-naphthalenes ............................................................. 142 C2-naphthalenes ............................................................. 156 C3-naphthalenes ............................................................. 170 C4-naphthalenes ............................................................. 184 Fluorene ........................................................................... 166 C1-fluorenes .................................................................... 180 C2-fluorenes .................................................................... 194 C3-fluorenes .................................................................... 208 Dibenzothiophenes .......................................................... 184 C1-dibenzothiophenes ..................................................... 198 C2-dibenzothiophenes ..................................................... 212 C3-dibenzothiophenes ..................................................... 226 Anthracene ...................................................................... 178 Phenanthrene .................................................................. 178 C1-phenanthrenes ........................................................... 192 C2-phenanthrenes ........................................................... 206 C3-phenanthrenes ........................................................... 220 Fluoranthene/pyrene ........................................................ 202 C1-pyrenes ...................................................................... 216 C2-pyrenes ...................................................................... 230 Chrysene ......................................................................... 228 C1-chrysenes ................................................................... 242 C2-chrysenes ................................................................... 256 Hopanes (177 family) ...................................................... 177 Hopanes (191 family) ...................................................... 191 Steranes (217 family) ...................................................... 217 Benzo(b)fluoranthene ...................................................... 252 Benzo(k)fluoranthene ...................................................... 252 Benzo(e)pyrene ............................................................... 252 Benzo(a)pyrene ............................................................... 252 Perylene ........................................................................... 252 Ideno(g,h,i)pyrene ............................................................ 276 Dibenzo(a,h)anthracene .................................................. 278 Benzo(1,2,3-cd)perylene ................................................. 276 d8-naphthalene ................................................................ 136 d10-anthracene ................................................................. 188
VerDate Mar<15>2010 09:25 Jul 28, 2010 Jkt 220169 PO 00000 Frm 00250 Fmt 8010 Sfmt 8002 Y:\SGML\220169.XXX 220169WR
eier
-Avi
les
on D
SK
GB
LS3C
1PR
OD
with
CF
R

241
Environmental Protection Agency Pt. 300, App. C
TABLE 7—PRIMARY IONS MONITORED FOR EACH TARGET ANALYTE DURING GC/MS ANAL-YSIS—Continued
Compound Ion
d10-phenanthrene ............................................................. 188 d12-chrysene .................................................................... 240
TABLE 7—PRIMARY IONS MONITORED FOR EACH TARGET ANALYTE DURING GC/MS ANAL-YSIS—Continued
Compound Ion
d12-perylene ..................................................................... 264 a-androstane ................................................................... 260
TABLE 8—ANALYTES AND REFERENCE COMPOUNDS
Compound Reference compound Compound Reference compound
n-C10 ....................................... n-C10 ..................................... C2-naphthalene ...................... Naphthalene. n-C11 ....................................... n-C11 ..................................... C3-naphthalene ...................... Naphthalene. n-C12 ....................................... n-C12 ..................................... C4-naphthalene ...................... Naphthalene. n-C13 ....................................... n-C13 ..................................... Fluorene ................................. Fluorene. n-C14 ....................................... n-C14 ..................................... C1-fluorene ............................ Fluorene. n-C15 ....................................... n-C15 ..................................... C2-fluorene ............................ Fluorene. n-C16 ....................................... n-C16 ..................................... C3-fluorene ............................ Fluorene. n-C17 ....................................... n-C17 ..................................... Dibenzothiophene .................. Dibenzothiophene. Pristane .................................... Pristane .................................. C1-dibenzothiophene ............. Dibenzothiophene. n-C18 ....................................... n-C18 ..................................... C2-dibenzothiophene ............. Dibenzothiophene. Phytane .................................... Phytane .................................. C3-dibenzothiophene ............. Dibenzothiophene. n-C19 ....................................... n-C19 ..................................... Phenanthrene ......................... Phenanthrene. n-C20 ....................................... n-C20 ..................................... Anthracene ............................. Anthracene. n-C21 ....................................... n-C21 ..................................... C1-phenanthrene ................... Phenanthrene. n-C22 ....................................... n-C22 ..................................... C2-phenanthrene ................... Phenanthrene. n-C23 ....................................... n-C23 ..................................... C3-phenanthrene ................... Phenanthrene. n-C24 ....................................... n-C24 ..................................... Fluoranthene .......................... Fluoranthene. n-C25 ....................................... n-C25 ..................................... Pyrene .................................... Pyrene. n-C26 ....................................... n-C26 ..................................... C1-pyrene .............................. Pyrene. n-C27 ....................................... n-C27 ..................................... C2-pyrene .............................. Pyrene. n-C28 ....................................... n-C28 ..................................... Chrysene ................................ Chrysene. n-C29 ....................................... n-C29 ..................................... C1-chrysene ........................... Chrysene. n-C30 ....................................... n-C30 ..................................... C2-chrysene ........................... Chrysene. n-C31 ....................................... n-C31 ..................................... Benzo(b)fluoranthene ............. Benzo(b)fluoranthene. n-C32 ....................................... n-C32 ..................................... Benzo(k)fluoranthene ............. Benzo(k)fluoranthene. n-C33 ....................................... n-C33 ..................................... Benzo(e)pyrene ...................... Benzo(e)pyrene. n-C34 ....................................... n-C34 ..................................... Benzo(a)pyrene ...................... Benzo(a)pyrene. n-C35 C3017a,21b-hopane ...... n-C35 C3017a,21b-hopane .... Perylene ideno(g,h,i)pyrene ... Perylene ideno(g,h,i)pyrene. 5a-androstane ......................... 5a-androstane ........................ Dibenzo(a,h)anthracene ......... Dibenzo(a,h)anthracene. C1-naphthalene ....................... Naphthalene ........................... Benzo(1,2,3-cd)perylene ........ Benzo(1,2,3-cd)perylene.
11. Use equation 7 to calculate the con-centration of analytes in ng/mg (ppm) oil:
Concentration (ng/mg)=(Ax Is Vt× 1,000)/ (Ais(RRF)Vi Mo)(7)
where:
Ax=peak area of characteristic ion for com-pound being measured
Is=amount of internal standard injected, in ng (i.e., 20 ng)
Vt=volume of the total DCM extract (50 ml) Ais=peak area of the characteristic ion of the
internal standard RRF=relative response factor Vi=volume of the extract injected (2 μl) Mo=total mass of the oil added to the flask,
mg 12. Compute the ‘‘normalized concentra-
tions’’ for each target analyte concentration at a given sampling time (equation 7) by sim-ply dividing by the conserved internal mark-er concentration at the same sampling time.
4.6.4 Generally accepted laboratory proce-dures. Samples are immediately logged into the laboratory, where they will be given a
unique sample identification based on Julian data and the number logged in. Prior to the analysis of any experimental samples, a five- point standard curve is prepared. One of the mid-range standard curve concentration lev-els is analyzed daily before sample analysis as a continuing standard. RRFs for all target analytes should be within 25% of the stand-ard curve response values at day 0, and at any sampling event the check standard per-cent difference from the initial five-point calibration must not exceed 20% between the before and after daily standard mix (see below). The collected GC/MS data are ini-tially processed by a macro routine, which performs extracted chromatographic plots of the target compounds, integrates the target compounds, and shows integration results to include tabular numbers. The integration values are then transferred to a spreadsheet format to be quantified. Because of the com-plexity of the analyte matrix (oil), a very high degree of manual verification and re-integration of the spectral data is required.
VerDate Mar<15>2010 09:25 Jul 28, 2010 Jkt 220169 PO 00000 Frm 00251 Fmt 8010 Sfmt 8002 Y:\SGML\220169.XXX 220169WR
eier
-Avi
les
on D
SK
GB
LS3C
1PR
OD
with
CF
R

242
40 CFR Ch. I (7–1–10 Edition) Pt. 300, App. C
4.6.5 QA/QC procedures. The reliability of this method is dependent on the QA/QC pro-cedures followed. Before and after each ana-lytical batch (approximately 10 samples), analyze one procedural blank, one duplicate, and one calibration verification standard (10 ng/μl). Analyze one reference crude oil stand-ard. The instrument’s performance and re-producibility are validated routinely in this manner. Surrogate recoveries should be within 70 to 120%, and duplicate relative per-cent difference values should be ±20%. A con-trol chart of the standard oil should be pre-pared and monitored. Variations of analytes in the control chart should be no more than 25% from the historical averages. Injection port discrimination for n-C25 and greater alkanes must be carefully monitored; the ratio of RRF n-C32/RRF n-C21 alkanes should not be allowed to fall below 80%. The mass discrimination can be reduced by replacing the quartz liner in the injection port after every analytical batch. The instrument’s performance and reproducibility are vali-dated routinely by analyzing the reference crude oil standard. All analyses are recorded in instrument logs detailing operating condi-tions, date and time, file name, etc. After analysis, the sample extracts are archived at refrigeration temperatures. To document QA/QC, the following information is con-tained in the detailed quantitative reports: average RRF derived from the standard curve; RRF from the daily standard; percent relative standard deviation; area of target analyte; concentration determined both on a weight and volume basis; and values for any surrogates and internal standards.
4.6.6 Instrument configuration and calibra-tion. A 2-ml aliquot of the hexane extract prepared by the above procedure is injected into a GC/MS instrument, such as the Hew-lett-Packard 5890/5971 GC/MS (recommended for use). This instrument should be equipped with a DB–5 capillary column (30 m, 0.25-mm I.D., and 0.25-μm film thickness) and a split/ splitless injection port operating in the splitless mode. Table 9 summarizes the tem-perature program used for the analysis. This temperature program has been optimized to give the best separation and sensitivity for analysis of the desired compounds on the in-strument. Prior to the sample analysis, a five-point calibration must be conducted on a standard mix of the compounds listed in table 7 to determine RRFs for the analyses.
TABLE 9—OPERATING CONDITIONS AND TEMPERATURE PROGRAM OF GC/MS
Operating conditions
Injector port—290 °C Transfer line—320 °C
Total run time—73 minutes Column flow rate (He)—1.0 ml/minute
Temperature Program
Level Temp. 1, °C
Time 1, min-utes
Rate, °C/
minute
Temp 2, °C
Time 2, min-utes
Level 1 ....... 55 3 5 280 5 Level 2 ....... 280 0 3 310 10
4.7 Statistical analysis. The determination of a bioremediation agent’s effectiveness will be partially based upon the results of a sta-tistical analysis of the shaker flask experi-ment. The experimental design for this test is a two factorial design. This two-way anal-ysis of variance (ANOVA) will be used to de-termine data trends. The statistical method is designed to test various types of bio-remediation treatments including microbial, nutrient, enzyme, and combination products. The following is a summary of the statistical methods to be used to evaluate the analyt-ical data obtained from all product tests. The experimental design, data analysis methodology, interpretation of results, re-quired documentation, and a numeric exam-ple are outlined below.
4.7.1 Experimental design. The experi-mental design for this test is known as a fac-torial experiment with two factors. The first factor is product/control group; the second factor is time (measured in days). For exam-ple, if two groups (product A and a non-nu-trient control) are tested at each of three points in time (day 0, 7, and 28), the experi-ment is called a 2×3 factorial experiment. There will be three replications (replicated shaker flasks) of each group-time combina-tion.
4.7.2 Data analysis methods. For each analyte and each product used, a product is considered a success by the demonstration of a statistically significant difference between the mean analyte degradation by the product and the mean analyte degradation by the non-nutrient control. Such a determination will be made by performing an ANOVA on the sample data. The technical aspects of this procedure are outlined in Snedecor and Cochran (12). Most statistical software pack-ages support the use of two-way ANOVA. However, the format required for the input data differs among the various commercial packages. Whichever package is used, the following ANOVA table will be provided as part of the output. In the Degree of Freedom column of table 10, p = the number of prod-uct/control groups, t = the number of days at which each group is analyzed, and n = the number of replications. For the example of the 2×3 factorial experiment discussed above, p=2, t=3, and n=3. The significance of the F- statistics (as indicated by their cor-responding p-values) are used to interpret the analysis.
VerDate Mar<15>2010 09:25 Jul 28, 2010 Jkt 220169 PO 00000 Frm 00252 Fmt 8010 Sfmt 8002 Y:\SGML\220169.XXX 220169WR
eier
-Avi
les
on D
SK
GB
LS3C
1PR
OD
with
CF
R

243
Environmental Protection Agency Pt. 300, App. C
TABLE 10—TWO-WAY ANOVA TABLE
Source Degree of free-dom (df) Sum of squares Mean square F-Statistic p-Value
Group .......................................... p-1 SSG MSG-MSG/MSE MSG/MSE 1 Time ............................................ t-1 SST MST-MST/MSE MST/MSE 1 Interaction .................................... (p–1)(t–1) SSI MSI-MSI/MSE MSI/MSE 1 Error ............................................ pt(n–1) SSE MSE-SSE
Total ....................... npt–1 SSTOT
1 To be determined from the value of the F-statistic.
4.7.3 Interpretation. 4.7.3.1 If the F-sta-tistic for the interaction is significant at the 0.05 level (i.e., p-value is less than 0.05), the data indicate that the mean response of at least two groups being tested differ for at least one point in time. In order to find out which groups and at which points in time the difference occurs, pairwise comparisons be-tween the group means should be conducted for all time points. These comparisons can be made using protected least squared dif-ference (LSD) or Dunnett mean separation techniques. The protected LSD procedure is detailed in Snedecor and Cochran (12); the Dunnett procedure is outlined in Mont-gomery (13). For both methods, the mean square error (MSE) from the two-way ANOVA table should be used to compute the separation values.
4.7.3.2 If the F-statistic for the inter-action is not significant at the 0.05 level (i.e., p-value not less than 0.05), but the F-sta-tistic for the group is significant (i.e., p- value is less than 0.05), the data indicate that any differences that exist among the group means are consistent across time. To find out which group means differ, a pairwise comparison of the group means should be carried out by pooling data across all points in time. Again, the MSE from the two-way ANOVA table should be used to compute the separation values.
4.7.3.3 If the F-statistic corresponding to both interaction and group are not signifi-cant at the 0.05 level, the data indicate no difference between the group means at any point in time. In this case, no further anal-ysis is necessary.
4.7.3.4 Finally, Snedecor and Cochran (12) use caution concerning the use of multiple comparisons. If many such comparisons are being conducted, then about 5% of the tested differences will erroneously be concluded as significant. The researcher must guard against such differences causing undue at-tention.
4.7.4 Required documentation. 4.7.4.1 The following documents should be included to summarize the findings from a product test.
1. Data listings for each analyte that was analyzed. These should show all raw data.
2. A table of summary statistics for each analyte. The table should include the mean,
standard deviation, and sample size for each group at each day.
3. An ANOVA table for each analyte. The table should be of the same format as table 10.
4. A clear summary of the mean separa-tions (if mean separations were necessary). The mean separation methods (LSD or Dunnett), the significance level, the min-imum significant difference value, and the significant differences should be clearly marked on each output page.
5. All computer outputs should be included. No programming alterations are necessary. The specific computer package used to ana-lyze the data should be included in the re-port.
Example. An analysis of the total aromatic data (in ppm) was conducted for the fol-lowing three groups:
Group 1: Non-nutrient Control Group 2: Nutrient Control Group 3: Test Product 4.7.4.2 The raw data are shown in table 11.
Note the three replications for each group- time combination.
TABLE 11—PRODUCT TEST DATA, TOTAL AROMATICS (PPM)
Group 1
Group 2
Group 3
Day 0 ......................................... 8153 7912 7711 8299 8309 8311 8088 8111 8200
Day 7 ......................................... 8100 7950 6900 8078 8200 6702 7999 8019 5987
Day 28 ....................................... 8259 8102 4000 8111 7754 3875 8344 7659 3100
4.7.4.3 Table 12 gives the summary statis-tics (number of observations, means, and standard deviations) for each group-time combination.
TABLE 12—SUMMARY STATISTICS FOR PRODUCT TEST DATA TOTAL AROMATICS (PPM)
Time Product n Mean
Stand-ard
devi-ation
Day 0 .............................. Group 1 3 8,180.0 108.1
VerDate Mar<15>2010 09:25 Jul 28, 2010 Jkt 220169 PO 00000 Frm 00253 Fmt 8010 Sfmt 8002 Y:\SGML\220169.XXX 220169WR
eier
-Avi
les
on D
SK
GB
LS3C
1PR
OD
with
CF
R

244
40 CFR Ch. I (7–1–10 Edition) Pt. 300, App. C
TABLE 12—SUMMARY STATISTICS FOR PRODUCT TEST DATA TOTAL AROMATICS (PPM)—Contin-ued
Time Product n Mean
Stand-ard
devi-ation
Group 2 3 8,110.7 198.5 Group 3 3 8,074.0 319.2
Day 7 .............................. Group 1 3 8,059.0 53.1 Group 2 3 8,056.3 129.1 Group 3 3 6,529.7 480.3
Day 28 ............................ Group 1 3 8,238.0 117.9
TABLE 12—SUMMARY STATISTICS FOR PRODUCT TEST DATA TOTAL AROMATICS (PPM)—Contin-ued
Time Product n Mean
Stand-ard
devi-ation
Group 2 3 7,838.3 233.2 Group 3 3 3,658.3 487.6
4.7.4.4 Table 13 shows the results of the two-way ANOVA.
TABLE 13—EXAMPLE TWO-WAY ANOVA TABLE
Source df Sum of squares Mean square F-sta-tistic p-value
Group ............................................................................................ 2 23,944,856.41 11,972,428.70 151.94 0.0001 Time .............................................................................................. 2 10,954,731.19 5,477,365.59 69.51 0.0001 Interaction ...................................................................................... 4 19,347,589.04 4,836,897.26 61.39 0.0001 Error .............................................................................................. 18 1,418,303.33 78,794.63 ............ ............
Total ......................................................................... 26 55,665,480.96 .......................... ............ ............
4.7.4.5 From table 13, it can be seen that the F-statistic for interaction is significant (F=61.39, p=0.0001). This indicates that group differences exist for one or more days. Pro-tected LSD mean separations were then con-ducted for each day to determine which group differences exist. The results are sum-marized in table 14. Note that means with the same letter (T grouping) are not signifi-cantly different.
TABLE 14—PAIRWISE PROTECTED LSD MEAN SEPARATION
T grouping Mean n Interaction
A ......................... 8,338.0 3 Group 1, Day 28. A ......................... 8,180.0 3 Group 1, Day 0. A ......................... 8,110.7 3 Group 2, Day 0. A ......................... 8,074.0 3 Group 3, Day 0. A ......................... 8,059.0 3 Group 1, Day 7. A ......................... 8,056.3 3 Group 2, Day 7. A ......................... 7,838.3 3 Group 2, Day 28. B ......................... 6,529.7 3 Group 3, Day 7. C ......................... 3,658.3 3 Group 3, Day 28.
Significant Level = 0.05. Degrees of Freedom = 18. Mean Square Error = 78794.63. Critical Value = 2.10. Least Significant Difference = 481.52.
4.7.4.6 The grouping letters indicate that the product mean values (group 3) at day 7 and day 28 are significantly different from those of both the nutrient control (group 2) and the non-nutrient control (group 1) for those days. No other significant differences are shown. Therefore, in terms of total aro-matic degradation, the test indicates the de-sired statistically significant difference be-tween the mean of the product and the mean of the non-nutrient control.
5.0 Bioremediation agent toxicity test [Reserved]
6.0 Summary technical product test data format.
The purpose of this format is to summarize in a standard and convenient presentation the technical product test data required by the U.S. Environmental Protection Agency before a product may be added to EPA’s NCP Product Schedule, which may be used in car-rying out the National Oil and Hazardous Substances Pollution Contingency Plan. This format, however, is not to preclude the submission of all the laboratory data used to develop the data summarized in this format. Sufficient data should be presented on both the effectiveness and toxicity tests to enable EPA to evaluate the adequacy of the summa-rized data. A summary of the technical prod-uct test data should be submitted in the fol-lowing format. The numbered headings should be used in all submissions. The sub-headings indicate the kinds of information to be supplied. The listed subheadings, how-ever, are not exhaustive; additional relevant information should be reported where nec-essary. As noted, some subheadings may apply only to particular types of agents.
I. Name, Brand, or Trademark II. Name, Address, and Telephone Number of
Manufacturer III. Name, Address, and Telephone Numbers
of Primary Distributors IV. Special Handling and Worker Precautions
for Storage and Field Application 1. Flammability. 2. Ventilation. 3. Skin and eye contact; protective cloth-
ing; treatment in case of contact.
VerDate Mar<15>2010 09:25 Jul 28, 2010 Jkt 220169 PO 00000 Frm 00254 Fmt 8010 Sfmt 8002 Y:\SGML\220169.XXX 220169WR
eier
-Avi
les
on D
SK
GB
LS3C
1PR
OD
with
CF
R

245
Environmental Protection Agency Pt. 300, App. C
4. Maximum and minimum storage tem-peratures; optimum storage temperature range; temperatures of phase separations and chemical changes.
V. Shelf Life VI. Recommended Application Procedure 1. Application method. 2. Concentration, application rate (e.g.,
gallons of dispersant per ton of oil). 3. Conditions for use: water salinity, water
temperature, types and ages of pollutants. VII. Toxicity (Dispersants, Surface Washing
Agents, Surface Collecting Agents, and Mis-cellaneous Oil Spill Control Agents)
Materials Tested Species LC50 (ppm)
Product Menidia beryllina Mysidopsis bahia 2
96-hr. 48-hr.
No. 2 fuel oil Menidia beryllina Mysidopsis bahia
96-hr. 48-hr.
Product and No. 2 fuel oil (1:10)
Menidia beryllina Mysidopsis bahia
96-hr. 48-hr.
VIII.(a). Effectiveness (bioremediation agents). Raw data must be reported according to the format shown below. The first column lists the names of the analytes measured by GC/MS (SIM), the surrogate standards, and various ratios and sums. In the next three columns, the concentration of the analytes (ng/mg oil), the concentration of the analytes corrected for the recovery of the surrogate standard (a-androstane for alkanes, d10-phenanthrene for aromatics),
and the concentration of corrected analytes normalized against the conserved internal marker, respectively, are reported for the first replicate from the first sampling event. These three columns are each repeated for the next two replicates, giving 9 total col-umns for the product of interest. The next 9 columns are the same as the product col-umns except they are for the non-nutrient control. The last nine columns are for the nutrient control. Thus, a total of 28 columns are needed in the spreadsheet. This spread-sheet is for the first sampling event (day 0). Two more identical spreadsheets will be needed for each of the next two sampling events (days 7 and 28). For the statistical analysis, a report showing the two-way anal-ysis of variance (ANOVA) table created by the software used by the investigator must be shown in its entirety along with the name of the software package used. Another print-out showing the mean separation table (pro-tected LSD test results) generated by the software must be reported. The statistical analyses are conducted using the sum of the alkane concentrations and the sum of the aromatics concentrations from the raw data table. Thus, two ANOVAs are run for each sampling event, one for total alkanes and one for total aromatics, giving a total of 6 ANOVAs for a product test (2 ANOVAs × 3 sampling events). Only if significant dif-ferences are detected by a given ANOVA will it be necessary to run a protected LSD test.
BIOREMEDIATION AGENT EFFECTIVENESS TEST RAW DATA [Date: . Testing Date: 0, 7, 28 (Circle One). Initial Oil Weight: .]
Product Replicate 1 Product Replicate
2 Concentration ng/mg
Surrogate cor-rected ng/mg
Normalized to marker ng/mg
Alkane Analyte .............................. .............................. .............................. ..............................n-C10 .............................................. .............................. .............................. .............................. ..............................n-C11 .............................................. .............................. .............................. .............................. ..............................n-C12 .............................................. .............................. .............................. .............................. ..............................n-C13 .............................................. .............................. .............................. .............................. ..............................n-C14 .............................................. .............................. .............................. .............................. ..............................n-C15 .............................................. .............................. .............................. .............................. ..............................n-C16 .............................................. .............................. .............................. .............................. ..............................n-C17 .............................................. .............................. .............................. .............................. ..............................pristane ........................................... .............................. .............................. .............................. ..............................n-C18 .............................................. .............................. .............................. .............................. ..............................phytane ........................................... .............................. .............................. .............................. ..............................n-C19 .............................................. .............................. .............................. .............................. ..............................n-C20 .............................................. .............................. .............................. .............................. ..............................n-C21 .............................................. .............................. .............................. .............................. ..............................n-C22 .............................................. .............................. .............................. .............................. ..............................n-C23 .............................................. .............................. .............................. .............................. ..............................n-C24 .............................................. .............................. .............................. .............................. ..............................n-C25 .............................................. .............................. .............................. .............................. ..............................n-C26 .............................................. .............................. .............................. .............................. ..............................n-C27 .............................................. .............................. .............................. .............................. ..............................n-C28 .............................................. .............................. .............................. .............................. ..............................n-C29 .............................................. .............................. .............................. .............................. ..............................n-C30 .............................................. .............................. .............................. .............................. ..............................n-C31 .............................................. .............................. .............................. .............................. ..............................n-C32 .............................................. .............................. .............................. .............................. ..............................n-C33 .............................................. .............................. .............................. .............................. ..............................n-C34 .............................................. .............................. .............................. .............................. ..............................n-C35 .............................................. .............................. .............................. .............................. ..............................
VerDate Mar<15>2010 09:25 Jul 28, 2010 Jkt 220169 PO 00000 Frm 00255 Fmt 8010 Sfmt 8002 Y:\SGML\220169.XXX 220169WR
eier
-Avi
les
on D
SK
GB
LS3C
1PR
OD
with
CF
R

246
40 CFR Ch. I (7–1–10 Edition) Pt. 300, App. C
2 If the submitter claims that the informa-tion presented under this subheading is con-fidential, this information should be sub-mitted on a separate sheet of paper clearly
BIOREMEDIATION AGENT EFFECTIVENESS TEST RAW DATA—Continued [Date: . Testing Date: 0, 7, 28 (Circle One). Initial Oil Weight: .]
Product Replicate 1 Product Replicate
2 Concentration ng/mg
Surrogate cor-rected ng/mg
Normalized to marker ng/mg
n-C36 .............................................. .............................. .............................. .............................. ..............................a-androstane ................................... .............................. .............................. .............................. ..............................Total alkanes .................................. .............................. .............................. .............................. ..............................n-C17:pristane ................................ .............................. .............................. .............................. ..............................n-C18:phytane ................................ .............................. .............................. .............................. ..............................
Aromatic Analyte: .............................. .............................. .............................. ..............................naphthalene .................................... .............................. .............................. .............................. ..............................C1-naphthalenes ............................. .............................. .............................. .............................. ..............................C2-naphthalenes ............................. .............................. .............................. .............................. ..............................C3-naphthalenes ............................. .............................. .............................. .............................. ..............................C4-naphthalenes ............................. .............................. .............................. .............................. ..............................dibenzothiophene ............................ .............................. .............................. .............................. ..............................fluorene ........................................... .............................. .............................. .............................. ..............................C1-fluorenes ................................... .............................. .............................. .............................. ..............................C2-fluorenes ................................... .............................. .............................. .............................. ..............................C3-fluorenes ................................... .............................. .............................. .............................. ..............................C1-dibenzothiophenes .................... .............................. .............................. .............................. ..............................C2-dibenzothiophenes .................... .............................. .............................. .............................. ..............................C3-dibenzothiophenes .................... .............................. .............................. .............................. ..............................phenanthrene .................................. .............................. .............................. .............................. ..............................anthracene ...................................... .............................. .............................. .............................. ..............................C1-phenanthrenes .......................... .............................. .............................. .............................. ..............................C2-phenanthrenes .......................... .............................. .............................. .............................. ..............................C3-phenanthrenes .......................... .............................. .............................. .............................. ..............................naphthobenzothio ........................... .............................. .............................. .............................. ..............................C1-naphthobenzothio ...................... .............................. .............................. .............................. ..............................C2-naphthobenzothio ...................... .............................. .............................. .............................. ..............................C3-naphthobenzothio ...................... .............................. .............................. .............................. ..............................fluoranthene .................................... .............................. .............................. .............................. ..............................pyrene ............................................. .............................. .............................. .............................. ..............................C1-pyrenes ..................................... .............................. .............................. .............................. ..............................C1-pyrenes ..................................... .............................. .............................. .............................. ..............................chrysene ......................................... .............................. .............................. .............................. ..............................benzo(a)anthracene ........................ .............................. .............................. .............................. ..............................C1-chrysenes .................................. .............................. .............................. .............................. ..............................c2-chrysenes ................................... .............................. .............................. .............................. ..............................benzo(b)fluoranth ............................ .............................. .............................. .............................. ..............................benzo(k)fluoranth ............................ .............................. .............................. .............................. ..............................benzo(e)pyrene ............................... .............................. .............................. .............................. ..............................benzo(a)pyrene ............................... .............................. .............................. .............................. ..............................perylene .......................................... .............................. .............................. .............................. ..............................indeno(1,2,3-cd)per ......................... .............................. .............................. .............................. ..............................benzo(g,h,i)pyrene .......................... .............................. .............................. .............................. ..............................dibenz(ah)anthrac ........................... .............................. .............................. .............................. ..............................a,b-hopane ...................................... .............................. .............................. .............................. ..............................d8-naphthalene ............................... .............................. .............................. .............................. ..............................d10-phenanthrene ........................... .............................. .............................. .............................. ..............................d12-chrysene .................................. .............................. .............................. .............................. ..............................d12-perylene ................................... .............................. .............................. .............................. ..............................
Total aromatics ........................ .............................. .............................. .............................. ..............................Grav. weight oil ............................... .............................. .............................. .............................. ..............................No. oil degraders/ml ....................... .............................. .............................. .............................. ..............................
VIII.(b). Toxicity (Bioremediation Agents) [Reserved]
IX. Microbiological Analysis (Bioremediation Agents)
X. Physical Properties of Dispersant/Surface Washing Agent/Surface Collecting Agent/Mis-cellaneous Oil Spill Control Agent:
1. Flash Point: ( °F) 2. Pour Point: ( °F) 3. Viscosity: lll at lll °F (furol sec-
onds)
4. Specific Gravity: lll at lll °F 5. pH: (10% solution if hydrocarbon based) 6. Surface Active Agents (Dispersants and
Surface Washing Agents) 2
VerDate Mar<15>2010 09:25 Jul 28, 2010 Jkt 220169 PO 00000 Frm 00256 Fmt 8010 Sfmt 8002 Y:\SGML\220169.XXX 220169WR
eier
-Avi
les
on D
SK
GB
LS3C
1PR
OD
with
CF
R

247
Environmental Protection Agency Pt. 300, App. D
labeled according to the subheading and en-titled ‘‘Confidential Information.’’
7. Solvents (Dispersants and Surface Wash-ing Agents)
8. Additives (Dispersants and Surface Washing Agents)
9. Solubility (Surface Collecting Agents) XI. Analysis for Heavy Metals, Chlorinated
Hydrocarbons, and Cyanide (Dispersants, Sur-face Washing Agents, Surface Collecting Agents, and Miscellaneous Oil Spill Control Agents):
Compounds Concentration (ppm)
Arsenic ....................................Cadmium .................................Chromium ...............................Copper ....................................Lead ........................................Mercury ...................................Nickel ......................................Zinc .........................................Cyanide ...................................Chlorinated Hydrocarbons ......
REFERENCES
(1) L.T. McCarthy, Jr., I. Wilder, and J.S. Dorrier. Standard Dispersant Effectiveness and Toxicity Tests. EPA Report EPA-R2-73-201 (May 1973).
(2) M.F. Fingas, K.A. Hughes, and M.A. Schwertzer. ‘‘Dispersant Testing at the Envi-ronmental Emergencies Technology Divi-sion.’’ Proc. Tenth Arctic Marine Oilspill Pro-gram Technical Seminar. 9–11 June, 1987. Ed-monton, Alberta, Canada. Conservation and Protection, Environment Canada. pp. 343–356.
(3) J.R. Clayton, Jr., S-F-Tsang, V. Frank, P. Marsden, and J. Harrington. Chemical Oil Spill Dispersants: Evaluation of Three Labora-tory Procedures for Estimating Performance. Final report prepared by Science Applica-tions International Corporation for U.S. En-vironmental Protection Agency, 1992.
(4) J.R. Clayton, Jr. and J.R. Payne. Chem-ical Oil Spill Dispersants: Update State-of-the- Art on Mechanisms of Actions and Factors In-fluencing Performance With Emphasis on Lab-oratory Studies. Final report prepared by Science Applications International Corpora-tion for U.S. Environmental Protection Agency, 1992.
(5) D.P. Middaugh, M.J. Hemmer, and L. Goodman. Methods for Spawning, Cultureing and Conducting Toxicity-tests with Early Life Stages of Four Antherinid Fishes: the Inland Silverside, Menidia beryllina, Atlantic Silverside, M. menidia, Tidewater Silverside, M. penisulae, and California Grunion, Lesthes tenuis. Office of Research and Development, U.S. Environmental Protection Agency, Washington, DC. EPA 600/8–87/004, 1987.
(6) U.S. EPA. Methods for Measuring the Acute Toxicity of Effluents and Receiving Wa-ters to Freshwater and Marine Organisms. Fourth edition. U.S. Environmental Protec-
tion Agency, Washington, D.C EPA 600/4–90/ 027, 1991.
(7) G.S. Douglas, et al. ‘‘The Use of Hydro-carbon Analyses for Environmental Assess-ment and Remediation.’’ In: P.T. Kostecki and E.J. Calabrese (eds.), Contaminated Soils, Diesel Fuel Contamination. Lewis Publishers, Ann Arbor, MI, 1992.
(8) Draft International Standard ISO/DIS 8708 ‘‘Crude Petroleum Oil—Determination of Distillation Characteristics Using 15 Theo-retical Plates Columns.’’ International Orga-nization for Standardization.
(9) Standard Methods for the Examination of Water and Wastewater, 17th Edition, Amer-ican Public Health Association, 1989.
(10) U.S. EPA. Test Method for Evaluating Solid Waste: SW–846. Third edition. U.S. Envi-ronmental Protection Agency, Office of Solid Waste and Emergency Response, Wash-ington, D.C, 1986.
(11) M.C. Kennicutt II. ‘‘The Effect of Bio-remediation on Crude Oil Bulk and Molec-ular Composition.’’ In: Oil Chemical Pollution, 4:89–112, 1988.
(12) G.W. Snedecor and W.G. Cochran. Sta-tistical Methods, 7th edition, The Iowa State University Press, Ames, Iowa, 1980.
(13) D.C. Montgomery. Design and Analysis of Experiments. Third edition. John Wiley & Sons, New York, NY, 1991.
[59 FR 47458, Sept.15, 1994]
APPENDIX D TO PART 300—APPROPRIATE ACTIONS AND METHODS OF REM-EDYING RELEASES
(a) This appendix D to part 300 describes types of remedial actions generally appro-priate for specific situations commonly found at remedial sites and lists methods for remedying releases that may be considered by the lead agency to accomplish a par-ticular response action. This list shall not be considered inclusive of all possible methods of remedying releases and does not limit the lead agency from selecting any other actions deemed necessary in response to any situa-tion.
(b) In response to contaminated soil, sedi-ment, or waste, the following types of re-sponse actions shall generally be considered: removal, treatment, or containment of the soil, sediment, or waste to reduce or elimi-nate the potential for hazardous substances or pollutants or contaminants to contami-nate other media (ground water, surface water, or air) and to reduce or eliminate the potential for such substances to be inhaled, absorbed, or ingested.
(1) Techniques for removing contaminated soil, sediment, or waste include the fol-lowing:
(i) Excavation. (ii) Hydraulic dredging. (iii) Mechanical dredging.
VerDate Mar<15>2010 09:25 Jul 28, 2010 Jkt 220169 PO 00000 Frm 00257 Fmt 8010 Sfmt 8002 Y:\SGML\220169.XXX 220169WR
eier
-Avi
les
on D
SK
GB
LS3C
1PR
OD
with
CF
R