Psychosocial competencies and risky behaviours in Perú - Marta Favara & Alan Sánchez|
49
Psychosocial competencies and risky behaviours in Peru Marta Favara Alan Sanchez September 8, 2016 FavaraSanchez Risky behaviours September 8, 2016 1 / 33
-
Upload
ninos-del-milenio-grade -
Category
Presentations & Public Speaking
-
view
74 -
download
0
Transcript of Psychosocial competencies and risky behaviours in Perú - Marta Favara & Alan Sánchez|
Psychosocial competencies and risky behavioursin Peru
Marta Favara Alan Sanchez
September 8, 2016
FavaraSanchez Risky behaviours September 8, 2016 1 / 33

Introduction
Content
1 Introduction
2 Data
3 Empirical strategy
4 Results
5 Conclusions
FavaraSanchez Risky behaviours September 8, 2016 2 / 33
Introduction
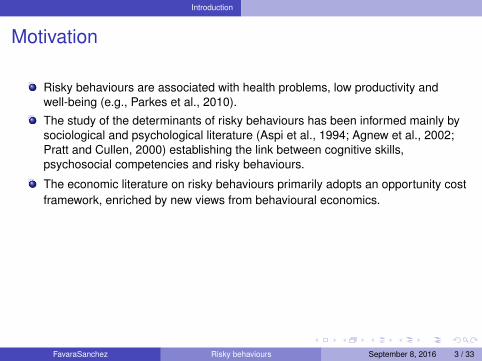
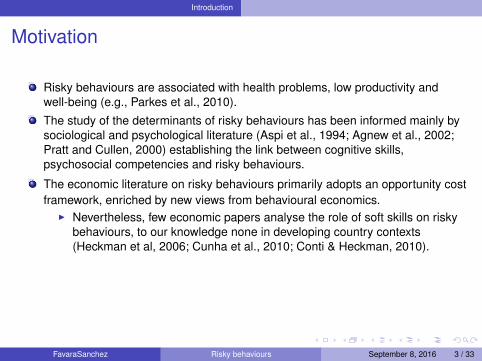
Motivation
Risky behaviours are associated with health problems, low productivity andwell-being (e.g., Parkes et al., 2010).
The study of the determinants of risky behaviours has been informed mainly bysociological and psychological literature (Aspi et al., 1994; Agnew et al., 2002;Pratt and Cullen, 2000) establishing the link between cognitive skills,psychosocial competencies and risky behaviours.
The economic literature on risky behaviours primarily adopts an opportunity costframework, enriched by new views from behavioural economics.
I Nevertheless, few economic papers analyse the role of soft skills on riskybehaviours, to our knowledge none in developing country contexts(Heckman et al, 2006; Cunha et al., 2010; Conti & Heckman, 2010).
I Our aim to fill this gap using YL data.I Can go further than previous YL studies by using latest round of data
(Cueto et al., 2011; Crookston et al., 2014; Lavado et al., 2015).
FavaraSanchez Risky behaviours September 8, 2016 3 / 33
Introduction
Motivation
Risky behaviours are associated with health problems, low productivity andwell-being (e.g., Parkes et al., 2010).
The study of the determinants of risky behaviours has been informed mainly bysociological and psychological literature (Aspi et al., 1994; Agnew et al., 2002;Pratt and Cullen, 2000) establishing the link between cognitive skills,psychosocial competencies and risky behaviours.
The economic literature on risky behaviours primarily adopts an opportunity costframework, enriched by new views from behavioural economics.
I Nevertheless, few economic papers analyse the role of soft skills on riskybehaviours, to our knowledge none in developing country contexts(Heckman et al, 2006; Cunha et al., 2010; Conti & Heckman, 2010).
I Our aim to fill this gap using YL data.I Can go further than previous YL studies by using latest round of data
(Cueto et al., 2011; Crookston et al., 2014; Lavado et al., 2015).
FavaraSanchez Risky behaviours September 8, 2016 3 / 33

Introduction
Motivation
Risky behaviours are associated with health problems, low productivity andwell-being (e.g., Parkes et al., 2010).
The study of the determinants of risky behaviours has been informed mainly bysociological and psychological literature (Aspi et al., 1994; Agnew et al., 2002;Pratt and Cullen, 2000) establishing the link between cognitive skills,psychosocial competencies and risky behaviours.
The economic literature on risky behaviours primarily adopts an opportunity costframework, enriched by new views from behavioural economics.
I Nevertheless, few economic papers analyse the role of soft skills on riskybehaviours, to our knowledge none in developing country contexts(Heckman et al, 2006; Cunha et al., 2010; Conti & Heckman, 2010).
I Our aim to fill this gap using YL data.
I Can go further than previous YL studies by using latest round of data(Cueto et al., 2011; Crookston et al., 2014; Lavado et al., 2015).
FavaraSanchez Risky behaviours September 8, 2016 3 / 33

Introduction
Motivation
Risky behaviours are associated with health problems, low productivity andwell-being (e.g., Parkes et al., 2010).
The study of the determinants of risky behaviours has been informed mainly bysociological and psychological literature (Aspi et al., 1994; Agnew et al., 2002;Pratt and Cullen, 2000) establishing the link between cognitive skills,psychosocial competencies and risky behaviours.
The economic literature on risky behaviours primarily adopts an opportunity costframework, enriched by new views from behavioural economics.
I Nevertheless, few economic papers analyse the role of soft skills on riskybehaviours, to our knowledge none in developing country contexts(Heckman et al, 2006; Cunha et al., 2010; Conti & Heckman, 2010).
I Our aim to fill this gap using YL data.I Can go further than previous YL studies by using latest round of data
(Cueto et al., 2011; Crookston et al., 2014; Lavado et al., 2015).
FavaraSanchez Risky behaviours September 8, 2016 3 / 33
Introduction
Research objectives
1 To document the prevalence of risky behaviours in the context of Peru, and theheterogeneity of these outcomes by gender and area of location.
2 To test the hypothesis that dimensions related to the concepts of self-esteem,self-efficacy, and aspirations have an impact on the occurrence of riskybehaviours during adolescence.
3 To test the robustness of this association by applying statistical methods thatallow to control for unobservable cofounders.
FavaraSanchez Risky behaviours September 8, 2016 4 / 33

Data
Content
1 Introduction
2 Data
3 Empirical strategy
4 Results
5 Conclusions
FavaraSanchez Risky behaviours September 8, 2016 5 / 33
Data
The Young Lives Study
Data from the Young Lives Study in Peru
Original sampling: 20 districts randomly selected from the universe, excludingthe wealthiest 5%.
Focus on a sample of approximately 700 children born in 1994/95 (older cohort).
Four waves of data collection: 2002 (age 7), 2006 (age 12), 2009 (age 15) and2013 (age 19).
The attrition rate across all four rounds for this cohort is 10.3 percent.
FavaraSanchez Risky behaviours September 8, 2016 6 / 33

Data
YL Self-Administered Questionnaire
The information on risky behaviours comes from a Self-Administered Questionnaireapplied in Rounds 3 (age 15) and 4 (age 19). The protocol is as follows:
The interviewer explains the content of the SAQ to the child.
The child is told she is free to choose to complete the SAQ, and she is free toleave questions blank.
The interviewer mentions all answers will remain confidential and, oncecompleted, the SAQ will be put in a sealed envelope containing not her name buta code.
The child is asked whether she wants to complete the questionnaire.
If she agrees, she is left alone for 15 minutes.
Finally, the child is asked to put the SAQ in a closed envelope.
FavaraSanchez Risky behaviours September 8, 2016 7 / 33

Data
YL Self-Administered Questionnaire
In Round 4, only 3.8% of the sample refused to complete the SAQ.
From those that agreed to answer, 1.6% left all questions blank.
Among those that decided to go on, the proportion of missing answers rangesfrom 0.5% (drinking, smoking) to 5.8% (for consumption of illegal drugs).
FavaraSanchez Risky behaviours September 8, 2016 8 / 33

Data
Table : Definitions of the variables
Variables Description
Risky Behaviours
(a) Smoking Smoke at least once a month.(b) Drinking Has been drunk at least once in his/her life.(c) Drinking & Violence Engaged in risky behaviours while drinking.(d) Drugs Consumption Ever consumed illegal drugs.
(e) Unprotected Sex Did not use condoms in the last sexual relationship.
(f) Carrying a Weapon Carried a weapon in the last 30 days.(g) Criminal Behaviour Sum of the following behaviors:
Carried a weapon in the last 30 daysEver been arrested by the police for an illegal offenseEver been a member of a gangEver sentenced to spend time in a corrections institution
(h) No. of Risky Behaviours Sum of (a) + (b) + (d) + (e) + (f)
FavaraSanchez Risky behaviours September 8, 2016 9 / 33

Risky Behaviours at age 15 and 19
Age 15 Age 19
Smoking 0.06 0.19Drinking 0.08 0.34Drinking & Violence 0.12 0.40Drugs Consumption 0.02 0.13Unprotected Sex 0.06 0.27Carrying a Weapon 0.07 0.05
No. of Risky Behaviours: 0 0.78 0.45No. of Risky Behaviours: 1 0.16 0.27No. of Risky Behaviours: 2 0.03 0.16No. of Risky Behaviours: 3 or more 0.02 0.12
Observations 524 471

Data
Psychosocial competencies and aspirations
Self-esteem scale: it is related to a person overall evaluation of his/her ownworth.
Self-efficacy scale: it measures the child’s freedom of choice and his/her agency(or power) to influence his/her own life.
Both scales are measured through a set of Likert-scale items that are part of theYL core questionnaire. In each case, a score is calculated for each individual asthe average of all non-missing, normalized, items.
Educational aspirations: Obtained from the following question: imagine you hadno constraints and could study for as long as you liked, or go back to school ifyou have already left. What level of formal education would you like to complete.
FavaraSanchez Risky behaviours September 8, 2016 11 / 33

Empirical strategy
Content
1 Introduction
2 Data
3 Empirical strategy
4 Results
5 Conclusions
FavaraSanchez Risky behaviours September 8, 2016 12 / 33
Empirical strategy
Linear probability model
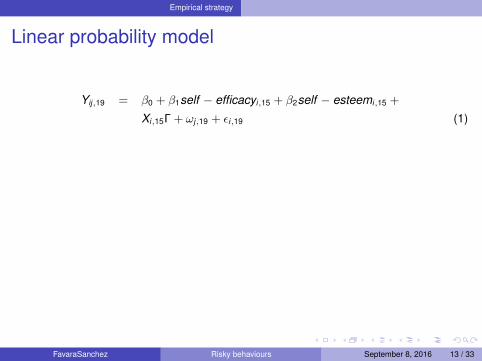
Yij,19 = β0 + β1self − efficacyi,15 + β2self − esteemi,15 +
Xi,15Γ + ωj,19 + εi,19 (1)
where Xi,15 includes:
Indicators of household socio-economic status (wealth index, parentaleducation).
Information about family structure (broken home, number of siblings).
Information about individual school achievement (test scores and schoolenrolment).
Area of location and migration.
ωj,19 is a set of community dummies to control for unobservable characteristicscommon at community level. Finally, the error term is composed of εi,19 and αi .
This structure is helpful, but still prone to bias.
FavaraSanchez Risky behaviours September 8, 2016 13 / 33

Empirical strategy
Linear probability model
Yij,19 = β0 + β1self − efficacyi,15 + β2self − esteemi,15 +
Xi,15Γ + ωj,19 + εi,19 (1)
where Xi,15 includes:
Indicators of household socio-economic status (wealth index, parentaleducation).
Information about family structure (broken home, number of siblings).
Information about individual school achievement (test scores and schoolenrolment).
Area of location and migration.
ωj,19 is a set of community dummies to control for unobservable characteristicscommon at community level. Finally, the error term is composed of εi,19 and αi .
This structure is helpful, but still prone to bias.
FavaraSanchez Risky behaviours September 8, 2016 13 / 33
Empirical strategy
Linear probability model with child fixed effects
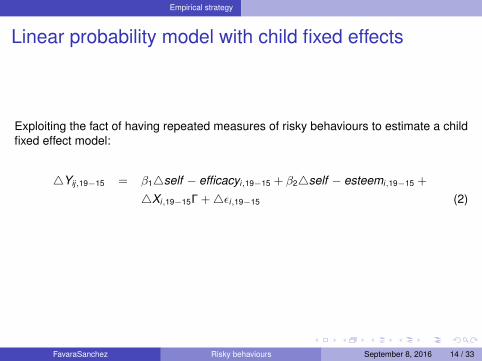
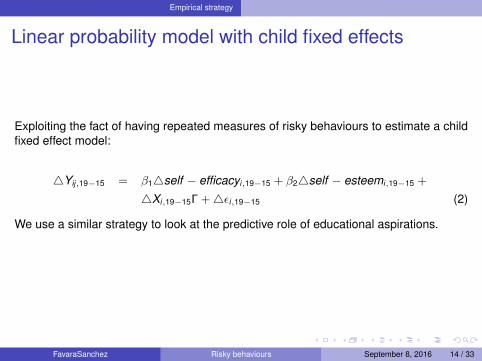
Exploiting the fact of having repeated measures of risky behaviours to estimate a childfixed effect model:
4Yij,19−15 = β14self − efficacyi,19−15 + β24self − esteemi,19−15 +
4Xi,19−15Γ +4εi,19−15 (2)
We use a similar strategy to look at the predictive role of educational aspirations.
FavaraSanchez Risky behaviours September 8, 2016 14 / 33
Empirical strategy
Linear probability model with child fixed effects
Exploiting the fact of having repeated measures of risky behaviours to estimate a childfixed effect model:
4Yij,19−15 = β14self − efficacyi,19−15 + β24self − esteemi,19−15 +
4Xi,19−15Γ +4εi,19−15 (2)
We use a similar strategy to look at the predictive role of educational aspirations.
FavaraSanchez Risky behaviours September 8, 2016 14 / 33

Results
Content
1 Introduction
2 Data
3 Empirical strategy
4 Results
5 Conclusions
FavaraSanchez Risky behaviours September 8, 2016 15 / 33

Risky Behaviours by gender and rural/urban at age 19
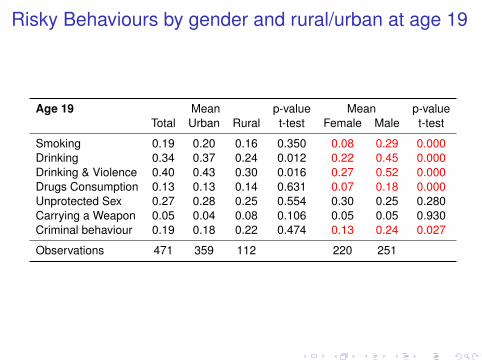
Age 19 Mean p-value Mean p-valueTotal Urban Rural t-test Female Male t-test
Smoking 0.19 0.20 0.16 0.350 0.08 0.29 0.000Drinking 0.34 0.37 0.24 0.012 0.22 0.45 0.000Drinking & Violence 0.40 0.43 0.30 0.016 0.27 0.52 0.000Drugs Consumption 0.13 0.13 0.14 0.631 0.07 0.18 0.000Unprotected Sex 0.27 0.28 0.25 0.554 0.30 0.25 0.280Carrying a Weapon 0.05 0.04 0.08 0.106 0.05 0.05 0.930Criminal behaviour 0.19 0.18 0.22 0.474 0.13 0.24 0.027
Observations 471 359 112 220 251
Risky Behaviours by gender and rural/urban at age 19
Age 19 Mean p-value Mean p-valueTotal Urban Rural t-test Female Male t-test
Smoking 0.19 0.20 0.16 0.350 0.08 0.29 0.000Drinking 0.34 0.37 0.24 0.012 0.22 0.45 0.000Drinking & Violence 0.40 0.43 0.30 0.016 0.27 0.52 0.000Drugs Consumption 0.13 0.13 0.14 0.631 0.07 0.18 0.000Unprotected Sex 0.27 0.28 0.25 0.554 0.30 0.25 0.280Carrying a Weapon 0.05 0.04 0.08 0.106 0.05 0.05 0.930Criminal behaviour 0.19 0.18 0.22 0.474 0.13 0.24 0.027
Observations 471 359 112 220 251
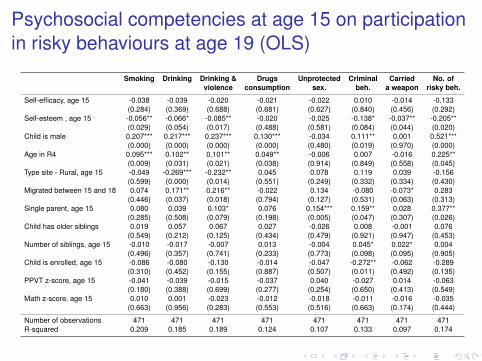
Psychosocial competencies at age 15 on participationin risky behaviours at age 19 (OLS)
Smoking Drinking Drinking & Drugs Unprotected Criminal Carried No. ofviolence consumption sex. beh. a weapon risky beh.
Self-efficacy, age 15 -0.038 -0.039 -0.020 -0.021 -0.022 0.010 -0.014 -0.133(0.284) (0.369) (0.688) (0.681) (0.627) (0.840) (0.456) (0.292)
Self-esteem , age 15 -0.056** -0.066* -0.085** -0.020 -0.025 -0.138* -0.037** -0.205**(0.029) (0.054) (0.017) (0.488) (0.581) (0.084) (0.044) (0.020)
Child is male 0.207*** 0.217*** 0.237*** 0.130*** -0.034 0.111** 0.001 0.521***(0.000) (0.000) (0.000) (0.000) (0.480) (0.019) (0.970) (0.000)
Age in R4 0.095*** 0.102** 0.101** 0.049** -0.006 0.007 -0.016 0.225**(0.009) (0.031) (0.021) (0.038) (0.914) (0.849) (0.558) (0.045)
Type site - Rural, age 15 -0.049 -0.269*** -0.232** 0.045 0.078 0.119 0.039 -0.156(0.599) (0.000) (0.014) (0.551) (0.249) (0.332) (0.334) (0.430)
Migrated between 15 and 18 0.074 0.171** 0.216** -0.022 0.134 -0.080 -0.073* 0.283(0.446) (0.037) (0.018) (0.794) (0.127) (0.531) (0.063) (0.313)
Single parent, age 15 0.080 0.039 0.103* 0.076 0.154*** 0.159** 0.028 0.377**(0.285) (0.508) (0.079) (0.198) (0.005) (0.047) (0.307) (0.026)
Child has older siblings 0.019 0.057 0.067 0.027 -0.026 0.008 -0.001 0.076(0.549) (0.212) (0.125) (0.434) (0.479) (0.921) (0.947) (0.453)
Number of siblings, age 15 -0.010 -0.017 -0.007 0.013 -0.004 0.045* 0.022* 0.004(0.496) (0.357) (0.741) (0.233) (0.773) (0.098) (0.095) (0.905)
Child is enrolled, age 15 -0.086 -0.080 -0.130 -0.014 -0.047 -0.272** -0.062 -0.289(0.310) (0.452) (0.155) (0.887) (0.507) (0.011) (0.492) (0.135)
PPVT z-score, age 15 -0.041 -0.039 -0.015 -0.037 0.040 -0.027 0.014 -0.063(0.180) (0.388) (0.699) (0.277) (0.254) (0.650) (0.413) (0.549)
Math z-score, age 15 0.010 0.001 -0.023 -0.012 -0.018 -0.011 -0.016 -0.035(0.663) (0.956) (0.283) (0.553) (0.516) (0.663) (0.174) (0.444)
Number of observations 471 471 471 471 471 471 471 471R-squared 0.209 0.185 0.189 0.124 0.107 0.133 0.097 0.174
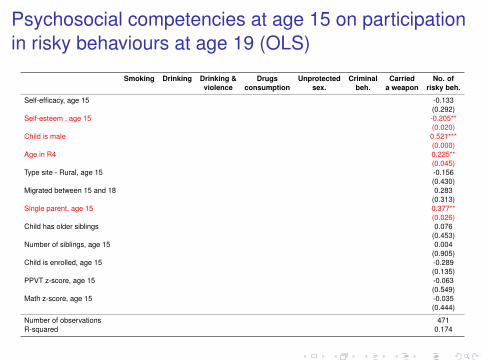
Psychosocial competencies at age 15 on participationin risky behaviours at age 19 (OLS)
Smoking Drinking Drinking & Drugs Unprotected Criminal Carried No. ofviolence consumption sex. beh. a weapon risky beh.
Self-efficacy, age 15 -0.133(0.292)
Self-esteem , age 15 -0.205**(0.020)
Child is male 0.521***(0.000)
Age in R4 0.225**(0.045)
Type site - Rural, age 15 -0.156(0.430)
Migrated between 15 and 18 0.283(0.313)
Single parent, age 15 0.377**(0.026)
Child has older siblings 0.076(0.453)
Number of siblings, age 15 0.004(0.905)
Child is enrolled, age 15 -0.289(0.135)
PPVT z-score, age 15 -0.063(0.549)
Math z-score, age 15 -0.035(0.444)
Number of observations 471R-squared 0.174

Psychosocial competencies at age 15 on participationin risky behaviours at age 19 (OLS)
Smoking Drinking Drinking & Drugs Unprotected Criminal Carried No. ofviolence consumption sex. beh. a weapon risky beh.
Self-efficacy, age 15 -0.038 -0.039 -0.020 -0.021 -0.022 0.010 -0.014 -0.133(0.284) (0.369) (0.688) (0.681) (0.627) (0.840) (0.456) (0.292)
Self-esteem , age 15 -0.056** -0.066* -0.085** -0.020 -0.025 -0.138* -0.037** -0.205**(0.029) (0.054) (0.017) (0.488) (0.581) (0.084) (0.044) (0.020)
Child is male
Age in R4
Type site - Rural, age 15
Migrated between 15 and 18
Single parent, age 15
Child has older siblings
Number of siblings, age 15
Child is enrolled, age 15
PPVT z-score, age 15
Math z-score, age 15
Number of observationsR-squared
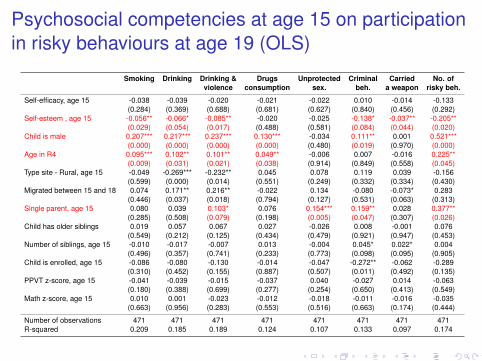
Psychosocial competencies at age 15 on participationin risky behaviours at age 19 (OLS)
Smoking Drinking Drinking & Drugs Unprotected Criminal Carried No. ofviolence consumption sex. beh. a weapon risky beh.
Self-efficacy, age 15 -0.038 -0.039 -0.020 -0.021 -0.022 0.010 -0.014 -0.133(0.284) (0.369) (0.688) (0.681) (0.627) (0.840) (0.456) (0.292)
Self-esteem , age 15 -0.056** -0.066* -0.085** -0.020 -0.025 -0.138* -0.037** -0.205**(0.029) (0.054) (0.017) (0.488) (0.581) (0.084) (0.044) (0.020)
Child is male 0.207*** 0.217*** 0.237*** 0.130*** -0.034 0.111** 0.001 0.521***(0.000) (0.000) (0.000) (0.000) (0.480) (0.019) (0.970) (0.000)
Age in R4 0.095*** 0.102** 0.101** 0.049** -0.006 0.007 -0.016 0.225**(0.009) (0.031) (0.021) (0.038) (0.914) (0.849) (0.558) (0.045)
Type site - Rural, age 15 -0.049 -0.269*** -0.232** 0.045 0.078 0.119 0.039 -0.156(0.599) (0.000) (0.014) (0.551) (0.249) (0.332) (0.334) (0.430)
Migrated between 15 and 18 0.074 0.171** 0.216** -0.022 0.134 -0.080 -0.073* 0.283(0.446) (0.037) (0.018) (0.794) (0.127) (0.531) (0.063) (0.313)
Single parent, age 15 0.080 0.039 0.103* 0.076 0.154*** 0.159** 0.028 0.377**(0.285) (0.508) (0.079) (0.198) (0.005) (0.047) (0.307) (0.026)
Child has older siblings 0.019 0.057 0.067 0.027 -0.026 0.008 -0.001 0.076(0.549) (0.212) (0.125) (0.434) (0.479) (0.921) (0.947) (0.453)
Number of siblings, age 15 -0.010 -0.017 -0.007 0.013 -0.004 0.045* 0.022* 0.004(0.496) (0.357) (0.741) (0.233) (0.773) (0.098) (0.095) (0.905)
Child is enrolled, age 15 -0.086 -0.080 -0.130 -0.014 -0.047 -0.272** -0.062 -0.289(0.310) (0.452) (0.155) (0.887) (0.507) (0.011) (0.492) (0.135)
PPVT z-score, age 15 -0.041 -0.039 -0.015 -0.037 0.040 -0.027 0.014 -0.063(0.180) (0.388) (0.699) (0.277) (0.254) (0.650) (0.413) (0.549)
Math z-score, age 15 0.010 0.001 -0.023 -0.012 -0.018 -0.011 -0.016 -0.035(0.663) (0.956) (0.283) (0.553) (0.516) (0.663) (0.174) (0.444)
Number of observations 471 471 471 471 471 471 471 471R-squared 0.209 0.185 0.189 0.124 0.107 0.133 0.097 0.174

Psychosocial competencies at age 15 on participationin risky behaviours at age 19 (fixed effects)
Smoking Drinking Drinking & Drugs Unprotected Carried No. ofviolence consumption sex. a weapon risky beh.
Self-efficacy -0.030 0.027 0.042 0.015 -0.026 -0.053** -0.068(0.422) (0.480) (0.263) (0.606) (0.467) (0.045) (0.456)
Self-esteem -0.048* -0.096*** -0.090** -0.010 0.009 -0.030 -0.174**(0.074) (0.003) (0.012) (0.696) (0.793) (0.204) (0.024)
Type site - Rural -0.259*** -0.581*** -0.718*** -0.246*** -0.338*** 0.034 -1.391***(0.002) (0.000) (0.000) (0.000) (0.001) (0.578) (0.000)
Migrated between rounds 0.150** 0.276*** 0.359*** 0.096* 0.131 -0.038 0.616***(0.022) (0.000) (0.000) (0.059) (0.107) (0.503) (0.001)
Wealth tercile : middle -0.047 0.050 0.012 -0.023 0.048 0.018 0.046(0.410) (0.410) (0.853) (0.465) (0.450) (0.659) (0.735)
Wealth tercile: top -0.132* 0.085 0.012 -0.087** 0.022 -0.007 -0.120(0.057) (0.280) (0.887) (0.044) (0.791) (0.888) (0.488)
Single parent 0.079 0.139 0.193** 0.044 0.133* 0.029 0.424**(0.264) (0.111) (0.025) (0.277) (0.092) (0.261) (0.018)
Number of siblings -0.011 -0.011 -0.009 0.002 -0.043* 0.000 -0.063(0.547) (0.610) (0.708) (0.910) (0.064) (0.972) (0.250)
Child is enrolled -0.095 -0.210** -0.160 -0.148* -0.256** 0.110 -0.598***(0.222) (0.046) (0.157) (0.086) (0.013) (0.231) (0.006)
PPVT z-score -0.029 -0.087*** -0.049 -0.049*** 0.000 0.000 -0.166**(0.247) (0.007) (0.179) (0.009) (0.999) (0.983) (0.015)
Math z-score -0.028 -0.068** -0.071** 0.018 -0.028 -0.020 -0.127*(0.276) (0.015) (0.016) (0.376) (0.342) (0.269) (0.071)
Number of observations 872 872 872 872 872 872 872R-squared 0.064 0.139 0.156 0.074 0.097 0.033 0.168

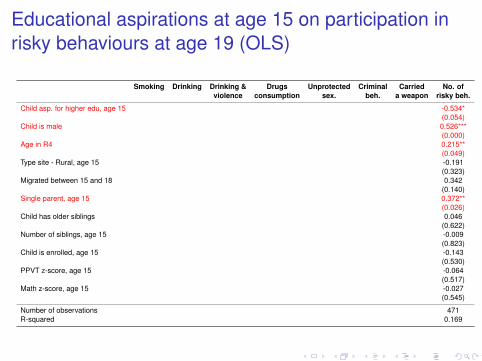
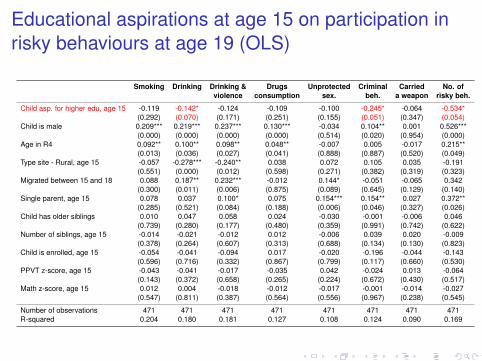
Educational aspirations at age 15 on participation inrisky behaviours at age 19 (OLS)
Smoking Drinking Drinking & Drugs Unprotected Criminal Carried No. ofviolence consumption sex. beh. a weapon risky beh.
Child asp. for higher edu, age 15 -0.119 -0.142* -0.124 -0.109 -0.100 -0.245* -0.064 -0.534*(0.292) (0.070) (0.171) (0.251) (0.155) (0.051) (0.347) (0.054)
Child is male 0.209*** 0.219*** 0.237*** 0.130*** -0.034 0.104** 0.001 0.526***(0.000) (0.000) (0.000) (0.000) (0.514) (0.020) (0.954) (0.000)
Age in R4 0.092** 0.100** 0.098** 0.048** -0.007 0.005 -0.017 0.215**(0.013) (0.036) (0.027) (0.041) (0.888) (0.887) (0.520) (0.049)
Type site - Rural, age 15 -0.057 -0.278*** -0.240** 0.038 0.072 0.105 0.035 -0.191(0.551) (0.000) (0.012) (0.598) (0.271) (0.382) (0.319) (0.323)
Migrated between 15 and 18 0.088 0.187** 0.232*** -0.012 0.144* -0.051 -0.065 0.342(0.300) (0.011) (0.006) (0.875) (0.089) (0.645) (0.129) (0.140)
Single parent, age 15 0.078 0.037 0.100* 0.075 0.154*** 0.154** 0.027 0.372**(0.285) (0.521) (0.084) (0.188) (0.006) (0.046) (0.327) (0.026)
Child has older siblings 0.010 0.047 0.058 0.024 -0.030 -0.001 -0.006 0.046(0.739) (0.280) (0.177) (0.480) (0.359) (0.991) (0.742) (0.622)
Number of siblings, age 15 -0.014 -0.021 -0.012 0.012 -0.006 0.039 0.020 -0.009(0.378) (0.264) (0.607) (0.313) (0.688) (0.134) (0.130) (0.823)
Child is enrolled, age 15 -0.054 -0.041 -0.094 0.017 -0.020 -0.196 -0.044 -0.143(0.596) (0.716) (0.332) (0.867) (0.799) (0.117) (0.660) (0.530)
PPVT z-score, age 15 -0.043 -0.041 -0.017 -0.035 0.042 -0.024 0.013 -0.064(0.143) (0.372) (0.658) (0.265) (0.224) (0.672) (0.430) (0.517)
Math z-score, age 15 0.012 0.004 -0.018 -0.012 -0.017 -0.001 -0.014 -0.027(0.547) (0.811) (0.387) (0.564) (0.556) (0.967) (0.238) (0.545)
Number of observations 471 471 471 471 471 471 471 471R-squared 0.204 0.180 0.181 0.127 0.108 0.124 0.090 0.169
Educational aspirations at age 15 on participation inrisky behaviours at age 19 (OLS)
Smoking Drinking Drinking & Drugs Unprotected Criminal Carried No. ofviolence consumption sex. beh. a weapon risky beh.
Child asp. for higher edu, age 15 -0.534*(0.054)
Child is male 0.526***(0.000)
Age in R4 0.215**(0.049)
Type site - Rural, age 15 -0.191(0.323)
Migrated between 15 and 18 0.342(0.140)
Single parent, age 15 0.372**(0.026)
Child has older siblings 0.046(0.622)
Number of siblings, age 15 -0.009(0.823)
Child is enrolled, age 15 -0.143(0.530)
PPVT z-score, age 15 -0.064(0.517)
Math z-score, age 15 -0.027(0.545)
Number of observations 471R-squared 0.169

Educational aspirations at age 15 on participation inrisky behaviours at age 19 (OLS)
Smoking Drinking Drinking & Drugs Unprotected Criminal Carried No. ofviolence consumption sex. beh. a weapon risky beh.
Child asp. for higher edu, age 15 -0.119 -0.142* -0.124 -0.109 -0.100 -0.245* -0.064 -0.534*(0.292) (0.070) (0.171) (0.251) (0.155) (0.051) (0.347) (0.054)
Child is male
Age in R4
Type site - Rural, age 15
Migrated between 15 and 18
Single parent, age 15
Child has older siblings
Number of siblings, age 15
Child is enrolled, age 15
PPVT z-score, age 15
Math z-score, age 15
Number of observations 471 471 471 471 471 471 471 471R-squared 0.204 0.180 0.181 0.127 0.108 0.124 0.090 0.169
Educational aspirations at age 15 on participation inrisky behaviours at age 19 (OLS)
Smoking Drinking Drinking & Drugs Unprotected Criminal Carried No. ofviolence consumption sex. beh. a weapon risky beh.
Child asp. for higher edu, age 15 -0.119 -0.142* -0.124 -0.109 -0.100 -0.245* -0.064 -0.534*(0.292) (0.070) (0.171) (0.251) (0.155) (0.051) (0.347) (0.054)
Child is male 0.209*** 0.219*** 0.237*** 0.130*** -0.034 0.104** 0.001 0.526***(0.000) (0.000) (0.000) (0.000) (0.514) (0.020) (0.954) (0.000)
Age in R4 0.092** 0.100** 0.098** 0.048** -0.007 0.005 -0.017 0.215**(0.013) (0.036) (0.027) (0.041) (0.888) (0.887) (0.520) (0.049)
Type site - Rural, age 15 -0.057 -0.278*** -0.240** 0.038 0.072 0.105 0.035 -0.191(0.551) (0.000) (0.012) (0.598) (0.271) (0.382) (0.319) (0.323)
Migrated between 15 and 18 0.088 0.187** 0.232*** -0.012 0.144* -0.051 -0.065 0.342(0.300) (0.011) (0.006) (0.875) (0.089) (0.645) (0.129) (0.140)
Single parent, age 15 0.078 0.037 0.100* 0.075 0.154*** 0.154** 0.027 0.372**(0.285) (0.521) (0.084) (0.188) (0.006) (0.046) (0.327) (0.026)
Child has older siblings 0.010 0.047 0.058 0.024 -0.030 -0.001 -0.006 0.046(0.739) (0.280) (0.177) (0.480) (0.359) (0.991) (0.742) (0.622)
Number of siblings, age 15 -0.014 -0.021 -0.012 0.012 -0.006 0.039 0.020 -0.009(0.378) (0.264) (0.607) (0.313) (0.688) (0.134) (0.130) (0.823)
Child is enrolled, age 15 -0.054 -0.041 -0.094 0.017 -0.020 -0.196 -0.044 -0.143(0.596) (0.716) (0.332) (0.867) (0.799) (0.117) (0.660) (0.530)
PPVT z-score, age 15 -0.043 -0.041 -0.017 -0.035 0.042 -0.024 0.013 -0.064(0.143) (0.372) (0.658) (0.265) (0.224) (0.672) (0.430) (0.517)
Math z-score, age 15 0.012 0.004 -0.018 -0.012 -0.017 -0.001 -0.014 -0.027(0.547) (0.811) (0.387) (0.564) (0.556) (0.967) (0.238) (0.545)
Number of observations 471 471 471 471 471 471 471 471R-squared 0.204 0.180 0.181 0.127 0.108 0.124 0.090 0.169
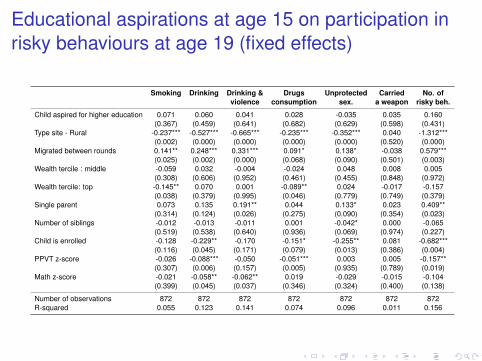
Educational aspirations at age 15 on participation inrisky behaviours at age 19 (fixed effects)
Smoking Drinking Drinking & Drugs Unprotected Carried No. ofviolence consumption sex. a weapon risky beh.
Child aspired for higher education 0.071 0.060 0.041 0.028 -0.035 0.035 0.160(0.367) (0.459) (0.641) (0.682) (0.629) (0.598) (0.431)
Type site - Rural -0.237*** -0.527*** -0.665*** -0.235*** -0.352*** 0.040 -1.312***(0.002) (0.000) (0.000) (0.000) (0.000) (0.520) (0.000)
Migrated between rounds 0.141** 0.248*** 0.331*** 0.091* 0.138* -0.038 0.579***(0.025) (0.002) (0.000) (0.068) (0.090) (0.501) (0.003)
Wealth tercile : middle -0.059 0.032 -0.004 -0.024 0.048 0.008 0.005(0.308) (0.606) (0.952) (0.461) (0.455) (0.848) (0.972)
Wealth tercile: top -0.145** 0.070 0.001 -0.089** 0.024 -0.017 -0.157(0.038) (0.379) (0.995) (0.046) (0.779) (0.749) (0.379)
Single parent 0.073 0.135 0.191** 0.044 0.133* 0.023 0.409**(0.314) (0.124) (0.026) (0.275) (0.090) (0.354) (0.023)
Number of siblings -0.012 -0.013 -0.011 0.001 -0.042* 0.000 -0.065(0.519) (0.538) (0.640) (0.936) (0.069) (0.974) (0.227)
Child is enrolled -0.128 -0.229** -0.170 -0.151* -0.255** 0.081 -0.682***(0.116) (0.045) (0.171) (0.079) (0.013) (0.386) (0.004)
PPVT z-score -0.026 -0.088*** -0.050 -0.051*** 0.003 0.005 -0.157**(0.307) (0.006) (0.157) (0.005) (0.935) (0.789) (0.019)
Math z-score -0.021 -0.058** -0.062** 0.019 -0.029 -0.015 -0.104(0.399) (0.045) (0.037) (0.346) (0.324) (0.400) (0.138)
Number of observations 872 872 872 872 872 872 872R-squared 0.055 0.123 0.141 0.074 0.096 0.011 0.156

Results
Other results
1 Girls aspiring to higher education are less likely to have unprotected sex.
FavaraSanchez Risky behaviours September 8, 2016 29 / 33

Conclusions
Content
1 Introduction
2 Data
3 Empirical strategy
4 Results
5 Conclusions
FavaraSanchez Risky behaviours September 8, 2016 30 / 33
Conclusions
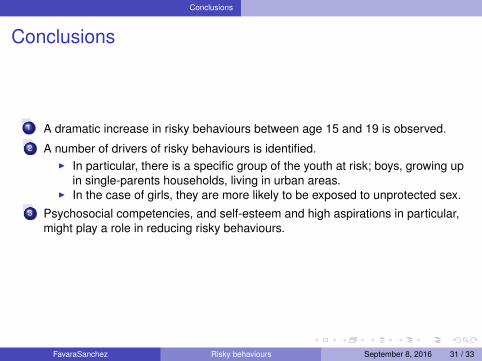
Conclusions
1 A dramatic increase in risky behaviours between age 15 and 19 is observed.2 A number of drivers of risky behaviours is identified.
I In particular, there is a specific group of the youth at risk; boys, growing upin single-parents households, living in urban areas.
I In the case of girls, they are more likely to be exposed to unprotected sex.3 Psychosocial competencies, and self-esteem and high aspirations in particular,
might play a role in reducing risky behaviours.
FavaraSanchez Risky behaviours September 8, 2016 31 / 33

Conclusions
Policy implications
1 It is worth to explore whether interventions designed to take place atsecondary-level schools can reduce the engagement of adolescents in riskybehaviours.
2 In terms of comprehensive interventions, the Minister of Education in Peru iscurrently implementing an Extended School Day Program (Jornada EscolarCompleta, JEC). This initiative seeks both to extend the length of the school-dayand to provide better services to students at the secondary level in urban areas(including a full-time psychologist).
3 Theoretically, JEC and similar initiatives can have direct as well as indirecteffects on the prevalence of risky behaviours.
4 Our results suggest improving psychological competencies might be anadditional mechanisms through which the JEC might reduce the prevalence ofrisky behaviours.
FavaraSanchez Risky behaviours September 8, 2016 32 / 33

Conclusions
THANK YOU!
FavaraSanchez Risky behaviours September 8, 2016 33 / 33