Psychometric Evaluation of the Neonatal Pain, Agitation ...
150
Loyola University Chicago Loyola University Chicago Loyola eCommons Loyola eCommons Dissertations Theses and Dissertations 2014 Psychometric Evaluation of the Neonatal Pain, Agitation, and Psychometric Evaluation of the Neonatal Pain, Agitation, and Sedation Scale (n-Pass) Tool in Infants and Children Age One to Sedation Scale (n-Pass) Tool in Infants and Children Age One to Thirty-Six Months in the Post-Anesthesia Care Unit Thirty-Six Months in the Post-Anesthesia Care Unit Patricia A. Hummel Loyola University Chicago Follow this and additional works at: https://ecommons.luc.edu/luc_diss Part of the Nursing Commons Recommended Citation Recommended Citation Hummel, Patricia A., "Psychometric Evaluation of the Neonatal Pain, Agitation, and Sedation Scale (n- Pass) Tool in Infants and Children Age One to Thirty-Six Months in the Post-Anesthesia Care Unit" (2014). Dissertations. 900. https://ecommons.luc.edu/luc_diss/900 This Dissertation is brought to you for free and open access by the Theses and Dissertations at Loyola eCommons. It has been accepted for inclusion in Dissertations by an authorized administrator of Loyola eCommons. For more information, please contact [email protected]. This work is licensed under a Creative Commons Attribution-Noncommercial-No Derivative Works 3.0 License. Copyright © 2014 Patricia A. Hummel
Transcript of Psychometric Evaluation of the Neonatal Pain, Agitation ...

Loyola University Chicago Loyola University Chicago
Loyola eCommons Loyola eCommons
Dissertations Theses and Dissertations
2014
Psychometric Evaluation of the Neonatal Pain, Agitation, and Psychometric Evaluation of the Neonatal Pain, Agitation, and
Sedation Scale (n-Pass) Tool in Infants and Children Age One to Sedation Scale (n-Pass) Tool in Infants and Children Age One to
Thirty-Six Months in the Post-Anesthesia Care Unit Thirty-Six Months in the Post-Anesthesia Care Unit
Patricia A. Hummel Loyola University Chicago
Follow this and additional works at: https://ecommons.luc.edu/luc_diss
Part of the Nursing Commons
Recommended Citation Recommended Citation Hummel, Patricia A., "Psychometric Evaluation of the Neonatal Pain, Agitation, and Sedation Scale (n-Pass) Tool in Infants and Children Age One to Thirty-Six Months in the Post-Anesthesia Care Unit" (2014). Dissertations. 900. https://ecommons.luc.edu/luc_diss/900
This Dissertation is brought to you for free and open access by the Theses and Dissertations at Loyola eCommons. It has been accepted for inclusion in Dissertations by an authorized administrator of Loyola eCommons. For more information, please contact [email protected].
This work is licensed under a Creative Commons Attribution-Noncommercial-No Derivative Works 3.0 License. Copyright © 2014 Patricia A. Hummel

LOYOLA UNIVERSITY CHICAGO
PSYCHOMETRIC EVALUATION OF THE NEONATAL PAIN, AGITATION, AND
SEDATION SCALE (N-PASS) TOOL IN INFANTS AND CHILDREN AGE ONE TO
THIRTY-SIX MONTHS IN THE POST-ANESTHESIA CARE UNIT
A DISSERTATION SUBMITTED TO
THE FACULTY OF THE GRADUATE SCHOOL
IN CANDIDACY FOR THE DEGREE OF
DOCTOR OF PHILOSOPHY
PROGRAM IN NURSING
BY
PATRICIA HUMMEL
CHICAGO, ILLINOIS
MAY 2014

Copyright by Patricia Hummel, 2014
All rights reserved

iii
ACKNOWLEDGEMENTS
Dr. Nancy Hogan, the chair of my dissertation committee, has been a mentor in
every sense of the term. She is truly an experienced and trusted advisor. Her experience
with psychometrics was inspiring, as she provided trusted guidance throughout the
process. Faculty who give of themselves to their students as she has are essential to this
process. I appreciate her patience and humor as she guided me through the research
process.
My other committee members, Dr. Lee Schmidt and Dr. Judith Jennrich, were
also essential in guiding my research, providing valuable insight and direction. I thank
them for their support and encouragement.
My gratitude also extends to the managers of the Post-anesthesia Care Units at
Loyola University Medical Center, J. Keane, RN, and D. Serwa, RN. Their support was
crucial to my research. I am also grateful to the unit nursing staff for their support during
data collection. They made me feel welcome and at home in their units, and their patients
are fortunate to have such capable and professional nurses as caregivers.
I also thank the families who were kind enough to allow me to observe their
children for data collection during the stressful postoperative period. I did not have any
refusals from families, and many were interested enough to engage me in more extended
conversations regarding my research.

To the infants and children who experience pain as a result of their disease or treatment:
May this research add to the body of knowledge necessary to alleviate their suffering.

v
TABLE OF CONTENTS
ACKNOWLEDGEMENTS iii
LIST OF TABLES viii
LIST OF FIGURES x
ABSTRACT xi
CHAPTER ONE: STATEMENT OF THE PROBLEM 1
Introduction 1
Problem Statement 6
Purpose of the Study 6
CHAPTER TWO: LITERATURE REVIEW 8
Conceptualization and Theory 8
Conceptualization of Pain 8
Conceptualization of Sedation 10
The Gate Theory of Pain 12
Behaviorism 12
The Psychological Behaviorism Theory of Pain 13
The Social Communication Model of Pain 13
The Fuller Infant Pain Assessment Model 15
Prescriptive theory of acute pain management in infants and children 15
The Onion Theory of Pain 16
The modified Onion Theory of Pain and Sedation for the nonverbal infant or
child 18
Psychometrics 22
Nonverbal Pain Assessment 25
Biologic Pain and Sedation Markers 28
Developmental Changes in Pain Expression 31
Behavioral Indicators of Pain 32
Physiological Indicators of Pain 36
Infant Nonverbal Pain Assessment Tools 37
Pediatric Nonverbal Pain Assessment Tools 44
Sedation Assessment Tools 45
Tools that Assess Pain and Sedation 47
Analysis of Research 55
Gaps in Knowledge 57
CHAPTER THREE: RESEARCH METHODS 59
Research Design 59
Setting 59
Population 60
Sample 60

vi
Sample Size 61
Ethical Considerations 61
Risks and Benefits 63
Data Collection 63
Measures 64
Data Analysis 64
Descriptive Statistics 64
Reliability 65
Criterion Validity 65
Construct Validity 66
Factor analysis 67
Methods Summary 67
CHAPTER FOUR: RESULTS 69
Sample 69
Descriptive Analysis 70
Reliability Analysis 72
N-PASS Sedation Scale 73
N-PASS Pain/Agitation Scale 73
FLACC Tool 74
Correlational Analysis 74
Correlations between N-PASS Sedation Scale and UMSS 75
Correlations between N-PASS Pain Scale and FLACC 75
Correlations between N-PASS Scale and Heart Rate 76
Analysis of Variance 78
N-PASS Sedation Scale 78
N-PASS Pain Scale 80
Regression Analysis 82
Test of Change in Sedation Predicting Time to Discharge 82
Principal Axis Factoring (PAF) 83
PAF Results Unrotated 85
PAF Results Rotated 91
Summary 100
CHAPTER FIVE: DISCUSSION 102
Reliability 102
Correlations 103
Repeated Measure Analysis of Variance (ANOVA) 104
Regression 105
Principle Axis Factoring (PAF) 106
Limitations 108
Implications for Nursing Practice 108
Implications for Nursing Research 109
Implications for Nursing Theory 110
Implications for Nursing Administration 112
Implications for Nursing Education 114

vii
Future Research 114
Conclusion 115
APPENDIX A: DATA ANALYSIS TOOLS: N-PASS, UMSS, FLACC 116
APPENDIX B: DATA COLLECTION FORMS 119
REFERENCE LIST 122
VITA 136

viii
LIST OF TABLES
Table 1. Continuum of Sedation 11
Table 2. Descriptive Statistics (N-PASS sedation/UMSS) 71
Table 3. Descriptive Statistics (N-PASS pain/FLACC) 72
Table 4. N-PASS Sedation Score/Cronbach’s alpha 73
Table 5. N-PASS Pain Score/Cronbach’s alpha 74
Table 6. FLACC/Cronbach’s alpha 74
Table 7. Correlations of N-PASS Sedation Scale and UMSS 75
Table 8. Correlations of N-PASS Pain Scale and FLACC 76
Table 9. Correlations of Heart Rate and N-PASS Sedation and Pain Scales 77
Table 10. N-PASS Sedation ANOVA Marginal Means, First Ten Observations 79
Table 11. N-PASS Pain ANOVA Marginal Means, First Ten Observations 81
Table 12. KMO and Bartlett’s Tests 84
Table 13. Time 1 Communalities 85
Table 14. Time 1 Total Variance Explained, Unrotated 86
Table 15. Time 5 Communalities 87
Table 16. Time 5 Total Variance Explained, Unrotated 88
Table 17. Time 10 Communalities 89
Table 18. Time 10 Total Variance Explained, Unrotated 90
Table 19. Time 1 Total Variance Explained, Rotated 92

ix
Table 20: Time 1 Factor Matrix, Rotated 93
Table 21: Time 5 Total Variance Explained, Rotated 95
Table 22: Time 5 Factor Matrix, Rotated 96
Table 23: Time 10 Total Variance Explained, Rotated 98
Table 24: Time 10 Factor Matrix, Rotated 99

x
LIST OF FIGURES
Figure 1. The Onion Theory of Pain 17
Figure 2. The modified Onion Theory of Pain and Sedation for the nonverbal infant
or child 21
Figure 3. Estimated marginal means N-PASS sedation scale, first ten observations 79
Figure 4. Estimated marginal means N-PASS pain score, first ten observations 81
Figure 5. Time 1 scree plot 86
Figure 6. Time 5 scree plot 88
Figure 7. Time 10 scree plot 90
Figure 8. Time 1 rotated factor plot 94
Figure 9. Time 5 rotated factor plot 97
Figure 10. Time 10 rotated factor plot 100

xi
ABSTRACT
The purpose of this study was to investigate the Neonatal Pain, Agitation, and
Sedation Scale (N-PASS) tool for evidence of validity and reliability in infants and
children aged one to thirty-six months in the Post-Anesthesia Care Unit (PACU). This
study design was a prospective, non-experimental psychometric evaluation of the N-
PASS tool.
The research was conducted at a Midwestern Medical Center. The sample
analyzed comprised forty subjects aged one to thirty-six months.
Data collection involved the evaluation of participants every five minutes,
utilizing the N-PASS sedation subscale along with the University of Michigan Sedation
Scale (UMSS) and the N-PASS pain/agitation subscale along with the Face, Legs, Arms,
Cry, Consolability (FLACC) tool. All subjects were observed for a minimum of ten
observations.
The results showed that the Cronbach’s alphas of the N-PASS sedation scale
ranged from .853 to .923, and from .935 to .971 for the N-PASS pain/agitation scale.
Correlations between the N-PASS sedation scale and the UMSS tool ranged from .847 to
.967. Correlations between the N-PASS pain/agitation scale and the FLACC tool ranged
from .980 to .996.
Repeated Measures ANOVA analysis revealed that the N-PASS sedation score
decreased linearly over time. Repeated Measures ANOVA indicated that the N-PASS

xii
pain/agitation scores changed over time, but not at a linear, quadratic, or cubic form.
Regression analysis revealed a statistically non-significant linear trend for the prediction
of amount of time spent in PACU as a function of change in sedation levels from time 1
to time 10.
Principal axis factor analysis found that two factors accounted for 80.46 to
87.77% of the variance. One factor represented pain/agitation, and one factor represented
sedation, confirming the two subscales of the N-PASS tool. All items had high factor
loadings (> .60). Factor structure remained similar over the three time periods.
The implications for this research indicate sufficient evidence for use of the N-
PASS tool for sedation and pain/agitation assessment in infants and children one to
thirty-six months of age.
1
CHAPTER ONE
STATEMENT OF THE PROBLEM
Introduction
Management of pain and alleviating suffering are ethical mandates for nursing
practice (American Nurses Association, 2001). Pain assessment is an essential nursing
responsibility and the foundation of pain management. Sedation assessment is also an
essential nursing responsibility—monitoring for inadvertent sedation following analgesic
medications, or the level of sedation following sedative administration, or post-anesthesia
in the perioperative setting. Nonverbal patients, including infants and preverbal toddlers,
critically ill or unconscious patients, persons with intellectual disabilities, and patients at
the end of life all challenge the nurse to detect and interpret behavioral indicators of pain
and sedation.
Each of these populations may be unable to self-report pain due to cognitive,
developmental, or physiologic issues, including medically induced conditions, creating a
major barrier for adequate pain assessment and achieving optimal pain control. Inability
to provide a reliable report about pain leaves the patient vulnerable to under-recognition,
and under- or over-treatment. Nurses are integral to ensuring assessment and treatment of
these vulnerable populations (Herr, Coyne, McCaffery, Manworren, & Merkel, 2011).
Behavioral assessment tools are widely used in nonverbal populations to provide
an assessment and measurement of specific behaviors as objectively as possible in the

2
clinical setting, providing information necessary to deliver safe care and to evaluate
clinical interventions. Psychometric evaluation of these behavioral assessment tools is
essential, as the instruments are used to guide clinical care and as outcome measures in
pain management research.
The Joint Commission pain management standards, implemented in 2001, stated
that every patient has a right to have their pain assessed and treated (JCAHO, 2000). The
standards mandate that tools with evidence of reliability and validity are used for pain
assessment, and that the appropriate tool be used for the patients’ age and situation. This
standard spurred the implementation of pain assessment and management protocols in
health care organizations. This, in turn, identified gaps in knowledge, leading to an
increase in the development and implementation of pain assessment tools designed,
researched, and used mainly by registered nurses to assess pain and guide interventions.
Behavioral pain assessment tools, developed empirically over the past thirty to
forty years, are used in the clinical setting and in research. These tools were first designed
for use in the pediatric population, and then expanded to the neonatal and the adult
nonverbal population. The Children’s Hospital of Eastern Ontario Pain Scale (CHEOPS)
tool was one of the earliest tools developed to assess and document pain behaviors in
young children (McGrath et al., 1985). Within a few years, The Neonatal Facial Coding
System (NFCS) was developed for use in newborn infants (Grunau & Craig, 1987).
Dozens of pain assessment tools have been developed since that time for use in all
nonverbal populations including the preterm neonate through the nonverbal adult.
Sedation assessment and measurement has not been formally mandated, other
than in safety guidelines for discharge following procedural sedation in children

3
(American Academy of Pediatrics, 2006). Tools with evidence of validity and reliability
that standardize assessment of the child’s sedation level enhance systematic assessment
and documentation, allow individual alterations in the therapeutic regimen, and help
avoid insufficient or excessive sedative use (Marx et al., 1994). Sedation assessment tools
are commonly used as an outcome measure in clinical research.
Sedation assessment tool development and testing in the adult and pediatric
populations has emerged over the past decade, in response to clinical and research
requirements for sedation level documentation. The University of Michigan Sedation
Scale (UMSS) is an observational tool that scores the adult or pediatric patients’
responsiveness to stimulation as a measure of sedation during procedures (Malviya et al.,
2002). The Richmond Agitation-Sedation Scale (RASS) is a commonly used adult
sedation scale, grading behavior on a scale of combativeness to deep sedation (Sessler et
al., 2002).
Neonatal and pediatric pain research has been subjected to systematic review and
analysis, identifying core outcomes and measures recommended for pain research (Anand
et al., 2006; McGrath et al., 2008). The National Institute of Child Health and Human
Development and the U.S. Food and Drug Administration (NICHD/FDA) task force on
neonatal pain identified pain assessment knowledge gaps; current tools were delineated,
and the need for further validity and reliability testing of the tools was identified (Anand
et al., 2006). The N-PASS tool (Hummel, Puchalski, Creech, & Weiss, 2008) was
recommended for use in the neonatal population. The Pediatric Initiative on Methods,
Measurement, and Pain Assessment in Clinical Trials (PedIMMPACT) consensus
statement reviewed observational pain assessment tools and identified those appropriate

4
for use in acute pain trials (McGrath et al., 2008). Both reviews identify the need for the
development of tools designed for pain and sedation measurement in infants and
preverbal toddlers, particularly in the intensive care setting.
An assessment tool with evidence of validity and reliability that measures pain
and sedation in critically ill or perioperative children has implications for all realms of
nursing, including education, practice, and research. Nursing education includes pain and
sedation assessment and management in the nonverbal population. Assessment tools
quantify pain indicators, facilitate classroom learning, and reinforce the role of the nurse
in pain assessment and evidence-based intervention. Pediatric nursing textbooks by
Algren (2005) and by Hockenberry and Wilson (2009) devote several pages to pain
assessment. Tools for verbal children and for behavioral pain assessment are listed, with
basic explanations of behavioral pain assessment. Pediatric behavioral pain rating scales
outlined in chapters focusing on family-centered care of the child during illness and
hospitalization include the Children’s Hospital of Eastern Ontario Pain Scale (CHEOPS)
(McGrath et al., 1985) and the Face, Legs, Activity, Cry, Consolability tool (FLACC)
(Merkel, Voepel-Lewis, Shayevitz, & Malviya, 1997), as well as other tools that are used
clinically but lack psychometric evaluation. Infant assessment tools included are the
Neonatal Infant Pain Score (NIPS) (Lawrence et al., 1993); the Crying, Requires oxygen,
Increased vital signs, Expression, Sleepless (CRIES) (Krechel & Bildner, 1995); the
Premature Infant Pain Profile (PIPP) (Stevens, Johnston, Petryshen, & Taddio, 1996);
and the Neonatal Pain, Agitation, and Sedation Scale (N-PASS) (Hummel et al., 2008);
as well as other clinically used tools that lack psychometric evaluation. Sedation

5
assessment instruments are not included in the textbooks (Algren, 2005; Hockenberry &
Wilson, 2009).
Nurse researchers interested in assessment of nonverbal patients have
unprecedented opportunities at this time for conducting pain research in nonverbal
populations including infants and preverbal children. Studies should focus on comparison
of existing instruments to determine those with the strongest psychometric properties and
to identify the weaknesses in instruments that may be widely used but have significant
psychometric weaknesses that lead to incorrect inferences. Validated assessment tools
can be used in nursing intervention pain and sedation research, contributing to evidence-
based nursing practice guidelines.
Pain and sedation assessment and providing comfort are universal nursing
functions that require measurement based on patient characteristics including age and
stage of development. The nursing diagnosis of alteration in comfort is applicable for
infants and children experiencing pain (North America Nursing Diagnosis Association
International, 2009). Clinical practice is based on findings from research-based
assessment tools, providing the means by which to make an accurate nursing diagnosis,
leading to appropriate intervention.
There is a need for an empirically developed instrument with adequate
psychometric evaluation to measure pain and sedation in the infant and pediatric
populations. Such an instrument is essential to the implementation and evaluation of
evidence-based interventions in the clinical and research settings.

6
Problem Statement
There is a clinical need for an assessment tool that measures pain and sedation in
infants and children. The N-PASS tool has been researched in preterm and term infants,
twenty-three to forty weeks gestation at birth up to 100 days of age; the upper age limit
for use of the N-PASS tool has not been researched (Hummel, Lawlor-Klean, & Weiss,
2010; Hummel et al., 2008). Users regularly contact the author of the N-PASS to inquire
if the tool can be used in older infants and toddlers, indicating a need for testing of the
tool in older age groups, particularly with infants up to thirty-six months of age. This age
group is justified for research, as children over three years of age may be
developmentally able to provide verbal self-report of pain. Children under three years of
age are developmentally unable to clearly and reliably self-report pain, necessitating
behavioral pain assessment (Wong & Baker, 1988). The N-PASS tool requires
investigation to determine the age usage limits for validity and reliability evidence,
guiding appropriate clinical and research use.
Purpose of the Study
The purpose of this study was to investigate the N-PASS tool for evidence of
validity and reliability in a sample of infants and children one to thirty-six months of age
in the Post-Anesthesia Care Unit (PACU). Nurses and physicians in the PACU provide
care for infants and children in the immediate postoperative condition. This setting allows
for observation of infants and children emerging from general anesthesia, providing data
for psychometric evaluation of the sedation assessment portion of the N-PASS tool. This
setting also enables observation of infants and children in pain, providing data for
psychometric testing of the pain assessment portion of the N-PASS tool.

7
The research questions for infants one to thirty-six months of age in the PACU
setting are the following:
1. Do the N-PASS tool subscales of sedation and pain/agitation exhibit internal
consistency as measured by Cronbach’s alpha?
2. Does the N-PASS tool sedation subscale exhibit criterion validity when compared
with the UMSS instrument?
3. Does the N-PASS tool pain/agitation subscale exhibit criterion validity when
compared with the FLACC instrument?
4. Do the N-PASS tool sedation and pain/agitation subscales exhibit construct
validity in the PACU setting by showing significant difference in scores over time
through Repeated Measure ANOVA testing?
5. Does the N-PASS tool provide a predicted pathway of behaviors over time of
recovery in the PACU setting?
6. What is the factor structure of the N-PASS tool?
The chapters that follow provide a review of the literature involving pain and
sedation assessment and a research plan for the psychometric evaluation of the N-PASS
tool in infants and toddlers, one to thirty-six months of age in the PACU setting.
Research findings will be delineated and discussed.

8
CHAPTER TWO
LITERATURE REVIEW
This chapter reviews the conceptualization of pain and sedation in infants and
children, with an emphasis on assessment. The state of theoretical knowledge and clinical
practice is summarized, reviewing behavioral pain and sedation indicators and the current
pain and sedation assessment tools used in the pediatric population. Gaps in knowledge
are identified, justifying the need for this research.
Conceptualization and Theory
Pain experience physiology is a complex phenomenon (Marchand, 2008). Pain
perception and response is dependent upon intact nerves, tracts, neurotransmitters, and cortical
function, and can be interrupted in any or all of these areas by analgesic medications, or by
physical or physiological variants.
Conceptualization of Pain
A concise overview of pain is provided by Loeser and Melzack (1999). The pain
experience begins with nociception. This is the detection of tissue damage in the periphery with
pain receptors, the nociceptors, activating a stimulus that travels to the dorsal horn of the spinal
cord, resulting in reflexive response along with transmission to the brain via ascending fibers.
Descending inhibitory pain tracts are simultaneously activated and may diminish transmission to
the brain. Multiple areas of the brain are involved in pain perception and response; there is no
specific pain center. Cortical interpretation of the pain stimulus leads to a response which may be
verbal, or nonverbal, or both. Suffering is a negative response induced by pain and also by fear,

9
anxiety, stress, loss of loved objects, and other psychological states (Cassel, 1982). Pain
expression and behaviors result from pain and suffering. The verbal individual can communicate
their pain to others using words describing the location, intensity, and character of the experience.
The nonverbal individual communicates with a behavioral response if physiologically able to do
so.
The International Association of Pain (IASP) describes pain as “an unpleasant sensory
and emotional experience associated with actual or potential tissue damage, or described in terms
of such damage. Pain is always subjective” (IASP, 1994). This description was expanded in 2001,
adding that the inability to communicate in no way negates the possibility that an individual is
experiencing pain and is in need of appropriate pain-relieving treatment (IASP, 2001).
The absolute subjectivity of the pain experience leads to difficulty in the
measurement of pain in the person who is unable to verbally express their level of pain.
The American Society for Pain Management Nursing delineates a hierarchy of pain
assessment and treatment techniques, providing guidelines for the clinician (Herr et al.,
2006; Herr et al., 2011; McCaffery & Pasero, 1999). This guideline gives a sequence of
five steps to achieve optimal pain assessment in the clinical setting:
1. The most optimal pain assessment technique is verbal self-report.
2. In the absence of self-report, the clinician should search for potential causes of pain
and treat the patient accordingly, ensuring that patients are treated in painful
situations regardless of behaviors.
3. The clinician should observe patient behaviors, cautioning that these behaviors may
not always be accurate reflections of pain intensity and in some cases indicate another
source of distress, such as physiologic or emotional distress.

10
4. The clinician should use surrogate reporting from parents and caregivers.
5. An analgesic trial should be employed if there are pathologic conditions or
procedures likely to cause pain or if pain behaviors persist after attention to basic
needs and comfort measures.
Pain and sedation are viewed as separate yet linked phenomena. Pain levels range
from mild to severe, while sedation levels range from light sedation to general anesthesia.
Analgesic medications may relieve pain and may also lead to sedation. Sedative
medications cause sedation by altering neurotransmitters, receptors, or cortical processes.
Sedatives may mask behavioral pain signals without providing analgesia. Pain and
sedation may be present simultaneously or independently.
Conceptualization of Sedation
Sedation is defined as a calm tranquil state that allays anxiety and excitement
(Curley, Harris, Fraser, Johnson, & Arnold, 2006). The American Society of
Anesthesiologists delineates a continuum of sedation from minimal (anxiolysis) to
general anesthesia (American Society of Anesthesiology House of Delegates, 2012). (See
Table 1.) In this continuum, levels of sedation are evaluated by assessing responsiveness,
airway maintenance, spontaneous ventilation, and cardiovascular function; these items
are particularly important in the perioperative or procedural/diagnostic situations.
Sedative medications modulate receptors in the central nervous system as well as
other organs in the body (American Society of Anesthesiology House of Delegates, 2012;
Crain, Slonim, & Pollack, 2002). Sedatives are used to reduce anxiety, decrease agitation,
and induce sleep. Vital functions such as respiration are depressed. General anesthetics
cause a loss of awareness and a general insensitivity to pain.

11
Table 1. Continuum of Sedation
Minimal
sedation
anxiolysis
Moderate
sedation/analgesia
(“conscious
sedation”)
Deep sedation/
analgesia
General
anesthesia
Responsiveness Normal
response to
verbal
stimulation
Purposefula
response to verbal
or tactile
stimulation
Purposefula
response
following
repeated or
painful
stimulation
Unarousable
even with
painful
stimuli
Airway Unaffected No intervention
required
Intervention
may be required
Intervention
often
required
Spontaneous
ventilation
Unaffected Adequate May be
inadequate
Often
inadequate
Cardiovascular
function
Maintained Maintained Impaired
aReflex withdrawal from painful stimulus is not considered a purposeful response
(American Society of Anesthesiology House of Delegates, 2012).
Anesthesia professionals are concerned with defining awakening from anesthesia
in the perioperative setting. To define awakening in infants, Bould and Sury (2011) used
a modified Delphi technique with an iterative process of questionnaires and anonymous
feedback by email. Thirty-one consultant pediatric anesthetists were surveyed. Consensus
was defined a priori as 80% agreement. This consensus was reached on six criteria that
define awakening in infants. Crying and attempting to cry were combined, leaving five
criteria: 1) crying or attempting to cry; 2) vigorous limb movements; 3) gagging on a
tracheal tube; 4) eyes open; and 5) looking around.
The authors propose that at least two of the five behaviors are present to consider
a neonate awake after anesthesia. The authors did not psychometrically evaluate this tool.

12
They anticipate that future investigators may modify the criteria and develop a
consciousness-level scale for infants.
The Gate Theory of Pain
The Gate Theory of Pain, introduced by Melzack and Wall (1965) over forty
years ago, remains a widely accepted theory of pain perception for all populations. This
theory includes a conceptualization of pain transmission and transduction of pain
messages via neurological pathways from the body to the brain, with a complex array of
ascending, as well as descending, mechanisms. Messages travel from the periphery
through the spinal cord to the brain and pass back to the periphery. Some pain messages
do not reach the brain due to the closed gate; the message is blocked by descending
inhibitory pathways or modified by endorphin release. This protective mechanism allows
the person to function in the presence of a painful stimulus by blunting pain perception.
Cognitive thought processes and emotional responses to the pain are influential in
modulating the pain response, as well as affecting the personal experience of pain. Pain is
a physiological sensation that an individual quantifies objectively, according to their
personal experience of pain events.
Behaviorism
Behaviorism is a psychological perspective introduced over one hundred years
ago that seeks to explain animal and human behavior entirely in terms of observable and
measurable responses to environmental stimuli (Watson, 1913). Behaviorism theory is an
essential framework used in pain assessment research in the nonverbal population.
Observable and measurable responses to pain are the basis of behavioral pain and
sedation assessment methodologies.

13
The Psychological Behaviorism Theory of Pain
The Psychological Behaviorism Theory of Pain facilitates the development of a
common vocabulary for pain research across disciplines (A. W. Staats, 1996; P. S. Staats,
Hekmat, & Staats, 2004). In this theory, pain is proposed to consist of seven interacting
dimensions: basic biology, conditioned learning, language cognition, personality
differences, pain behavior, the social environment, and emotions. Because pain is a
multidimensional response to a physiological stimulus, examining the bidirectional
impact of emotion is pivotal to understanding pain. Emotion influences each of the other
areas of interest and causes the impact of each factor to amplify or diminish in an additive
fashion. This theory and its definitions of pain, however, are problematic when applied to
the nonverbal subject, as emotions are difficult to quantify through behavioral
observation.
The Social Communication Model of Pain
A theory that guides pediatric/infant research and practice is the Social
Communication Model of Pain (Craig, 2009; Craig & Pillai Riddell, 2003; T.
Hadjistavropoulos & Craig, 2002). In this theory, infant pain, pain assessment, and pain
management are understood within the context of the caregiver. The infant experiences
pain, and expresses the pain behaviorally. Pain behaviors are influenced by the
caregiver’s assessment and management of pain. The infant in pain is assessed within the
context of a dynamic, interactive process involving both the child and caregiver, each of
whom is uniquely influenced by the greater spheres of family, community, and culture.
Infant pain is posited to be comprised of states within the child, within the caregiver, and

14
between the child and caregiver.
This theory posits that the infant or child’s internal experience of pain is
influenced by the biological composition of the infant (such as nervous system
thresholds), the infant’s past experiences with pain, and the different social contexts (such
as in the hospital alone or at home with the parents) in which the pain occurs. A caregiver
can never obtain a definitive understanding of the child’s internal pain experience (Craig
& Pillai Riddell, 2003). Healthy infants react to tissue damage with vigorous vocal and
non-vocal activity, providing a means for inferring their subjective state. The infant is
dependent on others for survival; these actions communicate distress. The aspects of the
social context and the presence of parents will impact the infant’s pain expression.
The theory conceptualizes pain assessment as a process that involves the
caregivers becoming aware of and interpreting the infant’s expression of pain. The
caregiver may or may not gather information to classify the distress as pain; this process
is influenced by the sensitivity of the caregiver. The caregiver’s interpretation is
influenced by their knowledge base—knowledge of the specific child and of children in
general, and knowledge of common pain indicators. The caregiver considers possible
alternatives for the distress. Interpretation of the infant’s expressions is influenced by pre-
existing attitudes and the environmental context. The caregiver processes the information
and makes decisions as to whether the infant is in pain. Interventions may then be
instituted to relieve the infant’s pain. If the infant’s distress is not relieved, the caregiver
further assesses the infant and employs a new management strategy.
This theory led to the development of a theory of pain assessment as a transaction
(Schiavenato & Craig, 2010). This theory proposes a more comprehensive
15
conceptualization of pain assessment as a transaction based on the interplay between the
patient and the clinician. This theory was supported by a review of the literature that
includes the complexity of pain assessment in children, the difficulties in interpreting
their pain scores, and the difficulties in nurses’ clinical pain management decisions
(Voepel-Lewis, Piscotty, Annis, & Kalisch, 2012).
The Fuller Infant Pain Assessment Model
A similar infant pain assessment model describes a process whereby the nurse
acknowledges the infant distress signal, most often crying, then postulates on possible
sources of distress such as hunger or pain (Fuller, 1998). The nurse examines background
data such as clinical setting, baseline behaviors, surgical and medication history, food and
fluid status, and opinions or actions of colleagues, followed by a more complete
assessment for pain behaviors. Comfort measures are provided and the consolability of
the infant is judged. Response to these comfort measures and consolability facilitate the
assessment of the infant’s pain status.
Prescriptive theory of acute pain management in infants and children. This
middle-range theory was developed heuristically from national pain guidelines, with the
goal of providing guidance for research on children’s pain and findings that have clinical
application (Huth & Moore, 1998). The assumptions of this behavioral theory are: 1)
healthcare professionals collaborate to manage acute pain in the infant and child; 2)
nurses are responsible for pain assessment and intervention; 3) nurses have current
knowledge of pediatric pain management, growth and development, and dosage
calculation; 4) opioid analgesia and/or pharmacologic adjuvants are indicated for pain
reduction; 5) medication for side effects is given if needed; 6) the patients are

16
between six months and twelve years old; and 7) past pain influences the pain experience.
Based on this theory, pediatric pain management is achieved by using assessment
strategies, pharmacologic and non-pharmacologic pain relief techniques, and child/parent
participation. The theory includes three sequential steps used in practice:
1. An initial assessment consisting of past pain history, current pain assessment,
assessments of developmental level, coping strategies, plus cultural background
leads to choice of appropriate therapeutic intervention.
2. Therapeutic interventions, consisting of child-parent teaching and/or opioid
analgesics, pharmacologic or non-pharmacologic adjuvants, contribute to pain
reduction that is satisfactory to child, parent, and nurse.
3. Reassessment consisting of regular assessment of pain by child or parent report,
assessment of behavioral and physiological states, and side effects leads to
identification of inadequate pain relief, behavioral distress, unacceptable
physiological measures, and side effects, which contributes to a choice of
appropriate therapeutic interventions.
Further research on this theory was not found in the literature.
The Onion Theory of Pain
The Onion Theory of Pain developed by Loeser (1982) includes the concept of
pain behavior, providing a theoretical basis for nonverbal pain assessment (Loeser &
Melzack, 1999). Pain is described as a five-layer phenomenon, with layers similar to an
onion. The first layer, the core of the onion, consists of nerve damage or stimulus, or the

17
physiology of pain, which involves nociception and transmission of the stimulus to the
brain. The second layer is termed pain perception, described as the cognition of pain in
the brain. Suffering is the third layer, a judgment of the meaning of the experience, or
negative response induced by pain. Pain behavior is the fourth layer, resulting from pain
and suffering. Pain behaviors include verbal expressions, grimacing, limping, lying
down, seeking health care, or refusing to work. Nociception, pain, and suffering are
inferred from pain behaviors, history, and physical examination. The outer layer,
interaction with environment, entails the social context, such as the location of person,
the response of other people, and cultural influences (see Figure 1).
Figure 1. The Onion Theory of Pain (Loeser, 1982).

18
This model gives greater awareness of the multi-layered effects of pain, illustrating that
pain is not a simplistic stimulus-response concept, and explains the concepts that form the
basis for behavioral pain assessment. This also relates pain behavior to the suffering
associated with pain. Suffering is not considered in most models of behavioral pain
assessment; suffering is a subjective experience, which can lead to behavioral
manifestations of pain. The person with verbal abilities can verbalize pain and the
suffering caused by the pain.
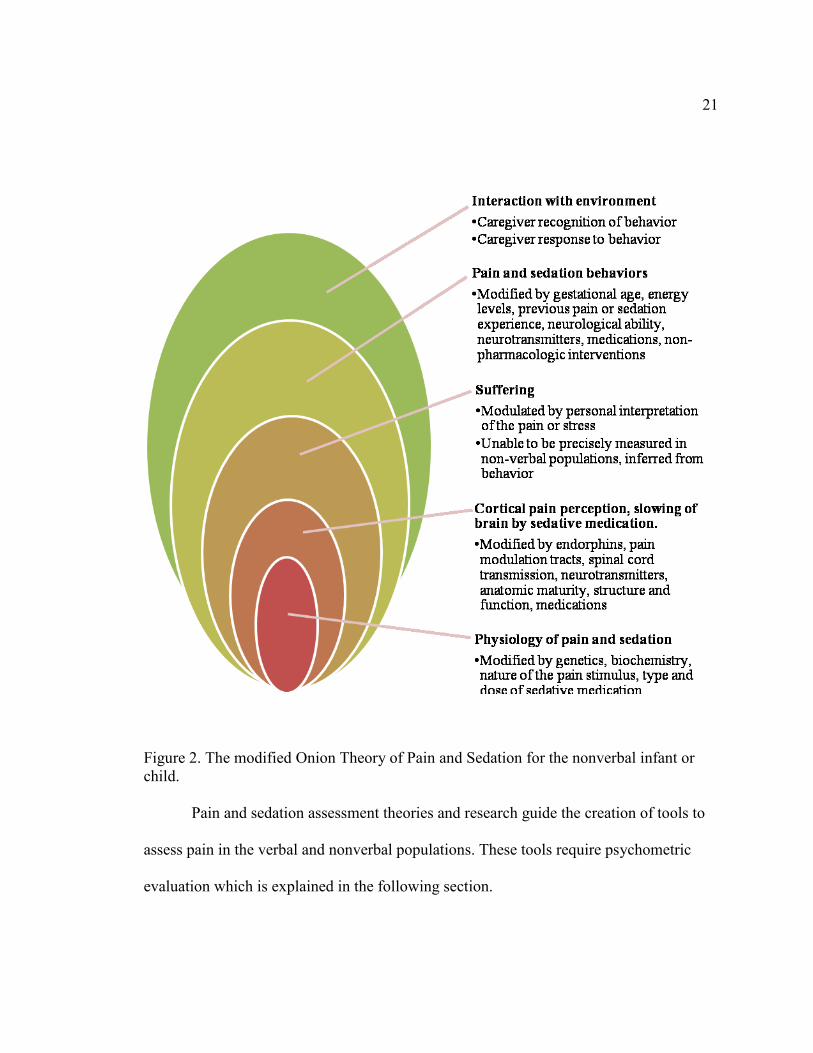
The modified Onion Theory of Pain and Sedation for the nonverbal infant or
child. The Onion Theory of Pain is useful in conceptualization of behavioral pain
assessment in the nonverbal infant or child, but is expanded by this author to include
modifiers unique to the nonverbal infant or child, based on research findings, and to
include the concept of sedation assessment. An important consideration that is not
explicit in the Onion Theory of Pain is that all layers of the process are modified
internally, by physiological differences such as genetics, maturity, and biochemistry; and
externally, by environmental and caregiver factors. In addition, suffering is inferred, but
cannot be determined by behavioral observation.
The first layer, physiology of pain and sedation, is similar, as infants and children
have mature nociception and transmission pathways, albeit modified by genetics,
biochemistry, and the nature of the pain or stressor stimulus (Anand & Craig, 1996;
Craig, McMahon, Morison, & Zaskow, 1984; Craig, Whitfield, Grunau, Linton, &
Hadjistavropoulos, 1993). The first layer also includes the physiology of sedation, as
pharmacologic agents are given orally or intravenously and then travel to the brain for the
desired effect.

19
The second layer, pain perception, is better termed cortical perception of pain in
the nonverbal infant or child. Cognition implies that the person can recognize and know
pain; this may not be present in the infant or any nonverbal person with diminished
cognitive abilities. Cortical perception involves the pain being transmitted to and
perceived by the brain, producing a response that is more than simply reflexive (Bartocci,
Bergqvist, Lagercrantz, & Anand, 2006; Fitzgerald & Anand, 1993; Holsti, Grunau, &
Shany, 2011). Cortical perception is modified by endorphins, pain inhibitory and
modulation tracts, spinal cord transmission, neurotransmitters, anatomic maturity, and the
structure and function of the brain (Anand & McGrath, 1995; Fitzgerald & Anand, 1993).
Cortical perception of pain can also be modified by medications. The second layer
involves sedation, with the cortical slowing of the brain activity by sedative or opioid
medications. Neurotransmitters are affected, to slow signal transmission, leading to the
sedative effect.
The third layer in the modified Onion Theory of Pain and Sedation, suffering, is
the emotion experienced as a result of pain. Suffering is modulated by personal
interpretation of the event. Suffering is unable to be precisely measured in the nonverbal
population, and is inferred from behavior (Ambuel, Hamlett, Marx, & Blumer, 1992;
Anand et al., 2006; Garten, Deindl, Schmalisch, Metze, & Buhrer, 2010; McGrath et al.,
2008). Suffering is assumed to be reduced by the administration of sedative or analgesic
medications.
The fourth layer, pain and sedation behavior, is present and observable in the
nonverbal infant or child. Pain behaviors are present due to the suffering caused by the
cortical perception of pain. Pain behaviors including crying, consolability, facial

20
expression, body movements, and vital sign changes have been described and validated
through observation of painful events. Behaviors indicative of sedation include a
decreased response to verbal or tactile stimuli and slowing of physiologic functions such
as breathing and airway maintenance. The verbal child is able to express the pain’s
intensity, location, and quality; in the nonverbal child, these are inferred through
behavioral observation. Behavioral expression of pain is modified by many factors,
including maturity and energy levels, neurological abilities, and neurotransmitter function
(Johnston, Stevens, Craig, & Grunau, 1993; Lilley, Craig, & Grunau, 1997). Medications
such as sedatives or analgesics, as well as non-pharmacological interventions or comfort
measures, may modify pain behaviors. The verbal child may be able to express light
levels of sedation, stating that they feel sleepy or dizzy. Deeper levels of sedation require
behavioral observation as the child becomes unable to verbalize the sensations.
The fifth and outer layer, interaction with environment, explains the impact of the
caregiver interacting with the nonverbal person. The caregiver must recognize the pain
behaviors exhibited, and then take appropriate action to relieve the pain and distress,
inferred by decreasing behavioral signs of pain (Craig, 2009; Fuller, 1998; Voepel-Lewis
et al., 2012). The caregiver must also recognize the behaviors of sedation. The
environment also impacts pain and sedation levels, as it is more difficult to achieve
sedation or analgesia when the person is being stimulated, such as with painful
procedures or if the environment is not quiet or calm. See Figure 2 for the modified
Onion Theory of Pain and Sedation for the nonverbal infant or child.
21
Figure 2. The modified Onion Theory of Pain and Sedation for the nonverbal infant or
child.
Pain and sedation assessment theories and research guide the creation of tools to
assess pain in the verbal and nonverbal populations. These tools require psychometric
evaluation which is explained in the following section.

22
Psychometrics
Psychometrics is the field of study concerned with the theory and techniques of
measurement, primarily concerned with the construction and validation of measurement
instruments (Nunnally & Bernstein, 1994a). Measurement consists of rules for assigning
symbols to objects so as to represent quantities of attributes numerically (scaling) or to
define whether the objects fall in the same or different categories with respect to a given
attribute (classification) (Nunnally & Bernstein, 1994a). Standardized measures remove
guesswork from scientific observation and permit the use of powerful methods of
statistical analysis. Communication between clinical practitioners and researchers is
facilitated when standardized measures are available, enhancing evidence-based care in
the clinical setting and increasing validity in research.
Behavioral pain and sedation assessment tools have been developed through
various methodologies. Most commonly, behaviors that are observed empirically with a
known pain stimulus or after sedative administration have been incorporated into
assessment tools. Expert caregivers, generally nurses with clinical experience caring for
patients in pain, have provided input on the indicators in assessment tools.
Behavioral pain assessment tools score pain by assigning numeric values to the
presence and/or intensity of selected pain behaviors. Generally, a higher number reflects
increased incidence, duration, and/or intensity of specific pain behaviors. Some pain
experts caution that pain intensity cannot be specifically measured behaviorally,
recommending that a list of behaviors be used rather than a composite score (Pasero &
McCaffery, 2005). The debate regarding an increased behavioral response as a sign of
pain and, conversely, a decreased response as a sign of diminished pain is extensive and

23
involves beliefs and emotions. Consensus on this has not been achieved (Anand et al.,
2006; Goldman & Koren, 2002; McGrath et al., 2008; A. R. Wolf, 1993).
The behavior (indicator) is rated by the observer based on frequency and/or
intensity of the behavior. Simplicity and clinical utility are valued, keeping the number of
indicators to a minimum; the ideal number is undetermined. Most behavioral pain tools
include at least three behaviors, some include over ten behaviors. Clinicians clearly prefer
fewer indicators. The scaling of a behavior can be simplified to present or not present,
yielding nominal data, though this is not frequently done. Behaviors are often Likert-type
scaled from 0 (not present) to a higher number. Again, there is no standard for scaling
pain behaviors. Clinically, it is difficult to rate several behaviors on a large scale;
behaviors are generally scaled from 0-2, possibly 0-5. Increasing the scaling number
could increase precision, but decrease clinical utility. Each indicator is rated, and then the
item scores are generally totaled.
Many measures, such as behavioral pain assessment measures, yield a score, a
sum of item responses, of each scaled behavior. Data from each indicator are ordinal: the
number is assigned based on the decision that the observer makes to assign a higher
number because the behavior is observed more frequently or with more intensity than the
low number indicates. The total score is usually treated as interval data, with computed
means, assuming equality of intervals (Nunnally & Bernstein, 1994a).
Reliability, or stability, of the clinical pain assessment instrument is commonly
assessed through inter-rater reliability with more than one person assessing and scoring
the subject simultaneously and independently. Scores are then compared, individual items
are analyzed by Cohen’s kappa, and the total score is analyzed by the Intra-class

24
Correlation Coefficient. Intra-rater reliability is established by videotaping the event, then
scoring the video repeatedly, comparing scores by correlation. Cronbach’s alpha
(Cronbach, 1951) is the statistic of choice for evaluating the internal consistency of a
measurement tool using multidimensional scoring formats. This gives the average of all
of the possible split-half reliabilities of a scale. Cronbach’s alpha can be calculated
multiple times, deleting one item each time with the goal of obtaining the shortest
instrument that represents the phenomenon. Homogeneity of the scale is increased if the
alpha increases significantly when a specific item is left out (Streiner & Norman, 2003).
DeVellis (2003) provides guidelines for Coefficient alpha identifying that “…below .60
is unacceptable, between .60 and .65 undesirable, between .65 and .70 minimally
acceptable, between .70 and .80 respectable, and between .80 and .90 very good”.
Further, he describes that “scales that are intended for individual diagnostic, employment,
academic placement, or other important purposes should probably have considerably
higher reliabilities, in the mid-.90’s, for example”. Cronbach’s alpha is commonly
employed in psychometric evaluations as it is useful with both dichotomous and
continuous variables (Cortina, 1993).
Validity, the ability of the instrument to measure the attributes of the construct
under study (Trochim, 2001), is usually a matter of gradation rather than an all-or-none
property. Validation is a continuous process and requires empirical investigations
(Nunnally & Bernstein, 1994b). Validity of a behavioral pain assessment tool can be
difficult to establish in the nonverbal population. Ideally, self-report or a biologic pain
marker would be used in construct validation; neither is readily available in the infant and
toddler population. Empirical documentation of behaviors during procedures or events

25
known to be painful or during sedation is the foundation of extant measures. Criterion or
convergent validity can be assessed by utilizing the tool along with a previously validated
tool. Construct validity can be assessed by 1) comparing the score during a painful event
to a score during a non-painful event; 2) comparing the scores before and after an
analgesic or sedative intervention; 3) examining scores for differences over time; or 4)
examining items through factor analysis or principal component analysis procedures.
Both techniques are designed to explore the variation in a set of observed variables on the
basis of a few underlying dimensions (Dunteman, 1989). Further refinement of construct
validation requires a network of evidence that accumulates with repeated research.
DeVon et al. (2007) reviewed the concepts of instrument reliability and validity in
published nursing research. Findings indicate that studies frequently reported content
validity, often with fewer than five experts reviewing the tool, and rarely reported
evidence of criterion validity, erroneously reported criterion validity, and under-reported
construct validity. The majority of reports included Cronbach’s alpha for study
instruments. The authors concluded that lack of psychometric information is common in
the literature.
Nonverbal Pain Assessment
Behavioral and physiologic cues are the current accepted standard for assessment
and evaluation of pain and sedation in the nonverbal patient. Nonverbal pain assessment
has been studied widely in the infant population, and more recently in the adult
population, including critically ill adults and those with dementia (Herr et al., 2006).
Pediatric pain behavioral research initially was conducted as observation of
inflicted pain, such as a pinprick. Due to ethical guidelines, pain assessment research is

26
now accomplished through observing and monitoring the infant or child during and
following a medically necessary procedure that causes tissue injury (Anand et al., 2005;
Anand & McGrath, 1995). Behavioral and physiological changes with tissue injury have
been documented, such as facial grimacing and vital sign changes. Researchers have
validated that the infant is experiencing pain and that the behaviors and physiologic
changes that occur are a result of the pain from the tissue injury. In the absence of verbal
report and a biological marker for pain, these physiologic and behavioral correlates are
accepted as indicators of pain (Anand et al., 2005; Herr et al., 2006).
Neonatal pain behavioral research began over sixty years ago, with a single study
of infant reaction to pinprick (McGraw, 1941). The prevailing belief in this period
viewed the cerebral cortex as non-functioning at birth, as indicated in histological studies
of the brain. This led the researcher to assume that the sensorimotor experiences of the
newborn infant did not extend beyond the subcortical or thalamic level, leading to
reflexive, non-purposeful reactions. The infants’ non-specific neonatal motor response—
generalized body movements rather than isolated withdrawal to repeated pin pricks—
strengthened the long-held belief that neonates were incapable of perceiving pain (Anand
& McGrath, 1995; McGraw, 1941). This assumption curtailed further research on the
topic for the next three decades (Stevens, Johnston, & Gibbins, 2000).
In the 1970s, infant pain research resumed, mainly using basic observational
techniques in the context of medically necessary short-term pain experiences such as
heelstick, circumcision, or intramuscular injection. Behavioral pain indicators were also
validated in pain management research, as the effectiveness of an intervention was
evaluated by observing changes in pain behaviors. Infant cry variations and response to

27
pinprick were documented (Fisichelli, Karelitz, Fisichelli, & Cooper, 1974; Rich,
Marshall, & Volpe, 1974). Neonatal pain behavior research confirmed that infants feel
and express pain, delineating and validating neonatal pain behaviors (Craig et al., 1984;
Craig et al., 1993; Fitzgerald, Shaw, & MacIntosh, 1988).
Research published in the late 1980s by Anand and colleagues advanced the
knowledge of infant pain and the consequences of pain in preterm neonates. Anand’s
research demonstrated a decreased mortality rate and a more rapid recovery in infants
receiving adequate anesthesia and analgesia perioperatively. This body of research was
instrumental in changing attitudes regarding neonatal pain (Anand & Hickey, 1987;
Anand, Sippell, & Aynsley-Green, 1987). Another major factor in the attitudinal change
was a mother’s account, in 1986, of her preterm infant’s thoracotomy for patent ductus
arteriosus ligation without anesthesia, published in the Washington Post (Rovner, 1986).
Public outcry demanded change in clinical management of infant pain, contributing to an
increase in pain assessment and management research.
Research completed over the past thirty years has verified that neural pathways
for afferent/ascending pain transmission and cortical interpretations are present in even
the smallest preterm infant, dispelling the perception that neonates are unable to perceive
pain (Andrews & Fitzgerald, 1994; Fitzgerald, 1999; Fitzgerald & Anand, 1993;
Fitzgerald et al., 1988; Kostovic & Rakic, 1990; Okado, Kakimi, & Kojima, 1979).
Undertreatment of pediatric pain has been documented beyond the neonatal
period. Multiple research studies documented that children in the postoperative period
received opioid analgesics infrequently, far less than a comparable adult sample (Beyer,

28
DeGood, Ashley, & Russell, 1983; Eland & Anderson, 1977; Hamers, Abu-Saad, van den
Hout, & Halfens, 1998; Mather & Mackie, 1983).
Nursing has been the primary discipline researching pain assessment. Medicine,
pharmacy, psychology, and developmental pediatrics have also contributed to pain
assessment and management research (Debillon, Zupan, Ravault, Magny, & Dehan,
2001; Grunau & Craig, 1987; Stevens et al., 1996; Taddio et al., 2009). The following
section describes the identification of biologic pain markers. The clinical and research
utility of these markers is outlined.
Biologic Pain and Sedation Markers
In the absence of verbal report, a specific biologic pain marker with clinical utility
would be preferable to behavioral assessment. Such a biologic marker has yet to be
discovered. Stress hormone measurement in infant’s serum or saliva perioperatively,
during heelstick, and during mechanical ventilation has been studied (Anand & Hickey,
1987; Guinsburg et al., 1998; Herrington, Olomu, & Geller, 2004; Simons et al., 2005).
These researchers reported that the stress hormone levels of cortisol, epinephrine, and
norepinephrine increase with a painful experience, and are modified by analgesic
administration. Clinical utility is limited as these levels rise inconsistently due to the
infant’s physiological immaturity or disease process, and due to clinical administration of
medications that alter these levels. Biochemical markers are unethical to use if this leads
to additional pain due to an additional needlestick and also wasting blood volume to
obtain the levels. The practitioner cannot wait for lab results before adjusting analgesia in
the clinical setting.

29
Hormonal or endocrine response, as measured by blood or saliva analysis, palmar
sweating, and electrical brain activity monitoring have been researched for utilization in
pain assessment and for evaluation of pain management strategies. Emotional sweating in
the palm and sole resulting from neurophysiologic arousal with increased activity in the
sympathetic nervous system during a heel-lance procedure is measured as skin
conductance or Galvanic Skin Response (GSR) (Eriksson, Fremming, Gradin, Schollin,
& Storm, 2003). Researchers compared the behavioral response with the Neonatal Facial
Coding System (NFCS) and GSR during three events: touching (deemed non-painful),
placing a cloth soaked with alcohol on the skin (deemed stressful), and heel-lance
(deemed painful). The GSR increased minimally with the alcohol cloth placement, and
markedly with heel lance. The NFCS score showed a larger increase with touch than with
stress and a significant increase with heel lance. GSR was found, in healthy term infants,
to differentiate between stress and acute pain situations as well or better than the
measurement by the NFCS. The GSR method needs to be evaluated with
established/ongoing pain and with infants. This technique is not expected to be valid in
the premature infant, as palmar sweating is not present until closer to term gestation
(Anand et al., 2006). In addition, sensitivity and specificity are low with skin
conductance (Van Dijk & Tibboel, 2012). Skin conductance is further discussed with
physiologic pain assessment.
EEG recording is used extensively to evaluate neurological cerebral function.
Reactivity to somatosensory stimuli is important clinically, and may be useful in pain
assessment. Evaluation of pain in full-term infants with EEG found a significant increase
in the higher frequency band components of the EEG in frontal regions, but not

30
somatosensory or other regions (Norman et al., 2008). Other research found an evoked
response after a single painful stimulus using a time-locking technique (Slater, Fabrizi, et
al., 2010; Slater, Worley, et al., 2010). More research is needed to explore pain
assessment with EEG for clinical or research purposes (Holsti et al., 2011).
Near infra-red spectroscopy (NIRS) is used in the neonate to measure cerebral
auto-regulation, blood volume, flow, and oxygenation (M. Wolf & Greisen, 2009). This
non-invasive method is useful in the assessment of brain activity through the intact skull.
Pain increases oxygenation and thus indicates higher activity. Research in preterm infants
found that standardized tactile stimuli and venipuncture elicit specific hemodynamic
responses in the somatosensory cortex, implying conscious sensory perception (Bartocci
et al., 2006). NIRS may be more sensitive than behavioral pain assessment; researchers
found cortical pain responses with NIRS without a change in facial expression (Slater,
Cantarella, Franck, Meek, & Fitzgerald, 2008). NIRS remains challenging for clinical
bedside assessment because movement artifacts can interfere with the signal, and
environmental factors such as sound, light, odors, and clinical conditions that affect blood
flow and oxygenation can influence NIRS recordings (Holsti et al., 2011).
Other biologic markers of pain might include changes in intracranial pressure
(measured through the anterior fontanel), thresholds for the dorsal cutaneous flexion
reflex or abdominal skin reflex, event-related potential (ERP) measured by detailed
electrical mapping, or neuroimaging techniques such as functional Magnetic Resonance
Imaging (fMRI) (Anand et al., 2006). Again, clinical feasibility of these methods is
limited.

31
Bispectral (BIS) index technology monitoring of sedation levels is used in
surgery, and has also been described in adult critical care patients, and, more recently, in
the Pediatric Intensive Care Unit (PICU) (Crain et al., 2002). BIS monitoring has been
validated in children over one year of age.
Developmental Changes in Pain Expression
Developmental changes in pain expression in infants and children occur with
maturation. The neonatal facial indicators of pain are involuntary and include brow bulge,
eye squeeze, stretched mouth, and taut tongue. Fuller posits that these expressions are not
as valid in the infant older than three months (Fuller & Conner, 1995). However, facial
expression is used as a pain indicator in all nonverbal populations, infants to adults. Older
infants and children are able to make facial expressions deliberately to elicit a response in
their caretaker. Vocalizations of infants seven months and older are more intentional and
more variable in pitch and intensity (Fuller & Conner, 1995). Researchers compared the
cries and facial expression in the response of premature, term, and two- and four-month-
old infants to painful procedures (Johnston et al., 1993). While two- and four-month-old
infants were similar, preterm and term infants showed significant differences in their
response. Preterm infants had higher pitched cries, inability to sustain facial distress, and
a more horizontally stretched mouth. Therefore it is important for the clinician to take
into consideration the age and developmental stage of the infant or child during pain
assessment.
Many infant pain behaviors are also observed and validated in nonverbal children
and adults. While crying is used as a pain indicator in infants and children, sounds of
distress such as groaning and moaning are indicators of pain in older children and adults.

32
Children age three and above with verbal abilities may be capable of expressing pain
more directly, although imprecisely. Behavioral pain assessment is abandoned when the
child is able to verbalize pain and, more specifically, pain intensity (McGrath et al.,
2008). Limited verbal skills place children at a disadvantage, unable to communicate
their pain directly (McGrath et al., 2008). Several pain assessment tools have been
developed that facilitate self-report of pain in children. The Wong and Baker FACES
Pain-Rating Scale, with seven faces indicating degrees of pain, is commonly used in
children around three years of age and older, in the absence of developmental disorders
(Wong & Baker, 1988). This pain scale has been tested in multiple populations. The scale
was researched and revised to include six faces (The Faces Pain Scale Revised, FPS-R),
with scoring from zero to five. The FPS-R was found to be appropriate for use in
assessment of the intensity of children’s acute pain from age four or five onward (Hicks,
von Baeyer, Spafford, van Korlaar, & Goodenough, 2001) . Other pediatric rating scales
utilize objects or symbols, such as poker chips that represent pain (von Baeyer &
Spagrud, 2007). Postoperatively, verbal pain expression is not possible until anesthetic
effects are minimal or absent. Therefore, behavioral pain assessment is used until verbal
self-report is possible.
Behavioral Indicators of Pain
Crying is a distress signal—a response by neonates, infants, and children—to both
acute and established pain (Craig, Gilbert, & Lilley, 2000; H. D. Hadjistavropoulos,
Craig, Grunau, & Johnston, 1994; Howard & Thurber, 1998; Krechel & Bildner, 1995;
Owens & Todt, 1984; Partanen et al., 1967; Ramelet, 1999; Ramelet, Abu-Saad, Bulsara,

33
Rees, & McDonald, 2006; Rich et al., 1974; Stevens et al., 2000; Van Cleve, Johnson,
Andrews, Hawkins, & Newbold, 1995). A “pain cry” is described as more persistent and
higher-pitched (Craig et al., 2000). Crying is frequently used in behavioral pain
assessment in the clinical setting as a sign of distress, while recognizing that crying has
limited specificity as a pain indicator (since infants and children sometimes cry for many
reasons other than pain). Older infants and children may verbalize pain by moaning or
groaning.
General behavior and sleep/awake state is assessed by observing body
movements, such as arching and kicking, and the ability to rest and sleep, indicative of
general comfort level (Beacham, 2004; Craig et al., 1993; Gedaly-Duff & Huff-Slankard,
1998; Grunau, Holsti, Whitfield, & Ling, 2000; Ramelet et al., 2006). Many behavioral
pain scales validated in various ages and populations include these signals of distress,
including the CHEOPPS (McGrath et al., 1985), FLACC (Merkel et al., 1997), NIPS
(Lawrence et al., 1993), CRIES (Krechel & Bildner, 1995), and the EDIN tool (Debillon
et al., 2001).
Facial expression as a behavioral expression of pain has extensive validity and
reliability testing (Craig et al., 2000). Facial changes indicative of pain include lowered
brows drawn together, bulge between brows, eye squeeze, nasolabial furrow, nose
broadened and bulging, cheeks raised, mouth open and squarish (Grunau & Craig, 1987;
Grunau, Oberlander, Holsti, & Whitfield, 1998; H. D. Hadjistavropoulos et al., 1994;
Johnston & Strada, 1986; Lilley et al., 1997). The cluster of facial activity associated with
pain is similar across infancy and in adults (Craig, Prkachin, & Grunau, 1992). One
neonatal pain assessment tool, the Neonatal Facial Coding System (NFCS), utilizes facial

34
expression only (Grunau & Craig, 1987). This tool has been widely used in the research
setting, usually employing videotape analysis, but has not been widely accepted for
clinical use, as it is difficult to score multiple pain expressions without the benefit of
videotaped replay (Grunau et al., 1998). The NFCS has been used widely in acute pain
intervention research. A computer program under development analyzes facial
expression, the Classification of Pain Expressions (COPE), using facial recognition
techniques to extract and examine the infant’s facial expression, reported to have > 90%
accuracy in initial testing (Brahnam, Chuang, Shih, & Slack, 2006). Further testing has
not been reported in the literature.
Observing the position of the extremities, fisting/clenching, finger splay, and
general tone of the body assists in evaluating comfort and relaxation, and is helpful in
assessing both acute and established pain (Bozzette, 1993; Craig et al., 1993; Fuller,
1998; Grunau et al., 2000; Johnston & Strada, 1986). Extremity movement and posturing
are used in nonverbal pain assessment tools used in various populations.
Infant behavioral pain indicators have also been validated in children and adults.
Pediatric nonverbal pain measures commonly include facial expression, extremity
movement, cry, consolability, behavioral state, muscle tone, and mechanical ventilation
tolerance (Ambuel et al., 1992; McGrath et al., 1985; Merkel et al., 1997).
Pediatric nonverbal pain indicators are similar to those used in infants (von
Baeyer & Spagrud, 2007). Facial expression, extremity movement, cry, compliance with
mechanical ventilation, and consolability are common indicators found in pediatric pain
assessment tools.

35
A child’s specific reactions to pain at any stage in life are the optimal adaptations
given the child’s experience and competence (Anand & Craig, 1996). Reactions to
aversive stimuli are essentially automatic in early life as infants are not able to process
information and control response to pain (T. Hadjistavropoulos & Craig, 2002). Pain
expression is increasingly shaped during the toddler and preschool years by the child’s
growing understanding of emotions and ability to anticipate outcomes and feelings. By
preschool age, children are developing an ability to feign, exaggerate, or suppress
outward signs of pain (von Baeyer & Spagrud, 2003). Children’s expression of pain is
influenced both by age and by social context. The child learns how others react to pain by
parental and professional interactions during common painful experiences, such as
bumps, bruises, scrapes, and immunization injections.
Pediatric pain assessment concerns infants over one month old, up to fourteen
years of age. Adult pain assessment scales are commonly employed over fourteen years
of age. Behavioral pain assessment in the adult population has achieved more recent
attention. Adult nonverbal pain assessment includes variations of the infant and pediatric
pain indicators. Indicators of pain used in adult nonverbal pain assessment commonly
include facial expression, compliance with ventilation, activity, limb movement, and
compliance with commands (Kabes, Graves, & Norris, 2009; Payen et al., 2001;
Prkachin, 2009). Vocalizations such as moaning or groaning are validated indicators in
the older children and adult populations (Bjoro & Herr, 2008). Facial expression, such as
grimacing and tension are also validated adult pain indicators (Aissaoui, Zeggwagh,
Zekraoui, Abidi, & Abouqal, 2005). Limb movement and compliance with ventilation are
common indicators in adult nonverbal pain assessment (Aissaoui et al., 2005).

36
Physiological Indicators of Pain
Vital sign changes are related to the autonomic stress response associated with
pain (Franck & Miaskowski, 1997). Heart rate increase is consistently documented as a
pain indicator (Butler-O'Hara, LeMoine, & Guillet, 1998; Cote, Morse, & James, 1991;
Craig et al., 1993; Dale, 1986; Gonsalves & Mercer, 1993; Johnston, Stevens, Yang, &
Horton, 1995; Johnston & Strada, 1986; McIntosh, Van Veen, & Brameyer, 1993; Owens
& Todt, 1984; Pereira et al., 1999; Stevens & Johnston, 1994; Taksande, Vilhekar, Jain,
& Chitre, 2005). Heart rate variability may also be a physiological indicator of pain.
Research with heel lance and with postoperative patients showed decreased variability
(Faye et al., 2010; Padhye, Williams, Khattak, & Lasky, 2009). Blood pressure and
respiratory rate increases above baseline in painful situations (Goldstein & Brazy, 1991;
Hamon, Hascoet, Debbiche, & Vert, 1996; Quinn et al., 1992). Blood pressure variations
may be less useful when obtained utilizing the blood pressure cuff rather than central
arterial monitoring, as obtaining a cuff blood pressure increases distress (Hudson-Barr et
al., 2002). Oxygen desaturation per pulse oximetry is observed in both acute and
established pain situations (Pokela, 1994; Taddio, Ohlsson, Einarson, Stevens, & Koren,
1998).
Skin conductance measurement has more recently been evaluated as an objective
approach to pain assessment (Harrison et al., 2006; Hullett et al., 2009; Munsters,
Wallstrom, Agren, Norsted, & Sindelar, 2012; Valkenburg, Niehof, van Dijk, Verhaar, &
Tibboel, 2012). This is measured by a device and is based on stress-induced sweating of
the palms of the hand or soles of the foot, as sweat glands are stimulated by sympathetic
activity with pain. Skin conductance measurement is not accepted for clinical practice
37
due to the wide range of reported sensitivity and specificity (Van Dijk & Tibboel, 2012).
Physiologic indicators of pain can be problematic with pain assessment, as variations in
these parameters occur with many disease states. Therefore, these indicators should not
be used alone, but as an adjunct to behavioral pain assessment (Herr et al., 2006; von
Baeyer & Spagrud, 2007).
Infant Nonverbal Pain Assessment Tools
Several behavioral pain measurement tools, developed over the past twenty years,
are currently used in research and the clinical setting. Pain assessment reviews concur
that pain assessment tools should be multidimensional as well as having evidence of
validity and reliability (Byers & Thornley, 2004; Duhn & Medves, 2004; Hummel & van
Dijk, 2006; von Baeyer & Spagrud, 2007). Most infant behavioral pain assessment tools
are designed for use in acute pain, while few are useful for ongoing or chronic pain
assessment.
Behavioral pain indicators are distress signals used in scoring the infant based on
the frequency and/or intensity of the behavior. Absence of pain behaviors does not ensure
that pain is not present, as some infants, such as those that are neurologically impaired,
are unable to mount a behavioral response (Bozzette, 1993; Johnston et al., 1999).
Premature infants have a limited ability to display and maintain behavioral or
physiological manifestations of pain (Craig et al., 1993; Johnston, Stevens, Yang, &
Horton, 1996; Stevens, Johnston, & Horton, 1994).
The Neonatal Facial Coding System (NFCS) was developed to monitor pain in
newborn infants, using only facial movements (Grunau & Craig, 1987). The NFCS was
developed and researched using videotaping which allowed for intensive slow motion

38
stop frame video coding and playback. Interrater reliability was acceptable (r = 0.82).
Construct validity has been supported in several studies, as the tool discriminates tissue
insult and non-tissue insult procedures, and differentiates infants receiving pharmacologic
treatment (Benini, Johnston, Faucher, & Aranda, 1993; Craig et al., 1993; Grunau et al.,
1998; Johnston et al., 1993; Johnston et al., 1995; Taddio, Katz, Ilersich, & Koren, 1997).
The NFCS has been widely employed in research but not in the clinical setting due to the
extensive training and scoring time needed to use this tool.
The Premature Infant Pain Profile (PIPP) tool (Stevens et al., 1996) was
developed and tested methodically, utilizing seven steps:
1. identification of the indicators through literature review and clinical observation
2. pilot testing of the indicators on a sample of 124 premature neonates 24-32 weeks
gestation undergoing a heelstick procedure
3. evaluation of the specificity and sensitivity of the indicators whereby an indicator
had to be present at least 50% of the time during the painful procedure but less
than 20% of the time during a nonpainful situation
4. determination of the factor structure of the indicators through factor analysis
where the three-factor solution with six-indicators yielded acceptable limits of
error
5. developing indicator scales based on the distributional characteristics of each
factor
6. providing evidence for internal consistency of the indicators through Cronbach’s
alpha calculation

39
7. establishing construct validity of the measure by scoring infants in painful versus
non-painful situations
The seven indicators in the PIPP tool include heart rate elevation and oxygen
desaturation, three components of facial activity, and two modifiers, gestational age and
pre-procedural behavioral state. PIPP scores range from 0-21. Factor structure was
explored on a data set of 124 infants of 32 to 36 weeks gestation. Six of these indicators
(gestational age was not included as it was a modifier that did not vary in the study) were
analyzed by principal component analysis to determine the underlying structure of the
data or indicator groupings. Indicators were retained if the commonality was at least 0.30
and a loading of 0.40 on any factor. Orthogonal rotations were examined for all factor
solutions. Factors with eigenvalues greater than one were retained, accounting for 78.3%
of the variance. Three factors—facial activity, physiological activity, and behavioral
state—were identified. Upper facial activity accounted for the majority (42.4%) of the
variance in the total score, while physiological activity explained 19.1% of the total
variance. Behavioral state accounted for 16.7% of the total variance. The six indicator,
three factor solution had a root-mean squared residual correlation of 0.040, within
acceptable limits of error.
Cronbach’s alpha for the PIPP was .71 for the total set of indicators. Initial
construct validity was assessed, finding that scores were different between heelstick (M =
12.9, SD = 3.4) and handling (M = 6.0, SD = 2.7), a significant difference by paired t test
(t = 12.24, p < .01). Construct validity was also tested by comparing a real heelstick to a
sham heelstick procedure; the mean PIPP score for the actual heelstick was higher than
for the sham procedure, (M = 10.3, SD = 4.5) and (M = 6.3, SD = 3.2), respectively.

40
These scores were significantly different (t = 2.4, p < .02). In addition, the PIPP was
tested with full-term infants during circumcision, comparing topical anesthetic and
placebo treatment. The mean PIPP score with the topical anesthetic was lower than in the
placebo group, (M = 11.8, SD = 2.7) and (M = 14.1, SD = 1.4), respectively. The
difference between the two groups was significant (t = 2.6, p < .02).
An additional study demonstrated construct validity and inter- and intra-rater
reliability for the PIPP tool in the clinical assessment of procedural pain of preterm and
term infants (Ballantyne, Stevens, McAllister, Dionne, & Jack, 1999). Interrater
reliability coefficients (.93-.96) were high. The PIPP tool has been widely employed in
pain management research but has not been widely adopted for use in the NICU, possibly
because the tool is designed for acute pain, while prolonged pain measurement is more
relevant in clinical care of the ill neonate (Hummel & van Dijk, 2006).
The Neonatal Infant Pain Score (NIPS) was also developed to assess
acute/procedural pain (Lawrence et al., 1993). The tool was developed through data from
a survey of forty-six experienced neonatal nurses at one Canadian hospital, and adapted
from a pediatric pain assessment tool. The initial scale of eight indicators was used by the
researchers to document responses to twenty needle-intrusive procedures. Two indicators,
facial color and torso movement, were deleted due to assessment difficulties. Six
behavioral indicators of pain—facial expression, cry, breathing patterns, arm movement,
leg movement, and state of arousal—are scored on either a two-point or three-point scale;
higher points are scored with an increase in intensity or quantity of the indicators. Ninety
procedures in thirty-eight infants were videotaped for analysis. A research assistant
scored the procedures, documenting scores before, during, and after the event. A random
41
sample of twenty videotaped procedures was also scored by one of the investigators.
Twenty-seven preterm and seventeen term infants were included, with an average
gestational age at birth of 33.5 (SD = 4.8) weeks at birth, and an average corrected age of
35.4 (SD = 4.1) weeks at the time of the first procedure. Interrater reliability was high,
with a Pearson’s correlation of two raters of twenty videotapes ranging from .92-.97 (p <
.05). A Repeated Measures ANOVA utilizing the total NIPS scores for twenty-two
infants undergoing a heelstick procedure revealed that the NIPS scores were significantly
different before (M = 1.1, SD = 2.2), during (M = 4.8, SD = 2.58), and after (M = 2.0, SD
= 2.09) the painful procedure (F(2.42) = 18.97, p <.01), providing evidence for construct
validity. Non-parametric Friedman test was also used to confirm the Repeated Measure
ANOVA evaluating the NIPS scores before, during, and after the painful procedure;
results were also significant (χ2
(2, N = 66) = 18.89, p <.01), suggesting construct
validity. Concurrent validity was explored by using Pearson’s correlations to compare the
Visual Analog Scale (VAS) with the NIPS during the procedure. The observer rated the
baby with the VAS by assigning a number from 0-10 to the infant’s behavior. The
correlations between the NIPS and VAS at each observation ranged from .53 to .84.
Internal consistency was calculated on the scores before, during, and after the procedure,
with Cronbach’s alphas of .95, .87, and .88. The NIPS tool has had scattered utilization,
again due to the low clinical need for routine procedural assessment in the neonatal
setting. Utilizing the VAS for concurrent validity is not currently acceptable, as the
raters’ assignment of one number on a 0-10 scale does not validate the more objective
itemized scoring in an acceptable manner. However, at the time of tool development, few
other objective tools were available for concurrent validity assessment.

42
The Crying, Requires oxygen, Increased vital signs, Expression, Sleepless
(CRIES) tool was developed through literature review and a survey of neonatal care
givers for ongoing postoperative pain assessment in infants (Krechel & Bildner, 1995).
The five indicators are scored 0-2 for a total maximum score of 10. Twenty-four infants
between thirty-two and sixty weeks post-conceptual age (mean age of forty-four weeks)
were enrolled. The infants were assessed hourly by two nurses, between twenty-four and
seventy-two hours postoperatively. The infant was judged subjectively by the nurse to be
in pain or not in pain. Secondly, each nurse evaluated the infant with the Objective Pain
Scale (OPS), a scale used with older children, and with the CRIES scale. Concurrent
validity was assessed by comparing the CRIES and OPS scores, with a Spearman Rank
Correlation Coefficient of 0.73 (p < .01). Discriminant validity was implied, as pain
scores were significantly lower following analgesic administration, with a decline in
CRIES score of 3.0 units, assessed by the Wilcoxon Sign Rank Test, (p<0.01). Interrater
reliability was acceptable, per Spearman correlation (r = 0.72, p < .01). The CRIES does
not appear to be valid for small premature infants. It was not tested in infants less than
thirty-two weeks, and the oxygen/pulse oximetry parameter of requiring oxygen to
maintain oxygen saturation > 95% is not inclusive of care standards for preterm infants.
Thus, clinical use in the NICU is limited.
The Echelle Douleur Inconfort Nouveau-Né neonatal pain and discomfort scale
(EDIN) was developed to assess ongoing pain in the premature infant (Debillon et al.,
2001). The tool was developed by videotaping infants with short- and long-term assisted
ventilation, necrotizing enterocolitis, and postoperatively following patent ductus
arteriosus surgical closure. Potential indicators were evaluated by a panel of physicians,
43
nurses, psychologists, and physiotherapists, who selected the indicators found to be
highly relevant and eliminating those difficult to observe clinically. The EDIN tool
utilizes five behavioral indicators of prolonged pain: facial activity, body movements,
quality of sleep, quality of contact with nurses, and consolability. The EDIN tool does not
contain any physiological criteria for evaluation. The indicator “quality of contact with
nurses” has poor content validity when applying the tool to extremely preterm infants
(Aranda et al., 2005). This indicator asks the rater to judge if the infant is smiling or
responding; preterm neonates do not socially interact routinely, particularly when their
eyes are fused or they are critically ill, causing researchers and clinicians to question the
validity of this indicator. Initial research was conducted in seventy-six preterm infants,
26-36 weeks (M = 31.5 weeks, range 26-36 weeks) gestational age. Inter-rater reliability,
calculated for each indicator, revealed moderate agreement—kappa coefficients ranging
from .59-.74. Internal consistency was high, with Cronbach’s alpha coefficients
calculated after deletion of each item ranging from .86-.94, and was .92 for the full scale.
Construct validity was supported by paired t-test when the scores before (M = 9.2 (SD =
1.7) and after (M = 4.7 (SD = 2.1) analgesic administration vs. were compared in forty
ventilated preterm infants. The standard error of the mean (SEM) difference was
significant (SEM = 4.4(0.4), CI (3.6, 5.2), p < .01). In thirty-six less critically ill infants
EDIN scores on admission day and the day before discharge were compared. The mean
score was significantly lower by paired t-test at discharge (M = 1.5, SD = 1.5) than at
admission (M = 4.5, SD = 3.7). The SEM difference was significant (SEM = 3.0 (0.5), CI
(2.0, 3.9), p < .01). This was interpreted by the authors as evidence of construct validity,
assuming that infants are in more pain on admission to the NICU than at discharge.

44
Parametric statistics were applied despite the fact that normalcy of the distribution is
questionable in this area of research. Non-parametric statistics should be used. The EDIN
tool has not been widely adopted, possibly due to poor content validity and limited
testing.
Pediatric Nonverbal Pain Assessment Tools
The Children’s Hospital of Eastern Ontario Pain Scale (CHEOPS) quantifies six
behaviors: cry, facial expression, verbal expression, torso position, touch, and leg
position, each on a scale of 0-3 (McGrath et al., 1985). This tool has been validated with
procedural and postoperative pain in children one to twelve years of age. Interrater
reliability was high, ranging from .90-.95. Concurrent validity for postoperative pain
assessment was moderate to high; correlations ranging from .56 to .90. The CHEOPS tool
has been judged to have sufficient psychometric testing to be used as an outcome
measure in pain research in various situations, including general surgery, closed fracture
reduction, bladder nerve stimulation, intravenous cannulation, sickle cell episodes,
circumcision, and immunizations (von Baeyer & Spagrud, 2007).
The FLACC (Face, Legs, Activity, Cry, Consolability) tool is a five-item scale
designed to assess postoperative pain in young children (Merkel et al., 1997). The tool
was developed with input from clinicians to provide a simple method for pain
assessment, as previous tools were found to be too lengthy and cumbersome for routine
clinical use. Eighty-nine children aged two months to seven years were observed
postoperatively in the Post-Anesthesia Care Unit. Initial psychometric evaluation of the
tool revealed high interrater reliability (.94, p <.01). Construct validity was suggested, as
preanalgesic scores (M = 7.0, SD = 2.9) were significantly higher than the postanalgesia

45
scores at ten minutes (M = 1.7, SD = 2.2), thirty minutes (M = 1.0, SD = 1.9), and sixty
minutes (M = 0.2, SD= 0.5) per ANOVA analysis (p <.01). Criterion validity was
supported; the FLACC showed a significant correlation with the Objective Pain Scale (r
= .80, p <.01). The FLACC tool has wide clinical use and has been used as an outcome
measure in multiple research studies of postoperative pain and minor noninvasive
procedures (McGrath et al., 2008).
Many instruments have been created to assess pain in nonverbal infants and
children. Some tools purport to assess acute pain, and some ongoing or prolonged pain.
Most are multidimensional, including five to seven indicators. All tools reviewed have
one published psychometric evaluation; few have been researched more than once.
Sedation Assessment Tools
Sedation is a concept less studied in the neonatal and pediatric population. A
literature search found that no neonatal sedation assessment tool was available for infants
prior to the N-PASS. The Cochrane review of sedative use in neonates recognized the
need for a validated neonatal sedation tool (Ng, Taddio, & Ohlsson, 2000). The N-PASS
is the sole sedation assessment tool available for use in preterm and term neonates.
Sedation assessment tools are a more recent addition to pediatric practice,
corresponding to the increased use of analgesics and sedatives over the past 20 years.
Items in pediatric sedation scales include level of consciousness, agitation, ventilation,
pain, psychological variables, muscle tone, and reaction to tracheal suction (Ista, van
Dijk, Tibboel, & de Hoog, 2005).
The Modified Glasgow Scale (MGS) evaluates level of consciousness, scoring the
best eye, verbal, and motor responses in the pediatric population (Reilly, Simpson, Sprod,
46
& Thomas, 1988). The MGS is used regularly in the emergency room setting, but is not
widely used clinically for sedation assessment, as it was not designed to evaluate the
level of consciousness associated with medication administration.
The State Behavioral Scale (SBS) was developed to provide systematic
description of the sedation-agitation continuum in pediatric patients ages six weeks to six
years old supported on mechanical ventilation (Curley et al., 2006). Indicators of sedation
and agitation included in this scale are respiratory drive, response to ventilation,
coughing, best response to stimulation, attentiveness to care provider, tolerance to care,
consolability, and movement after being consoled. A total of ninety-one intubated and
mechanically ventilated patients six weeks to six years of age provided a median of two
observations for a total of 198 sets of observations. Patients were observed for one
minute, and then incremental levels of stimulation were applied until patient response.
After two minutes of consoling, the SBS assessment and a numeric rating system (NRS)
were completed. Weighted kappa scores for all 198 dimension ratings ranged from .44 to
.76, indicating moderate to good interrater reliability. The intra-class coefficient of .79
was acceptable. Cluster analysis revealed five distinct state profiles which grouped
behaviors into score clusters, indicating five states ranging from deep sedation through
agitation, with mean ratings of 1.1, 2.5, 4.0, 5.3, and 7.6, all of which differed
significantly from each other (F = 75.8, p < .001), supporting the profile’s construct
validity.
The University of Michigan Sedation Scale (UMSS) is a one item observational
tool that scores the patient’s responsiveness to stimulation as a measure of sedation
during procedures (Malviya et al., 2002). Thirty-two children four months to five years of

47
age were scored, following sedative administration, every ten minutes with the UMSS
and two other sedation assessment tools, the Visual Analog Scale (VAS), and the
Observer’s Assessment of Alertness/Sedation Scale (OASS), which had not been tested
in the pediatric population. The assessments were also videotaped for further analysis.
Change in scores from baseline to discharge supported construct validity (p < .01).
Criterion validity was supported as correlation with the VAS and OASS were .96 (p <
.01) and .93 (p < .01). Inter-rater reliability ranged from .47 to .97 at the various levels of
sedation and among four blinded observers. Test-retest reliability showed .67 agreement
between repeated observations. Furthermore, UMSS scores have been shown to be
sensitive and specific in determining return to baseline level of alertness and discharge
readiness after sedation (Malviya, Voepel-Lewis, Ludomirsky, Marshall, & Tait, 2004).
Data regarding the tool’s reliability in differentiating moderate to deep sedation are
limited.
An example of a commonly used adult sedation assessment tool is the Richmond
Agitation-Sedation Scale (RASS); it has not been studied in the pediatric population.
Similar to pediatric sedation tools, behavior is graded on a scale of combativeness to deep
sedation (Sessler et al., 2002). Interrater reliability was high, ranging from .92-.98. The
RASS also correlated significantly with other sedation measures, .75 to .93. In other
research, the RASS correlated significantly with Bispectral Index Scoring, (r = .90, p
<.01), supporting its validity (Turkmen, Altan, Turgut, Vatansever, & Gokkaya, 2006).
Tools that Assess Pain and Sedation
The COMFORT tool was developed as a measure of behavioral and physiologic
factors, assessing distress in the Pediatric Intensive Care Unit (PICU) (Ambuel et al.,

48
1992). Indicators were selected based upon literature review and a survey of PICU
nurses. The COMFORT scale assesses distress; the indicators assess pain or
sedation/agitation. Indicators include level of consciousness which is an indicator of
sedation. Other indicators included are facial grimacing, muscle tone, physiological
values, and level of agitation; these are more indicative of pain but could also indicate
sedation. Principal components analysis revealed two correlated factors, behavioral and
physiologic, accounting for 84% of the variance. Criterion validity was assessed by
correlation of the COMFORT score to a global rating given by the bedside nurse (.75).
Internal consistency was acceptable, with Cronbach’s alpha at .84.
The COMFORT scale was more recently evaluated for evidence of reliability and
validity as a postoperative pain instrument in newborn to three-year-old children (van
Dijk et al., 2000). The COMFORT scale was evaluated in 158 neonates and toddlers
(newborn to three years old) postoperatively in a PICU. Interrater reliability ranged from
.63 to .93 in this study. Criterion validity of the COMFORT scale was supported by a
high correlation (.92) between the observed Visual Analog Scale and the COMFORT
scores. The COMFORT tool has been widely adopted in the PICU setting and has been
used in studies of heart surgery pain, positioning and oxygenation interventions, and
mechanical ventilation interventions.
An observational study examined the behaviors of twenty sedated, mechanically
ventilated children, ages one month to fourteen years, using the COMFORT scale, and
observing for body and facial movements, behavior state, and environmental activity
(Grap, Pickler, & Munro, 2006). Children were observed to be at minimal levels of
sedation on the COMFORT scale but the subjects still displayed body and facial

49
movement. The authors concluded that further investigation of existing sedation
measures as well as the development of more sensitive measures of sedation in children is
warranted.
The Neonatal Pain, Agitation, and Sedation Scale (N-PASS) was developed by
this author with two subscales, pain/agitation assessment and sedation level assessment,
for infants born at twenty-three weeks gestation to term, and studied up to 100 days age
(Hummel et al., 2008). The N-PASS was designed in the year 2000 as a clinical tool for
all infants in the NICU. The literature review revealed many validated pain and sedation
behaviors, as well as many validated pain assessment tools. A tool to assess prolonged
pain in the neonate, and a valid neonatal sedation assessment tool were not found in the
literature.
The N-PASS was developed based upon the Onion Theory of Pain. Observable
pain behaviors are due to the suffering that occurs with a painful stimulus. Observable
sedation behaviors are due to the changes in the central nervous system following
medication administration.
The author observed infants in the clinical setting for over twenty years, yielding
a list of empirically derived pain and sedation behaviors. Based on these behaviors, and
the literature review that showed that there were no tools to measure prolonged pain in
neonates, the N-PASS tool was developed. Expert opinion from experienced NICU
nurses was obtained, and the tool was modified based on clinical applicability and ease of
assessment. The N-PASS items that these experts believed best represented neonate pain
and sedation behaviors were retained.

50
The scale was developed with a range of 0 to 10, as this is consistent with the
tools used for children and adults in the institution (VAS and FLACC). Five criteria are
graded 0, 1, or 2 for pain/agitation and 0, -1, or -2 for sedation; pain scores are indicated
by a positive number, sedation scores by a negative number. A high pain/agitation score
indicates more frequent or intense behaviors, and a low sedation score indicates a
decreased response to stimulation, or a deeper level of sedation. See Appendix A and
Figure 4 for the N-PASS tool.
One to three points were added to the preterm infant’s pain score due to their
limited ability to display and maintain behavioral or physiological manifestations of pain,
approximating the normal response of a full-term infant (Craig et al., 1993; Johnston et
al., 1996; Stevens & Johnston, 1994). Gestational age categories and points assigned
were initially based on the PIPP tool categories (Stevens et al., 1996). Corrected
gestational age determines the number of points added to the score, with less mature
infants receiving a higher baseline score than more mature infants. These points for
prematurity were modified after the two research studies, as the preterm infant was found
in both studies to respond less than the full term infant, but only by about one point. The
sedation score does not require this adjustment as gestational age is not known to affect
the premature infant’s ability to exhibit signs of sedation.
Five indicators are included in the N-PASS, chosen for evidence of validity,
clinical applicability, and ease of assessment: 1) crying/irritability, 2) behavior/state, 3)
facial expression, 4) extremities/tone, and 5) vital signs (heart rate, respiratory rate, blood
pressure, and/or oxygen saturation). Within each category, examples of criteria are
provided to assist in the assignment of a numerical value.

51
The pain assessment portion of the N-PASS is labeled “pain/agitation” due to
clinical difficulties in differentiating these two entities behaviorally, particularly in
prolonged or chronic pain situations. Although researchers have attempted to categorize
behaviors into “typical of pain” and “typical of agitation,” many commonalities exist,
such as crying, facial expression, and ability to console (Ramelet, 1999). An infant who
appears to be in pain or agitated should be evaluated within the context of the situation in
an attempt to determine causality for the behavior, guiding treatment. This is consistent
with the modified Onion Theory of Pain and Sedation.
Formatting the N-PASS using the same criteria to assess both pain/agitation and
sedation allows evaluation of the infant on a theoretical continuum, ranging from deeply
sedated, to lightly sedated, to normal, to mild pain/agitation, to severe pain/agitation.
Despite this theoretical continuum, pain and sedation must be evaluated and scored as
separate entities since both can occur simultaneously, although it is recognized that
increasing levels of sedation may mask the infant’s response to pain (Alexander &
Todres, 1998). Clinically, infants that become sedated due to analgesics are not likely to
be in pain, but pain may be masked by sedative administration. Sedation behaviors and
neurological depression behaviors are similar, and neurological irritability and pain
behaviors are similar, highlighting the difficulties with pain and sedation assessment in
an infant with an abnormal neurologic status.
Initial investigation of the N-PASS with prolonged pain was accomplished in the
clinical setting. Ventilated and/or postoperative infants with prolonged pain (not
acute/procedural pain) were evaluated before and after pharmacologic intervention.
Infants received an opioid and/or a sedative, based upon standard unit practices.

52
Morphine was administered by bolus in the majority of infants to achieve analgesia
and/or sedation. Lorazepam was administered when the clinical goal was sedation. The
N-PASS tool was independently and concurrently administered on an infant with a pain
score over three, when two data collection nurses were present. The infant was observed
for 5-10 minutes before and one hour after analgesic and/or sedative administration. One
nurse also administered the PIPP tool concurrently with the N-PASS.
Inter-rater reliability was high, measured by intra-class coefficients (ICC) of .85-
.95 (p <.01). Criterion validity was demonstrated by correlation with the PIPP scores
(Spearman rank correlation coefficient of .83 at high pain scores, .61 at low pain scores).
The lower correlation of the lower pain scores is due to the fact that the PIPP tool is
designed to measure acute/procedural pain where infants react less when the procedure is
started when they are sleeping, and therefore adds points for the sleeping infant. The N-
PASS assigns lower scores for the sleeping infant.
Internal consistency, measured by Cronbach’s alpha, was evident at high pain
scores (.82), and with high and low sedation scores (.87, .89). At low pain scores, internal
consistency was lower (.31). This is due to the fact that the majority of the post-
intervention pain scores were zero, resulting in limited variability of scores for internal
consistency evaluation. Construct validity was assessed via the Wilcoxon Signed-Ranks
Test, comparing the distribution of N-PASS scores before and after pharmacologic
intervention showing pain scores of (M = 4.86, SD = 3.38) and (M = 1.81, SD = 1.53), (p
< .01), and sedation scores of (M = -0.85, SD = 1.66) and (M = -2.78, SD = 2.81), (p <
.01), for pre- and post-intervention assessments, respectively.

53
The pain/agitation subscale of the N-PASS was also researched with
acute/procedural pain (Hummel et al., 2010). The N-PASS was studied with routine
heelstick procedures in the NICU, compared to a sham heelstick procedure in a
prospective psychometric evaluation with a randomized crossover design. The bedside
nurse randomly determined the order of events through coin toss. A researcher and a
trained staff nurse scored the infant with both the sham and real heelstick procedures
utilizing the N-PASS tool. One observer also scored the infant using the PIPP tool. Each
infant was assessed prior to and during each procedure. The observers were trained in the
use of both tools. When scoring the both tools, the raters were instructed to watch the
entire procedure, then score utilizing the N-PASS and PIPP.
An infant blanket or screen was placed over the incubator or crib, obstructing the
view of the lower half of the baby’s body, in order to blind the observers to the
procedure, while still allowing the bedside nurse to perform the procedure without
additional stress to the infant. Videotaping included the upper half of the infant’s body
only, to maintain blinding of the observer with scoring of the actual versus sham
heelstick.
The sham heelstick consisted of the nurse holding the foot as if doing a heelstick,
wiping the heel gently with a dry 2x2 gauze, and holding the heel in place for at least 30
seconds. No lancing, squeezing of the heel, or alcohol/other prep was allowed with the
sham procedure. The blood collection supplies were used as if in an actual heelstick, but
no blood was obtained. The actual heelstick consisted of the standard NICU procedure of
holding the foot in the usual position, prepping and collecting blood.

54
The second procedure, whether real or sham, occurred after the infant was quieted
following the first procedure. The interval between procedures was between five and ten
minutes. The observers watched the infant’s behavior and monitored vital signs to enable
scoring with the N-PASS and the PIPP tools. The assessment occurred before any
intervention (baseline) and was repeated with each of the real and sham heelsticks. The
order of the procedure was randomized by coin toss. Thirteen heelstick and sham
procedures were videotaped with parental consent to enable intra-rater reliability (test-
retest) analysis.
Discriminant (construct) validity was evaluated via the Wilcoxon Signed-Ranks
Test, comparing the distribution of the heelstick and sham N-PASS scores, hypothesizing
that the score would be higher with the actual heelstick than with the sham heelstick. Pain
scores differed significantly for the heelstick and sham procedures (M = 3.93, SD = 2.30)
and (M = 0.81, SD = 1.21), respectively, (z = -6.429, p < .01). Convergent validity was
demonstrated by correlation with the PIPP scores (Spearman rank correlation coefficient
of .75 and .72 for raters 1 and 2, respectively). Inter-rater reliability was high, measured
by intra-class coefficients; the ICC estimates (95% C.I.) of the pain scale were .86 (.78,
.92) and .93 (.88, .96) for a single rating and average of two independent ratings,
respectively (p < .01). Internal consistency, measured by Cronbach’s alpha, was evident
(.84-.89). Test-retest reliability was demonstrated by repeat scoring of videotaped
heelsticks, measured by Spearman’s rho correlation (.87, p < .01). The N-PASS scores
were compared between the group of infants receiving the heelstick first (n = 28) as
compared with those receiving the sham procedure first (n = 31) using the Mann-Whitney

55
U-test. The mean ranks were not significantly different, (28.74 and 29.43), respectively (z
= -0.114, p = .91).
European researchers evaluated the association between an empathy-based Faces
Pain Scale Revised (FPS-R) and the item-based N-PASS tool when used to assess
prolonged distress in term and preterm infants (Garten et al., 2010). Sequential
evaluations of distress were done at four-hour intervals during a forty-eight hour time
period. The two scales were used in parallel in forty-four term and preterm infants. When
infants were categorized as being in distress or not, the rate of agreement between the two
tools showed little variation (79.6 to 89.4%).
The N-PASS tool has been widely adopted for use in the NICU, with over 350
units currently utilizing this tool in the United States and internationally. The N-PASS
has been translated into several languages, and is beginning to be used in research. See
Appendix A for the N-PASS tool.
Analysis of Research
Nonverbal pain assessment has focused on behavioral indicators due to the lack of
a valid and specific biologic marker for pain. Initially, research was accomplished by the
developmental psychology discipline. Nurses have become leading researchers in pain
assessment, creating nearly all of the current neonatal/infant pain assessment tools.
Pharmacy and medical disciplines have also contributed to neonatal pain assessment
research.
Neonatal pain assessment research has evolved over the past fifty years due to
changes in underlying assumptions. Initially, researchers believed that neonates do not
use their cerebral cortex. Thus, when the researcher observed the neonate with a pinprick

56
and saw a non-specific and generalized response, the interpretation was that the infant did
not feel pain. The paradigm has shifted: the current view is that neonates have an active
cortex and are capable of cortical input and output. With the revised paradigm, based on
improved neuroscience data, researchers observe the neonate during a painful situation
and view the behaviors as signals of pain. Researchers also now understand that repeated
painful experiences may contribute to abnormal cortical development and to an altered
response to pain. Pain assessment and management research ultimately should contribute
to improved patient outcomes.
Neonatal and pediatric behavioral pain assessment has progressed rapidly in the
past twenty years. Assessment tools have been developed by nurses, mainly using
empiric observations of behaviors during a painful procedure or postoperatively, by
surveying experienced nurses, and by literature review. Multiple tools were designed for
acute/procedural pain; few were designed for use in ongoing pain, such as postoperative
pain and mechanical ventilation. Clinically, tools that are less cumbersome have become
more widely used. Pain management research has increased, incorporating pain
assessment tools as outcome measures.
Psychometric evaluation of these tools is an evolving process. Historically, tools
were created and used without validity and reliability evidence, not acceptable by current
standards of evidence-based practice. Pain assessment tools have been validated with
acute procedural pain by comparing scores during the procedure to scores before the
procedure or during a sham procedure. Validation of tools with ongoing pain has been
accomplished through comparing scores before and after an analgesic intervention.
Validity evidence is also assessed by comparing scores of a newer tool to a tool with

57
evidence of validity measuring the same inferred variable, which assumes that the
criterion tool shows evidence of validity. Reliability is assessed by having two nurses
score the subject simultaneously, giving inter-rater reliability, and through repeated
scoring of a videotape, giving intra-rater reliability. Internal consistency is reported with
all psychometric evaluations.
Precise evaluation of validity could be accomplished if valid and reliable biologic
pain and sedation markers were available. In the absence of a biologic marker, validity
testing will continue unchanged. Repeated psychometric evaluation of pain assessment
tools in various populations and settings adds to the ongoing process of evaluating
validity and reliability evidence of any tool. There is no gold standard of behavioral pain
and sedation assessment methodology, or of the rigor of the psychometric evaluation of
the assessment tools.
Sedation assessment is less developed in the neonatal and pediatric populations,
despite the accepted use of analgesics and sedatives in these populations. Development
and psychometric evaluation of sedation assessment tools has followed the
methodologies of pain assessment tools. There is a potential to study validity for sedation
assessment tools in the pediatric population through the use of BIS monitoring, a biologic
marker of sedation levels used in the clinical setting.
Gaps in Knowledge
The search for a biologic marker for pain should continue. In the absence of a
biologic marker, objective validation of behavioral pain indicators is lacking. Pain
assessment in neurologically abnormal infants and during neuromuscular blockade
remains difficult in the clinical setting. Pain assessment has been widely studied in acute

58
pain; chronic pain assessment research is necessary for clinical use, as well as when
researching chronic pain management strategies. Pain assessment tools currently used
should be researched more extensively, in various situations and populations.
There is currently no tool available to assess both pain and sedation in nonverbal
children. The N-PASS requires testing in older populations, to determine appropriate use
of the tool. Following this, the N-PASS tool could be modified for use in pediatrics and
subjected to psychometric evaluation utilizing the same methodology as was used in the
neonatal population.
This research, testing the N-PASS tool in populations of older infants and
toddlers, is necessary for expanded clinical use of the tool. The NICU population
occasionally includes infants with long stays, up to twelve months of age in some units.
Testing the upper limits of age use for the N-PASS tool is necessary before modifying the
tool for use in the pediatric population. Testing the instrument in children up to thirty-six
months of age is warranted, as behavioral pain assessment is utilized on all children of
this age span, while children over thirty-six months of age may be able to provide self-
report of pain verbally or through other measures.
59
CHAPTER THREE
RESEARCH METHODS
This chapter describes the research design, setting, target population, sample,
sample size, ethical considerations, data collection procedures, measures, and method of
data analysis.
Research Design
This study was a prospective, non-experimental psychometric evaluation of the
Neonatal Pain, Agitation, and Sedation Scale (N-PASS). The primary goal of this study
was to evaluate the internal consistency and validity evidence of the N-PASS tool in
infants and preverbal toddlers aged one to thirty-six months in the Post-Anesthesia Care
Unit (PACU). This setting allows for multiple sequential observations of subjects that are
experiencing sedation and pain.
Setting
This study was conducted at a university-affiliated medical center located in
Illinois. This facility is a private, not-for-profit comprehensive academic medical center
with 592 licensed beds, including a Level 1 trauma center and a Children’s Hospital. The
Post-Anesthesia Care Unit (PACU) is a 40-bed unit that cares for adult and pediatric
patients directly from the operating room until discharge to the inpatient unit or
outpatient surgery center.

60
Population
The target population for this study was infants and toddlers aged one month to
thirty-six months of age who have received general anesthesia, who are
recovering in the PACU. Over 300 pediatric surgeries are completed yearly in this
institution. The surgical sub-specialties include general pediatric, cardiac,
otolaryngology, orthopedic, or urologic surgeries. Subjects that were transferred from the
operating suite immediately to an inpatient unit for recovery are not included.
Sample
The target population was described in the previous section. A non-probability
convenience sample was obtained. The study sample inclusion criteria were as follows:
1) postoperative admission to the PACU and 2) age at one month to thirty-six months old.
Exclusion criteria were as follows: 1) brain injury, suspected or confirmed; 2)
neuromuscular disease with abnormal baseline neurologic status; or 3) neurosurgical
intervention.
Participants meeting the criteria were identified weekly via the surgical schedule
by the PACU nursing manager. This participant list was given to the researcher, who
collected data based on the availability of the researcher. The PACU nursing manager
estimated that two to eight subjects would meet the criteria for inclusion each week. The
manager retrieved the information from the surgical schedule which is available in the
electronic medical record. The potential subject information included the name, age,
gender, diagnosis, surgical procedure, and the surgical procedure schedule. The
information was transmitted electronically to the investigator via a password protected
electronic mailbox. The name of the subject was used only to assure that the investigator

61
was collecting data on the planned participant, and was kept in a locked data collection
file.
Sample Size
Power analysis was based on the ANOVA analysis as the primary analysis. The
sample size calculation was based on the possibility of obtaining a medium correlation
effect size (r = .38) with at least 80% power with a two-tailed p of <0.05. This requires a
sample size of forty participants. A sample size of eighty-four participants provided the
possibility of detecting a smaller effect size (r = .30). A sample size of 100 provided the
possibility of detecting a slightly smaller effect size (r = 0.28) with at least 80% power
(Osborne & Costello, 2004).
A sample size of forty subjects was planned for this research, based on a
minimum of ten observations for each subject. Initial psychometric evaluation of the N-
PASS tool with prolonged pain revealed an effect size of r = .42. Psychometric evaluation
of the N-PASS tool with acute pain revealed an effect size of r = .65. Since this research
included subjects experiencing both acute and prolonged pain, a sample size of forty
subjects was adequate.
Data from several earlier studies of pain and sedation assessment tools indicate
that sample sizes of thirty to forty-five are used, sometimes collecting several data sets
for each subject (Curley et al., 2006; Debillon et al., 2001; Lawrence et al., 1993; Merkel
et al., 1997; Stevens et al., 1996).
Ethical Considerations
This study was guided by both ethical and legal considerations. Consideration for
the protection of the interests of subjects, the supporting facility, and the principal

62
investigator were incorporated. Confidentiality of identity and information, and
protection of the research subjects against physical, mental, or emotional injury were
maintained. Approval from the Medical Center Institutional Review Board was obtained.
Consultation with the director of the Human Research Protections Program confirmed
that informed parental consent was not required due to the observational nature of the
research. Nursing and medical student observation of care is a frequent phenomenon in
the academic medical center. The research was explained to the parent by the nursing
staff during the admission procedure. The nurse explained that the investigator would be
observing the subject continually during the PACU stay, and would be recording
observations regarding the infant’s pain and sedation behaviors, and that the
investigator’s observations would not influence the care of the subject. Observation and
data collection were planned to not occur if the parents expressed objections to the
process.
The unit nursing and medical management teams were informed, and their
suggestions were incorporated into the design and data collection plan. Suggestions
included feasibility of subject recruitment and education of the nursing staff. The nursing
staff was in-serviced in person during staff meetings, and the researcher contacted the
nurse prior to the admission procedure, with a reminder to discuss the research with the
subjects’ parents.
The researcher observed the participant without interfering in the usual care and
monitoring. The researcher did not interfere with the care, or give suggestions about the
monitoring or care. The researcher answered parental questions regarding the research as

63
these arose. Data collection was planned to be terminated if the parent expressed any
reluctance or objections to the process.
Data entry was confidential, and completed solely by the investigator. Data files
were maintained in a password-protected directory of a personal computer located at the
investigator’s private residence. The participants’ name and medical record number were
not in the data file. Demographic data collected included date of birth, age in months,
gender, diagnosis, and surgical procedure. Accuracy of data entry was assured as data
were cleaned of errors by the investigator and also by statistical support staff by visual
inspection and by running descriptive statistics.
Risks and Benefits
The parent(s) could experience additional stress due to the investigator’s presence
and documentation. However, it was not anticipated that this would be experienced by a
significant number of parents. Data collection was planned to not be initiated or to be
terminated if the parent expressed distress or discomfort due to the investigation. There
was no risk to the participants, as the investigator was collecting observational data only.
The potential risks of this study were outweighed by the anticipated benefits. Pain
and sedation assessment tools with evidence of reliability and validity are essential to the
safe care of the patient in the PACU.
Data Collection
Data collection began on 06/04/2013 upon Institutional Review Board approval.
The researcher administered the N-PASS and the gold standard instruments, the FLACC
and the UMSS, every five minutes following admission to the PACU, for a minimum of
ten observations or until discharge from the PACU. The assessments were documented

64
on data collection sheets (Appendix B). See Appendix A for the FLACC tool and the
UMSS tool. Participant recruitment and data collection continued until the sample size
was achieved. Data collection was completed on 12/16/2013.
Measures
In addition to the N-PASS tool, the FLACC (Merkel et al., 1997) and the UMSS
(Malviya et al., 2002) were used in this study. The psychometric evaluation of these
measures was discussed in Chapter Two. See Appendix A for the FLACC and UMSS
tools. In addition, the subjects’ heart rate as displayed on the cardiac or pulse oximetry
monitor was recorded with every observational scoring.
Data Analysis
The primary objective of this research involved testing of the internal consistency
and validity of the N-PASS tool. Data analyses included descriptive statistics of the
sample data, evaluations of reliability through internal consistency, and construct and
criterion validity assessments. Validity evidence was also examined through an analysis
of how the N-PASS scores change over time. The analysis also permitted a test of the
value of the tool in the evaluation of readiness for discharge from the PACU. The factor
structure of the N-PASS tool was examined. SPSS version 20.0 was used as the statistical
software for analysis.
Descriptive Statistics
Descriptive statistics provide an overall picture of the sample. Demographics
included age in months, gender, and surgical procedure. This information was
summarized through means and standard deviations for interval level data. Frequencies
were used to summarize nominal level data.

65
Reliability
The first research question, “Do the N-PASS tool subscales of sedation and
pain/agitation exhibit internal consistency as measured by Cronbach’s alpha?” was
answered by using Cronbach’s alpha analysis (Cronbach, 1951). The N-PASS
pain/agitation and the N-PASS sedation subscales were analyzed separately for internal
consistency.
Inter-rater and test-retest reliability of the N-PASS tool was not researched as this
has been estimated in two previous studies. This information was discussed in Chapter
Two. Data collection for this research was accomplished with one observer, the
researcher.
Criterion Validity
The second and third research questions, “Does the N-PASS tool exhibit criterion
validity when the sedation subscale is compared to the UMSS instrument?” and “Does
the N-PASS tool exhibit criterion validity when the pain/agitation subscale is compared
to the FLACC instrument?” were answered by using correlation statistics. Criterion
related validity describes the empirical association of an instrument in relation to some
criterion or gold standard. It assesses the practical nature rather than the theoretical nature
of an instrument (DeVellis, 2003). The most widely used pediatric pain assessment tool is
the FLACC tool (Merkel et al., 1997), considered the gold standard tool (McGrath et al.,
2008). No gold standard tool has emerged for pediatric sedation assessment; the UMSS
has the most extensive testing and appears to be the most widely used in the pediatric
population (Malviya et al., 2002).
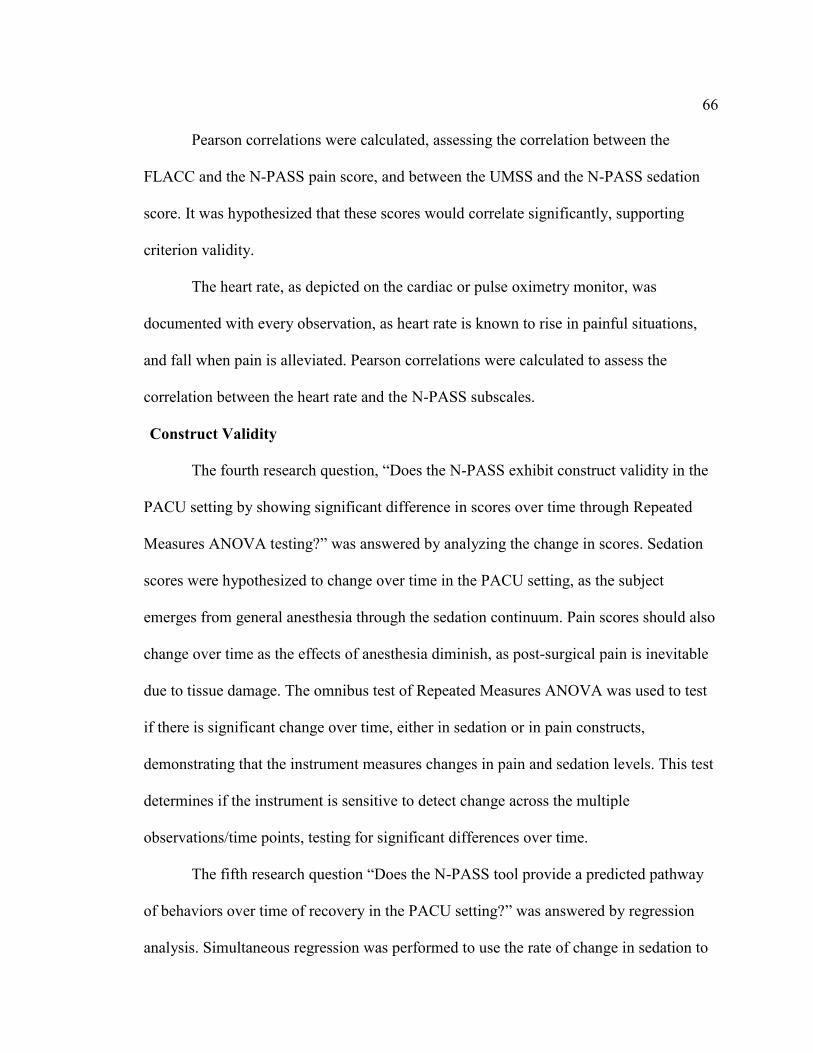
66
Pearson correlations were calculated, assessing the correlation between the
FLACC and the N-PASS pain score, and between the UMSS and the N-PASS sedation
score. It was hypothesized that these scores would correlate significantly, supporting
criterion validity.
The heart rate, as depicted on the cardiac or pulse oximetry monitor, was
documented with every observation, as heart rate is known to rise in painful situations,
and fall when pain is alleviated. Pearson correlations were calculated to assess the
correlation between the heart rate and the N-PASS subscales.
Construct Validity
The fourth research question, “Does the N-PASS exhibit construct validity in the
PACU setting by showing significant difference in scores over time through Repeated
Measures ANOVA testing?” was answered by analyzing the change in scores. Sedation
scores were hypothesized to change over time in the PACU setting, as the subject
emerges from general anesthesia through the sedation continuum. Pain scores should also
change over time as the effects of anesthesia diminish, as post-surgical pain is inevitable
due to tissue damage. The omnibus test of Repeated Measures ANOVA was used to test
if there is significant change over time, either in sedation or in pain constructs,
demonstrating that the instrument measures changes in pain and sedation levels. This test
determines if the instrument is sensitive to detect change across the multiple
observations/time points, testing for significant differences over time.
The fifth research question “Does the N-PASS tool provide a predicted pathway
of behaviors over time of recovery in the PACU setting?” was answered by regression
analysis. Simultaneous regression was performed to use the rate of change in sedation to

67
predict time of discharge. Regression is used to predict a continuous dependent variable
by a continuous independent variable. The hypothesis was that the faster a child’s
sedation decreases, the sooner they will be discharged. Assuming a linear trend to the
data, slopes were created by calculating change scores by subtracting difference score =
V1-V2. These calculated slopes may predict time in the PACU and assist in determining
the optimal time of discharge from the PACU.
Factor analysis. The sixth research question, “what is the factor structure of the
N-PASS tool?” was examined through Principal Axis Factoring (PAF). PAF separates the
variance in items into common variance, which is predicted by the latent variables. PAF
also separates the variance in items into unique error variance, which is unrelated to the
latent variable. It was hypothesized that the N-PASS has two latent factors, one that
represents the underlying spectrum of pain and one that represents sedation. PAF analysis
was conducted at three different time points to determine if the same factor structure is
found repeatedly over time.
Methods Summary
Reliability and validity evidence of the N-PASS tool were obtained using a
sample of infants and children aged one to thirty-six months in a PACU setting. One
observer, the researcher, scored the subjects every five minutes using the N-PASS tool
along with the FLACC and UMSS tools. The heart rate was also recorded at each
observation point.
Reliability was tested through internal consistency evaluation. Validity was tested
using criterion validity and Repeated Measure ANOVA. Regression analysis was used to
determine if discharge could be predicted by the change in sedation scores over time.

68
Factor structure of the N-PASS was explored through PAF. The results of these analyses
are presented in the next chapter.

69
CHAPTER FOUR
RESULTS
The purpose of this study was to test an assessment tool designed to evaluate pain
and sedation in infants and children one to thirty-six months age. This chapter includes
the results of the psychometric evaluation of the N-PASS tool in this population.
Sample
A convenience sample was obtained. Forty subjects, ranging in age from three to
thirty-five (M = 19.25, SD = 10.84) months of age, were enrolled during their stay in the
Post-Anesthesia Care Unit (PACU) at a large Midwestern medical center. The subjects
were observed postoperatively during recovery following general anesthesia. Fourteen
subjects (35%) were female, twenty-six (65%) were male. Otolaryngology surgical
procedures were the most common at nineteen (48%). These procedures included
adenoidectomy, pressure equalization (PE) tube insertion, neck mass resection, and
tonsillectomy. Urologic procedures such as circumcision or circumcision revision and
ureteral re-implant procedure accounted for nine (22%). Other surgical procedures were
the remainder, eleven (28%), e.g., inguinal hernia repair and umbilical hernia repair. One
subject underwent an orthopedic procedure (open reduction of a fractured arm).
All subjects were recovering from general anesthesia, and 50% of the urologic
and general surgical subjects received local or regional anesthesia. Operating room time
ranged from 35-245 minutes (M = 88, SD = 36). Time in the PACU setting ranged from
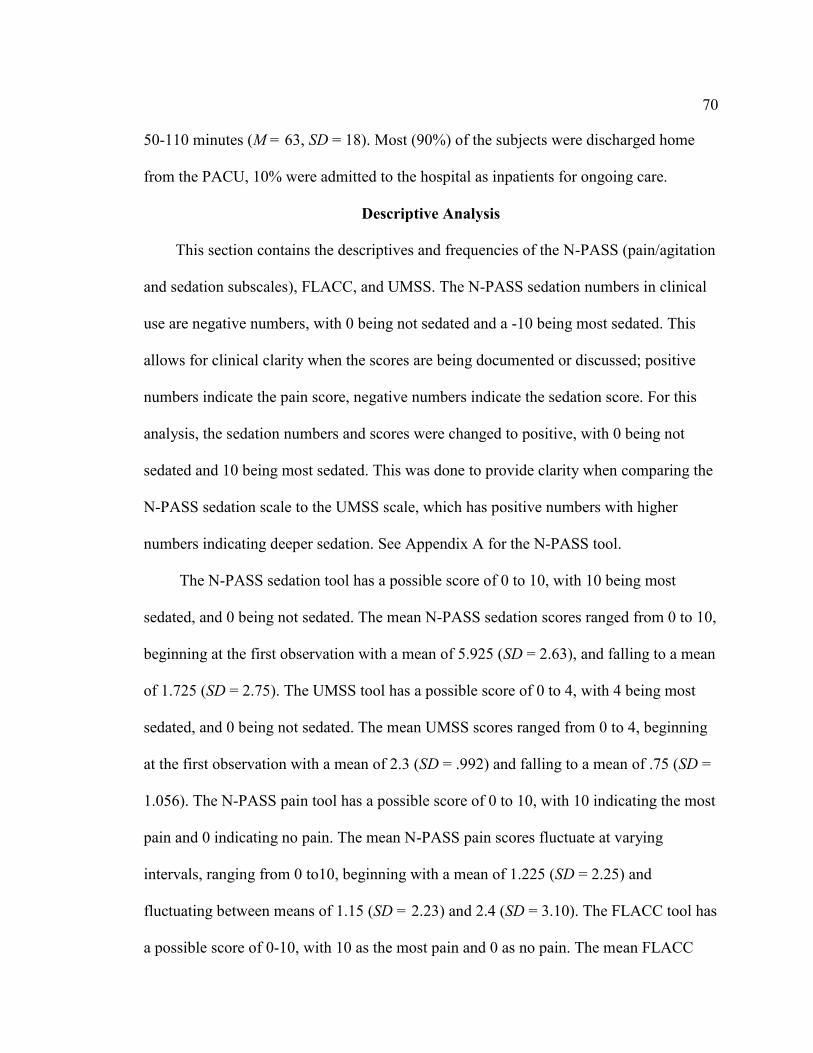
70
50-110 minutes (M = 63, SD = 18). Most (90%) of the subjects were discharged home
from the PACU, 10% were admitted to the hospital as inpatients for ongoing care.
Descriptive Analysis
This section contains the descriptives and frequencies of the N-PASS (pain/agitation
and sedation subscales), FLACC, and UMSS. The N-PASS sedation numbers in clinical
use are negative numbers, with 0 being not sedated and a -10 being most sedated. This
allows for clinical clarity when the scores are being documented or discussed; positive
numbers indicate the pain score, negative numbers indicate the sedation score. For this
analysis, the sedation numbers and scores were changed to positive, with 0 being not
sedated and 10 being most sedated. This was done to provide clarity when comparing the
N-PASS sedation scale to the UMSS scale, which has positive numbers with higher
numbers indicating deeper sedation. See Appendix A for the N-PASS tool.
The N-PASS sedation tool has a possible score of 0 to 10, with 10 being most
sedated, and 0 being not sedated. The mean N-PASS sedation scores ranged from 0 to 10,
beginning at the first observation with a mean of 5.925 (SD = 2.63), and falling to a mean
of 1.725 (SD = 2.75). The UMSS tool has a possible score of 0 to 4, with 4 being most
sedated, and 0 being not sedated. The mean UMSS scores ranged from 0 to 4, beginning
at the first observation with a mean of 2.3 (SD = .992) and falling to a mean of .75 (SD =
1.056). The N-PASS pain tool has a possible score of 0 to 10, with 10 indicating the most
pain and 0 indicating no pain. The mean N-PASS pain scores fluctuate at varying
intervals, ranging from 0 to10, beginning with a mean of 1.225 (SD = 2.25) and
fluctuating between means of 1.15 (SD = 2.23) and 2.4 (SD = 3.10). The FLACC tool has
a possible score of 0-10, with 10 as the most pain and 0 as no pain. The mean FLACC

71
scores also fluctuated at varying intervals, ranging from 0 to10, beginning with a mean of
1.18 (SD = 2.26), and fluctuating between means of 1.18 (SD = 2.23) and 2.4 (SD =
3.02).
The descriptives of the sum score of the N-PASS sedation score and the UMSS score
for the first ten observations are presented in Table 2. The descriptives of the sum score
of the N-PASS pain score and the FLACC score for the first ten observations are
presented in Table 3.
Table 2. Descriptive Statistics (N-PASS sedation/ UMSS)
Sum Score N Minimum Maximum Mean S.D.
1 N-PASS sedation 40 .00 10.00 5.9250 2.68316
1 UMSS 40 0 4 2.30 .992
2 N-PASS sedation 40 .00 10.00 5.0000 3.18651
2 UMSS 40 0 4 2.03 1.209
3 N-PASS sedation 40 .00 10.00 4.9000 3.41790
3 UMSS 40 0 4 1.92 1.289
4 N-PASS sedation 40 .00 10.00 4.5500 3.07971
4 UMSS 39 0 4 1.85 1.182
5 N-PASS sedation 40 .00 10.00 4.0250 3.16623
5 UMSS 40 0 4 1.70 1.285
6 N-PASS sedation 40 .00 10.00 3.7000 3.26756
6 UMSS 39 0 4 1.62 1.248
7 N-PASS sedation 40 .00 10.00 3.1250 3.09000
7 UMSS 40 0 4 1.32 1.207
8 N-PASS sedation 40 .00 10.00 2.8500 3.00896
8 UMSS 39 0 4 1.26 1.251
9 N-PASS sedation 40 .00 10.00 2.2750 2.73615
9 UMSS 40 0 4 1.02 1.187
10 N-PASS sedation 40 .00 9.00 1.7250 2.74551
10 UMSS 40 0 4 .75 1.056
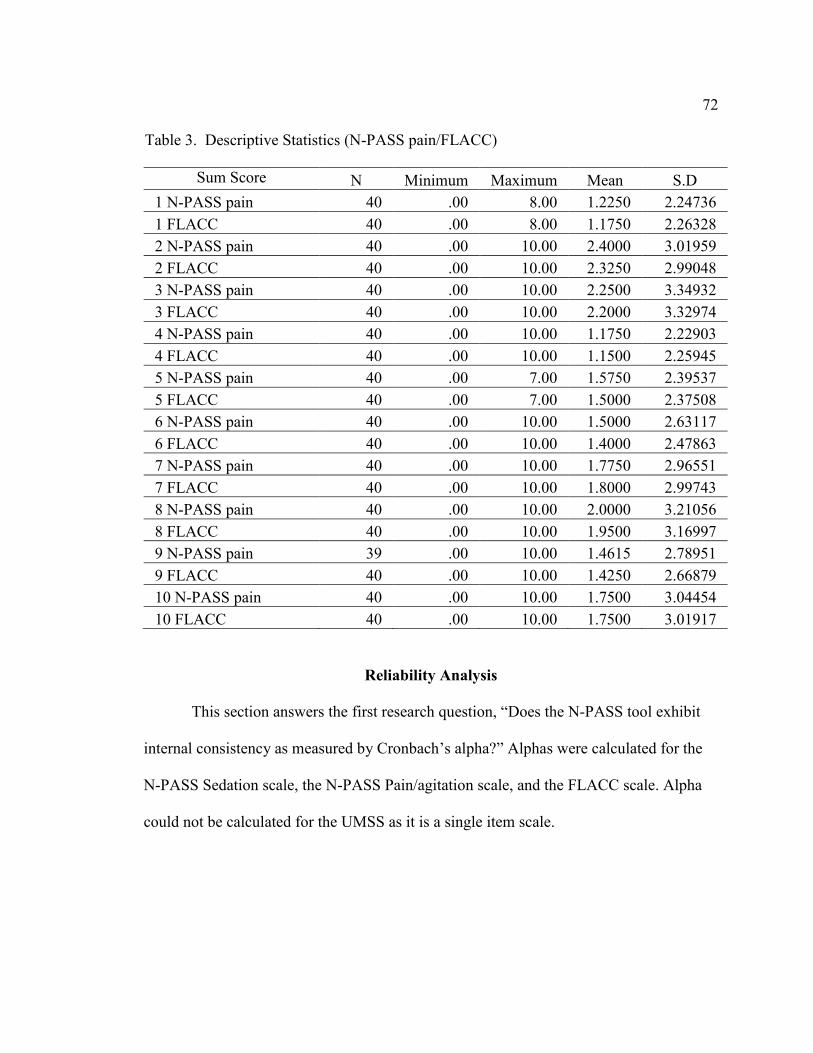
72
Reliability Analysis
This section answers the first research question, “Does the N-PASS tool exhibit
internal consistency as measured by Cronbach’s alpha?” Alphas were calculated for the
N-PASS Sedation scale, the N-PASS Pain/agitation scale, and the FLACC scale. Alpha
could not be calculated for the UMSS as it is a single item scale.
Table 3. Descriptive Statistics (N-PASS pain/FLACC)
Sum Score N Minimum Maximum Mean S.D
1 N-PASS pain 40 .00 8.00 1.2250 2.24736
1 FLACC 40 .00 8.00 1.1750 2.26328
2 N-PASS pain 40 .00 10.00 2.4000 3.01959
2 FLACC 40 .00 10.00 2.3250 2.99048
3 N-PASS pain 40 .00 10.00 2.2500 3.34932
3 FLACC 40 .00 10.00 2.2000 3.32974
4 N-PASS pain 40 .00 10.00 1.1750 2.22903
4 FLACC 40 .00 10.00 1.1500 2.25945
5 N-PASS pain 40 .00 7.00 1.5750 2.39537
5 FLACC 40 .00 7.00 1.5000 2.37508
6 N-PASS pain 40 .00 10.00 1.5000 2.63117
6 FLACC 40 .00 10.00 1.4000 2.47863
7 N-PASS pain 40 .00 10.00 1.7750 2.96551
7 FLACC 40 .00 10.00 1.8000 2.99743
8 N-PASS pain 40 .00 10.00 2.0000 3.21056
8 FLACC 40 .00 10.00 1.9500 3.16997
9 N-PASS pain 39 .00 10.00 1.4615 2.78951
9 FLACC 40 .00 10.00 1.4250 2.66879
10 N-PASS pain 40 .00 10.00 1.7500 3.04454
10 FLACC 40 .00 10.00 1.7500 3.01917

73
N-PASS Sedation Scale
Cronbach’s alphas were computed for each of the first ten observations. Alphas
ranged from .853-.938. This indicates an acceptable internal consistency. Also, the alphas
fell slightly over the time period as the sedation scores fell. See Table 4 for these results.
Table 4. N-PASS Sedation Score/Cronbach’s alpha
Time 1 .923 Time 6 .908
Time 2 .931 Time 7 .878
Time 3 .938 Time 8 .881
Time 4 .916 Time 9 .872
Time 5 .917 Time 10 .853
All Cronbach’s alphas for the sedation scale if each item was deleted were > .77.
The alphas were highest if the sedation vitals item was deleted. This indicates that the N-
PASS sedation subscale has slightly improved internal consistency without the vital sign
items, but is acceptable with the vitals indicator.
N-PASS Pain/Agitation Scale
Cronbach’s alphas were computed for each of the first ten observations. Alphas
ranged from .935-.971, indicating acceptable internal consistency. The scores remained
fairly constant over the ten observations. Cronbach’s alphas if each item was deleted
were > .8. See Table 5 for Cronbach’s alpha for the N-PASS pain scale.

74
Table 5. N-PASS Pain Score/Cronbach’s alpha
Time 1 .944 Time 6 .966
Time 2 .967 Time 7 .963
Time 3 .974 Time 8 .966
Time 4 .945 Time 9 .964
Time 5 .935 Time 10 .971
FLACC Tool
Cronbach’s alphas were computed for each of the first ten observations. Alphas ranged
from .935-.971, remaining constant, and indicating an acceptable internal consistency.
See Table 6 for FLACC Cronbach’s alphas.
Table 6. FLACC/Cronbach’s alpha
Time 1 .966 Time 6 .970
Time 2 .974 Time 7 .967
Time 3 .982 Time 8 .978
Time 4 .967 Time 9 .969
Time 5 .936 Time 10 .974
Correlation Analysis
This section answers the second and third research questions, “Does the N-PASS
tool exhibit criterion validity when the sedation subscale is compared to the UMSS
instrument?” and “Does the N-PASS tool exhibit criterion validity when the
pain/agitation subscale is compared to the FLACC instrument?”

75
Correlations between N-PASS Sedation Scale and UMSS
The sum scores of the N-PASS sedation scale and the UMSS were analyzed for
criterion validity at ten observation times. The correlations ranged from .847 to .967, all
were significant at p < .001. See Table 7 for correlations between the N-PASS sedation
scale and the UMSS instrument.
Table 7. Correlations of N-PASS Sedation Scale and UMSS
Observation time N-PASS sedation and
UMSS Pearson correlation
Pearson Correlation
Significance
Time 1 .847 <.001
Time 2 .932 <.001
Time 3 .930 <.001
Time 4 .928 <.001
Time 5 .941 <.001
Time 6 .958 <.001
Time 7 .945 <.001
Time 8 .967 <.001
Time 9 .961 <.001
Time 10 .931 <.001
Correlations between N-PASS Pain Scale and FLACC
The sum scores of the N-PASS pain scale and the FLACC were analyzed for
criterion validity. The correlations ranged from .977 to .996, all were significant at p <
.001. See Table 8 for correlations between the N-PASS pain scale and the FLACC
instrument.

76
Table 8. Correlations of N-PASS Pain Scale and FLACC
Observation time N-PASS pain and FLACC
Pearson correlation
Significance
Time 1 .985 <.001
Time 2 .990 <.001
Time 3 .996 <.001
Time 4 .977 <.001
Time 5 .980 <.001
Time 6 .987 <.001
Time 7 .990 <.001
Time 8 .983 <.001
Time 9 .994 <.001
Time 10 .994 <.001
Correlations between the N-PASS Scale and Heart Rate
Correlations were calculated between the N-PASS subscales and the documented
heart rate as heart rate is known to rise with pain and to fall with decreased pain and also
with sedation. Correlations were computed between the N-PASS sedation scale and the
recorded heart rate at each observation. The sample size was adequate for observations at
times 1, 5, and 10, (at admission, at 25 minutes, and at 50 minutes). Correlations were
high: -.708 at time 1, -.526 at time 5, and -.516 at time 10, and all were significant. At all
three times the correlation between the heart rate and the N-PASS sedation scores
indicated a negative relationship such that as the sedation score increases, heart rate
decreases; heart rate was lower with increased sedation. Sample size decreased after the
tenth observation and was inadequate for correlation calculations. Sample size decreased
over time as subjects had varying lengths of stay/observation. See Table 11 for the N-
PASS sedation score and heart rate correlations.

77
Correlations were computed between the N-PASS pain scale and the recorded
heart rate at each observation time point. The sample size was adequate for observations
at times 1, 5, and 10. Correlations were high—.623 at time 1, .651 at time 2, and .687 at
time 10—and all were significant. At all three times the correlation between the heart rate
and the N-PASS pain scores indicated a positive relationship such that as the pain score
increases, heart rate increases; heart rate is higher with increased pain. Sample size
decreased after the tenth observation and was inadequate for correlation calculations. See
Table 9 for the N-PASS pain score and heart rate correlations.
Table 9. Correlations of Heart Rate and N-PASS Sedation and Pain Scales
df N
Heart rate and
N-PASS
sedation
Heart rate and
N-PASS
pain/agitation
Time 1 Pearson
correlation 1 -.708 .623
Sig. (2-tailed) .000 .000
N 39 39 39
Time 5 Pearson
correlation 1 -.526 .651
Sig. (2-tailed) . .001 .000
N 39 39 39
Time 10 Pearson
correlation 1 -.516 .687
Sig. (2-tailed) .001 .000
N 38 38 38
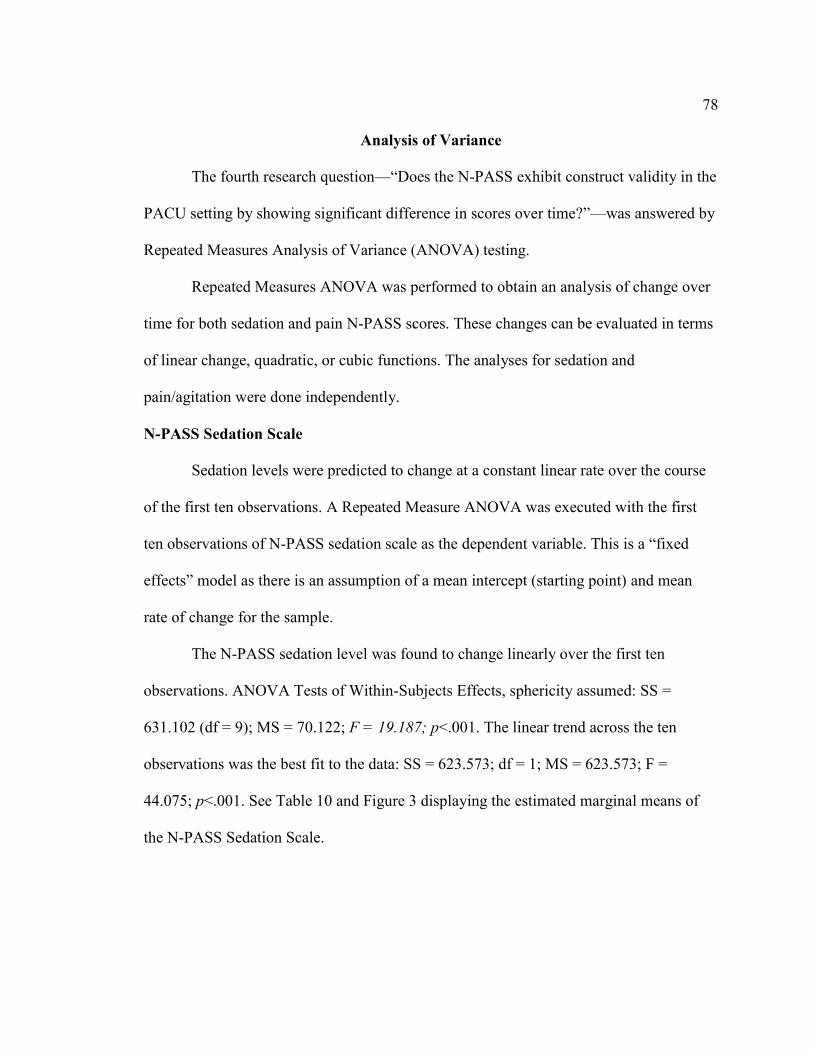
78
Analysis of Variance
The fourth research question—“Does the N-PASS exhibit construct validity in the
PACU setting by showing significant difference in scores over time?”—was answered by
Repeated Measures Analysis of Variance (ANOVA) testing.
Repeated Measures ANOVA was performed to obtain an analysis of change over
time for both sedation and pain N-PASS scores. These changes can be evaluated in terms
of linear change, quadratic, or cubic functions. The analyses for sedation and
pain/agitation were done independently.
N-PASS Sedation Scale
Sedation levels were predicted to change at a constant linear rate over the course
of the first ten observations. A Repeated Measure ANOVA was executed with the first
ten observations of N-PASS sedation scale as the dependent variable. This is a “fixed
effects” model as there is an assumption of a mean intercept (starting point) and mean
rate of change for the sample.
The N-PASS sedation level was found to change linearly over the first ten
observations. ANOVA Tests of Within-Subjects Effects, sphericity assumed: SS =
631.102 (df = 9); MS = 70.122; F = 19.187; p<.001. The linear trend across the ten
observations was the best fit to the data: SS = 623.573; df = 1; MS = 623.573; F =
44.075; p<.001. See Table 10 and Figure 3 displaying the estimated marginal means of
the N-PASS Sedation Scale.

79
Table 10. N-PASS Sedation ANOVA Marginal Means, First Ten Observations
N-PASS sedation
observation times Mean Std. error
95% Confidence interval
Lower bound Upper bound
1 5.925 .424 5.067 6.783
2 5.000 .504 3.981 6.019
3 4.900 .540 3.807 5.993
4 4.550 .487 3.565 5.535
5 4.025 .501 3.012 5.038
6 3.700 .517 2.655 4.745
7 3.125 .489 2.137 4.113
8 2.850 .476 1.888 3.812
9 2.275 .433 1.400 3.150
10 1.725 .434 .847 2.603
Figure 3. Estimated marginal means N-PASS sedation scale, first ten observations.

80
The intercept was statistically significant: SS = 5798.823; df = 1, MS = 5798.823;
F = 96.71; p<.001. This indicates that the intercept is statistically significant from zero;
the level of sedation at the start is greater than zero.
N-PASS Pain Scale
It was predicted that pain levels would change at a constant linear rate over the
course of the first ten observations. Repeated Measure ANOVA was executed with the
first ten observations of N-PASS pain scale as the dependent variable. This is a “fixed
effects” model as there is an assumption of a mean intercept (starting point) and mean
rate of change for the sample. The N-PASS pain scale scores did change over time, but
not in a linear, quadratic, or cubic form. This indicates that the pain levels are not
dependent on time postoperatively; pain levels fluctuate independently of time, due to
many intervening factors such as analgesic administration, nursing and parental comfort
interventions, individual differences, and other unknown factors. The effects of analgesic
medications on the pain score could not be analyzed as only three subjects received
analgesic medications during the observation period. ANOVA Test of Within-Subjects
Effects was not significant, SS = 53.221 (df = 9); MS = 5.913; F = .903; p = .523. See
Table 11 and Figure 4 displaying the estimated marginal means of the N-PASS pain
scale.

81
Table 11. N-PASS Pain ANOVA Marginal Means, First Ten Observations
N-PASS pain
observation times Mean Std. error
95% Confidence interval
Lower bound Upper bound
m
e
n
s
i
o
n
1
1 1.256 .363 .521 1.992
2 2.359 .488 1.371 3.347
3 2.231 .543 1.132 3.330
4 1.205 .360 .476 1.934
5 1.590 .388 .804 2.376
6 1.410 .417 .567 2.254
7 1.769 .481 .795 2.743
8 1.923 .515 .881 2.965
9 1.462 .447 .557 2.366
10 1.667 .486 .682 2.651
Figure 4. Estimated marginal means of the N-PASS pain score, first ten observations.

82
Regression Analysis
The fifth research question—“Does the N-PASS tool provide a predicted pathway
of behaviors over time of recovery in the PACU setting?”—was answered by regression
analysis. Since a significant change over time for sedation was found by Repeated
Measures ANOVA, post hoc tests were used to determine the rates or slopes of change.
Simultaneous regression was performed to use the rate of change in sedation to predict
time of discharge. Regression is used to predict a continuous dependent variable by a
continuous independent variable. The hypothesis was that the faster a child’s sedation
decreases, the sooner they will be discharged. Regression was not performed for the
pain/agitation subscale since the Repeated Measures ANOVA did not show a linear
change in the scores.
Test of Change in Sedation Predicting Time to Discharge
Change scores in sedation were calculated by subtracting Time 1 from Time 10
(T10-T1 = Change in Sedation). As the relationship is linear, the two scores can be
subtracted. Time to Discharge or total time spent in PACU was calculated by subtracting
time of admission from time of discharge. (Time of Discharge minus Time of Admission =
Time to Discharge). Using the change in sedation variable, the subject’s length of stay
(Time to Discharge) was predicted. The independent variable was Change in Sedation from
time 1 to time 10. The dependent variable was the amount of time spent in PACU.
The amount of time spent in the PACU was not predicted by the change in
sedation scores from time 1 to time 10. A non-significant linear trend was found for the
prediction of amount of time spent in PACU as a function of change in sedation levels
from time 1 to time 10 (β = .284; p = .075; R2 = 0.081).These findings indicate that every

83
standard deviation decrease in sedation is associated with a .284 standard deviations
decrease in time to discharge. I.e., a greater decrease in sedation over time predicts
shorter length of stays in the unit. Unstandardized coefficients: Constant /Intercept:
4178,674 (SE = 266.623); t = 15.673; p<.001. Slope/beta: 90.637 (SE = 49.553); t =
1.829; p = .075. Standardized coefficients: rate of change in standardized units = .284.
Principal Axis Factoring
The sixth research question, “What is the factor structure of the N-PASS tool?” was
examined through Principal Axis Factoring (PAF). PAF is a factor analysis method of
data reduction. PAF separates the variance in items into common variance (which is
predicted by the latent variables) and unique error variance (which is unrelated to the
latent variables). It was predicted that the N-PASS would have two underlying factors—
one representing pain/agitation and one representing sedation. Clinically, pain and
sedation do not rise and fall together. Therefore it was predicted that sedation scores
would be lower when pain scores were high, and conversely, sedation scores would be
higher with lower pain scores. This would result in negative loadings for pain and
positive loadings for sedation, or vice versa. Since two factors were found with factor
extraction, with remaining factors contributing very little to the variance, analysis was
run with rotation. Varimax (orthogonal) rotation was used as the two factors are assumed
to be uncorrelated. Varimax rotation maximizes the variance of each of the factors, so the
variance accounted for is distributed over the two extracted factors.
PAF was computed on the N-PASS scale at three separate observation times—
Time 1 (the first observation upon admission to the PACU), Time 5 (the fifth
observation, done at 25 minutes after admission), and Time 10 (the tenth observation,

84
done at 50 minutes after admission) since these were the time points used in the other
analyses. These observational time points reflect changes over time with the largest
sample size.
Two tests, the Kaiser-Meyer-Olkin Measure of Sampling Adequacy (KMO) and
Bartlett’s Test of Sphericity, were run to determine the appropriateness of including
factor analysis in this research. The KMO statistic varies between 0 and 1, and values
closer to 1 are desired. A value of .6 is a suggested minimum (Kaiser, 1974). The KMO
statistics were all well above .6: Time 1 = .826, Time 5 = .813, and Time 10 = .819.
Bartlett's Test of Sphericity tests the null hypothesis that the correlation matrix is
an identity matrix (a matrix in which all the diagonal elements are 1 and all off-diagonal
elements are 0). This null hypothesis was rejected. All three PAF analyses demonstrated
significant Bartlett’s tests. Time 1 Bartlett’s test was 442.203, df = 45 (p = .000). Time 5
Bartlett’s test was 418.761, df = 45 (p = .000). Time 10 Bartlett’s test was 497.793, df =
45 (p = .000). Together, the KMO and Bartlett’s tests provide a minimum standard which
should be passed before a factor analysis is conducted. These standards were met in these
three analyses (see Table 12).
Table 12. KMO and Bartlett’s Tests
Time 1 Time 5 Time 10
Kaiser-Meyer-Olkin measure of sampling
adequacy
.826 .813 .819
Bartlett's test of
sphericity
Approx. chi-square 442.203 418.761 497.793
Df 45 45 45
Significance .000 .000 .000
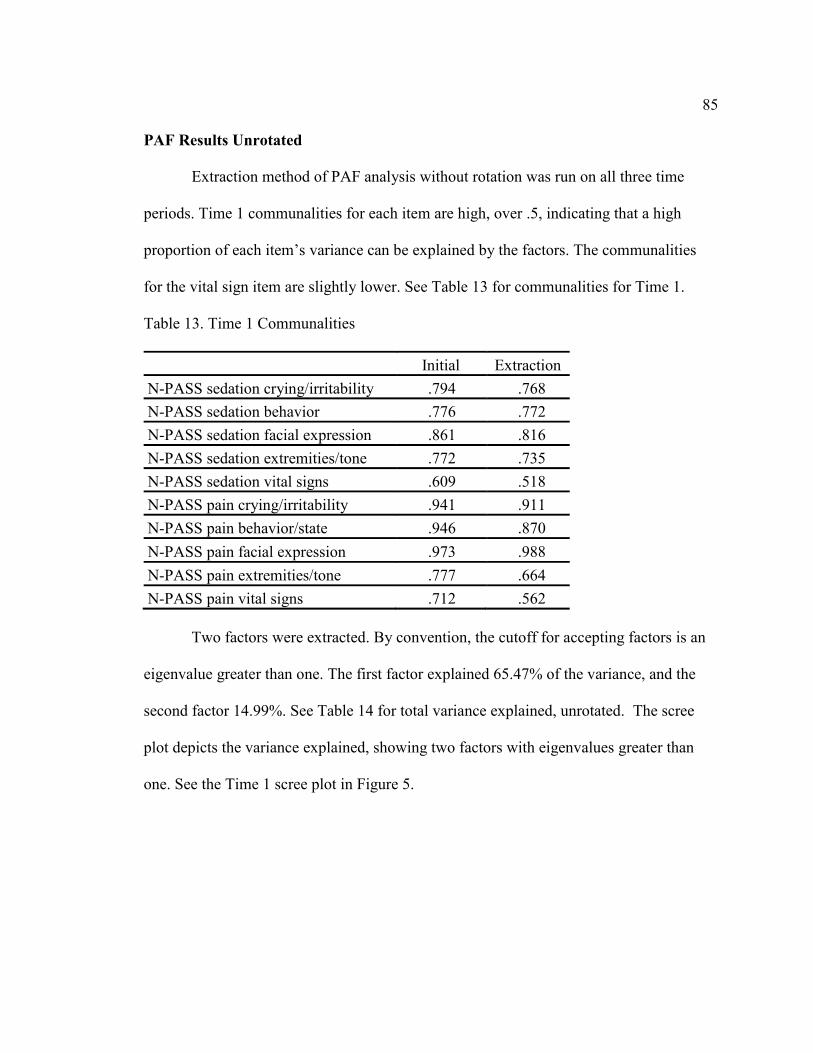
85
PAF Results Unrotated
Extraction method of PAF analysis without rotation was run on all three time
periods. Time 1 communalities for each item are high, over .5, indicating that a high
proportion of each item’s variance can be explained by the factors. The communalities
for the vital sign item are slightly lower. See Table 13 for communalities for Time 1.
Table 13. Time 1 Communalities
Initial Extraction
N-PASS sedation crying/irritability .794 .768
N-PASS sedation behavior .776 .772
N-PASS sedation facial expression .861 .816
N-PASS sedation extremities/tone .772 .735
N-PASS sedation vital signs .609 .518
N-PASS pain crying/irritability .941 .911
N-PASS pain behavior/state .946 .870
N-PASS pain facial expression .973 .988
N-PASS pain extremities/tone .777 .664
N-PASS pain vital signs .712 .562
Two factors were extracted. By convention, the cutoff for accepting factors is an
eigenvalue greater than one. The first factor explained 65.47% of the variance, and the
second factor 14.99%. See Table 14 for total variance explained, unrotated. The scree
plot depicts the variance explained, showing two factors with eigenvalues greater than
one. See the Time 1 scree plot in Figure 5.

86
Table 14. Time 1 Total Variance Explained, Unrotated
Factor Initial Eigenvalues Extraction sums of squared loadings
Total % of
variance
Cumulative
%
Total % of
variance
Cumulative
%
1 6.547 65.470 65.470 6.330 63.303 63.303
2 1.499 14.989 80.460 1.273 12.734 76.037
3 .650 6.497 86.957 -- -- --
4 .404 4.037 90.994 -- -- --
5 .317 3.168 94.161 -- -- --
6 .245 2.454 96.616 -- -- --
7 .162 1.616 98.231 -- -- --
8 .112 1.119 99.350 -- -- --
9 .047 .469 99.819 -- -- --
10 .018 .181 100.000 -- -- --
Note. Extraction sums of squared loadings are included only for factors with eigenvalues
greater than 1.
Figure 5. Time 1 scree plot.

87
Extraction method of PAF analysis without rotation was run on Time 5. The
communalities for each item are also high, greater than .5. The vital sign item values are
slightly lower. See Table 15 for communalities for Time 5.
Table 15. Time 5 Communalities
Initial Extraction
N-PASS sedation crying/irritability .907 .856
N-PASS sedation behavior .954 .954
N-PASS sedation facial expression .810 .855
N-PASS sedation extremities/tone .855 .756
N-PASS sedation vital signs .616 .505
N-PASS pain crying/irritability .833 .762
N-PASS pain behavior/state .868 .894
N-PASS pain facial expression .853 .815
N-PASS pain extremities/tone .798 .746
N-PASS pain vital signs .711 .619
Two factors were extracted. By convention, the cutoff for accepting factors is an
eigenvalue greater than one. The first factor explained 61.33% of the variance, and the
second factor 20.46%. See Table 16 for Time 5 total variance explained, unrotated. The
scree plot depicts the variance explained, showing two factors with eigenvalues greater
than one. See the Time 5 scree plot in Figure 6.

88
Table 16. Time 5 Total Variance Explained, Unrotated
Factor Initial Eigenvalues Extraction sums of squared loadings
Total % of
variance
Cumulative
%
Total % of
variance
Cumulative
%
1 6.133 61.331 61.331 5.928 59.278 59.278
2 2.046 20.459 81.789 1.835 18.347 77.625
3 .571 5.713 87.502 -- -- --
4 .451 4.505 92.007 -- -- --
5 .230 2.304 94.312 -- -- --
6 .182 1.815 96.127 -- -- --
7 .154 1.541 97.667 -- -- --
8 .121 1.211 98.879 -- -- --
9 .084 .836 99.715 -- -- --
10 .029 .285 100.000 -- -- --
Note. Extraction sums of squared loadings are included only for factors with eigenvalues
greater than 1.
Figure 6. Time 5 scree plot.

89
Extraction method of PAF analysis without rotation was run on Time 10. The
communalities for each item were also high, ranging from .734 to .919. The vital signs
item was not as notably lower as in the first two time period analyses. See Table 17 for
communalities for Time 10.
Table 17. Time 10 Communalities
Two factors were extracted. By convention, the cutoff for accepting factors is an
eigenvalue greater than one. The first factor explained 57.06% of the variance, and the
second factor 30.71%. See Table 18 for total variance explained, unrotated. The scree
plot depicts the variance explained, showing two factors with eigenvalues greater than
one. See the Time 10 scree plot in Figure 7.
Initial Extraction
N-PASS sedation crying/irritability .864 .880
N-PASS sedation behavior .844 .734
N-PASS sedation facial expression .897 .893
N-PASS sedation extremities/tone .869 .842
N-PASS sedation vital signs .815 .753
N-PASS pain crying/irritability .938 .919
N-PASS pain behavior/state .924 .878
N-PASS pain facial expression .907 .919
N-PASS pain extremities/tone .849 .812
N-PASS pain vital signs .865 .850

90
Table 18. Time 10 Total Variance Explained, Unrotated
Factor Initial Eigenvalues Extraction sums of squared loadings
Total % of
variance
Cumulative
%
Total % of
variance
Cumulative
%
1 5.706 57.062 57.062 5.559 55.593 55.593
2 3.071 30.713 87.775 2.920 29.201 84.793
3 .395 3.955 91.730 -- -- --
4 .237 2.375 94.105 -- -- --
5 .165 1.645 95.750 -- -- --
6 .143 1.428 97.178 -- -- --
7 .119 1.187 98.364 -- -- --
8 .079 .787 99.152 -- -- --
9 .051 .513 99.664 -- -- --
10 .034 .336 100.000 -- -- --
Note. Extraction sums of squared loadings are included only for factors with eigenvalues
greater than 1.
Figure 7. Time 10 scree plot.

91
PAF Results Rotated
Since two factors were found with extraction, with the remaining factors
contributing very little to the variance, analysis was run with rotation. Varimax
(orthogonal) rotation was used. Analysis was run at the same three observational time
points: the first, fifth, and tenth observation after admission to the PACU. Factors with
eigenvalues greater than one were considered significant variance.
PAF with Varimax rotation was completed for Time 1. One factor accounted for
40.09% of the variance. A second factor accounted for 35.94% of the variance. See Table
19 for the total variance explained, rotated.

Table 19. Time 1 Total Variance Explained, Rotated
Factor Initial Eigenvalues Extraction sums of squared loadings Rotation sums of squared loadings
Total
% of
variance
Cumulative
% Total
% of
variance
Cumulative
% Total % of variance
Cumulative
%
1 6.547 65.470 65.470 6.330 63.303 63.303 4.009 40.094 40.094
2 1.499 14.989 80.460 1.273 12.734 76.037 3.594 35.943 76.037
3 .650 6.497 86.957 -- -- -- -- -- --
4 .404 4.037 90.994 -- -- -- -- -- --
5 .317 3.168 94.161 -- -- -- -- -- --
6 .245 2.454 96.616 -- -- -- -- -- --
7 .162 1.616 98.231 -- -- -- -- -- --
8 .112 1.119 99.350 -- -- -- -- -- --
9 .047 .469 99.819 -- -- -- -- -- --
10 .018 .181 100.000 -- -- -- -- -- --
Note. Extraction and rotation sums of squared loadings are included only for factors with eigenvalues greater than 1.
Extraction method: Principal Axis Factoring.
92

93
The rotated factor matrix shows the pain/agitation items loading on Factor 1 and the
sedation items on Factor 2. Loadings less than .3 are not reported. Table 20 shows the
rotated factor matrix.
Table 20. Time 1 Factor Matrix, Rotated a
Factor
1 2
N-PASS sedation crying/irritability -.346 .805
N-PASS sedation behavior -- .836
N-PASS sedation facial expression -.432 .793
N-PASS sedation extremities/tone -- .826
N-PASS sedation vital signs -- .667
N-PASS pain crying/irritability .903 -.308
N-PASS pain behavior/state .861 -.357
N-PASS pain facial expression .947 -.304
N-PASS pain extremities/tone .764 --
N-PASS pain vital signs .683 -.310
Note. Factor loadings less than .3 are not displayed.
Extraction Method: Principal Axis Factoring.
Rotation Method: Varimax with Kaiser Normalization. aRotation converged in 3 iterations.
The rotated factor plot shows the two factors loading separately. See Figure 8 for
the time 1 rotated factor plot.

94
Figure 8. Time 1 rotated factor plot.
PAF with Varimax rotation was completed for Time 5. The first factor accounted
for 39.09% of the variance. A second factor accounted for 38.56% of the variance. See
Table 21 for the total variance explained, rotated.

Table 21. Time 5 Total Variance Explained, Rotated
Factor Initial Eigenvalues Extraction sums of squared loadings Rotation sums of squared loadings
Total
% of
variance
Cumulative
% Total
% of
variance
Cumulative
% Total % of variance
Cumulative
%
1 6.133 61.331 61.331 5.928 59.278 59.278 3.909 39.090 39.090
2 2.046 20.459 81.789 1.835 18.347 77.625 3.854 38.535 77.625
3 .571 5.713 87.502 -- -- -- -- -- --
4 .451 4.505 92.007 -- -- -- -- -- --
5 .230 2.304 94.312 -- -- -- -- -- --
6 .182 1.815 96.127 -- -- -- -- -- --
7 .154 1.541 97.667 -- -- -- -- -- --
8 .121 1.211 98.879 -- -- -- -- -- --
9 .084 .836 99.715 -- -- -- -- -- --
10 .029 .285 100.000 -- -- -- -- -- --
Note. Extraction and rotation sums of squared loadings are included only for factors with eigenvalues greater than 1.
Extraction method: Principal Axis Factoring.
95

96
The factor matrix shows sedation items loading on Factor 1 and pain/agitation
items loading on Factor 1. Loadings less than .3 are not reported. See Table 22 for Time 5
factor matrix, rotated.
Table 22. Time 5 Factor Matrix, Rotated a
Factor
1 2
N-PASS sedation crying/irritability .878 --
N-PASS sedation behavior .919 -.331
N-PASS sedation facial expression .916 --
N-PASS sedation extremities/tone .843 --
N-PASS sedation vital signs .661 --
N-PASS pain crying/irritability -- .824
N-PASS pain behavior/state -- .910
N-PASS pain facial expression -- .861
N-PASS pain extremities/tone -- .826
N-PASS pain vital signs -- .776
Note. Factor loadings less than .3 are not displayed.
Extraction method: Principal Axis Factoring.
Rotation method: Varimax with Kaiser Normalization. aRotation converged in 3 iterations.
The rotated factor plot shows the sedation and pain/agitation items loading
separately. See Figure 9 for Time 5 rotated factor plot.

97
Figure 9. Time 5 rotated factor plot.
PAF with Varimax rotation was completed for Time 10. The first factor
accounted for 43.9% of the variance. A second factor accounted for 40.9% of the
variance. See Table 23 for the total variance explained, rotated.

Table 23. Time 10 Total Variance Explained, Rotated
Factor Initial Eigenvalues Extraction sums of squared loadings Rotation sums of squared loadings
Total
% of
variance
Cumulative
% Total
% of
variance
Cumulative
% Total % of variance
Cumulative
%
1 5.706 57.062 57.062 5.559 55.593 55.593 4.390 43.897 43.897
2 3.071 30.713 87.775 2.920 29.201 84.793 4.090 40.896 84.793
3 .395 3.955 91.730 -- -- -- -- -- --
4 .237 2.375 94.105 -- -- -- -- -- --
5 .165 1.645 95.750 -- -- -- -- -- --
6 .143 1.428 97.178 -- -- -- -- -- --
7 .119 1.187 98.364 -- -- -- -- -- --
8 .079 .787 99.152 -- -- -- -- -- --
9 .051 .513 99.664 -- -- -- -- -- --
10 .034 .336 100.000 -- -- -- -- -- --
Note. Extraction and rotation sums of squared loadings are included only for factors with eigenvalues greater than 1.
Extraction method: Principal Axis Factoring.
98

99
The rotated factor matrix for Time 10 shows the pain/agitation items loading on
Factor 1 and the sedation items loading on Factor 2. Loadings less than .3 are not
reported. See Table 24 for the Time 10 factor matrix, rotated.
Table 24. Time 10 Factor Matrix, Rotated a
Factor
1 2
N-PASS sedation crying/irritability -- .932
N-PASS sedation behavior -- .834
N-PASS sedation facial expression -- .941
N-PASS sedation extremities/tone -- .884
N-PASS sedation vital signs -- .863
N-PASS pain crying/irritability .940 --
N-PASS pain behavior/state .919 --
N-PASS pain facial expression .951 --
N-PASS pain extremities/tone .896 --
N-PASS pain vital signs .910 --
Note. Factor loadings less than .3 are not displayed.
Extraction method: Principal Axis Factoring.
Rotation method: Varimax with Kaiser Normalization. aRotation converged in 3 iterations.
The rotated factor plot for Time 10 shows the sedation and pain/agitation items
loading separately. See Figure 10 for the Time 10 rotated factor plot.

100
Figure 10. Time 10 rotated factor plot.
Summary
The psychometric evaluation shows adequate reliability determined by
Cronbach’s alpha analysis. Criterion validity is supported by the correlations between the
N-PASS tool pain/agitation subscale and the FLACC tool and also between the N-PASS
sedation subscale and the UMSS tool. Construct validity is supported by Repeated
Measures ANOVA, as the scores exhibited variance; the sedation score fell in a linear

101
fashion, the pain/agitation score changed erratically over time. Regression analysis found
a non-significant linear trend for the prediction of amount of time spent in the PACU as a
function of change in the sedation levels. PAF analysis found two factors accounting for
80.77 to 87.77% of the variance. One factor was pain/agitation, and one was sedation.
The factor structure remained stable over time.

102
CHAPTER FIVE
DISCUSSION
This research was conducted as a psychometric evaluation of the Neonatal Pain,
Agitation, and Sedation Scale (N-PASS) (Hummel et al., 2008) in an older population
than previously studied, in a different setting, and with different methodology. Previous
research had focused on preterm and term neonates up to 100 days of age, in an ongoing
painful situation, or in an acute painful situation. This study was designed to obtain
information regarding reliability and validity when using the N-PASS tool up to three
years of age.
Studying the N-PASS sedation tool in the PACU allowed for improved evaluation
of the tool, with repeated observations of subjects emerging from general anesthesia
through the continuum of sedation. The N-PASS sedation tool had previously been
evaluated in just one study of sedation in the NICU, with observations before and after
sedative administration.
The PACU setting also allowed for evaluation of the N-PASS pain scale in a
time-limited setting with repeated observations. Previous research of the N-PASS pain
scale did not include repeated observations.
Reliability
Cronbach’s alpha for the N-PASS sedation and the N-PASS pain scales at each
time period were found to be greater than .80. This answers the first research question,
103
“Does the N-PASS tool exhibit internal consistency as measured by Cronbach’s alpha?”
An alpha of over .80 is desirable for a clinical assessment tool. Thus, summing up the
items from each scale to form a composite score is acceptable.
Repeated Measures ANOVA found that the sedation scores fell linearly over time.
Cronbach’s alpha values for the N-PASS sedation scale also fell slightly over the ten
observation periods. The fall in the alphas could be due to the fact that as the sedation
score fell over time, fewer items were scored leading to decreased variance and lower
correlations as more items were scored zero.
If the vital sign indicator on the sedation scale was eliminated, the alpha rose to >
.90. Elimination of the other sedation items did not raise the alpha to this degree. This
was not found in previous research of the N-PASS tool. Perhaps the vital signs indicator
is less valuable in the postoperative setting, as these physiologic parameters might be
affected by the administration of anesthesia, slightly decreasing internal consistency of
the tool. Modification of the tool for this situation is not indicated, as the alphas including
the vital sign indicator were all over .80.
Correlations
Correlations between the N-PASS pain scale and the FLACC and between the
N-PASS sedation scale and the UMSS were positive, of a large magnitude and great
significance. This answers the second and third research questions, “Does the N-PASS
tool exhibit criterion validity when the sedation subscale is compared to the UMSS
instrument?” and “Does the N-PASS tool exhibit criterion validity when the
pain/agitation subscale is compared to the FLACC instrument?”

104
Correlation coefficients between the corresponding N-PASS sedation ratings and
UMSS ratings at each time point were positive and all were significant ranging from .847
to .967. Based on these results, it appears that the two scales are measuring a similar
concept, sedation.
All correlations between the N-PASS pain/agitation ratings and FLACC ratings at
each time point ranging from .977 to .996 were positive and significant. The strong
positive, significant relationships between the N-PASS pain/agitation and FLACC
suggest that the two scales are measuring the same phenomenon, pain.
Correlations between the heart rate and the N-PASS sedation scale were negative,
indicating that the heart rate rose as sedation scores fell, consistent with research
indicating that the heart rate is decreased with sedation. Correlations between the heart
rate and the N-PASS pain scale were positive and significant, indicating that the heart
rate rose as pain scores rose, consistent with research indicating that an elevated heart
rate is an indicator of pain.
Repeated Measure Analysis of Variance (ANOVA)
The N-PASS ratings of sedation and pain changed significantly over time, answering
the fourth research question, “Does the N-PASS tool sedation and pain/agitation
subscales exhibit construct validity in the PACU setting by showing significant
difference in scores over time?” Repeated Measures ANOVA was performed to obtain an
analysis of change over time for both pain/agitation and sedation N-PASS scores. These
changes can be evaluated in terms of linear change, quadratic, or cubic functions.
The N-PASS ratings of sedation decreased in a linear fashion over time, as
expected. Subjects move through the sedation continuum, from general anesthesia

105
through deep sedation, moderate sedation, and light sedation before full recovery from
pharmacologic anesthesia. N-PASS pain ratings increased and decreased in a non-linear
fashion. The unpredictable variations in pain scores are probably due to many factors,
including the varying effects of anesthesia and duration of action. Only three participants
received analgesics in the PACU setting. Parental or nursing comfort interventions may
also account for the non-linear pain ratings. Behavioral pain assessment scores are
influenced by non-pain factors such as anxiety and fear, and situational factors such as
hunger, nausea, and parental deprivation or presence.
These findings support the modified Onion Theory of Pain and Sedation for the
nonverbal infant or child. The tissue damage from surgery is the stimulus, which is
transmitted to the cortex. This causes suffering or distress, leading to pain and distress
behaviors, scored by the N-PASS pain/agitation subscale. These behaviors are modified
by interaction with the environment, nursing, and parental response and interventions.
The anesthetic affected the cerebral cortex, slowing the brain and responses, as scored by
the N-PASS sedation subscale.
Regression
Since a significant change over time was found, post hoc tests were used to
determine the rates or slopes of change, answering the fifth research question “Does the
N-PASS tool provide a predicted pathway of behaviors over time of recovery in the
PACU setting?” Post-hoc regression analysis was performed. A meaningful, yet
statistically non-significant linear trend was found for the prediction of amount of time
spent in PACU as a function of change in sedation levels from time 1 to time 10. The
findings indicate that every standardized unit of decrease in sedation is associated with a

106
.284 standardized units decrease in time to discharge. In other words, a greater decrease
in sedation over time predicts shorter length of stays in the unit. This finding may have
been attenuated due to decreased sample size, but the observed findings suggest a
meaningful trend in the association between sedation and time to discharge, which may
hold promise in the utility in the N-PASS sedation scale.
Principal Axis Factoring (PAF)
PAF was performed to answer the sixth research question “What is the factor
structure of the N-PASS tool?” The goal of PAF is to describe variability among
correlated items to identify unobserved variables or factors.
Factor analysis is a technique that requires a large sample size. Suggested
minimums for sample size include from three to twenty times the number of variables.
Ideally, there are five to ten participants per item (Nunnally & Bernstein, 1994b). Sample
size is sometimes recommended as an absolute size from 100 to over 1000. There is little
empirical evidence to support these recommendations.
Research on this topic found that minimum sample sizes are smaller when the
variables to factors ratio exceeds six (Mundfrom, Shaw, & Ke, 2005). Sapnas and Zeller
(2002) evaluated research examples and concluded that a sample size of 50 to 100
subjects is adequate for evaluating the psychometric properties of social construct
measures through factor analysis.
The sample size in this study is low for PAF analysis with forty participants;
however, these analyses give some preliminary results for what to expect with a larger
sample size. Two factors were found, giving a variable to factor ratio of ten to two; ten
variables to two factors. There were forty cases for observation time points 1 through 10.

107
After Time 10, many patients were discharged from the PACU, ending observations,
leading to the drop in sample size. Thus, data were primarily examined at three
observation times: Time 1, Time 5, and Time 10.
It was assumed that there were two factors that represent the underlying spectrum
of pain and sedation, one pain, and the other sedation. Negative loadings for sedation and
positive loadings for pain, or positive loadings for pain and negative loadings for sedation
were expected. PAF was conducted at three different time points to determine if the same
factor structure is found repeatedly over time. Varimax rotation clearly demonstrated the
two factors, one pain, and the other sedation.
Most of the assessment tools described in Chapter Two assess either pain or
sedation. The COMFORT tool appears to have some items assessing pain and some
assessing sedation. No evidence of factor analysis statistics is found in the literature. The
N-PASS score was created to assess both pain and sedation; these two factors are
supported by this research.
Two factors were found at each time period, pain, and sedation. Slight variations
were found in the variance of the factors over time, but the factors remained quite
constant. At Time 1, admission to the PACU, the pain factor accounted for 40% of the
variance, while sedation accounted for 35.9% of the variance. At Time 5, twenty-five
minutes after admission, sedation accounted for slightly more variance than pain; 39%
and 38% respectively. At Time 10, fifty minutes after admission, pain accounted slightly
more variance; 43.9% and 40.9% respectively. Overall, the factor structure is similar,
with the pain and sedation subscales accounting for nearly equal variance.

108
Limitations
Data were collected at one institution, in one setting. This can limit
generalizability to other settings. Data were collected by one researcher, increasing the
chance for bias. The study could be replicated with two observers to test inter-rater
reliability. The tool should be tested with ongoing or chronic pain such as cancer pain, or
in ventilated children with an endotracheal tube.
The sample size is low, particularly for PAF analysis. This increases the chance
for error in analysis. This study should be replicated in different settings such as Pediatric
Intensive Care or general pediatrics with a larger sample size.
Implications for Nursing Practice
The N-PASS tool is widely used in Neonatal Intensive Care Units around the
world. As the creator of the N-PASS tool, this author has given written consent for use of
the N-PASS in over 350 settings and in many countries such as Canada, Mexico,
Australia, South Africa, Great Britain, France, Taiwan, and China. Reliability and
validity of the N-PASS tool has been researched up to 100 days of age. Some infants are
hospitalized in the NICU for more than 100 days, leading to clinical use of the N-PASS
beyond the age range of available psychometrics, or to nursing staff using another tool,
such as the FLACC, for pain assessment in older infants in the NICU. The FLACC tool
has been researched in subjects one month of age and older; this necessitates that nurses
in the pediatric settings that use the FLACC tool employ an alternate tool such as the N-
PASS, NIPS, or CRIES before one month of age.
Findings from this research provide preliminary support for the use of the N-
PASS in a wider age range, from preterm birth to three years of age. This is helpful to

109
nurses practicing in the NICU, the PICU, and the PACU, where sedation and pain
assessment are important nursing functions. Differences across age groups were not
addressed as this would require a much larger sample size.
Sedating an infant or child is a potentially dangerous but necessary intervention.
The potential for over-sedation or under-sedation are safety concerns in any setting. This
research provides preliminary support for the use of the N-PASS tool to assess sedation
levels in a wider population, potentially decreasing suffering by avoiding under-sedation,
and increasing safety by avoiding or recognizing over-sedation.
Implications for Nursing Research
Infants and young children continue to experience many painful situations and
procedures in the inpatient and outpatient settings (American Academy of Pediatrics,
2006). Nurse researchers study nursing interventions to maximize comfort in these
situations. Multi-modal pain assessment, including behavioral pain assessment, is often
the primary outcome of research designed to study the effects of nursing interventions in
painful situations. Findings from this study support the utilization of the N-PASS tool in
clinical research studies.
Infants and young children also continue to receive medications to achieve a
sedated state. Nurse researchers are concerned with the care of infants and children who
are sedated. The N-PASS tool was recently used as the primary outcome in research
designed to investigate the safety, efficacy, and pharmacokinetic profile of
Dexmedetomidine in preterm and full-term neonates ≥28 to ≤44 weeks gestational age
(Chrysostomou et al., 2014). This research supports the use of the N-PASS tool in
researching interventions and medications in infants and children up to three years of age.

110
The N-PASS tool, studied in preterm and term infants, includes both pain and
sedation assessment. This tool has been modified to assess the adult population, and is
being tested in the adult intensive care unit, replicating the methodology of the initial
neonatal N-PASS research.
Implications for Nursing Theory
The Onion Theory of pain (Loeser, 1982) explains that the pain experience
involves the physiology of the pain stimulus which is transmitted to the brain, where it is
interpreted as a noxious individual experience. Suffering results; this is expressed in
behaviors and may be modified by the environment. This theory was modified by
expanding the process to better understand the experience of pain in nonverbal infants
and children, and to include the process of sedation assessment.
The Modified Onion Theory of Pain and Sedation in infants and children explains
that the core of these experiences is the physiology of the pain stimulus, or the sedative
medication. The physiology is modified by genetics, biochemistry, nature of the pain
stimulus, and the type and dose of the sedative medication. This is followed by changes
in the cortical pain perception or by slowing the brain by sedative medications. Cortical
perception is modified by endorphins, pain modulation tracts, spinal cord transmission,
neurotransmitters, anatomic maturity, structure and function, and medications. Pain
perception results in suffering, which is modulated by personal interpretation of the pain
or stress. Pain cannot be reported in nonverbal populations, it can only be inferred from
pain behaviors that are an outcome of the suffering. The degree of suffering is modified
by gestational age, energy levels, previous pain or sedation experience, neurological
ability, neurotransmitters, medications, and non-pharmacologic interventions.

111
Changes in sedation behaviors result from the brain slowing as a result of sedation
medications. Pain and sedation behaviors are modified by interaction with the
environment, such as in the recognition of the suffering by caregivers or healthcare
professionals and their response through attempting to provide comfort to the infant.
Findings from this study show that the N-PASS instrument operationalizes the
pain and sedation assessment process, as conceptualized in the modified Onion Theory of
Pain and Sedation for nonverbal infants and children in this population up to thirty-six
months of age recovering from surgical procedures. The infants and toddlers in this
research had a surgical pain stimulus and also were sedated as a consequence of
medications given to achieve general anesthesia during their surgical procedure. The
painful stimuli and medications led to cortical perception and changes in brain function.
According to the Onion Theory the suffering from the surgical pain was exhibited as pain
behaviors. Sedation behaviors were exhibited as a result of the medications slowing
cortical function. The environment included the caregivers in the PACU setting, nurses,
and parents caring for the infants and children. The environment influenced the N-PASS
scores, as caregivers recognized the behaviors and intervened to comfort the children.
Only three subjects received analgesic medications during their stay. Comforting
interventions included actions such as talking to the child, giving verbal reassurance,
stroking, holding, and giving a pacifier or liquid by bottle or cup. The sedation behaviors
decreased over time as the medication effect waned.
Unique findings include the evidence that comprehensive measurement of
behavior and physiological attributes of pain and sedation should be included in practice
and research. The modified Onion Theory is applicable to nursing practice and research.

112
This research provides additional evidence for use of the N-PASS tool in clinical
practice and research, thus advancing nursing practice, including nonverbal pain
assessment, sedation assessment, and nursing practice in the assessment and management
of pain and sedation in young children. As nursing research continues to evaluate nursing
care of infants and children who are in pain and/or sedated, middle-range theories can be
formulated and evaluated. Practice theory could be formulated and evaluated by
interviewing nurses to determine how decisions are made regarding pain and sedation
assessment and management by nurses.
This research could be used in theory building regarding nursing care and the
nurses’ experiences, including the process of caring for patients through this continuum
from deep sedation, as they become less sedated, weaned from medications, or as effects
wane, and also when in painful situations. In addition, a need exists for development of a
substantive theory of how nurses experience caring for infants and toddlers who
experience chronic pain, such as when they are intubated over an extended time. Theory
that conceptually describes the nursing process for caring for extremely preterm infants
through thirty-six months of age who are sedated and/or in pain has not been generated.
Implications for Nursing Administration
Nursing administration is concerned with the safety of patients, with patient
satisfaction, and with meeting regulatory requirements and standards of care regarding
pain and sedation management in children. The Joint Commission pain management
standards, implemented in 2001, stated that every patient has a right to have their pain
assessed and treated (JCAHO, 2000). The standards mandate that tools with evidence of
reliability and validity be used for pain assessment, and require that the appropriate tool

113
be used for the patients’ age and situation. In addition, sedation assessment and
measurement is mandated in safety guidelines for discharge following procedural
sedation in children (American Academy of Pediatrics, 2006).
Tools with evidence of validity and reliability that standardize assessment of the
child’s sedation level enhance systematic assessment and documentation, allow
individual alterations in the therapeutic regimen, decrease suffering, and increase safety
by avoiding insufficient or excessive sedative use (Marx et al., 1994). This research
enables utilization of the N-PASS tool in a broader range of patients, which may lead to
improved pain and sedation management. Regulatory requirements for pain and sedation
assessment practices are met when assessment tools with sufficient psychometric
evidence are used in the correct setting and with appropriate age groups.
Parents are vigilant in protecting their children from harm and undue suffering.
Patient satisfaction may be enhanced as parents and families observe nursing efforts to
assess and manage their child’s pain and sedation safely and effectively.
Patient satisfaction surveys provide information to administrators and caregivers
about the perceptions of patients in the setting, including nursing care. This information
is valuable internally, as caregivers strive to provide excellent care for their patients. In
addition, these surveys are available for public viewing, affecting public perception of the
institution, which in turn has either positive or negative financial effects as patients
choose hospitals based on these results. The surveys are also used by payers to determine
preferred providers for reimbursement.

114
Implications for Nursing Education
Nurse educators are responsible for preparing students to continue and advance
the profession of nursing. Pain and sedation assessment are essential nursing functions.
Alleviation of suffering is included in the nursing Code of Ethics (American Nurses
Association, 2001). Pain assessment and management have been studied in children,
adolescents, and adults but there has been scarce reference to infant sedation or pain
assessment or management. Students need education regarding the nursing responsibility
for the practice of nonverbal pain and sedation assessment adults as well as in infants and
young children. Students are educated according to evidence-based practice guidelines.
This research increases the evidence for pain and sedation assessment in infants and
young children, and could be included in pediatric and maternal-child nursing textbooks.
Future Research
Infant pain research began over sixty years ago with a study on infant’s reaction
to a pinprick. Research then ceased for about twenty years due to the prevailing paradigm
that infants do not feel pain. Research began again in the 1970s as the inequities in pain
management for children were noted (Eland & Anderson, 1977). Researchers confirmed
that infants and children are able to feel pain. Pain research and interventions to treat pain
became more prevalent.
This research extends the science of assessment of pain and sedation in children, a
foundation for clinical management. Future research should include additional
psychometric evaluation of the N-PASS in various settings and age groups. As multi-
modal pain assessment research advances, the validity of the N-PASS tool could be
researched using biochemical, electrographic, or brain imaging methods. The N-PASS

115
sedation scale could be researched with BIS monitoring to add to validity testing. The N-
PASS could be modified and tested in the adult population. The N-PASS can be used
more extensively in the research of clinical pain and sedation.
Conclusion
Alleviation of suffering is recognized in the ANA Code of Ethics as part of the
moral responsibility of nurses. Evidence-based position statements and practice
guidelines address the recognition and treatment of pain and suffering, as well as the
administration of analgesics and sedative agents, all essential to safety and to high quality
nursing practice.
Infants and young children are a vulnerable population in any health care setting.
Diseases and treatments, surgeries, and the health-care environment pose a high potential
of pain and suffering if not treated appropriately. Analgesics and sedatives are given to
decrease pain and suffering, with known and unknown benefits and risk. This requires
close monitoring and accurate assessments to ensure safe and effective nursing care.
Many pain assessment tools have been created for use in infants and children.
However, only the N-PASS instrument includes both pain and sedation assessment,
including both behavioral and physiologic criteria. This research, in addition to previous
studies, gives adequate psychometric evidence for use of the N-PASS tool in infants and
children, born as early as twenty-three weeks of gestation, up to thirty-six months of age.
Findings from this study provide evidence for evidence-based methodology to assess and
relieve pain and suffering from the point of infant viability to three years of age when
verbal means of pain assessment become possible.

116
APPENDIX A:
DATA ANALYSIS TOOLS:
N-PASS, UMSS, FLACC

117
N-PASS: Neonatal Pain, Agitation, and Sedation Scale
AAsssseessssmmeenntt
CCrriitteerriiaa SSeeddaattiioonn SSeeddaattiioonn//PPaaiinn PPaaiinn // AAggiittaattiioonn
--22 --11 00//00 11 22
CCrryyiinngg
IIrrrriittaabbiilliittyy
No cry with
painful stimuli
Moans or cries
minimally with
painful stimuli
No sedation/
No pain signs
Irritable or crying at
intervals
Consolable
High-pitched or
silent-continuous
cry
Inconsolable
BBeehhaavviioorr
SSttaattee
No arousal to any
stimuli
No spontaneous
movement
Arouses minimally to
stimuli
Little spontaneous
movement
No sedation/
No pain signs
Restless, squirming
Awakens frequently
Arching, kicking
Constantly awake or
Arouses minimally /
no movement (not
sedated)
FFaacciiaall
EExxpprreessssiioonn
Mouth is lax
No expression
Minimal expression
with stimuli
No sedation/
No pain signs
Any pain expression
intermittent
Any pain expression
continual
EExxttrreemmiittiieess
TToonnee
No grasp reflex
Flaccid tone
Weak grasp reflex
muscle tone
No sedation/
No pain signs
Intermittent clenched
toes, fists or finger
splay
Body is not tense
Continual clenched
toes, fists, or finger
splay
Body is tense
VViittaall SSiiggnnss
HHRR,, RRRR,, BBPP,,
SSaaOO22
No variability with
stimuli
Hypoventilation or
apnea
< 10% variability
from baseline with
stimuli
No sedation/
No pain signs
10-20% from
baseline
SaO2 76-85% with
stimulation – quick
> 20% from baseline
SaO2 75% with
stimulation – slow
Out of sync/fighting
vent

118
UMSS Tool:
The University of Michigan Sedation Scale
0 Awake/Alert
1 Minimally Sedated: Tired/sleepy, appropriate response to verbal conversation
and/or sounds
2 Moderately Sedated: Somnolent/sleeping, easily aroused with light tactile
stimulation
3 Deeply Sedated: Deep sleep, arousable only with significant physical
stimulation
4 Unarousable
FLACC Tool:
Face, Legs, Activity, Cry, Consolability
0 1 2
Face No particular
expression or smile
Occasional grimace
or frown,
withdrawn,
disinterested
Frequent to
constant
quivering chin,
clenched jaw
Legs Normal position or
relaxed
Uneasy, restless,
tense
Kicking, or legs
drawn up
Activity Lying quietly,
normal position,
moves easily
Squirming, shifting
back and forth,
tense
Arched, rigid, or
jerking
Cry No cry (awake or
asleep)
Moans or whimpers,
occasional
complaint
Crying steadily,
screams or sobs,
frequent
complaints
Consolability Content, relaxed Reassured by
occasional touching,
hugging or being
talked to;
distractible
Difficult to
console or
comfort

119
APPENDIX B:
DATA COLLECTION FORMS

120
Demographic Variables Case #_________
Date: __/__/__
Sex: Male Female Age: _______ Months
Primary Diagnosis: ______________________
Surgery type __________________________________________________
Time entering OR: ______________________
Time entering PACU: __________________
Time leaving PACU: __________________
Other pertinent information:

121
Data collection
Case number:__________
Time Sedation
cry/irritability
Sedation
Behavior/state
Sedation Face Sedation
ext/tone
Sedation vitals Pain
cry/irritability
Pain
Behavior/state
Pain face Pain ext/tone Pain vitals
FLACC face FLACC legs FLACC Activity FLACC Cry FLACC
Consolability
UMSS score Heart rate Event
A = analgesia administration specify ______________________
S = sedative administration specify ______________________
P = parent intervention
N= nurse intervention

122
REFERENCE LIST
Aissaoui, Y., Zeggwagh, A. A., Zekraoui, A., Abidi, K., & Abouqal, R. (2005).
Validation of a behavioral pain scale in critically ill, sedated, and mechanically
ventilated patients. Anesthesia & Analgesia, 101(5), 1470-1476.
Alexander, S. M., & Todres, I. D. (1998). The use of sedation and muscle relaxation in
the ventilated infant. Clinics in Perinatology, 25(1), 63-78.
Algren, C. (2005). Family-centered care of the child during illness and hospitalization. In
M. J. Hockenberry (Ed.), Wong’s essentials of pediatric nursing (7th ed., pp. 637-
705). St. Louis: Elsevier.
Ambuel, B., Hamlett, K. W., Marx, C. M., & Blumer, J. L. (1992). Assessing distress in
pediatric intensive care environments: the COMFORT scale. Journal of Pediatric
Psychology, 17(1), 95-109.
American Academy of Pediatrics. (2006). Guidelines for Monitoring and Management of
Pediatric Patients During and After Sedation for Diagnostic and Therapeutic
Procedures: An Update. Pediatrics, 118, 2587-2602
American Nurses Association. (2001). Code of ethics for nurses wtih interpretive
statements. Silver Spring, MD: The Publishing Program of the ANA.
American Society of Anesthesiology House of Delegates. (2012). Continuum of depth of
sedation. Retrieved September 27, 2013, from
https://www.asahq.org/~/media/For%20Members/Standards%20and%20Guidelin
es/2012/CONTINUUM%20OF%20DEPTH%20OF%20SEDATION%20442012.
Anand, K. J., Aranda, J. V., Berde, C. B., Buckman, S., Capparelli, E. V., Carlo, W., . . .
Walco, G. A. (2006). The Newborn Drug Development Initiative (NDDI)
Workshop: Summary proceedings from the Neonatal Pain Control Group.
Pediatrics, 117, 9-22.
Anand, K. J., Aranda, J. V., Berde, C. B., Buckman, S., Capparelli, E. V., Carlo, W. A., .
. . Walco, G. A. (2005). Analgesia and anesthesia for neonates: study design and
ethical issues. Clinical Therapeutics, 27(6), 814-843.
Anand, K. J., & Craig, K. D. (1996). New perspectives on the definition of pain. Pain,
67(1), 3-6.

123
Anand, K. J., & Hickey, P. R. (1987). Pain and its effects in the human neonate and fetus.
New England Journal of Medicine, 317(21), 1321-1329.
Anand, K. J., & McGrath, P. J. (1995). On overview of current issues and their historical
background. In K. J. Anand & P. J. McGrath (Eds.), Pain in neonates: Pain
research and clinical management (Vol. 5, pp. 1-15). Amsterdam: Elsevier.
Anand, K. J., Sippell, W. G., & Aynsley-Green, A. (1987). Pain, anaesthesia, and babies.
Lancet, 2(8569), 1210.
Andrews, K., & Fitzgerald, M. (1994). The cutaneous withdrawal reflex in human
neonates: sensitization, receptive fields, and the effects of contralateral
stimulation. Pain, 56(1), 95-101.
Aranda, J. V., Carlo, W., Hummel, P., Thomas, R., Tutag-Lehr, V., & Anand, K. J.
(2005). Analgesia and sedation during mechanical ventilation in neonates.
Clinical Therapeutics, 27(6), 877-899.
Ballantyne, M., Stevens, B. J., McAllister, M., Dionne, K., & Jack, A. (1999). Validation
of the premature infant pain profile in the clinical setting. Clinical Journal of
Pain, 15(4), 297-303.
Bartocci, M., Bergqvist, L. L., Lagercrantz, H., & Anand, K. J. (2006). Pain activates
cortical areas in the preterm newborn brain. Pain, 122(1-2), 109-117.
Beacham, P. S. (2004). Behavioral and physiological indicators of procedural and
postoperative pain in high-risk infants. JOGNN - Journal of Obstetric,
Gynecologic, & Neonatal Nursing, 33(2), 246-255.
Benini, F., Johnston, C. C., Faucher, D., & Aranda, J. V. (1993). Topical anesthesia
during circumcision in newborn infants. Journal of the American Medical
Association, 270(7), 850-853.
Beyer, J. E., DeGood, D. E., Ashley, L. C., & Russell, G. A. (1983). Patterns of
postoperative analgesic use with adults and children following cardiac surgery.
Pain, 17(1), 71-81.
Bjoro, K., & Herr, K. (2008). Assessment of pain in the nonverbal or cognitively
impaired older adult. Clinics in Geriatric Medicine, 24(2), 237-262, vi.
Bould, M. D., & Sury, M. R. (2011). Defining awakening from anesthesia in neonates: a
consensus study. Pediatric Anesthesia, 21(4), 359-363.
Bozzette, M. (1993). Observation of pain behavior in the NICU: an exploratory study.
Journal of Perinatal and Neonatal Nursing, 7(1), 76-87.

124
Brahnam, S., Chuang, C. F., Shih, F. Y., & Slack, M. R. (2006). Machine recognition and
representation of neonatal facial displays of acute pain. Artificial Intelligence in
Medicine, 36(3), 211-222.
Butler-O'Hara, M., LeMoine, C., & Guillet, R. (1998). Analgesia for neonatal
circumcision: a randomized controlled trial of EMLA cream versus dorsal penile
nerve block. Pediatrics, 101(4), E5.
Byers, J. F., & Thornley, K. (2004). Cueing into infant pain. MCN, American Journal of
Maternal Child Nursing, 29(2), 84-89.
Cassel, E. J. (1982). The nature of suffering and the goals of medicine. New England
Journal of Medicine, 306(11), 639-645.
Chrysostomou, C., Schulman, S. R., Herrera Castellanos, M., Cofer, B. E., Mitra, S., da
Rocha, M. G., . . . Gramlich, L. (2014). A phase II/III, multicenter, safety,
efficacy, and pharmacokinetic study of Dexmedetomidine in preterm and term
neonates. The Journal of Pediatrics, 164(2), 276-282.
Cortina, J. M. (1993). What is Coefficient Alpha? An examination of theory and
application. Journal of Applied Psychology, 78(1), 98-104.
Cote, J. J., Morse, J. M., & James, S. G. (1991). The pain response of the postoperative
newborn. Journal of Advanced Nursing, 16(4), 378-387.
Craig, K. D. (2009). The social communication model of pain. Canadian Psychology,
50(1), 22-32.
Craig, K. D., Gilbert, C. A., & Lilley, C. M. (2000). Cry as an indicator of pain in infants.
In R. G. Barr, B. Hopkins & J. Green (Eds.), Crying as a signal, a sign, and a
symptom (pp. 23-40). London: MacKeigh Press.
Craig, K. D., McMahon, R. J., Morison, J. D., & Zaskow, C. (1984). Developmental
changes in infant pain expression during immunization injections. Social Science
& Medicine, 19(12), 1331-1337.
Craig, K. D., & Pillai Riddell, R. (2003). Social influences, culture and ethnicity. In G. A.
Finley & P. J. McGrath (Eds.), Pediatric pain: biological and social context (pp.
159-182). Seattle: IASP Press.
Craig, K. D., Prkachin, K. M., & Grunau, R. E. (1992). The facial expression of pain. In
D. C. Turk & R. Melzack (Eds.), Handbook of Pain Assessment (pp. 257-276).
New York: Guilford.

125
Craig, K. D., Whitfield, M. F., Grunau, R. V., Linton, J., & Hadjistavropoulos, H. D.
(1993). Pain in the preterm neonate: behavioural and physiological indices. Pain,
52(3), 287-299.
Crain, N., Slonim, A., & Pollack, M. M. (2002). Assessing sedation in the Pediatric
Intensive Care Unit by using BIS Scale. Pediatric Critical Care Medicine, 3(1),
11-14.
Cronbach, L. J. (1951). Coefficient Alpha and internal structure of tests. Psychometrika,
16, 297-334.
Curley, M. A., Harris, S. K., Fraser, K. A., Johnson, R. A., & Arnold, J. H. (2006). State
Behavioral Scale: a sedation assessment instrument for infants and young children
supported on mechanical ventilation. Pediatric Critical Care Medicine, 7(2), 107-
114.
Dale, J. C. (1986). A multidimensional study of infants' responses to painful stimuli.
Pediatric Nursing, 12(1), 27-31.
Debillon, T., Zupan, V., Ravault, N., Magny, J. F., & Dehan, M. (2001). Development
and initial validation of the EDIN scale, a new tool for assessing prolonged pain
in preterm infants. Archives of Disease in Childhood Fetal & Neonatal Edition,
85(1), F36-41.
DeVellis, R. F. (2003). Scale Development Theory and Application (Vol. 26). Thousand
Oaks, CA: Sage Publications.
DeVon, H. A., Block, M. E., Moyle-Wright, P., Ernst, D. M., Hayden, S. J., Lazzara, D.
J., . . . Kostas-Polston, E. (2007). A psychometric toolbox for testing validity and
reliability. Journal of Nursing Scholarship, 39(2), 155-164.
Duhn, L. J., & Medves, J. M. (2004). A systematic integrative review of infant pain
assessment tools. Advances in Neonatal Care, 4(3), 126-140.
Dunteman, G. H. (1989) Principal Components Analysis. Sage University Paper series
on Quantitative Applications in the Social Sciences: Vol. 07-069. Newbury Park,
CA: Sage.
Eland, J. M., & Anderson, J. E. (1977). The experinece of pain inchildren. In A. Jacox
(Ed.), Pain: A Source Book for Nurses and other Health Professionals (pp. 453-
373). Boston: Little, Brown, & Company.
Eriksson, M., Fremming, A., Gradin, M., Schollin, J., & Storm, H. (2003). Skin
conductance compared to behavioural and other physiological pain measures in

126
newborn infants. Paper presented at the Pediatric Academic Societies' Annual
Meeting, Seattle, WA.
Faye, P. M., De Jonckheere, J., Logier, R., Kuissi, E., Jeanne, M., Rakza, T., & Storme,
L. (2010). Newborn infant pain assessment using heart rate variability analysis.
Clinical Journal of Pain, 26(9), 777-782.
Fisichelli, V. R., Karelitz, S., Fisichelli, R. M., & Cooper, J. (1974). The course of
induced crying activity in the first year of life. Pediatric Research, 8(12), 921-
928.
Fitzgerald, M. (1999). Developmental neurobiology of pain. In R. Melzack (Ed.),
Textbook of Pain (pp. 235-252). Edinburgh, Scotland: Churchhill Livingstone.
Fitzgerald, M., & Anand, K. J. (1993). The developmental neuroanatomy and
neurophysiology of pain. In N. L. Schechter, C. Berde & M. Yaster (Eds.), Pain
Management in Infants, Children, and Adolescents (pp. 11-32). Baltimore:
Williams and Williams.
Fitzgerald, M., Shaw, A., & MacIntosh, N. (1988). Postnatal development of the
cutaneous flexor reflex: comparative study of preterm infants and newborn rat
pups. Developmental Medicine & Child Neurology, 30(4), 520-526.
Franck, L. S., & Miaskowski, C. (1997). Measurement of neonatal responses to painful
stimuli: a research review. Journal of Pain and Symptom Management, 14(6),
343-378.
Fuller, B. F. (1998). The process of infant pain assessment. Applied Nursing Research,
11(2), 62-68.
Fuller, B. F., & Conner, D. A. (1995). The effect of pain on infant behaviors. Clinical
Nursing Research, 4(3), 253-273.
Garten, L., Deindl, P., Schmalisch, G., Metze, B., & Buhrer, C. (2010). Parallel
assessment of prolonged neonatal distress by empathy-based and item-based
scales. European Journal of Pain, 14(8), 878-881.
Gedaly-Duff, V., & Huff-Slankard, J. (1998). Sleep as an indicator for pain relief in an
infant: a case study. Journal of Pediatric Nursing, 13(1), 32-40.
Goldman, R. D., & Koren, G. (2002). Biologic markers of pain in the vulnerable infant.
Clinics in Perinatology, 29(3), 415-425.
127
Goldstein, R. F., & Brazy, J. E. (1991). Narcotic sedation stabilizes arterial blood
pressure fluctuations in sick premature infants. Journal of Perinatology, 11(4),
365-371.
Gonsalves, S., & Mercer, J. (1993). Physiological correlates of painful stimulation in
preterm infants. Clinical Journal of Pain, 9(2), 88-93.
Grap, M. J., Pickler, R. H., & Munro, C. (2006). Observation of behavior in sedated,
mechanically ventilated children. Pediatric Nursing, 32(3), 216-220.
Grunau, R. E., & Craig, K. D. (1987). Pain expression in neonates: facial action and cry.
Pain, 28(3), 395-410.
Grunau, R. E., Holsti, L., Whitfield, M. F., & Ling, E. (2000). Are twitches, startles, and
body movements pain indicators in extremely low birth weight infants? Clinical
Journal of Pain, 16(1), 37-45.
Grunau, R. E., Oberlander, T., Holsti, L., & Whitfield, M. F. (1998). Bedside application
of the Neonatal Facial Coding System in pain assessment of premature neonates.
Pain, 76(3), 277-286.
Guinsburg, R., Kopelman, B. I., Anand, K. J., de Almeida, M. F., Peres Cde, A., &
Miyoshi, M. H. (1998). Physiological, hormonal, and behavioral responses to a
single fentanyl dose in intubated and ventilated preterm neonates. Journal of
Pediatrics, 132(6), 954-959.
Hadjistavropoulos, H. D., Craig, K. D., Grunau, R. V., & Johnston, C. C. (1994). Judging
pain in newborns: facial and cry determinants. Journal of Pediatric Psychology,
19(4), 485-491.
Hadjistavropoulos, T., & Craig, K. D. (2002). A theoretical framework for understanding
self-report and observational measures of pain: a communications model.
Behaviour Research and Therapy, 40(5), 551-570.
Hamers, J. P., Abu-Saad, H. H., van den Hout, M. A., & Halfens, R. J. (1998). Are
children given insufficient pain-relieving medication postoperatively? Journal of
Advanced Nursing, 27(1), 37-44.
Hamon, I., Hascoet, J. M., Debbiche, A., & Vert, P. (1996). Effects of fentanyl
administration on general and cerebral haemodynamics in sick newborn infants.
Acta Paediatrica, 85(3), 361-365.
Harrison, D., Boyce, S., Loughnan, P., Dargaville, P., Storm, H., & Johnston, L. (2006).
Skin conductance as a measure of pain and stress in hospitalised infants. Early
Human Development, 82(9), 603-608.

128
Herr, K., Coyne, P. J., Key, T., Manworren, R., McCaffery, M., Merkel, S., . . . American
Society for Pain Management, N. (2006). Pain assessment in the nonverbal
patient: position statement with clinical practice recommendations. Pain
Management Nursing, 7(2), 44-52.
Herr, K., Coyne, P. J., McCaffery, M., Manworren, R., & Merkel, S. (2011). Pain
assessment in the patient unable to self-report: position statement with clinical
practice recommendations. Pain Management Nursing, 12(4), 230-250.
Herrington, C. J., Olomu, I. N., & Geller, S. M. (2004). Salivary cortisol as indicators of
pain in preterm infants: a pilot study. Clinical Nursing Research, 13(1), 53-68.
Hicks, C. L., von Baeyer, C. L., Spafford, P. A., van Korlaar, I., & Goodenough, B.
(2001). The Faces Pain Scale-Revised: toward a common metric in pediatric pain
measurement. Pain, 93(2), 173-183.
Hockenberry, M. J., & Wilson, D. (2009). Pain Assessment and Management in Children
Wong's Essentials of Pediatric Nursing (8th ed.). St. Louis: Elsevier.
Holsti, L., Grunau, R. E., & Shany, E. (2011). Assessing pain in preterm infants in the
neonatal intensive care unit: moving to a 'brain-oriented' approach. Pain
Management, 1(2), 171-179.
Howard, V. A., & Thurber, F. W. (1998). The interpretation of infant pain: physiological
and behavioral indicators used by NICU nurses. Journal of Pediatric Nursing,
13(3), 164-174.
Hudson-Barr, D., Capper-Michel, B., Lambert, S., Palermo, T. M., Morbeto, K., &
Lombardo, S. (2002). Validation of the Pain Assessment in Neonates (PAIN)
scale with the Neonatal Infant Pain Scale (NIPS). Neonatal Network - Journal of
Neonatal Nursing, 21(6), 15-21.
Hullett, B., Chambers, N., Preuss, J., Zamudio, I., Lange, J., Pascoe, E., & Ledowski, T.
(2009). Monitoring electrical skin conductance: a tool for the assessment of
postoperative pain in children? Anesthesiology, 111(3), 513-517.
Hummel, P., Lawlor-Klean, P., & Weiss, M. G. (2010). Validity and reliability of the N-
PASS assessment tool with acute pain. Journal of Perinatology, 30(7), 474-478.
Hummel, P., Puchalski, M., Creech, S. D., & Weiss, M. G. (2008). Clinical reliability and
validity of the N-PASS: neonatal pain, agitation and sedation scale with
prolonged pain. Journal of Perinatology, 28(1), 55-60.
Hummel, P., & van Dijk, M. (2006). Pain assessment: Current status and challenges.
Seminars in Fetal & Neonatal Medicine, 11, 237-245.

129
Huth, M. M., & Moore, S. M. (1998). Prescriptive theory of acute pain management in
infants and children. Journal of the Society of Pediatric Nurses, 3(1), 23-32.
IASP. (1994). Pain terms, a current list with definitions and note on usage. In H. Merskey
& N. Bogduk (Eds.), Classification of Chronic Pain (2nd ed., pp. 209-314).
Seattle: IASP Press.
IASP. (2001). Announcement: Modification of pain definition. IASP Newsletter(2), 2.
Ista, E., van Dijk, M., Tibboel, D., & de Hoog, M. (2005). Assessment of sedation levels
in pediatric intensive care patients can be improved by using the COMFORT
"behavior" scale. Pediatric Critical Care Medicine, 6(1), 58-63.
JCAHO. (2000). Implementing the new pain management standards. Oak Brook Terrace,
IL: Joint Commission on Accreditation of Healthcare Organizations.
Johnston, C. C., Stevens, B. J., Craig, K. D., & Grunau, R. E. (1993). Developmental
changes in pain expression in premature, full-term, two- and four-month-old
infants. Pain, 52(2), 201-208.
Johnston, C. C., Stevens, B. J., Franck, L. S., Jack, A., Stremler, R., & Platt, R. (1999).
Factors explaining lack of response to heel stick in preterm newborns. Journal of
Obstetric, Gynecologic, and Neonatal Nursing, 28(6), 587-594.
Johnston, C. C., Stevens, B. J., Yang, F., & Horton, L. (1995). Differential response to
pain by very premature neonates. Pain, 61(3), 471-479.
Johnston, C. C., Stevens, B. J., Yang, F., & Horton, L. (1996). Developmental changes in
response to heelstick in preterm infants: a prospective cohort study.
Developmental Medicine and Child Neurology, 38(5), 438-445.
Johnston, C. C., & Strada, M. E. (1986). Acute pain response in infants: a
multidimensional description. Pain, 24(3), 373-382.
Kabes, A. M., Graves, J. K., & Norris, J. (2009). Further validation of the nonverbal pain
scale in intensive care patients. Critical Care Nurse, 29(1), 59-66.
Kaiser, H. F. (1974). An index of factorial simplicity. Psychometrika, 39(1), 31-36.
Kostovic, I., & Rakic, P. (1990). Developmental history of the transient subplate zone in
the visual and somatosensory cortex of the macaque monkey and human brain.
Journal of Comparative Neurology, 297(3), 441-470.

130
Krechel, S. W., & Bildner, J. (1995). CRIES: a new neonatal postoperative pain
measurement score. Initial testing of validity and reliability. Paediatric
Anaesthesia, 5(1), 53-61.
Lawrence, J., Alcock, D., McGrath, P. J., Kay, J., MacMurray, S. B., & Dulberg, C.
(1993). The development of a tool to assess neonatal pain. Neonatal Network -
Journal of Neonatal Nursing, 12(6), 59-66.
Lilley, C. M., Craig, K. D., & Grunau, R. E. (1997). The expression of pain in infants and
toddlers: developmental changes in facial action. Pain, 72(1-2), 161-170.
Loeser, J. D. (1982). Concepts of Pain. In M. Stanton-Hicks & R. A. Boas (Eds.),
Chronic low back pain (pp. 145-148). New York: Raven Press.
Loeser, J. D., & Melzack, R. (1999). Pain: an overview. Lancet, 353(9164), 1607-1609.
Malviya, S., Voepel-Lewis, T., Ludomirsky, A., Marshall, J., & Tait, A. R. (2004). Can
we improve the assessment of discharge readiness?: A comparative study of
observational and objective measures of depth of sedation in children.
Anesthesiology, 100(2), 218-224.
Malviya, S., Voepel-Lewis, T., Tait, A. R., Merkel, S., Tremper, K., & Naughton, N.
(2002). Depth of sedation in children undergoing computed tomography: validity
and reliability of the University of Michigan Sedation Scale (UMSS). British
Journal of Anaesthesia, 88, 241-245.
Marchand, S. (2008). The physiology of pain mechanisms: from the periphery to the
brain. Rheumatic Disease Clinics of North America, 34(2), 285-309.
Marx, C. M., Smith, P. G., Lowrie, L. H., Hamlett, K. W., Ambuel, B., Yamashita, T. S.,
& Blumer, J. L. (1994). Optimal sedation of mechanically ventilated pediatric
critical care patients. Critical Care Medicine, 22(1), 163-170.
Mather, L., & Mackie, J. (1983). The incidence of postoperative pain in children. Pain,
15(3), 271-282.
McCaffery, M., & Pasero, C. (1999). Assessment, underlying complexities,
misconceptions, and practical tools. In M. McCaffery & C. Pasero (Eds.), Pain:
clinical manual (2nd ed., pp. 35-102). St. Louis: Mosby.
McGrath, P. J., Johnson, G., Goodman, J. T., Schillinger, J., Dunn, J., & Chapman, J.
(1985). CHEOPS: a behavioral scale for rating postoperative pain in children. In
H. L. Fields, R. Dubner & F. Cervero (Eds.), Advances in Pain Research and
Therapy (Vol. 9, pp. 395-402). New York: Raven Press.
131
McGrath, P. J., Walco, G. A., Turk, D. C., Dworkin, R. H., Brown, M. T., Davidson, K., .
. . Zeltzer, L. (2008). Core outcome domains and measures for pediatric acute and
chronic/recurrent pain clinical trials: PedIMMPACT recommendations. Journal of
Pain, 9(9), 771-783.
McGraw, M. B. (1941). Neural maturation as exemplified in the changing reactions of
the infant to pinprick. Child Development, 12, 31-42.
McIntosh, N., Van Veen, L., & Brameyer, H. (1993). The pain of heel prick and its
measurement in preterm infants. Pain, 52(1), 71-74.
Melzack, R., & Wall, P. D. (1965). Pain mechanisms: A new theory. Science, 150, 971-
979.
Merkel, S. I., Voepel-Lewis, T., Shayevitz, J. R., & Malviya, S. (1997). The FLACC: a
behavioral scale for scoring postoperative pain in young children. Pediatric
Nursing, 23(3), 293-297.
Mundfrom, D. J., Shaw, D. G., & Ke, T. L. (2005). Minimum sample size
recommendations for conducting factor analyses. International Journal of
Testing, 5(2), 159-168.
Munsters, J., Wallstrom, L., Agren, J., Norsted, T., & Sindelar, R. (2012). Skin
conductance measurements as pain assessment in newborn infants born at 22-27
weeks gestational age at different postnatal age. Early Human Development,
88(1), 21-26.
Ng, E., Taddio, A., & Ohlsson, A. (2000). Intravenous midazolam infusion for sedation
of infants in the neonatal intensive care unit. Cochrane Database of Systematic
Reviews(2), CD002052.
Norman, E., Rosen, I., Vanhatalo, S., Stjernqvist, K., Okland, O., Fellman, V., &
Hellstrom-Westas, L. (2008). Electroencephalographic response to procedural
pain in healthy term newborn infants. Pediatric Research, 64(4), 429-434.
North America Nursing Diagnosis Association International. (2009). Nursing Diagnoses:
Definitions and Classification. 349-356.
Nunnally, J. C., & Bernstein, I. H. (1994a) Psychometric theory. New York: McGraw-
Hill, Inc.
Nunnally, J. C., & Bernstein, I. H. (1994b). Validity. In J. C. Nunnally & I. H. Bernstein
(Eds.), Psychometric theory (pp. 83-113). New York: McGraw-Hill, Inc.

132
Okado, N., Kakimi, S., & Kojima, T. (1979). Synaptogenesis in the cervical cord of the
human embryo: sequence of synapse formation in a spinal reflex pathway.
Journal of Comparative Neurology, 184(3), 491-518.
Osborne, J. W., & Costello, A. B. (2004). Sample size and subject to item ration in
principal components analysis. Practical Assessment, Research, & Evaluation,
9(11).
Owens, M. E., & Todt, E. H. (1984). Pain in infancy: neonatal reaction to a heel lance.
Pain, 20(1), 77-86.
Padhye, N. S., Williams, A. L., Khattak, A. Z., & Lasky, R. E. (2009). Heart rate
variability in response to pain stimulus in VLBW infants followed longitudinally
during NICU stay. Developmental Psychobiology, 51(8), 638-649.
Partanen, T. J., Wasz-Hockert, O., Vuorenkoski, V., Theorell, K., Valanne, E. H., &
Lind, J. (1967). Auditory identification of pain cry signals of young infants in
pathological conditions and its sound spectrographic basis. Annales Paediatriae
Fenniae, 13(2), 56-63.
Pasero, C., & McCaffery, M. (2005). No self-report means no pain-intensity rating.
American Journal of Nursing, 105(10), 50-53.
Payen, J. F., Bru, O., Bosson, J. L., Lagrasta, A., Novel, E., Deschaux, I., . . . Jacquot, C.
(2001). Assessing pain in critically ill sedated patients by using a behavioral pain
scale. Critical Care Medicine, 29(12), 2258-2263.
Pereira, A. L., Guinsburg, R., de Almeida, M. F., Monteiro, A. C., dos Santos, A. M., &
Kopelman, B. I. (1999). Validity of behavioral and physiologic parameters for
acute pain assessment of term newborn infants. Sao Paulo Medical Journal,
117(2), 72-80.
Pokela, M. L. (1994). Pain relief can reduce hypoxemia in distressed neonates during
routine treatment procedures. Pediatrics, 93(3), 379-383.
Prkachin, K. M. (2009). Assessing pain by facial expression: facial expression as nexus.
Pain Research and Management, 14(1), 53-58.
Quinn, M. W., Otoo, F., Rushforth, J. A., Dean, H. G., Puntis, J. W., Wild, J., & Levene,
M. I. (1992). Effect of morphine and pancuronium on the stress response in
ventilated preterm infants. Early Human Development, 30(3), 241-248.
Ramelet, A. S. (1999). Assessment of pain and agitation in critically ill infants.
Australian Critical Care, 12(3), 92-96.

133
Ramelet, A. S., Abu-Saad, H. H., Bulsara, M. K., Rees, N., & McDonald, S. (2006).
Capturing postoperative pain responses in critically ill infants aged 0 to 9 months.
Pediatric Critical Care Medicine, 7(1), 19-26.
Reilly, P. L., Simpson, D. A., Sprod, R., & Thomas, L. (1988). Assessing the conscious
level of infants and young children: a paediatric version of the Glasgow Coma
Scale. Childs Nervous System, 4(1), 30-33.
Rich, E. C., Marshall, R. E., & Volpe, J. J. (1974). The normal neonatal response to pin-
prick. Developmental Medicine & Child Neurology, 16(4), 432-434.
Rovner, S. (1986, Aug 13). Surgery without anesthesia: can preemies feel pain? Jill
Lawson's story. The Washington Post, pp. 7-8.
Schiavenato, M., & Craig, K. D. (2010). Pain assessment as a social transaction: beyond
the "gold standard". Clinical Journal of Pain, 26(8), 667-676.
Sessler, C. N., Gosnell, M. S., Grap, M. J., Brophy, G. M., O'Neal, P. V., Keane, K. A., . .
. Elswick, R. K. (2002). The Richmond Agitation-Sedation Scale: validity and
reliability in adult intensive care unit patients. American Journal of Respiratory
and Critical Care Medicine, 166(10), 1338-1344.
Simons, S. H., van Dijk, M., van Lingen, R. A., Roofthooft, D., Boomsma, F., van den
Anker, J. N., & Tibboel, D. (2005). Randomised controlled trial evaluating effects
of morphine on plasma adrenaline/noradrenaline concentrations in newborns.
Archives of Disease in Childhood Fetal and Neonatal Edition, 90(1), F36-40.
Slater, R., Cantarella, A., Franck, L. S., Meek, J., & Fitzgerald, M. (2008). How Well Do
Clinical Pain Assessment Tools Reflect Pain in Infants? PLoS Med, 5(6), e129.
Slater, R., Fabrizi, L., Worley, A., Meek, J., Boyd, S., & Fitzgerald, M. (2010).
Premature infants display increased noxious-evoked neuronal activity in the brain
compared to healthy age-matched term-born infants. Neuroimage, 52(2), 583-589.
Slater, R., Worley, A., Fabrizi, L., Roberts, S., Meek, J., Boyd, S., & Fitzgerald, M.
(2010). Evoked potentials generated by noxious stimulation in the human infant
brain. European Journal of Pain, 14(3), 321-326.
Staats, A. W. (1996). Behavior and Personality: Psychological Behaviorism. New York:
Springer.
Staats, P. S., Hekmat, H., & Staats, A. W. (2004). The psychological behaviorism theory
of pain and the placebo: its principles and results of research application.
Advances in Psychosomatic Medicine, 25, 28-40.

134
Stevens, B. J., & Johnston, C. C. (1994). Physiological responses of premature infants to
a painful stimulus. Nursing Research, 43(4), 226-231.
Stevens, B. J., Johnston, C. C., & Gibbins, S. (2000). Pain assessment in neonates. In K.
J. Anand, B. J. Stevens & P. J. McGrath (Eds.), Pain in Neonates (2nd ed., pp.
101-134). Amsterdam: Elsevier.
Stevens, B. J., Johnston, C. C., & Horton, L. (1994). Factors that influence the behavioral
pain responses of premature infants. Pain, 59(1), 101-109.
Stevens, B. J., Johnston, C. C., Petryshen, P., & Taddio, A. (1996). Premature Infant Pain
Profile: development and initial validation. Clinical Journal of Pain, 12(1), 13-22.
Streiner, D. L., & Norman, G. R. (2003). Health measurement scales: A practical guide
to their development and use (3rd ed.). Oxford: University Press.
Taddio, A., Katz, J., Ilersich, A. L., & Koren, G. (1997). Effect of neonatal circumcision
on pain response during subsequent routine vaccination. Lancet, 349(9052), 599-
603.
Taddio, A., O'Brien, L., Ipp, M., Stephens, D., Goldbach, M., & Koren, G. (2009).
Reliability and validity of observer ratings of pain using the visual analog scale
(VAS) in infants undergoing immunization injections. Pain, 147(1-3), 141-146.
Taddio, A., Ohlsson, A., Einarson, T. R., Stevens, B. J., & Koren, G. (1998). A
systematic review of lidocaine-prilocaine cream (EMLA) in the treatment of acute
pain in neonates. Pediatrics, 101(2), E1.
Taksande, A. M., Vilhekar, K. Y., Jain, M., & Chitre, D. (2005). Pain response of
neonates to venipuncture. Indian Journal of Pediatrics, 72(9), 751-753.
Trochim, W. M. K. (2001). The research methods knowledge base (2nd ed.). Cincinnati:
Atomic Dog Publishing.
Turkmen, A., Altan, A., Turgut, N., Vatansever, S., & Gokkaya, S. (2006). The
correlation between the Richmond agitation-sedation scale and bispectral index
during dexmedetomidine sedation. European Journal of Anaesthesiology, 23(4),
300-304.
Valkenburg, A. J., Niehof, S. P., van Dijk, M., Verhaar, E. J., & Tibboel, D. (2012). Skin
conductance peaks could result from changes in vital parameters unrelated to
pain. Pediatric Research, 71(4 Pt 1), 375-379.

135
Van Cleve, L., Johnson, L., Andrews, S., Hawkins, S., & Newbold, J. (1995). Pain
responses of hospitalized neonates to venipuncture. Neonatal Network - Journal
of Neonatal Nursing, 14(6), 31-36.
van Dijk, M., de Boer, J. B., Koot, H. M., Tibboel, D., Passchier, J., & Duivenvoorden,
H. J. (2000). The reliability and validity of the COMFORT scale as a
postoperative pain instrument in 0 to 3-year-old infants. Pain, 84(2-3), 367-377.
Van Dijk, M., & Tibboel, D. (2012). Update on pain assessment in sick neonates and
infants. Pediatric Clinics of North America, 59, 1167-1181.
Voepel-Lewis, T., Piscotty, R. J., Jr., Annis, A., & Kalisch, B. (2012). Empirical review
supporting the application of the "pain assessment as a social transaction" model
in pediatrics. Journal of Pain and Symptom Management, 44(3), 446-457.
von Baeyer, C. L., & Spagrud, L. J. (2003). Social development and pain in children. In
P. J. McGrath & G. A. Finley (Eds.), Pediatric pain: Biological and social
context (Vol. 26, pp. 81-97). Seattle: IASP Press.
von Baeyer, C. L., & Spagrud, L. J. (2007). Systematic review of observational
(behavioral) measures of pain for children and adolescents aged 3 to 18 years.
Pain, 127(1-2), 140-150.
Watson, J. B. (1913). Psychology as the behaviorist sees it. Psychological Review, 20,
158-177.
Wolf, A. R. (1993). Treat the babies, not their stress responses. Lancet, 342(8867), 319-
320.
Wolf, M., & Greisen, G. (2009). Advances in near-infrared spectroscopy to study the
brain of the preterm and term neonate. Clinics in Perinatology, 36(4), 807-834, vi.
Wong, D., & Baker, C. (1988). Pain in children: comparison of assessment scales.
Pediatric Nursing, 14(1), 9-17.

136
VITA
Patricia Hummel received her Associate Degree in Nursing from Iowa Central
Community College in 1975, Bachelor of Science Degree in Nursing from the University
of Kansas in 1982, and Master of Arts in Nursing from the University of Iowa in 1989.
She has practiced as a bedside nurse, transport nurse, charge nurse, Clinical Nurse
Specialist, and Advanced Practice Registered Nurse throughout the Midwest. Ms.
Hummel developed the Neonatal Pain, Agitation, and Sedation Scale (N-PASS) in 2000,
in response to a clinical need for a tool to measure ongoing pain and sedation in the
Neonatal Intensive Care Unit.
She completed two research studies to evaluate the N-PASS tool; one with
ongoing pain and sedation, and another with acute pain. She has been an invited speaker
nationally and internationally, educating nurses and physicians about the N-PASS tool
and pain in neonates. The N-PASS tool is used in over 350 institutions around the world,
and has been translated into several languages.