Psychoacoustics Survey Results - Workplace Unlimited Final Report.pdf · Our data did however...
32
Research Report v1.2, September 2015 Psychoacoustics Survey 1 Psychoacoustics Survey Results: Psychological Factors Affecting Noise Distraction Prepared for: Saint-Gobain Ecophon Created by: Nigel Oseland PhD CPsychol, Workplace Unlimited September 2015 v1.2 Tel: +44 7900 908193 Email: [email protected] Web: www.workplaceunlimited.com Twitter: @oseland
Transcript of Psychoacoustics Survey Results - Workplace Unlimited Final Report.pdf · Our data did however...
Research Report v1.2, September 2015
Psychoacoustics Survey 1
Psychoacoustics Survey Results:
Psychological Factors Affecting Noise Distraction
Prepared for:
Saint-Gobain Ecophon
Created by:
Nigel Oseland PhD CPsychol, Workplace Unlimited
September 2015
v1.2
Tel: +44 7900 908193
Email: [email protected]
Web: www.workplaceunlimited.com
Twitter: @oseland

Research Report v1.2, September 2015
Psychoacoustics Survey 2
Contents
Summary 3
1.0 Background 7
2.0 Methodology 8
2.1 Survey questions 8
2.2 Statistical analysis 9
2.3 Survey sample 9
2.4 Personality profiles 10
3.0 Results 11
3.1 Noise metrics 11
3.2 Primary and most effective workspace 13
3.3 Workspace and personality type 15
3.4 Noise and personality type 16
3.5 Noise and concentration 17
3.6 Perceived control and acoustic design 18
3.7 Screening ability and coping strategies 20
3.8 Socio-demographics 21
3.9 Combined factors 22
4.0 Discussion 23
4.1 Summary of findings 23
4.2 Interpretation of results 25
4.3 Practical implications 26
4.4 Original hypotheses 27
4.5 Conclusion 27
Appendices 28
A Big Five OCEAN personality types 28
B Survey questions 29
C Acoustic Design Index 31

Research Report v1.2, September 2015
Psychoacoustics Survey 3
Summary
Ecophon commissioned Workplace Unlimited to conduct a literature review of psychoacoustics,
exploring how factors such as personality impact on the perception of noise and affects
distraction from noise in the office. An on-line survey was conducted to test the hypotheses
generated by the literature review. The primary objective of the survey was to test whether
personality types, in particular extroversion, affect noise perception and distraction.
A new on-line survey was designed jointly by Workplace Unlimited and Ecophon. The survey
explored the relationship between noise distraction metrics and key variables such as
personality, work activities, primary workplace, acoustic design, the ability to screen noise and
demographics. We received 516 valid responses, providing a relatively small but nonetheless
valid sample size for analysis.
The survey included 44 sub-questions used to determine the respondents’ personality profile on
the Big Five Inventory (BFI), also known as OCEAN as it determines the strength of five
personality factors: Openness, Conscientiousness, Extroversion, Agreeableness and
Neuroticism. The respondents were sub-grouped into three categories, on each personality
factor, to represent those with low, medium and high scores relative to the other respondents.
Those with a rating below 1 standard deviation represented the lower extreme of the
personality scale and those with a rating above 1 standard deviation represented the upper
extreme. Some 68% of the respondents fit into the mid-range, with 16% of the sample at
either end of the personality scales.
When asked how noise affects the ability to work, three-quarters of our respondents reported
that they are negatively affected by the noise in their workplace. Our survey participants are
mostly distracted by nearby colleagues’ conversations, telephone calls and individuals with loud
voices; it should be noted that all these distractions are fundamentally behavioural issues. One-
quarter of the respondents had problems concentrating and another quarter said they are
interrupted mid-way through completing an important task.
We asked our survey respondents to estimate approximately how much their performance at
work is increased or decreased by the noise levels in their primary workspace. Two-thirds of our
sample believe that the noise level in their workplace is having a negative effect on their
performance (and only 10.1% say it has a positive effect), which is very poor. Furthermore, the
mean estimated impact of noise on work performance is -5.1%. Whilst this figure appears low it
should be noted that just a 5% increase in employee performance can off-set the cost of
building and operating an office property. So it appears that, for our sample, noise in the
workplace is indeed an issue and affects perceived performance.
Those who primarily work from home also rate the effectiveness of the design of their
workspace in reducing noise better than those who work at open-plan desks. Similarly, home-
workers perceive they have more control over the noise on their workplace than those at open-
plan desks. So, as expected, those working from home have more control over noise levels and
the design of their workspaces. The key question is whether the primary workplace affects the
perception of noise distraction and corresponding performance. Indeed, we found that those
who primarily work from home rate noise distraction as more positive than those working in
open-plan or private/shared offices. The largest effect was shown for “listening into nearby
conversations” and “distractions from colleagues’ conversations”.
Whilst the results show that working from home is good for minimising noise distraction, it does
not necessarily mean that the only solution to noise distraction is working from home. There
were no significant differences between the ratings of performance and productivity across the
primary workspaces. The respondents may be adapting to “get the job done” or their views on
what actually is productive work may vary; understanding adaptation is worthy of further study.

Research Report v1.2, September 2015
Psychoacoustics Survey 4
As expected, the home is the most popular setting selected for work requiring concentration,
but surprisingly it is one of the preferred spaces for telephone calls and it is also selected by
more for overall productivity than private offices. Meeting rooms and informal/breakout spaces
are considered effective for team-working and meeting colleagues, two major components of
productive working that are better supported by the traditional office. Interestingly, whilst
private/shared offices were selected for concentration and telephone calls, very few found them
effective for creativity, team-working and meeting colleagues. In terms of overall productivity,
the most popular space selected was the home, closely followed by the open-plan desk then
followed by the office. That the open-plan desk is more popular than private offices may partly
be because it offers connection and proximity to colleagues, and access to a variety of facilities
without feeling isolated. So, depending on the nature of work, neither private/shared offices nor
homes are the panacea for working environments and a selection of spaces are required. One
design challenge is ensuring the right mix of spaces and offering real choice.
Unexpectedly, despite being susceptible to noise, introverts find their open-plan desk more
effective than extroverts for carrying out work requiring concentration. It may be that having a
powerful computer, good connectivity, easy access to data or a fixed routine (office hours)
overrides any noise issues, which are tolerated. It may be possible that the introverts who want
to work at their desk have adopted a number of coping strategies that help them; but our data
did not support this. On the other hand, extroverts find the open-plan desk more effective for
team work. Those more extroverted also find meeting rooms and breakout spaces more
productive than their introverted colleagues.
Nevertheless, our data supports that introverts are more affected by noise than extroverts. The
estimated impact on performance of introverts is more negative than extroverts, and stress,
well-being, concentration and productivity are all rated slightly worse. The largest effect on the
noise distraction variables is for neuroticism. The less neurotic respondents are less affected by
noise; their ability to carry out work is less affected and the largest effect size is found for
concentration. Our more neurotic respondents are also more likely to miss a work deadline due
to noise.
There were some significant differences in noise distraction for those spending their time in
focus and concentration. However, the size of the effect was small which was not expected for
such a key variable, and all the other noise distraction variables did not cause any statistically
significant results. It may be possible that people who need to focus and concentrate have
learned to cope with or adapt to the noise levels. It may also be that the people who need to
focus are more diligent and just “get the job done” regardless of the distractions.
Our data did however reveal differences between the time that different personality types spend
in their work activities. An important finding is that the more introverted spend more time in the
office, more time in heads down work and more time in work requiring focus and concentration
than the extroverts. We also found that those spending 60% or more of their time carrying out
tasks requiring concentration and focus are slightly more neurotic and more introverted than
those spending less time concentrating. So the time spent concentrating may be confounded by
personality type i.e. there is an interaction between personality, time concentrating and the
effect on noise distraction.
The respondents who perceived they have more control over noise were less distracted by
noise. Those working primarily at home had more perceived control than their colleagues and
also less noise distraction. So perceived control appears to be the key variable rather than the
workplace per se. The challenge is to create office environments that have the same level of
perceived control and effective acoustic design as the home.

Research Report v1.2, September 2015
Psychoacoustics Survey 5
We created an Acoustic Design Index (ADI) based on a tally of weighted acoustic design factors
identified by the survey respondents. For example acoustic panels, soft tiled ceiling and
carpeted floors were considered positive. There is a good relationship between the percentage
performance and ADI scores, indicating that the ADI could be a useful simple tool for
determining good acoustic environments.
Our respondents were asked how good they are at screening out noise and distractions in their
primary workplace. We found that all of our noise variables are significantly affected by the
ability to screen and the size of effect is one of the strongest we found. We also found good
correlations with all our noise metrics and the ability to screen, accounting for up to 26% of the
variation in ratings of noise. Screening was also weakly correlated with all personality factor
ratings, but not strongly related to any one personality type as shown in previous studies. The
ability to screen out noise requires further investigation to understand whether it is learned or
an innate capability. If learned then perhaps those good at screening can educate their
colleagues.
The alternative to being able to naturally screen out noise, or to adapt to noise, is to cope with
it in some other way. Moving away from the source of noise distraction, either by going outside
the office or moving to a quiet area are the primary coping mechanisms. Unexpectedly, there
were also a high proportion of respondents who say they come in early or work late to avoid
noise and who wear headphones at work. Interestingly, fewer respondents say they raise the
issue with colleagues, so they learn to cope in other ways rather than challenge. The number of
coping strategies employed is also weakly correlated with perceived control.
Unexpectedly, our older respondents perceive noise to be slightly less of an issue than the
younger ones. We were anticipating that the younger respondents coped better in noisy
environments whereas it appears the older ones may have adapted to their acoustic
environment. A more cynical view might be that the older respondents have poorer hearing so
are less affected by noise, but this is not general consensus in the literature. A more recognised
problem with aging is distinguishing speech in noisy environments.
When considering all the variables in our survey, the ones that repeatedly predict noise
distraction are: the ability to screen noise, design effectiveness, time working at home and
perceived control. Personality types such as extroversion, openness and neuroticism also
contribute to noise distraction. In addition, the time in heads-down work had an effect on
distraction and age affected ratings of productivity. These variables predict up to 27% of the
variance1 in ratings of productivity. Furthermore, these variables also contribute to 40% of the
variation in how the respondents believe noise affects their concentration, with 26% of the
effect on distraction and 25% of the variation in the ability to carry out work. Therefore our
data has unearthed variables accounting for up 40% of the response to noise.
Our literature review reported that the impact of sound on noise perception and distraction is
typically 25% whereas the other 75% is due to other psychological factors. So again, whilst the
40% effect we found was not as large as anticipated 75%, there is definitely a trend supporting
our hypotheses. Adding our 40% psychological effect to the 25% physical, implies we can
account for (i.e. predict) 65% of the response to noise. So as originally proposed in the
literature review, there is a need to consider and resolve the psychological and behavioural
factors that impact on noise as well as the physical.
1 Variance describes how much a random variable differs from its expected value. So 100% variance
means that the independent variables (i.e. background factors) fully explain the dependent variable (i.e.
response to noise).

Research Report v1.2, September 2015
Psychoacoustics Survey 6
Our analysis clearly shows that noise is an issue that affects performance at work, in particular
concentration. We found many statistically significant results but in many cases the size of the
effect was not as great as expected or observed in studies reported in our literature review. This
smaller than anticipated effect of noise may be for a number of reasons including: i) carrying
out research on the “real world” rather than laboratory based, ii) the need to complete work
tasks even if distracted, and iii) adaptation, coping strategies and the ability to screen.
The survey revealed that those who work primarily at home are less distracted by noise than
those in the open-plan and private or shared offices. However, the range of settings in the office
environment was shown to support team-working, creativity and meetings etc. So, the noise
issue is not just about open-plan versus private offices, as is often the focus. A choice of
working environments is required to suit different activities and personalities. But office
environments do need to cater more for work requiring focus and concentration, without placing
people in boxes, and this is the biggest challenge facing interior designers.

Research Report v1.2, September 2015
Psychoacoustics Survey 7
1.0 Background
Towards the end of 2014, Ecophon commissioned Workplace Unlimited to conduct a literature
review of psychoacoustics. The focus of the study was on how factors such as personality
impacts on the perception of noise and affects distraction from noise in the office. The
corresponding report (Oseland and Hodsman, 20152) was well received and forms the basis of a
chapter on acoustics in the forthcoming book Ergonomic Design for Healthy and Productive
Workplaces.
The review resulted in a series of hypotheses that require testing:
1. Extroverted office workers can cope better with noisy environments whereas introverts will
perform better under quieter conditions.
2. Co-locating introverts and separating them from extroverts will help manage noise
distraction.
3. Co-locating teams will help manage noise distraction from meaningful speech.
4. Perceived control over noise will reduce the problem of poorer performance caused by noise
distraction.
5. Offering choice over alternative work-settings in the office will reduce noise distraction and
improve performance.
6. Occasional working from home reduces noise distraction and will improve performance.
7. Educating employees in how to behave in open-plan environments and introducing office
etiquette around noise will reduce noise distraction.
8. Activity-based, acoustically sensitive designed spaces create better environments for both
introverts and extroverts.
9. Applying a combined approach of worker psychology mapping and acoustic design will
improve worker performance.
The next step was therefore to verify the hypotheses through the means of an on-line survey.
However, the primary objective of the survey was to test whether personality types, in
particular extroversion, affect noise perception and distraction. This paper describes the main
results and conclusions drawn from the survey.
2 Oseland N A and Hodsman P (2015) Planning for Psychoacoustics: A Psychological Approach to Resolving
Office Noise Distraction. Research report, April. Berkhamsted: Workplace Unlimited.

Research Report v1.2, September 2015
Psychoacoustics Survey 8
2.0 Methodology
2.1 Survey questions
The core methodology was a new on-line survey, designed jointly by Workplace Unlimited and
Ecophon, and hosted by Survey Monkey. The survey was developed to explore the relationship
between noise distraction and key variables such as personality, work activities, primary
workplace, acoustic design, the ability to screen noise and demographics. The survey included
100 questions distributed across seven sections/screens.
The first question included 44 sub-questions used to determine the respondents’ personality
profile on the Big Five Inventory (BFI) developed by the University of California Berkeley3. The
BFI, also known as OCEAN, determines the strength of five personality factors: Openness (O),
Conscientiousness (C), Extroversion (E), Agreeableness (A) and Neuroticism (N). The
personality types are explained further in Appendix A.
The main noise questions or metrics (dependent variables) are:
1. Approximately how much is your performance at work increased or decreased by the noise
levels in your primary workspace?
2. How do the noise levels in your primary workspace affect your ability to carry out work?
3. Do you believe that the noise levels in your primary workspace are affecting your … well-
being? ... stress levels? ... productivity?
4. Concentration factor (mean of 7 questions)
5. Talking factor (mean of 6 questions)
6. Distraction factor (mean of 5 questions)
The other questions on noise distraction and other factors (independent variables) are listed in
Appendix B and the full survey can be viewed at: www.surveymonkey.com/r/psychoacoustics.
The performance at work question (1 above) is based on that administered as part of the Office
Environment Survey4 since 1987, and uses a similar 9-point response scale but ranging from 1
= “-20%” to 5 = “0%” to 9 = “+20%”.
The ability to work question (2 above) was rated 5-point scale where 1 = ”makes work
impossible” (poor), 2 = “makes work very difficult”, 3 = “makes work difficult”, 4 = “makes
work slightly difficult” and 5 = “has no effect” (good).
In contrast, the well-being, stress and productivity questions (3 above) were rated using a scale
of 1 = “definitely not” (good), 2 = not really”, 3 = a little, 4 = “mostly” and 5 = very much so”
(poor). In hindsight, these questions could have also been interpreted as a more positive effect
with 1 = poor and 5 = good, but we believe that the interpretation was the former as it followed
the other questions on noise distraction, described below.
The three factors (4-6 above) are based on a series of questions on noise distraction such as
“Over the last week have you had problems concentrating”. The response scale for these
questions was 1 = ”never” (good), 2 = “rarely”, 3 = “sometimes”, 4 = often” and 5 = “all the
3 John O P, Donahue E M and Kentle R L (1991) The Big Five Inventory - Versions 4a and 54. Berkeley,
CA: UC Berkeley.
4 Wilson S and Hedge A (1987) Office Environment Survey. London: Building Use Studies Ltd.

Research Report v1.2, September 2015
Psychoacoustics Survey 9
time” (poor). The three factors were derived using factor analysis5 of all the questions on noise
distraction and performance (the dependent variables).
2.2 Statistical analysis
The results presented in this report are all statistically significant (p<0.05), determined using
the Statistics Package for Social Scientists (SPSS). The size of the effect when comparing
groups (tests of difference) was measured by eta2 and when comparing relationships
(correlations) variance (r2) was used as the measure. In general, an eta2 and r2 of <0.1 is
considered small, whereas 0.1-0.2 is medium and >0.2 is large.
2.3 Survey sample
Merlin Events & Marketing, who organise the Workplace Trends series of conferences, invited
their database to participate in the survey. Ecophon also sent emails requesting their clients to
take part in the study. Calls to participate were also made via relevant LinkedIn groups such as
Acoustic Bulletin and Twitter feeds.
We received 547 responses, but 31 came after the deadline so were excluded resulting in 516
valid responses. Due to using social media the number of invites is not certain, but we estimate
a response rate in the region of 5-10%. Whilst this is not high, we believe the number of
responses and survey sample characteristics are sufficient to offer worthwhile, statistically valid,
analysis.
Half (the majority) of responses came from the UK (50.2%), with a further 18.6% coming from
the Netherlands; see figure below.
Figure 1 Survey sample
The sample included a range of occupations but there was a higher proportion of Architects,
Designer and Engineers (17.4%) and consultants or advisors (16.1%). The sample also included
5.8% of Acousticians and 4.7% Project Managers, and Surveyors. So our sample is mostly from
the construction industry and therefore probably more informed in acoustics matters.
5
A Principal Component Analysis with Rotated Component Matrix was computed. The questions with a
factor loading greater than 0.5 were ascribed to the factor grouping.

Research Report v1.2, September 2015
Psychoacoustics Survey 10
2.4 Personality profiles
The primary objective of the survey was to test whether different personality types, in particular
extroversion, affects noise perception and distraction. It is therefore important that the sample
includes a range of personality types. Figure 2 shows that our sample is normally distributed
across each of the Big Five (OCEAN) personality types; the mean ( ̅) rating and standard
deviation (σ) are shown for each personality factor.
Figure 2 Distribution of scores on OCEAN personality types
The developers of the Big Five Personality Inventory
recommend that the respondents are sub-grouped into
three categories, on each personality factor, to
represent those with low, medium and high scores
relative to the other respondents in the sample. So
those with a rating below 1 standard deviation (-1σ) of
the mean average were considered low scoring and
representing one end of the personality scale; they
represent around 16% of our respondents. Those with
a rating above 1σ of the average were considered high
scoring and representing the other end of the
personality scale; they also represent around 16% of
our respondents. The majority (68%) of the
respondents fit into the mid-range, with a personality
score within ±1σ of the mean; see Figure 3. This
grouping into three broad categories allowed us to
compare the preferences of those at extreme ends of
the five personality factors. Figure 3 Calculating extreme scores

Research Report v1.2, September 2015
Psychoacoustics Survey 11
3.0 Results
3.1 Noise metrics
When asked “Do you believe that the noise levels in your primary workspace are affecting your
productivity?” one-quarter (26.1%) of all of our respondents replied “very much so” or
“mostly”. A further one-third (36.4%) replied “a little” such that two-thirds of our respondents
believe they are affected by office noise; see Figure 4.
Figure 4 Effect of noise on productivity Figure 5 Effect of noise on ability to work
Similarly, when asked “How do the noise levels in your primary workspace affect your ability to
work?” three-quarters (77.8%) of respondents reported that they are negatively affected by the
noise in their workplace; see Figure 5. So it appears that, for our sample, noise in the
workplace is indeed an issue and affects perceived performance.
The survey also included a series of questions asking how the workplace affected concentration
and distraction etc. Figure 6 shows that one-quarter (25.3%) of the respondents had problems
concentrating often or all the time, which is significant. An even higher proportion (42.4%) of
the sample found themselves listening into conversations. This is not necessarily a bad thing as
conversations assist tacit knowledge and can help with reducing the time to complete work
tasks. In contrast, conversations unrelated to the task in hand can be distracting.
% Responses
Figure 6 Over the last working week in your primary workspace, have you …
Research Report v1.2, September 2015
Psychoacoustics Survey 12
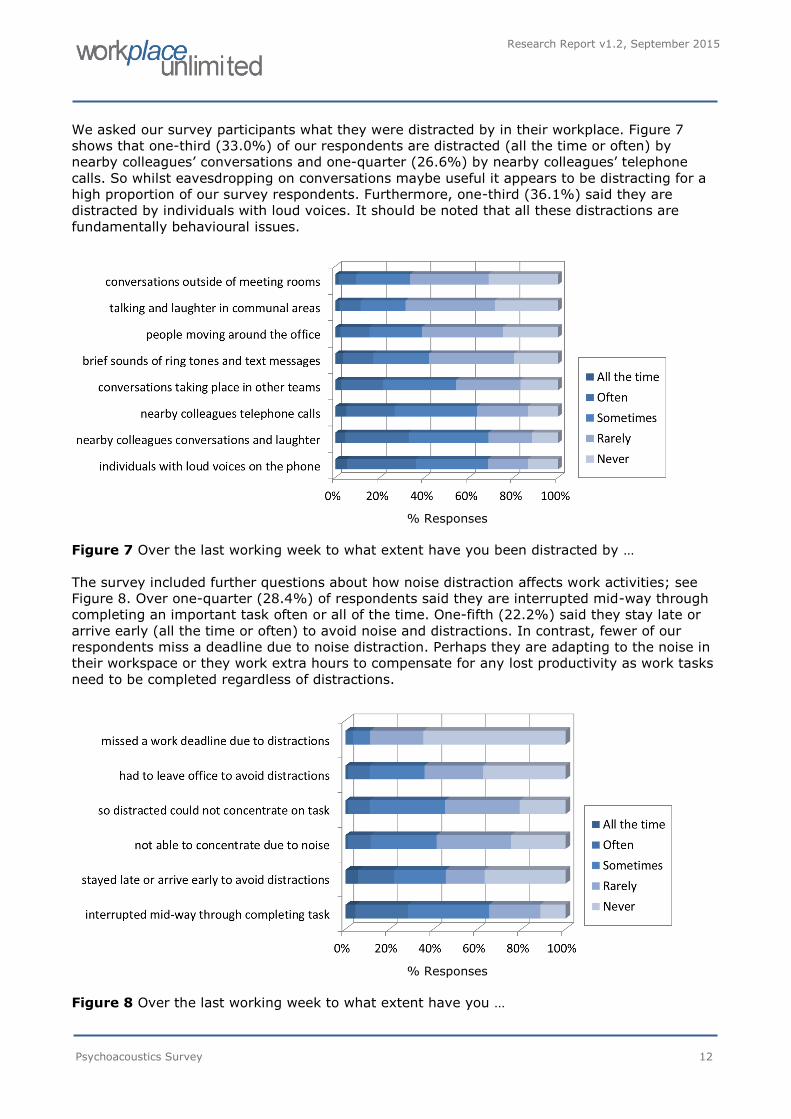
We asked our survey participants what they were distracted by in their workplace. Figure 7
shows that one-third (33.0%) of our respondents are distracted (all the time or often) by
nearby colleagues’ conversations and one-quarter (26.6%) by nearby colleagues’ telephone
calls. So whilst eavesdropping on conversations maybe useful it appears to be distracting for a
high proportion of our survey respondents. Furthermore, one-third (36.1%) said they are
distracted by individuals with loud voices. It should be noted that all these distractions are
fundamentally behavioural issues.
% Responses
Figure 7 Over the last working week to what extent have you been distracted by …
The survey included further questions about how noise distraction affects work activities; see
Figure 8. Over one-quarter (28.4%) of respondents said they are interrupted mid-way through
completing an important task often or all of the time. One-fifth (22.2%) said they stay late or
arrive early (all the time or often) to avoid noise and distractions. In contrast, fewer of our
respondents miss a deadline due to noise distraction. Perhaps they are adapting to the noise in
their workspace or they work extra hours to compensate for any lost productivity as work tasks
need to be completed regardless of distractions.
% Responses
Figure 8 Over the last working week to what extent have you …

Research Report v1.2, September 2015
Psychoacoustics Survey 13
We asked our survey respondents to estimate approximately how much their performance at
work is increased or decreased by the noise levels in their primary workspace. We converted
the percentage responses on the 9-point scale into a negative, zero and positive effect. Figure 9
shows that two-thirds (64.9%) of our respondents believe that the noise level in their workplace
is having a negative effect on their performance, and more importantly only 10.1% say it has a
positive effect, which is very poor. In comparison, one-half (50.2%) of respondents reported
that the overall workplace has a negative effect, therefore noise is a greater concern.
Figure 9 How much is performance affected by noise levels
Using the same question, the mean estimated impact of noise on work performance is -5.1%
decrease in productivity. Whilst this figure appears low it should be noted that just a 5%
increase in employee performance can off-set the cost of building and operating an office
property. The mean overall effect of the workplace on performance is -3.2%, and if that is
considered the benchmark (norm) then it might be argued that noise has a -1.9% effect, which
is similar to the -1.7% previously predicted by Oseland and Burt6.
3.2 Primary and most effective workspace
The respondents were asked to identify their primary place of work. Over one-half (53.9%)
primarily work at an open-plan desk, with one-third (36.6%) at a fixed desk and 17.3% working
at a hot/flexi desk. One-quarter of the sample worked in a private or shared enclosed office,
which seems high but may reflect the respondents outside of the UK. A further 17.8% of
respondents worked mainly from home but few (1.3%) use a co-working hub as their main
workspace. Other than co-working there is a good range of primary workspaces to allow further
analysis. For simplicity, the seven sub-groups were recoded as three: desk, office and home.
Figure 10 Reported primary place of work
6 Oseland N A and Burton A (2012) Quantifying the impact of environmental conditions on worker
performance for inputting to a business case to justify enhanced workplace design features. Journal of
Building Survey, Appraisal and Valuation, 1 (2), 151–164.

Research Report v1.2, September 2015
Psychoacoustics Survey 14
Figure 11 shows that the respondents who
primarily work from home rate the effectiveness of
the design of their workspace in reducing noise
better than those who primarily work at open-plan
desks (p<0.001, F=8.52, eta2=0.04). Similarly,
home-workers perceive they have more control
over the noise on their workplace than those at
open-plan desks (p<0.001, F=28.8, eta2=0.11).
So, as expected, those working from home have
more control over noise levels and the design of
their workspaces. The key question to focus on is
whether the primary workplace affects the
perception of noise distraction and corresponding
performance.
Table 1 below shows the ratings on a 1 to 5 point
scale (where 1 = ”never” i.e. good and 5 = “all the
time” i.e. poor) in response to the various
questions on noise distraction. The table shows
that overall those who primarily work from home
rate noise distraction as more positive (a lower rating) than those working in open-plan or
offices. All results are statistically significant but the largest effect was shown for “listening into
nearby conversations” and “distractions from colleagues’ conversations”.
Table 1 Ratings of noise distraction metrics by primary workspace
Whilst the results show that working from home is good for minimising noise distraction, it does
not necessarily mean that the only solution to noise distraction is working from home. Indeed,
there are no significant differences across the primary workspaces between the specific
questions and ratings of performance and productivity. The respondents may be adapting to
“get the job done” or their views on what is productive work may vary. For example, for some
workers meeting colleagues, sharing ideas and delegating work may be considered their key
deliverables; for others it may be analysis, processing or written outputs that are the main
deliverable. We suspect that as concentration and distraction are affected then performance
efficiency will also be degraded, even if output is maintained.
Figure 11 Rating of design and
control by workspace

Research Report v1.2, September 2015
Psychoacoustics Survey 15
The survey also requested that respondents select the two most effective spaces for carrying
out various work activities. The respondents were asked where they are most creative and have
their best ideas and where they are most effective at conducting work requiring concentration
etc. Table 2 shows the results with the frequency of responses above 30% shown in and orange
above 40% shown in red.
Table 2 Percentage of selected preferred workspace for different activities
The above table reveals that the home in particular, but also informal/breakout space and
outside areas, are most effective for creative work rather than traditional work environments.
As expected, the home is the most popular setting selected for work requiring concentration.
Surprisingly it is also one of the preferred spaces for telephone calls, perhaps due to late or
early overseas teleconferences or making confidential calls. Meeting rooms and
informal/breakout spaces are considered effective for team-working and meeting colleagues,
two major components of productive working that are better supported by the traditional office.
Interestingly, whilst private/shared offices were selected for concentration and telephone calls
very few found them effective for creativity, team-working and meeting colleagues. In terms of
overall productivity, the most popular space selected was the home, followed by the open-plan
desk then followed by the office. So, depending on the nature of work, neither private/shared
offices nor homes are the panacea for working environments. The results presented here are
similar to our previous study of collaboration spaces7.
3.3 Workspace and personality type
Table 2 showed that the most effective spaces depend upon the work activity. Table 3 also
shows that some of the preferred workspaces vary by personality type (indicated using the
OCEAN abbreviations). Note the red letter indicates a negative effect on the personality scale,
so for example an E indicates introversion. Only statistically significant differences (p<0.01) are
reported in the table.
The table reveals some interesting results. Firstly, despite being susceptible to noise, introverts
find their open-plan desk more effective than extroverts (E) for carrying out work requiring
concentration. It may be that having a good computer, connectivity and access to data
overrides any noise issues, which are tolerated or learned to cope with. On the other hand,
7 Oseland N A (2003) Personality and Preferences for Interaction. Occasional Paper WPU-OP-03,
December. Berkhamsted: Workplace Unlimited.

Research Report v1.2, September 2015
Psychoacoustics Survey 16
extroverts rather than introverts find the open-plan desk more effective for team work. Those
more extroverted also find meeting rooms and breakout spaces more productive than their
introverted colleagues. So, as previously suggested in our literature review, the spaces provided
should reflect the make-up of personality types.
Table 3 Preferred workspaces for different personality types
Those more open (O) minded find outside more effective for creativity whereas those less open
to new ideas prefer their open-plan desk. Those more open also find café, bars and restaurants
more effective for work requiring concentration – possibly spaces that help avoid being
disturbed by colleagues. Respondents who were more agreeable (A) found breakout space more
effective for creativity and productivity. The less agreeable do not highly rate the home for
team-working or productivity.
Unexpectedly, those less conscientious (C) volunteered they find working at home or in a
private office effective for team-working. However, the more conscientious find meeting rooms
more effective for creativity than the less conscientious. Those more emotionally stable find
their open-plan desk is effective for meeting colleagues, whereas in contrast, the more neurotic
(N) prefer meeting a private office.
3.4 Noise and personality type
The table overleaf shows the ratings of noise distraction on a 1 to 5 point scale (where 1 =
”never” i.e. good and 5 = “all the time” i.e. poor) in response to the various questions on noise
distraction. Table 4 also shows the estimated percentage of performance affected by noise and
ability to work on a 1 to 5 point scale (where 1 = ”makes work impossible” i.e. poor and 5 =
“has no effect” i.e. good).
The table shows that the more introverted (i.e. less extroverted) respondents are more affected
by noise than the extroverts. The estimated impact on performance of introverts is more
negative than extroverts, and stress well-being, concentration and productivity are all rated
more poorly. Unexpectedly there is no significant effect on talking, distraction or the ability to
carry out work. Noise is clearly a complicated subject producing some results that don’t always
match our predictions. In this case it appears that the distraction from colleagues talking and
other factors is not the main source of difference between introverts and extroverts, but
nevertheless the concentration and performance of introverts is affected.
The largest effect on the noise distraction variables is for neuroticism. The more emotionally
stable (less neurotic) respondents are less affected by noise; their ability to carry out work is
less affected and the largest effect size is found for concentration.

Research Report v1.2, September 2015
Psychoacoustics Survey 17
Similarly, the less conscientious are more affected by noise than their conscientious colleagues.
In particular, performance, ability to carry out work, productivity, concentration and well-being
are negatively affected. These effects are all statistically significant but the size of effect is
relatively small.
Table 4 Noise metrics by personality types
The table also shows that there are some small effects for the agreeableness but no significant
(N/S) effects for openness.
Looking in detail at the individual questions that make up the three noise factors at the bottom
of the table, we found that the more neurotic (p<0.01, F=4.9, eta2=0.02) and less
conscientious (p<0.01, F=6.1, eta2=0.02) are more likely to miss a work deadline due to noise
distraction.
In summary, there appear to be some statistically significant but nevertheless small effect of
personality types on noise distraction. The data is not as clear as expected but there is sufficient
evidence to show a trend where distraction from noise is partially dependent on personality.
3.5 Noise and concentration
The research literature reports very strong links between work requiring concentration and the
impact of noise distraction. So our survey participants were asked “During a typical working
week, approximately what percentage of the time do you carry out tasks that require focus and
concentration? The response has been recoded as 1-40%, 41-59% and 60%+.
Table 5 overleaf shows that there were some significant differences in noise distraction for
those spending their time in focus and concentration. However, the size of the effect was small
(eta2<0.1) which was not expected for such a key variable, and all the other noise distraction
variables did not cause any statistically significant results. This result was not affected by
filtering for those who spend most of their time in the office or for those who use headphones
etc. It may be possible that people who need to focus and concentrate have learned to cope
with or adapt to the noise levels. It may also be that the people who need to focus are more
diligent and just “get the job done” regardless of the distractions. Despite there being some
minor effects of the time spent concentrating on noise distraction, overall this is an unexpected
result.

Research Report v1.2, September 2015
Psychoacoustics Survey 18
Table 5 Noise metrics by percentage time spent in concentration
Our data did however reveal differences between the time different personality types spend in
their work activities. Table 6 shows the mean time/ratings for the personality types; only
statistically significant results are displayed. An important finding is that the less extroverted
(more introverted) spend more time in the office and in heads down work. They also spend
more time in work requiring focus and concentration (rated on a scale 1 = 0-20%, 2 = 21-40%,
3 = 41-60%, 4 = 61-80% and 5 = “81-100%”).
Table 6 Time in work activities by personality types
Similarly, the more neurotic spend more time in heads down work and in work requiring focus
and concentration. The less conscientious spend less time working at home whereas the more
open-minded spend more time working at home; perhaps because working from home is still
considered a relatively new concept and not a “proper” working environment. There were no
significant (N/S) results for agreeableness. These results are consistent with those found in our
previous study of collaboration5. As reported before, offices need to be designed to cater for the
introverts and neurotics who spend more time in them than their personality counterparts.
We also found that those spending 60% or more of their time carrying out tasks requiring
concentration and focus are more neurotic (p<0.01, t=-3.0) and less extroverted (p<0.001, t=-
5.0) than those spending less time concentrating.
Table 6 also implies that the effect of noise distraction on the time spent concentrating may be
confounded by personality type i.e. there is an interaction between personality, time
concentrating and the effect on noise distraction. This hypothesis was not supported through
the data (two-way ANOVA) but this may be due to sample size limitations.

Research Report v1.2, September 2015
Psychoacoustics Survey 19
3.6 Perceived control and acoustic design
The respondents who perceived they have more control over noise (1 = “Definitely not” and 5 =
“Very much so”) were less distracted by noise. Table 7 overleaf shows that the noise variables
were all statistically significant; the size of the effect was largest for talking and concentration.
Those working primarily at home had more perceived control than their colleagues (Figure 11)
and also less noise distraction (Table 1). So perceived control appears to be the key variable
rather than the workplace per se. The challenge is to create office environments that have the
same level of perceived control as the home.
Table 7 Noise metrics by perceived control
We created an Acoustic Design Index (ADI) based on a tally of weighted (-1 to +2) acoustic
design factors identified by the survey respondents. For example acoustic panels, soft tiled
ceiling and carpeted floors were considered positive, and higher weighted, design features; the
full list of design elements provided in Appendix C. Figure 7 shows the relationship between the
mean percentage performance and binned ADI scores8. There is a good correlation (r=0.49,
r2=24%, p=0.05) between performance and ADI indicating that the ADI could be a useful
simple tool for determining good acoustic environments.
Figure 12 Perceived performance by Acoustic Design Index
8 The ADI scores were binned into unit scores ranging from -5 to 12 and the mean performance computed
for each bin. The regression analysis was weighted to account for the number of responses by bin.

Research Report v1.2, September 2015
Psychoacoustics Survey 20
The respondents were also asked to rate the effectiveness of the design of their primary
workplace for reducing noise. Table 8 shows that there are good correlations between the noise
metrics and perceived control, design effectiveness and the ability to screen (see next section).
Perceived control accounts for 23% of the variation in the concentration factor scores and
design effectiveness for 16%. Whilst the variances shown in Table 8 may not be as high as
expected, they are all contributory factors to noise distraction.
Table 8 Relationship between noise metrics, control, design and screening
3.7 Screening ability and coping strategies
The respondents were asked how good they are at screening out noise and distractions in their
primary workplace. As shown in Table 8 there are good correlations with all the noise metrics
and screening ability, accounting for up to 26% of the variance in responses. Table 9 also shows
that the noise variables are all significantly affected by ability to screen and the size of effect is
one of the strongest we found.
Table 9 Noise metrics by screening ability
The ability to screen out noise has previously been found to be a key variable in the research
literature, but it is unclear what underlines the ability or whether it is a separate personality

Research Report v1.2, September 2015
Psychoacoustics Survey 21
factor. We did find weak correlations between the ability to screen and the five personality
factors: Open (r=0.11, p<0.05), Conscientiousness (r=0.21, p<0.001), Extroversion (r=0.11,
p<0.05), Agreeableness (r=0.11, p<0.001) and Neuroticism (r=-0.34, p<0.001). However, no
one of the Big Five personality types was associated with screening ability. If screening is a
learned skill then perhaps natural screeners can educate their less-fortunate colleagues.
The alternative to being able to naturally screen out noise, or to adapt to noise, is to cope with
it in some other way. We therefore asked our survey participants to select the main ways they
deal with noise distraction. Figure 13 shows that moving away from the source of noise
distraction, either by going outside the office (46%) or moving to a quiet area (41%) are the
primary coping mechanisms. The high proportion of respondents who say they come in early or
work late to avoid noise (39%) and the numbers that wear headphones at work (38%) was
unexpected. Interestingly, fewer respondents say they raise the issue with colleagues (15%).
Figure 13 Noise coping mechanisms
3.8 Socio-demographics
A few basic background questions were asked. For example, we found statistically significant
differences in some the noise variables across age groups. Table 10 shows that, unexpectedly,
the older respondents perceive noise to be slightly less of an issue than the younger ones. We
were anticipating that the younger respondents coped better in noisy environments whereas it
appears the older ones may have adapted to their acoustic environment. A more cynical view
might be that the older respondents have poorer hearing so are less affected by noise, but this
is not general consensus in the literature. A more recognised problem with ageing is
distinguishing speech in noisy environments; but our data did not support this.
Table 10 Noise metrics by age of respondent
Research Report v1.2, September 2015
Psychoacoustics Survey 22
Some minor effects of organisation size were found. Those in smaller organisations (1-14
people) rated their concentration (p<0.05, F=3.4, eta2=0.02) and talking (p<0.001, F=10.9,
eta2=0.07) better than those larger organisations.
We also found small but significant differences in some of the noise metrics across job roles.
Senior management and acousticians rate the effect of noise on their concentration (p<0.05,
F=2.0, eta2=0.04), well-being (p<0.05, F=2.0, eta2=0.04) and stress (p<0.01, F=2.6,
eta2=0.05) better than those working in project management, cost consulting, sales or business
development, or research.
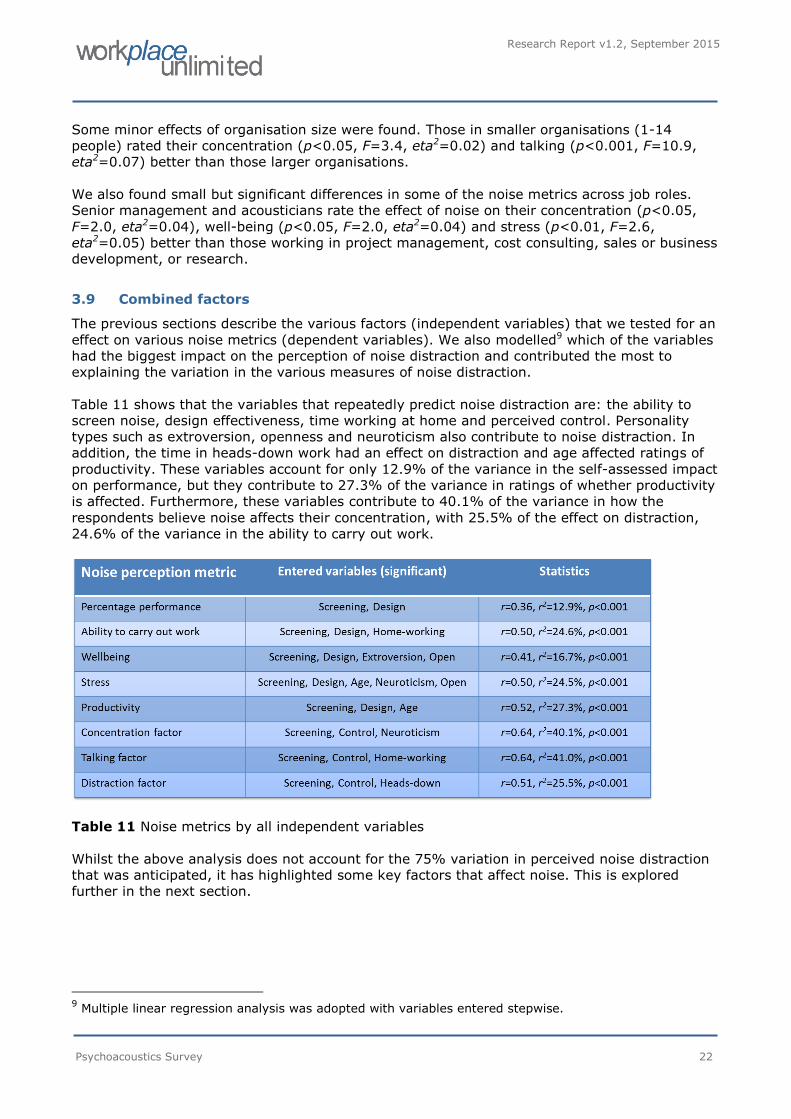
3.9 Combined factors
The previous sections describe the various factors (independent variables) that we tested for an
effect on various noise metrics (dependent variables). We also modelled9 which of the variables
had the biggest impact on the perception of noise distraction and contributed the most to
explaining the variation in the various measures of noise distraction.
Table 11 shows that the variables that repeatedly predict noise distraction are: the ability to
screen noise, design effectiveness, time working at home and perceived control. Personality
types such as extroversion, openness and neuroticism also contribute to noise distraction. In
addition, the time in heads-down work had an effect on distraction and age affected ratings of
productivity. These variables account for only 12.9% of the variance in the self-assessed impact
on performance, but they contribute to 27.3% of the variance in ratings of whether productivity
is affected. Furthermore, these variables contribute to 40.1% of the variance in how the
respondents believe noise affects their concentration, with 25.5% of the effect on distraction,
24.6% of the variance in the ability to carry out work.
Table 11 Noise metrics by all independent variables
Whilst the above analysis does not account for the 75% variation in perceived noise distraction
that was anticipated, it has highlighted some key factors that affect noise. This is explored
further in the next section.
9 Multiple linear regression analysis was adopted with variables entered stepwise.

Research Report v1.2, September 2015
Psychoacoustics Survey 23
4.0 Discussion
4.1 Summary of findings
When asked how noise affects the ability to work, a significant three-quarters of our
respondents reported that they are negatively affected by the noise in their workplace. Only
10% of the respondents thought their acoustics environment had a positive effect on their
performance. Our survey participants are mostly distracted by nearby colleagues’
conversations, telephone calls and individuals with loud voices; it should be noted that all these
distractions are fundamentally behavioural issues. One-quarter of the respondents had
problems concentrating often or all the time and another quarter said they are interrupted mid-
way through completing an important task often or all of the time.
We asked our survey respondents to estimate approximately how much their performance at
work is increased or decreased by the noise levels in their primary workspace. Two-thirds (of
our sample believe that the noise level in their workplace is having a negative effect on their
performance (and only 10.1% say it has a positive effect), which is very poor. Furthermore, the
mean estimated impact of noise on work performance is -5.1%. Whilst this figure appears low it
should be noted that just a 5% increase in employee performance can off-set the cost of
building and operating an office property. So it appears that, for our sample, noise in the
workplace is indeed an issue and affects perceived performance.
Those who primarily work from home also rate the effectiveness of the design of their
workspace in reducing noise better than those who work at open-plan desks. Similarly, home-
workers perceive they have more control over the noise on their workplace than those at open-
plan desks. So, as expected, those working from home have more control over noise levels and
the design of their workspaces. The key question is whether the primary workplace affects the
perception of noise distraction and corresponding performance. Indeed, we found that those
who primarily work from home rate noise distraction as more positive than those working in
open-plan or private/shared offices. The largest effect was shown for “listening into nearby
conversations” and “distractions from colleagues’ conversations”.
Whilst the results show that working from home is good for minimising noise distraction, it does
not necessarily mean that the only solution to noise distraction is working from home. There
were no significant differences between the ratings of performance and productivity across the
primary workspaces. The respondents may be adapting to “get the job done” or their views on
what is productive work may vary.
As expected, the home is the most popular setting selected for work requiring concentration,
but surprisingly it is one of the preferred spaces for telephone calls (perhaps overseas
teleconference or confidential) and it is also selected by more for overall productivity than
private offices. Meeting rooms and informal/breakout spaces are considered effective for team-
working and meeting colleagues, two major components of productive working that are better
supported by the traditional office. Interestingly, whilst private/shared offices were selected for
concentration and telephone calls, very few found them effective for creativity, team-working
and meeting colleagues. In terms of overall productivity, the most popular space selected was
the home, closely followed by the open-plan desk then followed by the office. That the open-
plan desk is more popular than private offices may partly be because it offers connection and
proximity to colleagues, and access to a variety of facilities without feeling isolated. So,
depending on the nature of work, neither private/shared offices nor homes are the panacea for
working environments and a selection of spaces are required.
Unexpectedly, despite being susceptible to noise, introverts find their open-plan desk most
effective than extroverts for carrying out work requiring concentration. It may be that having a
good computer and workstation overrides any noise issues, which are tolerated. On the other
hand, extroverts rather than introverts find the open-plan desk more effective for team work.

Research Report v1.2, September 2015
Psychoacoustics Survey 24
Those more extroverted also find meeting rooms and breakout spaces more productive than
their introverted colleagues.
Nevertheless, the introverted respondents are more affected by noise than the extroverts. The
estimated impact on performance of introverts is more negative than extroverts, and stress,
well-being, concentration and productivity are all rated slightly worse. The largest effect on the
noise distraction variables is for neuroticism. The less neurotic respondents are less affected by
noise; their ability to carry out work is less affected and the largest effect size is found for
concentration. Those more neurotic are also more likely to miss a work deadline due to noise
distraction.
There were some significant differences in noise distraction for those spending their time in
focus and concentration. However, the size of the effect was smaller than expected for such a
key variable, and all the other noise distraction variables did not cause any statistically
significant results. It may be possible that people who need to focus and concentrate have
learned to cope with or adapt to the noise levels. It may also be that the people who need to
focus are more diligent and just “get the job done” regardless of the distractions. Despite there
being some minor effects of the time spent concentrating on noise distraction, overall this is an
unexpected result worthy of further investigation. It does, however, imply that in terms of noise
factors such as personality are more important than the task or work activity.
Our data did however reveal differences between the time different personality types spend in
their work activities. An important finding is that the more introverted spend more time in the
office, more time in heads down work and more time in work requiring focus and concentration
than the extroverts. We also found that those spending 60% or more of their time carrying out
tasks requiring concentration and focus are slightly more neurotic and more introverted than
those spending less time concentrating. So the time spent concentrating may be confounded by
personality type i.e. there is an interaction between personality, time concentrating and the
effect on noise distraction.
The respondents who perceived they have more control over noise were less distracted by
noise, irrespective of personality type. Those working primarily at home had more perceived
control than their colleagues and also less noise distraction. So perceived control appears to be
the key variable rather than the place of work per se. The challenge is to create office
environments that have the same level of perceived control as the home.
We created an Acoustic Design Index (ADI) based on a tally of weighted acoustic design factors
identified by the survey respondents. For example acoustic panels, soft tiled ceiling and
carpeted floors were considered positive. There is a good relationship between the percentage
performance and ADI scores, indicating that the ADI could be a useful simple tool for
determining good acoustic environments.
Our respondents were asked how good they are at screening out noise and distractions in their
primary workplace. There are good correlations with all the noise metrics and screening ability,
accounting for up to 26% of the variance in responses. The noise variables are all significantly
affected by ability to screen and the size of effect is one of the strongest we found. Screening
was also weakly correlated with all personality factor ratings, but not related strongly with any
one personality type. The ability to screen out noise requires further investigation to understand
whether it is learned or innate.
The alternative to being able to naturally screen out noise, or to adapt to noise, is to cope with
it in some other way. Moving away from the source of noise distraction, either by going outside
the office or moving to a quiet area are the primary coping mechanisms. Unexpectedly, there
was also a high proportion of respondents who say they come in early or work late to avoid

Research Report v1.2, September 2015
Psychoacoustics Survey 25
noise and who wear headphones at work. Interestingly, fewer respondents say they raise the
issue with colleagues, so they learn to cope rather than challenge.
Unexpectedly, our older respondents perceive noise to be slightly less of an issue than the
younger ones. We were anticipating that the younger respondents coped better in noisy
environments whereas it appears the older ones may have adapted to their acoustic
environment. A more cynical view might be that the older respondents have poorer hearing so
are less affected by noise, but this is not general consensus in the literature. A more recognised
problem with the elderly is distinguishing speech in noisy environments; but our data did not
support this.
When considering all the variables in our survey, the ones that repeatedly predict noise
distraction are: the ability to screen noise, design effectiveness, time working at home and
perceived control. Personality types such as extroversion, openness and neuroticism also
contribute to noise distraction. In addition, the time in heads-down work had an effect on
distraction and age affected ratings of productivity. These variables account for only 13% of the
variance in the self-assessed impact on performance, but they contribute to 27% of the
variance in ratings of whether productivity is affected. Furthermore, these variables contribute
to 40% of the variance in how the respondents believe noise affects their concentration, with
26% of the effect on distraction, 25% of the variance in the ability to carry out work. So whilst
our analysis does not account for the 75% variation in perceived noise distraction that we
anticipated, it has highlighted some key factors that affect noise.
4.2 Interpretation of results
Our analysis clearly shows that noise is an issue that affects performance at work, in particular
concentration. We found many statistically significant results but in many cases the size of the
effect (measured by eta2 and r2) was not as great as expected or observed in studies reported
in our literature review. This smaller than anticipated effect of noise may be for a number of
reasons:
1. We conducted “real world” research. We asked people to complete the survey about their
primary place of work, possibly completed in that place, rather than carryout a controlled
laboratory experiment. We could not therefore control the actual sound levels in the
respondent’s offices and are dependent on them coming for a range of acoustic
environments. Furthermore, in controlled experiments the subjects are generally focussing
on one specific task, away from distractions and interfering factors, and often motivated
(financially or otherwise) to complete that task. In contrast, in the real world there are
many confounding variables such that noise becomes one of many factors rather than the
one focussed on. For example, productivity theory has shown that motivational factors, such
as reward and recognition, have a larger impact on performance than hygiene factors, such
as the physical environment. That noise distraction is registering as a concern amongst
other variables indicates its importance, but the subtleties of other factors such as
personality may be lost amongst the general office melee.
2. The effect of noise on concentration and distraction was stronger than on self-assessed
performance and productivity. It may be that despite the distractions from noise and the
associated inefficiencies, people still have to complete their work duties and complete tasks.
So their perceived performance (based on daily/weekly output) is not as greatly affected as
might be expected i.e. they have to “get the job done” regardless of distractions. However,
distractions causing inefficiencies will result in the work taking longer to ensure the output is
delivered; and these extra working hours will have an impact on stress.

Research Report v1.2, September 2015
Psychoacoustics Survey 26
3. Our survey respondents were found to adopt a number of coping strategies to deal with or
adapt to noise distractions. The ability to screen out noise is also a key factor. If our
respondents are adapting to noise then the effect of noise on distraction and performance
will be less noticeable. Nevertheless, it may mean that unnecessary effort, physical and
mental, is being wasted daily to deal with noise. Such effort can affect both stress and well-
being as well as work efficiency.
4.3 Practical implications
The survey revealed that those who work primarily at home are less distracted by noise than
those in the open-plan and private or shared offices. Those at home also believe they have
more control over noise and rate the effectiveness of the acoustic design as better. The home
was also found to be the preferred space by most for work requiring concentration and
creativity plus for many for telephone calls. The private/shared office was preferred for
telephone calls and concentration. Unexpectedly, the open-plan desk was preferred for work
requiring concentration (especially by introverts) for productivity overall. The range of settings
in the office environment was shown to support team-working, creativity and meetings etc. So,
the noise issue is not just about open-plan versus private offices, as is often the focus. A choice
of working environments is required to suit different activities and personalities. But office
environments do need to cater more for work requiring focus and concentration, without placing
people in boxes, and this is the biggest challenge facing interior designers.
Our literature review reported that the impact of sound on noise perception and distraction is
typically 25% whereas the other 75% is due to other psychological factors. Our analysis was
not able to account for the 75% variance but we did uncover important factors that contribute
up to 40% of the effect. The ability to screen noise, design effectiveness, time working at home,
perceived control, age, time doing heads-down work and personality types (such as
extroversion, openness and neuroticism) all contributed to perceived noise distraction. So
again, whilst the effect was not as large as anticipated, there is definitely a trend (small effect),
supporting our hypotheses. So as originally proposed in the literature review, there is a need to
consider and resolve the psychological and behavioural factors that impact on noise as well as
the physical.
Therefore, the people-centred acoustic solution we offered in our previous literature review2 still
stands. The solution to noise distraction is as much to do with the management of the space
and guidance on behaviour as it is about the design and acoustic properties. A choice of
different types of space with different acoustic properties and agreed behaviours is essential for
reducing noise distraction.
Our people-centred acoustic solutions are summarised as follows:
Displace – Displace the noise distraction by providing easy access to informal meeting areas,
breakout and brainstorming rooms. Provide quiet areas for the staff to retreat to, including
quiet booths, phone-free desk areas or a library-type space plus the option to work from
home occasionally. Good design and visual cues can be used to indicate how people should
behave in a space and the expected noise levels (e.g. consider the layout and design of a
library compared with a café).
Avoid – Avoid generating noise distraction (e.g. do not provide hands-free speaker phones in
open-plan offices or meeting tables in the middle of workstations where people are carrying
out work requiring concentration). Locate noisy teams together and away from the quieter
teams. Co-locate team members, because people are more tolerant of noise from their own
team. Consider the personality of the staff and perhaps separate the extroverts who thrive in
noisy environments from the introverts who prefer quiet.

Research Report v1.2, September 2015
Psychoacoustics Survey 27
Reduce – Reduce the noise distraction by controlling the desk size and density (high-density
environments with people closer to each other generate more noise distraction). Consider
allowing people who are conducting repetitive tasks requiring concentration to use
headphones. Use good acoustic design to reduce speech intelligibility across open-plan areas
and noise transference between rooms. If sound masking is to be used, consider using more
natural soundscapes rather than white or pink noise.
Educate – Introduce some form of office etiquette which reinforces consideration towards
colleagues. Etiquette should cover phone use, loud conversations, music, headphones,
managing interruptions, how different work-settings are used and so on. It may also include
“do not disturb” signals. Explain to staff how the office layout works, the facilities available to
them and how they can control noise disruption. If required, explain and justify why there is
a noisy environment.
4.4 Original hypotheses
Our literature review resulted in a series of hypotheses that required testing. We believe all of
our original hypotheses are supported:
1. Extroverted office workers can cope better with noisy environments whereas introverts will
perform better under quieter conditions.
2. Co-locating introverts and separating them from extroverts will help manage noise
distraction.
3. Co-locating teams will help manage noise distraction from meaningful speech.
4. Perceived control over noise distraction will reduce the problem of poorer performance.
5. Offering choice over alternative work-settings in the office will reduce noise distraction and
improve performance.
6. Occasional working from home reduces noise distraction and will improve performance.
7. Educating employees in how to behave in open-plan environments and introducing office
etiquette around noise will reduce noise distraction.
8. Activity-based, acoustically sensitive designed spaces create better environments for both
introverts and extroverts.
9. Applying a combined approach of worker psychology mapping, activity based working and
acoustic design will improve worker performance.
The next step of our research is to develop a tool to identify the appropriate physical and
behavioural acoustic solutions. We also have an aspiration to conduct an intervention study in a
real office where we implement the required physical and behavioural acoustic solutions.
4.5 Conclusion
Our survey confirms that distraction from noise is a key issue in offices and affects
performance, in particular concentration. The impact of noise on performance is not as clear as
expected possibly due to the respondents employing coping strategies and adapting to noise.
Personality types are affected by noise distraction. The more introverted respondents are more
affected by noise than the extroverts and the largest effect of noise distraction was found for
the more neurotic respondents. The ability to screen noise, design effectiveness, time working
at home, perceived control, age, time doing heads-down work and personality types (such as
extroversion, openness and neuroticism) all contributed to perceived noise distraction.
Differences in noise distraction were also found between the home, open-plan desk and private/
shared office, but a variety of spaces are required to support different work settings, in
particular work requiring focus and concentration.
Research Report v1.2, September 2015
Psychoacoustics Survey 28
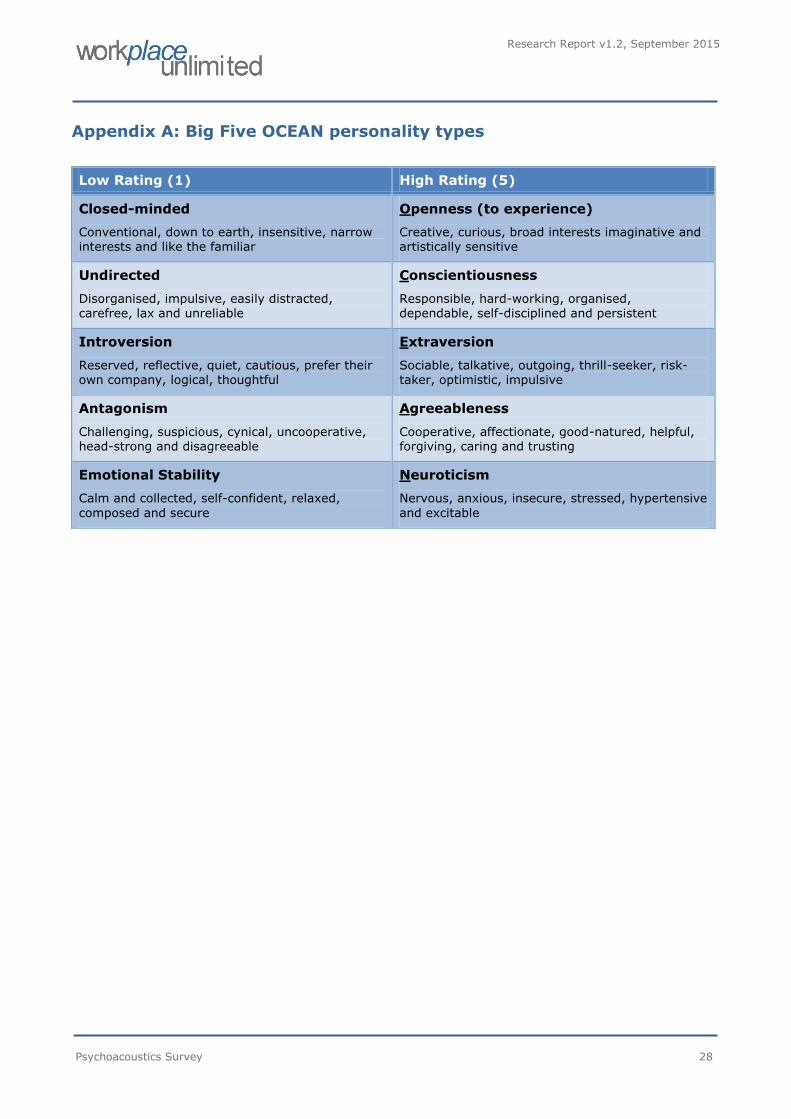
Appendix A: Big Five OCEAN personality types
Low Rating (1) High Rating (5)
Closed-minded
Conventional, down to earth, insensitive, narrow interests and like the familiar
Openness (to experience)
Creative, curious, broad interests imaginative and artistically sensitive
Undirected
Disorganised, impulsive, easily distracted,
carefree, lax and unreliable
Conscientiousness
Responsible, hard-working, organised,
dependable, self-disciplined and persistent
Introversion
Reserved, reflective, quiet, cautious, prefer their own company, logical, thoughtful
Extraversion
Sociable, talkative, outgoing, thrill-seeker, risk-taker, optimistic, impulsive
Antagonism
Challenging, suspicious, cynical, uncooperative, head-strong and disagreeable
Agreeableness
Cooperative, affectionate, good-natured, helpful, forgiving, caring and trusting
Emotional Stability
Calm and collected, self-confident, relaxed,
composed and secure
Neuroticism
Nervous, anxious, insecure, stressed, hypertensive
and excitable

Research Report v1.2, September 2015
Psychoacoustics Survey 29
Appendix B: Survey questions
Other questions included in the survey were as follows.
Dependent variables:
Over the last working week in your primary workspace, have you ...
... had problems concentrating?
... found it difficult to make decisions?
... had memory lapses?
... found it difficult to think clearly?
... found it difficult to hear when colleagues talk to you?
... found yourself listening in to nearby conversations?
Over the last working week in your primary workspace, to what extent have you been
distracted by ...
... nearby colleagues' conversations and laughter?
... conversations taking place in other teams?
... talking and laughter in communal areas (breakout, kitchen)?
... conversations taking place outside of meeting rooms?
... nearby colleagues' telephone calls?
... individuals with loud voices, on the phone or talking to their colleagues
... people moving around the office?
... brief sounds of ring tones, text signals, computers etc?
... sounds from the ventilation system?
... traffic noise from outside the office?
Over the last working week, how often have you ...
... been so distracted that you could not fully concentrate on the task in front of you?
... not been able to fully concentrate due to the noise levels in your primary workspace?
... been interrupted midway through completing an important task?
... had to leave the workspace to avoid distractions and finish off work tasks?
... missed a work deadline due to continuous distractions or noise?
... stayed late or come in early to avoid noise and distractions?
Independent variables:
When working from a desk, where is your primary workspace i.e. where do you usually sit
when carrying out your core work activities?
Select the environments that reflect where you are most effective at carrying out your work
activities
How do you cope with noise in your workspaces, what actions have you taken previously?
How good are you at screening out noise and distractions in your primary workspace?

Research Report v1.2, September 2015
Psychoacoustics Survey 30
How would you rate the effectiveness of the design of your usual place of work for reducing
noise?
Do you believe that you have control over the level of noise in your primary workspace?
Does your usual place of work have any of the following features?
During a typical working week, approximately what percentage of your work time do you
spend in each of the following locations?
When in your primary workspace, approximately what percentage of the time do you carry
out the following activities?
During a typical working week, approximately what percentage of the time do you carry out
tasks that require focus and concentration?

Research Report v1.2, September 2015
Psychoacoustics Survey 31
Appendix C: Acoustic Design Index (ADI)
Ranking of Environmental Factors Weighting
Soft, tiled ceiling 1
Metal ceiling -1
Free-hanging, floating "raft" (horizontal hanging) or baffle (vertical hanging) ceiling 1
Exposed concrete ceiling -1
Acoustic panels on walls 1
Screens/panels used to break up the open plan office areas 1
Plants or trees used to break up the open plan area 1
Carpet on most of the floor area 1
Hard flooring throughout - no or little carpeting -1
Mix of carpet and hard flooring 0
High screens/partitions between desks (so can't see colleagues mouth moving while talking) 2
Low/hard screens/partitions between desks 1
No screens between desks 0
Face to face desks -1
Your own fully enclosed office 2
Access to enclosed meeting space 1
Access to dedicated quiet/focus rooms 2
Access to quiet/focus pods or booths 1
No access to quiet/focus pods or booths 0
Breakout/vend/kitchen/tea point located away from the main desk area 1
Breakout/vend/kitchen/tea point located adjacent and open to the main desk area -1
Informal meeting space located away from the main desk areas 1
Informal meeting space located within main desk area -1
Printers/Copiers located in the desk area without screens -1
Printers/Copiers located behind screens/partitions or away from the desks 1
Research Report v1.2, September 2015
Psychoacoustics Survey 32
Tel: +44 7900 908193
Email: [email protected]
Web: www.workplaceunlimited.com
Twitter: @oseland