
Psy B07 Chapter 1Slide 1 ANALYSIS OF VARIANCE. Psy B07 Chapter 1Slide 2 t-test refresher In chapter...
47
Chapter 1 Chapter 1 Slide Slide 1 Psy B07 ANALYSIS OF VARIANCE ANALYSIS OF VARIANCE
Transcript of Psy B07 Chapter 1Slide 1 ANALYSIS OF VARIANCE. Psy B07 Chapter 1Slide 2 t-test refresher In chapter...
Chapter 1Chapter 1 Slide Slide 11
Psy B07
ANALYSIS OF VARIANCEANALYSIS OF VARIANCE

Chapter 1Chapter 1 Slide Slide 22
Psy B07
t-test refreshert-test refresher
In chapter 7 we talked about analyses that In chapter 7 we talked about analyses that could be conducted to test whether could be conducted to test whether pairspairs of means were significantly different.of means were significantly different.
For example, consider an experiment in For example, consider an experiment in which we are testing whether using which we are testing whether using caffeine improves final marks on an exam. caffeine improves final marks on an exam. We might have two groups, one group (say We might have two groups, one group (say 12 subjects) who is given normal coffee 12 subjects) who is given normal coffee while they study, another group (say also while they study, another group (say also 12 subjects) who is given the same 12 subjects) who is given the same amount of decaffeinated coffee.amount of decaffeinated coffee.

Chapter 1Chapter 1 Slide Slide 33
Psy B07
t-test refreshert-test refresher
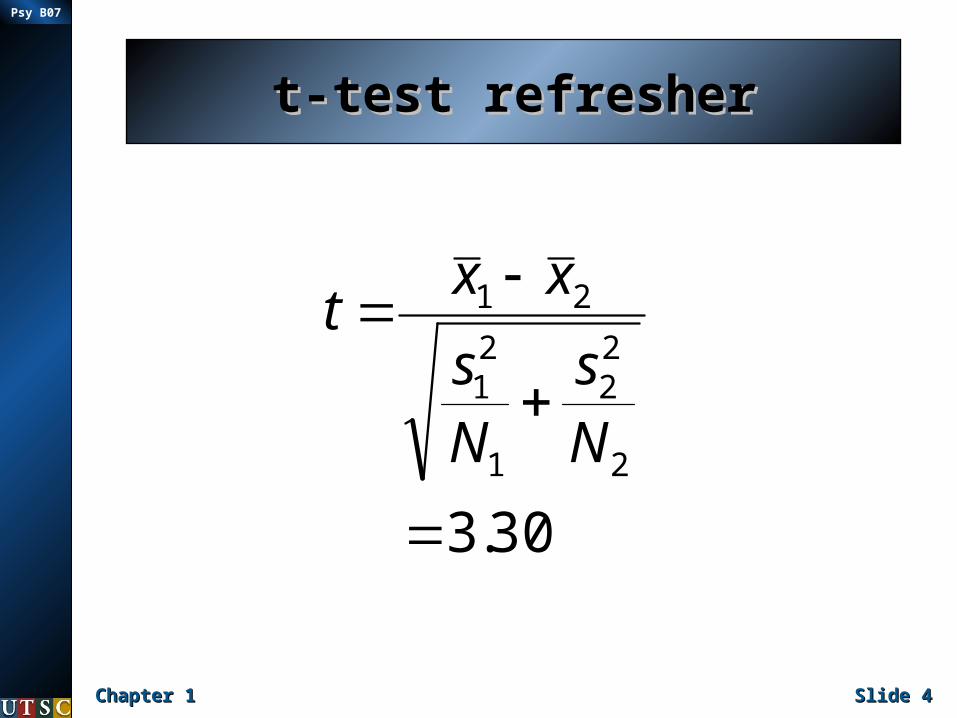
We could now We could now look at the look at the exam marks for exam marks for those students those students and compare and compare the means of the means of the two groups the two groups using a using a “between-“between-subjects” (or subjects” (or independent independent samples) t-samples) t-test:test:
Sub Caf (X) Decaf(Y) X2 Y2
1 72 68 5184 46242 65 74 4225 54763 68 59 4624 34814 83 61 6889 37215 79 65 6241 42256 92 72 8464 51847 69 80 4761 64008 74 58 5476 33649 78 65 6084 4225
10 83 60 6889 360011 88 78 7744 608412 71 75 5041 5625
= 922 815 71622 56009
Chapter 1Chapter 1 Slide Slide 44
Psy B07
t-test refreshert-test refresher
30.32
22
1
21
21
Ns
Ns
xxt

Chapter 1Chapter 1 Slide Slide 55
Psy B07
t-test refreshert-test refresher
The critical point of the previous example The critical point of the previous example is theis the
following:following:
The basic logic for testing whether or not The basic logic for testing whether or not two means are different is to compare two means are different is to compare the size of the differences between the the size of the differences between the groups (which we assume is due to groups (which we assume is due to caffeine), relative to the differences caffeine), relative to the differences within the groups (which we assume is within the groups (which we assume is due to due to random variation .. or errorrandom variation .. or error).).

Chapter 1Chapter 1 Slide Slide 66
Psy B07
t-test refreshert-test refresher
measure of effect (or treatment)assessed by examining variance
(or difference) between the groups
measure of random variation (or error)assessed by examining variance
within the groups
This exact logic underlies virtually all statistical This exact logic underlies virtually all statistical tests, including analysis of variance, an analysis tests, including analysis of variance, an analysis that allows us to compare multiple means that allows us to compare multiple means simultaneously.simultaneously.

Chapter 1Chapter 1 Slide Slide 77
Psy B07
Analysis of Variance (ANOVA) Analysis of Variance (ANOVA) – the why?– the why?
The purpose of analysis of variance is to let us ask The purpose of analysis of variance is to let us ask whether means are different when we have whether means are different when we have more more than just two meansthan just two means (or, said another way, when (or, said another way, when our variable has more than two levels).our variable has more than two levels).
In the caffeine study for example, we In the caffeine study for example, we were interested in only one variable were interested in only one variable (caffeine) and we examined two levels (caffeine) and we examined two levels of that variable, no caffeine versus of that variable, no caffeine versus some caffeine.some caffeine.
Alternately, we might want to test Alternately, we might want to test different dosages of caffeine where different dosages of caffeine where each dosage would now be considered each dosage would now be considered a “level” of caffeinea “level” of caffeine

Chapter 1Chapter 1 Slide Slide 88
Psy B07
Analysis of Variance (ANOVA) Analysis of Variance (ANOVA) – the why?– the why?
As you’ll see in PsyC08, as you learn As you’ll see in PsyC08, as you learn about more complicated ANOVAs (and about more complicated ANOVAs (and the experimental designs associated with the experimental designs associated with them) we may even be interested in them) we may even be interested in multiple variables, each of which may multiple variables, each of which may have more than two levels.have more than two levels.
For example, we might want to For example, we might want to simultaneously consider the effect of simultaneously consider the effect of caffeine (perhaps several different caffeine (perhaps several different dose levels) and gender (generally just dose levels) and gender (generally just two levels) on test performance.two levels) on test performance.
Chapter 1Chapter 1 Slide Slide 99
Psy B07
Analysis of Variance (ANOVA) Analysis of Variance (ANOVA) – the what?– the what?
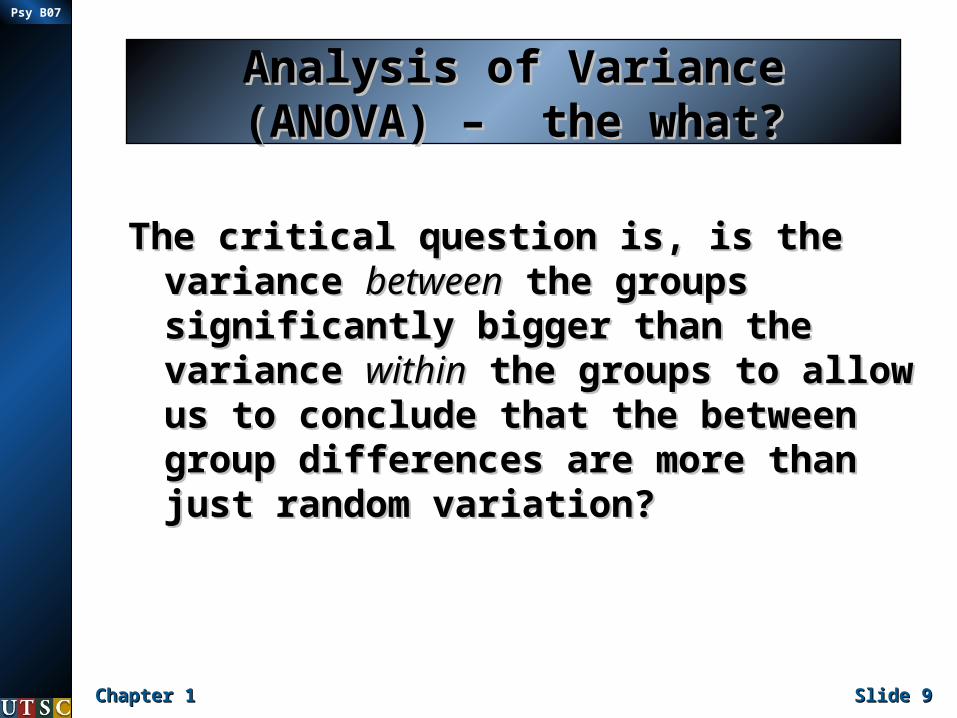
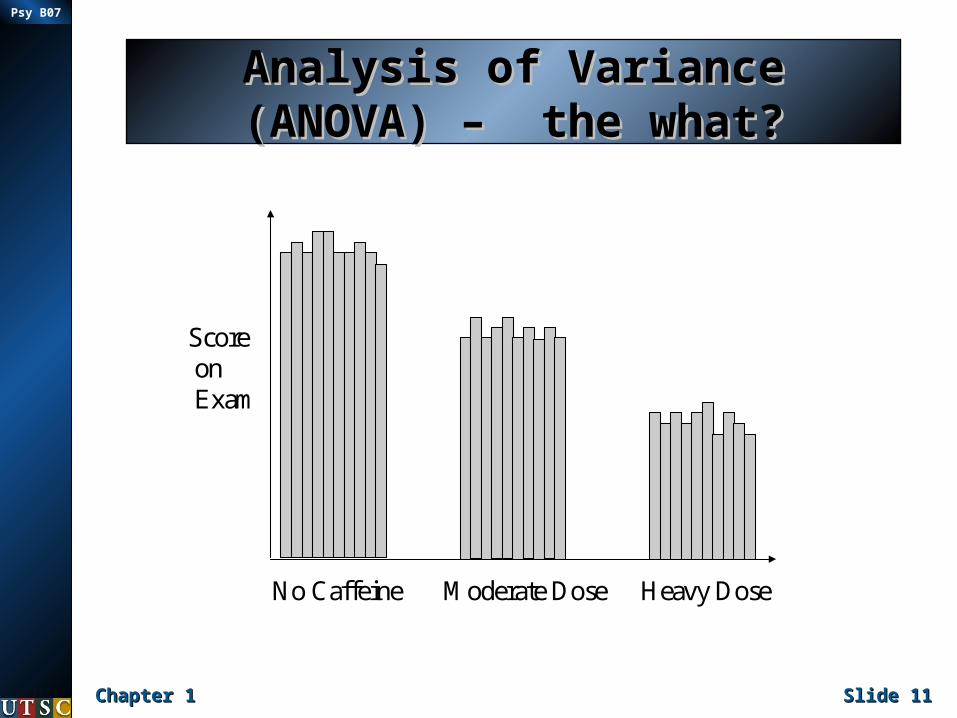
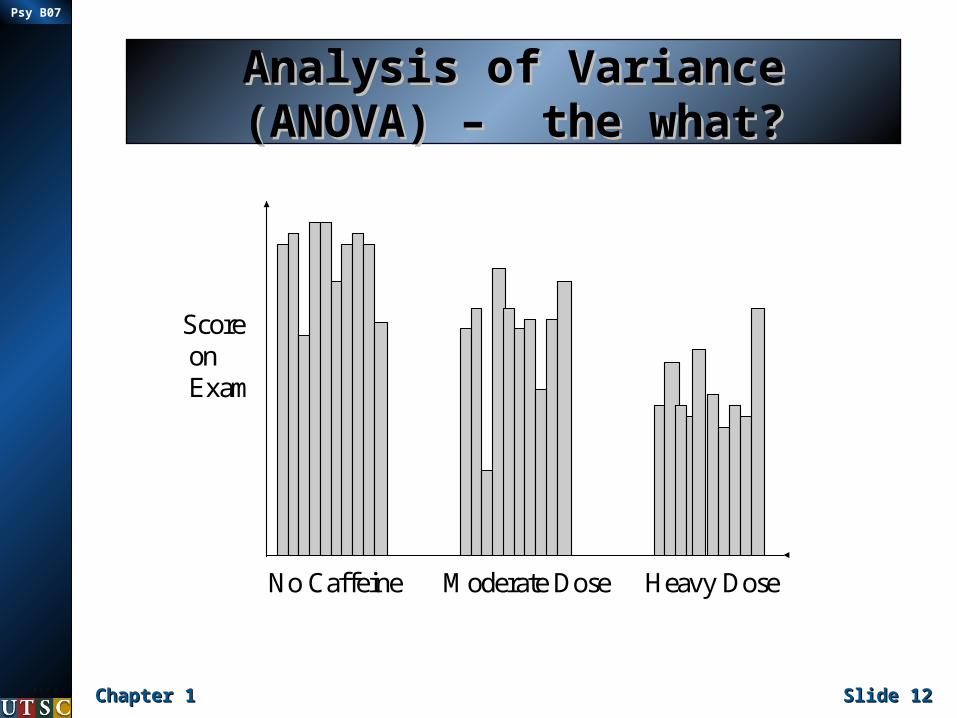
The critical question is, is the The critical question is, is the variance variance betweenbetween the groups the groups significantly bigger than the significantly bigger than the variance variance withinwithin the groups to allow the groups to allow us to conclude that the between us to conclude that the between group differences are more than group differences are more than just random variation?just random variation?

Chapter 1Chapter 1 Slide Slide 1010
Psy B07
Analysis of Variance (ANOVA) Analysis of Variance (ANOVA) – the what?– the what?
Score on Exam
No Caffeine Moderate Dose Heavy Dose
Chapter 1Chapter 1 Slide Slide 1111
Psy B07
Analysis of Variance (ANOVA) Analysis of Variance (ANOVA) – the what?– the what?
Score on Exam
No Caffeine Moderate Dose Heavy Dose
Chapter 1Chapter 1 Slide Slide 1212
Psy B07
Analysis of Variance (ANOVA) Analysis of Variance (ANOVA) – the what?– the what?
Score on Exam
No Caffeine Moderate Dose Heavy Dose
Chapter 1Chapter 1 Slide Slide 1313
Psy B07
Analysis of Variance (ANOVA) Analysis of Variance (ANOVA) – the how?– the how?
The textbook presents the logic in a The textbook presents the logic in a more verbal/statistical manner, and more verbal/statistical manner, and it can’t hurt to think of this in as it can’t hurt to think of this in as manner different ways as possible, manner different ways as possible, so, in that style:so, in that style:
Let’s say we were interested in Let’s say we were interested in testing three doses of caffeine; testing three doses of caffeine; none, moderate and high.none, moderate and high.
Chapter 1Chapter 1 Slide Slide 1414
Psy B07
Analysis of Variance (ANOVA) Analysis of Variance (ANOVA) – the how?– the how?
First of all, use of analysis of variance First of all, use of analysis of variance assumes that these groups have (1) data assumes that these groups have (1) data that is approximately normally distributed, that is approximately normally distributed, (2) approximately equal variances, and (3) (2) approximately equal variances, and (3) that the observations that make up each that the observations that make up each group are independent.group are independent.
Given the first two assumptions, only the Given the first two assumptions, only the means can be different across the groups - means can be different across the groups - thus, if the variable we are interested in is thus, if the variable we are interested in is having an affect on performance, we having an affect on performance, we assume it will do so by affecting the mean assume it will do so by affecting the mean performance level.performance level.
Chapter 1Chapter 1 Slide Slide 1515
Psy B07
Analysis of Variance (ANOVA) Analysis of Variance (ANOVA) – the how?– the how?
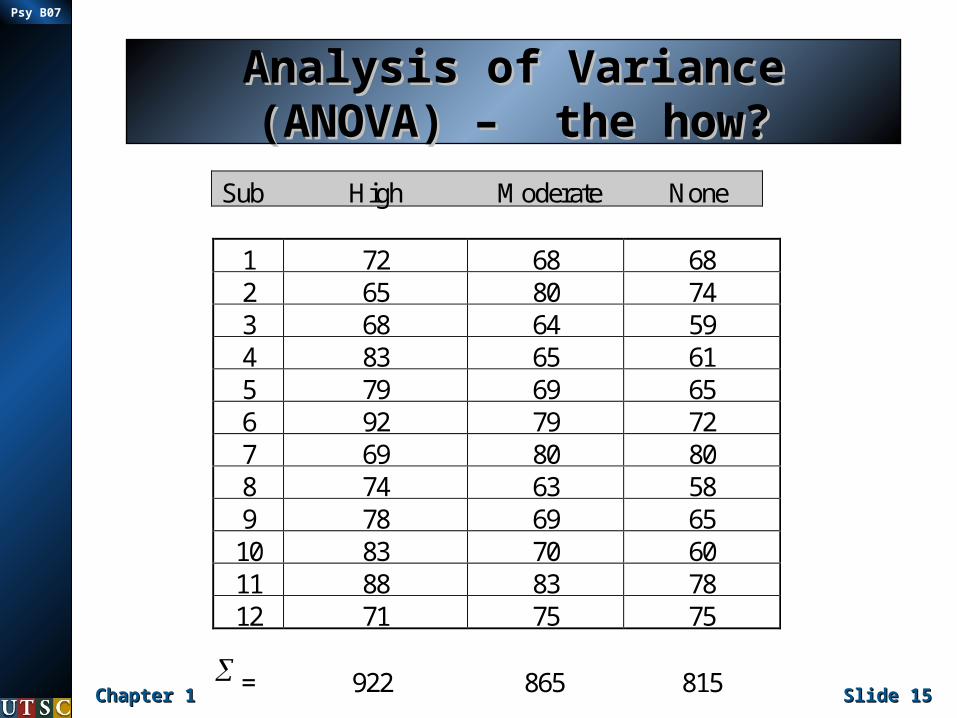
Sub High Moderate None
1 72 68 682 65 80 743 68 64 594 83 65 615 79 69 656 92 79 727 69 80 808 74 63 589 78 69 65
10 83 70 6011 88 83 7812 71 75 75
= 922 865 815
Chapter 1Chapter 1 Slide Slide 1616
Psy B07
Analysis of Variance (ANOVA) Analysis of Variance (ANOVA) – the how?– the how?
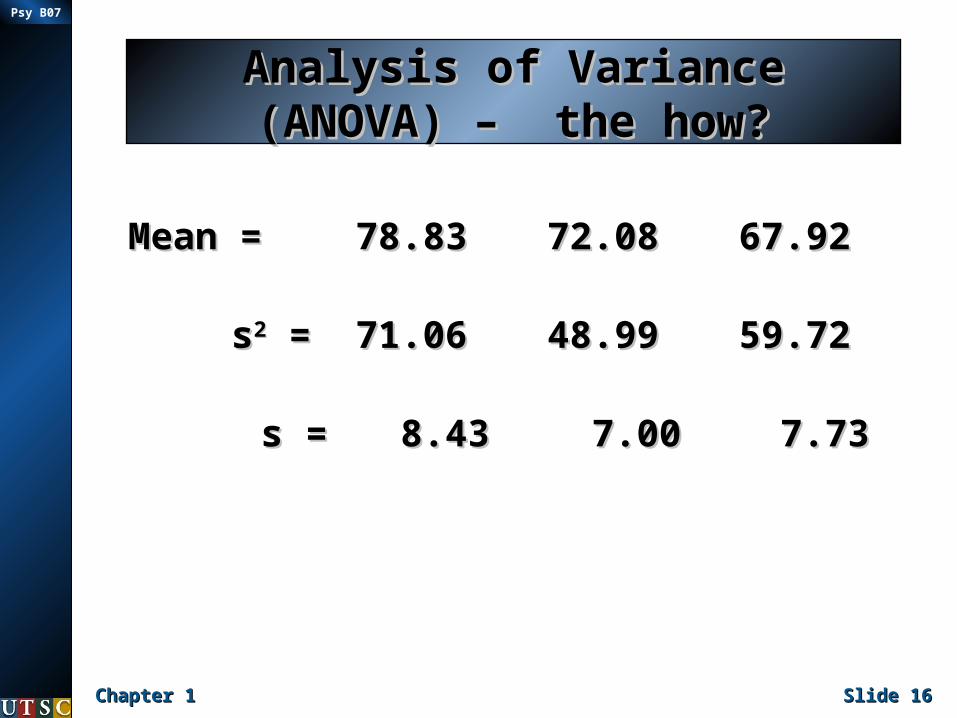
Mean = Mean = 78.8378.83 72.0872.08 67.9267.92
ss22 = = 71.0671.06 48.9948.99 59.7259.72
s =s = 8.43 8.43 7.00 7.00 7.737.73

Chapter 1Chapter 1 Slide Slide 1717
Psy B07
Analysis of Variance (ANOVA) Analysis of Variance (ANOVA) – the how?– the how?
From this data, we can generate two From this data, we can generate two estimates of the population variance estimates of the population variance 22..
““Error” estimate (Error” estimate (σσ22ee ):): One estimate we can One estimate we can
generate makes no assumptions about the generate makes no assumptions about the veracity (trueness or falseness) of the null veracity (trueness or falseness) of the null hypothesis.hypothesis.
Specifically, the variance within Specifically, the variance within each group provides an estimate of each group provides an estimate of σσ22
ee..

Chapter 1Chapter 1 Slide Slide 1818
Psy B07
Analysis of Variance (ANOVA) Analysis of Variance (ANOVA) – the how?– the how?
Given the assumption of equal variance (all Given the assumption of equal variance (all of which provide estimates of of which provide estimates of 22), our best ), our best estimate of estimate of 22 would be the mean of the would be the mean of the group variances.group variances.
This estimate of the population variance is This estimate of the population variance is sometimes called the mean squared error sometimes called the mean squared error (MS(MSee) or the mean squared within (MS) or the mean squared within (MSwithinwithin).).
ks je22

Chapter 1Chapter 1 Slide Slide 1919
Psy B07
Analysis of Variance (ANOVA) Analysis of Variance (ANOVA) – the how?– the how?
Treatment estimate (Treatment estimate (σσ22tt ) ): Alternatively, if we assume : Alternatively, if we assume
the null hypothesis is true (i.e., that there is no the null hypothesis is true (i.e., that there is no difference between the groups), then another difference between the groups), then another way to estimate the population variance is to use way to estimate the population variance is to use the variance of the means across the groups.the variance of the means across the groups.
By the central limit theorem, the variance of our By the central limit theorem, the variance of our sample means equals the population variance sample means equals the population variance divided by n, where n equals the number of divided by n, where n equals the number of subjects in each group.subjects in each group.
22
xsn

Chapter 1Chapter 1 Slide Slide 2020
Psy B07
Analysis of Variance (ANOVA) Analysis of Variance (ANOVA) – the how?– the how?
Therefore, employing some algebra:Therefore, employing some algebra:
This is also called the mean squared This is also called the mean squared treatmenttreatment
(MS(MStreattreat) or mean squared between ) or mean squared between (MS(MSbetweenbetween).).
22xns
Chapter 1Chapter 1 Slide Slide 2121
Psy B07
Analysis of Variance (ANOVA) Analysis of Variance (ANOVA) – the how?– the how?
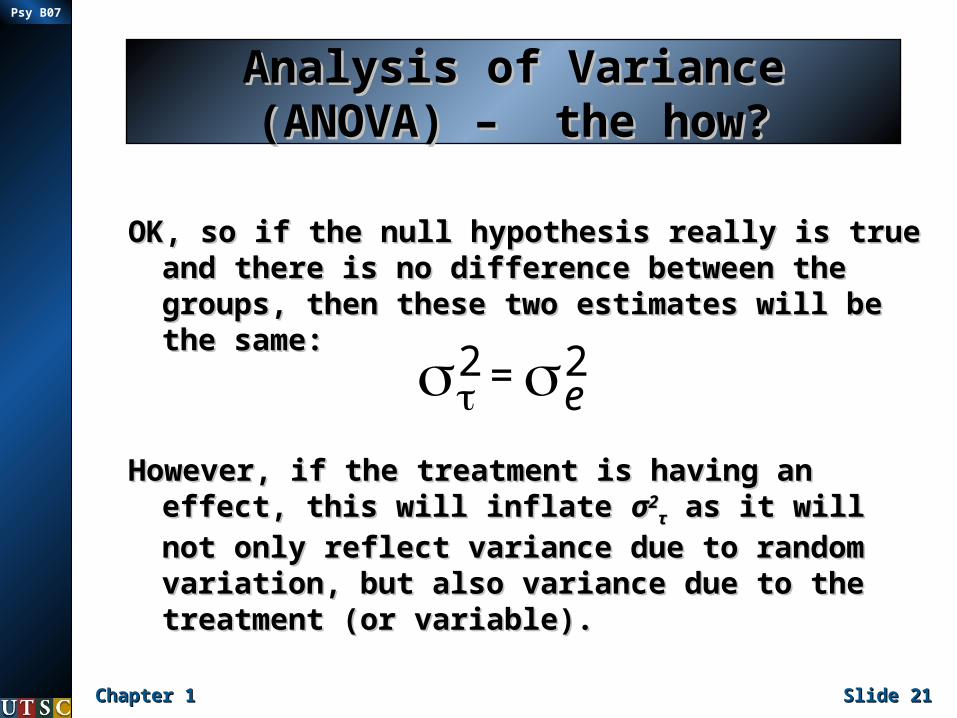
OK, so if the null hypothesis really is true OK, so if the null hypothesis really is true and there is no difference between the and there is no difference between the groups, then these two estimates will be groups, then these two estimates will be the same:the same:
However, if the treatment is having an However, if the treatment is having an effect, this will inflate effect, this will inflate σσ22
ττ as it will not only as it will not only reflect variance due to random variation, reflect variance due to random variation, but also variance due to the treatment (or but also variance due to the treatment (or variable).variable).
2 = e2

Chapter 1Chapter 1 Slide Slide 2222
Psy B07
Analysis of Variance (ANOVA) Analysis of Variance (ANOVA) – the how?– the how?
The treatment will not affect The treatment will not affect σσ22ee , therefore, , therefore,
by comparing these two estimates of the by comparing these two estimates of the population variance, we can assess population variance, we can assess whether the treatment is having an effect:whether the treatment is having an effect:
Measure of Chance Variance + Treatment Measure of Chance Variance + Treatment EffectEffect
Measure of Chance Variance OnlyMeasure of Chance Variance Only
2
e2= MStreatMSerror
= MSbetweenMSwithin
Chapter 1Chapter 1 Slide Slide 2323
Psy B07
Analysis of Variance (ANOVA) Analysis of Variance (ANOVA) – the how?– the how?
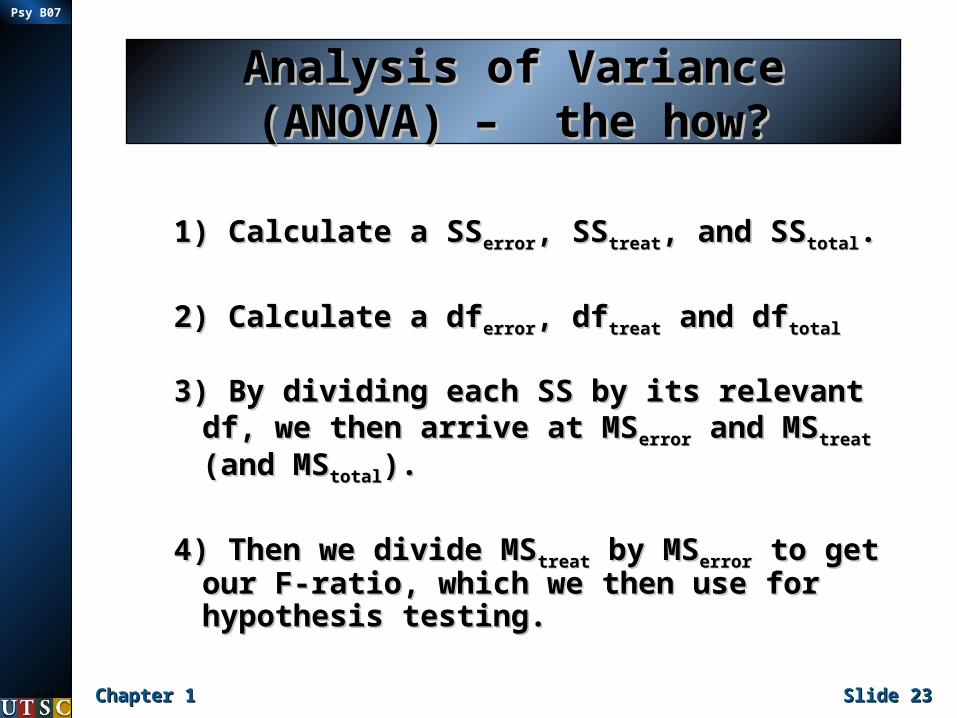
1) Calculate a SS1) Calculate a SSerrorerror, SS, SStreattreat, and SS, and SStotaltotal..
2) Calculate a df2) Calculate a dferrorerror, df, dftreattreat and df and dftotaltotal
3) By dividing each SS by its relevant df, 3) By dividing each SS by its relevant df, we then arrive at MSwe then arrive at MSerrorerror and MS and MStreattreat (and (and MSMStotaltotal). ).
4) Then we divide MS4) Then we divide MStreattreat by MS by MSerrorerror to get to get our F-ratio, which we then use for our F-ratio, which we then use for hypothesis testing.hypothesis testing.

Chapter 1Chapter 1 Slide Slide 2424
Psy B07
Sums of SquaresSums of Squares
The sum of squares is simply a measure of The sum of squares is simply a measure of the sum of the squared deviations of the sum of the squared deviations of observations from some mean:observations from some mean:
OK, so rather than directly calculating the OK, so rather than directly calculating the MSMSerrorerror and MS and MStreattreat (which are actually (which are actually estimates of the variance within and estimates of the variance within and between groups), we can calculate SSbetween groups), we can calculate SSerrorerror and SSand SStreattreat..
2)xx(

Chapter 1Chapter 1 Slide Slide 2525
Psy B07
ANOVAANOVA
Sub High Moderate None
1 72 68 68 2 65 80 74 3 68 64 59 4 83 65 61 5 79 69 65 6 92 79 72 7 69 80 80 8 74 63 58 9 78 69 65
10 83 70 60 11 88 83 78 12 71 75 75
X = 922 865 815 X2 = 71622 62891 56009 Mean = 76.83 72.08 67.92

Chapter 1Chapter 1 Slide Slide 2626
Psy B07
SSSSerrorerror
To calculate SSTo calculate SSerrorerror, we subtract the , we subtract the mean of each condition from each mean of each condition from each score, square the differences, and score, square the differences, and add them up, and then add up all add them up, and then add up all the sums of squaresthe sums of squares
2
jijerror )xx(SS

Chapter 1Chapter 1 Slide Slide 2727
Psy B07
SSSSerrorerror
There is a different way of doing this. There is a different way of doing this. First, calculate First, calculate ΣΣXX22 for each groupfor each group
For example, for Group 1, the For example, for Group 1, the XX22 would would equal (72equal (7222+65+6522+….+88+….+8822+71+7122) = 71622.) = 71622.
Once we have them, we then calculate the Once we have them, we then calculate the sum of squares for each group using the sum of squares for each group using the computational formula:computational formula:
n
)X(XSS
22
j

Chapter 1Chapter 1 Slide Slide 2828
Psy B07
SSSSerrorerror
For example, for Group 1, the math would be:For example, for Group 1, the math would be:
To get SSTo get SSerrorerror we then sum all the SS we then sum all the SSerrors.errors.
SSSSerrorerror = SS = SS11+SS+SS22+SS+SS33 = = 781.67+538.92+656.92781.67+538.92+656.92
= 1977.50= 1977.50
67.78112
)922(71622SS
2
1

Chapter 1Chapter 1 Slide Slide 2929
Psy B07
SSSStreattreat
To calculate SSTo calculate SStreattreat we subtract the we subtract the grand mean from each group mean, grand mean from each group mean, square the differences, sum them square the differences, sum them up, and multiply by n.up, and multiply by n.
2
jtreat ..)xx(nSS

Chapter 1Chapter 1 Slide Slide 3030
Psy B07
SSSStreattreat
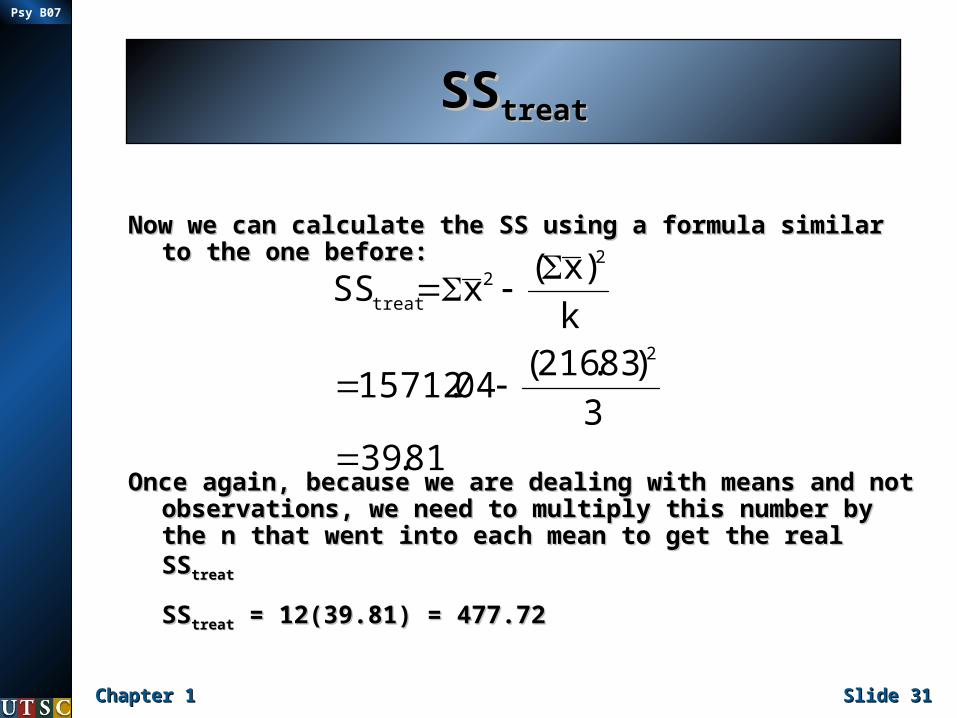
Again, there is a different way of Again, there is a different way of doing this. Basically, all we need doing this. Basically, all we need are our three means and the are our three means and the squares of those means.squares of those means.
We then calculate the sum of the We then calculate the sum of the means, and the sum of the squared means, and the sum of the squared means:means:
04.15712
67.461201.519636.5903x
83.21692.6708.7283.76x2
Chapter 1Chapter 1 Slide Slide 3131
Psy B07
SSSStreattreat
Now we can calculate the SS using a formula similar Now we can calculate the SS using a formula similar to the one before:to the one before:
Once again, because we are dealing with means and Once again, because we are dealing with means and not observations, we need to multiply this number not observations, we need to multiply this number by the n that went into each mean to get the real by the n that went into each mean to get the real SSSStreattreat
SSSStreattreat = 12(39.81) = 477.72 = 12(39.81) = 477.72
81.393
)83.216(04.15712
k
)x(xSS
2
22
treat
Chapter 1Chapter 1 Slide Slide 3232
Psy B07
SSSStotaltotal
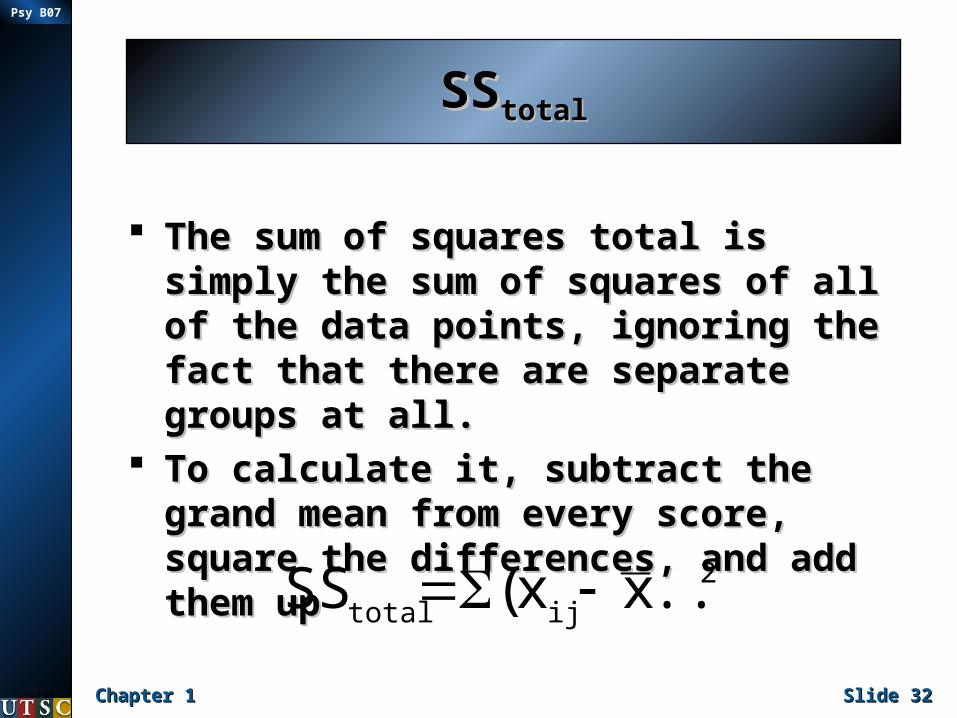
The sum of squares total is simply The sum of squares total is simply the sum of squares of all of the the sum of squares of all of the data points, ignoring the fact that data points, ignoring the fact that there are separate groups at all.there are separate groups at all.
To calculate it, subtract the grand To calculate it, subtract the grand mean from every score, square the mean from every score, square the differences, and add them updifferences, and add them up
2
ijtotal ..)xx(SS
Chapter 1Chapter 1 Slide Slide 3333
Psy B07
SSSStotaltotal
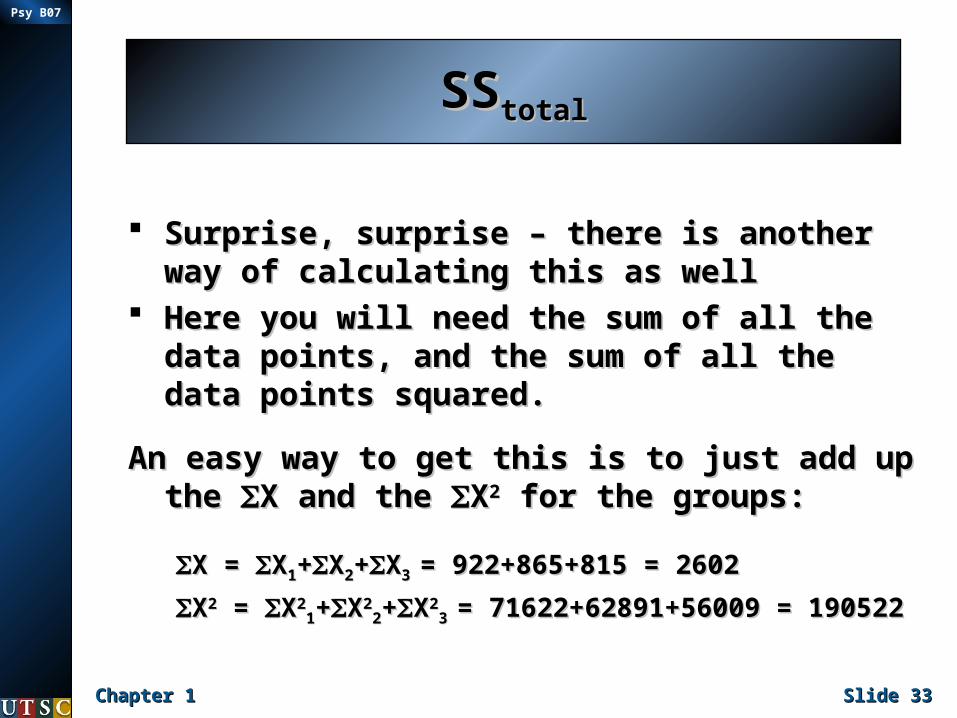
Surprise, surprise – there is another way of Surprise, surprise – there is another way of calculating this as wellcalculating this as well
Here you will need the sum of all the data Here you will need the sum of all the data points, and the sum of all the data points points, and the sum of all the data points squared.squared.
An easy way to get this is to just add up the An easy way to get this is to just add up the X and the X and the XX22 for the groups: for the groups:
X = X = XX11++XX22++XX3 3 = 922+865+815 = 2602= 922+865+815 = 2602
XX22 = = XX2211++XX22
22++XX223 3 = 71622+62891+56009 = = 71622+62891+56009 =
190522190522

Chapter 1Chapter 1 Slide Slide 3434
Psy B07
SSSStotaltotal
Then, again using a version of the old SS formula:Then, again using a version of the old SS formula:
If all is right in the world, then SSIf all is right in the world, then SStotaltotal should equal should equal SSSSwithinwithin+SS+SStreattreat. For us, it does.. For us, it does.
22.245536
)2602(190522
N
)x(xSS
2
22
total

Chapter 1Chapter 1 Slide Slide 3535
Psy B07
dfdf
OK, so now we have our three sum of OK, so now we have our three sum of squares, step two is to figure the squares, step two is to figure the appropriate degrees of freedom for each.appropriate degrees of freedom for each.
Here’s the formulaeHere’s the formulae::dfdferrorerror=k(n-1)=k(n-1)
dfdftreattreat=k-1=k-1
dfdftotaltotal=N-1=N-1
where k = the number of groups, n = the where k = the number of groups, n = the number of subjects within each group, and number of subjects within each group, and N = the total number of subjects.N = the total number of subjects.
Chapter 1Chapter 1 Slide Slide 3636
Psy B07
From SS to MS to FFrom SS to MS to F
MS estimates for treatment and within MS estimates for treatment and within are calculated by dividing the are calculated by dividing the appropriate sum of squares by its appropriate sum of squares by its associated degrees of freedom.associated degrees of freedom.
We then compute an F-ratio by We then compute an F-ratio by dividing the MSdividing the MStreattreat by the MS by the MSerror.error.
Finally, we place all these values in a Finally, we place all these values in a Source TableSource Table that clearly shows all the that clearly shows all the steps leading up to the final F value.steps leading up to the final F value.
Chapter 1Chapter 1 Slide Slide 3737
Psy B07
ANOVA source tableANOVA source table
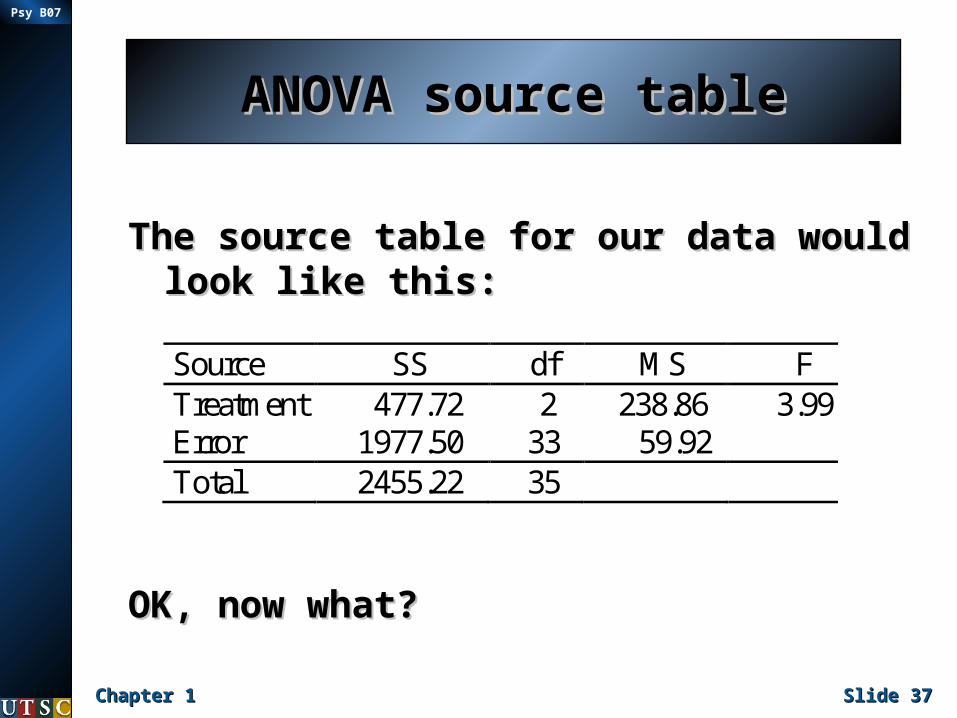
The source table for our data would The source table for our data would look like this:look like this:
OK, now what?OK, now what?
Source SS df MS F Treatment 477.72 2 238.86 3.99 Error 1977.50 33 59.92 Total 2455.22 35

Chapter 1Chapter 1 Slide Slide 3838
Psy B07
Hypothesis TestingHypothesis Testing
Now we are finally ready to get back to the Now we are finally ready to get back to the notion of hypothesis testing. . .that is, we notion of hypothesis testing. . .that is, we are not ready to answer the following are not ready to answer the following question:question:
If there is really no effect of caffeine on If there is really no effect of caffeine on performance, what is the probability of performance, what is the probability of observing an F-ratio as large as 3.99.observing an F-ratio as large as 3.99.
More specifically, is that probability less More specifically, is that probability less that our chosen level of alpha (e.g., .05).that our chosen level of alpha (e.g., .05).

Chapter 1Chapter 1 Slide Slide 3939
Psy B07
Sampling distribution of FSampling distribution of F
How do we arrive at the probability of How do we arrive at the probability of observing some specific F value?observing some specific F value?
Recall our example when we created 3 Recall our example when we created 3 groups by randomly sampling individuals groups by randomly sampling individuals from the same population and asking from the same population and asking them for some piece of data (e.g. age).them for some piece of data (e.g. age).
In this case, the null hypothesis should be In this case, the null hypothesis should be true … the means of the three groups true … the means of the three groups should only vary as a result of chance (or should only vary as a result of chance (or error) variationerror) variation

Chapter 1Chapter 1 Slide Slide 4040
Psy B07
Sampling distribution of FSampling distribution of F
If we perform an analysis of variance on If we perform an analysis of variance on this data, the F value should be about 1. this data, the F value should be about 1. However, it will not be exactly 1; rather, However, it will not be exactly 1; rather, there will be a distribution with a mean of there will be a distribution with a mean of 1 and some variance around that mean.1 and some variance around that mean.
This distribution is termed the F This distribution is termed the F distribution, and its exact shape varies as distribution, and its exact shape varies as a function of dfa function of dftreattreat and df and dferrorerror..
The important point here is that for any The important point here is that for any given degrees of freedom, the function given degrees of freedom, the function can be mathematically specified, allowing can be mathematically specified, allowing one to perform calculus and, therefore, to one to perform calculus and, therefore, to find the probabilities of certain values.find the probabilities of certain values.

Chapter 1Chapter 1 Slide Slide 4141
Psy B07
Hypothesis TestingHypothesis Testing
All we really want to know is whether the F All we really want to know is whether the F we have obtained in our analysis is we have obtained in our analysis is significantly larger than we would expect significantly larger than we would expect by chance.by chance.
That is, we want to know whether it falls That is, we want to know whether it falls within the extreme “high” 5% of the within the extreme “high” 5% of the chance distribution.chance distribution.
Thus, all we really need to know is the Thus, all we really need to know is the critical F value that “cuts off” the extreme critical F value that “cuts off” the extreme 5% of the distribution.5% of the distribution.
If our obtained F is larger than the critical F, If our obtained F is larger than the critical F, we know it is in the “rejection region” and, we know it is in the “rejection region” and, therefore, that the probability of obtaining therefore, that the probability of obtaining an F that large is less than 5%.an F that large is less than 5%.

Chapter 1Chapter 1 Slide Slide 4242
Psy B07
Finishing the exampleFinishing the example
From the table, Fcrit(2,33) = 3.32
Since Fobt (3.99) > Fcrit (3.32) wereject the null hypothesis
Mean Fcrit
= 1 = 3.32
Chapter 1Chapter 1 Slide Slide 4343
Psy B07
Finishing the exampleFinishing the example
One thing to keep in mind – all an One thing to keep in mind – all an ANOVA (significant) tells you is that ANOVA (significant) tells you is that there is a difference between the there is a difference between the means. You can’t tell where means. You can’t tell where exactly this difference lies just yet. exactly this difference lies just yet. That’s in chapter 12 – and PsyC08That’s in chapter 12 – and PsyC08

Chapter 1Chapter 1 Slide Slide 4444
Psy B07
Violation of AssumptionsViolation of Assumptions
The textbook discusses this issue in detail and The textbook discusses this issue in detail and offers a couple of solutions (including some really offers a couple of solutions (including some really nasty formulae) for what to do when the nasty formulae) for what to do when the variances of the groups are not homogeneous.variances of the groups are not homogeneous.
What I want you to know is the following:What I want you to know is the following:
1) 1) If the biggest variance is more than 4 If the biggest variance is more than 4 times larger than the smallest times larger than the smallest variance, you may have a problem.variance, you may have a problem.
2) 2) There are things that you can do to There are things that you can do to calculate an F if the variances are calculate an F if the variances are heterogeneous.heterogeneous.
Chapter 1Chapter 1 Slide Slide 4545
Psy B07
The Structural ModelThe Structural Model
Let’s assume that the average height of Let’s assume that the average height of all people is 5’7”. Let’s also assume that all people is 5’7”. Let’s also assume that males tend to be 2” taller than females, males tend to be 2” taller than females, on average.on average.
Given this, I can describe anyone’s height Given this, I can describe anyone’s height using three components: 1) the mean using three components: 1) the mean height of all people, 2) the component height of all people, 2) the component due to sex, and 3) individual due to sex, and 3) individual contributionscontributions
My height is about 6’0”. I can break this My height is about 6’0”. I can break this down into: 5’7”+2”+3”down into: 5’7”+2”+3”

Chapter 1Chapter 1 Slide Slide 4646
Psy B07
The Structural ModelThe Structural Model
In more general terms, we can In more general terms, we can write the model out like this:write the model out like this:
x

Chapter 1Chapter 1 Slide Slide 4747
Psy B07
ijjij tX ...
ij
ijj.j.
j.ijj.
X
XXXGMGM
)XX()GMX(GM
GMX
GMXXX
XXGMXGMX
ij
ijjj
ijijjij
..
. )()()(
errortreatmenttotal
j j ijijj
j i jj
iijj
j i i j j ijijjijtotal
jijijijjjij
jijjij
SSSSSS
XXGMXn
XXGMX
XXGMXGMXSS
XXXXGMXGMXGMX
XXGMXGMX
22
22
222
222
)()(
)()(
)()()(
)())((2)()(
)()()(


![PM [B07] Exponent Partner](https://static.fdocuments.in/doc/165x107/588aa16d1a28ab4c308b478d/pm-b07-exponent-partner.jpg)
