PSI-CO report wp3 PSIC… · thecr ea PSI-CO Public sector innovation through collaboration Prof....
139
thecr ea PSI-CO Public sector innovation through collaboration Prof. dr. Koen Verhoest (UAntwerpen)- Prof. dr. Trui Steen (KU Leuven)-Prof. dr. David Aubin (UCL) - Prof. dr. Stéphane Moyson (UCL)- Prof. dr. Catherine Fallon (Ulg) – Tom Langbroek (UAntwerpen)- Charlotte van Dijck (KU Leuven) – Cécile Riche (UCL) – Aline Thiry (Ulg) – Chesney Callens (UAntwerpen) Work package 3 Deliverable 3.1.1/3.2.1/3.3.1/3.4.1/3.5 Contract nr. : BR/154/A4/PSI-CO Public sector innovation through collaboration (PSI-CO) Period : 01-09-2016 - 15/10/2018
Transcript of PSI-CO report wp3 PSIC… · thecr ea PSI-CO Public sector innovation through collaboration Prof....

thecr ea
PSI-CO Public sector innovation through collaboration
Prof. dr. Koen Verhoest (UAntwerpen)- Prof. dr. Trui Steen (KU Leuven)-Prof. dr. David Aubin (UCL) - Prof. dr. Stéphane Moyson (UCL)- Prof. dr. Catherine Fallon (Ulg) – Tom Langbroek (UAntwerpen)- Charlotte van Dijck (KU Leuven) – Cécile Riche (UCL) – Aline Thiry (Ulg) – Chesney Callens (UAntwerpen)
Work package 3 Deliverable 3.1.1/3.2.1/3.3.1/3.4.1/3.5
Contract nr. : BR/154/A4/PSI-CO Public sector innovation through collaboration (PSI-CO) Period : 01-09-2016 - 15/10/2018

PSI-CO work package 3: cross-case analysis
BRAIN-be (Belgian Research Action through Interdisciplinary Networks) 2
PSI-CO Public sector innovation through collaboration
Contract - BR/154/A4/PSI-CO
Work package 3
Deliverable 3.1.1/3.2.1/3.3.1/3.4.1/3.5
PROMOTORS: Prof. dr. Koen Verhoest (UAntwerpen) Prof. dr. Trui Steen (KU Leuven) Prof. dr. David Aubin (UCL) Prof. dr. Stéphane Moyson (UCL) Prof. dr. Catherine Fallon (Ulg)
AUTHORS: Tom Langbroek (UAntwerpen) Charlotte van Dijck (KU Leuven) Cécile Riche (UCL) Aline Thiry (Ulg) Chesney Callens (UAntwerpen)

CONTENTS 1. OBJECTIVE OF THE REPORT 5
1.1 THE OBJECTIVES AND RESEARCH QUESTIONS OF THE PSI-CO PROJECT ............................................................................................................ 5 1.2 THE CONTENT OF THIS REPORT AND ITS OBJECTIVE WITHIN THE BROADER PSI-CO PROJECT ................................................................................ 7 1.3 OVERALL THEORETICAL FRAMEWORK ....................................................................................................................................................... 8
2. RESEARCH STRATEGY, METHODOLOGY AND DATA 12 2.1. RESEARCH STRATEGY ......................................................................................................................................................................... 12 2.2 THE CASE SELECTION ........................................................................................................................................................................... 13 2.3. DATA COLLECTION ............................................................................................................................................................................. 21 2.3. DATA ANALYSIS STRATEGIES AND COMPARATIVE LOGIC ............................................................................................................................. 24 2.4 THE RELEVANCE OF CONSIDERING NETWORK-LEVEL, INDIVIDUAL AND ORGANIZATIONAL CONDITIONS FOR COLLABORATIVE INNOVATION: A FIRST
ANALYSIS OF THE SURVEY DATA ................................................................................................................................................................... 26 2.4.1 Descriptive statistics of survey items 26 2.4.2. Regression analyses of single independent variables 26 2.4.3. Regression analysis of combined independent variables 29 2.4.4. Discussion: the relevance of combining network-level, individual and organizational conditions 30
3. ANSWERING THE RESEARCH QUESTIONS 32 3.1 HOW DO COLLABORATIVE ARRANGEMENTS RESULT IN INNOVATIONS? ......................................................................................................... 32
3.1.1 Theoretical framework 32 3.1.2.Methodology 33 3.1.3 Analysis and results 35 3.1.4 Discussion 52
3.2. METAGOVERNANCE AS CONDITION FOR COLLABORATIVE INNOVATION ........................................................................................................ 54 3.2.1 Theoretical framework 54 3.2.2 Methodology 55 3.2.3 Analysis and results - Metagovernance strategies 55 3.2.4 Discussion on metagovernance strategies 67 3.2.5 Discussion: how network level and metagoverance conditions combine when producing collaborative innovation 70
3.3. INDIVIDUAL CONDITIONS FOR COLLABORATIVE INNOVATION ...................................................................................................................... 71 3.3.1 Theoretical framework 71 3.3.2 Methodology 74 3.3.3 Analysis and results 76 3.3.4 Discussion 82
3.4 ORGANIZATIONAL CONDITIONS FOR COLLABORATIVE INNOVATION ............................................................................................................... 84 3.4.1 Theoretical framework 84 3.4.2 Methodology 85 3.4.3 Analysis and results 87 3.4.4 Discussion: how the three main variables interact with each other 100
4. CONCLUSION: CONDITIONS FOR COLLABORATIVE INNOVATION 102 Conditions on the network level 103 Conditions on the individual level 108 Conditions on the organizational level 110
5. APPENDICES 119 Annex 1. Survey questions 119 Annex 2: Interview protocol 130 Annex 3: Output regression 133 Annex 4: Full ERGM results 134
Annex 5: Output statistical analyses individual level 135 Annex 6: visual representation of models 137

PSI-CO work package 3: cross-case analysis
4
Table of figures
Figure 1. Collaborative innovation by transversal coordination and co-production .............................................................................. 6 Figure 2. Work packages of the PSI-CO project ........................................................................................................................................ 7 Table 1. Type of actors ............................................................................................................................................................................. 19 Table 2. Comparison of cases ................................................................................................................................................................... 20 Table 3. Variables in the study, data sources and the analysis in which the variable is used .............................................................. 24 Table 4. Data analysis method and comparative logics used in the different sections of the report.................................................. 25 Table 5. OLS regression analyses of single independent variables with perceived innovation as dependent variable (in models with robustness check and controlling for network dummies) ...................................................................................................................... 29 Table 6. OLS regression analyses of combined independent variables with perceived innovation as dependent variable............... 30 Table 7. Network characteristics.............................................................................................................................................................. 36 Table 8. Innovative outcomes .................................................................................................................................................................. 38 Table 9. Process quality ............................................................................................................................................................................ 40 Table 10. Institutional quality................................................................................................................................................................... 42 Table 11. Perceived synergy ..................................................................................................................................................................... 44 Table 12. Commitment ............................................................................................................................................................................. 45 Table 13. Reciprocity ................................................................................................................................................................................ 47 Table 14. Nodal covariates ....................................................................................................................................................................... 48 Table 15. Arranging strategies ................................................................................................................................................................ 57 Table 16. Process rules ............................................................................................................................................................................. 58 Table 17. Connecting strategies ............................................................................................................................................................... 61 Table 18. Exploring content strategies .................................................................................................................................................... 66 Figure 3. Conditions for learning.............................................................................................................................................................. 72 Table 19. Measurement of learning ........................................................................................................................................................ 75 Table 20. Coefficients of univariate logistic regressions on policy learning .......................................................................................... 78 Table 21. Classification table policy learning........................................................................................................................................... 78 Table 22. Coefficient of the logistic regression on policy learning ........................................................................................................ 79 Table 23. Coefficients of univariate logistic regressions relational learning ......................................................................................... 80 Table 24. Classification table relational learning .................................................................................................................................... 80 Table 25. Coefficient of the logistic regression on relational learning .................................................................................................. 81 Table 26. Coefficient univariate logistic regression on political learning ............................................................................................. 81 Table 27. Classification table political learning ....................................................................................................................................... 82 Table 28. Logistic regression political learning........................................................................................................................................ 82 Figure 4. Competing values model (Quinn and Rohrbaugh, 1983) ........................................................................................................ 84 Figure 5. Organizational conditions for collaborative innovation .......................................................................................................... 85 Table 29. Coding scheme ......................................................................................................................................................................... 87 Table 30. Success project versus collaborative innovation as element employee evaluation ............................................................. 90 Figure 6. Organizational culture per type of organization...................................................................................................................... 93 Figure 7. Organizational support per type of organization .................................................................................................................... 94 Figure 8. Type of respondents ................................................................................................................................................................. 97 Figure 9. Red tape Subordinates and superiors ...................................................................................................................................... 97 Figure 10. Gender ..................................................................................................................................................................................... 97

PSI-CO work package 3: cross-case analysis
5
1. OBJECTIVE OF THE REPORT
1.1 The objectives and research questions of the PSI-CO project Nowadays, public sector innovation is high on government agendas across OECD countries. Confronted with major budgetary pressures and grand societal challenges, governments worldwide experience a need to step beyond conventional wisdoms and sedimented practices.
Despite the growing awareness of the need for collaboration, there is a lack of knowledge about how such collaborative governance arrangements result in meaningful innovations regarding policies and services, and how different forms of collaborative governance interact and reinforce each other. Furthermore, it is unclear what organizational, and individual conditions need to be present within administrations to foster collaborative governance arrangements. The Belgian Research Action through Interdisciplinary Research on ‘Public Sector Innovation through Collaboration’ (BRAIN- PSI-CO) that brings together four research groups from different universities, addresses this research gap by conducting a multi method study on collaborative innovation, studying both:
1. how collaborative governance can foster innovation, and
2. by what conditions, in turn, collaborative innovation is supported.
Next to providing academic advances, research on this topic is of particular relevance to the Federal ministries and agencies which are looking for, and experimenting with innovation strategies. It will offer practitioners insight into the potential of promoting public sector innovation through collaboration within and across governments, and with external stakeholders, and provide guidelines for establishing conditions favorable for such collaborative innovation.
The overall research question of this project is ‘how and under which conditions do collaborative governance arrangements foster the initiation, adoption and diffusion of innovations in policies and services?’
First, in order to study how collaborative governance can foster public sector innovation, we analyze not only the innovative capacity, but also the internal dynamics of collaborative governance arrangements. Second, in order to identify what conditions support collaborative innovation, we study the meta-governance of collaborative innovation, as well as characteristics at the level of the individual civil servants involved and of the public organizations concerned. In doing this, specific attention is directed to if and how new practices of organization and HRM, such as New Ways of Working, foster capacity for collaborative innovation. Additionally, the role of the so-called government-wide innovation architecture is studied. This results in seven different research questions which will be dealt with by the PSI-CO project:
RQ 1. (a) How do collaborative governance arrangements result in innovations with respect to policies and services?
(b) How do these collaborative governance strategies influence and reinforce each other in order to create such innovations?
RQ 2. How do governments create, stimulate and sustain such innovation-enhancing collaborative governance arrangements (metagovernance as condition for collaborative innovation)?

PSI-CO work package 3: cross-case analysis
6
RQ 3. How do individual civil servants in these collaborative governance arrangements select, process, and handle information in developing new tools, policies and services ? What skills, attitudes and incentives do they need to effectively work together with other public actors and stakeholders and how do they learn (individual conditions for collaborative innovation)?
RQ 4. How do organizational characteristics (e.g. organizational structures and organizational leadership) influence government capacity to set-up, sustain and learn from collaborative interactions (organizational conditions for collaborative innovation)?
These first four research questions get a preliminary answer in this research report, after which these preliminary findings will be validated by an Delphi study, an international validation (WP4) and tested in living labs (WP5). The three next research questions (RQ5 to RQ7) will be dealt with in WP6 to WP8 which are planned in 2019 and 2020.
RQ 5. To what extent are the meta-governance, individual and organizational conditions for collaborative innovation present in the federal ministries and agencies of Belgium and how can these be strengthened (gap-analysis)?
RQ 6. To what extent do new practices of organization in the form of New Ways of Working in the federal ministries and agencies of Belgium create appropriate individual and organizational conditions for collaborative innovation and how should these be adapted?
RQ 7. To what extent does the current innovation architecture within the Federal Government support and enhance collaborative innovation and how should this be adapted?
We study how collaborative governance arrangements with other public actors and with external stakeholders lead to service and policy innovations as an output (RQ1), as well as under what conditions the underlying collaborative innovation process takes place (RQ2 to RQ7). This is illustrated by the figure 1.
Figure 1. Collaborative innovation by transversal coordination and co-production

PSI-CO work package 3: cross-case analysis
7
The project uses multiple methods to address these questions, combining (1) a multiple case study phase, (2) a validation phase (Delphi and international validation), (3) a design-phase with two test cases, using Living Lab methodology and (4) a gap-analysis phase, using quantitative survey data, and (5) this in an international and comparative set-up. Figure 2 shows the set-up of the project with different work packages. The project itself is designed to be a collaborative process in which the commissioning government, their civil servants, and stakeholders are involved in various stages and through various instruments.
Figure 2. Work packages of the PSI-CO project
This research report reports the findings of WP3. Cross-case analysis.
1.2 The content of this report and its objective within the broader PSI-CO project After a theoretical-analytical model, a case study protocol and a case selection strategy have been developed in WP1 and reported in D1.1., nine case studies were conducted in WP2 (see D2.1). This data collection in the multiple case study took place from March 2017 till March 2018. One extra case study by UCL is still ongoing.
This report presents the results of the cross-case analysis of WP3 as shown in Figure 2, focusing on the first four research questions (RQ1 to RQ4). First, the overall theoretical core-elements are reiterated, and the overall research strategy, the methodology for data collection as well as the case selection strategy is discussed, with a short presentation of the nine anonymized cases. Subsequently, the first four research-questions of the project are answered based on the findings in the cross-case analysis. The report is accompanied with a draft policy brief as a separate document that presents in a preliminary form the findings and recommendations for practitioners.
The thematic findings of the cross-case analysis were originally planned to form separate project deliverables (D3.1.1; D3.2.1; D3.3.1; D3.4.1; D3.5) respectively focusing on the results of the collaborative governance arrangements, the individual conditions, organizational conditions and metagovernance conditions for collaboration innovation. In concertation with the accompanying committee and the project officer, it was agreed that these would be reported in one document, which would be labelled as D3. This

PSI-CO work package 3: cross-case analysis
8
research report brings these integrated parts together and constitutes the Deliverable D3. The findings in this report are still preliminary, as they need to be validated through a Delphi study (WP4.1) and an international validation (WP4.2).
This deliverable D3 also relates to a separate deliverable, being the draft policy brief (D3.6) on collaborative innovation in the public sector with features of innovation-enhancing collaborative governance arrangements and conditions, to be finalized after WP4.
1.3 Overall theoretical framework The research is guided by theoretical notions from public sector innovation literature, collaborative governance literature and research on network management, as well as literature on individual conditions for learning and organizational features fostering innovation. We introduce the main elements of our theoretical framework in this section, while in later sections further theoretical elaboration regarding network-level conditions, individual conditions and organizational conditions for collaborative innovation is to be found.
Innovation
Although there has been a growing demand for innovation, there is no real consensus about the definition of this concept. A study by De Vries et al. (2015) reviewed 181 articles about innovation in the public sector and found that a vast majority of these articles (76%) did not provide a definition of innovation. In the articles that did provide a definition however, two recurring elements were identified: first, definitions focus on a perceived novelty, and second, definitions include the first adoption of an idea by a given organization. The definition by Sørensen and Torfing (2012) combines these elements. They define innovation as “an intentional and proactive process that involves the generation, practical adoption and spread of new and creative ideas, which aim to produce a qualitative change in a specific context.” Innovation not necessarily involves an improvement in all cases, but rather a process that aims to solve a problem (Sørensen & Torfing 2012; Meijer, 2014). In defining innovation for the cases we study in our research, we base ourselves on the definition by Sørensen and Torfing. We do specify however, that, ‘new ideas’ merely have to be ‘new’ in the context of the case we study, not in absolute terms.
There are five main analytical phases in the innovation process: the ideation phase, the design policy, the implementation of the innovation, the evaluation and the adjustment. “Innovation can be defined as a complex and iterative process through which problems are defined; new ideas are developed and combined; prototypes and pilots are designed, tested, and redesigned; and new solutions are implemented, diffused, and problematized” (Hartley 2013).
What types of innovation can be distinguished? Different kinds of innovation can be identified. De Vries et al. (2014) have identified four types of innovation which are commonly used in their literature review. They distinguish:
1. Process innovation: Improvement of quality and efficiency of internal and external processes. It includes:
• Administrative process innovation: Creation of new organizational forms, the introduction of new management methods and techniques and new working methods

PSI-CO work package 3: cross-case analysis
9
• Technological process innovation: Creation or use of new technologies, introduced in an organization to render services to users and citizens
2. Product or service innovation: Creation of new public services or products
3. Governance innovation: Development of new forms and processes to address specific societal problems
4. Conceptual innovation: Introduction of new concepts, frames of reference or new paradigms that help to reframe the nature of specific problems as well as their possible solutions.
An additional type of innovation which is often mentioned in this respect is social innovation (e.g. Cajaiba-Santana, 2013; Voorberg et al., 2015). Voorberg et al. (2015) define this type of innovation as “the creation of long-lasting outcomes that aim to address societal needs by fundamentally changing the relationships, positions and rules between the involved stakeholders, through an open process of participation, exchange and collaboration with relevant stakeholders, including end-users, thereby crossing organizational boundaries and jurisdictions.”
Collaborative innovation
The principal idea in the collaborative innovation process is to open the innovation process for a large group of actors, to internalize external ideas and leverage internal knowledge (Bommert,2010). The assets of a group of different actors will increase the quantity and quality of innovations (Ibid.). Different actors can be present in these networks. As far as collaboration goes, we can distinguish two kinds of public sector collaborative innovation: collaborative innovation with internal stakeholders, and collaboration with external stakeholders. Governments can collaborate with internal stakeholders through transversal coordination and collaboration. In those cases, the government works together with other departments and agencies within the same government level and/or across governments levels. Governments can also collaborate with external stakeholders, working together with (groups of) citizens, interest groups, non-profit organizations and/or businesses. When citizens contribute to the workings of a public organization this is a specific type of collaboration called co-production. While Brandsen and Honingh (2016) focus on citizens who co-produce by engaging in co-design (of products/services) and co-implementation (of policies), multiple other forms of co-production can be discerned. Bovaird and Löffler (2012), for example, additionally mention co-assessment, co-prioritization, co-planning, co-managing, co-commissioning and co-delivering services. Other authors add co-pricing, co-maintenance, co-promotion and co-distributing services (Frow et al., 2015).
An important factor that makes collaboration successful are the different insights that are established (Sørensen, et. al, 2012). Thus, it is beneficial to have different organizations in the networks. The concept of governance networks, or collaborative governance arrangements, is important in this respect. Sørensen and Torfing (2009) define the concept as follows: “A stable articulation of mutually dependent, but operationally autonomous actors from state, market and civil society, who interact through conflict-ridden negotiations that take place within an institutionalized framework of rules, norms, shared knowledge and social imaginaries; facilitate self-regulated policy making in the shadow of hierarchy; and contribute to the production of ‘public value’ in a broad sense of problem definitions, visions, ideas, plans and concrete regulations that are deemed relevant to broad sections of the population.”

PSI-CO work package 3: cross-case analysis
10
This definition aims to include all the relevant factors of governance networks. It highlights the interdependency of the actors whether they are public or private, but still can function autonomously in the sense that they are not commanded by supervisors. Next to that, they negotiate with each other with consensus-seeking deliberation. When they are first formed there are no agreed rules, norms, procedures or ‘constitution’ where and how a legitimate decision where to be taken. However, the ongoing network interactions should eventually lead to a framework of rules, norms, values and idea that is both precarious and incomplete. The interactions in this network can be coordinated by a so-called metagovernor.
Please note that in the remainder of the report we often use the notion of ‘network’ to denote the collaborative governance arrangement in the involved cases.
Processes of collaborative innovation
Innovation does not happen by just placing some actors in a network. The innovation is driven by generative mechanisms that induce innovation (Sørensen & Torfing, 2012; Stevens and Verhoest, 2016a). Studying collaborative innovation does therefore not only mean looking at the relationship between collaboration and innovation, but also to the intermediate processes that facilitate innovation (Skelcher & Torfing, 2010; Sørensen & Torfing, 2012). There is a need of generative mechanisms for innovation. The generative mechanisms this research focusses on are synergy, learning and commitment. These can be treated as one element since they are sequential mechanisms (Ansell & Torfing, 2014).
The study of the processes of collaborative innovation should focus initially on the synergy of empowered actors with different identities, roles, and resources. Synergy is “the power to combine the perspectives, resources, and skills of a groups of people and organizations.” (Lasker et al, 2001). Synergy is an unique advantage of collaboration. Since we look at collaborative innovation, the question if complementary resources are brought together is essential (Ansell & Torfing, 2014; Sørensen & Torfing, 2011). Synergy is the mechanism where the innovation assets are mobilized at the start of the process. These innovation assets can be found on the organizational and individual level. Koppenjan and Klijn (2010) identify different types of resources that an actor is able to add to a network: financial resources, production resources, competencies, knowledge and legitimacy. Competencies and knowledge can be considered conditions at the individual level whereas financial resources can be linked to performance contracts and legitimacy to leadership, both at the organizational level. Each organization has certain specific resources and bringing them together is the starting point of the innovative process.
Purely bringing actors together however, does not lead to innovation. As developed further in the section on individual conditions, transformative learning1 need to occur (Torfing and Ansell, 2017). This is the second generative mechanism. It means that something has to happen when complementary resources are brought in. A cognitive change occurs as a result of interaction with other stakeholders. Interacting with people with different insights or knowledge spurs on the generating of new ideas (Ansell and Torfing, 2014). This is why Meijer (2014) defines innovation as: “a learning process in which governments attempt to meet specific societal challenges.” Nonetheless, a mere understanding through learning does not create a product. Therefore, commitment and joint ownership of the collaborative process and its product is
1 The learning aspect of the innovation process is discussed under individual conditions in section 3.3 of the report.

PSI-CO work package 3: cross-case analysis
11
necessary to turn ideas into innovations. It should overcome resistance towards the implementation (Skelcher and Torfing, 2010). This is the third generative mechanism.
Three levels of conditions fostering collaborative innovation
According to the literature, collaborative governance arenas enhance problem understanding, formulation of new visions, solutions, strategies and problem solving capacities, and mobilize societal actors to help generate, adopt, and diffuse innovations (Eggers and Singh, 2009; Sørensen and Torfing, 2011). Recent research projects have increased our knowledge of the conditions for innovation. Yet, little is still known about how collaborative governance arrangements result in meaningful innovations in services and policies and how different arrangements of collaborative governance interact and reinforce each other. Also it is unclear which organisational and individual conditions foster collaborative innovation, or how to design and sustain innovation-enhancing arrangements (the so-called meta-governance).
The capacity to innovate needs to be present on at least three levels, the individual level of the representatives active in the collaborative arrangement, the organizational level related to the home-organizations of these representatives, and the network level of the collaborative governance arrangement itself (see also figure 1; Gieske, Van Buuren and Bekkers, 2016). Within these levels, three components need to be met to have innovative capacity: connective capacity, ambidextrous capacity, and the capability to learn. The first component is connective capacity. In a society that becomes more fragmentized it is important that the capacity to establish and maintain connections is present on all levels. The second component to be capable to innovate is having ambidextrous capacity. Having innovative capacity means that a good balance between exploration and exploitation is found. Innovation and exploration are processes that includes searching, uncertainty and taking risks, while exploitation includes refinement, efficiency, and implementation. Third, the last component of innovative capacity is learning. Reflection is especially important at the individual level. A reflective attitude towards own norms and values and tolerance and openness towards change and innovation enhances the innovative capability. Thus, it is important to study the three levels of collaborative innovations. All of the levels are important for successful innovations, yet is remains unclear how these interact and reinforce each other. In this report we study a range of conditions at the level of the network or collaborative arrangement, the level of the participating individual representatives and at the level of the home-organizations of these representatives. We also pay attention to how these conditions combine in enhancing collaborative innovation.

PSI-CO work package 3: cross-case analysis
12
2. RESEARCH STRATEGY, METHODOLOGY AND DATA
2.1. Research strategy In this research project we tackle the research questions by a multiple case study design, using multiple data collection methods (interviews, questionnaires and social network analysis). The project combines qualitative and quantitative data analysis methods in line with what is advocated by pioneering researchers on collaborative innovation (Sørensen and Torfing 2011: 862-863). Moreover, the research project itself is meant to be a collaborative process in which the commissioning government, their civil servants and stakeholders are intensively involved in various stages and through various instruments (e.g., discussion of analytical framework; case study selection; validation of case study findings through Delphi; pilot-testing; and quantitative gap-analysis).
So far, qualitative multiple case studies of different practices of collaborative innovation were conducted. The study of the relations in figure 1 calls for a holistic approach, which takes into account the context, features of the involved actors, and multi-actor and multi-level interactions in the collaborative governance arrangements. Qualitative case studies are required to fully understand the complex processes and causalities, and to appreciate the role of actors’ different interpretations of the collaborative and innovative processes and outputs (Bekkers et al.2013). Because of the importance of the context, the research design should enable to compare across political-administrative cultures and policy sectors. So, our project entails a comparative multiple case study, comparing cases from different policy sectors. Additionally, we compare between cases geared towards service innovations and others emphasizing policy innovations. Comparative case studies will facilitate the formulation and testing of more specific hypotheses and contribute to theory building.
In order to conduct the comparative case studies a jointly developed, integrated analytical framework and a standardized data collection protocol were developed in WP1, bringing together theoretical perspectives on (a) processes of and conditions for public sector innovation, (b) coordination within and between governmental levels, and (c) co-production (including consultation) with external stakeholders.
In WP2 nine case studies were conducted, using a range of data collection techniques like document analysis, network mapping (analyzing actors and their resources), social network questionnaires to map actors and relations, individual questionnaires, and semi-structured interviews. Data collection and reporting of these case studies was standardized across the case studies. The cases consisted of an arrangement of different actors that frequently came together to discuss the process. The aim was to interview every actor in these arrangements in order to get to know everyone’s perspective on the innovative case. These interviews were complemented with an online survey which would be filled out by the same respondents. Thus, was set out to give an interview and fill out a survey. These included questions about their experience on the process, the outcomes, what they learned, the applied metagovernance and the characteristics of their home-organization. The survey also provided us with quantitative data on the network formation. This approach resulted in 91 conducted interviews and 110 completed surveys.
The case studies were selected based on the following criteria. (1) The cases entail arrangements involving public actors and to the extent possible also private actors and citizens, in order to learn if and under which conditions these arrangements lead to service or policy innovations. (2) In order to avoid the pro-innovation bias we included also cases which did not materialize in innovations, or in which innovation processes were

PSI-CO work package 3: cross-case analysis
13
particularly difficult in their progress. (3) Comparability, originality and accessibility were important criteria as well.
In WP3 a thematic cross-case analysis on all 9 cases was done in order to generate case-related answers on RQ1 to RQ4. This delivers case-related principles about how and under which circumstances collaborative governance arrangements result in policy and service innovations and how the governments’ meta-governance, individual conditions, and organizational conditions foster or inhibit this. With regard to the individual conditions we focused on the skills, attitudes, and positions , and incentives of civil servants empowering and motivating them to participate, engage in transformative learning and develop ownership (see also the conceptual framework in figure 1). As to organizational conditions we focused on the red tape of public organizations (‘hard aspects’) and on organizational culture and leadership as exponent of the ‘soft’ conditions.
This document contains the results of the cross-case analysis.
2.2 The case selection The case selection procedure has been described earlier in D.1.1. The starting point for the case selection was the follow-up committee. During the first meeting with the follow-up committee some first suggestions of potential cases were done. All follow-up committee members were called afterwards to discuss potential cases. These phone calls led to some suggested actors that were contacted. Not all of suggested cases were found to be suitable to serve as cases due to various reasons, such as the content of the innovation, a lack of accessibility to the actors, the period of the process and the lack of output of the collaborative arrangement. The cases (and the case episodes) were selected based on the following criteria for inclusion and variation:
x the collaboration needed to aim for some kind of innovation in a certain episode; x the set of cases needed to have variance concerning the type of innovation (service or policy); x the cases needed to involve collaborative arrangements with a minimum of 8 individual
representatives, representing multiple public and/or private actors and a mix of smaller and larger collaborative arrangements was strived for;
x the cases needed to have multiple public actors involved, and preferably non-public actors needed to be involved in some cases as well;
x the sets of cases needed to have a mix in terms of level of government of the public actors involved, with preferably at least some actors at the federal level, but also with some cases involving public actors from other levels of government;
x whether or not there was some sort of platform where actors had formal meetings; x the cases should be recent (no cases that started before 2012); x the practical aspects also play a role, such as easy access to the actors in the collaborative
arrangement; x the set of cases should cover a mix of sectors; x the sets of cases preferably included cases in which innovation was considered to be achieved, and
cases in which the achievement of innovation had not been fully achieved, or in which the process of collaborative innovation was considered to be rather difficult;

PSI-CO work package 3: cross-case analysis
14
x the possibility to define a specific episode in the process that are is most interesting based on the criteria summed up.
Based on the criteria, we contacted potential cases that seemed to be interesting and we had follow-up conversations to learn more about the cases with the coordinators of the cases.
The follow-up conversations were held to discuss the cases more in-depth with people who were actively involved in their respective cases. These people then served as the person that provided access to the collaborative arrangement. Because we knew that actors sometimes come and go during the innovative process, we used these follow-up conversations with the coordinators to determine the most interesting episode for us, in terms of issues discussed, and actors that were part of the collaborative arrangement. Therefore, we did an exploratory interview with the coordinator of the case in order to determine what the major episodes were and to prevent that we randomly chose such an episode. Interesting episodes were for example times where a core group of public and private actors came together frequently, or where a lot of issues occurred.
We aimed to have sufficient variety of cases on the different criteria in order to learn more about how collaborative innovation comes about in different settings. Simultaneously, we made sure that we could compare cases with each other. This resulted in nine different cases which were selected.
2.2.1 Description of cases2
2.2.1.1 Carelab
Carelab was a project concerning the simplification of rules and bureaucracy for parents with a disabled child. The project started from a parent’s story that illustrated the human impact of the rules and procedures that they have to deal with and about the effect that this complexity has on the parents.
A federal agency initiated the project together with some public officials to take action with the notion how it is ‘to stand on the other side’ in mind. The project team decided to shrink down the ‘field of operation’ and to focus on the needs and possibilities on a local scale. An advantage of this decision was that stakeholders knew each other to some extent already and that the smaller scale gave the opportunity for a more direct impact. This was the start of ‘Carelab’ and the start of this case.
At the start of 2014, the most important local actors were identified in collaboration with the mayor’s cabinet chef the municipal organization.
Stakeholders were invited to participate during the spring of 2014. Around 50 people came to the first kick-off meeting, but the amount of people involved declined over time. During the process a core group of committed people could be identified. The project ended with the creation of four possible solutions. Core actors left the process and implementation of these solutions remained limited.
2.2.1.2 Working group radicalization
The terror attacks in Paris on 13 November 2015 prompted the government to take a number of measures concerning national security. The responsible ministers brought all relevant parties around the table at that time to create a working groups concerning radicalization. The objective of this working group became 2 The names of cases and organizations are fictionalized due to privacy matters.

PSI-CO work package 3: cross-case analysis
15
detecting possible signs of radicalization within the group of asylum seekers or refugees. The main objective is that this information should flow to where it was needed. It had always been the intention to set up this working group, but the attacks caused an acceleration. The creation of the working group was already legally determined in the renewed Plan Q: “This action plan is a plan of approach that aims to limit radicalism and extremism in our society through integrated cooperation between various government departments.”
The radicalization working group is an implementation of Plan Q. This way of working is new. The exchange of information is much more structured through monthly meetings. But also the way information is collected is new, in particular the involvement of Fugit3 and the reporting procedure developed by them. At the local level, reports of possible signs or signals of radicalism are sent to the local police by the center directors of asylum seekers' centers. At the same time, this information is transferred to the reference person at Fugit's head office via a specific e-mail address. The transfer of this information to the relevant federal services is the subject of a procedure that is being developed by the Radicalization working group within the Q plan. Everything is being done to ensure that the transfer of information on radicalism is effective, both horizontally and vertically. This study focuses on the entire first year of this working group. That is, the establishment, coming to the notification procedure and the further procedure for collaboration.
2.2.1.3 Connecting Healthcare
Connecting Healthcare is a project in which an IT system was developed for administrative simplification. In short it ensures (among other things) that hospitals (first stage of the project), general practitioners (second stage) and pharmacies (third stage) have easy online access to information about their patient’s social rights, most specifically about whether their medical expenses are covered by social services. This way, when a socially vulnerable patient comes in asking for the reduced fee, the caregivers can find out if social services will compensate them for charging the reduced fee. Apart from offering easier access to information for different healthcare, this project is also about administrative simplification. It reduces the administrative burden by electronically processing information and keeping it on a central platform.
This project consisted of 11 different organizations. Central in the project are the local social services. Their role is to consult with patients requesting the social status, decide whether their healthcare is to be paid by the state, and communicate about this decision via the newly developed tool. This organization was instrumental in giving advice for developing the software for the project. Where the OCMWs are at the input-side of the project, the general practitioners, hospitals and pharmacies are at the output-end of the project. They are the ‘care givers’ and were represented by general practitioner. Connecting the input and the output side of the project are various different actors.
2.2.1.4 Invasive species management working group
In 2014, an ad hoc working group on invasive alien management was launched for the implementation of the EU directive regarding the prevention and control of invasive alien species. It was initiated by the representative of an environmental federal public service, who submitted, after consultation with
3 Fictional name

PSI-CO work package 3: cross-case analysis
16
colleagues that participates in the drafting of the EU directive, a proposal for the creation of such working group to the minister through the Interministerial Conference on Environment (ICE).
This working group consists of jurist and expert civil servants representing the three regions (Brussels, Flanders, Wallonia) and the federal state. It supported the launching of a cooperation agreement to implement the EU directive, based on a detailed analysis of the legal and scientific implication of the EU directive. A detailed argumentation in favour of this idea was presented to the ministers at the ICE, in February 2015. The ministers agreed on the idea and mandated the working group to elaborate the cooperation agreement.
The aim of the group was to create a new institutional arrangement at the federal level that organize and formalize information exchange between institutions dealing with invasive species policies across regions and communities. The final goal was to generate a more comprehensive and effective policy on invasive species. At this moment, the new institutional arrangement is implemented but the cooperation agreement has not been published in the Monitor yet.
2.2.1.5 City on scheme ‘City on scheme’ was initiated in the working group Hospitium (‘Care concerning hospitalization and discharge management’). This working group consists of several first-line healthcare organizations in a regional area in Belgium. In this group the idea was initiated to work out a strategy/methodology to make the public aware of the scheme to be taken to the hospital and the home pharmacist and to emphasize the importance of the medication scheme as a means of communication between different care providers.
The idea was to set up a pilot project in one municipality with the objective that every citizen of the chosen municipality has a medication schedule and also has this with him when he / she is hospitalized. For example, they wanted to develop a kind of model that can be transferred to other municipalities and that municipality can be rolled out across the whole of Belgium. Their ultimate goal is that every citizen in Belgium regards the availability of a medication scheme as an obvious thing.
At this moment, this methodology is transferred to several other municipalities. This is done under supervision of members of the original steering group. The focus of this case is, however, only the development and implementation in city M.
2.2.1.6 Sustainability program 2015 - 2020
The sustainability program 2015-2020 development comprises the set of actions federal administration should implement in order to reach international and national objectives. According the 1997 law on the coordination of the federal sustainable development policy, modified in 2010, this plan have to be adopted every 5 years by the interdepartmental authority for sustainability. It is elaborated by the Federal Strategy working group, composed of representatives of most of the federal public services (FPS) and public planning service (PPS).

PSI-CO work package 3: cross-case analysis
17
The case scrutinized here is the elaboration of the first draft of the 2015-2020 plan. This plan is interesting for three reasons. First, for the first time, workshop with stakeholders from the civil society were organized to define the guidelines. Second, actions should implement the long-term vision of sustainable development, adopted by the government in 2013. Third, those actions had to be interdepartmental, supported and realized by at least two different federal public service.
The draft of the sustainability program has been adopted by the interdepartmental authority for sustainability beginning 2015. However, it has never been adopted by the government and therefore never implemented. Now, a new process has started for the 2019 edition of the plan, integrating the new sustainable development goals and with a larger involvement of the stakeholders from the civil society (Professional organization, NGO, others).
2.2.1.7 Mothers in poverty
This project was initiated by a federal service on Social Integration. It is about the empowerment of single mothers in poverty and consisted of the intense guidance of groups of 15 single mothers in poverty during one year. In general it aimed at empowering these women through individual help and group sessions in order to diminish the isolation they experienced and help them get a better grip on their lives through helping them to decent housing, education, a job… and bringing them into contact with different services that could be beneficial to them.
In this project the federal service on Social Integration collaborated with a civil society organization for women’s rights, and a school for higher education. While they coordinated the project, five local welfare centers executed the project. The choice for these local welfare centers was based on their high numbers of single mothers in poverty. In every welfare center one or more case manager(s) was/were responsible for guiding the 15 mothers selected in that city.
In that year the mothers were supported they received individual support (house visits) as well as group sessions. The mothers met every two weeks for a session. These sessions had various themes ranging from ‘healthy food’ to ‘rewarding and disciplining children’ and ‘getting rid of lice’. For these sessions there were often volunteers or members of local women’s organizations involved. The holistic approach with frequent individual meetings, supplemented by group therapy is innovative because it differs radically from the current way of working where case managers rush from one service user to the next. Here case managers had time for house visits, time to look at the housing situation, job perspectives, health, parental needs, and emotional well-being of the women involved all at once.
2.2.1.8 Experts by experience Here, a federal service on Social Integration enlisted citizens with a background in poverty and social exclusion as experts by experience. These citizens were placed at other federal government services in order to detect issues and recommend changes for the organization’s ways of working that impeded people in poverty and social exclusion from making effective use of the services provided by these organizations.
PSI-CO work package 3: cross-case analysis
18
In practice they devised measures to lower thresholds for citizens in poverty to go to these services, as well as improved government communication for this section of society. Their goal was to make the services more inclusive. This collaborative innovation has been ongoing for several years through different sources of funding. There are currently almost 40 experts by experience active across different federal services. The project consists of 3 different types of actors: the coordinating team at the federal level, the experts by experience, and the federal services where they were placed. We studied the process of involving experts by experience in different federal services. This project has existed in some form for over a decade now, but became a lot more structured and uniform over the last few years. In this project the use of experts by experience is innovative as such. Asking where the problems in social exclusion lie to people who experienced poverty and social exclusion themselves and employing them, was new in the Belgian federal administration. New methods of recruitment had to be created in order to capture the potential of the applicants, since most of them had no traditional education or CV; next a new kind of job with new tasks had to be created in each service where experts were placed, and lastly a way of integrating the experts in the federal organizations had to be thought out.
2.2.1.9 National Information sharing platform (NISP)
The main objective of this innovation is to unify and professionalize crisis management and emergency planning practices throughout Belgium using an IT tool shared by all the actors involved.
This is a primarily technological innovation that is supposed to implement an organizational innovation to unify communication processes with all users on the territory. A public procurement procedure has been launched to select a private IT provider and working groups with a large number of stakeholders have met regularly to discuss the platform's functionalities.
This innovation will replace another system which had been developed over the years by the users in a bottom up way.
Table 1 and 2 show the differences in the cases that were studied. We included a wide array of cases which were the same on some case selection criteria, but different on other criteria. This enabled us to obtain a good understanding of collaborative innovation arrangements in all its different aspects while still be able to compare them. Table 1 shows the variance in the composition of the collaborative arrangement, with seven cases having non-public actors, besides public actors. These public actors in the cases we studied are mostly from different governmental levels, and in the cases where only federal public actors are involved, there are ministries or agencies from different policy domains included. This enabled us to obtain a good understanding of collaborative innovation arrangements in all its different aspects while still be able to compare them.

PSI-CO work package 3: cross-case analysis
19
Citizens Public actors Private actors Non-profit Interest groups
Carelab X X (fed/reg/local) X X
Radicalization X (federal)
Connecting Healthcare
X (fed/reg/local) X X
Invasive species X (fed/reg) X
City on scheme X (reg/local) X X X
Sustainability program
X (federal)
Mothers in poverty
X X (fed/local) X X
Experts by experience
X X (federal)
NISP X (fed/local) X
Table 1. Type of actors
Table 2 shows that cases included also differ in terms of the kind of innovation they pursued, the phase that the innovation achieved and the overall success in terms of innovation. Cases also differ in duration, size (number of actors involved) and policy sectors, the availability of separate financial resources specifically geared towards the innovation, political involvement, as well as the presence of a strong informal network.

Table 2. Comparison of cases
PHASE TYPE OF INNOVATION
FIELD HANDS-ON LEADER
FINANCIAL RESOURCES
SIZE POLITICAL INVOLVEMENT
SUCCESS? INFORMAL NETWORK
DURATION
CARELAB Design Social innovation for vulnerable group
Social Yes No Large Only set-up, not in process
No ++ 1-2 years
RADICALIZATION Adjustment Governance innovation
Crisis management
No No Small Priority, but not involved
Yes - 1 year
CONNECTING HEALTHCARE
Evaluation Technological process innovation
Health Yes Yes Large Asked Yes ++ +5 years
INVASIVE SPECIES
Implementation Governance innovation
Environment Yes Medium Small No priority, but constant involvement
Yes +- 2-3 years
CITY ON SCHEME Adjustment Social/administrative process innovation
Health Yes Medium Small Only set-up, not in process
Yes ++ 1-2 years
SUSTAINABILITY PROGRAM
Design Administrative policy innovation
Environment No No Large No No - 2-3 years
MOTHERS IN POVERTY
Adjustment Social innovation for vulnerable group
Social No Medium Small Project used for public relations
Yes ++ 2 years
EXPERTS BY EXPERIENCE
Adjustment Social innovation for vulnerable group
Social No Medium Small No Later on: yes - + 5 years
NISP Implementation Technological Crisis management
No Yes Large Priority, but not involved
Yes - 3 years

2.3. Data collection The case study research involved different data collection methods; namely document analysis, survey, semi-structured interviews and data collection for the social network analysis.
When we selected a case and episode, we determined together with the coordinator who the actors in the collaborative arrangement were. We targeted the individual representatives active in the formal meetings of the collaborative arrangement, and collected through them information about the network, interactions and metagovernance, their own individual characteristics and features of their home-organization (if any). We invited the relevant actors in the collaborative arrangement through email to fill out a digital survey. Subsequently, these respondents were also asked to participate in a semi-structured interview to gain more information, such as certain motivations behind their survey answers. For example, the social network analysis part of the survey gives us information about the interactions, but not so much why certain actors interacted with each other. This way we got a broad understanding of the innovative project and the interactions that happened in the collaborative arrangement.
In sum, the aim was that every actor in the collaborative arrangement filled out the survey (including the social network questions included in that survey) and is subsequently interviewed partially based on his or her answers. The survey questions are to be found in Appendix 1, and the interview questions in Appendix 2.
The data was collected in the period March 2017 until March 2018.
Table 3 contains an overview of the variables studied in the research, indicating whether there is survey, interview or social network data on these variables and in which sections of the research report these variables are studied.
Variable Survey data
Interview data
SNA data
Overall statis-tical
analysis of survey
data
(section 2.4)
Network-level
variables
(section 3.1)
Meta-gover-nance
(section 3.2)
Individual conditions
(section 3.3)
Organi-zational
condi-tions
(section 3.4)
Innovation
outcomes
x x x x x (x) x
Phase of innovation x x x x x
Network-level variables
Prior differences in opinion
x x
Prior levels of trust x x

PSI-CO work package 3: cross-case analysis
22
Variable Survey data
Interview data
SNA data
Overall statis-tical
analysis of survey
data
(section 2.4)
Network-level
variables
(section 3.1)
Meta-gover-nance
(section 3.2)
Individual conditions
(section 3.3)
Organi-zational
condi-tions
(section 3.4)
Process quality x x x
Institutional quality x x x
Synergy x x x x
Commitment x x x x
Actor importance x
‘Information sharing’ interactions
x x (+ERGM)
‘Contact outside meetings’ interactions
x x
‘Building upon each others’ ideas inside meetings’ interactions
x x (+ERGM)
Density of the network
x x
Reciprocity in interactions
x x (ERGM)
Cliques in the network
x x x
Coordinator x x x x (ERGM)
Public actor x x x x
Private actor x x x x
Citizen x x x x
Metagovernance strategies - arranging
x x x
Metagovernance strategies – process rules
x x x
Metagovernance strategies - exploring
x x x x

PSI-CO work package 3: cross-case analysis
23
Variable Survey data
Interview data
SNA data
Overall statis-tical
analysis of survey
data
(section 2.4)
Network-level
variables
(section 3.1)
Meta-gover-nance
(section 3.2)
Individual conditions
(section 3.3)
Organi-zational
condi-tions
(section 3.4)
Metagovernance strategies - connecting
x x x x
Individual level variables
Individual policy learning
x x (dependent)
Individual political learning
x x (dependent)
Individual relational learning
x x (dependent)
Expertise x x x x (ERGM)
Trust propensity x x x
Public service motivation
x x x
Perception of procedural fairness
x x
Information exchange in the network
x x
Frequency of contact x x
Trust in other participants
x x
Perception of trustworthiness of the other participants
x x
Organizational level variables
Organizational culture
x x x x

PSI-CO work package 3: cross-case analysis
24
Variable Survey data
Interview data
SNA data
Overall statis-tical
analysis of survey
data
(section 2.4)
Network-level
variables
(section 3.1)
Meta-gover-nance
(section 3.2)
Individual conditions
(section 3.3)
Organi-zational
condi-tions
(section 3.4)
Performance contracts and evaluation
x x
Leadership x x x x
Control from minister/higher levels of organization
x x x x (ERGM) (x)
Priority for minister/higher levels of organization
x x x x (ERGM) (x)
Liberty to act (freedom)
x x x x (ERGM)
General red tape x x x x
Specific red tape x x x
Table 3. Variables in the study, data sources and the analysis in which the variable is used
2.3. Data analysis strategies and comparative logic In this report different analysis methods are used, entailing both quantitative and qualitative methods. This combination of data analysis method enables us to study the phenomena from different angles by making maximum use of the different data-sources and using different comparative logics. Table 4 lists the different methods used and the comparative logics (case-oriented or variable-oriented).
Section in the report Kind of analyses Case-oriented analysis
Variable-oriented analysis
Section 2.4 First analysis of survey data
OLS regressions based on the survey data with innovative outcomes as dependent and with network dummies in order to control for intra-network interdependencies
No Solely variable-oriented analysis
Section 3.1 Network-level conditions
Descriptive analysis and comparison of network features (using survey, interview and SNA data)
ERGM-analyses per case to explain interaction patterns in each network
Pre-dominantly case-oriented analysis
Concluding statements on relevance of variables across cases

PSI-CO work package 3: cross-case analysis
25
Looking for patterns between network-level conditions and innovative outcomes in a qualitative way (multiple case comparison)
Network-level conditions are described per case
ERGMs per case
Section 3.2 Meta-governance
Descriptive analysis and comparison of metagovernance strategies (using survey and interview data)
Looking for patterns between metagovernance and innovative outcomes in a qualitative way (multiple case comparison)
Pre-dominantly case-oriented analysis
Metagovernance strategies are described per case.
Concluding statements on relevance of variables across cases
Section 3.3 Individual conditions
Logistic regressions with different kinds of learning (using interview data) as dependents and with independents referring to individual-level conditions (based on survey and SNA data)
No Solely variable-oriented analysis
Section 3.4 Organizational conditions
Qualitative analysis of mainly interview data on organizational conditions in relation with innovative outcomes
Limited Predominantly variable-oriented analysis, but with some contextualization
Table 4. Data analysis method and comparative logics used in the different sections of the report
The use of different data analysis methods and comparative logics results in rich and complementary insights, but also raises serious challenges in terms of reporting and summarizing the overall findings. First, the combination of methods and comparative logics has as implication that the different sections in this report have their own way of reporting the results and that each methodology asks for additional explanations. The research team has tried to ensure the scientific quality of reporting according to the standards of each method, while ensuring the understandability of the report for non-academic readers. Moreover, summarizing overall findings when using different methods of analysis and comparative logics is not easy, as methods have different standards in terms of which results are significant. In this report we treat the results generated by the different methods as being complementary and of equal value.

PSI-CO work package 3: cross-case analysis
26
2.4 The relevance of considering network-level, individual and organizational conditions for collaborative innovation: a first analysis of the survey data
The first step in the analysis we conducted was based solely on the survey data, and consisted of the following three activities. First, we analyzed the descriptives of each of the variables. Secondly, we ran factor analyses to see to what extent items which were related to one concept/variable indeed loaded on one factor. We also calculated a scale reliability coefficient, being Cronbach’s Alpha. Thirdly, we performed OLS regression analyses to study the independent effects of network-level, individual-level and organization-level variables, on which we have survey data, on the perceived innovative outcomes.
2.4.1 Descriptive statistics of survey items4
Innovation is our dependent variable. We describe it as the individual perception of innovation outcomes of the network. We incorporated four survey items in our statistical analysis5. The four items are measured by 106 observations in which the mean is slightly higher than the average of the scale but the histograms of the survey items display a good spread of the data. The scale reliability coefficient (Cronbach’s Alpha) for the data is 0.80 and the eigenvalue for the factor analysis shows that we can include the four survey items into one variable using the factor scores.
The descriptives, factor analyses and Cronbach’s Alpha can be found in appendix 3 of this report. For most scales we used, reliability scale coefficients and factor analyses taught us that the items indeed relate to the concept they were deemed to measure.
2.4.2. Regression analyses of single independent variables
We used ordinary least squares (OLS) regression for the analysis of the isolated effects of the independent variables on perceived innovation in the networks. Since the variance in the data was likely to be dependent on the networks the data was collected from, we used dummy variables for the networks. The nine networks we selected in our analysis generated eight additional independent variables (network dummies). We generated three kinds of models: (a) a regression model without the network dummies, (b) a regression model with a robustness check, and (c) a regression model with the network dummies and the robustness check. The robustness check corrected the standard errors, so there were less deviations in the variance.
Table 5 reports the results of the third kind of models (c). When controlling for the network dummies and applying the robustness check, we see in table 5 that especially the following four independent variables at network-level explain statistically significantly and positively the variance of perceived innovation in the networks:
x the prior existence of differences in opinion between the actors in the network at the start of the process;
x the level of synergy6 in the network;
4 All of the data we used, comprises out of a 10-point scale from 0-10. However, the software program we used translated a 0 to a 1, which resulted in a 1-11 scale. Means, minima and maxima should be considered in that regard. 5 1) Extent of innovative ideas; 2) Innovative character higher/lower than expected; 3) Innovative ideas are feasible; 4) Solutions that have been developed do (not) deal with problem at hand. 6 We describe synergy as the individual perceptions by respondents on the synergy in the network. In developing our variable, we use three survey items: (1) At the start of [the process] there were a lot of differences of opinion between participants; (2) my input was (not) actively

PSI-CO work package 3: cross-case analysis
27
x whether or not the respondent is the coordinator; x the extent of meta-governance strategies7 (exploring and connecting) applied in the network.
As to the individual-level conditions, the following independent variable also has a positive effect:
x the extent of trust propensity8 of the respondent.
As to the organizational-level conditions, the following variables have a positive effect on the perceived innovation in networks, when controlling for network dummies:
x the extent to which the project is a priority for the top management of the home-organization of the respondent;
x the extent to which the top management of the home organization exert control on his/her activities and positioning in the process vis-à-vis the respondent;
x the extent to which the home-organization of the respondent has a developmental culture9.
We see that the proportion of the variance in the dependent variable (innovation) that is explained by the variance in these individual independent variables is situated between 20% and 31%, which is reasonably low. Please note that the models with the highest R² and with highly significant independent variables, are in decreasing order respectively the models with the following single independent variables: (1) synergy in the network; (2) priority of top management of the home-organization of the respondent; (3) trust
used; (3) differences of opinion have deepened the substantive decisions. Our data consists out of answers from 103-104 respondents. The mean, minima and maxima show no large deviations between the items and the histograms are generally well spread. The reliability statistics show a Cronbach’s Alpha of 0.68 which is not very high but also not problematically low. Furthermore, the factor analysis shows a reasonably high eigenvalue for the first component and a fit of the data on one component. 7 Meta governance is an independent variable. We measure the variable as the individual perceptions by respondents on network management/meta governance (perceptions by each respondent). We use six survey items in our analysis to analyse the impact of meta governance on innovation: (1) There has been a lot of attention in this project for involving external organizations who can bring in new ideas; (2) When gathering information and knowledge in this project there has been a lot of emphasis on determining the joint information needs; (3) In case of deadlocks and problems in this process, bringing together opposing interests has been very much attempted; (4) In this process there has been a lot of attention for the (development in) relationships between the involved participants and organizations; (5) All organizations are/have been actively involved in the decision-making, (collective decision-making); (6) All important actors necessary to deal with the issue at hand were included in the process. We received data from 103-105 respondents for these items, with a mean between 8 and 8.6. The minima, maxima and the histogram show no substantial deviations from a normal distribution. Considering the factor analysis and reliability statistics, we see a Cronbach’s Alpha of 0.86 and a high eigenvalue for the first factor component, which means we can integrate the six items into one variable, using the factor scores. 8 Trust propensity is in our analysis described as the extent to which participants in general are inclined to trust other people. Our variable is composed out of three items: (1) Do you think that, generally speaking, most people can be trusted or that you cannot be cautious enough; (2) Do you think that most people would try to take advantage of others if they had the chance or that they would try to be fair? (3) Do you think that most of the time people try to be helpful or that they are looking out for themselves. The descriptive analysis shows that the mean of the three items is situated between 7 and 8 for 110 answers of respondents. Minima and maxima are the same for all survey items (resp. 3 and 11) and the histograms show a normal distribution that is similar for the three items. As expected, the reliability statistics are high (Cronbach’s Alpha = 0.83). The factor analysis shows that we can use one variable that describes the variance in the three survey items based on the factor scores. 9 We measure developmental organizational culture in the survey as the individual perceptions per respondent on the organizational culture of the organizations of which the respondents are part. We construct the variable using six survey items, because the reliability statistics provide us with enough evidence to assume a convergence of the data from the different survey items (Cronbach’s Alpha = 0.87). The survey items were: (1) Readiness to meet new challenges is important in my organization; (2) My organization emphasizes growth and acquiring new resources; (3) My organization is very dynamic and entrepreneurial; (4) In my organization people are willing to stick their necks out and take risks; (5) The glue that holds my organization together is a commitment to innovation and development; (6) In my organization, there is an emphasis on being first. Furthermore, the factor analysis of the items shows us a high eigenvalue for the first component and a high factor loading of the items on the first component. We can safely assume that the factor scores for the items can be used to construct our variable. The different items measured observations from 96-99 respondents and the distribution on the histograms, the respective maxima/minima and means give us a further indication of the reliability of the data.

PSI-CO work package 3: cross-case analysis
28
propensity and (4) meta governance. It seems that the variance in innovation is best explained by the variance in synergy. In the next section we perform regression analyses in which we combine two or three of these independent variables with a significant effect in order to check whether the variance explained in innovation increases.
Please note that some variables were significant in the basic model (a), but became insignificant when applying the robustness check and/or controlling for the network dummies (models (b) and (c)):
x Commitment of the own organization of the respondent to support the innovation; x Commitment of the own organization of the respondent to invest financial resources into the
innovation; x public service motivation.
Independent variables R² p-value of model p-value of independent variable
Network-level conditions
Prior differences of opinion 0,2027 0,0014 0,008***
Prior trust between partners 0,1386 0,0535 0,419
Synergy 0,3143 0,0004 0,000*** Commitment (support by own organization) 0,1521 0,0116 0,230 Commitment (financial support by own organization) 0,1625 0,0166 0,111
Coordinator 0,1954 0,0021 0,002***
Public actor 0,1335 0,0831 0,181
Private actor 0,1342 0,0527 0,108
Citizen 0,1120 0,1135 0,665
Meta governance 0,2447 0,0001 0,000***
Individual-level conditions
Trust propensity 0,2653 0,0003 0,000***
Public service motivation 0,1763 0,0027 0,106
Expertise 0,1342 0,0825 0,174
Organization-level conditions
Developmental organizational culture 0,2436 0,0025 0,077*
Organizational leadership 0,2358 0,0031 0,332 Control higher levels of the own organization10 0,2580 0,0009 0,076* Priority higher levels of the own organization 0,3095 0,0007 0,005***
Control (minister) 0,1986 0,0245 0,721
Priority for minister 0,2226 0,0227 0,929
10 In this report we use the notions of ‘own organization’ or ‘home organization’ to denote the organization in which the respondent/network participants works and which he is representing in the network.

PSI-CO work package 3: cross-case analysis
29
Independent variables R² p-value of model p-value of independent variable
Liberty (freedom) 0,2302 0,0013 0,183
Red tape (general) 0,2289 0,0064 0,849 Legend : p < 0,01 *** ; p < 0,05 **; p < 0,1 *
Table 5. OLS regression analyses of single independent variables with perceived innovation as dependent variable (in models with robustness check and controlling for network dummies)
2.4.3. Regression analysis of combined independent variables As we expect that the variance in perceived innovation is explained by the variance of more than one independent variable, we combined several independent variables in the OLS regression models. We selected only the independent variables that showed statistical significance in the regression analyses in Table 5. We used the same procedure as before regarding the correction on the standard errors and the usage of network dummy variables because of the expected dependence of the variance on the network from which we collected the data. We applied also a heteroscedasticity test on the data to analyse the amount of deviation of the variance between the variables (because we incorporated now more than one independent variable in our models). The heteroscedasticity test allowed us to choose the proper model for our results. The correction of the standard errors was not necessary for four of our models11, which is the reason why we selected the regular model with network dummies to analyse the R² and p-values of these models. The other models all showed a significant (> 0.05) heteroscedasticity. Accordingly, we used the robust models with network dummies to analyse the R² and p-values of these models. The models with all the parameters are attached in Appendix 3. In this section of the report, we only provide the reader with a summarizing table of the results. As we hoped for, we see in Table 6 that the R² of the statistically significant independent variables display higher values than in the regression analyses of Table 5. We see in particular high values for the dual combinations of meta governance, synergy and trust propensity which we expected because of their relatively high R² in the previous models (Table 5). However, we see also high values for R² for the combination of “coordinator” and “priority top management”. We saw in Table 5 that both these variables had high p-values, which can explain the presence of high significant R² in Table 6. In every model we ran, we see that synergy is a highly significant variable, of which the variance explains in a lot of models the variance in the dependent variable. We see the highest value for R² (45%) in the model that combines “synergy” with “priority top management”, in which synergy as independent variable is highly significant (0.000) and priority top management is moderately significant (0.056). Multicollinearity has been tested in these models and did not prove to be problematic.
11 1) Coordinator + meta governance; 2) Meta governance + commitment (financial); 3) Meta governance + priority of top management; 4) Meta governance + network outcome (opinion).

PSI-CO work package 3: cross-case analysis
30
Independent variable R² p-value of model p-value independent variable
Coordinator 0.2985 0.0002
0,019** Trust propensity 0,007*** Meta governance
0,3029 0,0000 0,011**
Trust propensity 0,036** Synergy
0.3926 0,0000 0,000***
Trust propensity 0,024** Prior differences in opinion
0.3034 0,0000
0,014** Trust propensity 0,001*** Trust propensity
0.3636 0,0000 0,023**
Prior differences in opinion 0,015** Coordinator 0,011** Coordinator
0.2640 0,0054 0,086**
Meta governance 0,064* Coordinator
0.3741 0,0000 0,159
Synergy 0,003***
Coordinator 0.4100 0,0027
0,084*
Priority higher levels in own organizaton 0,079*
Meta governance 0.3561 0,0000
0,355 Synergy 0,022** Meta governance
0.2438 0,0031 0,001***
Commitment of own organization (financial) 0,542 Meta governance
0.3991 0,0001 0,002***
Priority higher levels in own organization 0,062*
Synergy 0.4495 0,0000
0,000*** Priority higher levels in own organization 0,056*
Coordinator 0.3044 0,0000
0.059* Meta governance 0,188 Trust propensity 0,117
Coordinator 0.3979 0,0000
0,229 Synergy 0,007***
Trust propensity 0,118 Meta governance
0.2737 0,0007 0,001***
Prior differences in opinion 0,059* Legend : p < 0,01 *** ; p < 0,05 **; p < 0,1 * Table 6. OLS regression analyses of combined independent variables with perceived innovation as dependent variable
2.4.4. Discussion: the relevance of combining network-level, individual and organizational conditions
The analyses shown in table 5 and in Table 6 show on one hand the relevance of taking into account variables at network-level, individual level and organizational level, and on the other hand, the relevance of studying the combined effects of variables at these three levels. First, Table 5 teaches us that the perceived level of innovation by the respondents active in the networks can be explained partially by

PSI-CO work package 3: cross-case analysis
31
network-level factors, like the synergy in the network, the applied metagovernance strategies, or whether the respondent is the coordinator or not. But also individual-level variables like the trust propensity of the respondent and organization-level variables like the extent the home-organization of the respondent has a developmental culture, the project is the priority of his top management or whether the top management exerts control on the respondents’ activities and positioning in the process. So, perceived innovation in the networks is explained by network-level, individual-level or organization-level variables.
However, also the combination of network-level, individual-level and organization-level variables matters for the perceived level of innovation. Table 6 teaches us that for example the perceived level of synergy in the network and the trust propensity of the respondent can explain about 39% of the variance in perceived innovation (when controlling for network dummies). Similarly, the perceived extent of applied metagovernance strategies, together with the extent to which the project is a priority of the top management of the home-organization of the respondent, explains up to 40% of the variance. A model with trust propensity of the respondent, whether or not the respondent is the coordinator and the level of differences of opinion at the start of the project together explains 36% of the variance in perceived innovation by the respondent. Hence, the survey data teaches us that variables at network-level, individual-level and organization-level when they are jointly present may explain more of the perceived innovation, then when considered separately.
In the next sections we consider the different levels of variables separately, using survey data, interview data and social network analysis data. In the concluding part of the report we come back to the question how variables at different levels may combine in their effect on collaborative innovation.

PSI-CO work package 3: cross-case analysis
32
3. ANSWERING THE RESEARCH QUESTIONS
3.1 How do collaborative arrangements result in innovations? This section presents the answer on the first research question of the project:
RQ 1. (a) How do collaborative governance arrangements result in innovations with respect to policies and services (innovative capacity of collaborative governance arrangements)?
(b) How do these collaborative governance strategies influence and reinforce each other in order to create such innovations (dynamics and interaction of collaborative governance arrangements)?
3.1.1 Theoretical framework One main concept in this study are collaborative governance arrangements. As was mentioned already in the general theoretical framework of this report, collaborative government arrangements are: “A stable articulation of mutually dependent, but operationally autonomous actors from state, market and civil society, who interact through conflict-ridden negotiations that take place within an institutionalized framework of rules, norms, shared knowledge and social imaginaries; facilitate self-regulated policy making in the shadow of hierarchy; and contribute to the production of ‘public value’ in a broad sense of problem definitions, visions, ideas, plans and concrete regulations that are deemed relevant to broad sections of the population.” (Sørensen and Torfing, 2009). This definition emphasizes the presence of a network in which different actor interact and operate. Innovation through collaboration means that a network is present in which the different actors operate, and that the outcome of this network is an innovation.
A network can be defined in a very simple way as “a set of nodes and the set of ties representing some relationship, or lack of relationship, between the nodes.” (Brass et al., 2004). Network literature, however, often refers to a more detailed definition of certain common themes that networks possess, including social interaction (of individuals acting on behalf of their organizations), relationships, connectedness, collaboration, collective action, trust, and cooperation (Provan et al., 2007). Provan and others (2007) define ‘whole networks’ as: “a group of three or more organizations connected in ways that facilitate achievement of a common goal.” However, the node is not necessarily always an organization; think for example of a collaborative innovation where local citizens who do not represent an organization are involved. Therefore, it is better to speak about actors in the network.
Innovation is not something that occurs by mere cooperation in a network, although the structure of the network can certainly play a role in its successful outcome (Provan & Sebastian,1998; Koppenjan and Klijn,2010). A network can take many forms and shapes. This can be attributed to different characteristics of human interaction that establish social ties. An important concept related to the formation of networks are the density, which is a measure of the existing connections between the actors divided by the total amount of possible connections. A higher number represents a higher density. If an existing ties between two actors is directed in both ways, we speak of ‘reciprocity’. This indicates a mutual relationship, for example “I give information to you, because you give information to me”. It is also possible to look at cliques or the centrality in the network . A clique is a part of the network in which the actors are more closely and intensely tied to one another than they are to other members of the network. The centrality in the network addresses who the most central, most connected, actor in the network is.

PSI-CO work package 3: cross-case analysis
33
Network characteristics such as density, centrality and cliques are measures of the shape of the network and, thus represent the communication channels within the network (Lusher et al ,2012). Actors get access to information, social support and other resources through these ties (Agneessens, et al,2015). The shape of the network thus determines the availability of resources, and in the case of innovations the possibility of bringing together different perspectives and resources that should eventually lead to the development of an innovative outcome.
Repeated collaboration in stable and closed networks that have established more or less the same worldview will stifle creativity and reduce innovation because of a lack of synergy and learning. In terms of network structure, a network needs to be sufficiently dense in order to guarantee access to all actors and the information they possess (Gilsing et al. 2005). Redundant relations are not a big problem because their costs do not outweigh the advantages of the information sharing. However, too dense and stable networks decrease the ability for variation in actors and knowledge, thereby not creating synergy and learning.
Stevens (2018) examined under which conditions individuals are more likely to interact with other participants in learning activities in three Belgian collaborative government arrangements aimed at creating an innovation. He found that the learning process is no linear process, but a dialectic process that goes back and forth between phases. Actors tend to interact with actors that share the same perception of the problem. Also interaction is influenced by ‘returning the favor’. Actors are more eager to interact with actors that asked questions for clarification or shared relevant information and ideas with them. Finally, the actors who are seen as being ‘very necessary’ to deal with the policy problem tend to receive more information than actor actors in the network.
The quality of these collaborative governance arrangements can be evaluated on three potential outcomes (Koppenjan and Klijn,2010): 1) substantive outcomes: that is, the outcomes that are produced content-wise. The innovative outcomes of the project fall under the substantive outcomes. 2) the process outcomes, or as we call them in report to prevent confusion: process quality. By process quality is the smoothness of the process and the interactions understood. For example, did the process ran smooth without any blockades? 3) the institutional outcomes (or institutional quality) are the ‘solidified history’ expressed in rules, more or less stable patterns of interactions and relationships of trust among actors.This section described the role of network interactions in the creation of collaborative innovation and in what types of outcomes they can result. The structure of the network is an important aspect for the creation of innovation. In the next section we try to explain what the role of the collaborative governance arrangements and their network structure is in the development of innovations.
3.1.2.Methodology
The research question was answered in a qualitative and a quantitative way.
3.1.2.1 Descriptive statistics and interviews
The outcomes of the innovation cases were measured through survey items related to the content of the innovation, the quality of the process and the institutional quality. The average score and the standard

PSI-CO work package 3: cross-case analysis
34
deviation were calculated for every case. The average score indicates the perceived outcomes of the actors, and the standard deviation is the average variation around this mean. It thus indicates the spread, or the difference in answers, among actors within one network. A high standard deviation indicates low consensus of actors about the outcomes. Next, these outcomes are compared to the interview data. All actors in the network who filled out the survey were also asked to participate in an interview about the outcomes of the network. The interview transcripts were coded in accordance with the characteristics of substantive innovative outcomes, as well as the process and institutional quality. This way, the survey and interview data could be compared to each other, making possible the drawing of conclusions both within cases and between cases.
3.1.2.2 Social network analysis
The network characteristics were mapped by asking the respondents so-called ‘social network’-analysis questions. We performed a social network analysis to determine the interactions in the cases. All actors in the study were asked to evaluate their interactions with the other actors in order to determine the interactions in the innovative cases. We used three network questions in this report:
x 1. The network which can be constructed from the question: ‘Which actor did you give information after or outside official meetings?’ The ties of this network are confirmed by both of the involved actors. That is, a tie is only taken into account when an actor says he gave information to someone, and in turn, that other actor confirms that he received information from that actor.
x 2. The network which can be constructed from the question: ‘Which actors elaborated most frequently on your contributions during official meetings?’ We reversed the answers on this question so the network indicates upon whom the actor elaborated instead of from whom he received elaboration. This is done because it eliminates the bias that an actor can have towards the perception of his/her own elaboration. In this way, the receiving actor indicates the interactions, which increases the reliability.
x 3. The network which can be constructed from the question: During [process], how frequent did you have contacts (telephone, email, face-to-face), concerning [process] after and outside of meetings of [the arrangement] with the following participants?
The collected data in the cases provided the possibility to use a model to determine by which factors the interactions in the networks are driven (Snijders, 2017; Snijders, van de Bunt, and Steglich, 2010). The networks were studied with an Exponential Random Graph Model (ERGM). ERGMs are statistical models for explaining the network structure, permitting inferences about how network ties are patterned (Robins & Lusher,2013:9). The approach of this method is based on an actor-based model, which means that the social actors represented by the nodes play a crucial role in changing their ties with others (Ripley et. al, 2017). It is thus the ideal method for exploring the underlying mechanisms in collaborative innovation networks. The ERGMs were performed on two networks per case: 1) The ‘information giving outside meetings’ network 2) The ‘elaboration upon others’ ideas inside meetings’ network

PSI-CO work package 3: cross-case analysis
35
3.1.3 Analysis and results
3.1.3.1 Cross case network descriptives
Table 7 shows the density of the different networks in the cases and gives a description of the formation of cliques in the network. As mentioned in the theoretical framework, the density of the networks is a measure of the existing connections between the actors divided by the total amount of possible connections. A higher number represents a higher density. A density of 1 means that everyone in the networks is connected with everyone else and a density of 0 means that no actors are connected with each other. The value of the density thus indicates the chance of having a tie with someone.
A clique is a part of the network in which the actors are more closely and intensely tied to one another than they are to other members of the network. These cliques can be found in every network. What we describe here are the main observations in the cases studied. The study of cliques enables to know, for example, whether certain actors can be identified that are really central within the network and/or whether there are (groups of) actors that are totally isolated. Since the networks are relatively small, we looked for cliques which included a minimum of three actors.
Case Information giving outside meetings12
Elaboration upon others’ ideas inside meetings13
Contact frequency outside meetings14
Cliques
Carelab 0.209 0.173 0.163 Coordinators play a central role and can be found together in almost every clique, indicating that they are very central in the network
Radicalization 0.622 0.333 0.489 The cliques are different in each network. The representative of one of the organizations is very well-connected in the info giving network (together with the coordinator and another representative in all cliques), but is an isolated actor in the ‘elaboration upon others’ network.
Connecting Healthcare
0.651 0.356 0.348 It depends on the type of network in which actors interact. In the ‘information-giving’ network a large overlap exists between cliques, indicating no real isolated actors. Coordinators tend to stick to each other; they are most often in the same cliques.
Invasive species 0.355 0.382 0.495 The coordinator is present in all cliques indicating a strong, central role in the network. With whom the coordination generally forms a clique depends on the network. No
12 Respondents were asked to answer the following questions: “Could you please indicate to whom did you gave information to and from whom you received information after and outside formal meetings ? Information includes reports, statistics, advices, and remarks. This information can be both verbal as written.” Respondents could indicate for every actor if they gave and/or received information from the other actors in the network outside or after formal meetings. A relation was only considered when the tie was confirmed on both sides. For example: if A says he gave information to B, we only take that into account if B confirms he RECEIVED information from A etc. 13 Respondents were asked to answer the following question: Which participants [in the process] most frequently elaborated during the meetings of [the arrangement] on the information and ideas you shared? List up to maximal 5 (or 7 for larger networks) participants. The ties were then reversed, so the network was directed from the perspective of the actor that elaborated. 14 Respondents were asked to answer the following question: 13.During [process], how frequent did you have contacts (telephone, email, face-to-face), concerning [process] after and outside of meetings of [the arrangement] with the following participants?. The answer options were: daily, weekly, monthly, several times a year, yearly, and never. If a respondent answered that he or she had daily, weekly or monthly contact with someone it was considered a tie in the ‘contact frequency’ network. If the frequency was several times a year, every year or never it was not considered a tie.

PSI-CO work package 3: cross-case analysis
36
Case Information giving outside meetings12
Elaboration upon others’ ideas inside meetings13
Contact frequency outside meetings14
Cliques
obvious isolated actors, since this is different for every network in this case.
City on scheme 0.360 - 0.295 Strong clique forming between the coordinators, which form a tight group. Local actors are isolated.
Sustainability program
0.151 0.242 - In these networks, four actors can be seen as the main actors in the networks. They tend to have a lot of cliques in common. Remarkably, the coordinator in the sustainability program case is quite isolated.
NISP - 0.375 0.282 The coordinators form a clear clique in this case. They are most frequently in a clique together indicating that they tend to work together.
Table 7. Network characteristics
Network densities
The networks15 which have a relatively low density are the networks where the members have a voluntary approach to the innovation process and where actors are to a lesser extent dependent on each other. Networks that are mainly ‘thinking exercises’ and which did not result in implementation are the networks where we find low densities. For example, Carelab did not have any activities which implicated subsequent action by actors and which required the involvement of everyone. This case is characterized by a ‘loose’ cooperation in which everyone could join, but the involvement of specific actors was not crucial for the realization of the innovation. Interesting to see is that low densities often occur in cases that are characterized by formally created subgroups (not to be confused with the cliques, which are informal). These are networks where either one or a few people have the lead, such as Carelab, or where the network is divided into different subgroups by the metagovernor, such as the Invasive Species case.
Cliques
The way in which cliques are formed is not that surprising. It is clearly visible that metagovernor(s) are involved in most of the cliques in cases where the metagovernor(s) had an active hands-on role. It can be concluded that the network tends to centralize around the coordinators in those networks. For instance, the metagovernor of the Invasive Species case had a very hands-on approach, which becomes visible into the amount of cliques in which she is present. The metagovernor is present in most of the cliques, indicating contact with most actors. The metagovernane applied in the Sustainability program case, in contrast, had a much less hands-on character. We see that he is isolated in the networks and thus not so much involved in the interactions with the other actors.
15 Not all cases were examined because it is crucial for these analyses to have the answers from all actors in the network. The cases which were not analysed had a response rate which was considered to low or did not have all actors coming together at the same time in general meetings.
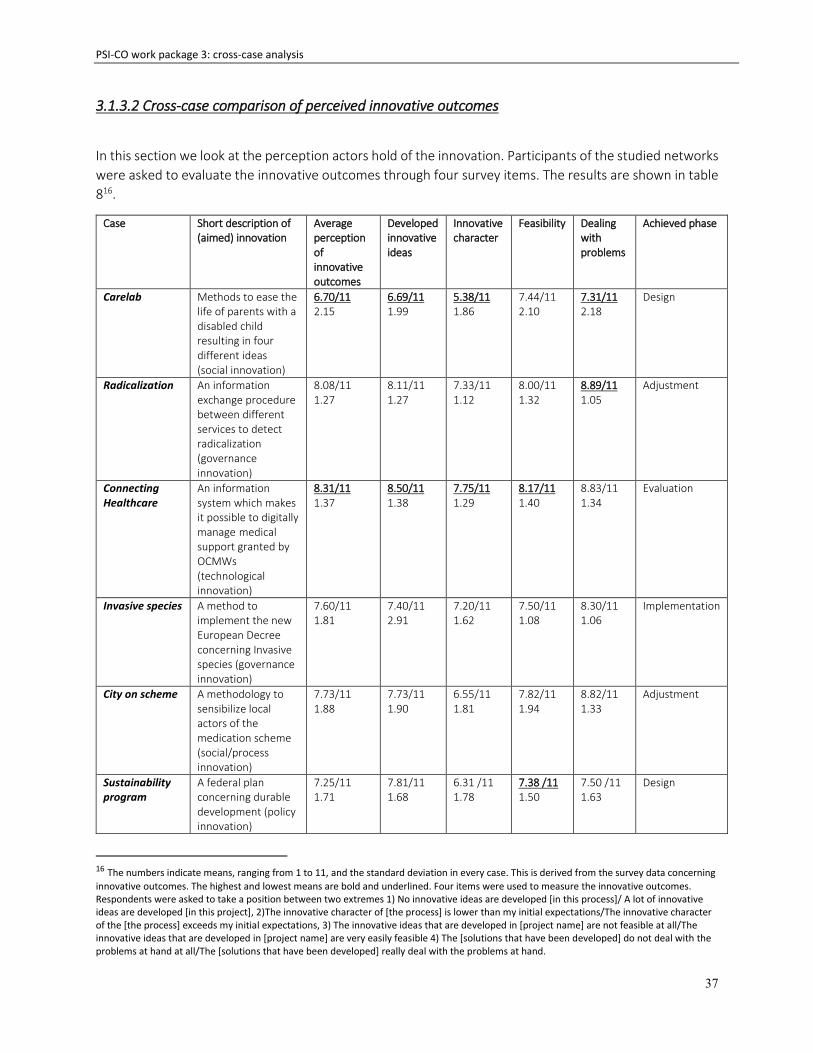
PSI-CO work package 3: cross-case analysis
37
3.1.3.2 Cross-case comparison of perceived innovative outcomes
In this section we look at the perception actors hold of the innovation. Participants of the studied networks were asked to evaluate the innovative outcomes through four survey items. The results are shown in table 816.
Case Short description of (aimed) innovation
Average perception of innovative outcomes
Developed innovative ideas
Innovative character
Feasibility Dealing with problems
Achieved phase
Carelab Methods to ease the life of parents with a disabled child resulting in four different ideas (social innovation)
6.70/11 2.15
6.69/11 1.99
5.38/11 1.86
7.44/11 2.10
7.31/11 2.18
Design
Radicalization An information exchange procedure between different services to detect radicalization (governance innovation)
8.08/11 1.27
8.11/11 1.27
7.33/11 1.12
8.00/11 1.32
8.89/11 1.05
Adjustment
Connecting Healthcare
An information system which makes it possible to digitally manage medical support granted by OCMWs (technological innovation)
8.31/11 1.37
8.50/11 1.38
7.75/11 1.29
8.17/11 1.40
8.83/11 1.34
Evaluation
Invasive species A method to implement the new European Decree concerning Invasive species (governance innovation)
7.60/11 1.81
7.40/11 2.91
7.20/11 1.62
7.50/11 1.08
8.30/11 1.06
Implementation
City on scheme A methodology to sensibilize local actors of the medication scheme (social/process innovation)
7.73/11 1.88
7.73/11 1.90
6.55/11 1.81
7.82/11 1.94
8.82/11 1.33
Adjustment
Sustainability program
A federal plan concerning durable development (policy innovation)
7.25/11 1.71
7.81/11 1.68
6.31 /11 1.78
7.38 /11 1.50
7.50 /11 1.63
Design
16 The numbers indicate means, ranging from 1 to 11, and the standard deviation in every case. This is derived from the survey data concerning innovative outcomes. The highest and lowest means are bold and underlined. Four items were used to measure the innovative outcomes. Respondents were asked to take a position between two extremes 1) No innovative ideas are developed [in this process]/ A lot of innovative ideas are developed [in this project], 2)The innovative character of [the process] is lower than my initial expectations/The innovative character of the [the process] exceeds my initial expectations, 3) The innovative ideas that are developed in [project name] are not feasible at all/The innovative ideas that are developed in [project name] are very easily feasible 4) The [solutions that have been developed] do not deal with the problems at hand at all/The [solutions that have been developed] really deal with the problems at hand.

PSI-CO work package 3: cross-case analysis
38
Case Short description of (aimed) innovation
Average perception of innovative outcomes
Developed innovative ideas
Innovative character
Feasibility Dealing with problems
Achieved phase
Mothers in poverty
A project to assist vulnerable women in daily life (social innovation)
7.69/11 2.46
7.78/11 3.31
7.22/11 1.92
7.67/11 1.87
8.11/11 2.80
Adjustment
Experts by experience
A project to place people who experienced poverty in organizations to learn from their perspective (social innovation)
7.47/11 1.38
7.56/11 1.67
7.56/11 1.42
7.44/11 1.67
7.33/11 0.87
Adjustment
NISP A national incident and security communication tool (technological innovation)
7.23/11 Stdev:2.04
7.21/11 2.15
6.57/11 2.44
7.64/11 1.98
7.50/1 1.56
Implementation
Table 8. Innovative outcomes
Table 8 shows that the Connecting Healthcare case is considered as most innovative, and the Carelab case as least innovative. The low standard deviations in the Connecting Healthcare case indicate that all actors generally agree with these high average scores. This is contrary to the Mothers in poverty case. Mothers in poverty has very high standard deviations (up to 3.31) indicating very different perceptions of actors about the innovative character.
The feasibility of the innovation is lowest for the Sustainability program case. This is not surprising, since the developed plan was not adopted by the government, so implementation was not feasible. Interesting is that the NISP project, which concerns a large multimillion ICT project, scores relatively low on innovation. This can be ascribed to the dissatisfaction among actors about the process. This is described in the next section of this report.
3.1.3.3 Cross-case comparison of perceived process quality, institutional quality, synergy and commitment
In this section we look at how respondents evaluate the process quality and the institutional quality of the networks, and at the perceived presence of two generative mechanisms, being synergy and commitment. The third generative mechanisms of innovation, learning, is discussed in section 3.3 where we analyze individual conditions of innovations, as this mechanism is more related to the individual actor than to the network as a whole.
Process quality
In this section, the process and the experience of the actors about this process are examined. This is done by looking at the process quality.

PSI-CO work package 3: cross-case analysis
39
The process quality refers to the evaluation by participants of the interactions between the different actors in the collaborative arrangement. Important to note it that process quality does not refer to the achieved results concerning the content, but to the participants’ evaluation of the interaction process of the network. Klijn et al (2010) mention the following characteristics of process quality of a network:
1. The extent to which the process has encountered stagnations or deadlocks (see Van Eeten 1999); 2. The management of the governance network, which refers to the level of satisfaction of the ways
in which actors are involved in the project (see Meier and O’Toole 2001); Æ see evaluation of metagovernance strategies
3. Conflict resolution, that is, the way in which conflicts have been averted and/or solved (Susskind and Cruikshank 1987); Æ see evaluation of metagovernance strategies
4. The productive use of differences in perspectives. This is the way in which differences in frame and perspective have been reconciled (see Koppenjan and Klijn 2004); Æ see evaluation of ‘exploring content’ strategy
5. Contact frequency, that is, the frequency of interactions between actors (see Meier and O’Toole 2001); Æ See network characteristics such as ‘density’ (page 36)
Since some overlap exists between these characteristics and the applied metagovernance strategies, we will discuss some characteristics in the section on ‘the applied metagovernance strategies’.
Table 9 shows how network participants rated different aspects of the process.17
Case Process quality
Support for process (process evaluation)
Encountered stagnations or deadlocks (process evaluation)
Typology of deadlocks
Carelab 7.67/11 Stdev:2.52
x In general no, expectations have not been met. The process was too much characterized by thinking, without actual implementation
x More and more actors left the project because the process remained thinking without actual implementation
Management cause
Radicalization 9.35/11 Stdev: 1.45
x Yes, actors experience the more formalized spread of information as being very positive
x The notification procedure is really seen as an improvement
x No real deadlocks that hindered the process
Not applicable
Connecting Healthcare
8.31/11 Stdev:2.10
x Yes, the result of the process are supported. OCMWs were a bit hesitant at the start, because the innovation affects their way of working
x No real deadlocks, main discussion was if organizations are ready in time to work with the innovation
x One actor perceived as a problem that the government changed during the project. It took the new minister a while to understand the project
Institutional cause
17The numbers refer to the mean value, ranging from 1-11, and the standard deviation in every case. This is derived from the survey data concerning process quality. Three items were used to measure the innovative outcomes. Respondents were asked to take a position between two extremes: 1) [The process]ran with a lot of blockades and stagnation due to differences of opinion and conflicts/ [The process ] ran smoothly without any blockades because no differences in opinions or conflicts occurred. 2)The [collaborative arrangement] treats none of the parties fairly. 3) The [collaborative arrangement] treats all parties fairly/The meetings [in the process] are not at all marked by mutual respect 4)The meetings in [the process] are strongly marked by mutual respect The evaluation of the ‘support for the results’ and ‘encountered stagnations or deadlocks’ are derived from the interview data.

PSI-CO work package 3: cross-case analysis
40
Case Process quality
Support for process (process evaluation)
Encountered stagnations or deadlocks (process evaluation)
Typology of deadlocks
Invasive species 8.57/11 Stdev:2.54
x Yes, in general all actors are very satisfied with the process and the end result
x No real deadlocks. Actors sometimes mention small delays because of different points of view, but those were not major problems for the process
Not applicable
City on scheme 8.24/11 Stdev: 1.94
x Yes, the project is regarded as a success by all actors.
x No real deadlocks caused by different points of view. Before the project some actors did not want to participate, so the coordinators choose a different city
Social cause
Sustainability program
8.75/11 Stdev:2.16
x Actors are really divided about the end product and the process. For some it met their expectations, for others it did not
x Yes, an agreement was reached, but the government did not adopt it, therefore it ended there
Institutional cause
Mothers in poverty
8.85/11 Stdev:1.57
x Yes, actors see the project as really successful and it exceeded their expectations, however the process did not continue afterwards
x Poor interaction between French and Dutch speaking actors.
x No real deadlocks concerning methods because local case managers had a large amount of freedom how to implement the project into their ‘own’ OCMW
x Some disagreements between the coordinators concerning task division. Some people had to do more than they expected
Institutional cause Management cause
Experts by experience
8.67/11 Stdev: 1.75
x Actors are divided about the results. It is a matter of perception, some people expected more of it, so for them it did not meet their expectations. Others are satisfied
x No real deadlocks in terms of blockages of the process that had to be solved in order to continue
Not applicable
NISP 8.26/11 Stdev: 2.21
x It depends, some do, but it is not yet fully implemented and some actors see the old system as being better. Some people are dissatisfied with the process
x Poor interaction between French and Dutch speaking actors.
x The deadline for implementation is experienced as too tight
Institutional cause External developments
Table 9. Process quality
In five out of the nine examined projects, there is a general consensus that the outcomes of the process can be supported. The projects which are process-wise considered to be least successful are Carelab, Connecting Healthcare and NISP. This is supported in both the interviews as in the survey items. Looking at the scores of the survey items we see that all projects score relatively high on process quality, however, these three projects are at the lower end of the scores or have a high standard deviation indicating a higher difference in perception among actors.
One project that stands out is Invasive species. The interviewed actors were all positive about the process, but the survey scores indicate that the actors in this project are most divided compared to the other projects about the process quality. It has the highest standard deviation (2.54), indicating the largest amount of spread around the average of 8.57. This can be explained by the "hands on" strategy of the

PSI-CO work package 3: cross-case analysis
41
metagovernor and a strong pressure for deadlines: the metagovernor often decided by himself when deadline approached, so the perceptions of the quality of the process differ to a large extent
In some cases deadlocks occurred. These can be ascribed to different causes but they mainly refer either to the way the network was managed or to institutional causes. Institutional causes relate to a lack of shared institutions, such as same perceptions, rules, or languages; or institutions that are incompatible, such as governments that are unable to work with each other. The cases in which this occurred often had to deal with the Dutch/French language barrier (Miriam, Experts by Experience, NISP) or with a higher political body that were perceived as causing problems (Connecting Healthcare, Sustainability program). The effects of these deadlocks range from small inconveniences to deadlocks that ended the process. An example of the latter is the Sustainability program case where the government did not adopt the developed plan.
Institutional quality Institutional characteristics of the network are the ‘solidified history’ expressed in rules, more or less stable patterns of interactions and relationships of trust among actors. In table 1018 we examine the interactions of the actors. Of course, these do not show the full picture of institutional quality, since they do not reflect the extent to which rules have been developed. These results can be found in part 3.2 of the report concerning the evaluation of the applied metagovernance strategies. These different aspects will be brought together in the conclusion of this report.
Case Institutional quality
Worked before with each other?
Established relations/trust
Carelab 7.94/11 Stdev: 1.67
x Most local actors knew each other before
x Local actors knew each already, but actors claim that the relations and the local network have been strengthened by the process. They know better how to reach each other.
Radicalization 9.56/11
Stdev: 1.25
x Most actors knew each other already
x Actors experience that it has become much easier to talk about specific cases because they come together with the same people. It is easier to follow up on actors because they see each other on a regular basis.
Connecting Healthcare 8.83/11 Stdev: 1.61
x Most actors did not know each other yet
x People were at first a bit scared to innovate, but trust increased over time. It can be noticed that the actors over time really formed a network with a same understanding of the matter.
x OCMWs were hesitant, because they did not want to change their way of working. OCMWs were the most difficult organizations to work with because the innovation would change their way of working
Invasive species 8.65/11 Stdev:2.11
x Most scientists knew each other from the previous working groups concerning mosquitoes.
x There is a clear distinction between the scientists and the lawyers in terms of interaction. Actors mostly only discussed with people from their own ‘group’. Trust relations were thus mainly established in the own group.
18 The numbers refer to the mean value, ranging from 1-11, and the standard deviation in every case. This is derived from the survey data concerning institutional quality. Two items were used to measure the innovative outcomes. Respondents were asked to take a position between two extremes: 1)No new durable relations have been developed between involved actors during [the process]/A lot of new durable relations have been developed between involved actors during [the process] 2)The extent to which participants trust each other during [the process] has decreased/The extent to which participants trust each other during [the process] has increased. The evaluation if the actors worked before already and the established relations/interaction and are derived from the interview data.

PSI-CO work package 3: cross-case analysis
42
Case Institutional quality
Worked before with each other?
Established relations/trust
x Interaction was based on the expertise of people and who they already knew. These two issues go hand-in-hand, because the people often already knew each because of their expertise.
City on scheme 8.14/11 Stdev:1.70
x Most local actors knew each other already and the main coordinators knew each other as well from another working group.
x Local actors and coordinators were connected through this project. However, local actors experience that when the project ended, no durable relationships were developed.
Sustainability program 7.84/11 Stdev:2.60
x Some people knew each other already because this was the third time to develop a plan like this already
x Some actors argue that in general the added value of the plan is better interdepartemental collaboration.
Mothers in poverty 8.56/11 Stdev:1.10
x The coordinators knew each other already, but the local case managers did not
x Although the actors got to know each other, most actors do need see each other anymore because the project ended. French and Dutch speaking actors did not interact well with each other.
Experts by experience 8.78/11 Stdev: 1.17
x Some actors of project team knew each other already. The ‘experts’ were new to the process.
x Actors claim that relations have gotten better overtime. The ‘experts’ form a clique with each other, but mention a gap between generations of ‘experts’
x Most prominent established relations are between the expert and its mentor.
NISP 7.46/11 Stdev:1.84
x Most actors did not know each other already
x People got to know each other, but interaction between French and Dutch speaking people was hard
Table 10. Institutional quality
The institutional quality is evaluated positively in all cases. Based on the interviews, the conclusion can be drawn that people perceived this improved their network and the collaboration after the project. The innovation is sometimes even a by-product of the process, since the innovation is in some cases not even implemented, but the network continues to exist after the innovation project ended.
The survey scores are less ambiguous. Projects where actors in the interviews were positive about the collaboration generally have a higher evaluation of the institutional quality (Radicalization, Connecting Healthcare, Invasive Species and Experts by experience).
The standard deviation of the survey scores show how much the evaluation differs among actors. Especially the Sustainability program and Invasive Species case show large differences. In general, these differences cannot be ascribed to the extent to which actors worked together before, because cases where actors previously worked together do not always score higher than networks that were completely new. A potential explanation could be related to the way the network was managed, the so-called metagovernance. The metagovernance is discussed in the next section of this report.
Synergy

PSI-CO work package 3: cross-case analysis
43
As the regression analysis shows, the perceived synergy is important in relation with the innovative outcomes. Synergy is “the power to combine the perspectives, resources19, and skills of a groups of people and organizations.” (Lasker et al, 2001). These differences among actors can complement each other and add to the generation of successful innovative outcomes. Table 10 20 shows the perceived synergy in the cases.
Case Perceived synergy Perceived synergy (interviews)
Carelab 7.29/11 Stdev: 1.69
All actors were convinced that something had to be done. Not much differences of perceptions were present because actors agreed to a large extent with the solutions. Differences of perception about the process was present and led to actors abandoning the process and therefore no inclusion of their input.
Radicalization 8.06/11 Stdev: 1.94
Actors from all necessary government services were included and they all had a strict task, so discussions were not always present, because everyone knew what was expected from them. Some actors were, based on the statute of their organization, mainly present to listen. However, actors argue that most relevant actors were present at the meetings.
Connecting Healthcare 8.08/11 Stdev: 1.59
It was tried to include different organizations into the process. Especially the inclusion of hospitals seemed hard, but actors reckon that in the end a good common ground was established in the project consisting of different insights due to the different actors.
Invasive species 8.62/11 Stdev: 1.33
Two groups of actors were present: the scientists and the lawyers. These two groups had their own expertise and this really helped to deepen the discussions. Also, because they worked in thematic subgroups which excluded actors without expertise. Decisions were made with actors that really knew what was going on.
City on scheme 7.91/11 Stdev:1.74
The decisions in this case were largely driven by the coordinator of the arrangement. Actors in the working group were able to give their opinion on the ideas coined by the coordinators. Local actors could provide feedback about the practical implications of the innovation in their daily life
Sustainability program 8.31/11 Stdev: 1.64
Actors with a lot of different backgrounds were placed together in this project which provided a lot of different opinions and expertise in the project.
Mothers in poverty 7.85/11 Stdev:2.43
Differences of opinion were present and it was mentioned that not everyone had the same basic knowledge. Actors were largely able to implement what they wanted, so in that sense it their input was taken into account.
Experts by experience 7.96/11 Stdev: 1.67
Most ‘experts’ claim that they had most contact with the other experts and with their mentor and that arrangements were made there. Differences of opinion could arise between the organizations that paid the experts and the coordinators of the project about the activities of the experts.
NISP 7.42/11 Stdev: 1.73
It is argued that about 90-95% of the project was already decided by the project leaders, thus not much input from the other actors was used. French and Dutch speaking actors in the same
19 We argues that the willingness to bring in financial resources in the process are a part of the ‘commitment’ in the process. Therefore, this is discussed in the ‘commitment’ section of the report. 20 The numbers refer to the mean value, ranging from 1-11, and the standard deviation in every case. This is derived from the survey data concerning institutional quality. Three items were used to measure the innovative outcomes. Respondents were asked to take a position between two extremes: 1) Differences of opinion have not deepened the substantive discussions/ Differences of opinion have strongly deepened the substantive discussions 2)My input was not actively used at all in [ the process]/My input was actively used in [the process] 3) It has not been attempted at all to include different opinions in the decision-making in [the process]/It has been attempted as much as possible to include different opinions in the decision-making in [the process] The observations about the perceived synergy in the third column is based on the interview data.

PSI-CO work package 3: cross-case analysis
44
Case Perceived synergy Perceived synergy (interviews)
arrangements hindered the discussions, because they could sometimes not understand each other.
Table 11. Perceived synergy
We see that synergy was evaluated as highest in cases where decisions were made collectively and in cases that were not that much driven by one or multiple coordinators. In some other cases, it was argued that it was already very clear what would happen in the project, because the coordinators already internally discussed this before taking it to the general meetings. Other actors could only agree or make (small) adjustments to the plans that were more or less already decided. Cases that worked with thematic subgroups score high on synergy. This might be due to placing the right type of actors together, deepening the discussions because the right actors were included. Actors with a different type of expertise were placed in different groups and thus discussions did not remain too shallow because people without expertise were included. Therefore, different opinions, but within the same expertise or theme, were able to strengthen each other. Next, in the interview data it was found that the inclusion of actors is mostly based on the 1) nature of the organization, 2) the expertise of the actors, or 3) the reach of the organization.
The inclusion of actors is linked to the nature of the organization since organizations just had to be present in the network, because of their legal objective.
The expertise of actors plays an important role because of the need to include their insights in the problems at hand. For example, in the Connecting Healthcare case it was necessary to search for hospitals and to include them, because of their expertise in the matter. In the Carelab case, parents got involved in order to bring in insights from the target audience of the innovation.
What also matters is the reach of the organization, as some actors are able to mobilize the target audience for the innovation. The involvement of the elderly organization, the local pharmacists, or the municipality was in City on scheme very important to be able to implement the innovation and to reach the target audience.
Commitment Commitment and joint ownership of the collaborative process and its product is necessary to turn ideas into implemented innovations. In this regard we looked at the financial support and the continuous support for the innovation. Also, a question included in every interview was what resources the actor brought to the process besides his or her point of view to the related issue. The main findings of the perceived commitment are presented in table 12.

PSI-CO work package 3: cross-case analysis
45
Case Commitment financial support21
Commitment continuous support22
Commitment (interviews)23
Carelab 4.88/11 Stdev:1.96
5.13/11 Stdev:2.70
Actors became increasingly less committed to the project. Actors did not continue with the project after the main coordinators left and were not willing to financially support the project, but this was also not asked from the actors, since they were mainly there to think along on a voluntary basis.
Radicalization 7.56/11 Stdev:1.81
9.89/11 Stdev:0.78
Actors were very committed to the process. The organizations were placed in the working group because they were indispensable for the process. It was their function to be there, so the innovation could count on the continuous support
Connecting Healthcare 6.08/11 Stdev:3.96
9.42/11 Stdev:1.88
A few actors were responsible for the project’s budget. Continuous support for the innovation was established overtime. The innovation would change the way of working of some organizations, so these organizations had to be convinced.
Invasive species 7.90/11 Stdev:1.97
9.00/11 Stdev:1.83
The budget was based on a distribution key which was determined on the political level. Actors had to work with the European decree, so they were basically required to support the process
City on scheme 7.82/11 Stdev:2.40
9.27/11 Stdev:1.42
There were two main actors that financed the project, hence the high standard deviation. Since the actors were kept really motivated, participated on a voluntary basis and the efforts they had to do were not so demanding they would continuously supported the projects.
Sustainability program 6.87/11 Stdev:2.47
7.75/11 Stdev:2.65
Actors were divided in this project about the reach of the to be developed program. Some argue that is was good in the way it was developed, others argue that is should a have reached much wider and thus they (and their organization) did not support a potential realization. Also, the government did not adopt the program
Mothers in poverty 3.78/11 Stdev:3.15
8.56/11 Stdev:3.05
Actors and their organizations were supporting the project, but the project was funded by one organization. Actors feel that they it is pity that the project stopped, but do not have the resources to continue without the funding.
Experts by experience 6.44/11 Stdev:1.88
9.78/11 Stdev:1.56
The actors supported the process, but sometimes there was a disagreement about the payment of the experts in relation to the coordination of the experts. Was the one responsible for the salary also the one who could decide on the tasks of the experts.
NISP 5.33/11 Stdev:3.28
9.08/11 Stdev:1.38
Some actors claim that the old system was better so they did not support it that much. Actors were not willing to give a financial contribution, because the budget was already arranged from higher levels. (cf. the high standard deviation)
Table 12. Commitment
A main feature of governance networks is that they are created because of interdependencies between actors. An effective outcome cannot be reached alone, because organizations lack the financial resources, 21 The numbers refer to the mean value, ranging from 1-11, and the standard deviation in every case. This is derived from the survey data concerning commitment. The respondent was asked to take a position between two extremes: From our organization, there is no willingness at all to give a financial contribution to the realization of [the innovation]/From our organization, there is a very large willingness to contribute a financial contribution to the realization of [the innovation] 22 From our organization, the continuous support for the realization of [the innovation]cannot be expected/From our organization, a large continuous support for the realization of [the innovation]can be expected. 23 Based on the interview data

PSI-CO work package 3: cross-case analysis
46
expertise, communication platforms, et cetera. Looking at the studied innovation projects we see that major dependencies to implement the innovation are only present in a few cases. With respect to financial means as one kind of resources, the majority of the innovative projects were started by the organization(s) that also provided the budget. Therefore, it was not necessary to actively search for organizations to ensure the financial aspect of the innovation. A distribution key was made in projects where responsibility for finances was not held by one specific organization. These were projects where organizations were obliged to participate, because of the organizations’ legal mandate or objective. For example, a certain organization had to participate in the Invasive species case, because that is part of its mandate and objective; hence, the organization had to make a financial contribution which was decided at the political level. We did not find cases in which coordinators actively had to look for sponsors. In general, financial means were made available by the coordinator in the projects which had a highly voluntary character for the participants, such as Carelab. Actors volunteered in the project and thus did not have to make a financial contribution and were not willing to. Also, cases in which one (or a few organizations) were responsible for the budget have high standard deviations. This can be explained because some actors were very willing to provide financial resources, while others did not because it was not their responsibility.
The financial input of organizations was often very clear in projects where organizations were obliged to participate because of formal guidelines or their mandate. Thus, financial issues were actually never a point of discussion in the networks.
The cases where no implementation of the innovative ideas occurred are characterized by a lack of support to turn the ideas into actions. The Federal cabinet did not adopt the developed program in the Sustainability program case, and Carelab lacked actors that were willing to support the project after the coordinators left the project. Although these cases have a low score on financial commitment, they did not fail to achieve innovative outcomes because of a lack of financial support. The innovation was not implemented due to a lack of political support or due to a lack of commitment to lead the project on their own after the initial coordinators left the project.
3.1.3.4 Explaining observed network interactions
Exponential Random Graph Models (ERGMs) have been conducted to explain what drives interaction in the networks. Two ERGMs were run in every case that had sufficient social network data. This part searches for the underlying mechanisms of the interactions in the networks. We used two main networks for this:
1) The ‘information giving’ network 2) The ‘elaboration upon others’ ideas’ network
Reciprocity in the simple ERGM models
We examined the reciprocal connections in the ‘information giving’ and ‘elaboration upon others’ ideas’ networks. This means given an i -> j tie, what is the change of a j -> i tie? ( e.g. “I give information to you, because you give information to me”). Table 13 shows the results of these analyses.

PSI-CO work package 3: cross-case analysis
47
Case Information giving outside meetings Elaboration upon others’ ideas inside meetings
Carelab 0.592 compared to 0.107 0.416 compared to 0.123
Radicalization No significant result No significant result
Connecting Healthcare 0.860 compared to 0.261 0.554 compared to 0.247
Invasive species 0.833 compared to 0.201 0.715 compared to 0.176
City on scheme 0.571 compared to 0.240 -
Sustainability program 0.653 compared to 0.062 0.487 compared to 0.164
Mothers in poverty - 0.664 compared to 0.202
Table 13. Reciprocity
It is interesting to see is that in almost all networks reciprocity has a clear effect when reciprocity is the only variable included in the model. The table above can be interpreted as follows. The chance of tie between actors in the first model with respect to information giving outside meetings, in the case of Carelab, is 0.107 (=10.7%). When the tie is present then the chance that it is reciprocal is 0.592 (=59.2%). Reciprocity has the largest effect in the Sustainability program network in terms of information giving outside meetings. The chance of the tie being reciprocal is more than 10 times larger than the baseline probability of 0.615 percent. This means that the chance that an actor gives information to another actor is ten times more likely when he receives information from this actor. Thus, giving information to someone outside meetings and elaboration upon someone’s ideas inside meetings is very much influenced by this also happening in return. In other words, I give information to you, because you give information to me; and, I elaborate upon your ideas inside the meetings, because you elaborate on my ideas inside the meetings.
In table 14 we expand the models with extra variables which refer to features of the actors in terms of individual features, and features of their organization. These new variables are nodal covariates which are included next to ‘reciprocity’.
Information giving outside formal meetings
Odds ratio
Elaboration upon others’ ideas inside meetings
Odds ratio
Reciprocity Carelab 4.526007 Connecting Healthcare
7.756025
Connecting Healthcare 7.611117 Sustainability program
2.93721
Sustainability program 19.49543
Invasive species 2.812321
Expertise Invasive species 3.134094 Invasive species 2.314075
Invasive species 1.924527 Invasive species 1.763252

PSI-CO work package 3: cross-case analysis
48
Information giving outside formal meetings
Odds ratio
Elaboration upon others’ ideas inside meetings
Odds ratio
Control by higher levels organization
Sustainability program
1.187832
Priority of higher levels organization
Connecting Healthcare
2.098032 Connecting Healthcare
1.537319
Carelab 1.265281
Invasive species (negative)
0.5666191
Sustainability program
1.292618
Control minister
Priority minister Invasive species 1.385194
Liberty Carelab 1.277251 Carelab 1.241726
Connecting Healthcare 2.407021 Invasive species (negative)
0.3982203
Sustainability program 1.260515
Commitment own organization
Sustainability program 1.300124 Sustainability program
1.199086
Invasive species 1.973049
Coordinating function
Carelab 6.886824 Carelab 6.491697
Invasive species 70388.14 Invasive species 11973.26
Connecting Healthcare
5.068881
Sustainability program
2.180665
Table 14. Nodal covariates
Reciprocity in the more complex ERGM models
Reciprocity becomes a somewhat less common explanatory variable when other variables are added to the model. However, it is still one of the most important variables in the model; explaining interactions in four out of five cases. Reciprocity is especially important in the Sustainability program case in the ‘information

PSI-CO work package 3: cross-case analysis
49
giving outside meetings’ network. Actors are more than 19 times more likely to give information to someone outside meetings if they received information from that actor.
Expertise Expertise is an individual-level variable and is measured by the question how long the actor already deals with the issue professionally24. This variable only has an effect in the invasive species case, where it shows an effect on both information giving outside meetings and on the elaboration upon others’ ideas, but interesting to see is that the log odds are quite high for this case compared to the other significant results for ‘Invasive species’. The higher the expertise of the actors, the more likely he or she will give information outside meetings or elaborate upon others’ ideas. This finding is confirmed in the interviews, since the actors claim that interaction was based on the expertise of people and who they already knew. As an actor said to emphasize the importance of expertise in this case: “Some people were leaders in the field so their words were considered as being a kind of sacred.”
Control by the higher levels of the organization Control exercised by the higher levels of the home organization was measured by asking the actors to what extent they were controlled by the higher levels in their organization regarding their activities and positions in the innovation process2526. This variable explains interaction in two cases: Invasive species and Sustainability program. In case of a higher control by the higher levels of the home organization, actors are more likely to give information outside the formal meetings in the invasive species case, while they are more eager to ‘elaboration upon others’ ideas inside meetings’ in the Invasive species and Sustainability program case. Please note that in section 2.4 the analysis of the survey data learned us that the perceived extent to which the higher levels in the respondents’ home organization exert control on his/her activities positively influences the perception of the respondent about the innovation in the network. Priority of the higher levels of the organization The priority of the higher levels of the organization was measured by asking the actors to what extent the project was a top priority for the higher levels in their organization27. The priority of the higher levels of the actors’ organization is especially important for the eagerness of these actors to elaborate upon others’ ideas in the meetings. It has an effect in four cases. Interestingly, due to the priority of the higher levels of their organization giving to the project, actors in the Connecting Healthcare, Carelab and Sustainability program case are more eager to elaborate upon each other’s’ ideas inside meetings, but this is the opposite for the Invasive Species case. In the latter case the priority given by higher levels of the actors’ organization, induces actors to elaborate less upon others’ ideas inside meetings. This negative finding is not so easy to interpret. Overall, priority given by the higher levels of the actors’ organizations has a stimulating effect. This resonates with the finding reported in section 2.4 based on the analysis of the survey data that the perceived extent to which the project is a priority for the higher levels of the respondent’s home organization positively influences the perception of the respondent about the innovation in the network. 24 For how many years have you been dealing with the following policy issue(s) in your working life? 25 Respondents were asked to take a position between two extremes. This scale ranged from 1-11 26 The higher levels in my organization exerted no control at all on my activities and positioning in [the process]/The higher levels in my organization exerted a lot of control on my activities and positioning in [the process.] 27 The establishment of …. [project] was no priority at all for the higher levels in my organization/The establishment of [project] was a top priority for the higher levels in my organization

PSI-CO work package 3: cross-case analysis
50
Control by the minister The control of minister was measured by asking the actors to what extent they were controlled by their minister or his/her cabinet in terms of their activities and positioning in the network28. This variable shows no significant effect in none of the ERGM models. This variable was not included in the Carelab networks, because this was a local/regional case with limited involvement of a minister. Priority of the minister The priority of the minister was measured by asking the actors to what extent the project was a top priority for the minister or his/her cabinet29. This variable was again not included in the Carelab networks, because this was a local/regional case with limited involvement of a minister. This variable only helps to explain why people elaborated on each other’s’ ideas in the Invasive Species case. It seems that the role of the minister is not that important for interactions in the collaborative innovation cases that we have studied.
Liberty (freedom to act) Liberty is measured by asking to what extent the actors had the freedom to act how they wanted during the interactions with the other participants30. The ERGM analyses show that liberty is an important driver for interaction in the Carelab case (significant in both the information giving network and the elaboration upon others’ ideas). Especially information giving outside the official meetings is driven by the liberty of actors to act as they want. It explains interaction in three of the five cases that were studied here. The Connecting Healthcare case scores the highest with actors being 2.41 times more likely to give information outside meetings when their liberty increases with one point. Interesting to see is that actors in the Invasive species case are less likely to elaboration on others’ idea when their liberty increases.
Commitment of the own organization The commitment of the organization was measured by asking to what extent the project could count on the continuous support of its own organization of the actor31. This has a positive influence in the Sustainability program case in both networks. It has a positive influence on the elaboration on each other’s ideas during meetings in the Invasive species case.
Coordinating function We also found the role of the coordinator (or: metagovernor) in four cases to be important, especially concerning elaboration upon others’ ideas in the meetings.
Interesting to see is that metagovernors were far more likely to give information outside meetings in the cases that were characterized by a very hands-on approach of the metagovernor; a metagoverner who was
28 My responsible minister (or cabinet) exerted no control at all on my activities and positioning in [the process]/My responsible minister (or cabinet) exerted a lot of control on my activities and position in [the process] 29 The establishment of the [project] was no priority at all for my minister (or cabinet)/The establishment of the [project] was a top priority for my minister (or cabinet) 30 I had no freedom at all to act like I wanted during the interactions with the other participants [in the process]/I had complete freedom to act like I wanted during the interactions with the other participants in [the process] 31 From our organization, the continuous support for the realization of [the innovation]cannot be expected/ From our organization, a large continuous support for the realization of [the innovation]can be expected.

PSI-CO work package 3: cross-case analysis
51
very visible to all actors in the network. In these two cases, Carelab and Invasive species, was a significant effect in both networks found32.
32 Please note that the analysis in section 2.4 showed that respondents with a coordinating role were significantly more positive in their assessment of perceived innovation.

PSI-CO work package 3: cross-case analysis
52
3.1.4. Discussion The previous part aimed to seek an answer to the first research question:
RQ 1. (a) How do collaborative governance arrangements result in innovations with respect to policies and services (innovative capacity of collaborative governance arrangements)?
(b) How do these collaborative governance strategies influence and reinforce each other in order to create such innovations (dynamics and interaction of collaborative governance arrangements)?
Looking at the way collaborative governance arrangements result in innovations, it must be concluded that the processes are very case-specific and no single best way of achieving innovations exists. However, some general lessons can be learned even though the processes are highly context-dependent.
The cross-case network descriptives were explored at the start of this section. The density of the networks range from 0.151 to 0.622. Densities were especially high in cases that were formalized; that is, cases where the involvement of actors was seen as necessary and where actors/organizations came together because they were required because of their legal mandate. The way different cliques were present in the network shows that the networks in which a strong hands-on approach was applied tend to centralize towards the metagovernor. The metagovernor is often involved in the different cliques in the networks indicating that the metagovernor has a central role in the networks and thus in the creation of the innovation.
The evaluation of innovative outcomes is linked to the stage which the innovation reached. Innovations that did not go beyond the ‘design’ phase tend to score low on the average. This is the case in Carelab and Sustainability program; two projects that ended and were not (successfully) implemented. It must be no surprise that these cases score low on innovative character, feasibility and whether they deal with the problems at hand. Innovations that score high on innovative outcomes are the cases that already reached the implementation phase (or beyond). The actors in these cases are now able to adjust their innovative output in order to fine-tune the innovation, and to really make it deal with the problems at hand or to make the innovation more feasible for achieving the intended purposes. It seems that higher evaluated innovations are characterized by quick piloting and/or implementation of the innovation. Dissatisfaction grows among the actors when the pace of the process is too slow, because actors experience the whole process as too time-consuming in relation to the outcomes.
The regression analyses as reported in section 2.4 show that synergy is a strong indicator for the perception of innovative outcomes. That is, if actors feel that different perceptions and ideas are brought together, that something is done with their input and that discussions are deepened by the different perspectives, then this results in a more positive evaluation of the innovative outcomes. We found that the inclusion of actors is mostly based on the 1) nature of the organization, 2) the expertise of the actors or 3) the reach of the organization. It is important to have a diverse group of actors that bring different perspectives to the table. It is therefore also very important to include actors who are different from the ones already in the network, but who are able to deepen the discussions.
In some cases deadlocks – events that problematize the process - occurred and hindered the process. A common deadlock was the poor interaction between Dutch and French speaking actors. However, dividing the network in subgroups might lead to a loss of differences in perspectives which is disadvantageous for the creation of synergy. Deadlocks happens also when actors in a network perceive that was is expected from them remains unclear. Some actors argue that they had to do more than they initially thought which

PSI-CO work package 3: cross-case analysis
53
caused dissatisfaction about the process quality. Often, the deadlocks do not lead to a lower average in terms of perceived process quality, but we see that cases characterized by the deadlocks have a higher standard deviation with respect to the process quality. Hence, there is less consensus on the process quality is present. This might indicate that the effect of deadlocks were perceived differently by the actors in the case. Some might see the deadlocks as very harmful for the process, for example because they were involved in the deadlocks, but other, less affected actors might not perceive the deadlocks as being particularly harmful.
The innovative cases have in general a high score on the institutional quality, indicating that relations between actors in the networks have been improved. Projects where actors were positive about the collaboration in the interviews generally have a higher evaluation of the institutional quality (Radizalization, Connecting Healthcare, Invasive Species and Experts by experience). Some actors mention that relationships were developed that were also useful outside the project. People got to know each other through the project, and this is also beneficial for their own personal network or for other initiatives. They can reach out to people more easily even if this is not related to the project.
The ERGM analyses show that the two main determinants that explain interaction in the networks are reciprocity and the role of the metagovernor. So, an actor who gives information to another actor or who builds upon the ideas of another actor, will likely experience that the other actors perform the same action toward him. The metagovernor seems to be a crucial actor for the interaction in the collaborative governance arrangement. Being a metagovernor is positively related to the perception of the innovative outcomes (see section 4.2), and metagovernors are also more likely to interact with other actors. Also, the extent to which the project is perceived as being a priority for the higher levels of an actor’s home organization is important to determine whether that actor is likely to elaborate upon the ideas of another actor. At the same time, the extent to which the actor perceives to have the freedom or liberty to act as he/she wants in the interactions with other actors in the network also explains the extent to which these actors will give information and elaborate upon others’ ideas in several networks. The control and priority of the minister towards the project does, however, not seem to be that important for the interactions in the networks. This is supported by the regression analyses (see 4.2) that find that the role of the minister has no effect on the innovative outcomes. These findings seem to imply that actors are stimulated by the priority given by the higher levels of their organization, but simultaneously need sufficient freedom to act in their interactions in the network as they see fit. It could be that actors value engagement and support by the higher levels of their organization, but it should not be too restrictive in terms of how they can act and position themselves in the networks. However, this seems to be nuanced by the invasive species case, where the control by higher levels in the actors’ organization regarding their activities and positions in the innovation process has a positive effect on the actors’ interactions, whereas the priority given by higher levels and the liberty to act as perceived by actors have a negative effect on the extent to which actors engage in interactions.

PSI-CO work package 3: cross-case analysis
54
3.2. Metagovernance as condition for collaborative innovation
This section deals with the second research question of the project:
RQ 2. How do governments create, stimulate and sustain such innovation-enhancing collaborative governance arrangements (meta-governance as condition for collaborative innovation)?
The analysis of the survey data in section 2.4 shows that the perceived extent of applied metagovernance strategies positively affects the perceived level of innovation, also when controlling for other variables and network dummies. In this section we further unravel the relevance of this variable by delving into the interview data, next to the survey data. We focus on what happens inside the collaborative arrangements and we only consider the metagovernance strategies that were applied by the coordinator and other actors active in the network. However, our analysis of metagovernance does not cover to what extent policy makers or politicians outside the network created the right conditions for the network (by framing and designing strategies).
3.2.1 Theoretical framework It is widely recognized in the literature that a satisfactory outcome in networks is often impossible without network management (Gage and Mandell, 1990; Agranoff and McGuire, 2001; Kickert et al, 1997).
There are different ways to manage the network and to get successful outcomes (e.g. Agranoff, 2007; Huxham and Vangen, 2005; Koppenjan and Klijn, 2010; Stevens and Verhoest, 2016). This management is often referred to as ‘metagovernance’, defined as: “the endeavour to regulate self-steering policy networks (or collaborative networks) by shaping the conditions under which they operate.” (Sørensen and Torfing, 2005: 202).
Metagovernance may concern the formal governance of the network, but may also concern the strategies which are more focused towards the content of the collaborative governance arrangement. Examples of the first type include shared governance (multiple actors managing the network), lead governance (one actor managing the network) and network administrative governance (one actor managing the network and who is specially created for that task) (Provan et al.,2007). Examples of the second type are exploring content or connecting actors with each other (Klijn et al., 2010). The range of possible metagovernance strategies is extensive: so many networks, so many proposed strategies. For example, Larsen (2014) argues that the lead actor in these networks should be embedded in the public sector when dealing with a network that aims to come to public sector innovation. Several strategies are described in the literature that can be applied in order to take away some of the unwanted practices in networks and that can stimulate innovation (Agranoff,2007; Klijn et al., 2010).
Different metagovernance strategies to improve the innovation process were used in the studied cases. These strategies range from methodologies which are specifically developed to improve these kinds of processes, to more pragmatic measures to deal with problems that occur along the way. The metagovernance strategies were divided into four different categories, as distinguished by Koppenjan and Klijn (2010): introducing process rules, arranging structure, exploring content and connecting strategies.
x Arranging structures for interaction, consultation and deliberation o Creating new ad hoc organizational arrangements (boards, project organizations, etc.).

PSI-CO work package 3: cross-case analysis
55
x Introducing process rules
o Rules for entrance into or exit from the process, conflict regulating rules, rules that specify the interests of actors or veto possibilities, rules that inform actors about the availability of information about decision-making moments, etc.
x Connecting strategies
o Selective (de)activation of actors, resource mobilizing, initiating new series of interactions, coalition building, mediation, appointment of process managers, removing obstacles to co-operation, creating incentives for co-operation. Actors in the network need to be connected in order to prevent ‘structural holes’ (Sørensen, et. al, 2012). These emerge when actors are not connected with each other or if there is a lack of homophily in the network resulting in people perceiving other actors to be too different from themselves.
x Exploring content
o Searching for goal congruency, creating variation in solutions, influencing (and explicating) perceptions, managing and collecting information and research, creating variation through creative competition
3.2.2 Methodology Alike the outcomes of the network, the metagovernance strategies were assessed in a quantitative and a qualitative way. The evaluation of the metagovernance strategies were measured through survey items that measured two of the four metagovernance strategies, being ‘connecting’ and ‘exploring content’. This provided an average evaluation score reflecting the extent to which the metagovernance strategies were applied. The average score and the standard deviation were calculated for every case. The average score indicates the perceived application of metagovernance strategies, and the standard deviation is the average variation around this mean. It thus indicates the spread, or the difference in answers, among actors. A higher standard deviation indicates less consensus of actors about the metagovernance strategies. Next, these means and standard deviations are set against the interview data. Every actor in the network that filled out the survey was also interviewed about the metagovernance strategies applied in the network. The interview transcripts were coded in accordance with the characteristics of the four metagovernance strategies.
3.2.3 Analysis and results - Metagovernance strategies
Arranging
Arranging strategies includes strategies to organize the interactions in governance networks in temporary organizational structures. This includes the creation of new ad hoc organizational arrangements such as boards or project organizations. Koppenjan and Klijn (2010) look at the composition of these organizational

PSI-CO work package 3: cross-case analysis
56
arrangements to determine to what extent the ‘arranging’ strategy is applied. They look at three different groups: - Groups of public stakeholders are involved through platforms for negotiation and debate. - Groups of private companies are involved through platforms for negotiation and debate. - Civil-society groups are involved through platforms for negotiation and debate. In the analysis of the arranging strategies, we looked at the way the network was formed, the arrangements, such as follow-up committees or subgroups that were created during the process, and the composition of the network. Looking at arranging strategies, it can be noted that the innovation networks were created in different ways. In a few cases, the networks were totally new and created especially with the goal of reaching the innovative outcome. Other networks derive from a small core group that existed already, yet was enlarged to come to a solution for a predefined problem experienced in their daily practice. Lastly, some networks existed already and started to work together again. The networks contained different types of actors. In two cases only public stakeholders were involved, in all other cases there is a mix of, for example public, non-for-profit organizations, private organizations or interest groups involved. Only one case studied had the active involvement of citizens. The cases can also be classified in terms of the dominant governmental level to which the network is related. Three cases are strongly embedded in a local context (although not only with local actors), while two work exclusively on the federal level. The other cases have actors from different levels. Also, not all projects work in ‘just’ one network. An often applied strategy is dividing the network in thematic subgroups. This is done to make meetings more effective, since in that way one can ensure that only the ‘right’ actors are involved in specific discussions or activities. Furthermore, a follow-up committee is sometimes established in order to be able to consult the expertise of the actors who are involved in this committee or to let them take decisions in case of no consensus in the project.
Case Network creation Arrangements created during the project
Type of actors
Carelab From scratch. Network was created for this innovation. Local actors knew each other already, but were brought together for this project
No, but coordinators did have one-on one- conversations outside general meetings
- Multiple public stakeholders - One private actor - Multiple actors from civil society:
local healthcare organizations and parents
Radicalization Actors worked together already. Placed together in a working group to streamline communication
No - Only public stakeholders
Connecting Healthcare Created from scratch. Especially hard to find hospitals that wanted to join.
Thematic subgroups. Follow-up committee was established for validation of decisions
-Multiple public stakeholders -One private stakeholder (ICT company) -Multiple actors from civil society, e.g. hospitals
Invasive species Some actors (scientists) worked together in another working group
Thematic subgroups (scientists and lawyers) and one general meeting with everyone involved.
-Public stakeholders -Non-profit organizations
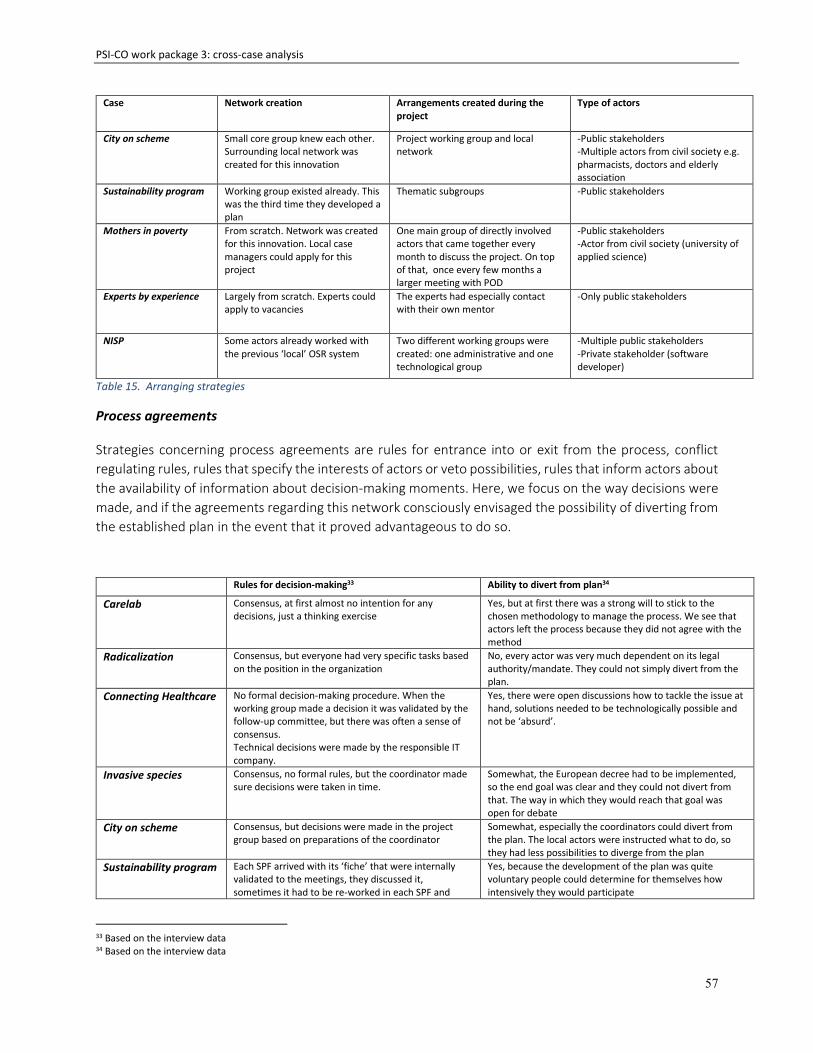
PSI-CO work package 3: cross-case analysis
57
Case Network creation Arrangements created during the project
Type of actors
City on scheme Small core group knew each other. Surrounding local network was created for this innovation
Project working group and local network
-Public stakeholders -Multiple actors from civil society e.g. pharmacists, doctors and elderly association
Sustainability program Working group existed already. This was the third time they developed a plan
Thematic subgroups -Public stakeholders
Mothers in poverty From scratch. Network was created for this innovation. Local case managers could apply for this project
One main group of directly involved actors that came together every month to discuss the project. On top of that, once every few months a larger meeting with POD
-Public stakeholders -Actor from civil society (university of applied science)
Experts by experience Largely from scratch. Experts could apply to vacancies
The experts had especially contact with their own mentor
-Only public stakeholders
NISP Some actors already worked with the previous ‘local’ OSR system
Two different working groups were created: one administrative and one technological group
-Multiple public stakeholders -Private stakeholder (software developer)
Table 15. Arranging strategies
Process agreements
Strategies concerning process agreements are rules for entrance into or exit from the process, conflict regulating rules, rules that specify the interests of actors or veto possibilities, rules that inform actors about the availability of information about decision-making moments. Here, we focus on the way decisions were made, and if the agreements regarding this network consciously envisaged the possibility of diverting from the established plan in the event that it proved advantageous to do so.
Rules for decision-making33 Ability to divert from plan34
Carelab Consensus, at first almost no intention for any decisions, just a thinking exercise
Yes, but at first there was a strong will to stick to the chosen methodology to manage the process. We see that actors left the process because they did not agree with the method
Radicalization Consensus, but everyone had very specific tasks based on the position in the organization
No, every actor was very much dependent on its legal authority/mandate. They could not simply divert from the plan.
Connecting Healthcare No formal decision-making procedure. When the working group made a decision it was validated by the follow-up committee, but there was often a sense of consensus. Technical decisions were made by the responsible IT company.
Yes, there were open discussions how to tackle the issue at hand, solutions needed to be technologically possible and not be ‘absurd’.
Invasive species Consensus, no formal rules, but the coordinator made sure decisions were taken in time.
Somewhat, the European decree had to be implemented, so the end goal was clear and they could not divert from that. The way in which they would reach that goal was open for debate
City on scheme Consensus, but decisions were made in the project group based on preparations of the coordinator
Somewhat, especially the coordinators could divert from the plan. The local actors were instructed what to do, so they had less possibilities to diverge from the plan
Sustainability program Each SPF arrived with its ‘fiche’ that were internally validated to the meetings, they discussed it, sometimes it had to be re-worked in each SPF and
Yes, because the development of the plan was quite voluntary people could determine for themselves how intensively they would participate
33 Based on the interview data 34 Based on the interview data

PSI-CO work package 3: cross-case analysis
58
Rules for decision-making33 Ability to divert from plan34
when the final version was approved by the DGs it was added to the plan.
Mothers in poverty In case of discussions local case managers just picked what they thought was necessary and used that. The involvement of those actors is more important than one common method
Yes, case managers could decide for themselves what to use in their own local OCMW based on what would work best.
Experts by experience The coordinator claims that nothing is imposed. Some ‘experts’ claim however that coordinators expect things from them while they are not paid by them
Not really mentioned in the interviews. ‘Experts’ did have a mentor with whom they could make individual arrangements
NISP Actors mention that the coordinator decided most things. From the technological aspects to the themes of the meetings.
Not really. Some actors mention that 90-95% was fixed already. However, they say that meetings had an ‘open’ atmosphere.
Table 16. Process rules
The studied cases are all characterized by having few formal rules. In all cases, most actors could not recall any specific measures that were taken to give clarity about the way the process was structured. In all cases the actors would say that decisions were based on consensus and not formal decision-making procedure such as agreements by the majority of vote was established. However, every case has a slightly different procedure as to how decisions were made even though every case claims to have a decision-making procedure based on consensus. In practice, this can range from simple consultation during meetings like in the case of City on scheme, to a much more formalized procedure to take decisions as is present in the Sustainability program case.
The goal of the innovation is an important aspect to see whether actors were able to diverge from the plan. Some cases were characterized by a single problem and the actors wanted to have an innovative solution to deal with the problem at hand. This allowed the actors to easily divert from the plan, especially given the fact that almost all projects were characterized by having few rules of which some had a highly voluntary character. Other projects, such Radicalization and Invasive Species had a specific task or objective, or ‘a point on the horizon’ which they had to meet. They could diverge from the plan during the process, but they were more limited because of the predefined outcomes they had to reach. They were not able to work towards an entirely different outcome, even if that would be more advantageous.
Connecting
Connecting strategies are aimed at bringing actors closer to each other. Examples are selective (de)activation of actors, resource mobilizing, initiating new series of interactions, coalition building, mediation, appointment of process managers, removing obstacles to co-operation, creating incentives for co-operation. The table on the next pages shows the main connecting strategies per case and how they are evaluated.
This strategy was measured both through survey items and through interview questions. The survey items to measure this strategy were:
x In case of deadlocks and problems [in this process], bringing together opposing interests has been attempted.
x In [this process] there has been attention for the (development in) relationships between the involved participants and organizations.
x All organizations are/have been actively involved in the decision-making, (collective decision-making) (Klijn et al., 2010).

PSI-CO work package 3: cross-case analysis
59
Case Average evaluation of connecting strategies
Avg + stdev
Bringing together opposing interest in case of deadlocks
Avg + stdev
Attention for relationships Avg + stdev
Collective decision-making
Carelab 7.48/11 7.50/11 1.67
x Metagovernors listened to the dissatisfaction about the pace of the project and made the project more tangible by including other actors and working out specific ideas
7.56/11 1.90
x The project improved the local network of healthcare providers.
x People left the project because it led to nothing Æ proposed solution by actors is making earlier decisions about direction
7.38/11 1.59
x Decisions were made in the general meetings. In those meetings it would ‘naturally’ become clear what the main points were and with what should be worked with
x Some actors say that in the next meetings they would start over again
Radicalization 9.22/11 9.00/11 1.58
x No real deadlocks. People know because of their position what is expected from them
9.00/11 1.58
x People needed to be in the working group because of their position. Every time they come together the same people are involved. Information flow is much more streamlined now
9.67/11 0.87
x Yes, but some organizations were only there to listen. Actors had very strict rules from their home-organization about what they could do
Connecting Healthcare
8.53/11 8.75/11 1.66
x In case of conflicting strategies issues were placed ‘on hold’ so the process could continue
x Snowballing based on actors they already knew to get others involved
8.42/11 1.62
x Actors speak very positive about the coordinators. They really included the right people (although maybe a bit too little OCMWs) and were really supportive. Thus, a smooth process.
x Metagovernors created milestones to see what works. After that, actors were more likely to participate. Thus, quick implementation
8.42/11 2.71
x Decisions were made based upon consensus. Only when a position taken by an actor was ‘absurd’, the decision had to be forced
x If consensus could not be reached in the working group, there was always the steering committee which could make decisions
Invasive species 8.77/11 9.00/11 1.76
x If consensus could not be reached, the discussion point would be parked to the next meeting
8.40/11 1.78
x Attention was paid to differences in language
8.90/11 1.91
x Because of the creation of the two subgroups it was possible for everyone to have their say about the topic they were experts on. The decisions in these subgroups were then taken to the larger meetings
City on scheme 7.73/11 8.09/11 1.70
x Not much deadlocks or opposing interests. Main deadlocks were technological ones. Prior to the project, some doctors did not want to
7.45/11 1.69
x Organization of large roundtable meetings
x Making use of local network and motivating them. Emphasizing that this is their
7.64/11 2.25
x The project was strongly led by one or two coordinators. Decisions were made in the arrangement with input

PSI-CO work package 3: cross-case analysis
60
Case Average evaluation of connecting strategies
Avg + stdev
Bringing together opposing interest in case of deadlocks
Avg + stdev
Attention for relationships Avg + stdev
Collective decision-making
participate so they choose a different pilot municipality.
project, not a project from the coordinators
x People feel that this project was really tangible.
x Quick implementation x Metagovernor created
milestones to determine what works.
from all actors, but the discussed issues were highly influenced by the coordinator.
Sustainability program
8.40/11 8.50/11 1.67
x In case of no consensus, placing the issue on hold
8.00/11 1.67
x People interacted because of shared themes. Therefore creation of thematic subgroups
x Roundtables with civil society
8.69/11 1.70
x Actors prepared their fiche with their home-organization. This was discussed in the general meeting. In case of no consensus it would be taken back to the home-organization
Mothers in poverty 8.67/11 8.89/11 1.45
x No real measures were taking in case of opposing interests. The coordinator mentioned that case managers could decide for themselves what they saw fit in their own city when that happened. This was more important than one general method for all cities
8.11/11 1.45
x Monthly intervisions to discuss the project. These intervisions were really helpful, but there was always a gap between French and Dutch speaking case managers Æ suggestion to separate the group in the future.
x The project was temporary. When it ended, the network was dissolved and no further measures for dissemination were undertaken
9.00/11 1.58
x Large amount of liberty for the involved people. Case manager were able to pick for themselves what they wanted to use, however some actors claim that some decisions were taken without prior consultation.
Experts by experience
8.71/11 8.78/11 0.97
x Pointing at the contract which is signed between the POD and the organization is often a way to manage differences in expectations
8.78/11 0.44
x Monthly meetings with the ‘experts’ are organized
x It is often mentioned that communication was insufficient. “experts’ did often not know if they would still have a job in two weeks
x ‘Experts’ had different superiors. This led to uncertainty what was expected
8.56/11 1.24
x Decisions were made by the coordinators. ‘Experts’ did not have much to say in the project

PSI-CO work package 3: cross-case analysis
61
Case Average evaluation of connecting strategies
Avg + stdev
Bringing together opposing interest in case of deadlocks
Avg + stdev
Attention for relationships Avg + stdev
Collective decision-making
NISP 7.69/11 7.83/11 1.59
x Not that much. Also considering the dissatisfaction about the process by the actors
7.33/11 1.97
x Measures were taken to improve interactions, such as translators, but in general communication between French and Dutch speaking persons was bad.
7.92/11 1.38
x No, it is generally said that decisions were made by the project leaders.
Table 17. Connecting strategies35
35 The numbers are the mean, ranging from 1-11, and the standard deviation in every case. This is derived from the survey data concerning connecting strategies. Three items were used to measure the connecting strategies. Respondents were asked to take a position between two extremes 1) In case of deadlocks and problems [in the process], bringing together opposing interests has not at all been attempted/In case of deadlocks and problems [in this process], bringing together opposing interests has been very much attempted 2) In [this process] there has been no attention at all for the (development in) relationships between the involved participants and organizations/ In [this process] there has been a lot of attention for the (development in) relationships between the involved participants and organizations 3) No organizations are/have been involved in taking decisions (collective decision-making) / All organizations are/have been actively involved in the decision-making, (collective decision-making). The text boxes next to the values are derived from the interview data.

PSI-CO work package 3: cross-case analysis
62
The average connecting strategies of the cases are all relatively highly evaluated, ranging from an average of 7.48 out of 11 to 9.22 out of 11. The evaluation of the connecting strategies can partially be ascribed to the occurrence of deadlocks in the networks. It can be noticed that the highest scores are in the projects without any significant blockades and with satisfied actors. The cases with the lowest scores are characterized by a problematic process with dissatisfactory outcomes. The average connecting scores are lowest in the Carelab and NISP case; cases with dissatisfied actors. However, a case that ran smoothly, like the City on scheme case is also in the lower end of the scores. This might be ascribed to the structure of the network. One coordinator was the driving force and the extent to which connecting between all actors occurred was limited (see for example the high standard deviation concerning collective decision-making indicating differences of opinion about the collective decision-making).
Different measures were taken to come to a process which was as smooth as possible. Milestones seem to be an important tool to keep actors motivated. What came forward in the interviews was that people got motivated by early success and that cases without implementation led to frustration, because nothing happened. Implementation gives the actors a feeling that they are going somewhere. We found that project can have two different dynamics: projects that a clear goal upfront or projects with just a desire to innovate without precisely knowing where to go. A goal-oriented project with a clear goal upfront (about what to achieve and how to do it) aims to bring actors together in order to practically get ‘things done’ to reach that end goal. A more goal-seeking project with no definite goal will engage actors to think along and to formulate the end goals. A project management approach (focused on deadlines etc.) is harder to realize when there is not yet a clear direction where to go to. Thus we see that projects which are still goal-seeking are more process or relational oriented. These goal-seeking projects have more attention for shared decision-making, while projects with a clear goal upfront have more attention for practical aspect, such as deadlines and ‘getting things done’. These projects often have less attention for shared decision-making, because the output of the process has often been decided already. Actors in these goal-oriented projects are more likely to be involved in the process just to make it possible to implement the innovation than to actively think along in the idea generation phase.
One of the main frustrations in the cases was the language barrier. Different ways were used to solve this. In some cases a translator was appointed, but this was not positively evaluated, because a discussion of twelve minutes was summarized in two minutes and this did not capture the entire discussion. Some actor mentioned talking in English as a solution. This might, however, also have some disadvantages. First, actors do not always speak English, which might for example be the case in a project with a lot of citizen-involvement. It is not desirable to have these meetings in the non-native language. Second, it is sometimes not even allowed by Belgian law to use English as working language. Finally, actors mentioned that a successful way to cope with this issue is to split the network in French and Dutch speaking actors. A disadvantage of this, however, would be that bringing different perspectives together then will be limited. Thus, it is very important that the metagoverner invests in reducing the language barrier without losing the different perspectives.

PSI-CO work package 3: cross-case analysis
63
Exploring content
Exploring content strategies consist of exploring different views of actors and possible new solutions as well as connecting the ideas of different actors. This includes: searching for goal congruency, creating variation in solutions, influencing (and explicating) perceptions, managing and collecting information and research, creating variation through creative competition. This strategy was measured both quantitatively and qualitatively. The items to measure this strategy were:
x There has been sufficient attention [in this project] for involving external organizations which can bring in new ideas.
x When gathering information and knowledge [in this project] there has been an emphasis on determining the joint information needs.
x All important actors necessary to deal with [the issue at hand] were included [in the process] (Klijn et al.,2010)

PSI-CO work package 3: cross-case analysis
64
Case Average evaluation of exploring content strategies
Avg + stdev Involving external organizations
Avg + stdev Emphasis on joint information needs
Avg + stdev Important actors involved
Carelab 7.77/11 8.63/11 1.63
x One on one conversations with coordinators and organizations to convince external organization to join
x Adding actors to connect the coordinators and the city local network
x Snowballing in local network (actors inviting actors)
x Talking to target audience to get to know the problem at hand.
7.69/11 1.74
x Different working methods to think out of the box. Methods such as design thinking and Theory U were applied.
x Frustration by participants that it was not specific enough. Too much thinking, no action.
7.00/11 2.83
x In general actors agree that the necessary actors were involved. However, at the end a community worker was asked to join in order to be able to implement the ideas
x Parents sometimes got the feeling that they were unwanted in the process
Radicalization 9.67/11 9.11/11 0.93
x People needed to be in the working group because of their position, so it was from the start clear who would be involved. No real need for metagovernace
9.89/11 0.93
x Every actor knew what was expected from them because of their function, so the metagovernor could have a very hands-off approach
10.00/11 0.87
x Eventually people got invited who knew more about the problem at hand, such a representative from foreign affairs for diplomatic
Connecting Healthcare
8.72/11 8.58/11 1.62
x Metagovernors made a large effort to bring in external parties. This was sometimes hard because they did not have the contacts yet
x Metagovernors actively talked to (federations of) hospitals for information and discussion, even without getting them in the network
8.58/11 1.73
x Actors mention that metagovernors were really taking the time to give every actor a good understanding of the concepts, so everyone knew what they were talking about, since this was not the case at the beginning
9.00/11 1.48
x Metagovernors really included the right people (although maybe a bit too little OCMWs according to some actors)
Invasive species 9.13/11 9.20/11 1.32
x Actors agree that the right external actors were involved
x Metagovernor contacted ‘externals’ when additional expertise was required
9.00/11 1.83
x Working in a large group and then splitting up in a legal and scientific smaller group to be able to talk in own jargon. This was very beneficial. Discussions became much more relevant,
9.20/11 2.25
x Yes, actors argue that people from every region were present and that the involved actors were really experts on the matter at hand

PSI-CO work package 3: cross-case analysis
65
Case Average evaluation of exploring content strategies
Avg + stdev Involving external organizations
Avg + stdev Emphasis on joint information needs
Avg + stdev Important actors involved
because only experts were involved.
City on scheme 8.82/11 8.36/11 1.29
x People generally feel that there were two main drivers. Others could provide input, but were mainly there to implement the methodology, but they are all positive about the metagovernance
8.36/11 1.50
x Almost every action was checked off by local stakeholders
x Measurement tool to measure impact was developed
9.73/11 1.74
x Yes, especially the metagovernors argue that the project was a success because they could count on a strong local network
Sustainability program
7.96/11 8.38/11 1.54
x There are no signs that actors do not think that there should have been more attention on involving external organizations
7.69/11 1.35
x Subgroups were created for refinement of ideas was very helpful
x They worked using a ‘fiche’ which was validated internally by the home organizations. Next, they were grouped in a thematic group .
7.81/11 2.17
x Content wise, the right actors were involved. However, the plan was not adopted by the government, so in that sense the right actors were not involved to deal with the issue at hand
Mothers in poverty
9.37/11 8.33/11 0.50
x Actors agree that there has been an emphasis to include the right organizations.
x People from practice were invited to give presentations
9.89/11 1.62
x Monthly intervisions were organized to keep each other updated and to determine what worked
x First year was a pilot year and a measurement tool to measure impact and to what extent it worked was developed
9.89/11 1.17
x Some actors had the feeling only Dutch-speaking organizations should have been involved, because interaction with the French-speaking actors was very limited and their presence was thus superfluous
Experts by experience
9.37/11
8.89/11 0.93
x External organizations were involved to place the ‘experts’. Not mentioned if this was (in)sufficient
x External lawyers were sometimes asked to analyze complex issues which was then communicated to the responsible services.
8.67/11 0.50
x Monthly meetings were organized to get to know the problems that the involved actors experienced
x At a certain point it was decided to organize trainings to train actors
9.33/11 1.58
x In the interviews are no signs that not all important actors are involved

PSI-CO work package 3: cross-case analysis
66
Case Average evaluation of exploring content strategies
Avg + stdev Involving external organizations
Avg + stdev Emphasis on joint information needs
Avg + stdev Important actors involved
how to be a mentor or hierarchical chef
NISP 7,51/11
7.46/11 1.76
x Yes, a lot of actors are involved. Some actors even argue too many actors.
7.77/11 1.59
x Yes, trainings were provided to learn how to work with the new system and context and history of the project were provided. However, because not everyone spoke the same language, communication was sometimes difficult
7.27/11 2.33
x Some actors say that the French speaking representatives were underrepresented and that the German speaking actors are not included
Table 18. Exploring content strategies36
36 The numbers are the mean, ranging from 1-11, and the standard deviation in every case. This is derived from the survey data concerning exploring content strategies. Three items were used to measure the exploring content strategies. Respondents were asked to take a position between two extremes: 1)There has been no attention at all [in this project] on involving external parties who can bring in new ideas/There has been a lot of attention [in this project] for involving external organizations who can bring in new ideas 2) When gathering information and knowledge [in this project]there has been no emphasis at all on determining the joint information needs/When gathering information and knowledge [in this project]there has been a lot of emphasis on determining the joint information needs. 3) The important actors necessary to deal with [the issue at hand] were not included [in the process]/All important actors necessary to deal with [the issue at hand ] were included [in the process]. The text boxes next to the values are derived from the interview data.

PSI-CO work package 3: cross-case analysis
67
In the evaluation of the connecting strategies it can be noticed that having different subgroups is beneficial for the process, because the right people are placed together. In the evaluation of the exploring content strategies it can be seen that having only the ‘right’ people in the subgroups leads to more refinement of the ideas. Related to ‘having the right people’ is that some projects actively invested in giving every actor a good understanding of the concepts at hand. It is regarded important to make sure everyone knows what one is talking about. For example, the Connecting Healthcare case deals with healthcare issues, but an IT company which has less knowledge of the healthcare sector is also involved in the project. Time was invested for elucidating the concepts to make sure that every actor has the same understanding of the problem.
From the studied cases, there is only one, Carelab, that had a specific methodology to explore content. The coordinators claim that the project was mostly a ‘thinking exercise’ and that coming to tangible output was a lesser priority at first. That is why they used special methodologies (e.g. Theory U) that aim to break through past unproductive patterns of behavior that prevent actors from empathizing with their target audience and often lock them into ineffective patterns of decision making. Ironically, this case was evaluated almost lowest on the ‘exploring content’ strategy with an average score of 7.77/11.
Also, the creation of subgroups is seen as an important strategy. This leads to a process where information is spread in a more efficient way. Some practical examples are the thematic subgroups in the Sustainable program case, the division between a legal and scientific working in the Invasive species case, and the suggestion to have a separate French speaking and Dutch speaking group in the Mothers in poverty case. All these strategies have the goal to make the meetings as efficient as possible and are aimed at only including actors who can make a substantive contribution to the process are involved in the meeting.
Finally, a strategy that was very positively experienced is the creation of a measurement tool. This was developed in two cases and it allowed the involved actors to measure the outcomes of the process and thus to see what works and what does not. Since an innovation is often a process of trial and error, this is experienced as a good way to objectively measure the results of implementation.
3.2.4 Discussion on metagovernance strategies This part provides an answer on the second research question:
RQ 2. How do governments create, stimulate and sustain such innovation-enhancing collaborative governance arrangements (meta-governance as condition for collaborative innovation)?
The analysis of the survey data in section 2.4 shows that the perceived extent of applied metagovernance strategies positively affects the perceived level of innovation, also when controlling for other variables and network dummies. In this section it became clear that the applied metagovernance strategies are very much context-dependent.
Arranging Looking at the arrangement of the networks we see that different strategies were applied to create the network. The cases all have a different history, some existed already to some extent, while others were created from scratch. The creation of innovation networks is different in every case, but we found that the networks are usually created by a single actor or a small core group of actors who initiate the project and subsequently also acted as the metagovernor(s) of the project. The metagovernor is often the starting point for the creation of the network specific for the innovation. Networks are often created

PSI-CO work package 3: cross-case analysis
68
based on the own (professional) networks of the metagovernor. We found that the own network of the metagovernor was important to determine who to invite to the network. This does not mean that all these actors were included, because often these invitations only were the starting point. Actors often mention that they got involved in the process because a colleague asked them to join the project after they were made aware of the project by the metagovernor. In some cases it was fairly simple for the metagovernor to determine what organizations needed to be included, because some organizations were required by law and because of their organizational mandate to join. Still, the selection of the specific person to be included in the network depended on the home-organization of the actors which decides who to put forward to join the process. The metagovernors often invited people from their own professional network and the organization of this person then decided who they would send.
Not all cases consisted of a network where everyone was present all the time. A strategy that was positively evaluated is the creation of thematic subgroups. This is a strategy that places people in different groups based on their area of expertise. Actors perceived this as being very beneficial, because only relevant actors were present and the meeting did not have too many actors which could make interaction too complex. The decisions made in these thematic subgroups were then taken to an overarching meeting that connected the decisions of the different groups with each other. Thematic subgroups might also be a good strategy to achieve synergy, because although different perspectives are present, only actors that can deepen the discussions are included.
Process rules In all cases studied, actors claim that there were few formal rules to manage the networks. They often cannot recall any measures that were taken and almost all actors claim that decisions were based on consensus. It can be confirmed that in (almost) none of the cases strict, formal rules were applied. However, the concept of ‘consensus by decision-making’ is sometimes stretched by the actors. For example, only the Sustainability program case had formal rules about decision-making that should have led to an outcome based on consensus, but actors in the City on scheme case also claim that decisions were taken by consensus, while this was far less structured and more based on consultation of all actors, but the final decision was largely influenced by the metagovernor. We see that the cases where this happened score lower on the survey item that measured if something was done with their input. This does not mean that one method is better than the other, but that decisions are more often made based on ‘decision-making after consultation of actors’ instead of actual joint decision making.
The ability of actors to divert from the plan if this was more advantageous usually depends on the end goal of the innovation. Some cases were characterized by a single problem and the actors wanted to have an innovative solution to deal with the problem at hand. This allowed the actors to easily divert from the plan. Other innovations really had a point on the horizon that they had to reach, so they could not diverge from the end goal. We argue that the ability to divert from the plan is mainly present when no clear end product is present or if the metagovernor organizes open meetings.
Connecting A commonly used strategy is to bring together opposing interests in case of deadlocks, but metagovernors in some cases say that it was very important that these differences of opinion should not block the whole process. Cases where deadlocks caused by differences in opinion were placed on hold and taken to the next meeting are evaluated more positively on the aspect of bringing together opposing interest. A reason that these metagovernors give for this strategy is that they did not want to slow down the process, because it would demotivate actors. Related to that, implementing quick wins is perceived to be important. Cases with milestones were evaluated positively, because it kept the

PSI-CO work package 3: cross-case analysis
69
actors motivated. It must be noted here that this is often easier to realize when the project has a clear end goal to work towards than in projects with no clear end goal.
A strategy which was very positively evaluated was the organization of feedback sessions when the innovation was already implemented. This included monthly interventions where actors could share their experiences and learn from others. Sometimes it was felt by actors that not sufficient attention was paid to the relationships, because there a clear separation between French and Dutch speaking actors was present in some cases.
As mentioned before, collective decision-making was not present in all cases, because in some cases the decision-making was strongly influenced by the metagovernor. This is however not always a bad thing, and does not always translate itself in dissatisfied actors. For example, the innovative outcomes were positively evaluated in the City on scheme case, while the decision-making was very much in the hands of the metagovernor. On the other hand, in the NISP case is little collective decision-making and we see that the innovative outcomes and the process quality is not very well evaluated.
Exploring content We found that metagovernors actively included external organizations. All the cases were characterized by including external organizations and it was no problem to include additional actors if this seemed to be beneficial. In one case, it was even argued that maybe too many actors were involved or that they were not important. For example, in some cases interaction with other actors was poor, like French versus Dutch speaking actors, and thus their presence in the same meetings seemed to be unnecessary sometimes, because no interaction occurred. In other cases, however, people say that the network was overrepresented by actors from one region.
Different strategies were applied to explore the joint information needs. The Carelab case used a special methodology to explore this content, City on scheme and Mothers in poverty developed a measurement tool to get to know to what extent their project was successful, Invasive species and Sustainability program used thematic subgroups to fulfill this need, and Connecting Healthcare actively tried to let all the actors have a common understanding of the problems at hand. These strategies are all very context dependent and depend for example on the amount of information that the actors already have or need. However, we can conclude that metagovernors usually had attention for the joint information needs.

PSI-CO work package 3: cross-case analysis
70
3.2.5. Discussion: how network level and metagoverance conditions combine when producing collaborative innovation
To see how different concepts at the network level interact, we compared the main concepts on the network level with each. The main concepts that were discussed in part 3.1 and 3.237 of this report were compared to each other by looking at the mean and standard deviation of the survey items of these concepts. We then looked for every concept in every case whether the mean and standard deviation scored higher or lower than the total average.
We found that cases that scored high in terms of innovative outcomes were also likely to score high on the perceived process outcomes, institutional outcomes and applied metagovernance strategies. Cases where metagovernance strategies were evaluated as highest were also the cases with the highest innovative outcomes, indicating that successful metagovernace is related to the higher perceived innovative outcomes.
Two of the cases only reached the design-phase. We find that these are also the cases who score lowest on institutional outcomes and exploring content strategies. It can be argued that a lack of trying to explore the available content in the cases by the metagoverner might lead to early stagnations of the process which stop the process from continuing.
We also found that the cases that scored lower on the innovative outcomes, generally also consisted of a network characterized by low densities. Carelab and Sustainability program have the lower than average densities in all of their networks, while actors in successful cases are in general more connected to each other. This is a clear indicator that being connected to each other is beneficial for the innovative outcomes. This is even more supported by the fact that the cases with a higher than average density in all of its networks (Radizalization and Connecting Healthcare) score high on the connecting metagovernance strategy. Interesting is that the standard deviation in this evaluation is lower than average, indicating that all the actors in this case agree with the high evaluation of the connecting metagovernance strategy. So there is a strong indication that high evaluated connecting metagovernance strategies lead to more dense networks, also because a case with low densities (City on scheme) is characterized by lower evaluated connecting strategies.
37 Innovative outcomes, process quality, institutional quality, connecting strategies, exploring strategies, and density of the ‘information given outside meetings’-network, density of the ‘elaboration upon each other’s ideas inside meetings’ – network, and density in the ‘contact frequency outside meetings’- network

PSI-CO work package 3: cross-case analysis
71
3.3. Individual conditions for collaborative innovation The results of the analyses on the individual conditions for collaborative innovation are presented in this section. We focus here on the attitudes and capacities of individual civil servants and participants active in these collaborative governance arrangements and how they influence different kinds of learning at individual level, as a precondition for collaborative innovation. This section provides an answer on the third research question:
RQ 3. How do individual civil servants in these collaborative governance arrangements select, process, and handle information in developing new tools, policies and services? What skills, attitudes, incentives38 do they need to effectively work together with other public actors and stakeholders and how do they learn (individual conditions for collaborative innovation)?
3.3.1 Theoretical framework The individual capacity to innovate in collaborative arrangement relies on the individual ability to learn. It is through the continuous process of absorbing new knowledge that people generate new solutions and build joint action (Klijn & Koppenjan, 2016, Gieske et al., 2016). In fact, a major condition for innovation to succeed is to encourage learning processes (Sørensen & Torfing, 2017). Understanding the factors that facilitate learning is therefore crucial. This chapter is divided in five sections. The first defines three types of learning important in the context of collaborative innovation (policy, relational and political learning). The second scrutinizes the facilitative conditions. The third section presents the methods used to measure the variables, including the qualitative coding of learning and the social network analysis. The analysis, based on logistic regressions, and the results are presented in the fourth section. The chapter ends with the discussions of the results. In short, the chapter shows the importance of reciprocate exchange of information for policy and political learning. The likelihood of relational and political learning is considerably increased for individuals who are trustworthy. Attraction to policy-making, a dimension of public service value, facilitates relational learning. Frequent contacts have, on the contrary, a detrimental effect on policy learning, controlling for information exchange. Learning for innovation At the most general level, learning is a process of knowledge acquisition (Heikkila & Gerlak, 2013). In the context of collaborative innovation three types of learning are particularly relevant: policy learning (learning about the content), relational learning (learning about the actors), and political learning (May, 1992; Klijn & Koppenjan, 2016).
- Policy learning refers to knowledge about the goal, the scope, or the impact of specific measures or the broader policy topic (May, 1992). This type of learning ensures that the solution designed is based on scientific insights and is not merely the product of interests disconnected from the reality (Klijn & Koppenjean, 2016). The presence of policy learning indicates that the problem at hand was addressed considering the available scientific information;
- Relational learning refers to knowledge about the resources and the interests of the actors involved in the collaboration. At the level of resources, it includes knowledge about the internal processes, the administrative, and the financial capacity or constraint of an organization or the
38 Originally, the question included the study of instruments. However, because instruments do not exactly fall under individual conditions, they won’t be addressed in this part. Details on instruments and the organization collaborative process implemented are described in the case study section.

PSI-CO work package 3: cross-case analysis
72
individual. Learning about interests includes knowledge about organizational or personal needs, point of view, or main objectives. This type of learning is especially important for the development of shared goals and the attainment of a joint solution (Siddiki et al., 2017). By understanding what others want and what they can do, actors can find solutions that improve the global situation without damaging one of the parties (Klijn & Koppenjan, 2016);
- Political learning refers to knowledge about the political feasibility, political strategy, as well as the politicians’ interest regarding the policy discussed (May, 1992). There are two effects of learning about politics in the context of innovation. First, actors involved in the collaboration can adapt their suggestions in order to win political support and ensure effective implementation (May, 1992). Second, in a case of failed innovation, the political knowledge acquired can be used to develop a new process that better suits political interest, increasing therefore the chance of success (De Vries et al., 2016).
Conditions for learning The individual ability to learn is determined by several decisive conditions (Gieske & al., 2016, Lewis & al., 2014). The analysis focuses on eight factors prevailing in the literature. Four of them are individual traits linked to individual skills (expertise), attitudes (perception of process fairness, trust propensity) and incentive (public service motivation). The other four are relationships, defined as the nature of the interactions occurring between participants (information exchange, frequency of contact, trust, and trustworthiness). This section briefly describes each of those variables and the expected impact on learning (see Figure 3).
Individuals traits
Individual traits refer to personality and include skills, attitudes and incentives, defined here as motivation. The following traits have been studied:
- Public service motivation (incentive) refers to “an individual’s orientation to delivering services to people with a purpose to do good for others and society” (Perry and Hondgehem, 2008 in Kim & Vandenabeele, 2013). The concept reflects in four dimensions, namely attraction to policy making, commitment to the public interest, compassion, and self-sacrifice (Perry, 1996). This analysis focuses on the first two dimensions, being attraction to policy-making and commitment to the public interest. Those are the most relevant in the context of collaborative innovation. The underlying
Figure 3. Conditions for learning

PSI-CO work package 3: cross-case analysis
73
hypothesis is that highly motivated people are more likely to engage in the collaborative process and therefore to acquire new information (Van Eijk & Steen, 2014).
- Perception of collaborative fairness refers to the perception of an individual that actors involved in the collaboration are treated equally and with mutual respect. It is expected that individuals who positively perceive the collaborative process are more likely to acquire any type of knowledge (Leach et al., 2014);
- Trust propensity refers to a general willingness to rely on others (Colquitt et al., 2007). It is the personal dimension of trust, a general predisposition to trust others. The main hypothesis is that individuals having a higher propensity to trust are more likely to learn39.
- Expertise (skills) is defined as the number of years an individual is working in the field related to the innovation studied. According to the findings of Leach and al. (2014) expertise is detrimental to learning. This can be explained by the fact that experts are reluctant to admit they are wrong (Kahneman, 2011);
Relationships
Relationships have recently been considered as major factors influencing individual learning. Four types of relations have been explored:
- Information exchange is the extent to which individuals send and receive information about the innovation from other actors involved in the same process or network, outside the official meetings. It affects individual learning by limiting or expanding information accessibility. It is expected that individuals who send and receive information from a higher number of actors are more likely to learn, as they have a greater access to new information (Lewis et al., 2014);
- Frequency of contact is the frequency to which individuals communicate by mail, phone calls or face-to-face meetings with the actors involved in the same process outside the official meetings. It is one dimension of the strength of tie, defined as “the amount of time, the emotional intensity, the intimacy and the reciprocal services characterizing the tie” (Granovetter, 1983). The impact on learning is uncertain: on the one hand, strong ties support trust, which is beneficial for the exchange of information. On the other hand, weak ties are opportunities for new perspectives and provide access to new information, which also fosters learning (Bekkers et al., 2013). In this study, the expectation is that individuals frequently interacting with numerous actors are more likely to learn;
- Trust is defined as “a stable and positive expectation that actor A has (or predicts he has) of the intentions and motives of actor B in refraining from opportunistic behaviour, even if the opportunity arises” Klijn et al. (2010). High trust involves a trustor’s vulnerability to the trustee’s willingness and capacity to behave according to the estimation. It has been operationalized as the probability that actors take into account one’s interests while using the received information. The presence of interpersonal trust supports the collaborative innovation process by fostering individual willingness to share information and individual change in understanding (Leach et al., 2014). It also stimulates risky and innovative choices by reducing uncertainty (Klijn et al, 2010). It is therefore hypothesized that individuals that trust to a larger extent a higher proportion of the network are more likely to learn;
- Trustworthiness refers to the perceived trustworthiness of the trustee. It is comprised of three dimensions: ability, benevolence and integrity (Mayer et al. 1995). In other words, somebody is perceived as trustworthy if he or she is perceived as competent, to care about the interests of the
39 Please note that in the preliminary survey reported in section 2.4 the perception of his/her own trust propensity of the respondent has a significant and positive effect on the perceived innovative outcomes by the network in which the respondent is involved.

PSI-CO work package 3: cross-case analysis
74
others and to be honest. While trust refers to the expectation of a specific behaviour, trustworthiness is a perception of other’s personal qualities. Trustworthy individuals have a greater chance to acquire information, and are therefore more likely to learn. The hypothesis is that people considered as the most trustworthy are more likely to learn.
3.3.2 Methodology
Measuring learning
Data on individual learning were collected through interviews, coded by the researcher and analysed using NVivo 12. A category scheme was developed according to the three learning types previously defined (policy, relational and political). Subcategories were created for relational learning in order to distinguish knowledge related to actors’ resources from actors’ interest. When various ideas were developed in the same paragraph, it was coded in several categories. Table 2 provides examples of quotes from the interviews for each learning type. Those qualitative data were then transformed into quantitative data. Each learning type became one variable taking the value 0 when learning is absent or 1 if learning is present for each individual. Data were then imported to SPSS.
Learning type Subcategories Learning about Example
Policy learning / Scope/Causality/Role/
Relevance of the policy
Specific Measures
Vocabulary/Concepts
« […]Heb ik dat eigenlijk enorm veel van geleerd om zowel het
proces van diagnose door geneesheren, het proces van
erkenning van die diagnose, het proces van financiering van
die diagnose, het proces van samenleven met andere met
dezelfde diagnose, het probleem van dat gezin om om te gaan
met alle noden die daarop afkomen.”
“[…] Alors quand on commence à parler des impacts, par
exemple pour des incitants financiers qui ne demandent que
0,55 au km pour le vélo par exemple, mais quand on met ça
sur la table, prendre jusqu’où, à qui, qui peut bénéficier de
cette mesure, l’étendue de la mesure, on se rend compte
effectivement c’est une autre dimension […] »
Relational
learning
Others' interest Others' policy preferences or
beliefs
“Euhm ja, in die zin… De belangen van de medicatieschema
voor die beroepsgroepen, apothekers en alle andere ook…
voor huisartsen… Ik heb ook geleerd dat marktlogica bij
huisartsen en apothekers meer meespeelt dan ik
oorspronkelijk gedacht had.”
Stakeholder
resources
Stakeholders way of
working/organizational power
and constraint
“Oui j’ai appris beaucoup. […] Comment fonctionne le
DEMNA. Le DEMNA, c’est comme l’Inbouw mais c’est l’institut
de recherche en Wallonie mais il a été intégré dans
l’administration et c’est complètement enfin différent en
termes de réorganiser son travail, en termes de flexibilité
comment travailler”
Political
learning
/ Political feasibility, politicians
policy preferences
“Wat ik zelf geleerd heb?... Ja ik heb heel veel.. een eerste ding
is al, als je zoiets gewaagd neerzet als Carelab, kies dan een

PSI-CO work package 3: cross-case analysis
75
vraagstuk dat gemakkelijker is. Bijvoorbeeld binnen een
ministerie, of dat tenminste die minister achter u staat...[…]”
Table 19. Measurement of learning
Measuring individual traits (skills, attitudes and incentives).
Measures on individual traits were gathered through a survey. The scale and the items used for each variable are described below.
- Public service motivation (incentive), is measured through 8 standardized items valued from 0 to 10 (Kim, Vandenabeele et al., 2013). Four items represented the dimension attraction to policy-making:
o I admire people who are involved on activities to aid my community o It is important to contribute to activities that tackle social problems o Meaningful public service is very important to me o It is important for me to contribute to the common good
The other four items represented commitment to the public interest:
o I think equal opportunities for citizens are very important o It is important that citizens can rely on the continuous provision of public services o It is fundamental that the interests of future generations are taken into account when
developing public policies o To act ethically is essential for public servants.
- Perception of collaborative fairness is measured with 2 standardized items, valued from 0 to 10 :
o The [collaborative arrangement] treats all parties fairly o The meetings are marked by mutual respect
- Trust propensity is measured with 3 items valued from 0 to 10, identical to the one used in the
European Social Survey. o Would you say that most people can be trusted, or that you can’t be too careful in dealing
with people? o Do you think that most people would try to take advantage of you if they got the chance,
or would they try to be fair? o Would you say that most of the time people try to be helpful or that they are mostly looking
out for themselves?
- Expertise (skills) is measured by the number of years an individual is working in the field related to the innovation studied.
Measuring relations
Relational data were collected through surveys following the roster choice method (Scott, 2017). In each case, respondents assessed their relations with the actors involved in the same collaborative process—or network— based on a pre-defined list. A Social Network Analysis was then performed using UCINET 6 to calculate the normalized degree centrality of each individual. This centrality degree represents the number of relations an actor has divided by the maximum number of relations

PSI-CO work package 3: cross-case analysis
76
possible—removing therefore the effect of network size (Freeman, 1979). Those centrality degrees were then imported into SPSS. The exact meaning of degree centrality for each type of relations studied (information exchange, frequency of contact, trust and trustworthiness) is explained just below:
- For information exchange outside the meetings, the centrality degree represents the number of actors an individual has sent to and receive information from, controlling for network size. In this sense, it only counts the number of relationships characterized by both information giving and information reception. It represents a proportion of the network with which the individual exchanges information outside the meetings;
- For frequency of contact outside the meetings the centrality degree represents the number of actors an individual has contact with at least monthly, controlling for network size. To do so, the data that originally took a value from 0 (no contact) to 5 (daily contact) were dichotomized. The value 1 was given to all value equal or above 3, which include monthly, weekly and daily contact, and 0 otherwise. The threshold of 3 was defined so as less than 50% of the relations are frequent contacts. In this case, centrality degree represents a proportion of the network with which the individual has at least monthly contact; For trust, the centrality degree represents the extent to which an individual trust the other actors in the network – or the expectation an individual has of the behaviour of the other actors - controlling for network size. To measure trust, each individual assessed the probability that the other actors involved in the network take his or her interests into account while using the received information, on a scale ranging from 0 (Not sure at all) to 10 (Absolutely sure). In this case, the centrality degree depends both on the number of actors trusted by the respondent and the certainty degree associated with them;
- To measure trustworthiness, or the perception of other’s qualities, individuals had to nominate up to 5 or 7 people (according to the size of the network) that best match with the following three items, representing the three dimensions of trustworthiness:
o He/she has the competences to deal with the issues at stake (ability dimension) o He/she is very concerned about the interests of the other participants (benevolence
dimension) o He/she tries to be fair in dealing with others (integrity dimension).
Three centrality degrees have then been calculated based on those three items. Each of them represents the proportion of the network that considers the individual as competent, benevolent and of integrity (or honest).
3.3.3 Analysis and results Logistic regressions were run with SPSS 25 to assess the impact of individual traits and relations on each type of learning, taken independently. Logistic regressions are used to analyse the effect of one or various independent variables on a binary outcome (Stoltzfus, 2011). It identifies the variables that increase the likelihood of the occurrence of an outcome, in this case learning. It also provides information about the proportion of correct value predicted by the model. Analysis below are based on 8 out of 9 cases40. The number of observations for each type of learning is N = 75. Specific models for
40 One case was not included because of the amount of missing data

PSI-CO work package 3: cross-case analysis
77
each type of learning were constructed. To control for the impact of the cases - the fact that an individual is part of a specific network- network dummies were created and jointly included in each model tested. To create the models, a two-step strategy was used. First, the effect of each variable on learning was tested independently. Second, variables were combined in two-by-two models. Based on the results and when necessary, models including three variables were tested41. The models represented here are those that maximize the proportion of correct predicted value including the least variables at a confidence level of at least 90% (p-value <0.1).
Because various factors analysed in this study are scales constructed with various items, new variables were created after testing for internal reliability, using Cronbach’s alpha index. It is commonly accepted that if this coefficient is higher than 0.7, the variables included in the test are internally reliable and can therefore be merged into a new one. The new variables created are explained below.
- Public service Motivation was divided into:
o Attraction to policy-making, calculated as the mean of 4 items (Cronbach’s alpha of 0.74); o Commitment to the public interest, calculated as the mean of 4 items (Cronbach’s alpha of
0.84)42; - Fairness of the process was calculated as the mean of 2 items related to equality and mutual respect
in the network (Cronbach’s alpha of 0.8); - Trust propensity was calculated as the mean of 3 items (Cronbach’s alpha of 0.83); - Trustworthiness was calculated as the mean of individual normalized degree centrality on ability,
benevolence and integrity. (Cronbach’s alpha of 0.95). It is those newly created variables that have been included in the analysis.
Policy learning: Information exchange outside the meetings and the detrimental effect of frequent contact.
The variable policy learning is a dummy variable that takes the value 1 when individuals have learned about the content of the policy, 0 otherwise. Table X provides the coefficients of the regressions and the p-value for each variable tested independently, controlling for the cases. The odd ratio expresses the scope of change in the likelihood of an individual to learn about the content of the policy. The percentage of correct predicted value refers to the explanatory power of the model. The results show that only information exchange outside the meetings and trust are statistically significant at a confidence level of 90%. However, because variables are likely to interact with each other, two-by-two models were constructed with variables with a p-value greater than 0.600. The use of a relaxed P-value as a selection criterion reduces the initial number of important variable while minimizing the risk of missing important ones (Sperandei, 2014).
41 Maximum three variables were included in the model in order to avoid overfitting (Stoltzfus, 2011). 42 In the next section, those two dimensions of public service motivation were analysed separately.

PSI-CO work package 3: cross-case analysis
78
Controlling for the cases, the model constructed with two variables that best explain the occurrence of policy learning includes information exchange outside the meetings and frequency of contact outside the meetings43. This model has the highest level of corrected predicted value, jumping from 51,5 to 76,5%, with both variables statistically significant at a confidence level of 95%. One model has a similar level of correct predicted value, but with a lower level of significance: the model combining trust and attraction to policy-making (trust significant at the 90% level of confidence, attraction to policy making not significant). The other variables are not statistically significant in any models (more details in Annex 5). This result is surprising. Regarding the effect of the variables taken one by one, it would have been expected that the best model includes trust and information exchange. It seems therefore that trust as an effect on policy learning that is overwhelmed by information exchange and frequency of contact taken together. To further explore the link between those three variables a model including those three variables was run. As indicated in table 21, this model correctly predicts 80,9% of the value taken by policy learning.
Observed Prevision constant model (Block 0) Prevision global model (information exchange, frequency of contact, trust, block 1)
Relational learning
Correct percentage Relational learning
Correct percentage
0 1 0 1
Relational learning
0 (absence) 35 0 100.0 29 6 82.9
1 (Presence) 33 0 ,0 7 26 78.8
Global percentage 51.5 80.9
Table 21. Classification table policy learning
The coefficient of the regression and the significance level of the model are indicated in table 20. As the coefficient B is positive for information exchange outside the meetings, an increase in one unit in normalized centrality degree for information exchange increases the likelihood of policy learning at a confidence level of 95% (significance level < 0.05), controlling for frequency of contact and trust. As the coefficient B is negative for frequency of contact outside the meetings, an increase in one unit in the normalized centrality degree for this variable decreases the likelihood of policy learning at a confidence level of 95% (significance level <0.05), controlling for information exchange and trust. As the variable trust is not significant, the coefficients are not interpretable. It seems to confirm that trust has an effect on policy learning - as it significantly increases the proportion of correct predicted value from the two-
43 In total, 10 models have been tested combining attraction to policy-making, fairness of the process, information exchange, frequency of contact and trust. More information in Annex 5.
Variable Odd ratio % correct predicted value (Constant model : 51, 5%)
P -value
Attraction to policy-making 1,849 66,7 0,154 Commitment to public interest 1,164 68,1 0,733 Fairness of the process 1,233 73,5 0,397 Trust Propensity 1,124 69,6 0,622 Expertise 0,870 66,7 0,870 Information exchange 1,057 73,5 0,004 Frequency of contact 0,988 70,6 0,538 Trust 1,025 75 0,057 Trustworthiness 1,006 70,6 0,739
Table 20. Coefficients of univariate logistic regressions on policy learning

PSI-CO work package 3: cross-case analysis
79
variables model - but this effect is too small to be significant when controlling for information exchange and frequency of contact outside the meetings.
The Exp(B) expresses the odd ratio, or the scope of changes in the likelihood of an individual to learn about the content of the policy. An increase in one unit in information exchange outside the meetings increases the likelihood of policy learning by a factor of 1,088 or 9%, with frequency of contact and trust being constant. Because a unit of information exchange represents an increase of 1% in the percentage of actors an individual sent information to and received information from, which is not meaningful in networks of a dozen individuals, it is more suitable to calculate the odds for a 10% increase. To do so, the odd ratio is exponentiated by 10. As a result, an increase of 10% in the percentage of actors with whom the individual share information outside the meetings increases its likelihood of learning about policies by 132% (factor of 2,32), with frequency of contact and trust being constant. On the contrary, an increase in one unit in frequency of contact outside the meetings decreases the likelihood of policy learning by a factor of 0,929 or 7%, with information exchange and trust being constant. Again, an increase in one unit in frequency of contact represents an increase of 1% in the percentage of actors an individual has contact with at least monthly. Therefore, it is more suitable to look at a 10% increase. In this case, the likelihood of relational learning decreases by 48% (factor of 0,478) with information exchange and trust being constant.
In sum, controlling for the cases, sharing information with 10% more actors outside the meetings increase the likelihood of policy learning by 132%, controlling for frequency of contact and trust, with a confidence level of 95%. Surprisingly, having frequent contact outside the meetings with 10% more actors decrease the likelihood of policy learning by 48%, controlling for information exchange and trust, with a confidence level of 95%. Trust has no significant influence on policy learning controlling for information exchange and frequency of contact but it increases the proportion of correct predicted value of the model.
It is interesting to note that in one case, individuals are less likely to learn about policy content controlling for information exchange, frequency of contact, and trust, at a confidence level of 95% (p<0.05), while in another one, individuals are more likely to learn at a confidence level of 95% (p = 0.05).
B E.S Wald ddl Sig. Exp(B)
Block 1
Frequency of contact -,074 ,034 4,751 1 ,029 ,929
Info exchange ,085 ,030 7,779 1 ,005 1,088
Trust 0,15 0,16 0,799 1 0,371 1,015
Constant -1,317 1,584 ,691 1 ,406 ,268
Table 22. Coefficient of the logistic regression on policy learning
3.3.3.2. Relational learning: the importance of being trustworthy and attracted to public value Relational learning is a dummy variable that takes the value 1 when individuals have learned about both the interest and the resources of the other actors, 0 otherwise. Table 23 provides the coefficients of the regressions and the p-value for each variable tested independently, controlling for the cases. Four variables are statistically significant at the 95% confidence level: attraction to policy-making,

PSI-CO work package 3: cross-case analysis
80
information exchange outside the meetings, trust and trustworthiness. Trustworthiness has the highest impact, correctly predicting by itself 82,4% of the value taken by relational learning.
Controlling for the cases, the model that best explain the occurrence of relational learning include trustworthiness and attraction to policy-making (one dimension of public service motivation)44. This model has the highest correct predicted value, jumping from 51,5 to 85.5 (see table 24). It is the only model that correctly predicts a higher proportion of value than trustworthiness alone. It means that the effect of information exchange outside the meetings and trust on relational learning is lower compared to the effect trustworthiness45.
Observed Prevision constant model (Block 0) Prevision global model (trustworthiness, APS, block 1)
Relational learning
Correct percentage Relational learning
Correct percentage
0 1 0 1
Relational learning
0 (absence) 35 0 100.0 26 9 88.6
1 (Presence) 33 0 ,0 11 22 81.8
Global percentage 51.5 85.3
Table 24. Classification table relational learning
The coefficient of the regression and the significance level are indicated in table 24. As the coefficient B is positive, it means that an increase in one unit in attraction to policy-making and in the normalized degree centrality of trustworthiness increase the likelihood of relational learning, at a confidence level of 95% for trustworthiness p<0.05) and 90% for attraction to policy-making (p<0.1). Looking at the odd ratio (the Exp(B)), it is possible to infer that an increase in one unit in the scale of attraction to policy making increases the likelihood of an individual to learn about other actors' resources by a factor of
44 In total, 6 models were run, combining attraction to policy making (one dimension pf public sector motivation), information exchange, trust and trustworthiness.
Variables Log odd % correct predicted value
(constant model : 51,5%)
P value
Attraction to policy-making 3,572 72,5 0,011
Commitment to public interest 1,029 60,9 0,946
Fairness of the process 1,122 69,1 0,626
Trust Propensity 1,121 69,5 0,620
Expertise 0,975 63,8 0,879
Information exchange 1,035 70,6 0,014
Frequency of contact 1,003 63,2 0,879
Trust 1,035 67,6 0,01
Trustworthiness 1,085 82,4 0,001
Table 23. Coefficients of univariate logistic regressions relational learning

PSI-CO work package 3: cross-case analysis
81
2.679 (or 168%), with trustworthiness being constant. As the previous relational variables, because a unit in trustworthiness represents an increase of 1% in the percentage of actors within a network that considers the individual trustworthy, it is more suitable to calculate the odds for a 10% increase. As a result, an increase of 10% in the percentage of actors considering the individual trustworthy increases its likelihood of learning about other actors' resources and interest by 106% (factor of 2,06) with attraction to policy making remaining constant.
In sum, controlling for the cases, being more attracted to policy-making increases the likelihood of relational learning by 168%, controlling for trustworthiness and with a confidence level of 90%. In addition, being perceived as trustworthy by 10% more actors increase the likelihood of relational learning by 106%, controlling for attraction to policy-making, one dimension of public service motivation, with a confidence level of 95%. There is no significant effect of the cases on this relation.
B E.S Wald ddl Sig. Exp(B)
Block 1 Attraction to public service ,985 ,532 3,434 1 ,064 2,679
Trustworthiness ,072 ,025 8,731 1 ,003 1,075
Constant -11,446 5,104 5,029 1 ,025 ,000
Table 25. Coefficient of the logistic regression on relational learning
3.3.3.3. Political learning: the importance of being trustworthy but the detrimental effect of frequency of contact Political learning is a dummy variable that takes the value 1 when individuals have learned about political interest or feasibility, 0 otherwise. Table 26 provides the coefficients of the regressions and the p-value for each variable tested independently, controlling for the cases. In this case, only information exchange outside the meetings is statistically significant at a level of 95%. Because variables are likely to interact with each other, two-by-two models were constructed with variables with a p-value greater than 0.600.
Variables Log odd % correct predicted value P value Attraction to policy-making 2,130 68,1 0,111 Commitment to public interest 0,880 72,5 0,880 Fairness of the process 0,871 69,1 0,572 Trust Propensity 0,909 68,5 0,677 Expertise 1,031 68,1 0,863 Information exchange 1,040 73,5 0,013 Frequency of contact 0,742 73,5 0,353 Trust 1,012 70,6 0,340 Trustworthiness 0,306 79,4 0,230
Table 26. Coefficient univariate logistic regression on political learning
Controlling for the cases, the model that best explains the occurrence of relational learning includes trustworthiness and information exchange outside the meetings46. As reported in table 27, the correct predicted value jumped from 61.8% to 82.4%. None of the other variables, even combined, had significant effect.
46 15 models have been tested with the variables attraction to policy-making, fairness of the process, information exchange, frequency of contact, trust and trustworthiness

PSI-CO work package 3: cross-case analysis
82
Observed Prevision constant model (Block 0) Prevision global model (trustworthiness, frequency of contact, block 1)
Political learning Correct percentage Political learning Correct percentage
0 1 0 1
Political learning
0 (absence) 42 0 100.0 39 3 92.9
1 (presence) 26 0 ,0 9 17 65.4
Global percentage 61.8 82,4
Table 27. Classification table political learning
The coefficient of the regression and the significance level are indicated in table 27. As the coefficient B is positive for trustworthiness and information exchange outside the meetings, an increase in one unit of normalized degree centrality in trustworthiness and in information exchange increases the likelihood of political learning at a confidence level of 95% for trustworthiness (p < 0.05) and 90% for information sharing (p<0.05). Looking at the odd ratio (the Exp(B)), it is possible to infer that an increase in one unit in trustworthiness increases the likelihood of political learning by 6,5% at constant value for information exchange. Taking the 10% increases reference, an increase of 10% in the proportion of actors considering the individual trustworthy increases its likelihood to learn about politics by 88% with information exchange remaining constant. An increase of 10% in the proportion of actors an individual exchange information with increase its likelihood to learn about politics by 36%, keeping trustworthiness constant.
In conclusion, controlling for the cases, being perceived as trustworthy by 10% more actors increases the likelihood of learning about politics by 88%, controlling for exchange of information and with a confidence level of 95%. Moreover, exchanging information outside the meetings with 10% more actors increase the likelihood of political learning by 36%, controlling for trustworthiness and with a confidence level of 90%. In one case, learning about politics is less likely controlling for information exchange and trustworthiness, at a confidence level of 90%.
B E.S Wald ddl Sig. Exp(B)
Block Trustworthiness ,063 ,025 6,421 1 ,011 1,065
Information exchange ,30 ,016 3,520 1 ,061 1,031
Constant -2,858 1,426 4,014 1 ,524 ,057
Table 28. Logistic regression political learning
3.3.4 Discussion Different types of learning are facilitated or constrained by different variables. Information exchange outside the meetings is important for policy and political learning, but not for relational learning. Trustworthiness facilitated both relational and political learning. Attraction to policy making, as a dimension of public service motivation, only plays a role in relational learning. Unexpectedly, the frequency of contact is detrimental and not beneficial to policy learning, while the effect of trust is non-significant when controlling for other variables.
The results lead to various observations. First, it is not by frequently interacting with people that individuals acquire knowledge. This somewhat confirms the “strength of weak ties” (Granovetter,

PSI-CO work package 3: cross-case analysis
83
1983): individuals are more likely to receive information from people located on the periphery of their network. It indicates that a certain degree of diversity is required in the network, as people that frequently interact with each other are likely to be near colleagues. Second, the perception of reciprocate exchange of information is important for policy learning. Individuals who both give and receive information from the same actors are more likely to learn about the policy. Third, what is important for relational and political learning is to be perceived as a trustworthy person, and not to trust the actors. Individuals that are perceived as competent, honest and benevolent are more likely to receive information about personal or organizational interest and resources, as well as political games. Because those types of information are more sensitive by nature, it is easier to share them with trustworthy people. As a consequence, it increases their likelihood to learn. Fourth, the only individual trait that has a role in learning is attraction to policy-making, positively related to relational learning. Individuals who have a higher attachment to public value seems to be more curious about the situation of the other actors. Finally, the result shows that learning is not fully explained by individual traits and relation (correct prediction ranging from 80,5 to 85,3%). Organizational and case level variables are likely to influence learning.
From our initial set of 8 variables, only 4 have statistically significant effect on at least one type of learning. In all our model, expertise, procedural fairness, trust propensity47 and trust have no significant effect or an effect that is overcome by other variables. For instance, trust has independently a positive impact on policy and relational learning but it disappears once controlled for trustworthiness and frequency of contact. Only one dimension of public service motivation (attraction to policy-making) has an influence on learning. Commitment to public interest is never statistically significant. In short, incentives and relational variables have a higher impact on learning compared to skills and attitude. This does not mean that skills and attitude do not play a role: other skills and attitude that have not been tested may be relevant, i.e. communication skills or positive attitude toward the goal of the process. Moreover, some variables an effect on other outputs of collaborative innovation. For instance, trust propensity is positively linked to the perception of innovation while expert people are more likely to elaborate on each other ideas. It is not because a variable is non-significant regarding learning that it does not affect the collaborative innovation process.
For innovation to occur, it is important to foster policy, relational and political learning. Particular attention should be paid in organizing reciprocate exchange of information outside the meetings with people that are not too close but deemed competent and honest. Enhancing participant’s motivation in policy making is also crucial.
47 Please note that in the preliminary survey reported in section 2.4 the perception of his/her own trust propensity of the respondent has a significant and positive effect on the perceived innovative outcomes by the network in which the respondent is involved.

PSI-CO work package 3: cross-case analysis
84
3.4 Organizational conditions for collaborative innovation This section provides the answer to the fourth research question of the project:
RQ 4. How do organizational characteristics (organizational structures and leadership) influence government capacity to set-up, sustain and learn from collaborative interactions (organizational conditions for collaborative innovation)?
3.4.1 Theoretical framework
Various authors have pointed out that organizational conditions can go a long way in explaining the success and failure of collaborative innovation (Head 2008; Sørensen and Torfing, 2011). This category of conditions refers to two different aspects of an organization: its culture and its structure.
Organization culture refers to the way organizations deal with competing values (Quinn and Rohrbaugh, 1983). On the one hand, they can be in favour of controlling the actions of their employees in as many ways as possible. On the other hand, they can allow flexibility and responsibility. Another competing value is the choice between an internal (towards the organization itself) or an external focus (towards clients or users). The link between organizational culture and innovation has been made by many authors already, in public administration research as well as in economic research (Chen & Williams, 2007, Büschgens, Bausch & Balkin, 2013). The key message put forward in much of this research is that there are different kinds of organizational cultures and that some of them promote innovation while others hamper it (Büschgens, Bausch & Balkin, 2013). According to the review by Büschgens, Bausch and Balkin (2013), a developmental culture, which is based on the values of flexibility and external orientation, is the best culture to foster innovation in organizations. A developmental culture can encourage adaptability to changes and can compensate for the bureaucratic resistance to new initiatives caused by red tape (Burden et al., 2012; Pandey & Marlowe, 2015).
Figure 4. Competing values model (Quinn and Rohrbaugh, 1983)
Whereas the culture of an organization refers to its values, the organizational structure refers to the structural system behind this culture. This structure influences the organizational culture and, in turn is also influenced by it. In practice, the organizational structure determines whether employees are divided into subgroups or teams or not, who leads these subgroups or teams, and what rules they have to abide to. Organizational structure can therefore be described using the three R’s: roles, responsibilities, and rules. Most collaborative innovation studies that include organizational structure as a variable thus far have focused on these first two aspects: roles and responsibilities. This way

PSI-CO work package 3: cross-case analysis
85
scholars discovered that flexible, decentralised structures; clear task distribution (roles and responsibilities); and provision of organisational rules and procedures for collaboration (e.g., Alford 2009; Verschuere et al. 2012) are known conditions for effective coordination and coproduction. However, up until now less attention has been given to the effects of rules and procedures, and particularly to the effects of red tape. Bozeman (1993) defines red tape as burdensome rules and procedures that negatively affect performance. Studies have shown that red tape can create a risk-averseness that hampers innovation, and that it damages an organization’s reputation as being an effective and efficient partner in collaborations (Van de Vrande, et al. 2009; Feeney & DeHart-Davis, 2009). On top of that, red tape can have numerous indirect effects on collaborative innovation. For example, red tape is strongly linked to a decline in motivation (Moon & Bretschneider, 2002), which in turn is a known driver for learning and collaborative innovation (Albury, 2005; Sørensen & Torfing, 2011). Among the three organizational structure aspects mentioned above, we choose to study red tape in this research given the fact that there is still little to no research available with regard to red tape effects on collaborative innovation.
Affecting both the organizational structure and its culture, is the organization’s leadership and how the organization’s leaders manage the organization in terms of collaborative innovation. The literature shows that transformational leadership is the type most likely to foster innovative behaviour (Schweitzer, 2014). This type of leadership is characterized by a leader who clearly articulates his/her vision about the future and strives to get the organization to work together in the direction of the vision (Moynihan, Wright & Pandey, 2012).
Figure 5. Organizational conditions for collaborative innovation
3.4.2 Methodology
The organizational variables we focused on in this study were organizational culture, red tape and leadership. In terms of leadership we looked at transformational leadership in the organisations (1), to what extent leaders fostered collaborative innovation in performance contracts (2), and to what extend they encouraged it via the content of employee evaluations (3). Given the complex and context-bound

PSI-CO work package 3: cross-case analysis
86
nature of the organizational variables, data on these variables was mainly collected through the interviews. The survey data on these variables were only supplementary.
All interview transcripts were coded and analysed using NVivo 11. Based on the literature a first coding scheme was developed. This scheme was adjusted and supplemented over the course of the coding proces as more subcategories arose. The coding three can be found in table 29.
Codes Subcodes Further specifications
ORGANIZATIONAL CULTURE
Developmental culture
Per type of organizational culture: 'examples', 'effects ' or 'other'
Hierarchical culture Group culture Rational culture
Undefined culture
RED TAPE
General red tape
Examples Psychological effects Effects on innovation
Effects on collaboration Operational effects
Specific dimensions
Budget
Per dimension: effects & examples
Procurement Information
Communication Personnel
Collaboration Validation
No red tape
Flexibility
LEADERSHIP
Performance contracts
Innovation Collaboration
Employee evaluation Innovation
Collaboration
General priorities
Innovation specifically Collaboration specifically
Coll. Inno. projects Priorities
Budget
Timing
Deadlines Start-up cost
Quality Hard results
Politics
Influence set-up Influence during Influence other
Attitude Negative
Uninterested

PSI-CO work package 3: cross-case analysis
87
Ambivalent Rethorical support Hand-on support
Pressure Table 29. Coding scheme
After the qualitative analysis some variables were coded for quantitative analysis. In the first place, these were general variables such as gender, type of organization (local public sector, regional public sector, federal public sector, non-profit organization, business) and position of the respondent within the organization (superior, subordinate). More specific variables included the main developmental culture experienced by the respondent, and whether or not the employee evaluation of the respondent mentioned collaborative innovation in the evaluation criteria.
Furthermore the survey data were analysed. The survey included items for developmental culture, general red tape, the five main red tape dimensions, and transformational leadership. Logistic regressions were run with SPSS 25 to assess the impact of each of these variables on the organization’s continued support for the collaborative innovation project and on the perceived success of the project. These results can be found in section 2.4. earlier in the report.
3.4.3 Analysis and results
3.4.3.1 Organizational leadership
This result section opens with the leadership variable, since organizational leadership is a key variable in collaborative innovation research, and since the organization’s leadership can affect its culture as well as its structure (Lewis et al. 2014). In the following paragraphs we start with the six leadership approaches to collaborative innovation we identified in the cases studied. Next we will give some general comments on the variable evaluation meetings and performance contracts on collaborative innovation. Lastly, we offer some findings on the effects of politics on the leadership within the organizations studied. Please note that in the preliminary survey analyses (as reported in section 2.4), the perception of respondents of both the control by the higher levels of the home-organization of the actions and positions taken by the respondents in the network, as well as the extent to which the project was perceived to be a priority of the higher levels of the home-organization of the respondents, had a positive effect on the perceived innovative outcomes of the networks. Moreover the ERGM analyses showed that in many of the networks the interactions between actors in the networks (in terms of information giving outside the meetings and in terms of building upon others’ ideas inside the meetings) could be explained by both the extent of priority given by the higher levels of the home-organization to the project, as well as by the liberty as perceived by the actor to act in the interactions of the networks as they see fit. By analysing the interview data, this section helps to interpret and nuance these preliminary findings.
1. Six leadership approaches to collaborative innovation
The 110 respondents we interviewed revealed a total of six different approaches their direct supervisor had towards collaborative innovation.

PSI-CO work package 3: cross-case analysis
88
1. Negative attitude towards collaborative innovation
“There is a strong resistance indeed. People are afraid of new things. They feel like things are good the way they are (R0106).”
Various respondents report that superiors are risk-averse and feel that collaborative innovative projects are not useful, that they will not be an improvement. The respondents report that such superiors do not encourage them to take part in the project. Some of these direct supervisors have agreed to the project, however they did this for political reasons or because top-management forced the project upon the division. Although they do not motivate their subordinates to engage in the project, they do not hinder them either and allow them to invest their time and effort in it. Many of the respondents explained that they were strongly intrinsically motivated and did not report their superior’s scepticism as harmful to the project. The actors that are sceptical themselves about the project they are engaged in can “get away with minimal effort for it, protected by their superior (R0504),” however.
2. Uninterested attitude towards collaborative innovation
“My boss does not care about the project (…) he declined the project coordinator’s invitation to explain it to him. He leaves me be, when I need help I ask [different superior within the team] (R0506).”
Some respondents report that their superiors are not interested in the project. They generally find support for the project with a different co-worker in a leadership position. The respondents report that they engage in the project out of personal motivation and that the disinterest of their superior does not significantly affect them.
3. Ambivalent attitude towards collaborative innovation
“Innovation is good in some contexts, a social worker has to innovate. But some of our people do paperwork, they do not need to be innovative or creative, they just have to file those papers in
due time (R0412).”
The superior’s support for collaborative innovation within some organizations largely depends on the context. Not every job or position lends itself to an innovative approach as explained by one of our respondents. He reported that his superior supports some projects and declines others as a result.
4. Rhetorical support of collaborative innovation
“We are always on the look-out for new ideas, innovations (R0202).” – “Innovation is one of the four pillars in our mission statement (R0101).”
Most respondents reported that collaborative innovation is encouraged by their superior. They indicate that this has a positive effect on their engagement in the project they are involved in. “I know my boss cares about the project, it gives me a good feeling (…) My friend in [other organization] cannot properly fulfil her tasks for the project because her boss does not see why it is useful (R0606).” When the projects do not deliver the expected results however, respondents notice that support is not present in every aspect and often problematic when things get hard. Support for innovation is often greater in theory than in practice. “It’s negative that we have invested a lot while it is difficult to foresee what the returns for us will be (R0305).” This results in respondents being apprehensive towards collaborative innovations. If the start-up cost for an innovation appears steep, respondents will avoid the project,

PSI-CO work package 3: cross-case analysis
89
even if fostering innovation is part of the organization’s mission statement, in order to avoid failure in front of their supervisor. “In theory my boss is a big fan of anything that looks like innovation, but when it comes down to it and things go wrong then he’s not coming to project meetings and he does not help when things go awry. We had an incident last year and I had to solve the ramifications of that all on my own, the consequences are simple: next time I will not try [innovative action benefitting the project results] again. Next time I’ll play it safe (R0506).”
5. Hands-on positive attitude towards collaborative innovation
“We get special training to enhance our skills [for innovative projects] (R0604).” – “Our organization is open to failure. We really encourage our employees to take risks. Perhaps too much at times (0108).”
The second most common attitude reported was the hands-on positive attitude towards collaborative innovation. It differs from the previous category since here the respondents are also supported in practice by their superiors to engage in collaborative innovation through trainings or by receiving back-up and support in case of failure. This results in real encouragement for actors to engage in collaboration and is perceived to be the best attitude to foster innovation according to our respondents as various respondents experiencing rhetorical support point out a need for true, hands-on support.
6. Pressuring attitude towards collaborative innovation
“We have to innovate, we have no choice. They always want something new or we do not find funding (…) Not every innovation is an improvement but we have to (R0502).”
A minority of the respondents indicated a pressure or obligation to engage in (collaborative) innovation. They all reported that pressure to innovate is not beneficial since innovation is not always the best approach. Furthermore, “trying something new just to try something new (R0502)” can have perverse effects. Lastly, some projects are pushed forward without being given enough time to develop and be thought-out as a result of a pressure to innovate.
2. Evaluation meetings and performance contracts
Contrary to our expectations, we found that in very few organizations within our cases studied, either innovation or collaboration were directly or indirectly part of the respondents’ individual evaluation criteria. In the respondents’ comments on performance contracts we noted even less mention of collaborative innovation. We did see however, that whether collaborative innovation was part of the respondents’ evaluation was largely dependent on the type of organization they worked in, and the position they occupied within the organization. Across our nine cases, we interviewed 63 federal and 16 regional public servants. They generally claimed that innovation and collaboration were beyond the scope of their job assignments. Most of these respondents engaged in the collaborative innovation projects on the side and not as part of their core assignment. It was therefore often not included in their evaluation meetings with superiors.
Public servants at the local level44 generally reported that collaboration, though not innovation, was part of their evaluation criteria. All local level public organizations across our nine cases had a habit of

PSI-CO work package 3: cross-case analysis
90
collaborating with other organizations. For the majority of the respondents interviewed who worked for a non-profit organization, both collaboration and innovation were important elements of their job assignment and therefore a part of their evaluation. “Yes, [my participation in collaborative innovation is part of my evaluation] because it is an official task of mine and I am responsible for it. I was hired to do this project (R0504),” a respondent explained us. This situation where respondents’ participation in the collaborative innovation was an explicit part of their job, could not only be found among the respondents from profit and non-profit organizations, but also among the project coordinators that worked for the federal and regional government.
In total 38 of our respondents indicated that collaborative innovation was part of their evaluation criteria or performance contract. Compared to the 62 respondents for which collaborative innovation was not part of their evaluation criteria or performance contracts45, this first group reported they had more time to invest in the projects they engaged in. They also reported they had more experience with similar projects. Only one respondent out of the first group of 38 had no prior experience in similar projects in his/her current job, whereas 33 out of the 62 respondents in the second group had no experience with similar projects before. However, when asking the respondents about their engagement in the project and their motivation for the project, there was no significant difference between any of the groups. Moreover, as visible in table 30, the cases where a majority of the respondents were evaluated on their performance in the project, were not more successful than the cases where the project was part of the job evaluation of only few people.
Case Actors are evaluated based on performance in project
Success48
Case 1 > 70% of actors Failure
Case 2 > 70% of actors Success Case 3 30% - 70% of actors Success Case 4 30% - 70% of actors Success Case 5 30% - 70% of actors Success Case 6 > 70% of actors At times successful, at times
unsuccessful Case 7 < 30 % of actors Failure Case 8 < 30 % of actors Success Case 9 30% - 70% of actors Success
Table 30. Success project versus collaborative innovation as element employee evaluation
3. Transformational leadership
The survey included 6 items on transformational leadership. 75 respondents completed all six of these items. As shown in section 2.4 where we displayed the survey analysis, on the 95% confidence level (p < 0,05) there was no significant effect between transformational leadership and the organization’s continued support for collaborative innovation, nor was there a significant effect on the perceived success of the cases. This can partly be explained by the low percentage of respondents reporting transformational leadership in their organization (19%).
48 The determinant of the success of a case, in this context, is whether or not the initial goal of the project was achieved.

PSI-CO work package 3: cross-case analysis
91
4. Leadership priorities and collaborative innovation
With regard to leadership priorities in collaborative innovation projects, respondents report competing pressures between hard results and the quality of those results. “We have several aims with this project, but we prefer to [reach goal A, B and C] in a sustainable and durable way than to tick every box. (R0508),” one respondent explained his/her organization’s emphasis on quality. “They do not care about what we accomplish, they want to see it in numbers and statistics (R0608)”, another respondent pointed out the pressure to perform quantitatively. “Quality is also a type of result (R0116),” was another recurring quote, pointing out that while some superiors focus mainly on hard result, others focus on the quality or sustainability of results, and a large group focused on a combination of both. Across our nine cases we could find at least five organizations for each of these focusses. We found no effect on the success of a case based on the focus on hard results or quality of the superior involved in the case, nor did we find differences in case involvement of actors based on the focus of their superior. In the survey we gauged the degree to which a project was a priority to the leadership in general terms, there we found that the perception of the extent to which the higher levels of the organization of the respondents has a positive effect on the perception of innovation in the networks these respondents are involved in. This is explained in section 2.4. of the rapport.
5. Political influence
“There is no such thing as a-political once you reach the top administration of a federal department (R0410).”
Across our nine cases, only two cases (Sustainability program and Experts by Experience) experienced no type of effect from politics or political interference. In three cases there was political involvement in setting-up the project. “Of course [politics] played an important role! Back when we had [name removed for the purpose of anonymity] as minister or secretary of state, we had the time of our lives (R0115).” As such one respondent explained that they had a lot of leeway because they enjoyed political support at the start of the project. “I have to admit that if someone did not want to cooperate or be engaged in the project, we did make phone calls to the cabinet to ‘convince’ some partners (R0410).” In the three cases where political involvement was strong in the set-up of the projects, the respondents agreed that the political support spurred on the project significantly: “An administration will always take into account what the minister responsible for the matter thinks [about a project] (R0717).” Still, political support is not enough to guarantee the success of a case across the board since in case 01 the political support was evident, yet the case failed. And in case 05 the political interest was remarkable as indicated by the following quote: “The state secretary even attended [certain internal project meetings] and had personal conversations with several actors (R0506),” yet the project was not successful in all five cities it was piloted in. Here the project was important to the political actors in terms of positive press however.
A different form of political support is not political involvement, but to brand a project as a political priority. The two cases which were branded explicitly as a political priority resulted in a success. A third case (Sustainability program) which was not seen as a political priority, but that did suffer constant political involvement, failed in the end. “All critical thinking was discouraged, the cabinet even tried to make us say things we did not want to say (R0713).” Considering all nine cases, the data indicates that

PSI-CO work package 3: cross-case analysis
92
political support can definitely aid the set-up of a collaborative innovation project, and also affects its sustainability. “The cabinet divides the money, if you want to keep going you need them to believe in the project so they give you the money (R0601).” Furthermore, we notice that political influence can also have adverse effects on the sustainability47 of the project: “This project works very well over here. The reports show it, the numbers show it, everyone unanimously agrees. But the project is discontinued here nevertheless, and moved to the [geographic area of the responsible politician] instead, in order to score with publicity. Everyone knows it. It’s not enough to do a great job when it does not pay off in the press (R0505),” a respondent explained us, a situation confirmed by other respondents in that same case. Even though political influence can affect the set-up and the sustainability of a project, it cannot guarantee its success as indicated above by the quotes taken from case Carelab. This corresponds with the survey findings discussed in section 3.2 of this study that show that a project being a minister’s priority does not affect the innovativeness of a project either.
Please note that in the preliminary survey analyses as reported in section 2.4. both the perception of the control by the minister on the actions and positions taken in the network by the respondents, as well as the priority of the minister given to the project did not have a significant effect.
6. Conclusion
Most of the respondents in our study do not have collaboration or innovation listed as criteria in their evaluation but are intrinsically motivated to engage in projects. Six different attitudes of superiors towards collaborative innovation could be distinguished across our nine cases. The general consensus among respondents was that rhetorical support, hand’s on support and pressure to innovate fosters collaborative innovation. These three categories were also most present in successful cases. But in more risky projects where the outcomes are more uncertain or additional expertise is required, the rhetorical support is insufficient and hands-on support is required. This is an important finding to take away from this research: support for innovation has to be more than just words and mission statements. Especially the superior’s support in case of failure is considered to be of high importance for respondents to collaborate as well as they can in innovative projects. All respondents experiencing hands-on support indicated that this positively affected their engagement in the project. This is supported by the survey material in 2.4 that showed how the extent to which the project was perceived to be a priority of the higher levels of the home-organization of the respondents had a positive effect on the perceived innovative outcomes of the networks. Moreover the ERGM analyses showed that in many of the network the interactions between actors in the networks could be explained by both the extent of priority given by the higher levels of the home-organization to the project. Remarkable enough, respondents that reported a negative or uninterested attitude from their superior towards collaborative innovation did not flag this as a barrier to their motivation or involvement in the project. But they did list it as a practical barrier. Fluctuating support appeared most harmful according to our respondents since “when with every new boss the support for the project changes again, you constantly have to adapt the strategy of how to frame the project and the project partners cannot count on stability on your end (R0602).” We did not have enough data to determine which type of support is most common in which type of organization however; future studies are needed to investigate this further. In short, fluctuating support is most harmful for collaborative innovation, a negative or uninterested attitude is the second least fostering attitude for collaborative innovation, rhetorical

PSI-CO work package 3: cross-case analysis
93
support and a pressuring attitude both foster collaborative innovation but both have their risks. The higher the uncertainty or risk in projects, the more insufficient rhetorical support is because of the fear of repercussions for failure, plus a pressuring attitude can have adverse effects on some respondents. And finally: a practical supportive attitude fosters collaborative innovation the most. Two important side notes with regard to leadership are that both a superior’s support for quality and hard results can make them foster collaborative innovation and political support can play an important role in the decision to set-up and to sustain a project, but it cannot guarantee its success.
3.4.3.2 Organizational culture
As explained in the introduction, the literature distinguishes four different organizational cultures: a group culture, a developmental culture, a rational culture and an administrative culture. When describing these four cultures to the respondents during the interviews48, over 70% of them explained to us that their organization was a combination of these archetypes rather than one specific culture: “I think our culture is mainly result-oriented (rational), with some effort to put family aspects (group culture) in there as well (R0607).” They also pointed out that the culture of the organization was dependent on the nature the organization’s core assignments: “To see colleagues as friends or extended family, no. Our job is too complicated and too serious for that (R0207)”. Respondents working in the social sector were more likely to report a group culture.
Figure 6. Organizational culture per type of organization
As displayed in figure 6, there are notable differences across the different organizations in terms of organizational culture. A hierarchical culture is dominant in the regional (69%) and federal (51%) public sector, but not in the local (22%) or non-profit (7%) sector of the organizations involved in our cases. In both the local (50%) and the non-profit (40%) sector, a group culture or family culture is reported to be most dominant. Across the four sectors, a rational culture is most prevalent in the federal public sector

PSI-CO work package 3: cross-case analysis
94
(28%) and a developmental culture is reported to be most often dominant in the non-profit sector (20%).
When we look at the effects the type of organizational culture has on the continued support respondents believe their organization has for the collaborative innovation they are involved in, there are notable differences between cultures as well. 93 respondents replied to our survey question about whether or not the project could count on the continued support of their organization. 65 of them reported the organizational support for the project was high (70%), 17 of them reported it was medium (18%) and 11 of them replied that it was low (11%). Compared to the proportions in the group containing all the respondents, we see that the administrative culture is overrepresented in the group of respondents that claimed their organization only has low to medium support for the project. Similarly, it is apparent that the rational culture is underrepresented in the low to medium support category when comparing it to the culture’s prevalence in the group containing all the respondents. The next paragraphs offer some in depth insights that can explain this phenomenon.
Figure 7. Organizational support per type of organization
1. Group culture
“Colleagues feel like family here (R0306).”
The 15 respondents that reported group culture to be the dominant culture in their organization often came from relatively small organizations or small organizational divisions, where everyone knew one another and there was a warm atmosphere among colleagues. The organizational focus was internal (own functions) rather than external (client-based) and the roles, rules and responsibilities were experienced as flexible and dependent on the context. Respondents reported a general flexibility to engage in collaborative innovation, and also a safety net in case of project failure. “If something goes wrong my superior won’t come to me with a stern speech saying I did not reach the right results, instead she will comfort me and try to make me feel better. We find solutions together (R0610)”. Similar anecdotes from other respondents similarly stressed the organization’s flexibility on one hand, and the compassion for failure on the other. They describe it as a good environment to innovate.
2. Hierarchical culture
“We have an administrative core, because of the organization’s tasks. Bottom line: what we deliver has to work (R0607).” – “The organization is a cumbersome structure with many little rules (R0306).”
Most respondents across our nine cases described their organizational culture as mainly administrative or hierarchical, recognized by an inward focus (rather than client-based), and a strong emphasis on

PSI-CO work package 3: cross-case analysis
95
control. “Adherence to the rules and procedures is more important than doing our job well and achieving things (R0102),” multiple respondents explained. The fact that the culture has an internal focus did not hamper collaborative innovation according to our respondents, since most organizations collaborated often with other organizations. Yet the emphasis on procedures and control was generally reported to make radical innovation difficult and to slow down incremental innovation.
3. Developmental culture
“We have a general culture where we think: alright, we have not done that yet, perhaps we can try it (R0108).”
Only eight respondents in our study deemed a developmental culture to be the dominant one in their organization. Since a couple of those respondents came from the same organization, a total of four organizations across nine cases were considered to have a developmental culture. Each of these organizations was described to be flexible and externally oriented; fostering growth, creativity, new ideas and out-of-the-box thinking. These organizations had innovation explicitly mentioned in their mission statement as well and engaged in numerous innovative collaborations. In general, the involved respondents described the culture as a very nurturing environment for collaborative innovation, although one respondent commented that “since the pressure to innovate was so present, innovation did not feel special and precious anymore (R0502),” that could diminish motivation and enthusiasm and create a pressure in the respondent’s opinion.
4. Rational culture
“Productivity, results, and a clear focus on the tasks at hand [are most important in my organization] (R0206).”
About a fourth of our respondents (26%) deemed their organization to be mostly rational in terms of culture. This culture is client oriented and result oriented and has therefore an external focus. Furthermore, this culture is characterized by strict procedures and an emphasis on control and doing things according to a certain code and protocol. The respondents indicated that this culture has an ambivalent relationship with collaborative innovation. When suggested projects fit the goals and objectives of the organization, these projects are generally welcomed. But when the start-up costs of engaging in a project appears to be too steep, the project results are uncertain, or the project does not help fulfil the core objectives or the organization, projects are declined. “It’s negative that we have invested a lot while it is difficult to foresee what the returns for us will be (R0305),” a respondent in a rational culture stressed the emphasis on results. “[Municipality A] was our first choice as a partner in this collaboration, but [societal problem A] was not deemed a priority there. It was in the other municipalities we approached, they dared to take a chance (R0504)”, another respondent contributed when explaining that some organizations want “to take a chance on something that could help society (R0504),” while others need a clear-cut plan with a clear-cut SWOT analysis, even though not all advantages and gains can fit a traditional SWOT analysis.

PSI-CO work package 3: cross-case analysis
96
5. A nuanced conclusion
Based on the interview data, both a developmental culture and a group culture appeared to be very nurturing environments for engagement in collaborative innovation and the success of such projects. Yet on a (project) network level, the proportion of organizations with a group culture or developmental culture turned out not to be a good predictor of project success. Projects where almost all organizations involved had a dominantly administrative culture generally succeeded better in achieving their innovation goals and collaborating together than projects partially composed of organizations with a developmental culture, and organizations with a group or developmental culture. This is supported by the findings of the preliminary survey analysis49 as reported in section 2.4. where we discovered that respondents who perceive the developmental organizational culture of their home-organization to be high, have a more positive perception of the innovative outcomes achieved by the network in which they are active.
In collaborations the schism between control-based organizations and flexible organizations appeared to be difficult to overcome. “They do not understand that we cannot just snap our finger and make it work, we have rules to abide by (R0412),” one respondent pointed out the difficulties of making a flexible organization understand that a control-based organization cannot achieve the same things in the same way. “I didn’t understand [the way of working of the other organization] (…) I was disappointed (…). When you have so many different partners around the table and (…) we still have not found what we were looking for [I get frustrated]. I think that it took very long to come to anything concrete (R0106),” a respondent from a flexible organization expressed frustration with the ‘slow and inefficient’ way of working with control-based organizations as partners. The conclusion therefore is that while some cultures may foster collaborative innovation better than others, within a project the organizational cultures themselves are not most important, but the fact that across the project most organizations are either all control-oriented, or all flexible appears to affect collaborative innovation most. The other value tension among cultures, the difference between internally or externally oriented cultures appeared to have no effect based on our interview data. A group culture and a developmental culture both foster collaborative innovation in our eight cases.
3.4.3.3. Red tape
The third and final variable we will discuss on the organizational level is red tape. As explained in the introduction, red tape are rules and procedures that negatively affect performance (Bozeman, 1993). Pandey and others (2007) have distinguished five different kinds of red tape in their research: personnel, budget, procurement, communication and information red tape. Our respondents reported all of these categories of red tape, and two additional ones: collaboration red tape in the organization and control/registration red tape in the organization. In the next paragraphs we explain more about the occurrence of these red tape dimensions in the organizations involved in our cases, and the effects thereof. Before we delve into that however, we offer some data on the prevalence of red tape per type of organization. We also briefly touch upon effects of gender and position on the red tape experience of respondents.
I. General findings
93 respondents replied to the survey questions about red tape in their organization. 40 of these (43%) reported high levels of red tape in their organization50, 22 (24%) reported medium levels and 31 (33%)

PSI-CO work package 3: cross-case analysis
97
reported low levels of red tape. When comparing the proportion of organizational types among all respondents and the proportion among the group that reports high levels of red tape only two types of organizations differ. The Cramer’s V value for this difference is 0,11 for the federal public sector, and 0,46 for the local public sector. The effect of being a federal public sector organization on red tape levels is thus considered weak, the effect of being a local public organization very strong.
Figure 8. Type of respondents
We also find that actors in a superior position experience less red tape than actors in a subordinate position. This is displayed in the figure below as it shows that subordinates are overrepresented in the “high red tape” category compared to the group containing all respondents.
Figure 9. Red tape Subordinates and superiors
Lastly, there is a big gender difference in red tape experience. Among all respondents that answered the red tape questions, 48% were men. In the group of respondents reporting high levels of red tape, only 28% are men.
Figure 10. Gender

PSI-CO work package 3: cross-case analysis
98
When conducting interviews, not all respondents reported organizational red tape, and when they did only few respondents mentioned more than two red tape dimensions. The red tape dimension most often mentioned (42 times) was personnel red tape. These are rules and procedures concerning human resources, that govern how people can be rewarded or promoted, and how people get paid. Most respondents indicated that personnel red tape had mostly psychological effects on them. “Some projects require me to put in 14 work hours a day, yet the system only allows me to work 10 hours a day. Those four extra hours are not reimbursed and cannot be compensated later on (…) of course that frustrates me (R0116).” The fact that personnel red tape makes it difficult to reward innovative/collaborative behaviour and that it hampers a flexible way of dealings with personnel rules, hampers collaborative innovation52.
I. Budget red tape
This red tape dimension concerns the rules and procedures with regard to altering project budgets and redistributing funds within an organization. The main concern of respondents with regard to this dimension is that government budgets are very rigid. When projects have to deal with an unexpected overrun of costs, or when a slight increase in budget could lead to a great increase in the results, this is often not possible. Especially at the federal level some organizations experience that much budget red tape that the impact on the organization’s functioning cannot be underestimated. “My colleague said that next time we have [common problem in specific domain], they will discover that our equipment is so worn-out that we cannot respond, regardless of the gravity of the situation or the urgency (R0207),” a respondent explained. Off the record another respondent explained to us that the effect hereof is that civil servants misrepresent their required budget, hoping to receive some spare money to fix other alarming deficits in the field. More flexibility in the budgets, especially at the federal level would greatly benefit collaborative innovation projects is the consensus among respondents.
II. Procurement red tape
The rules and procedures governing the procurement of vital goods and services for a project that hamper the performance, are called procurement red tape. This is a common red tape dimension in all government organizations. “The moment you want to buy something you get stuck in an endless storm of paperwork. You need to prove everything (R0115),” was a sentiment that recurred quite often. “I have spent hours and hours trying to get 250 euro back that I pre-financed myself because I could not wait for all the paperwork to come through. In the end my boss had to make phone calls in order for me to get my own money back (…). Next year I won’t do that anymore, even if the project needs it (R0506).” Rigid procurement rules hamper actors from making expenses required to make a project run smoothly. They make actors more risk aversive which forms a barrier to the success of projects.
III. Communication and information red tape
Communication and information red tape are burdensome rules concerning the communication or information transmission within an organization or between the organization and the outside world. This dimension was not so prevalent according to the actors we interviewed. Most of such rules had to do with privacy and confidentiality and their usefulness was clear to the actors involved, therefore they did not consider the rules burdensome or red tape. One respondent at the federal level did experience such rules however: “I cannot even talk to the cabinet myself. Sometimes deadlines are so short and I need permission from the cabinet to make certain decision on very short notice, yet I cannot call or

PSI-CO work package 3: cross-case analysis
99
even email them myself, I am not allowed. Thus when my boss is on holiday, or ill, I cannot do anything for the project (R0810),” the respondent explained. Such situations are psychologically demotivating and clearly hamper collaboration as well as the flexibility required to innovate.
IV. Collaboration red tape
Collaboration is not defined in the literature. We discovered however that same quotes did not fit the current red tape dimensions in the literature and thus created a new one. Collaboration red tape is organizational red tape that is specifically hindering respondents to collaborate as efficiently as possible or to engage in collaborations. “We cannot choose our own partners in a collaboration and we cannot change partners once the project has started (R0503),” one of the respondents explained. “If a partner is doing a terrible job we can either kick them out and lose the project and our funding, or we can keep them on. Similarly, we cannot redirect the project to something better if the initial plan is not working. We get permission to execute a certain proposal so we either execute the proposal or we stop a project, no improvements or changes possible (R0503),” they continued. This type of red tape is not described in the literature but does not fit any of the currently existing categories. We call this new category collaboration red tape. It hampers projects from being adjusted and it hampers flexibility in partners which negatively affect both the innovative character of projects, and the freedom to select the best partners for collaboration.
V. Verification/registration red tape
The last red tape dimension we discovered analysing the interview transcripts is validation or registration red tape, another dimension currently unmentioned in the literature as a separate dimension. “So many rules, we have to register everything, really everything! (R0101)” – “Some people have the feeling that they come to work to work, and not in order to full in ten different forms before they even come in contact with our [clients] (R0106). This specific red tape cannot be reduced to any of the previously mentioned dimensions since it mostly includes rules and procedures meant to control the day to day activities of employees. They have to register their activities with clients for example, which is not personnel red tape since it has nothing to do with hiring, firing or rewarding employees. This new dimension causes many operational issues such as extensive paperwork, delays and diminished efficiency. But respondents also report motivational consequences “I really have enough of it some days. Then I am sick and tired of it all (R0411),” respondents explain.
VI. Flexibility
Not all respondents suffer from burdensome rules and procedures however. “It is all a matter of attitude (R0412),” a respondent argued. “There are many rules but a creative person can get quite far with them even given the limits,” they added. “Yes, there are many rules. But rules are normal, rules make this place run well (R0410),” another actor agreed. This reinforces the fact that red tape is to a large extent about perception, and not just about an objective reality.
VII. Conclusion
A first conclusion based on our nine cases is that the red tape experience of actors is dependent on their type of organization, their position within the organization, and their gender. Furthermore, we found that there are more red tape dimensions than currently described in the literature. Two additional dimensions we have found are registration/validation red tape and collaboration red tape.

PSI-CO work package 3: cross-case analysis
100
Thirdly we note that the different red tape dimensions have different effects on actors. Registration/validation red tape mainly leads to actors feeling less trusted, along with personnel red tape it mostly has psychological effects on actors. Budget, communication and information red tape appear to have less psychological effects and mainly operational effects such as delays, lower efficiency, decreased effectiveness and more paperwork. Through these operational and psychological effects collaborative innovation is indirectly affected. A decrease in motivation can be a barrier for actors to fully engage in a project, and delays and excessive paperwork can slow projects down and make them less efficient. The two red tape dimensions that appear to affect collaborative innovation in the most direct way are collaboration red tape and procurement red tape. Collaboration red tape mainly forms a barrier when project aims cannot be redirected and partner cannot be chosen or changed while procurement red tape can hamper, stop or discourage actors from procuring goods and services required for a project.
3.4.4 Discussion: how the three main variables interact with each other
Studying the three variables that made up our organizational conditions for collaborative innovation, the general conclusion we can make is that all three variables are connected and affect one another.
The first connection we found was the one between red tape and organizational culture. Both the organizational cultures on the flexible side of the competing values model were linked by respondents to experiencing low levels of red tape. This is unsurprising since it is normal for a strong control-based organization to have more rules and procedures than a flexible organization. And with more rules and procedures in general, the chance of actors experiencing burdensome rules and procedures increases.
Among the two control-based organizational cultures, we noted a difference between the internally focussed and the externally focused one. Respondents in a rational culture reported rather medium levels of red tape while actors that worked in a hierarchical culture reported most different red tape dimensions and more red tape in general than other respondents. This difference can be explained since in a rational culture there is still a strong emphasis on results and efficiency.
Another connection we found between organizational culture and red tape could be linked to individual characteristics. Based on the interview data we noted that respondents who felt comfortable in a very structured and regulated environment were more likely to opt for a job in a hierarchical organization. One of our respondents also suggested that there is a vicious circle where risk-aversive and conservative individuals are attracted to strongly hierarchical organizations where they in turn create more rules and procedures that in turn attract more risk-averse co-workers. This respondent also pointed out that such an environment can even make more creative and innovative co-workers leave.
We saw the opposite was also true in group and developmental culture. Very flexible and innovative organizations tend to attract more flexible, creative and innovative people who prefer a flexible work environment over a very structured and regulated one. When the superior has a strongly innovative mind-set we noted that they greatly appreciated this quality in subordinates too. It can be therefore assumed that these qualities play a role in their decision to hire some people over others. And just as with the risk-averse public servants that admit they create more rules and more structure, the public servants with a strong belief that flexibility is the way to go try to limit or circumvent existing rules and

PSI-CO work package 3: cross-case analysis
101
procedures in turn. We assume that less rules and procedures in general also diminished the burdensome rules and procedures.
Between red tape and leadership, we also discovered some notable connections. Respondents in a superior position experienced lower levels of red tape, and respondents that had a good relationship with their superior enjoyed lower levels of red tape as well, by extension. In a way, superiors generally find more ways to circumvent or ignore burdensome rules and procedures and can give their subordinates implicit or even explicit permission to do the same. Furthermore, respondents experiencing a “hands-on positive attitude towards collaborative innovation” and a “pressuring attitude towards collaborative innovation” also discovered lower levels of red tape within their organization. This can be explained because superiors that are strong proponents of collaborative innovation are often more on the look-out for potential barriers to projects or projects within projects. In one of our cases we had the example of a respondent not getting her own money back for a product investment in a project, and since her boss deemed it important that the respondent stayed motivated and the project did not suffer because of the procurement red tape, he made a few phone calls and personally intervened to diminish the effects of the red tape. This is a difference we see between the rhetorical support for collaborative innovation, and the hands-on support.
Lastly, we found a connection between leadership attitudes and organizational culture. Respondents experiencing a “hands-on positive attitude towards collaborative innovation” more often named either a developmental culture or a family culture as the dominant culture in their organization. Actors reporting a “pressuring attitude towards collaborative innovation” were most likely to report a developmental culture in their organization. And a superior’s “negative attitude towards collaborative innovation” was most often connected to an administrative organizational culture. These findings can also be linked to the red tape variable and show how all three variables are connected. Organizations that are very hierarchical and risk aversive often have many regulations and procedures to limit risk and prescribe a certain way of working. Innovative, out-of-the-box thinking does not fit in this very inflexible and controlled environment. Actors choosing to work a great proportion of their professional life in such an hierarchical organization and eventually climb up to a leadership position often appreciate this type of environment and are not the most creative and risk-taking people in general. Therefore, it does not come as a surprise that they are not the superiors pressing for collaborative innovation, but are rather sceptical to neutral. Superiors with a hands-on positive attitude towards collaborative innovation or superiors pressuring attitude towards collaborative innovation were mostly reported in a developmental culture or a family culture which makes sense following the same logic. Based on the interviews we conducted it was also evident that most of those superiors believe in flexibility and a less control-based approach. Since they often do not appreciate a complicated web of rules and procedures themselves, they try to limit it in their organization. Based on this information we see that leadership appears to affect both the organization’s culture and its degree of red tape, while different degrees of red tape help shape organizational culture and attract or deter certain superiors. Lastly organizational culture in turn affects the degree of red tape in an organization and also attracts and deters certain superiors. And with that our variables all affect one another, creating four different potential contexts that affect collaborative innovation in different ways.

PSI-CO work package 3: cross-case analysis
102
4 Conclusion: conditions for collaborative innovation The role of collaborative networks in finding innovative solutions to complex problems is established in the scientific literature. Collaboration is “the process through which two or more actors engage in a constructive management of differences in order to define common problems and develop joint solutions based on provisional agreements that may coexist with disagreement and dissent” (Gray 1989 in Hartley 2013). Collaborative processes give pluralist framings of the problem, many different ideas for solutions (search for “new ways”). The principal idea of the collaborative innovation process is to open the innovation process for a large group of actors so external ideas are included in the process and existing views are challenged. Collaborative innovations should then involve final users and street level bureaucrats in the logic of building networks and learning organizations.
“Although collaborative innovation carries an unrealized potential for creating new public policies and service, it is not an institutional strategy that works in all contexts“ (Hartley 2013). Through the analysis of the case studies, we attempt to identify which elements of the context are favorable or unfavorable to collaborative innovation. In this concluding section we bring together the main conclusions and findings. The lessons and recommendations which we formulate on the basis of these findings are to be found in the draft policy letter (D.3.6).
Collaborative innovation
Innovation in this research is defined as “an intentional and proactive process that involves the generation, practical adoption and spread of new and creative ideas, which aim to produce a qualitative change in a specific context” (Sørensen and Torfing,2012) . Collaborative innovation is then to be understood as “a collaborative approach to innovation and problem solving in the public sector that relies on harnessing the resources and the creativity of external networks and communities (including citizen networks as well as networks of nonprofits and private corporations) to amplify or enhance the innovation speed as well as the range and quality of innovation outcomes“(Nambisan, 2008: 11).
The process of collaborative innovation involves three generative mechanisms, being synergy, learning and commitment. Synergy is “the power to combine the perspectives, resources, and skills of a group of people and organizations.” (Lasker et al, 2001). It is the proximal outcome of partnership functioning which makes synergy a unique advantage of collaboration. Since we look at collaborative innovation, the question if complementary resources are brought together is essential (Ansell & Torfing, 2014; Sørensen & Torfing, 2011). Synergy is the mechanism where the innovation assets are mobilized at the start of the process. These innovation assets can be found on the organizational and individual level. Koppenjan and Klijn (2010) identify different types of resources that an actor is able to add to a network: financial resources, production resources, competencies, knowledge and legitimacy.
Purely bringing actors together, however, does not lead to innovation. As developed further in the section on individual conditions, transformative learning needs to occur. This is the second mechanisms that brings collaborative innovation. It means that something has to happen when complementary resources are brought in. A cognitive change occurs as a result of interaction with other stakeholders. Interacting with people with different insights or knowledge spurs on the generating of new ideas (Ansell & Torfing, 2014). This is why Meijer (2014) defines innovation as: “a learning process in which governments attempt to meet specific societal challenges.”
Nonetheless, a mere understanding through learning does not create a tangible innovation. Therefore, commitment and joint ownership of the collaborative process and its product is necessary to turn ideas into innovations. This is the third mechanism.

PSI-CO work package 3: cross-case analysis
103
Moreover, literature (e.g. Gieske, Van Buuren and Bekkers, 2016) suggests that successful collaborative innovation is depending upon the interplay of conditions at the level of the collaborative governance arrangement (network-level conditions), the level of the individual actors active in the arrangement (individual-level conditions), and the level of the home-organizations of the individual actors in the arrangements (organization-level conditions).
At the level of the network, the structural aspects of the network like the intensity and kind of interactions as well as the position of the different actors and the coordinator are important. The innovative outcomes are assumed to be strongly influenced by the actors’ perceptions of the quality of the process and of the institutional relations. Process and institutional quality are two of the criteria (next to content outcomes) for assessing the outcomes of a network (Koppenjan and Klijn,2010). By content outcomes, we mean the perceived level of innovative outcomes of the process. Process quality refers to evaluation by actors of the interactions between the different actors in the collaborative arrangement. Important to note is that process quality thus does not refer to the achieved results concerning the content, but to the evaluation of the interaction process of the network. Institutional quality is the ‘solidified history’ expressed in rules, more or less stable patterns of interactions and relationships of trust among actors.
The coordinator of the network (called ‘metagovernor’ in the scientific literature) can create, manage and sustain the collaborative governance arrangements and organize the process in order to enhance innovative dynamics. This is done by applying sets of metagovernance strategies, like arranging structures for interaction, consultation and deliberation; designing process rules; exploring content; and connecting actors.
At the level of the individual actors involved in the collaborative arrangement, there are several conditions that shape the attitude, skills and incentives for these individual actors to engage in the collaborative innovation process and in transformational learning. Individual capacity to innovate in collaborative arrangement relies on the individual ability to learn. This capacity depends on individuals’ characteristics such as personality traits, their position within the network, and their perception about the quality of the relationships, i.e. trust. However, as theory suggests, individuals are constrained or stimulated in their behavior by organizational-level factors such as the organizational culture, leadership and red tape in their home-organization and the extent to which this home-organization controls or supports the activities of the networks.
In preliminary regression analyses of the survey data (see section 2.4) , we found that the perception of the innovative outcomes is explained by a combination of network-level, individual-level and organization-level variables. For example, the perceived level of synergy at the level of the network and the trust propensity of the individual respondent can explain about 39% of the variance in perceived innovation. Similarly, the perceived extent of applied metagovernance strategies within the network, together with the extent to which the project is a priority of the higher levels in the home-organization of the individual actor, explains up to 40% of the variance. Thus, it is important to examine all of these levels, but also to look how these levels reinforce each other.
Conditions on the network level When looking at the network level only, the preliminary regression analyses showed that four network-level conditions partially explain the innovative outcomes as perceived by the respondents. These are the extent to which synergy is achieved in the network and the extent of differences in opinion at the start of the collaborative innovation process are large, the applied metagovernance strategies, or whether the respondent is the coordinator or not. Combining the variables at different levels, positive

PSI-CO work package 3: cross-case analysis
104
evaluation of collaborative innovation occurs particularly when respondents note extensive application of metagovernance strategies, achievement of synergy at the network level, and high levels of trust propensity at the individual level. Likewise the extent to which an actor acts as a coordinator and the extent to which the collaborative innovation project is a priority of higher levels of the home-organization yield positive perceptions of the achieved innovative outcomes in the network. The priority of the higher levels of the home-organization can be interpreted as a sign of commitment, as a sign of the home-organization being more concerned about a successful outcome.
Thus, we see that collaborative innovation indeed occurs because of the three generative mechanisms of synergy, learning, and commitment. We discuss synergy and commitment in this part of the policy brief. Since learning is a much influenced by individual conditions, it is discussed in the ‘individual conditions’ section of this policy brief.
Synergy and commitment for innovation in the collaborative governance arrangements
As mentioned, synergy refers to “the power to combine the perspectives, resources, and skills of a groups of people and organizations” (Lasker et al, 2001). Different perspectives can be established by adding actors with different backgrounds to the collaborative governance arrangement. Their difference in opinion at the start of the process is a part of synergy.
We observe a diversity of actors in collaborative networks. Seven out of nine cases have actors from more than one governmental level. Three cases included citizens, four cases included private actors, three cases non-profit organizations and lastly three cases had the involvement of interest groups. The metagovernor is in almost all cases considered as being the most important actor, because he/she coordinates the project. Next, the involvement of different perspectives is regarded as being beneficial for the innovative outcomes. Yet the perceptions should not be too different from each other: a risk exists that actors do not understand each other because they have different expertise. Also, differences of opinion can cause deadlocks in the process, because actors cannot agree upon issues. The metagovernor should be aware of this and anticipate on this to make sure the differences of opinion deepen the discussions, and do not frustrate them.
Concerning the involvement of different perspectives, it is important to look at the way actors are included in the project. To what extent actors know each other is important. Not being familiar with each other allows actors to break out of the ‘groupthink’ that closed networks can have (Lewis and Ricard, 2014). This is also referred to as ‘the strength of weak ties’ (Granovetter, 1983). Having strong ties with each other can create group thinking and exclude relevant actors which might be detrimental for the innovation process. However, strong ties can also be seen as necessary for innovation, especially because they can establish and foster trust-building in the network (Klijn and Koppenjan, 2010). Actors have to share information without knowing beforehand what the outcome of the process will be. It is virtually impossible to have built-in guarantees against opportunistic behavior since no one knows what kind of opportunistic behavior can be expected. Trust can facilitate innovation since it reduces such uncertainties. In the creation of networks, we see three general tendencies: (a) The network of actors is new and specifically created to work on an innovation; (b) the network of actors already exists and people are used to working together ("we got along well, we worked together regularly and it worked well"); (c) a small core group already exists and then creates a larger network to work on a specific

PSI-CO work package 3: cross-case analysis
105
topic. Respondents generally argued that getting to know, or already knowing, the involved actors was beneficial for the process and that it facilitated smoother interactions. However, there should be room to invite additional actors when necessary, in order to include different perspectives. If so, attention should be paid to trust-building.
Next, we found that the amount of synergy (especially concerning expertise and differences of opinion) is associated with the way in which decisions (one-way consultation versus joint decision making) are made in the network or collaborative governance arrangement. We see that synergy was evaluated highest in cases where decisions were made collectively and in cases that were not fully driven by one or multiple coordinators. These are the cases where no clear, precise goal about what the innovation needs to be or how it should look like is formulated upfront. There are two different dynamics present in the cases: having a clear goal upfront or, in contrast, holding a desire to innovate in order to solve a problem yet without precisely knowing what exactly the innovation ought to be or how it should look like. A project with a clear goal formulated upfront tends to consist of actors that are able to get ‘things done’; to reach the end goal. A project with no definite goal tends to consists of actors that think along, that seek to define the problem that needs to be solved and seek to agree upon the goals about what the innovation should be. If precise goals are defined already before the network interactions started it is less obvious that decisions are made with the input of all the actors, which potentially leads to a loss of synergy or optimal use of the different expertise and opinions of involved actors.
Commitment refers to the joint ownership of the innovation; the feeling that actor they are all responsible for the innovation. This entails factors such as the extent to which actors are committed to invest resources in the process, results are aligned with their core beliefs, and they participate in managing the diffusion of the innovation. With respect to financial means as one kind of resource, the majority of the innovative projects studied were started by the organization/organizations that also provided the budget. Therefore, in order to ensure extra funds to secure the financial aspect of the innovation, it was not necessary to actively search for input from other organizations. A distribution key was made in projects where not one specific organization was responsible for the finances. In none of the cases coordinators actively had to look for sponsors. The financial input of organizations was often very clear in projects where organizations were obliged to participate because of formal guidelines or their legal mandate. Thus, financial matters were never a point of discussion in the networks. Furthermore, financial means were made available by the coordinator in the projects that had a highly voluntary character for the participants. Here, because of the voluntary nature, actors did not want to invest financial resources on their own, or simply did not have them. Thus financial commitment is generally lower in cases that are highly voluntary. The implementation of these projects is thus highly dependent on the metagovernor and his/her financial resources. As most of the collaborative innovation initiatives are initiated and coordinated by Federal or regional public organizations, it is hence important that the availability of financial resources is given sufficient attention, a point also raised in the recommendations.
We found that the extent to which the collaborative innovation project is a priority for the higher levels of the home organization yields positive perceptions of the achieved innovative outcomes in the network. We argue that the prioritization by the home organization of the innovation is a form of commitment. Actors feel that the prioritizing by the home organization contributes to the innovative output of the project, making it more feasible to implement and disseminate the innovation, since the network feels it can count of the support of the home organizations.

PSI-CO work package 3: cross-case analysis
106
The occurrence of these generative mechanisms of innovation are related to a good process quality and institutional quality. As mentioned, the process quality refers to the evaluation by actors of the interactions between the different actors in the collaborative arrangements. We looked at the satisfaction with the process and the occurrence of deadlocks (difficulties that hinder the process). We found that several deadlocks occurred in the projects:
x Higher political bodies that did not support the innovation and blocked the implementation (institutional cause)
x Deadlocks concerning interactions, especially difficulties in understanding each other because of a French/Dutch language barrier (institutional cause)
x Disagreements related to the coordination, task division or pace during the process (management cause)
Especially concerning this last deadlock, we found that having the feeling of making no progress, is very disadvantageous for the motivation of the actors. Cases with ‘quick wins’, for example by setting milestones, were evaluated positively on the quality of the process. It keeps actors motivated and keeps the process going which is essential. Similar, pilot projects are seen as an effective way to gain these quick wins and also to receive quick feedback from the field. The development of a measurement tool for the outcomes of the innovation can contribute to this.
Some actors argue that they had to do more than they initially thought which caused dissatisfaction about the process quality. The deadlocks do oftentimes not lead to a lower average evaluation of the process quality, but we see that cases characterized by deadlocks have a higher standard deviation. This can mean that less consensus on the process quality is present. This might indicate that deadlocks were perceived differently by the actors in the case. Some might see the deadlocks as very harmful for the process for example because they were involved in the deadlocks, while other actors might not perceive the deadlocks as being harmful because they are not affected by it.
The cases are in general highly evaluated on the institutional quality, indicating that relations have been improved over the course of the projects and new relations have been built fostering future cooperation. Projects in which actors were positive about the collaboration in the interviews generally also have a higher evaluation of the institutional quality. Some actors mention that relationships were developed that were also useful outside the project. People got to know each other through the project, and this is also beneficial for extending their own personal network. They can easier reach out to others even if this is not related to the project.
Interactions within the collaborative governance arrangements
We examined what drives the interactions between actors in the collaborative arrangements in terms of ‘information giving outside meetings’ and ‘elaboration upon other’s ideas inside meetings’. We see especially the tendency to exchange information when priority from the higher levels of the home organizations is present. The regression analyses also showed that the priority of the higher levels of the home-organization in combination of being a coordinator is positively related to the innovative outcomes. Similarly, we also found that the priority of the higher levels of the home-organizations and being a coordinator is also a strong indicator for the interactions in the network. This is especially observable regarding interactions in terms of ‘elaboration upon other’s ideas inside meetings’. People are more likely to interact with each other when the innovation is a priority for their home organization and when they are a coordinator. Liberty to act as you want and reciprocity (‘I interact with you,

PSI-CO work package 3: cross-case analysis
107
because you interact with me’) are factors fostering interactions in terms of giving information outside meetings, and to a lesser extent in terms of ‘elaboration upon other’s ideas inside meetings’. Thus, the tenedency to interact with other actors is highly influenced by the home organization of the resprentative.
A central element in the success or failure of the innovative process seems to be related to the skills and competences of the metagovernor. We often notice that the metagovernor is part of different cliques (subgroups in the network that frequently interact with each other), indicating that he/she is at the heart of the network he/she coordinates. By contrast, one of our failed case studies shows an isolated metagovernor. Where the metagovernor is strongly involved, he/she is also most involved in these cliques.
The cases that scored low on innovative outcomes, generally also consisted of a network characterized by low density. Density is a measure of the existing connections or interactions between the actors divided by the total amount of possible connections. Actors in successful cases are in general more connected to each other in terms of information giving outside meetings and in terms of building upon others’ ideas outside meetings. This is a clear indicator that being connected to each other is beneficial for the innovative outcomes.
Metagovernance strategies
Regression analyses showed that respondents who perceive the amount and level of applied metagovernance strategies to be high, also perceive the innovative outcomes of the networks in which they are active as high. The case studies and analysis of interview data showed that the strategies which the metagovernor can apply are very much context dependent, but there are some general observations that can be made. In the cross-case analysis we see that cases in which metagovernance strategies were evaluated as highest were also the cases with the highest innovative outcomes, indicating that assessment of metagovernance as succesful is related to higher perceived innovative outcomes.
We evaluated the strategies that the metagovernor can apply in terms of four different strategies (Klijn et al., 2010; Koppenjan and Klijn 2016):
x Introducing process rules. These include rules for entrance into or exit from the process, conflict regulating rules, rules that specify the interests of actors or veto possibilities, rules that inform actors about the availability of information about decision-making moments, etc. Actors claim in all cases that there were few formal rules to manage the networks. They often cannot recall any measures that were taken and almost all actors claim that decisions were based on consensus. However, in practice, decisions were sometimes highly influenced by the metagovernor after only a short consultation with the other actors. We see that the case where this happened scores lower on the item that measured whether or not something was done with the actor’s input. This does not mean that one method is better than the other, but that decisions are more often made based on ‘decision-making after consultation of actors’ instead of actual joint decision making.
x Arranging structures for interaction, consultation and deliberation. This includes the creating of new ad hoc organizational arrangements (boards, project organizations, etc.). The creation of innovation networks is different in every case, but we found that the networks are usually created by a single actor or a small core group of actors who initiate the project and subsequently also acted as the metagovernor(s) of the project. The metagovernor is often the

PSI-CO work package 3: cross-case analysis
108
starting point for the creation of the network specific for the innovation. Networks are often created based on the own (professional) networks of the metagovernor. This own network of the metagovernor was important to determine who to invite to the network.
x Exploring content. This includes: searching for goal congruency, creating variation in solutions, influencing (and explicating) perceptions, managing and collecting information and research, creating variation through creative competition. A main strategy concerning the establishment of synergy is the establishment of different subgroups. We found that establishing different subgroups is beneficial for the process, because the relevant actors are placed together. Working in small groups is appreciated by most of the stakeholders we met, because interactions become easier and only relevant actors were present that were able to deepen the discussions. They generally support the results of the innovative process in which they took part. Next, a strategy that was considered as very positively by the respondents is the creation of a measurement tool. This was developed in two cases and it allowed the involved actors to know what works and what does not. Since an innovation is often a process of trial and error, this is experienced as a good way to objectively measure the results of its implementation.
x Connecting strategies: This includes: selective (de)activation of actors, resource mobilizing, initiating new series of interactions, coalition building, mediation, appointment of process managers, removing obstacles to co-operation, creating incentives for co-operation. Different measures were taken to come to a process which was as smooth as possible. Milestones seem to be an important tool to keep actors motivated. The interviews showed that people got motivated by early success and that cases without implementation led to frustration, because nothing happened. Implementation gives the actors a feelings that they are going somewhere. This is also a strategy that was applied in two cases when a deadlock occurred. Furthermore, we found that the cases with intensive interactions between the participating actors (in terms of information giving and in terms of building upon others’ ideas) score high on the connecting strategy. Thus there is a strong indication that intensively used connecting strategies lead to more dense networks, resulting in a more positive perception of the innovative outcomes.
Conditions on the individual level
The individual capacity to innovate in collaborative arrangement relies on the individual ability to learn. It is through the continuous process of absorbing new knowledge that people generate new solutions and build joint action (Klijn & Koppenjean, 2016, Gieske et al., 2016). How and under which conditions individuals learn is therefore a major condition for innovation to succeed (Sørensen & Torfing, 2017). In the context of collaborative innovation three types of learning are particularly relevant: policy learning—learning about the content—, relational learning—learning about the interest and resources of the actors—and political learning (May, 1992; Klijn & Koppenjan, 2016). Policy learning ensures that the solution designed is based on scientific insights and is not merely the product of interests disconnected from the reality (Klijn & Koppenjean, 2016). Relational learning is important for the development of shared goals: it is by understanding others’ needs and capacities that individuals find joint solutions. Finally, political learning ensures the adoption of politically supported solution (May, 1992).
The analysis assesses the influence of eight factors prevailing in the literature on learning. Four of them are individual traits linked to individual skills, attitude and perception. It includes expertise, defined as the number of years an individual is working in the field related to the innovation studied, the

PSI-CO work package 3: cross-case analysis
109
perception of procedural fairness, or the perception of being treated equally, trust propensity—the general inclination to trust others—and public service motivation. Public service motivation was further divided into two dimensions, namely attraction to policy-making and commitment to the public interest. The remaining four factors are types of relationships, varying according to the nature of the interactions between participants. It includes the exchange of information outside the meetings, the frequency of contact outside the meetings (by mail, phone call or face-to-face meetings), trust and trustworthiness. Trust is defined as “a stable and positive expectation that actor A has (or predicts he has) of the intentions and motives of actor B in refraining from opportunistic behaviour, even if the opportunity arises” Klijn et al. (2010). Trustworthiness refers to the perception that someone is competent, care about the interests of the others and is honest. While trust refers to the expectation of a specific behaviour, trustworthiness is a perception of other’s personal qualities.
The results demonstrate that different types of learning are facilitated or constrained by different variables. First, policy learning is triggered by reciprocate exchange of information outside the meetings. Individuals perceiving that they have sent and received information from the same actors are more likely to acquire knowledge about the content of the policy. This finding confirms that information is the main input of learning about the content (Gerlak & Heikkila, 2013). Moreover, it shows that the perception of reciprocity matters: it appears that individuals are more receptive to new information when they feel they have shared information too. The perception of two-way communication seems to reinforce the integration of information useful for policy learning.
Second, and surprisingly, frequent contact outside the meetings have a detrimental effect on policy learning when controlling for information exchange. For a given level of information exchange outside the meetings, individuals that frequently interact with numerous actors are less likely to learn. In other words, if two individuals share information with the same number of actors, the one that interact frequently with the highest number of actors is less likely to learn. Our results seem to indicate that the benefit of information exchange is lower when, at the same time, frequent contact occurs. This may be explained by the “strength of weak ties” theory (Granovetter, 1983). Individuals are less likely to receive new information from people with whom they often communicate as frequent contacts often occur between individuals that know each other well or work in the same place. In addition, individuals that frequently interact with each other tend to develop the same worldview, limiting their probability of exchanging new information. This does not mean that people do not have to interact; rather, it suggests that repeated collaboration in closed and stable network “will tend to stifle creativity and prevent the generation of new and bold ideas” (Skilton & Dooley, 2010).
Third, relational learning is facilitated by trustworthiness and attraction to policy-making, one dimension of public service motivation. Being perceived as a trustworthy person—a person who’s competent, benevolent and honest, increase the likelihood of learning about the resources and interest of the other actors. This result is interesting as generally, it is trusting the actors in the network—believing that they won’t act opportunistically—rather than being perceived as trustworthy that facilitates learning. This can be explained by the fact that information on organizational and personal interest and resources are sensitive by nature. It is therefore easier for an individual to share them with people he or she perceives trustworthy (Gubbins & Mcccurtain, 2008). Consequently, trustworthy individuals are more likely to learn. In the same vein, individuals that are attracted to policy-making are more likely to learn about others’ resources and interest. One of the main motives of individuals attracted to policy-making is influencing the policy process and providing a solution to a social problem (Ritz, 2011; Kim et al., 2013).

PSI-CO work package 3: cross-case analysis
110
Yet, it is relational learning about the resources and interest of the actors more than learning about the policy content that supports the development of feasible and joint solutions (Klijn & Koppenjean, 2016). In this context, motivated individuals may be more likely to integrate information about others’ interest and resources.
Fourth, political learning is facilitated by both reciprocate exchange of information outside the meetings and trustworthiness. As for policy learning, individuals perceiving two-way communication they have sent and received information from the same actors—are more likely to acquire knowledge about the political games and interest surrounding the project. At the same time, similarly to relational learning, trustworthy individuals are more likely to learn about political interest, as political information are sensitive by nature. It seems that actors in a network share sensitive information with individuals they perceive competent, benevolent and honest.
Interestingly, some factors do not significantly facilitate or constrain learning. Experience, procedural fairness, trust propensity and commitment to public interest (the second dimension of public service motivation) never showed up in the analysis. Trust or the expectation that actors in the network won’t behave opportunistically often play a significant role when tested independently. However, once included in a model controlled for trustworthiness or information exchange outside the meetings, the effect of trust becomes non-significant. This probably arises from the fact that trust is closely linked to information exchange and trustworthiness (the perception of someone’s competence, benevolence and integrity). Regarding the other variables, it is not because they do not have an effect on learning that they are not important for collaborative innovation. In fact, some of them have a role in other processes relevant for innovation. For instance, trust propensity is linked to a positive perception of innovative outcomes while individuals with expertise are more likely to share information and to build upon each other ideas inside the meetings.
In conclusion, the analysis shed the light on important factors that foster policy, relational and political learning, prerequisites for successful collaborative innovation. Relational factors more than individual traits explain learning. Particular attention should be paid on organizing reciprocate exchange of information outside the meetings, on the diversity of the partners—not too close but deemed competent and honest—, in trust-building activities and in sustaining motivation related to participation in policy-making.
Conditions on the organizational level With regard to organizational conditions, our findings deal with three different aspects: organizational culture, red tape (rules and procedures with burdensome effects on performance), and organizational leadership.
Leadership
Conducting our research, a first discovery was that very few organizations, include either innovation or collaboration as part of the employee’s individual evaluation criteria and in their performance contracts. Actors for whom collaborative innovation was part of their evaluation criteria or performance contracts spent more time to invest in the projects they engaged in however.
Another discovery was that six different attitudes of superiors towards collaborative innovation could be distinguished across our nine cases. There we noted that an ambivalent attitude towards collaborative innovation was most harmful, stressing actors and making them uncertain and risk-

PSI-CO work package 3: cross-case analysis
111
aversive about their participation in the project. This attitude turned out to be more harmful than a neutral or negative attitude towards collaborative innovation. Here we also noted that actors can be able to engage in collaborative innovation even if their superiors are not encouraging this. Three attitudes foster collaborative innovation. The hands-on support for collaborative innovation turned out to be the most successful in terms of project outcomes and employee encouragement. Rhetorical support, where collaborative innovation is encouraged in the vision and in documents such as mission statements of the superior, is insufficient at times (no trainings for employees, no guaranteed support for the employee if the case fails compared to hand-on support). The sixth attitude, a pressuring attitude towards collaborative innovation can be positive, yet in rare cases also harmful since innovation is not always the best approach and some projects are pushed forward without being given enough time to develop and be thought-out as a result of a pressure to innovate.
Organizational culture
A hierarchical culture turned out to be dominant in the regional (69%) and federal (51%) public sector, while in the local (50%) and the non-profit (40%) sector a group culture was reported to be most dominant. The other two cultures (developmental and rational) were also prevalent in our cases, yet rarely dominant. There is a correlation between an administrative culture and low to medium organizational support for the project, and between a rational culture and high organizational support for the project.
Next, we found that both a developmental culture and a group culture are very nurturing environments for engagement in collaborative innovation and the success of such projects. Yet organizations with a dominant administrative culture succeeded better in achieving their innovation goals and collaborating together in projects exclusively composed of organizations with a dominant administrative culture than in projects where organizational cultures were mixed. Involving innovative organizations with a developmental or group culture does not compensate for the rigidness in administrative culture organizations because the schism between control-based organizations and flexible organizations appeared to be difficult to overcome in collaborations. The other value tension among cultures. In other words: in projects it is best to have organizations with similar cultures, rather than to include organizations with a developmental or group culture simply because these organizations tend to be are more innovative. Mutual understanding is what is more important.
Red tape
We found a strong correlation between high red tape levels and working for the local public sector. There is also a strong correlation between red tape and gender, and red tape and position since women and employees in a subordinate position experience higher levels of red tape than women and employees in a superior position respectively.
A second conclusion was that apart from the five red tape dimensions discovered by Pandey and others (2007) (budget, procurement, information, communication and personnel red tape), two more dimensions can be distinguished: registration/validation red tape and collaboration red tape. Registration/validation red tape are rules and procedures meant to control and verify the day-to-day activities of employees that cannot be considered personnel red tape. Collaboration red tape is organizational red tape specifically hindering respondents to collaborate as efficiently as possible or to engage in collaborations.
Thirdly we note that the different red tape dimensions have different effects on actors. Registration/validation red tape mainly leads to actors feeling less trusted, along with personnel red

PSI-CO work package 3: cross-case analysis
112
tape is mostly has psychological effects on actors. Budget, communication and information red tape appear to have less psychological effects and mainly operational effects such as delays, lower efficiency, decreased effectiveness and more paperwork. Through these operational and psychological effects collaborative innovation is indirectly affected. The two red tape dimensions that appear to affect collaborative innovation in the most direct way are collaboration red tape and procurement red tape. Collaboration red tape mainly forms a barrier when project aims cannot be redirected and partner cannot be chosen or changed while procurement red tape can hamper, stop or discourage actors from procuring goods and services required for a project.
Interactions
The first connection we found was the one between red tape and organizational culture. Both the organizational cultures on the flexible side of the competing values model are linked to low levels of red tape. Respondents in a rational culture reported medium levels of red tape while actors that worked in a hierarchical culture reported most different red tape dimensions and more red tape in general than other respondents.
Between red tape and leadership, we discovered that actors in a superior positions experienced lower levels of red tape, and respondents that had a good relationship with their superior enjoyed lower levels of red tape as well, by extension. Furthermore, actors experiencing a hands-on positive attitude towards collaborative innovation and a pressuring attitude towards collaborative innovation also discovered lower levels of red tape within their organization.
Lastly, we found a connection between leadership attitudes and organizational culture. Respondents experiencing a hands-on positive attitude towards collaborative innovation more often named either a developmental culture or a family culture as the dominant culture in their organization. Actors reporting a pressuring attitude towards collaborative innovation were most likely to report a developmental culture in their organization. A superior’s negative attitude towards collaborative innovation was most often connected to an administrative organizational culture. And with that our variables all affect one another, creating four different potential contexts that affect collaborative innovation in different ways.
PSI-CO work package 3: cross-case analysis
113
LIST OF REFERENCES
Albury, D. 2005. “Fostering innovation in public services”. Public Money and Management, 25(1), 51-56.
Alford, J. (2009) Engaging Public Sector Clients. Houndmills: Palgrave
Agranoff, R. (2007). Managing Within Networks: Adding Value to Public Organizations. Washington: Georgetown University Press.
Agranoff, R. and M. McGuire. (2001). Big Questions in Public Network Management Research, Journal of Public Administration Research and Theory, 11, 3, 295–326.
Ansell, C., & Torfing, J. (Eds.). (2014). Public innovation through collaboration and design. Routledge.
Ansell, C., Sørensen, E., & Torfing, J. (2017). Improving policy implementation through collaborative policymaking. Policy & Politics, 45 (3), 467-486.
Bekkers, V. J. J. M., Tummers, L. G., & Voorberg, W. H. (2013). From public innovation to social innovation in the public sector: A literature review of relevant drivers and barriers. Rotterdam: Erasmus University Rotterdam.
Bekkers, V.J.J.M., Tummers, L.G., Stuijfzand, B.G.; Voorberg, W. (2013). Social Innovation in the Public Sector: An integrative framework. LIPSE Working papers (no. 1). Rotterdam: Erasmus University Rotterdam.
Bommert, B. (2010). Collaborative innovation in the public sector. International public management review, 11(1), 15-33.
Bozeman, B. 1993. “A Theory of Government "Red Tape" Journal of Public Administration Research and Theory.” 3(3), 273-303.
Brass, D. J., Galaskiewicz, J., Greve, H. R., & Tsai, W. (2004). Taking stock of networks and organizations: A multilevel perspective. Academy of management journal, 47(6), 795-817.
Büschgens, T., Bausch, A., & Balkin, D. B. (2013). Organizational culture and innovation: A meta‐analytic review. Journal of product innovation management, 30(4), 763-781.
Burden, B. C., Canon, D. T., Mayer, K. R., & Moynihan, D. P. (2012). The effect of administrative burden on bureaucratic perception of policies: Evidence from election administration. Public Administration Review, 72(5), 741-751.
Cajaiba-Santana, G. (2014). Social innovation: Moving the field forward. A conceptual framework. Technological Forecasting and Social Change, 82, 42-51.
Chen, G., & Williams, D. W. 2007. “How political support influences red tape through developmental culture.” Policy Studies Journal, 35(3), 419-436.

PSI-CO work package 3: cross-case analysis
114
Colquitt, Scott & Lepine (2007). Trust, Trustworthiness and Trust Propensity: A Metal-Analytic Test of Their Unique Relationships With Risk Taking And Job Performance. Journal of Applied Psychology, 92 (4), 909-927.
De Vries, H., Bekkers, V., & Tummers, L. (2016). Innovation in the public sector: A systematic review and future research agenda. Public Administration, 94 (1), 146-166.
Eeten, M. van. (1999). Dialogues of the Deaf. Defining New Agendas for Environmental Deadlocks. Delft: Eburon.
Eggers, W. D., & Singh, S. K. (2009). The Public Innovator's Playbook: Nurturing bold ideas in government. Ash Institute, Harvard Kennedy School.
Feeney, M. K., & DeHart-Davis, L. 2009. “Bureaucracy and public employee behavior a case of local government.” Review of Public Personnel Administration, 29(4), 311-326.
Freeman, L. C. (1978). Centrality in social networks conceptual clarification. Social networks, 1 (3), 215-239.
Gadermann, A. M., Guhn, M., & Zumbo, B. D. (2012). Estimating ordinal reliability for Likert-type and ordinal item response data: A conceptual, empirical, and practical guide. Practical Assessment, Research & Evaluation, 17 (3), 1-13.
Gage, R.W. and M.P. Mandell (eds) (1990). Strategies for Managing Intergovernmental Policies and Networks. New York: Praeger
Gieske, H., van Buuren, A., & Bekkers, V. (2016). Conceptualizing public innovative capacity: A framework for assessment. Innovation Journal, 21(1), 1-27.
Gilsing, V., & Nooteboom, B. (2005). Density and strength of ties in innovation networks: an analysis of multimedia and biotechnology. European Management Review, 2(3), 179-197.
Granovetter, M. (1983). The strength of weak ties: A network theory revisited. Sociological theory, 201-233.
Gubbins, C., & MacCurtain, S. (2008). Understanding the dynamics of collective learning: The role of trust and social capital. Advances in Developing Human Resources, 10(4), 578-599.
Head, B. W. (2008). Wicked problems in public policy. Public Policy, 3(2), 101.
Heikkila, T. & Gerlak, A. (2013). Building a conceptual approach to collective learning: lessons for public policy scholar. The policy studies journal, 41 (3), 484-512.
Huxham, C, and S. Vangen. (2005) Managing to Collaborate. The theory and practice of collaborative advantage. London: Routledge.
Kickert, W.J.M., E.H. Klijn and J.F.M. Koppenjan (eds). (1997). Managing Complex Networks: Strategies for the Public Sector. London:Sage

PSI-CO work package 3: cross-case analysis
115
Kim, Vandenabeele & al. (2013). Investigating the structure and meaning of Public Service Motivation across Populations: developing an International Instrument and addressing issues of measurement invariance. Journal of public administration theory and research, 23, 79-102.
Klijn, E. H., Sierra, V., Ysa, T., Berman, E., Edelenbos, J., & Chen, D. Y. (2016). The influence of trust on network performance in Taiwan, Spain, and the Netherlands: A cross-country comparison. International Public Management Journal, 19(1), 111-139.
Klijn, E. H., Steijn, B., & Edelenbos, J. (2010). The impact of network management on outcomes in governance networks. Public administration, 88(4), 1063-1082.
Klijn, Edelenbos & Steijn (2010). Trust In Governance Networks: Its Impacts On Outcomes. Administration & Society, 42 (2), 193-221
Koppenjan, J. F. M., & Klijn, E. H. (2010). Managing uncertainties in networks: a network approach to problem solving and decision making. Psychology Press.
Koppenjan, J., & Klijn, E. H. (2016). Governance networks in the public sector. Routledge.
Lasker, R. D., Weiss, E. S., & Miller, R. (2001). Partnership synergy: a practical framework for studying and strengthening the collaborative advantage. The Milbank Quarterly, 79(2), 179-205.
Leach, W., Weible, C., Vince, S., Siddiki, S. & Calanni, J. (2014). Fostering learning through collaboration: knowledge acquisition and belief change in marine aquaculture partnerships. Journal of public administration research and theory, 24, 591-622
Lewis, J., & Ricard, L. M. (2014). Innovation capacity in the public sector: Structures, networks and leadership. LIPSE working papers (no. 3). Rotterdam: Erasmus University Rotterdam.
Lewis, J., Considine, M. & Alexander, D. (2014). “Innovation Inside Government: The importance of network” in Bekkers, V. Edelenboos, J. & Steijn, B. (eds.) Innovation in the public sector: linking capacity and leadership, Palgrave McMillan: Basingtoke, 107-133.
Lusher, D., Koskinen, J., & Robins, G. (Eds.). (2012). Exponential random graph models for social networks: Theory, methods, and applications. Cambridge University Press.
Lusher, D., Robins, G., Pattison, P. E., & Lomi, A. (2012). “Trust Me”: Differences in expressed and perceived trust relations in an organization. Social Networks, 34(4), 410-424.
May, P. J. (1992). Policy learning and failure. Journal of public policy, 12 (4), 331-354.
Mayer, R., Davis, J., & Schoorman, F. (1995). An Integrative Model of Organizational Trust. The Academy of Management Review, 20 (3), 709-734.
Meier, K.J. & L.J. O’Toole, Jr. (2001). Managerial Strategies and Behaviour in Networks: A Model with Evidence from US Public Education. Journal of Public Administration and Theory, 11 (3), 271–93.

PSI-CO work package 3: cross-case analysis
116
Meijer, A. J. (2014). From Hero-Innovators to Distributed Heroism: An in-depth analysis of the role of individuals in public sector innovation. Public Management Review, 16(2), 199-216.
Moon, M. J., & Bretschneiber, S. 2002. “Does the perception of red tape constrain IT innovativeness in organizations? Unexpected results from a simultaneous equation model and implications.” Journal of Public Administration Research and Theory, 12(2), 273-292.
Moynihan, D. P., Wright, B. E., & Pandey, S. K. (2012). Working within constraints: can transformational leaders alter the experience of red tape? International Public Management Journal, 15(3), 315-336.
Oomsels, P. (2016). Administrational trust: an empirical examination of inter-organizational trust and distrust in the Flemish administration, Faculteit Sociale Wetenschappen, Katholieke Universiteit of Leuven.
Pandey, S. K., Coursey, D. H., & Moynihan, D. P. 2007. “Organizational effectiveness and bureaucratic red tape: A multimethod study.” Public Performance & Management Review, 30(3), 398-425.
Pandey, S. K., & Marlowe, J. (2015). Assessing survey-based measurement of personnel red tape with anchoring vignettes. Review of Public Personnel Administration, 35(3), 215-237.
Perry, J. L. (1996). Measuring public service motivation: An assessment of construct reliability and validity. Journal of public administration research and theory, 6(1), 5-22.
Provan, K. G., & Kenis, P. N. (2008). Modes of network governance: Structure, management, and effectiveness. Journal of Public Administration Research and Theory, 18(2), 229-252.
Provan, K. G., & Sebastian, J. G. (1998). Networks within networks: Service link overlap, organizational cliques, and network effectiveness. Academy of Management journal, 41(4), 453-463.
Provan, K. G., Fish, A., & Sydow, J. (2007). Interorganizational networks at the network level: A review of the empirical literature on whole networks. Journal of management, 33(3), 479-516.
Quinn, R. E., & Rohrbaugh, J. (1983). A spatial model of effectiveness criteria: Towards a competing values approach to organizational analysis. Management Science, 29(3), 363-377.
Ritz, A. (2011). Attraction to Public Policy‐Making: A Qualitative Inquiry into Improvements in PSM Measurement. Public Administration, 89(3), 1128-1147.
Robins, G; Pattison, P; Wang, P (2009). Closure, connectivity and degree distributions: Exponential random graph (p*) models for directed social networks, Social Networks, 31(2), 105 – 117.
Schultz Larsen, T. (2015). The Ambivalent Relations Between Bureaucracy and Public Innovation: The Case of the Successful Failure of Dial Police. International Journal of Public Administration, 38(2), 92-103.
Schweitzer, J. (2014). Leadership and innovation capability development in strategic alliances. Leadership & Organization Development Journal, 35(5), 442-469

PSI-CO work package 3: cross-case analysis
117
Scott, J. (2017). Social network analysis. Sage.
Siddiki, S., Kim, J., & Leach, W. D. (2017). Diversity, Trust, and Social Learning in Collaborative Governance. Public Administration Review, 77 (6), 863-874.
Skelcher, C., & Torfing, J. (2010). Improving democratic governance through institutional design: Civic participation and democratic ownership in Europe. Regulation & Governance, 4(1), 71-91.
Skilton, P. F., & Dooley, K. J. (2010). The effects of repeat collaboration on creative abrasion. Academy of Management Review, 35(1), 118-134.
Snijders, T (2017). Stochastic Actor-Oriented Models for Network Dynamics. Annual Review of Statistics and its Application,4, 343-363.
Snijders, T.A.B., van de Bunt, G.G., and Steglich, C.E.G. (2010). Introduction to actor-based models for network dynamics. Social Networks, 32, 44-60.
Sørensen E. & Torfing, J. (2012). Introduction: collaborative innovation in the public sector. Innovation Journal, 17(1), 1-14.
Sørensen, E, & Waldorff, S. B. (2014). Collaborative policy innovation: Problem and potential. The Innovation Journal: The Public Sector Innovation Journal, 19(3), 1–17.
Sørensen, E. (2014, September). The metagovernance of public innovation in governance networks. In Policy and Politics Conference in Bristol.
Sørensen, E., & Torfing, J. (2009). Making governance networks effective and democratic through metagovernance. Public administration, 87(2), 234-258.
Sørensen, E., & Torfing, J. (2011). Enhancing collaborative innovation in the public sector. Administration & Society, 43(8), 842-868.
Sørensen, E., & Torfing, J. (2017). Metagoverning collaborative innovation in governance networks. The American Review of Public Administration, 47(7), 826-839.
Stevens, V. (2018). Managing the ostrich dance. A study on the management of collaborative networks for the promotion of policy innovations. PhD dissertation University of Antwerp.
Stevens, V., & Verhoest, K. (2016). How To Metagovern Collaborative Networks for the Promotion of Policy Innovations in a Dualistic Federal System?. The Innovation Journal, 21(2), 1.
Susskind, L. and J. Cruikshank. 1987. Breaking the Impasse. Consensual Approaches to Resolving Public Disputes. London: Basic Books
Van de Vrande, Vareska, et al. 2009. “Open innovation in SMEs: Trends, motives and management challenges.” Technovation 29(6), 423-437

PSI-CO work package 3: cross-case analysis
118
Van Eijk, C. J., & Steen, T. P. (2014). Why people co-produce: Analysing citizens’ perceptions on co-planning engagement in health care services. Public Management Review, 16(3), 358-382.
Verschuere, B., Brandsen, T., & Pestoff, V. 2012. “Co-production: The state of the art in research and the future agenda.” Voluntas: International Journal of Voluntary and Nonprofit Organizations, 23(4), 1083-1101.
Vries, H. de, Bekkers, V., & Tummers, L. (2015). Innovation in the public sector: A systematic review and future research agenda. Public Administration, 94(1), 146-166.
Voorberg, W.H., V. J. J. M. Bekkers & L. G. Tummers (2015) A Systematic Review of Co-Creation and Co-Production: Embarking on the social innovation journey, Public Management Review, 17(9), 1333-1357.

PSI-CO work package 3: cross-case analysis
119
5 APPENDICES
Annex 1. Survey questions
SURVEY
Thank you for taking part in our survey. This survey was send to you as you were part of the collaborative arrangement [name the collaborative arrangement studied], concerned with the creation of [name the innovation it was aimed for]. Your replies are very valuable for our research on collaborative innovation.
The survey we present you consists of 26 questions divided over three sections. It partially serves as input for the interview that we have later on, but it also provides us information that will not be discussed in the interview. The data will be fully anonymised when we analyse and report the data. None of the data can be traced back to any individual person.
It will take you about 25-30 minutes to fill in the survey. If there is anything unclear about the survey, please do not hesitate to contact us on [email address case specific]
Our research team thanks you for your valued input.

PSI-CO work package 3: cross-case analysis
120
1) THE COLLABORATIVE ARRANGEMENT AND THE INNOVATIVE PROCESS 1. First, could you please indicate the month and year in which you were first involved in the
collaborative arrangement? - Here we can insert a dropdown menu of months and years or a bar which the respondent
can shift to the exact number 2. For how many years have you been dealing with the following policy issue(s) in your working life?
Policy issue 0-2 years 3-5 years 6-8 years 9-11 years More than 11 years [To define according to the collaborative arrangement studied]
The next statement deal with your general perception of human relations in general. Could you please position yourself on the following items?
3. Do you think that generally speaking, most people can be trusted or that you cannot be cautious enough?
4. Do you think that most people would try to take advantage of others if they had the chance or that they would try to be fair?
5. Do you think that most of the time people try to be helpful or that they are looking out for themselves.
6. How much do you agree or disagree with the following items? (0=strongly agree, 5=nor agree, nor disagree, 10=strongly agree)
0 1 2 3 4 5 6 7 8 9 10 You cannot be cautious enough
Generally speaking, most people can be trusted.
0 1 2 3 4 5 6 7 8 9 10 Most people would try to take advantage of others if they had the chance.
Most people would try to be fair.
0 1 2 3 4 5 6 7 8 9 10 Most of the time people try to be helpful instead of looking out for themselves.
Most of the time people try to be helpful
0 (Strongly disagree)
1 2 3 4 5 [nor agree, nor disagree
6 7 8 9 10 (Strongly agree)
I admire people who are involved on activities to aid my community
It is important to contribute to activities that tackle social problems
Meaningful public service is very important to me It is important for me to contribute to the common good

PSI-CO work package 3: cross-case analysis
121
Now, we would like to learn more on your perception of the innovative ideas that were developed in [the innovative process]. With innovative ideas we mean a novelty in the given context. This can be a new or changed service, but also a new policy, method, process etc. The novelty might exist already somewhere else, but must be new in your context.
7. How would you classify [project] on the next aspects? Please indicate your position by marking a score between 0 and 10.
8. The next questions are about the [processes that occurred in the collaborative arrangement]. First we ask you about the input to [the process]. Please indicate your position by marking a score between 0 and 10.
I think equal opportunities for citizens are very important It is important that citizens can rely on the continuous provision of public services
It is fundamental that the interests of future generations are taken into account when developing public policies
To act ethically is essential for public servants.
0 1 2 3 4 5 6 7 8 9 10 No innovative ideas are developed [in this process]
A lot of innovative ideas are developed [in this project]
The innovative character of [the process] is lower than my initial expectations
The innovative character of the [the process] exceeds my initial expectations
The innovative ideas that are developed in [project name] are not feasible at all
The innovative ideas that are developed in [project name] are very easily feasible
The [solutions that have been developed] do not deal with the problems at hand at all
The [solutions that have been developed] really deal with the problems at hand
0 1 2 3 4 5 6 7 8 9 10 At the start of [the proces] there were no differences in opinion between participants
At the start of [the process] there were a lot of differences of opinion between participants
At the start of [the process] there was no trust at all between the actors.
At the start of [the process] there was a lot of trust between the actors
[The process]ran with a lot of blockades and stagnation due to
[The process ] ran smoothly without any blockades

PSI-CO work package 3: cross-case analysis
122
9. How would you score the outcomes of [the process] on the following aspects? Please indicate your position by marking a score between 0 and 10.
differences of opinion and conflicts
because no differences in opinions or conflicts occurred
None of the participants benefited from the activities of [the collaborative arrangement during the proces]
All of the participants benefited from the activities of [the collaborative arrangement during the proces].
Differences of opinion have not deepened the substantive discussions
Differences of opinion have strongly deepened the substantive discussions
My input was not actively used at all in [ the process]
My input was actively used in [the process]
It has not been attempted at all to include different opinions in the decision-making in [the process]
It has been attempted as much as possible to include different opinions in the decision-making in [the process]
0 1 2 3 4 5 6 7 8 9 10 The goals of the different participants have not been connected at all in [the process.]
The goals of the different participants have been strongly connected with each other in [the process]
None of the involved participants have delivered a recognizable contribution to the development of [the results]
All of the involved participants have delivered a recognizable contribution to the developments of [the results]
In [this process] the costs of collaborating exceed the benefits
In [this process] the benefits of collaborating exceed the costs
None of the participants benefited from the activities of [the collaborative arrangement during the proces]
All of the participants benefited from the activities of [the collaborative arrangement during the proces].

PSI-CO work package 3: cross-case analysis
123
10. These questions are about the way [the process] was managed. How would you score the approach to [the process] on the following aspects? Please indicate your position by marking a score between 0 and 10.
From our organization, the continuous support for the realization of [the innovation]cannot be expected
From our organization, a large continuous support for the realization of [the innovation]can be expected.
I am not sure at all that all other involved organizations will support the realization of the [innovation]
I am completely sure that all other involved organizations will support the realization of the [innovation]
From our organization, there is no willingness at all to give a financial contribution to the realization of [the innovation]
From our organization, there is a very large willingness to contribute a financial contribution to the realization of [the innovation]
The [collaborative arrangement] treats none of the parties fairly
The [collaborative arrangement] treats all parties fairly
The meetings [in the process] are not at all marked by mutual respect
The meetings in [the process] are strongly marked by mutual respect
No new durable relations have been developed between involved actors during [the process]
A lot of new durable relations have been developed between involved actors during [the process]
The extent to which participants trust each other during [the process] has decreased
The extent to which participants trust each other during [the process] has increased
0 1 2 3 4 5 6 7 8 9 10 There has been no attention at all [in this project] on involving external parties who can bring in new ideas
There has been a lot of attention [in this project] for involving external organizations who can bring in new ideas
When gathering information and
When gathering information and

PSI-CO work package 3: cross-case analysis
124
The next questions help us to determine the interactions in {process]. It is very important that u answer these questions as accurate as possible, so we can get an overview of [process] as clear as possible. Total anonymity concerning participating actors is completely guaranteed when reporting the results. 11. Could you please indicate for each of the participating actors whether you considered it 'very
important, 'important' or 'not that important' that they were involved in [the process]? Please tick one box per participant
knowledge [in this project]there has been no emphasis at all on determining the joint information needs
knowledge [in this project]there has been a lot of emphasis on determining the joint information needs.
In case of deadlocks and problems [in the process], bringing together opposing interests has not at all been attempted
In case of deadlocks and problems [in this process], bringing together opposing interests has been very much attempted
In [this process] there has been no attention at all for the (development in) relationships between the involved participants and organizations
In [this process] there has been a lot of attention for the (development in) relationships between the involved participants and organizations
No organizations are/have been involved in taking decisions (collective decision-making)
All organizations are/have been actively involved in the decision-making, (collective decision-making)
The important actors necessary to deal with [the issue at hand] were not included [in the process]
All important actors necessary to deal with [the issue at hand ] were included [in the process]
Very important
Important Not that important
I do not know this participant at all
A B C If you have any remarks about this question or if you miss people in the list below, you can leave them below:

PSI-CO work package 3: cross-case analysis
125
12. The next questions are about your interaction with the other participants in [process]. Could you please indicate to whom did you gave information to and from whom you received information after and outside formal meetings ? Information includes reports, statistics, advices, and remarks,. This information can be both verbal as written. You can select twee, one or none box for each participant.
List of participants I gave information to this participant I received information from this participant A B C If you have any remarks about this question or if you miss people in the list below, you can leave them below:
13. During [process], how frequent did you have contacts (telephone, email, face-to-face), concerning [process] after and outside of meetings of [the arrangement] with the following participants? Choose one option for every participant.
List of participant Frequency of contact Daily Weekly Monthly Multiple times a
year Yearly Never
A B C If you have any remarks about this question or if you miss people in the list below, you can leave them below:
14. Which participants [in the process] most frequently elaborated during the meetings of [the
arrangement] on the information and ideas you shared? List up to maximal 7 participants.
List of participants in the collaborative arrangement 1. 2. 3. 4.
15. How certain are you that the following participant [in the process] keep in mind your interest when using the information you give them? (1=not sure at all, 10 = totally sure)
For each of the following 3 statements, please name up to [depending on the ratio but max 7] participants in [the process] from the list above that, in your perception, best fit with it the statement. You can choose the same but also other participants for each statement:
List of participants
List of particpants 0 (not sure at all)
1 2 3 4 5 6 7 8 9 10 (Totally sure)
A B C

PSI-CO work package 3: cross-case analysis
126
16. He/she has the competences to deal with the issues at stake
1 2 3
17. He/she is very concerned about the interests of the other participants
1 2 3
18. He/she tries to be fair in dealing with others 1 2 3
If you have any questions about the 3 question above, you can leave them here.
2) ORGANIZATIONAL CHARACTERISTICS
The following part of our questionnaire is not directly related to the collaborative arrangement. The questions asked are importance, however, for us to get a more complete picture of how the collaborative arrangement functions. The questions in this part are about characteristics of your own organization that you represented in [project].
Were you part a representative for an organization in [process]?
Yes No [respondent is redirected to question 24]
19. In this question we present you with six items that relate to the culture in the organization that you are a part of. Please indicate to what extent you agree with the following statements.
20. If we define red tape as burdensome rules and procedures that you have to comply with, but that have a negative effect on performance; could you indicate the overall level of red tape in your organization?
21. The next few items are meant for us and an indication of the level of red tape in your organization. Please indicate to what extent you agree with the following statements. (0=strongly disagree, 5=nor agree, nor disagree, 10=strongly agree)
0 (not at all)
1 2 3 4 5 6 7 8 9 10 (to a very high extent)
Readiness to meet new challenges is important in my organization. My organization emphasizes growth and acquiring new resources. My organization is very dynamic and entrepreneurial In my organization people are willing to stick their necks out and take risks.
The glue that holds my organization together is a commitment to innovation and development.
In my organization, there is an emphasis on being first.
Overall red tape 0 (no red tape at all)
1 2 3 4 5 6 7 8 9 10 (a lot of red tape)
Red tape

PSI-CO work package 3: cross-case analysis
127
22. The following question is about leadership and about the characteristics of your leader. With your leader we mean the direct superior you report to. We would like to know how he or she communicates about the direction of the organization. In case he or she is not the one in charge of strategizing the vision of the organization, we would like to know how he or she, as an intermediate person, translates these visions for you. Please indicate to what extent the following statements apply to your leader. 0=not at all, 10=a great deal)
23. This question is about the political principals responsible for your organization. Please indicate
your position by marking a score between 0 and 10.
0 (Strongly disagree)
1 2 3 4 5 [nor agree, nor disagree
6 7 8 9 10 (Strongly agree)
Rules and procedures concerning budgets limit the manager’s possibilities to cope with projects/programmes that unexpectedly exceed the estimated budget.
Rules and procedures limit the communication in my organization
The rules and procedures concerning staff policy makes it easy for supervisors to reward their subordinates for good performance.
The rules concerning purchase in my organization make it easy for managers to purchase goods and services
Rules and procedures concerning budgets limit the manager’s possibilities to shift funds according to the organization’s mission
Procedural requirements to request systematic information makes it hard for managers to receive relevant information
Even when an employee performs poorly, formal rules make it hard to fire him or her
The rules concerning purchase make it difficult to speed up the purchase of goods and services for critical projects
Rules and procedures concerning the preparation of systematic information reports make that manage get their information in a timely manner
Rules and procedures limit communication with other government organization
My leader 0 (not at all)
1 2 3 4 5 6 7 8 9 10 (a great deal)
Strives to get the organization to work together in the direction of the vision
Communicates a clear vision of the organization’s future to me Seeks to make employees accept common goals for the organization
Concretizes a clear vision for the organization’s future to me Has a clear sense of where he or she believes our organization should be in 5 years
Strives to clarify for the employees how they can contribute to achieve the organization’s goals
Makes a continuous effort to generate enthusiasm for the organization’s vision

PSI-CO work package 3: cross-case analysis
128
3) INDIVIDUAL CHARACTERISTICS
The questionnaire ends with several basic questions on your profile.
24. What is your year of birth? 25. What is your highest level of education you have obtained?
i. No education ii. Primary education
iii. Secondary education iv. Candidate or Bachelor from a high school or a university v. Graduate or Master from a high school or a university; engineer, or doctor in medicine
vi. PhD with dissertation vii. Other:
26. What description does match with your field(s) of education? More than one answer is possible
a. Education, pedagogical training b. Arts, history, religions, philosophy, letters, languages c. Social and political sciences, psychology, journalism and communication d. Law
0 1 2 3 4 5 6 7 8 9 10 My responsible minister (or cabinet) exerted no control at all on my activities and positioning in [the process]
My responsible minister (or cabinet) exerted a lot of control on my activities and position in [the process]
The higher levels in my organization exerted no control at all on my activities and positioning in [the process]
The higher levels in my organization exerted a lot of control on my activities and positioning in [the process.]
I had no freedom at all to act like I wanted during the interactions with the other participants [in the process]
I had complete freedom to act like I wanted during the interactions with the other participants in [the process}
The establishment of the [project] was no priority at all for my minister (or cabinet)
The establishment of the [project] was a top priority for my minister (or cabinet)
The establishment of …. [project] was no priority at all for the higher levels in my organization
The establishment of [project] was a top priority for the higher levels in my organization

PSI-CO work package 3: cross-case analysis
129
e. Management, marketing f. Finances, accountability g. Mathematics, statistics, natural and environmental sciences h. Computer science, information and communication technologies i. Engineering, building sector, processing and manufacturing industries. j. Agriculture, forestry, fisheries and veterinary science. k. Health, social work l. Security and safety, transport m. I prefer not to reply
Concluding remarks Your answers to all questions have been correctly recorded and you may now close your browser. Thank you very much for your participation.
Best regards,
The PSICO team.

PSI-CO work package 3: cross-case analysis
130
Annex 2: Interview protocol Introduction
1. Can you briefly introduce yourself? 2. What was your role in the project? 3. What is your job within in your own organization?
Innovation
4. Did you have any expectations regarding the innovation? Have your expectations been met? Why (not)?
5. To what extent do you support the outcome of the collaborative process?
Network questions
6. How and why were you involved in the collaborative process? 7. With which actors had you worked before? 8. With whom did you interact most frequently? 9. Who was the most important actor? Why were they the most important actor?
Innovative processes
10. Next to information, which resources did you share with which actor to support the process in the collaborative arrangement ? (interviewer should be able to fill in the scheme below).
Financial resources
staff time, FTE, working time
Support in terms of communication platforms or access to service delivery platforms
Research and analytical efforts
Yes/no How much?
Yes/no How much?
Yes/no Which?
Yes/no Which?
Learning// Acquiring new knowledge.
11. Before your participation in [the collaborative process], did you have knowledge about [the general thematic]?
x Following your participation in the [collaborative process], what did you learn about [the problematic]?

PSI-CO work package 3: cross-case analysis
131
12. Before your participation in [the collaborative process], did you have knowledge about the Belgian (and European If relevant) legal framework on [the thematic]?
x What did you learn about this legal framework?
13. Before your participation in [the collaborative process], did you have knowledge about the measures to be taken in order to solve the problem of [ thematic]?
x What did you learn about the measures to be taken in order to solve the problem of [ thematic]?
x What did you learn about the feasibility of those measures?
14. Before your participation in [the collaborative process], did you have knowledge about the organizations involved in the [problematic]?
x Who or which organization did you get to know? x What did you learn about their way of working? x What did you learn about their interests? x What did you learn about their powers (in the sense of “de bevoegdheden van i.e. de
Vlaamse overheid”).
15. What did you learned about the powers of your own organization? x During the collaborative process, did you make use of external resources? x On which topics?
Learning// change in opinion
16. Before your participation in [the collaborative process], did you find this project useful? x And now? Do you find the [project, i.e. the cooperation agreement] useful? x At the beginning of the [collaborative process], do you think others participants
found the project useful? x And now? Do you think others participants find the project useful?
17. Was there any debate during the [collaborative process]?
x If yes, on which issues?
18. What was your position on [those issues] at the beginning of the discussion? x Did you change your position afterwards? x Why (not)?
19. What was the position of the others participants on [those issues] at the beginning of the discussion?
x Do you think some participants have changed their position afterwards? 20. What decisions were finally made regarding those issues?
x Do you think everybody agreed with those decisions?
Evaluation metagovernance strategies and smoothness of the project

PSI-CO work package 3: cross-case analysis
132
21. Have some measures been taken to create a process to come to successful collaboration between actors? Which ones?
22. Do you feel that they contributed to a better relationship with the other actors? 23. Do you feel that they contributed to a more effective process in terms of developing new
ideas, selecting ideas, implementation, or diffusion? (let it depends on the phases that occurred)
24. In what way? (e.g. better communication, more trust, shared problems understanding)
COPRODUCTION (to government meta-governors and private actors)
25. Which forms of coproduction did you engage in? (diagram with: co-design/co-planning, co-implementing/co-managing, co-evaluating, co-adjusting)
26. In what way are goals, targets and deadlines imposed on you? (contract, verbally…) x - Can we look into those documents? x - How is the emphasis on process versus results? x - Are there incentives for collaborative innovation or the opposite?
27. How someone in your function is evaluated? Are there incentive for collaborative
innovation?
28. Did you notice political pressure for collaborative innovation in your position?
29. Would you say that the new ways of working (elaborate until the respondent understands) are being implemented in your organization at the moment? Do they have a positive or negative effect on collaborative innovation?
30. Are there any kinds of red tape in your organization or the collaborative arrangement? What kinds of red tape (in personnel, budget, procurement, communication, information) and what kind of effects (delays, motivation, risk-aversive…) - What influence does that have on the chance and the willingness to co-produce
innovation through collaboration?
31. What do you think are the most important conditions fostering or hindering collaborative innovation?

PSI-CO work package 3: cross-case analysis
133
Annex 3: Output regression https://www.dropbox.com/s/rvwxoy1s9fdpgh0/Statistical%20analysis%20of%20results.docx.pdf?dl=0

PSI-CO work package 3: cross-case analysis
134
Annex 4: Full ERGM results https://www.dropbox.com/s/n7bgdreuj2c6ypf/ERGM%20output%20wp3.pdf?dl=0

PSI-CO work package 3: cross-case analysis
135
Annex 5: Output statistical analyses individual level https://www.dropbox.com/s/gmbhmbixekh08au/Annex_logistic%20regression.pdf?dl=0

PSI-CO work package 3: cross-case analysis
136
Annex 6: visual representation of models
Case Information given outside meetings Elaborated upon each other’s ideas inside meetings
Carelab
Radicalization

PSI-CO work package 3: cross-case analysis
137
Case Information given outside meetings Elaborated upon each other’s ideas inside meetings
Connecting Healthcare
Sustainability program

PSI-CO work package 3: cross-case analysis
138
Case Information given outside meetings Elaborated upon each other’s ideas inside meetings
Invasive species

PSI-CO work package 3: cross-case analysis
139