
Prysmian Group Company Presentation breakdown by business Sales breakdown by geography ... Sales...
55
Prysmian Group Company Presentation November 2017
Transcript of Prysmian Group Company Presentation breakdown by business Sales breakdown by geography ... Sales...

Prysmian Group Company Presentation
November 2017

Agenda
Company Presentation – November 2017 2
Group overview
Results by business
Outlook
Financial Results
Appendix

Company Presentation – November 2017 3
Energy Projects
36%
E&I22%
Industrial & Netw.Comp.
18%
Oil&Gas1%
Telecom 23%
Energy Projects
22%
E&I40%
Industrial & Netw.Comp.
18%
Other1%
Oil&Gas4%
Telecom 15%
Prysmian group at a glanceFY 2016 Financial Results
Sales breakdown by business Sales breakdown by geography
€ 7,567m
Energy Products
59%
EMEA
67%North America
14%
Latin America
6%
APAC
13%
€ 7,567m
Adj. EBITDA by business Adj. EBITDA margin
Energy Products
40%
€ 711m
15.9%
5.1%
9.5%
2.7%
14.0%
9.4%
Energy Projects
E&I Industrial& Netw.Comp.
Telecom TotalOil&Gas

Company Presentation – November 2017 4
711
527545
2016 9M'16 9M'17
7,567
5,660 5,865
2016 9M'16 9M'17
9M 2017 Key FinancialsEuro Millions, % on Sales
(1) Adjusted excluding restructuring, non-operating income/expenses and non-recurring income/expenses; (2) Defined as NWC excluding derivatives; % on sales is defined as Operative NWC on annualized last quarter sales
Sales Adjusted EBITDA (1)
Operative Net Working Capital (2) Net Financial Debt
-1.1%*
* Org. Growth
318
701774
Dec-16 Sep-16 Sep-17
4.2% 9.3% 10.0%
537
1,017 1,052
Dec-16 Sep-16 Sep-17
9.4% 9.3% 9.3%
488*519*
* 9M Adj.EBITDA excluding OCI(OCI Contribution: €26m in 9M’17 vs. €39m in 9M’16)

Company Presentation – November 2017 5
172 179
123 107 95 88
9 5
129 167
527 545
Further margin expansion in value added businesses
9M’16 9M’17
Energy Projects Oil&Gas
Industrial & NWC. Telecom TotalA
dj.
EB
ITD
A (
€ m
illio
n) /
% O
rg
. G
ro
wth
E&I
-1.2% +2.2% -13.0% +5.9%
Ad
j. E
BITD
A M
arg
in
-1.1%
14.6%17.2%
5.4% 4.3%
9.3% 8.0%
4.1%2.3%
14.9%17.6%
9.3% 9.3%
Energy Projects Oil&Gas
Industrial & NWC. Telecom TotalE&I
9M’16 9M’17
±X.X% = Sales Organic Growth
-6.7%

Agenda
Company Presentation – November 2017 6
Group overview
Results by business
Outlook
Financial Results
Appendix

Company Presentation – November 2017 7
Energy ProjectsEuro Millions, % on Sales
Sales
Adj. EBITDA / % of Sales
Highlights
Orders Backlog Evolution (€ m)
Dec ’13 Dec ’14 Dec ’15 Sep ’16 Dec ’16 Sep’17
Underground HV ~450 ~450 ~600 ~400 ~350 ~400
Submarine ~2,050 ~2,350 ~2,600 ~2,200 ~2,050 ~2,100
Group ~2,500 ~2,800 ~3,200 ~2,600 ~2,400 ~2,500
Submarine
• Adj.EBITDA margin improved over the year supported by insourced installation activities and favourable mix.
• Recent offshore wind auctions in UK at record-low LRoE demonstrates the increasing competitiveness of wind generation vs. traditional sources.
Underground High Voltage
• Slight organic decline, easing in Q3, driven by volume decrease in France, Nordics and US, partially compensated by the robust trend in APAC.
• Change of perimeter (China) negatively impacting profitability, partially offset by solid performance in APAC.
* Org. Growth
1,634
1,1721,039
2016 9M'16 9M'17
-6.7%*
260
172 179
2016 9M'16 9M'17
15.9% 14.6% 17.2%
Company Presentation – November 2017 8
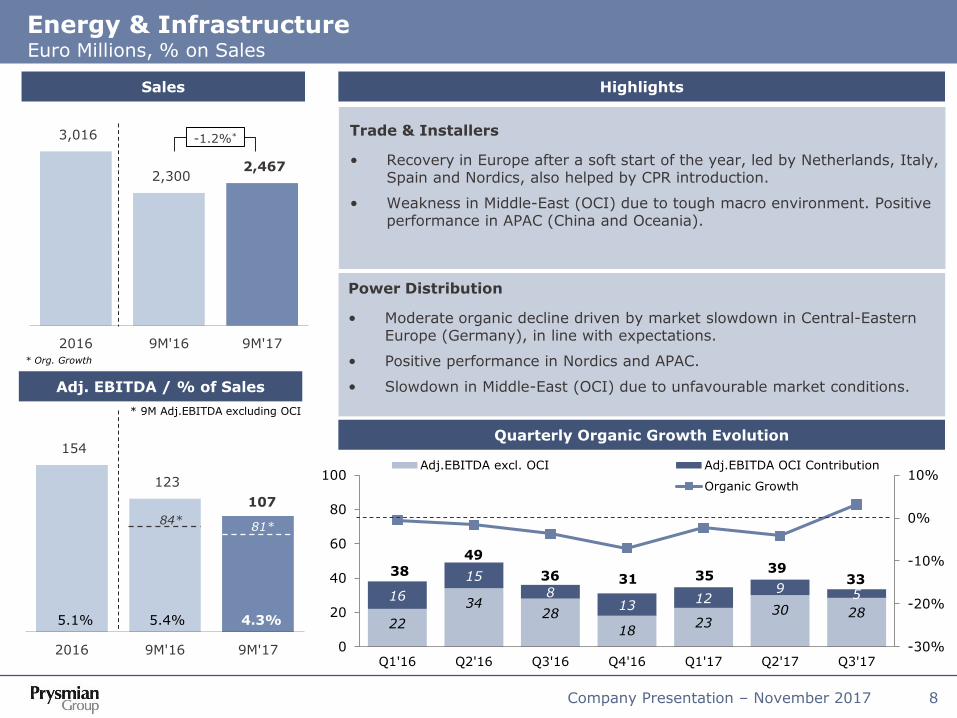
Energy & InfrastructureEuro Millions, % on Sales
Sales
Adj. EBITDA / % of Sales
Highlights
* Org. Growth
Power Distribution
• Moderate organic decline driven by market slowdown in Central-Eastern Europe (Germany), in line with expectations.
• Positive performance in Nordics and APAC.
• Slowdown in Middle-East (OCI) due to unfavourable market conditions.
3,016
2,300 2,467
2016 9M'16 9M'17
-1.2%*
154
123
107
2016 9M'16 9M'17
5.1% 5.4% 4.3%
Trade & Installers
• Recovery in Europe after a soft start of the year, led by Netherlands, Italy, Spain and Nordics, also helped by CPR introduction.
• Weakness in Middle-East (OCI) due to tough macro environment. Positive performance in APAC (China and Oceania).
Quarterly Organic Growth Evolution
84*81*
* 9M Adj.EBITDA excluding OCI
22
3428
1823
30 28
16
15
813
129 5
38
49
36 31 3539
33
-30%
-20%
-10%
0%
10%
0
20
40
60
80
100
Q1'16 Q2'16 Q3'16 Q4'16 Q1'17 Q2'17 Q3'17
Adj.EBITDA excl. OCI Adj.EBITDA OCI Contribution
Series3 Organic Growth

Company Presentation – November 2017 9
Industrial & Network ComponentsEuro Millions, % on Sales
HighlightsSales
Adj. EBITDA / % of Sales
Specialties, OEMs & Renewables
• Moderate organic increase driven by volume pick-up in Railways and recovery in Mining. Slowdown in Crane, Defense and Marine mainly linked to difficult market conditions.
• APAC, North America and Turkey were the best performing areas. Unfavorable business mix affecting margins.
• Order Book improved with demand acceleration for Infrastructure at global level.
Elevator
• Stable volume with a strong rise in Europe offset by the slowdown in China. Volume in North America was substantially in line with last year.
• Slight decline in margins mainly related to unfavourable product mix in US and China.
Automotive
• Double-digit growth, confirmed in Q3, supported by favourable market conditions with market share increase in APAC, North and Latin America.
• Profitability improved on better operating leverage and a leaner production footprint in Europe, partially offset by unfavourable mix.
Network Components
• Soft organic trend, slightly recovering in Q3, impacted by the slowdown of HV segment mainly in China, France and Netherlands.
• Positive performance of MV & LV business in Europe and US.
• Adj.EBITDA margin hit by unfavourable product mix (lower HV sales).
* Org. Growth
1,343
1,0211,100
2016 9M'16 9M'17
127
9588
2016 9M'16 9M'17
9.5% 9.3% 8.0%
+2.2%*

Company Presentation – November 2017 10
Oil & GasEuro Millions, % on Sales
Sales
Adj. EBITDA / % of Sales
Highlights
Quarterly organic growth* evolution
49.2%
33.4%
-3.4%
-21.7%
-33.9% -33.9%
-24.8%-20.9% -21.2%
-7.6% -9.2%
-50%
-40%
-30%
-20%
-10%
0%
10%
20%
30%
40%
50%
Q1'15 Q2'15 Q3'15 Q4'15 Q1'16 Q2'16 Q3'16 Q4'16 Q1'17 Q2'17 Q3'17
SURF
• Umbilical: volumes and margin slump as market conditions remain highly competitive in Brazil.
• DHT: recovery in US (driven by Shale Oil) partially offset by low activities in international & offshore projects.
Core Cable Oil & Gas
• Solid growth in Q3, driven by volume pick-up in on-shore projects in US and Middle East. Offshore activity still at bottom level.
• Adj.EBITDA margin benefiting from volume effect and footprint rationalization.
* Org. Growth
* % change vs. same quarter of previous year
8
9
5
2016 9M'16 9M'17
2.7% 4.1% 2.3%
300
225201
2016 9M'16 9M'17
-13.0%*

Company Presentation – November 2017 11
1,164
865953
2016 9M'16 9M'17
163
129
167
2016 9M'16 9M'17
TelecomEuro Millions, % on Sales
Highlights
Quarterly LTM Adj. EBITDA and % on LTM Sales evolution
Sales
Adj. EBITDA / % of Sales
100 116
126 144 146
134 147 141
157 163 174
194 201
-
50
100
150
200
250
8%
10%
12%
14%
16%
18%
20%LTM Adj.Ebitda
% on LTM Sales
** Adj. EBITDA margin excl. €8mln bad debt provision in Brazil
* Org. Growth
14.7%**
Telecom Solutions & Fiber
• Double-digit growth in optical business, confirmed in Q3 despite challenging comparison base. Solid market growth particularly in Europe(mainly France and Italy fixed broadband) and in US.
• Slowdown in copper business, in line with expectations, mainly related to project phase-out in Oceania.
• On-going capacity expansion in Europe and US to support medium term growth opportunities in the optical business.
• Adj.EBITDA margin expansion fuelled by volumes, operational efficiency in fiber manufacturing, footprint optimization and strong YOFC results.
+5.9%*
14.0% 14.9% 17.6%
15.8%**
* Including € 8m bad debt provision in Brazil

Agenda
Company Presentation – November 2017 12
Group overview
Results by business
Outlook
Financial Results
Appendix

Company Presentation – November 2017 13
FY 2017 Outlook
2017 Adj.EBITDA Target (€ million)
710 750Mid-point € 730m
- OPTICAL CABLES (INCLUDING YOFC)
- SUBMARINE- OCI
- FOREX: ~€10m negative impact expected in FY2017
POSITIVESNEGATIVES

Agenda
Company Presentation – November 2017 14
Group overview
Results by business
Outlook
Financial Results
Appendix

Company Presentation – November 2017 15
Profit and Loss StatementEuro Millions
9M 2017 9M 2016
Sales 5,865 5,660
YoY total growth 3.6% 1.6%
YoY organic growth (1.1%) 1.8%
Adj.EBITDA 545 527
% on sales 9.3% 9.3%
Adjustments (33) (39)
EBITDA 512 488
% on sales 8.7% 8.6%
Adj.EBIT 413 398
% on sales 7.0% 7.0%
Adjustments (33) (39)
Special items (39) (26)
EBIT 341 333
% on sales 5.8% 5.9%
Financial charges (72) (58)
EBT 269 275
% on sales 4.6% 4.9%
Taxes (75) (77)
% on EBT (28.0%) (28.0%)
Net Income 194 198
% on sales 3.3% 3.5%
Minorities (2) 10
Group Net Income 196 188
% on sales 3.3% 3.3%

Company Presentation – November 2017 16
Adjustments and Special Items on EBITEuro Millions
9M 2017 9M 2016
Non-recurring Items (Antitrust Investigation) (17) -
Restructuring (12) (27)
Other Non-operating Income / (Expenses) (4) (12)
EBITDA adjustments (33) (39)
Special items (39) (26)
Gain/(loss) on metal derivatives (2) 24
Assets impairment - (15)
Other (37) (35)
EBIT adjustments (72) (65)
Company Presentation – November 2017 17
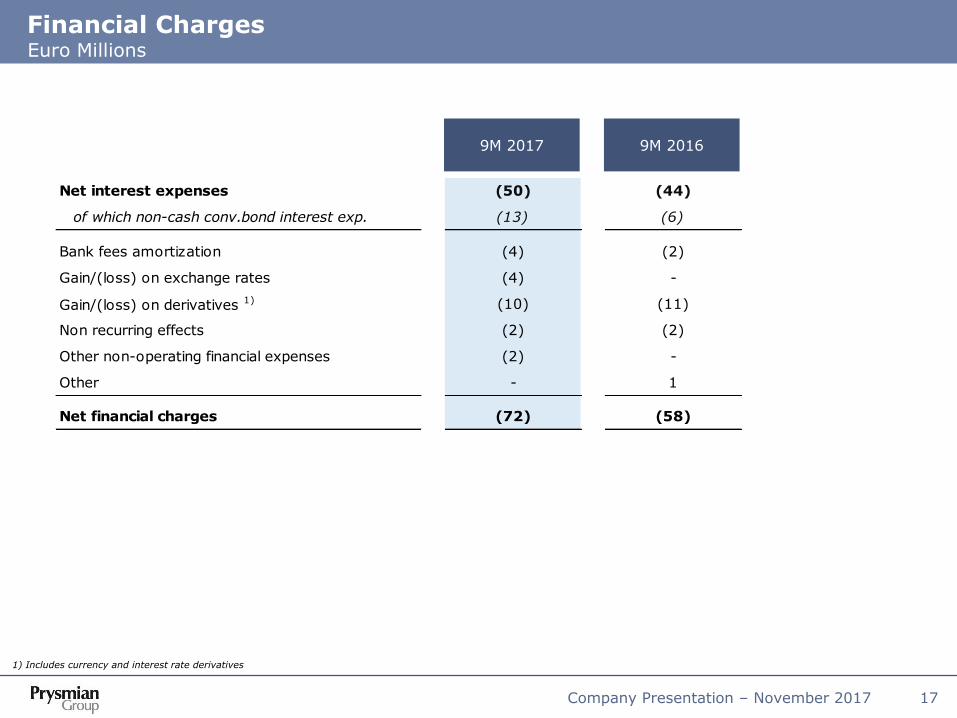
Financial ChargesEuro Millions
1) Includes currency and interest rate derivatives
9M 2017 9M 2016
Net interest expenses (50) (44)
of which non-cash conv.bond interest exp. (13) (6)
Bank fees amortization (4) (2)
Gain/(loss) on exchange rates (4) -
Gain/(loss) on derivatives 1) (10) (11)
Non recurring effects (2) (2)
Other non-operating financial expenses (2) -
Other - 1
Net financial charges (72) (58)
Company Presentation – November 2017 18
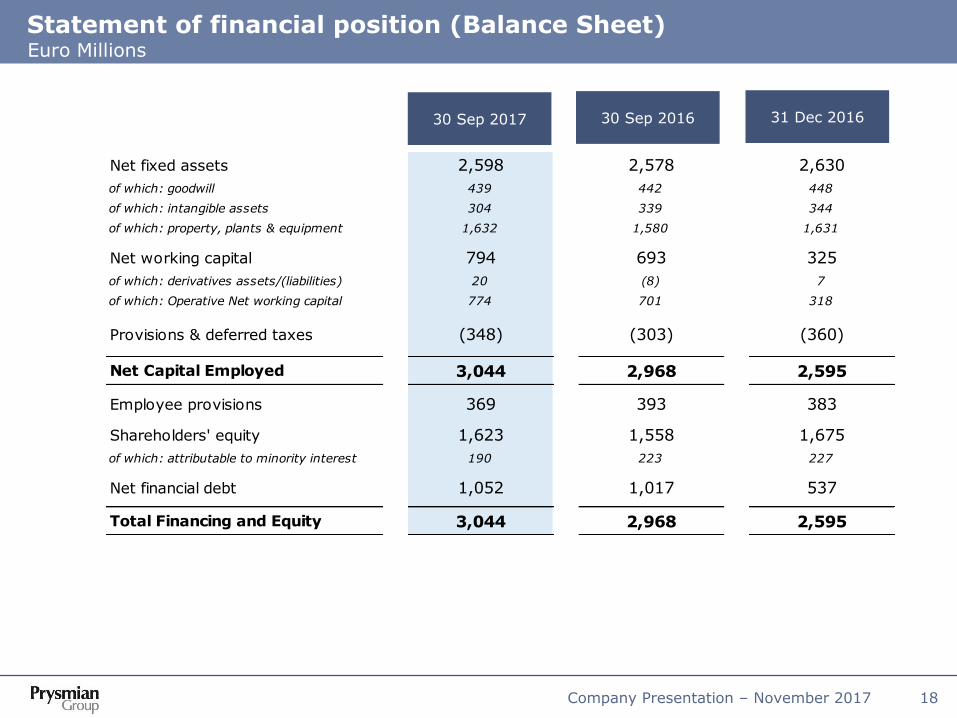
Statement of financial position (Balance Sheet)Euro Millions
30 Sep 2017 30 Sep 2016 31 Dec 2016
Net fixed assets 2,598 2,578 2,630
of which: goodwill 439 442 448
of which: intangible assets 304 339 344
of which: property, plants & equipment 1,632 1,580 1,631
Net working capital 794 693 325
of which: derivatives assets/(liabilities) 20 (8) 7
of which: Operative Net working capital 774 701 318
Provisions & deferred taxes (348) (303) (360)
Net Capital Employed 3,044 2,968 2,595
Employee provisions 369 393 383
Shareholders' equity 1,623 1,558 1,675
of which: attributable to minority interest 190 223 227
Net financial debt 1,052 1,017 537
Total Financing and Equity 3,044 2,968 2,595

Company Presentation – November 2017 19
Cash FlowEuro Millions
9M 2017 9M 201612 Months (from
1/10/2016 to 30/9/2017)
* Calculated as FCF (levered) excluding “acquisitions of assets of ShenHuan” and “Acquisitions & Disposals”.
Adj.EBITDA 545 527 729
Adjustments (33) (39) (60)
EBITDA 512 488 669
Net Change in provisions & others (21) (12) (9)
Share of income from investments in op.activities (36) (24) (43)
Cash Flow from operations (bef. WC changes) 455 452 617
Working Capital changes (508) (342) (99)
Dividends received 9 7 12
Paid Income Taxes (78) (53) (101)
Cash flow from operations (122) 64 429
Acquisitions & Disposals (3) - 28
Net Operative CAPEX (164) (152) (239)
of which acquisitions of assets of ShenHuan (35) - (46)
Free Cash Flow (unlevered) (289) (88) 218
Financial charges (50) (57) (61)
Free Cash Flow (levered) (339) (145) 157
Free Cash Flow (levered) excl. Acquisitions & Disposals* (301) (145) 175
Dividends (102) (101) (103)
Treasury shares buy-back & other equity movements (100) - (100)
Net Cash Flow (541) (246) (46)
Net financial debt beginning of the period (537) (750) (1,017)
Net cash flow (541) (246) (46)
Equity component of convertible bond 48 - 48
Other variations (22) (21) (37)
Net financial debt end of the period (1,052) (1,017) (1,052)

Agenda
Company Presentation – November 2017 20
Group overview
Results by business
Outlook
Financial Results
Appendix
o Prysmian at a glance
o OCI Acquisition
o Financials
o Energy Projects and Energy Products
o Telecom

Company Presentation – November 2017 21
9.2%
4.7%
6.3%
3.8%
-0.8%
1.4%
3.2%
4.6%
6.6%
9.1% 9.3%
9.0%
6.8%5.7%
6.5% 6.7%
5.3%6.4%
7.1%
-5%
0%
5%
10%
15%
20%
25%
1998 1999 2000 2001 2002 2003 2004 2005 2006 2007 2008 2009 2010 2011 2012 2013 2014 2015 2016
Sales Energy Sales Telecom Adj.EBIT %
Key milestones
Group Sales - € bn
20052001
Growth by acquisition
Restructuringprocess
Profitable growth
Acquisitions(Siemens,
NKF, MM, BICC)
Closure of 11plants
Disposal of non coreactivities
July 2005:GS
acquisition and birth
of PrysmianGroup
May 2007:Listingon the
Milan Stock Exchange
(IPO)
Listing
20112008
Managing the downturn
Strategicinvestmentspreparing
for theeconomicrecovery
March ‘10:
Prysmianbecame
a fullPublic
Company
Public Company
February ‘11:
Drakaacquisition
#1 Cable Maker
Reacting to downturn through consolidation
1998
Source: 1998-2003 Pirelli Group Annual Reports, data reported under Italian GAAP; 2004-2010 Prysmian accounts, data reported under IFRS; 2011 Draka full combined; 2011-2013 restated in application of IFRS 10-11 and reclassification of share of net income
2011-14A new level of operating
efficiency
Post merger integration
2015
3.9
4.6 4.7
3.5
3.13.4
3.7
5.0 5.1 5.1
3.7
4.6
7.7 7.6
7.07.4
2.8
7.6
“Bolt-On” Acquisitions
Acquisitions(GCDT,
Oman CablesIndustry)
6.8

Company Presentation – November 2017 22
Power Distribution
Optical Cables & Fibre
T&I
Submarine
Tlc Copper Cables
PROFITABILITY
High Voltage
Industrial
High
Medium
Low
MediumLow High
Oil&Gas
LONG TERM GROWTH
~ 76% of FY’16
Adj.EBITDA
Prysmian Group business portfolio
Look for Profitable Growth
• Focus on solutions
• Diversificationand innovation
• Competition on a global basis
• Take selective M&A opportunities
• Focus on products and service
• Limitedproduct diversificationwithin regions
• Regionalcompetition
Manage for Cash
~ 24% of FY’16
Adj.EBITDA
Focus on high value added segments
Network Components

Company Presentation – November 2017 23
Cash Flow generation as key priority to create value for shareholdersLow leverage enabling multiple capital deployment opportunities.
0
0.2
0.4
0.6
0.8
1
1.2
1.4
1.6
1.8
2
0
50
100
150
200
250
300
350
400
450
500
2011 2012 2013 2014 2015 2016
Free Cash Flow (levered) excl. Acquisition (L Axis) Total Dividends Paid (L Axis)
Net Financial Debt / Adj.EBITDA ratio (R Axis)*
Historical free cash flow generation and Net Financial Debt/Adj.EBITDA ratio (year-end)
Approx. € 250m average Free Cash Flow per year in 2011-16
Approximately € 440m cumulated dividend distributed in the
2011-2016 period.
*2015 Net Financial Debt/adj.EBITDA ratio calculated as Net Financial Debt reported at 31 Dec. 2015 divided by Pro-Forma FY2015 EBITDA including full OCI and GCDT contributions.
Cumulative capex of approx. € 1bn in 2011-2016
Deleveraging from 2,46x Net Debt/adj.EBITDA ratio (FY2010
pro-forma fully combined with Draka) to 0,8x at FY 2016

Company Presentation – November 2017 24
Disciplined Capex to grow in high margin business and out of EuropeInvestments focused on business with long term drivers and high entry barriers
CAPEX 2007-2016 (€ mln)
49 57 63 5483 75 55 49
97 94
89116 107 102
158139 138
163
210233
2007 2008 2009 2010 2011 2012 2013 2014 2015 2016
Cap. Increase & Product mix
2011 Combined; 2012-13 restated in application of IFRS 10-11 and reclassification of share of net income
Prysmian + Draka
Approx. € 680 million
cumulated CAPEX 2007-16 to
sustain growth in strategic
high value-added segments
EMEA72%
North America15%
Latin America4%
APAC9%
FY’16 CAPEX € 233m
Energy Projects23%
Energy Products12%
Telecom5%
Baseload11%
Efficiency30%
IT, R&D7%
Other12%
FY’16 CAPEX € 233m
Cap.increase & Product mix
40%
CAPEX 2016 breakdown
Company Presentation – November 2017 25
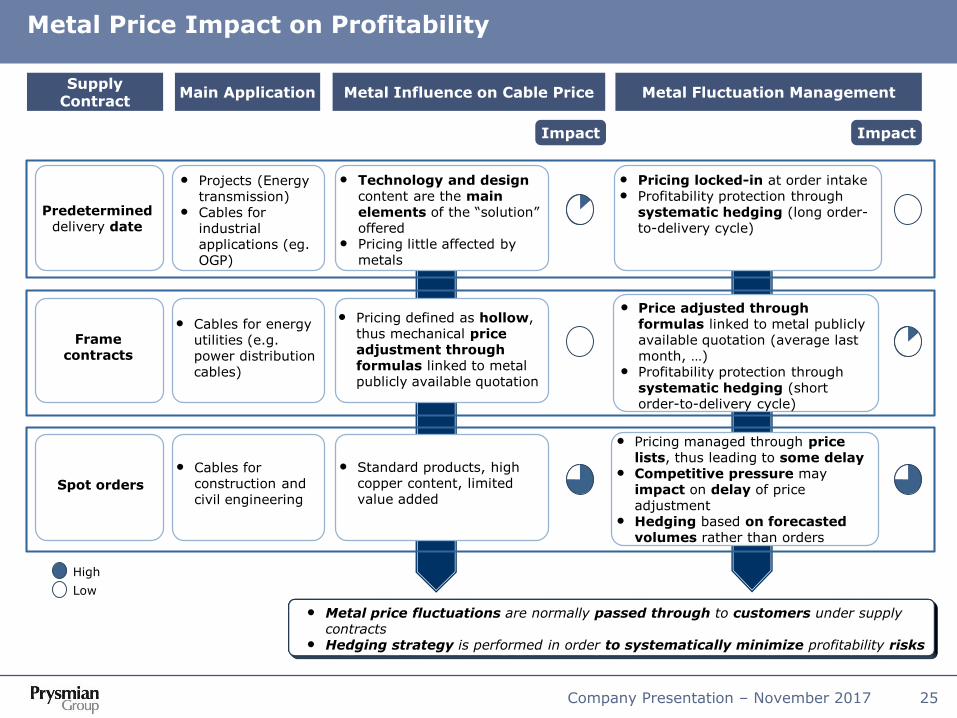
Metal Price Impact on Profitability
• Metal price fluctuations are normally passed through to customers under supply contracts
• Hedging strategy is performed in order to systematically minimize profitability risks
High
Low
• Projects (Energy transmission)
• Cables for industrial applications (eg. OGP)
Predetermined delivery date
Metal Influence on Cable Price Metal Fluctuation ManagementMain ApplicationSupply
Contract
Impact Impact
Framecontracts
• Technology and design content are the main elements of the “solution” offered
• Pricing little affected by metals
Spot orders
• Cables for energy utilities (e.g. power distribution cables)
• Cables for construction and civil engineering
• Pricing defined as hollow, thus mechanical price adjustment through formulas linked to metal publicly available quotation
• Standard products, high copper content, limited value added
• Price adjusted through formulas linked to metal publicly available quotation (average last month, …)
• Profitability protection through systematic hedging (short order-to-delivery cycle)
• Pricing locked-in at order intake• Profitability protection through
systematic hedging (long order-to-delivery cycle)
• Pricing managed through price lists, thus leading to some delay
• Competitive pressure may impact on delay of price adjustment
• Hedging based on forecasted volumes rather than orders

Agenda
Company Presentation – November 2017 26
Group overview
Results by business
Outlook
Financial Results
Appendix
o Prysmian at a glance
o OCI Acquisition
o Financials
o Energy Projects and Energy Products
o Telecom

Company Presentation – November 2017 27
Focus on Oman Cables Industry AcquisitionA perfect example of “Bolt-on” acquisition.
Structure of the Deal2015 Sales Breakdown (€ million (1))
STRUCTURE OF THE DEAL
• Acquisition of approx. 16% stake in listed company OCI
• Total cash consideration € 105 million
• OCI Balance Sheet consolidated at 31 Dec 2015; P&L consolidated as of 1st Jan 2016.
STRATEGIC RATIONALE
• Geographic diversification toward middle-east region.
• No import duties in GCC market.
• Low integration risk. Solid track record.
Product Range
Strategic Position
• Building Wire and Cable
• LV and MV power cables (up to 33kV)
• Control cables for industrial applications
Domestic
43%MENA
57%
Sales FY15 € 664 m
(1) 2015 average EUROMR spot FX rate 0.4268
GCC area
Agenda
Company Presentation – November 2017 28
Group overview
Results by business
Outlook
Financial Results
Appendix
o Prysmian at a glance
o OCI Acquisition
o Financials
o Energy Projects and Energy Products
o Telecom

Company Presentation – November 2017 29
Profit and Loss StatementEuro Millions
9M 2017 9M 2016
Sales 5,865 5,660
YoY total growth 3.6% 1.6%
YoY organic growth (1.1%) 1.8%
Adj.EBITDA 545 527
% on sales 9.3% 9.3%
of which share of net income 36 24
Adjustments (33) (39)
EBITDA 512 488
% on sales 8.7% 8.6%
Adj.EBIT 413 398
% on sales 7.0% 7.0%
Adjustments (33) (39)
Special items (39) (26)
EBIT 341 333
% on sales 5.8% 5.9%
Financial charges (72) (58)
EBT 269 275
% on sales 4.6% 4.9%
Taxes (75) (77)
% on EBT (28.0%) (28.0%)
Net Income 194 198
% on sales 3.3% 3.5%
Minorities (2) 10
Group Net Income 196 188
% on sales 3.3% 3.3%
Company Presentation – November 2017 30
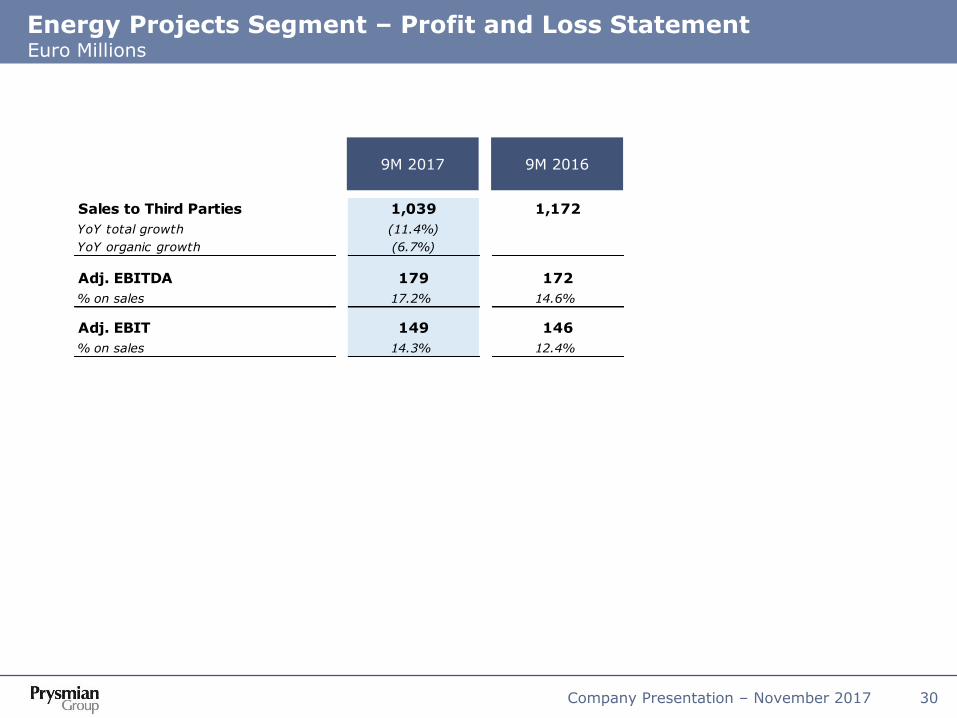
Energy Projects Segment – Profit and Loss StatementEuro Millions
9M 2017 9M 2016
Sales to Third Parties 1,039 1,172
YoY total growth (11.4%) 18.0%
YoY organic growth (6.7%) 20.9%
Adj. EBITDA 179 172
% on sales 17.2% 14.6%
Adj. EBIT 149 146
% on sales 14.3% 12.4%

Company Presentation – November 2017 31
Energy Products Segment – Profit and Loss StatementEuro Millions
9M 2017 9M 2016
Sale
s t
o T
hird P
art
ies
Adj.
EBIT
DA
Adj.
EBIT
E&I 2,467 2,300
YoY total growth 7.3% 5.8%
YoY organic growth (1.2%) (1.9%)
Industrial & Netw. Comp. 1,100 1,021
YoY total growth 7.7% (10.2%)
YoY organic growth 2.2% (2.5%)
Other 105 77
YoY total growth 37.4% (11.0%)
YoY organic growth 0.0% (3.9%)
ENERGY PRODUCTS 3,672 3,398
YoY total growth 8.1% (0.0%)
YoY organic growth (0.2%) (2.1%)
E&I 107 123% on sales 4.3% 5.4%
Industrial & Netw. Comp. 88 95
% on sales 8.0% 9.3%
Other (1) (1)
% on sales (1.1%) (0.8%)
ENERGY PRODUCTS 194 217
% on sales 5.3% 6.4%
E&I 64 76% on sales 2.6% 3.3%
Industrial & Netw. Comp. 72 81
% on sales 6.6% 7.9%
Other (2) (2)
% on sales (2.2%) (2.2%)
ENERGY PRODUCTS 134 155
% on sales 3.7% 4.6%

Company Presentation – November 2017 32
Oil&Gas Segment – Profit and Loss StatementEuro Millions
9M 2017 9M 2016
Sales to Third Parties 201 225
YoY total growth (10.9%)
YoY organic growth (13.0%)
Adj. EBITDA 5 9
% on sales 2.3% 4.1%
Adj. EBIT (8) (2)
% on sales (3.8%) (1.0%)

Company Presentation – November 2017 33
Telecom Segment – Profit and Loss StatementEuro Millions
9M 2017 9M 2016
Sales to Third Parties 953 865
YoY total growth 10.2% 2.2%
YoY organic growth 5.9% 8.4%
Adj. EBITDA 167 129
% on sales 17.6% 14.9%
Adj. EBIT 138 99
% on sales 14.5% 11.4%
Agenda
Company Presentation – November 2017 34
Group overview
Results by business
Outlook
Financial Results
Appendix
o Prysmian at a glance
o OCI Acquisition
o Financials
o Energy Projects and Energy Products
o Telecom

Company Presentation – November 2017 35
Giulio Verne
- Length overall: 124m
- Depth moulded: 6.8m
- Gross tonnage: 8,328 t
- Length overall: 133.2m
- Depth moulded: 7.6m
- Gross tonnage: 10,617 t
Drammen (Norway)Arco Felice (Italy)
Investing in submarine to increase ROCEStrengthening production and installation capabilities
Cable Enterprise
• Western Link
• BorWin 3 / DolWin 3
• Messina II
• Mon.Ita.
• Hainan 2
• Shannon River
• West of Adlergrund
• Cyclades
• Philippines
• Wikinger
• COBRA cable
• France offshore wind
Main projects in execution/orders backlog:
Pikkala (Finland)
Giulio VerneUlisse
- Length overall: 120.1m
- Depth moulded: 7.6m
- Gross tonnage: 10.157 t
Company Presentation – November 2017 36
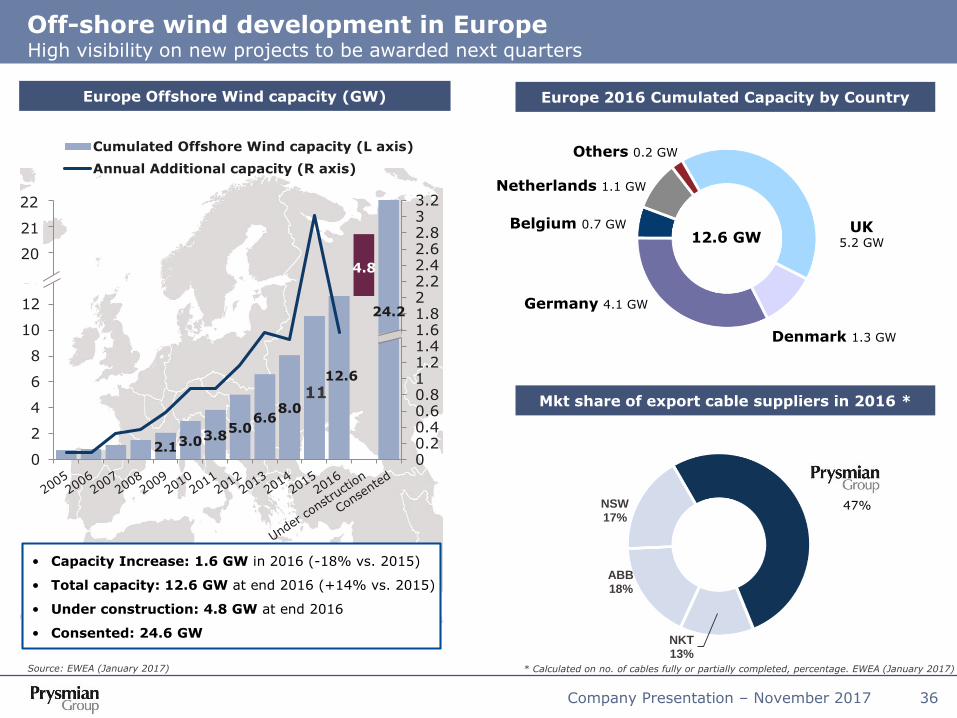
NKT13%
ABB18%
NSW17%
High visibility on new projects to be awarded next quarters
Off-shore wind development in Europe
12.6 GWUK
5.2 GW
Belgium 0.7 GW
Germany 4.1 GW
Denmark 1.3 GW
Netherlands 1.1 GW
Others 0.2 GW
2.13.03.85.0
6.68.0
12.6
24.2
00.20.40.60.811.21.41.61.822.22.42.62.833.2
0
2
4
6
8
10
12
14
16
18
20
Th
ou
san
ds
Cumulated Offshore Wind capacity (L axis)
Annual Additional capacity (R axis)
Source: EWEA (January 2017)
21
22
20
• Capacity Increase: 1.6 GW in 2016 (-18% vs. 2015)
• Total capacity: 12.6 GW at end 2016 (+14% vs. 2015)
• Under construction: 4.8 GW at end 2016
• Consented: 24.6 GW
Europe 2016 Cumulated Capacity by CountryEurope Offshore Wind capacity (GW)
47%
Mkt share of export cable suppliers in 2016 *
* Calculated on no. of cables fully or partially completed, percentage. EWEA (January 2017)
11
4.8
Company Presentation – November 2017 37
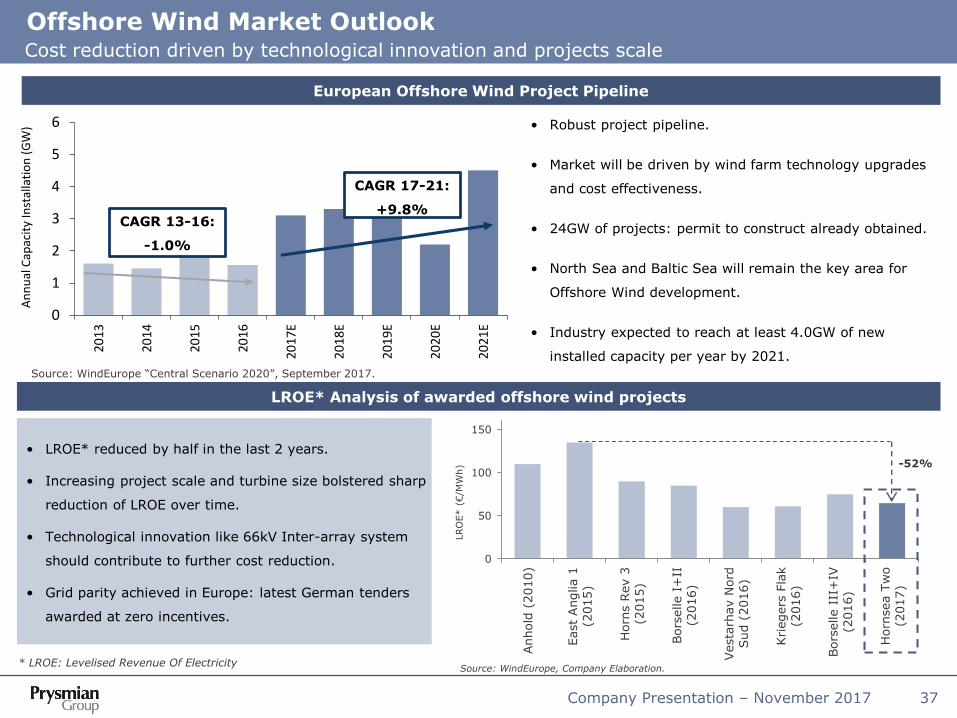
Cost reduction driven by technological innovation and projects scale
Offshore Wind Market Outlook
0
50
100
150
Anhold
(2010)
East
Anglia 1
(2015)
Horn
s R
ev 3
(2015)
Bors
elle I
+II
(2016)
Vesta
rhav N
ord
Sud (
2016)
Kri
egers
Fla
k
(2016)
Bors
elle I
II+
IV
(2016)
Horn
sea T
wo
(2017)
LROE* Analysis of awarded offshore wind projects
Source: WindEurope, Company Elaboration.* LROE: Levelised Revenue Of Electricity
LRO
E* (
€/M
Wh) -52%
European Offshore Wind Project Pipeline
Source: WindEurope “Central Scenario 2020”, September 2017.
• Robust project pipeline.
• Market will be driven by wind farm technology upgrades
and cost effectiveness.
• 24GW of projects: permit to construct already obtained.
• North Sea and Baltic Sea will remain the key area for
Offshore Wind development.
• Industry expected to reach at least 4.0GW of new
installed capacity per year by 2021.
• LROE* reduced by half in the last 2 years.
• Increasing project scale and turbine size bolstered sharp
reduction of LROE over time.
• Technological innovation like 66kV Inter-array system
should contribute to further cost reduction.
• Grid parity achieved in Europe: latest German tenders
awarded at zero incentives.
0
1
2
3
4
5
6
2013
2014
2015
2016
2017
E
2018
E
2019
E
2020
E
2021
E
An
nu
al C
apac
ity
Inst
alla
tio
n (
GW
)
CAGR 13-16:
-1.0%
CAGR 17-21:
+9.8%

Company Presentation – November 2017 38
1. Germany (HVDC Grid Offshore)
2. France Off-Shore (Inter-Array)
3. Western Isles Link
4. Green Connector
5. Denmark – UK (Viking Link)
6. Tunisia – Italy
7. Marseille – Languedoc
8. France – UK (FAB)
9. Sardinia-Corsica-Ita (SACOI3)1
2
3
4
Source: ENTSO-E
Main power flow trends
Main planned subsea & underground projects
6
7
Main subsea and underground projects of pan-European significance
5
List of main projects
Other Projects: Spain-France (sub), Ireland-France (sub), Israel-Cyprus-Crete-Greece (sub), Ireland-UK (sub), Egypt-Saudi Arabia (sub), North-South Germany (underground).
Major transmission projects to be awarded Large pipeline of pan-European projects under development
8
9

Company Presentation – November 2017 39
Latest submarine projects awarded
* Prysmian portion of the project
• Track record and reliability
• Ability to design/execute turnkey solution
• Quality of network services
• Product innovation
• State-of-the-art cable laying ships
• Cable Enterprise vessel conversion to improve installation capacity
• New investment worth approx. €40m in Pikkala and Arco Felice to enhance the production capability to meet the order backlog requirements
• Leverage on strong off-shore wind-farms trend
• Secure orders to protect long-term growth
• Focus on execution
Key success factors
Action plan
IFA2 RTE / National Grid 2018-20 350
ElecLink Groupe Eurotunnel 2017-19 79
COBRA cable TenneT – Energinet.dk 2016-18 250
Hainan II China South Grid 2016-19 $140m
NSN Link Statnett SF – National Grid 2015-21 550
West of Adlergrund Option 50Hertz Offshore GmbH 2015-18 230
Wikinger Iberdrola Renovables Offshore 2015-17 60
Philippines NGCP 2015-16 90
Dardanelles 2 TEIAS 2015-16 64
Cyclades IPTO 2015-16 95
West of Adlergrund 50Hertz Offshore GmbH 2015-18 480
Shannon River Crossing ESB 2014-16 40
Zakum offshore oil field Emirates Holding 2014-15 30
BorWin3 TenneT 2014-17 250
Capri Terna 2014-15 70
US Offshore platforms ExxonMobil's 2014-15 $100m
Balearic Islands Red Eléctrica de España 2014-15 85
DolWin3 TenneT 2014-16 350
Normandie 3 Jersey Electricity plc 2013-14 45
Mon.Ita Terna 2013-17 400
Dardanelles TEIAS 2012-14 67
Phu Quoc EVNSPC 2012-14 67
Western Link National Grid-Scottish Power JV 2012-17 800
HelWin2 TenneT 2012-15 200
Hudson Project Hudson Transm. Partners LLC 2012-13 $175m
SylWin1 TenneT 2012-15 280
Latest Key projects Customers Period €m*

Company Presentation – November 2017 40
Oilfield structure
Manifold
UmbilicalInjectioncontrol
UmbilicalFor control
Umbilical(Power)
Floating Platform(SEMI-SUBMERSIBLE)
Flexible
Pipes
Floating Platform(FPSO)
Fixed Platform
ChristmasTree
Petrol Well
Flexible Pipes
SURF – Off-shore oil exploration

Company Presentation – November 2017 41
SURF – Off-shore oil exploration
HYBRID ELECTRO-OPTIC
FIBER OPTIC
ELECTRICAL
GAS & FLUID TUBING
PACKAGED GAS & FLUID TUBING
Downhole Technology (DHT)
Cross selling opportunities driven by the Downhole technology business contributed by Draka

Company Presentation – November 2017 42
Trade & Installers – Overview
Global partner with strong local presence
Full Product range
Technological leadership and product excellence
Customer centric approach
Capillary logistical distribution network and
service
Technical support
Extra services
Unique industry expertize
Contractors & Installers
KEY CUSTOMERS
KEY SUCCESS FACTORS
Wholesalers Specialized distributors
• Building wires, Low and Medium voltage cables for residential, commercial, industrial and infrastructure constructions
• Partner of the World best Wholesalers, Installers, Contractors & Specialized Distributors; with a clear focus on their needs following a Customer Centricity approach
• Complete product range of solutions for the construction world, including residential, commercial, industrial and infrastructure with focus on high performance products: best in class Fire Resistant cables, LSOH, Green cables, Easy to Install and Total Cost of Ownership reduction solutions
BUSINESS DESCRIPTION

Company Presentation – November 2017 43
Trade & Installers
Offer overview
BEST IN CLASS FIRE RESISTANT AND LSOH CABLES
- Full range quality Building Wires, Low voltage, Medium voltage, Instrumentation & control
- Easy to install solutions
- Smart Packaging
- Hybrid cables Energy + Data
- Green products- Recycled
packaging- Full life cycle
assessment approach
- POWER SUPPLY- EMERGENCY CIRCUITS- CONNECTIONS- MACHINERY (MOBILE OR NOT)- SWITCHBOARD
- LIGHTING (INTERIOR/EXTERIOR)
- BRANCHES- CONTROL/DATA- ELECTRICAL APPLIANCES
RESIDENTIAL – COMMERCIAL –INDUSTRIAL - INFRASTRUCTURE
SAFETY QUALITY
SUSTANABILITYSAVING TIME
- Fire fightingsystems
Special fire safetyand eco-friendlycables for the site hosting the Milan Universal Exposition of 2015: 50 km of medium voltage P-Laser cables and 300 km of lowvoltage Afumexcables
Approximately 350 km of high-tech fire-resistant cables for power distribution supplied within the Shard skyscraper, the tallest building in London and Western Europe. Prysmianchosen as global supplier of BASEC and LPCB certified cables and components, and of support and advice to the construction company on the best installation methods to use
Around 500 km of cables for Tele2 Arena, a new, ultra-modern multi-purpose stadium in Stockholm. Prysmian Group has supplied halogen-free cables for the stadium’s power, telecommunication, and lighting systems, selected by the customer as the latest technology to guarantee safety
A MAJOR ROLE IN MILAN 2015 EXPO
TAKING SAFETY TO NEW HEIGHTS
THE LIVES OF THESE PEOPLE DO NOT HANG BY A THREAD

Company Presentation – November 2017 44
ElevatorMeeting the global demand for high-performing, durable and safe elevator cable and components we design manufacture and distribute packaged solutions for the elevator industry
AutomotiveStandard and specialist cables for the automotive and transport industry, collaborating with the sector’s leading internationalmanufacturers
Specialties & OEM Products for mining, crane , marine, railway, rolling stock, nuclear, renewables, defense and other niches
Integrated cable solutions highly customized to our industrial customers worldwide
Large and differentiated customer base generally served through direct sales
Industrial & Network Components – Overview
Business description Key customers
Network ComponentsNetwork accessories and components to connect cables and other network elements

Company Presentation – November 2017 45
Product macro structure Production process
Conductor (Cu, Al)
Internal Semiconductive
Insulation (XLPE, EPDM)
External Semiconductive
WB yarns
Cu tape
Outer jacket (Polyolefine, PVC, …)
Conductor
production
(drawing,
stranding)
Insulation Screening Sheathing Lay up Armouring
Final
quality
inspection
Building
Wire
(T&I)
Low Voltage
(T&I+PD)
Medium
Voltage
High voltage
(PD+HV)
Industrial
Cables
(Industrial)
Macro-structure of Energy Cables
Agenda
Company Presentation – November 2017 46
Group overview
Results by business
Outlook
Financial Results
Appendix
o Prysmian at a glance
o OCI Acquisition
o Financials
o Energy Projects and Energy Products
o Telecom

Company Presentation – November 2017 47
Telecom solutionsOptical cables: tailored for all today’s challenging environments from underground ducts to overhead lines, rail tunnels and sewerage pipes Copper cables: broad portfolio for underground and overhead solutions, residential and commercial buildingsConnectivity: FTTH systems based upon existing technologies and specially developed proprietary optical fibres
Optical FiberOptical fiber products: single-mode optical fiber, multimode optical fibers and specialty fibers (DrakaElite)Manufacturing: our proprietary manufacturing process for Plasma-activated Chemical Vapor Deposition and Licensed OVD Technology (600 unique inventions corresponding to > 1.4K patents) positions us at the forefront of today’s technology
Integrated cable solutions focused on high -end Telecom Key customers include key operators in the telecom sector
MMSMultimedia specials: solutions for radio, TV and film, harsh industrial environments, radio frequency, central office switching and datacomMobile networks: Antenna line products for mobile operatorsRailway infrastructure: Buried distribution & railfoot cables for long distance telecommunication and advanced signalling cables for such applications as light signalling and track switching
Telecom – Overview
Business description Key customers

Company Presentation – November 2017 48
Optical cables Global overview
• Fiber optic represents the major single
component cost of optical cables
• Fiber optic production has high entry barriers:
• Proprietary technology or licenses difficult
to obtain
• Long time to develop know-how
• Capital intensity
• When fiber optic is short, vertically integrated
cable manufacturers leverage on a strong
competitive advantage
• Maintain & reinforce position with key
established clients
• Further penetration of large incumbents in
emerging regions
• Optimize utilization of low cost manufacturing
units
• Expand distribution model in Domestic & Export
• Streamline the inter-company process
• Fully integrated products sales
• Refocus on export activities
• Increase level and effectiveness of agents
• Demand function of level of capital expenditures
budgeted by large telecom companies
(PTT/incumbents as well as alternative
operators) for network infrastructures, mainly
as a consequence of:
• Growing number of internet users data
traffic
• Diffusion of broadband services / other high-
tech services (i.e. IPTV)
• Continuous innovation and development of new
cable & fibre products
• Cable design innovation with special focus on
installation cost reduction
• Relentless activity to maintain the highest quality
and service level
• Focus on costs to remain competitive in a highly
price sensitive environment
Action planStrategic value of fibre
Key success factorsMarket trends

Company Presentation – November 2017 49
BACKBONE METROPOLITAN RING ACCESS NETWORK
Telecom Cables Main Applications

Company Presentation – November 2017 50
Digital Agenda for EuropeSetting up guidelines for all Member States to facilitate broadband development.
Source: Europe’s Digital Progress Report 2017
NGA Coverage by Region2020 TARGETS
• 100% coverage with 30Mbps download
speed
• 50% take-up of 100Mbps subscription.
• New targets have to be confirmed by EU
Commission and Parliament.
• 1 Gigabit download speed for schools,
transport hubs, public services and digital
intensive enterprises.
• 100Mbps download speed for 100%
households.
• 1 Gigabit download speed in all urban areas.
• Uninterrupted 5G coverage in urban areas
and major transport paths by 2025.
NEW 2025 TARGETS PROPOSAL
Company Presentation – November 2017 51
0
2
4
6
8
10
2013 2014 2015 2016 2017E
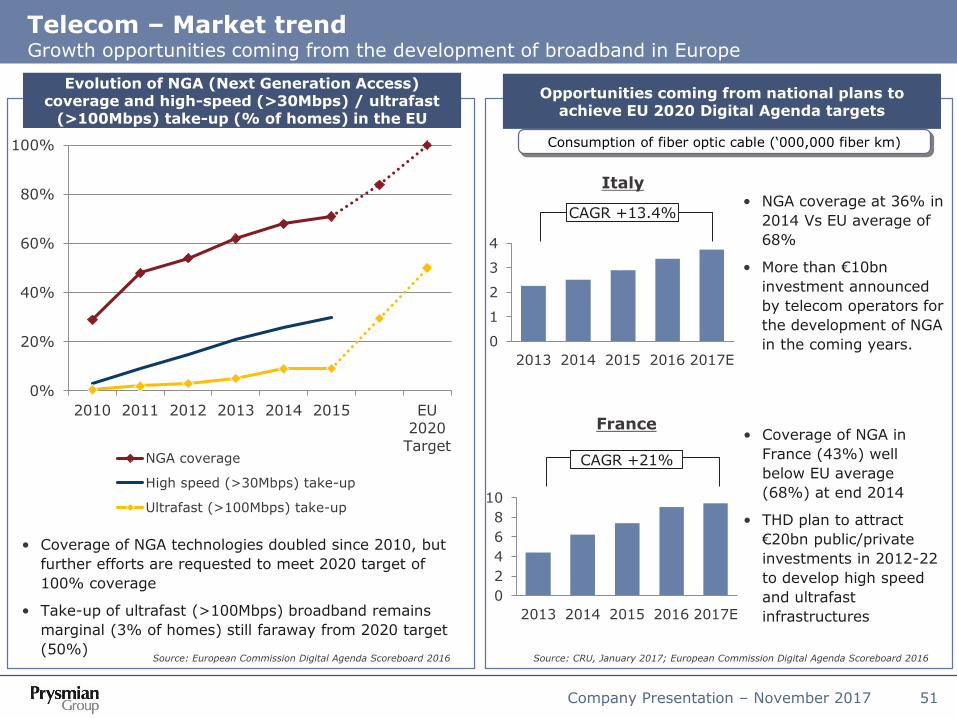
Telecom – Market trendGrowth opportunities coming from the development of broadband in Europe
0%
20%
40%
60%
80%
100%
2010 2011 2012 2013 2014 2015 EU2020
TargetNGA coverage
High speed (>30Mbps) take-up
Ultrafast (>100Mbps) take-up
• Coverage of NGA technologies doubled since 2010, but
further efforts are requested to meet 2020 target of
100% coverage
• Take-up of ultrafast (>100Mbps) broadband remains
marginal (3% of homes) still faraway from 2020 target
(50%)
Italy
Source: CRU, January 2017; European Commission Digital Agenda Scoreboard 2016
France• Coverage of NGA in
France (43%) well
below EU average
(68%) at end 2014
• THD plan to attract
€20bn public/private
investments in 2012-22
to develop high speed
and ultrafast
infrastructures
• NGA coverage at 36% in
2014 Vs EU average of
68%
• More than €10bn
investment announced
by telecom operators for
the development of NGA
in the coming years.
Source: European Commission Digital Agenda Scoreboard 2016
0
1
2
3
4
2013 2014 2015 2016 2017E
CAGR +13.4%
Evolution of NGA (Next Generation Access) coverage and high-speed (>30Mbps) / ultrafast
(>100Mbps) take-up (% of homes) in the EU
Consumption of fiber optic cable (‘000,000 fiber km)
Opportunities coming from national plans to achieve EU 2020 Digital Agenda targets
CAGR +21%
Company Presentation – November 2017 52
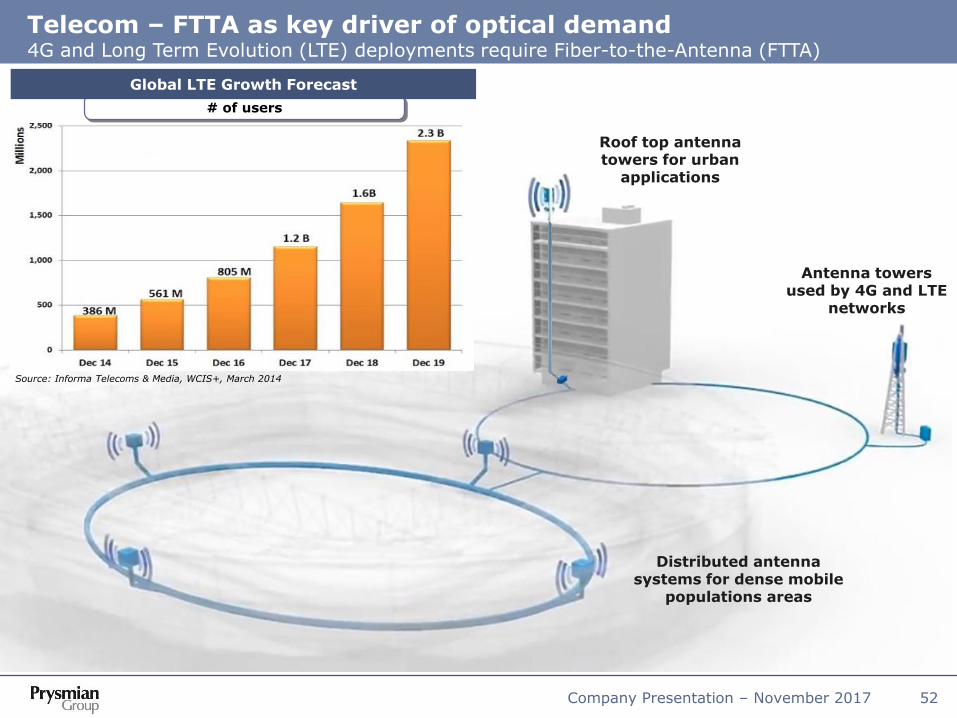
Antenna towersused by 4G and LTE
networks
Roof top antenna towers for urban
applications
Distributed antenna systems for dense mobile
populations areas
Telecom – FTTA as key driver of optical demand4G and Long Term Evolution (LTE) deployments require Fiber-to-the-Antenna (FTTA)
# of users
Global LTE Growth Forecast
Source: Informa Telecoms & Media, WCIS+, March 2014
Company Presentation – November 2017 53
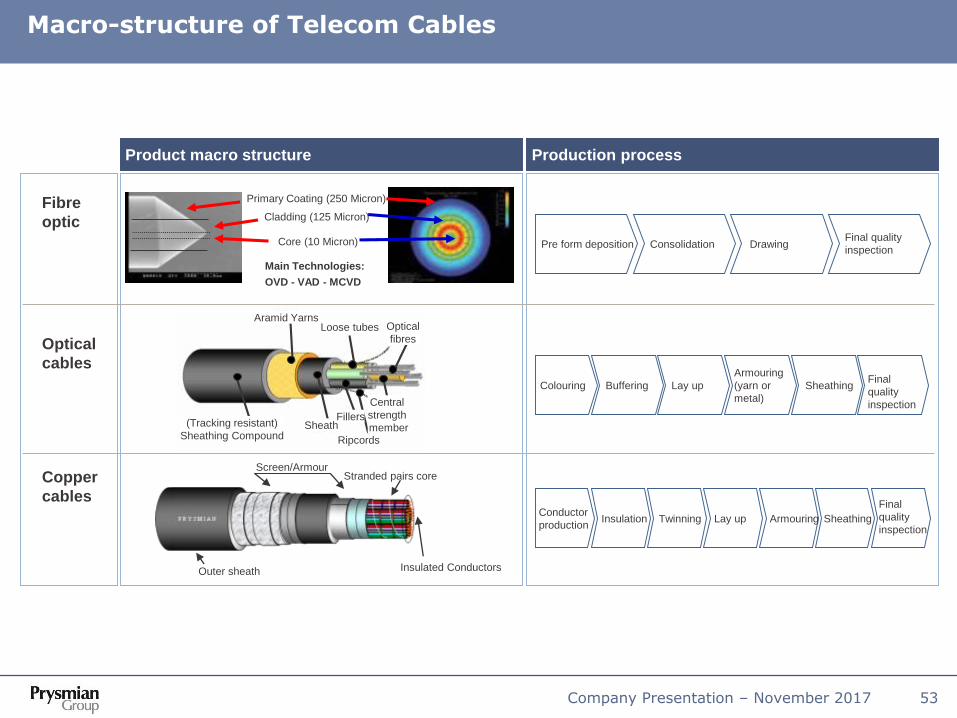
Product macro structure Production process
Main Technologies:
OVD - VAD - MCVD
Core (10 Micron)
Cladding (125 Micron)
Primary Coating (250 Micron)
Pre form deposition Consolidation Drawing
Conductor
productionInsulation Twinning Sheathing Lay up Armouring
Colouring Lay up
Armouring
(yarn or
metal)
Sheathing
Sheath
Ripcords
Fillers
Central
strength
member(Tracking resistant)
Sheathing Compound
Optical
fibresLoose tubes
Aramid Yarns
Stranded pairs coreScreen/Armour
Outer sheath Insulated Conductors
Fibre
optic
Optical
cables
Copper
cables
Final quality
inspection
Final
quality
inspection
Final
quality
inspection
Buffering
Macro-structure of Telecom Cables
Company Presentation – November 2017 54
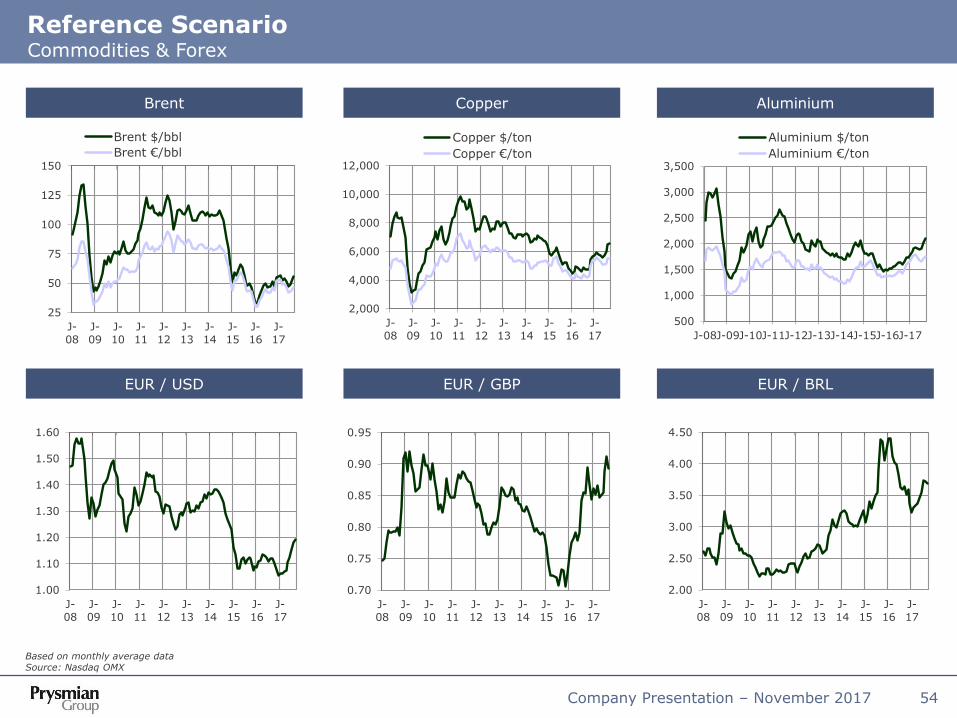
Reference ScenarioCommodities & Forex
Based on monthly average dataSource: Nasdaq OMX
Brent Copper Aluminium
EUR / USD EUR / GBP EUR / BRL
500
1,000
1,500
2,000
2,500
3,000
3,500
J-08J-09J-10J-11J-12J-13J-14J-15J-16J-17
Aluminium $/ton
Aluminium €/ton
2,000
4,000
6,000
8,000
10,000
12,000
J-08
J-09
J-10
J-11
J-12
J-13
J-14
J-15
J-16
J-17
Copper $/ton
Copper €/ton
25
50
75
100
125
150
J-08
J-09
J-10
J-11
J-12
J-13
J-14
J-15
J-16
J-17
Brent $/bbl
Brent €/bbl
2.00
2.50
3.00
3.50
4.00
4.50
J-08
J-09
J-10
J-11
J-12
J-13
J-14
J-15
J-16
J-17
0.70
0.75
0.80
0.85
0.90
0.95
J-08
J-09
J-10
J-11
J-12
J-13
J-14
J-15
J-16
J-17
1.00
1.10
1.20
1.30
1.40
1.50
1.60
J-08
J-09
J-10
J-11
J-12
J-13
J-14
J-15
J-16
J-17

Company Presentation – November 2017 55
Disclaimer
• The managers responsible for preparing the company's financial reports, A.Bott and C.Soprano, declare, pursuant
to paragraph 2 of Article 154-bis of the Consolidated Financial Act, that the accounting information contained in
this presentation corresponds to the results documented in the books, accounting and other records of the
company.
• Certain information included in this document is forward looking and is subject to important risks and
uncertainties that could cause actual results to differ materially. The Company's businesses include its Energy
Projects, Energy Products and Telecom Operating Segments, and its outlook is predominantly based on its
interpretation of what it considers to be the key economic factors affecting these businesses.
• Any estimates or forward-looking statements contained in this document are referred to the current date and,
therefore, any of the assumptions underlying this document or any of the circumstances or data mentioned in this
document may change. Prysmian S.p.A. expressly disclaims and does not assume any liability in connection with
any inaccuracies in any of these estimates or forward-looking statements or in connection with any use by any
third party of such estimates or forward-looking statements. This document does not represent investment advice
or a recommendation for the purchase or sale of financial products and/or of any kind of financial services. Finally,
this document does not represent an investment solicitation in Italy, pursuant to Section 1, letter (t) of Legislative
Decree no. 58 of February 24, 1998, or in any other country or state.
• In addition to the standard financial reporting formats and indicators required under IFRS, this document contains
a number of reclassified tables and alternative performance indicators. The purpose is to help users better
evaluate the Group's economic and financial performance. However, these tables and indicators should not be
treated as a substitute for the standard ones required by IFRS.