PRUDENTIAL PLC FIRST QUARTER 2010 INTERIM … fileIn the first quarter, APE new business across the...
26
Embargo: 07:00 am 17 May 2010 PRUDENTIAL PLC FIRST QUARTER 2010 INTERIM MANAGEMENT STATEMENT NEW RECORD FOR FIRST QUARTER NEW BUSINESS SALES AT £807 MILLION • GROUP-WIDE SALES OF £807 MILLION UP 26 PER CENT. NEW BUSINESS PROFIT UP 27 PER CENT • OUTSTANDING FIRST QUARTER IN ASIA. SALES UP 30 PER CENT, NEW BUSINESS PROFIT UP 35 PER CENT • CONTINUED POWERFUL MOMENTUM IN US. SALES UP 39 PER CENT, NEW BUSINESS PROFIT UP 25 PER CENT • UK FOCUS ON VALUE OVER VOLUME DELIVERS HIGH MARGINS • ASSET MANAGEMENT NET INFLOWS OF £1.2 BILLION • CAPITAL POSITION REMAINS STRONG - IGD SURPLUS ESTIMATED AT £3.4 BILLION 1 Q1 2010 Q1 2009 % change on Q1 09 Group Insurance 2, 3 Sales - APE £807m £640m 26% New Business Profit 4 £427m £336m 27% Margin – APE % 53% 53% - Investment Net Inflows £1,203m £2,728m (56%) Tidjane Thiam, Group Chief Executive said: “Our record performance in 2009 continued into the first quarter of 2010. We maintained our focus of allocating capital to the most profitable opportunities, and as a result have delivered strong growth in new business profit. This first quarter interim management statement represents a significant evolution in our financial communication as it includes for the first time new business profit, as well as new business sales. This change reflects our continued commitment to greater disclosure. In the first quarter, APE new business across the Group was £807 million, up 26 per cent (first quarter 2009: £640 million), and new business profit was £427 million, up almost £100 million and 27 per cent (first quarter 2009: £336 million). In Asia we delivered strong growth in new business compared to the first quarter 2009. APE sales in the first quarter 2010 were £359 million, an increase of 30 per cent on the first quarter last year of £276 million. New business profit for the first quarter was £183 million, an increase of 35 per cent. This performance demonstrates the strength of our businesses in Asia and emphasises the return to economic growth experienced across the region. In the US, Jackson’s focused approach and strict pricing discipline also delivered an improved first quarter with new business profit of 175 million, up 25 per cent (first quarter 2009: £140 million) and APE new business sales of £255 million up 39 per cent (first quarter 2009: £184 million). We maintained our deliberate emphasis on variable annuities in which we ranked fourth in the US in 2009, with a market share of 8 per cent. Prudential UK continued to serve targeted segments of the retirement savings and income markets, emphasising value over volume. This strategy delivered attractive returns on the capital employed in the first
Transcript of PRUDENTIAL PLC FIRST QUARTER 2010 INTERIM … fileIn the first quarter, APE new business across the...

Embargo: 07:00 am 17 May 2010 PRUDENTIAL PLC FIRST QUARTER 2010 INTERIM MANAGEMENT STATEMENT NEW RECORD FOR FIRST QUARTER NEW BUSINESS SALES AT £807 MILLION • GROUP-WIDE SALES OF £807 MILLION UP 26 PER CENT. NEW BUSINESS PROFIT UP 27 PER
CENT • OUTSTANDING FIRST QUARTER IN ASIA. SALES UP 30 PER CENT, NEW BUSINESS PROFIT UP
35 PER CENT • CONTINUED POWERFUL MOMENTUM IN US. SALES UP 39 PER CENT, NEW BUSINESS PROFIT
UP 25 PER CENT • UK FOCUS ON VALUE OVER VOLUME DELIVERS HIGH MARGINS • ASSET MANAGEMENT NET INFLOWS OF £1.2 BILLION • CAPITAL POSITION REMAINS STRONG - IGD SURPLUS ESTIMATED AT £3.4 BILLION 1
Q1 2010 Q1 2009 % change on Q1 09
Group Insurance 2, 3
Sales - APE £807m £640m 26%New Business Profit 4 £427m £336m 27%Margin – APE % 53% 53% - Investment Net Inflows £1,203m £2,728m (56%)
Tidjane Thiam, Group Chief Executive said: “Our record performance in 2009 continued into the first quarter of 2010. We maintained our focus of allocating capital to the most profitable opportunities, and as a result have delivered strong growth in new business profit. This first quarter interim management statement represents a significant evolution in our financial communication as it includes for the first time new business profit, as well as new business sales. This change reflects our continued commitment to greater disclosure. In the first quarter, APE new business across the Group was £807 million, up 26 per cent (first quarter 2009: £640 million), and new business profit was £427 million, up almost £100 million and 27 per cent (first quarter 2009: £336 million). In Asia we delivered strong growth in new business compared to the first quarter 2009. APE sales in the first quarter 2010 were £359 million, an increase of 30 per cent on the first quarter last year of £276 million. New business profit for the first quarter was £183 million, an increase of 35 per cent. This performance demonstrates the strength of our businesses in Asia and emphasises the return to economic growth experienced across the region. In the US, Jackson’s focused approach and strict pricing discipline also delivered an improved first quarter with new business profit of 175 million, up 25 per cent (first quarter 2009: £140 million) and APE new business sales of £255 million up 39 per cent (first quarter 2009: £184 million). We maintained our deliberate emphasis on variable annuities in which we ranked fourth in the US in 2009, with a market share of 8 per cent. Prudential UK continued to serve targeted segments of the retirement savings and income markets, emphasising value over volume. This strategy delivered attractive returns on the capital employed in the first
2
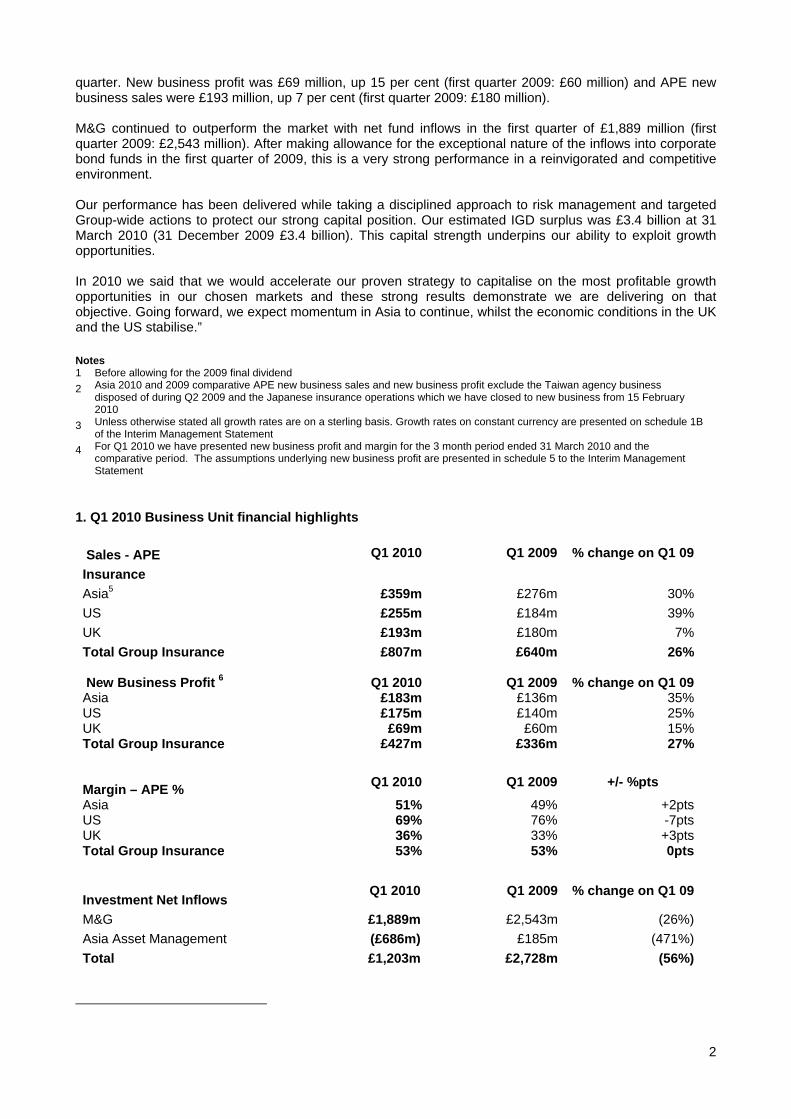
quarter. New business profit was £69 million, up 15 per cent (first quarter 2009: £60 million) and APE new business sales were £193 million, up 7 per cent (first quarter 2009: £180 million). M&G continued to outperform the market with net fund inflows in the first quarter of £1,889 million (first quarter 2009: £2,543 million). After making allowance for the exceptional nature of the inflows into corporate bond funds in the first quarter of 2009, this is a very strong performance in a reinvigorated and competitive environment. Our performance has been delivered while taking a disciplined approach to risk management and targeted Group-wide actions to protect our strong capital position. Our estimated IGD surplus was £3.4 billion at 31 March 2010 (31 December 2009 £3.4 billion). This capital strength underpins our ability to exploit growth opportunities. In 2010 we said that we would accelerate our proven strategy to capitalise on the most profitable growth opportunities in our chosen markets and these strong results demonstrate we are delivering on that objective. Going forward, we expect momentum in Asia to continue, whilst the economic conditions in the UK and the US stabilise.” Notes 1 Before allowing for the 2009 final dividend 2 Asia 2010 and 2009 comparative APE new business sales and new business profit exclude the Taiwan agency business
disposed of during Q2 2009 and the Japanese insurance operations which we have closed to new business from 15 February 2010
3 Unless otherwise stated all growth rates are on a sterling basis. Growth rates on constant currency are presented on schedule 1B of the Interim Management Statement
4 For Q1 2010 we have presented new business profit and margin for the 3 month period ended 31 March 2010 and the comparative period. The assumptions underlying new business profit are presented in schedule 5 to the Interim Management Statement
1. Q1 2010 Business Unit financial highlights Sales - APE Q1 2010 Q1 2009 % change on Q1 09Insurance Asia5 £359m £276m 30%US £255m £184m 39%UK £193m £180m 7%Total Group Insurance £807m £640m 26% New Business Profit 6 Q1 2010 Q1 2009 % change on Q1 09Asia £183m £136m 35% US £175m £140m 25%UK £69m £60m 15%Total Group Insurance £427m £336m 27% Margin – APE % Q1 2010 Q1 2009 +/- %pts Asia 51% 49% +2ptsUS 69% 76% -7ptsUK 36% 33% +3ptsTotal Group Insurance 53% 53% 0pts
Investment Net Inflows Q1 2010 Q1 2009 % change on Q1 09
M&G £1,889m £2,543m (26%) Asia Asset Management (£686m) £185m (471%) Total £1,203m £2,728m (56%)

3
Notes 5 Asia 2010 and 2009 comparative APE new business sales and new business profit exclude the Taiwan agency business
disposed of during Q2 2009 and the Japanese insurance operations which we have closed to new business from 15 February 2010
6 For Q1 2010 we have presented new business profit and margin for the 3 month period ended 31 March 2010 and the comparative period. The assumptions underlying new business profit are presented in schedule 5 to the Interim Management Statement
1.1 Asia Insurance operations
During the first quarter 2010 the Asian economies have continued to perform well and demand for life and savings business is rebounding strongly to pre-crisis levels. Prudential has delivered a very strong quarter, with APE new business sales of £359 million up by 30 per cent over the same period last year. Sales in the first quarter of 2010 at actual exchange rates were the second highest in our history and represent a record first quarter, ahead of the previous best first quarter in 2008. Our high margin South-East Asian operations (including Singapore and Hong Kong), grew APE sales by 53 per cent to £216 million, a clear indication of the potential of these markets. In line with the recovering economic outlook, single premiums are up 66 per cent over the first quarter last year meaning that their proportion of total APE has increased from 5 per cent to 6 per cent. The business mix is in line with the first quarter 2009, linked at 44 per cent, par at 29 per cent and protection at 24 per cent. We have continued to focus on the profitability of the business we write, allocating capital in priority to those markets and products which offer the highest returns. New business profits increased by 35 per cent to £183 million resulting in an improved margin of 51 per cent (first quarter 2009: 49 per cent). Looking at developments of our sales in each major market: China
In China, Prudential’s share of new business sales for the first quarter 2010, is £14 million (reflecting our 50 per cent ownership) up 27 per cent on 2009 and represents our strongest quarter ever in both local currency and at actual exchange rates. Recruiting and retaining agents in China remains challenging and CITIC-Prudential’s average agent numbers have declined by 20 per cent compared to the first quarter last year. However, this has been more than offset by a significant increase in average APE per case of 31 per cent and an increase in agent activity. The bancassurance channel is also performing very well with sales up 47 per cent. Our joint venture partner CITIC-Bank in particular is showing strong growth and generated 32 per cent of the total bank new business in the quarter. Hong Kong
Hong Kong delivered a very strong first quarter with March 2010 being the second highest production month ever in terms of APE for the agency channel after December 2009. A key driver of that performance is the 40 per cent increase we have achieved in the average case size as confidence returns to the market, coupled with the launch of a new linked product. Average agent numbers in the first quarter are up 14 per cent over the same period last year. The bank channel also continues to perform well and is demonstrating strong momentum over the same period last year, with new business sales up 48 per cent.
Asia Q1 2010 Q1 2009 % change on Q1 09Sales - APE £359m £276m 30%New Business Profit £183m £136m 35%Margin – APE % 51% 49% +2pts
Q1 2010 Q1 2009 % change on Q1 09 APE £14m £11m 27%
Q1 2010 Q1 2009 % change on Q1 09 APE £68m £46m 48%
4
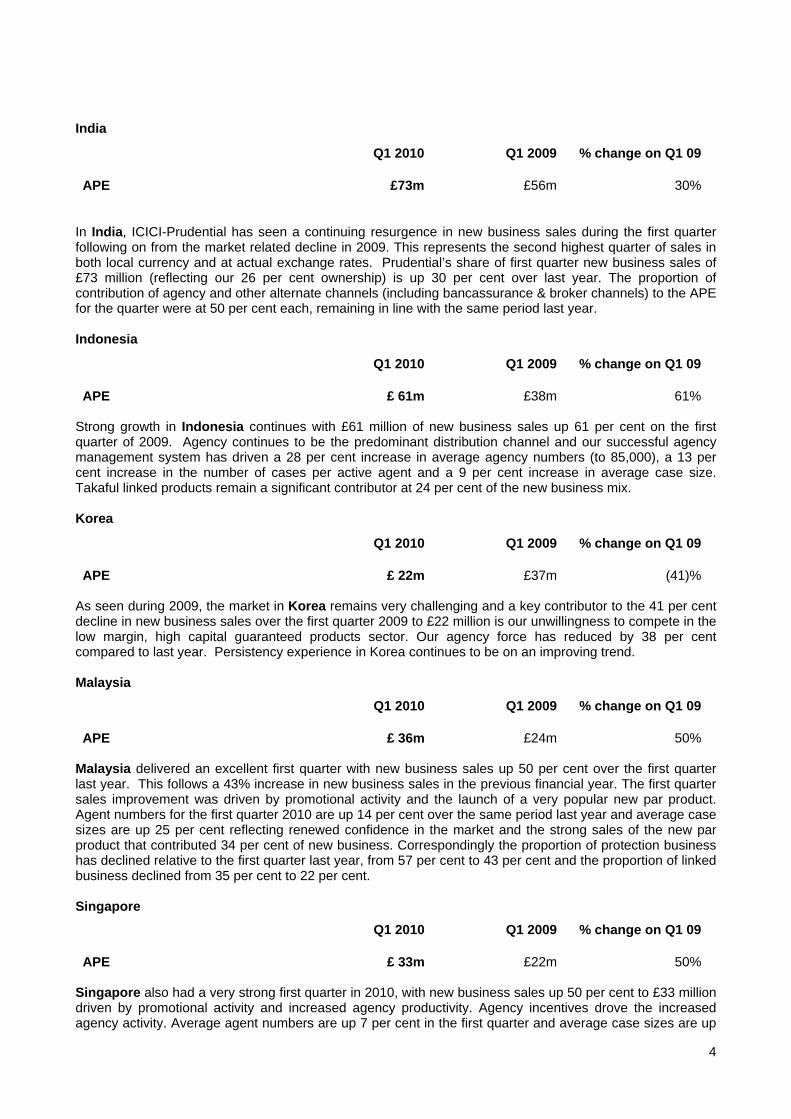
India
In India, ICICI-Prudential has seen a continuing resurgence in new business sales during the first quarter following on from the market related decline in 2009. This represents the second highest quarter of sales in both local currency and at actual exchange rates. Prudential’s share of first quarter new business sales of £73 million (reflecting our 26 per cent ownership) is up 30 per cent over last year. The proportion of contribution of agency and other alternate channels (including bancassurance & broker channels) to the APE for the quarter were at 50 per cent each, remaining in line with the same period last year. Indonesia
Strong growth in Indonesia continues with £61 million of new business sales up 61 per cent on the first quarter of 2009. Agency continues to be the predominant distribution channel and our successful agency management system has driven a 28 per cent increase in average agency numbers (to 85,000), a 13 per cent increase in the number of cases per active agent and a 9 per cent increase in average case size. Takaful linked products remain a significant contributor at 24 per cent of the new business mix. Korea
As seen during 2009, the market in Korea remains very challenging and a key contributor to the 41 per cent decline in new business sales over the first quarter 2009 to £22 million is our unwillingness to compete in the low margin, high capital guaranteed products sector. Our agency force has reduced by 38 per cent compared to last year. Persistency experience in Korea continues to be on an improving trend. Malaysia
Malaysia delivered an excellent first quarter with new business sales up 50 per cent over the first quarter last year. This follows a 43% increase in new business sales in the previous financial year. The first quarter sales improvement was driven by promotional activity and the launch of a very popular new par product. Agent numbers for the first quarter 2010 are up 14 per cent over the same period last year and average case sizes are up 25 per cent reflecting renewed confidence in the market and the strong sales of the new par product that contributed 34 per cent of new business. Correspondingly the proportion of protection business has declined relative to the first quarter last year, from 57 per cent to 43 per cent and the proportion of linked business declined from 35 per cent to 22 per cent. Singapore
Singapore also had a very strong first quarter in 2010, with new business sales up 50 per cent to £33 million driven by promotional activity and increased agency productivity. Agency incentives drove the increased agency activity. Average agent numbers are up 7 per cent in the first quarter and average case sizes are up
Q1 2010 Q1 2009 % change on Q1 09 APE £73m £56m 30%
Q1 2010 Q1 2009 % change on Q1 09 APE £ 61m £38m 61%
Q1 2010 Q1 2009 % change on Q1 09 APE £ 22m £37m (41)%
Q1 2010 Q1 2009 % change on Q1 09 APE £ 36m £24m 50%
Q1 2010 Q1 2009 % change on Q1 09 APE £ 33m £22m 50%
5
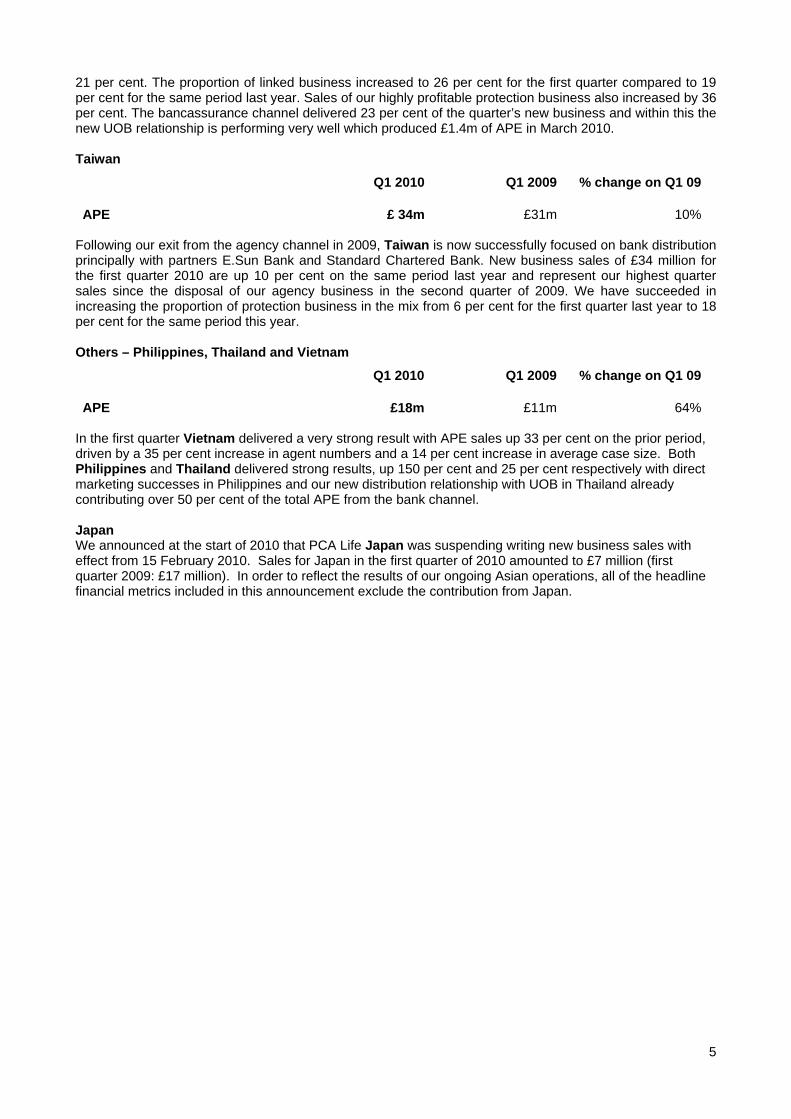
21 per cent. The proportion of linked business increased to 26 per cent for the first quarter compared to 19 per cent for the same period last year. Sales of our highly profitable protection business also increased by 36 per cent. The bancassurance channel delivered 23 per cent of the quarter’s new business and within this the new UOB relationship is performing very well which produced £1.4m of APE in March 2010. Taiwan
Following our exit from the agency channel in 2009, Taiwan is now successfully focused on bank distribution principally with partners E.Sun Bank and Standard Chartered Bank. New business sales of £34 million for the first quarter 2010 are up 10 per cent on the same period last year and represent our highest quarter sales since the disposal of our agency business in the second quarter of 2009. We have succeeded in increasing the proportion of protection business in the mix from 6 per cent for the first quarter last year to 18 per cent for the same period this year. Others – Philippines, Thailand and Vietnam
In the first quarter Vietnam delivered a very strong result with APE sales up 33 per cent on the prior period, driven by a 35 per cent increase in agent numbers and a 14 per cent increase in average case size. Both Philippines and Thailand delivered strong results, up 150 per cent and 25 per cent respectively with direct marketing successes in Philippines and our new distribution relationship with UOB in Thailand already contributing over 50 per cent of the total APE from the bank channel. Japan We announced at the start of 2010 that PCA Life Japan was suspending writing new business sales with effect from 15 February 2010. Sales for Japan in the first quarter of 2010 amounted to £7 million (first quarter 2009: £17 million). In order to reflect the results of our ongoing Asian operations, all of the headline financial metrics included in this announcement exclude the contribution from Japan.
Q1 2010 Q1 2009 % change on Q1 09 APE £ 34m £31m 10%
Q1 2010 Q1 2009 % change on Q1 09 APE £18m £11m 64%

6
1.2 US operations a) Insurance operations
The US equity markets continued to recover during the first quarter of 2010 while interest rates remained generally flat and AA corporate spreads and volatility declined somewhat from year-end 2009 levels. While market conditions have improved, companies that were hit hardest by the market disruption of the last 18 months are still struggling to regain market share as customers are increasingly seeking product providers that offer consistency, stability and financial strength. Jackson has continued to benefit significantly from this flight to quality. Our strategy remains focused on increasing sales in variable annuities whilst managing fixed annuity sales in line with the goal of capital preservation. There were no institutional sales during the first quarter of 2010 as Jackson directed available capital to support higher-margin annuity sales. Jackson delivered APE new business sales of £255 million in the first quarter of 2010, representing a 39 per cent increase over the same period in 2009 and the highest level of sales during the first quarter at actual exchange rates and local currency of any year in the company’s history. Jackson achieved exceptionally high new business margins in 2009, partially as a result of our ability to take advantage of extreme dislocation in the corporate bond market. While recovery in the corporate bond market has led to somewhat lower new business margins for fixed index and fixed annuities due to lower spreads in 2010, we continue to write new business at Internal Rates of Return in excess of 20%. Our pricing discipline has enabled us to substantially preserve the 2009 margin improvement. Jackson achieved an overall margin of 69% in the first quarter 2010. Whilst lower corporate bond spreads have resulted in fixed index and fixed annuity margins normalising to pre-crisis levels, variable annuity margins have remained high at 77%. Variable annuity
Variable annuity (VA) APE sales of £201 million in the first quarter of 2010 were 91 per cent higher than the same period in 2009, reflecting the equity market rally that began in the second quarter of 2009, the relative consistency of Jackson's product offering and continued disruptions among some of our major competitors. Jackson’s first quarter VA sales were the highest first quarter sales in the company’s history. Jackson7 ranked 4th in VA sales in 2009, with a market share of 8.1 per cent, up from 12th with a market share of 4.3 per cent in 2008. In the fourth quarter of 2009, which are the latest statistics available, Jackson8 ranked 1st in VA net flows. Notes 7 Source: VARDS 8 Source: Morningstar Fixed index annuity
7 Source: VARDS 8 Source: Morningstar
US Q1 2010 Q1 2009 % change on Q1 09Sales - APE £255m £184m 39%New Business Profit £175m £140m 25%Margin – APE % 69% 76% -7pts
Q1 2010 Q1 2009 % change on Q1 09 APE £201m £105m 91%
Q1 2010 Q1 2009 % change on Q1 09 APE £30m £25m 20%

7
Fixed index annuity (FIA) APE sales of £30 million in the first quarter of 2010 were up 20 per cent over the same period of 2009. Industry FIA sales have benefited from an increase in customer demand for products that offer guaranteed rates of return with additional upside potential linked to stock market index performance. Additionally, Jackson’s FIA sales have benefited from the company's consistent financial strength ratings and continued disruptions among some of the top FIA sellers. Jackson9 ranked 4th in sales of FIAs in 2009, with a market share of 7.5 per cent, up from 9th and a market share of 3.5 per cent in 2008. Fixed Annuity
Jackson’s strategy of containing fixed annuity volumes resulted in first quarter 2010 APE sales of £18 million, 63 per cent lower than the same period in 2009 and 14 per cent lower than in the fourth quarter of 2009. Total retail annuity net flows of £1.5 billion for the first quarter of 2010 represented a 108 per cent increase on the same period in 2009, reflecting the impacts of the significant increase in sales and continued low levels of surrender activity. b) Asset management Curian Capital, a specialised asset management company that provides innovative fee-based separately managed accounts, had total assets under management of £2.7 billion at the end of March 2010 compared with £2.3 billion at the end of 2009. Curian generated record deposits at actual exchange rates and local currency of £309 million in the first quarter of 2010, up 218 per cent on the first quarter of 2009 and up 7 per cent on the fourth quarter of 2009. Note 9 Source: AnnuitySpecs.com 1.3 UK insurance operations
Prudential UK continues to focus on balancing writing new business with cash generation while realising value from the opportunities created by the increasing need for retirement solutions in the UK. By competing in selected areas of the UK’s retirement savings and income markets Prudential has been successful in generating attractive returns on capital employed.
Total APE new business sales of £193 million were up 7 per cent on the first quarter of 2009, principally due to higher sales of corporate pensions and protection products. In continuing to apply strict return criteria, Prudential did not write any significant bulk annuity transactions in 2009 or 2010.
The new business margin improved to 36 per cent in the first quarter of 2010 from 33 per cent in the first quarter of 2009. This was primarily due to increased margins on with-profit bond business combined with the continuation of strong margins achieved on shareholder-backed annuity business.
Sales of individual annuities of APE £59 million were 2 per cent higher than the first quarter of 2009. Sales of external annuities of APE £26 million were up 37 per cent on the first quarter of 2009, aided by strong sales of with-profit annuities, which were up 73 per cent at £13 million following the launch of the with-profits Income Choice Annuity in the first quarter of 2009. Prudential UK continues to manage actively the flow of external conventional annuities to optimise capital consumption.
9 Source: AnnuitySpecs.com
Q1 2010 Q1 2009 % change on Q1 09 APE £18m £48m (63%)
UK Q1 2010 Q1 2009 % change on Q1 09Sales - APE £193m £180m 7%New Business Profit £69m £60m 15%Margin – APE % 36% 33% +3pts

8
For internal vestings, APE of £33m was 15 per cent lower than 2009, impacted by a reduction of 13 per cent in average case sizes as a result of depressed asset values and by customers choosing to delay their retirement to allow asset values to recover. We continue to see a positive shift in the number of internal customers choosing to take a with-profits annuity, APE sales amounted to £4 million and were 46 per cent higher than the first quarter of 2009.
Sales of onshore bonds of APE £33 million were in line with the first quarter of 2009. With-profits bonds sales of APE £29 million were down 6 per cent on the first quarter of 2009, but this was offset by an increase in sales of unit-linked bonds. Demand for with-profit bonds remains strong, reflecting the attractiveness of Prudential's with-profits offering, including in particular PruFund with its optional capital guarantee.
In January 2010 five new unit-linked risk graded portfolio funds - Pru Dynamic - were launched across Prudential’s retirement savings product range, providing risk managed investment for IFAs and their customers. We believe that the new funds play to Prudential’s key strengths of portfolio management, asset allocation, and its reputation of being a solid, secure investment company.
Within corporate pensions, Prudential UK continues to focus principally on the opportunities from the substantial existing Defined Contribution book of business as well as providing Additional Voluntary Contribution (AVC) arrangements to the public sector. We have been the sole AVC provider to Teachers’ Pensions for 20 years and provide AVCs to 65 of the 99 Local Government Authorities in England & Wales. First quarter 2010 corporate pensions sales of APE £60m were 15 per cent higher than the first quarter of 2009.
Sales of other products of APE £40 million were 14 per cent above the first quarter of 2009. Individual pensions sales (including income drawdown) of APE £15 million were 21 per cent higher than first quarter 2009. Sales of the Flexible Retirement Plan, Prudential UK’s individual pension product with customer agreed remuneration, continued to grow, with sales in the first quarter 2010 of APE £6 million up 37 per cent from the first quarter of 2009. Sales of the income drawdown product of APE £4million were double that of the first quarter 2009. PruProtect sales continued to grow strongly, with APE sales in the first quarter of 2010 of £5 million, up 145 per cent on the same period last year. This represented a record quarterly performance for PruProtect. Growth continues in PruHealth, with APE sales up 12 per cent on the first quarter 2009. PruHealth now has more than 210,000 customers insured.
1.4 M&G
M&G is an investment-led business which aims to deliver superior long term performance for third party clients and the internal funds of the Prudential Group. Our strategy is to recruit and nurture leading investment talent. We seek to create an environment in which this talent will thrive and so deliver the level of returns that our clients expect of us. This focus on investment performance, combined with a well-diversified business mix and well-established distribution capabilities, has helped M&G to make a strong start to 2010 as indicated by sales performance and the growth in FUM. We maintain our number two position in the UK on the basis of Retail FUM. Net new business for the first quarter of 2010 was robust at £1.9 billion. While this is lower than the £2.5 billion of net inflows during the same quarter of the previous period, 2009 was an exceptional year for M&G as investors invested heavily in our top-performing bond funds to exploit a near unique opportunity in fixed income markets. We expect new business to return to more normal levels this year. The UK & European Retail Business maintained its strong performance, with net inflows of £1.7 billion. Sales of our fixed income funds accounted for 35 per cent share of net inflows in the first quarter of 2010 but the continued recovery in the equity markets has meant that net inflows into M&G’s top performing equity fund accounted for 49 per cent of the inflow. The total Retail Business, including South Africa, attracted net new business of £1.5 billion, compared with £2.2 billion in the first quarter of 2009. Gross retail inflows for the quarter were £4.2 billion, an increase of 26 per cent on the first quarter 2009. These strong flows were on the back of excellent investment performance by M&G’s retail funds, with 42 per cent of funds in the top quartile over the preceding three years ending 31 March 2010 and 71 per cent of funds in the top half over the preceding three years ending 31 March 2010. Performance was strong across
Q1 2010 Q1 2009 % change on Q1 09Retail business inflows £1,454m £2,207m (34%)Institutional business inflows £435m £336m 29%Total net inflows £1,889m £2,543m (26%)

9
both equity and fixed income funds with 69 per cent of the equity funds and 75 per cent of the fixed income funds in the top half over the preceding three years ending 31 March 2010. The Institutional Business also attracted net new business with net inflows at £0.4 billion for the first quarter of 2010, including £0.2 billion of new money into our public debt funds and a new £0.1 billion segregated equity mandate. Gross inflows were up 99 per cent over the first quarter of 2009 at £2.2 billion. Investment performance on the Institutional side continues to be very strong with 94% of our external mandates at or above benchmark. M&G’s total funds under management at 31 March 2010 were £182.3 billion, up 5 per cent on the 2009 year-end and up 35 per cent on the first quarter of 2009. Total external funds under management at 31 March 2010 were £76.2 billion, a rise of 8 per cent since the start of the year and 64 per cent compared with 31 March 2009. The increase in external funds in the first quarter represents the combined result of market and other movements of £4.1 billion and net flows of £1.9 billion. After an exceptional 2009 and in line with expectations, net sales are showing signs of returning back to more normal levels in 2010. Nevertheless, the continuing excellent investment performance of M&G’s flagship funds gives grounds for confidence that M&G will win a healthy share of new business. 1.5 Asia Asset Management
The net retail outflows for the quarter were attributed to Money Market Funds (MMFs) of £857 million, principally in India and Taiwan, offset by net inflows of £171 million in other non-MMFs . Large redemptions in MMFs are typical for the March financial year-end and during last year the MMFs were seen as a safer haven in the volatile investment markets. At 1 January 2010 MMF funds under management, at £4.9 billion, were 34 per cent higher than the beginning of last year hence influencing the volume of outflows this quarter. In the first few days of April, close to £1 billion of money had already flowed back to the MMF funds. The non-MMF net inflows of £171 million included successes in Japan with the Asia/Oceania High Dividend Equity Fund that had net inflows of £440 million. In India ICICI-Prudential has won the "Debt Fund House" category in Morningstar's India Fund Awards 2009 for the second consecutive year. 2. Financial Management The Group remains focused on the proactive management of its balance sheet and risk profile. We continue to impose stringent stress testing on our key capital measures, ensuring we could withstand, both in the short and medium term, significant market shocks. 2.1 Capital Management Our capital position remains strong. We have continued to place emphasis on maintaining the Group’s financial strength through optimising the balance between writing profitable new business, conserving capital and generating cash. We estimate that our Insurance Groups Directive (IGD) capital surplus was £3.4 billion at 31 March 2010 (before taking into account the 2009 final dividend of £0.3 billion), covering our capital requirements 2.7 times. This compares to £3.4 billion at the end of 2009 and £2.3 billion at the end of the first quarter of 2009 (before taking into account the 2008 final dividend of £0.3 billion). The IGD capital surplus at 31 March 2010 is unchanged since the end of 2009. This primarily reflects a positive contribution from underlying earnings, offset by inadmissible assets arising on the purchase of UOB’s life insurance subsidiary in Singapore of £0.2 million and the impact of costs incurred to the end of March 2010 in relation to the AIA acquisition and its financing. We continue to have further available options for us to manage available and required capital. These could take the form of increasing available capital (for example, financial reinsurance) or reducing required capital (for example, through the mix and level of new business) and the use of other risk mitigation measures such as hedging and reinsurance.
Q1 2010 Q1 2009 % change on Q1 09 Net (outflows)/inflows (£686)m £185m (471%)
10
As at 31 March stress testing of our IGD capital position to various events has the following results:
• An instantaneous 20 per cent fall in equity markets from 31 March 2010 levels would reduce the IGD surplus by £250 million;
• A 40 per cent fall in equity markets (comprising an instantaneous 20 per cent fall followed by a
further 20 per cent fall over a four week period) would reduce the IGD surplus by £650 million; • A 150bps reduction (subject to a floor of zero) in interest rates would reduce the IGD surplus by
£350 million; • Credit defaults of ten times the expected level would reduce IGD surplus by £600 million.
In addition to our strong capital position, on a statutory (Pillar 1) basis the total credit reserve for the UK shareholder annuity funds also protects our capital position in excess of the IGD surplus. This credit reserve as at 31 March 2010 was £1.6 billion. This represents 44 per cent of the portfolio spread over swaps, compared to 41 per cent at 31 December 2009, and 31 per cent as at 30 June 2009. 2.2 Credit The Group’s total debt portfolio on an IFRS basis is estimated at £102.8 billion at 31 March 2010, excluding holdings attributable to external unit holders of consolidated unit trusts. Of this total, £68.9 billion is in the UK, including £44.5 billion within the UK with-profits fund. Shareholders have limited risk exposure to the with-profits fund as the solvency is protected by the inherited estate. Outside the with-profits fund there is £4.5 billion in unit-linked funds where the shareholder risk is limited, with the remaining £19.9 billion backing the shareholder annuity business and other non-linked business (of which 78.4 per cent is rated AAA to A, 18.8 per cent BBB and 2.8 per cent non-investment grade). No defaults were reported in the first quarter of 2010 for UK shareholder backed business. Asia’s debt portfolio totals £7.2 billion, of which £3.5 billion is invested in unit-linked and with-profits funds with minimal shareholder risk and £3.7 billion held by shareholder backed non-linked business. No defaults were reported in the first quarter of 2010. The most significant area of exposure to credit risk for the shareholder remains Jackson in the US. Jackson’s fixed income portfolio at 31 March is estimated at £25.4 billion. As reported at 31 December 2009 the net unrealised position continues to benefit from the market recovery from the historically wide spreads at the end of 2008. Jackson’s net unrealised gains has increased to £0.4 billion at 31 March 2010 from £4 million at the end of 31 December 2009. Gross unrealised losses on securities priced below 80 per cent of book value were £0.5 billion at 31 March 2010 compared to £0.6 billion at the end of 31 December 2009. Jackson did not experience any defaults during the first quarter of 2010. Write downs of impaired securities in the first quarter of the year were £35 million, of which £26 million were on Residential Mortgage Backed Securities (RMBS). No write downs were reported on corporate bonds. This compares to total write downs of £152 million for the first quarter 2009. In addition losses of £76 million were incurred in the first quarter of 2010 on sales of impaired and deteriorating bonds (first quarter 2009: £15 million). The increase over first quarter 2009 is the result of Jackson utilising opportunities to continue to de-risk the portfolio. ENDS Enquiries: Media Investors/Analysts
Edward Brewster +44 (0)20 7548 3719 Matt Lilley +44 (0)20 7548 3300
Robin Tozer +44 (0)20 7548 2776 Jessica Stalley +44 (0)20 7548 3300
Notes:

11
1. Asia 2010 and 2009 comparative APE new business sales and new business profit (NBP) exclude the
Taiwan agency business disposed of during the second quarter of 2009 and the Japanese insurance operations which we have closed to new business with effect from 15 February 2010.
2. On 1 March 2010 the Group announced that it has reached agreement with American International
group (AIG) on terms for Prudential to acquire AIA Group Limited, a wholly owned subsidiary of AIG. The prospectus detailing the terms of the acquisition was issued to shareholders today (details of the terms of the offer can be obtained on the Company’s website.
3. Annual premium equivalent (APE) sales comprise regular premium sales plus one-tenth of single
premium insurance sales and are subject to rounding. 4. Present Value of New Business Premiums (PVNBP) are calculated as equalling single premiums plus
the present value of expected new business premiums of regular premium business, allowing for lapses and other assumptions made in determining the EEV new business contribution.
5. NBP assumptions for the period are detailed in the accompanying schedule 5. All references to NBP
margins on pages 1 to 12 of this statement refer to margins on an APE basis, calculated as the ratio of new business profit to APE.
6. High resolution photographs are available to the media free of charge at www.newscast.co.uk (+44 (0)20
3137 9137) or by calling the media office on +44 (0)20 7548 2466. 7. Financial Calendar 2010: AGM
19 May 2010
Reconvened AGM
7 June 2010
2010 Half Year Results
12 August 2010
Third Quarter 2010 New Business Release
10 November 2010
8. Sales for overseas operations have been reported using average exchange rates for the period as
shown in the attached schedules. Reference to prior year figures in the commentary is on an actual exchange rate basis unless stated. An alternative method of presentation is on a constant exchange rate basis.
Prudential plc is a company incorporated and with its principal place of business in England, and its affiliated companies constitute a large global financial services group. It provides insurance and financial services through its subsidiaries and affiliates throughout the world. It has been in existence for over 160 years and has £290 billion in assets under management (as at 31 December 2009). Prudential plc is not affiliated in any manner with Prudential Financial, Inc, a company whose principal place of business is in the United States of America. Forward-Looking Statements This statement may contain certain “forward-looking statements” with respect to certain of Prudential's plans and its current goals and expectations relating to its future financial condition, performance, results, strategy and objectives. Statements containing the words “believes”, “intends”, “expects”, “plans”, “seeks” and “anticipates”, and words of similar meaning, are forward-looking. By their nature, all forward-looking statements involve risk and uncertainty because they relate to future events and circumstances which are beyond Prudential's control including among other things, UK domestic and global economic and business conditions, market related risks such as fluctuations in interest rates and exchange rates, and the performance of financial markets generally; the policies and actions of regulatory authorities, the impact of competition, inflation, and deflation; experience in particular with regard to mortality and morbidity trends, lapse rates and policy renewal rates; the timing, impact and other uncertainties of future acquisitions or combinations within relevant industries; and the impact of changes in capital, solvency standards or accounting standards, and tax and other legislation and regulations in the jurisdictions in which Prudential and its affiliates operate. This may for example result in changes to assumptions used for determining results of operations or re-estimations of reserves for future policy benefits. As a result, Prudential's actual future

12
financial condition, performance and results may differ materially from the plans, goals, and expectations set forth in Prudential's forward-looking statements. Prudential undertakes no obligation to update the forward-looking statements contained in this statement or any other forward-looking statements it may make, whether as a result of future events, new information or otherwise except as required pursuant to the Prospectus Rules, the Listing Rules, the Disclosure and Transparency Rules, the Hong Kong Listing Rules or the SGX-ST listing rules.
13
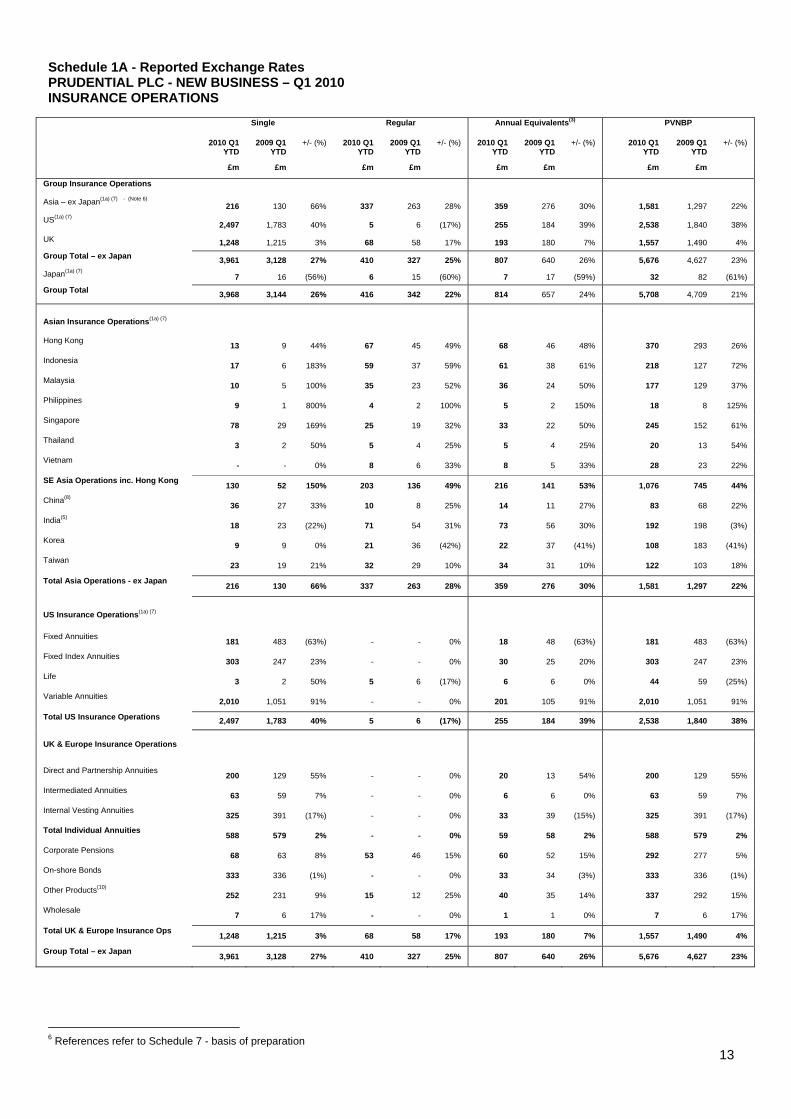
Schedule 1A - Reported Exchange Rates PRUDENTIAL PLC - NEW BUSINESS – Q1 2010 INSURANCE OPERATIONS
Single
Regular
Annual Equivalents(3)
PVNBP
2010 Q1YTD
2009 Q1 YTD
+/- (%) 2010 Q1YTD
2009 Q1YTD
+/- (%) 2010 Q1YTD
2009 Q1YTD
+/- (%) 2010 Q1YTD
2009 Q1YTD
+/- (%)
£m £m £m £m £m £m £m £m
Group Insurance Operations
Asia – ex Japan(1a) (7) - (Note 6) 216 130 66% 337 263 28% 359 276 30% 1,581 1,297 22%
US(1a) (7) 2,497 1,783 40% 5 6 (17%) 255 184 39% 2,538 1,840 38%
UK 1,248 1,215 3% 68 58 17% 193 180 7% 1,557 1,490 4% Group Total – ex Japan 3,961 3,128 27% 410 327 25% 807 640 26% 5,676 4,627 23%
Japan(1a) (7) 7 16 (56%) 6 15 (60%) 7 17 (59%) 32 82 (61%) Group Total 3,968 3,144 26% 416 342 22% 814 657 24% 5,708 4,709 21%
Asian Insurance Operations(1a) (7)
Hong Kong 13 9 44% 67 45 49% 68 46 48% 370 293 26%
Indonesia 17 6 183% 59 37 59% 61 38 61% 218 127 72%
Malaysia 10 5 100% 35 23 52% 36 24 50% 177 129 37%
Philippines 9 1 800% 4 2 100% 5 2 150% 18 8 125%
Singapore 78 29 169% 25 19 32% 33 22 50% 245 152 61%
Thailand 3 2 50% 5 4 25% 5 4 25% 20 13 54%
Vietnam - - 0% 8 6 33% 8 5 33% 28 23 22%
SE Asia Operations inc. Hong Kong 130 52 150% 203 136 49% 216 141 53% 1,076 745 44%
China(8) 36 27 33% 10 8 25% 14 11 27% 83 68 22%
India(5) 18 23 (22%) 71 54 31% 73 56 30% 192 198 (3%)
Korea 9 9 0% 21 36 (42%) 22 37 (41%) 108 183 (41%)
Taiwan 23 19 21% 32 29 10% 34 31 10% 122 103 18%
Total Asia Operations - ex Japan 216 130 66% 337 263 28% 359 276 30% 1,581 1,297 22%
US Insurance Operations(1a) (7)
Fixed Annuities 181 483 (63%) - - 0% 18 48 (63%) 181 483 (63%)
Fixed Index Annuities 303 247 23% - - 0% 30 25 20% 303 247 23%
Life 3 2 50% 5 6 (17%) 6 6 0% 44 59 (25%)
Variable Annuities 2,010 1,051 91% - - 0% 201 105 91% 2,010 1,051 91%
Total US Insurance Operations 2,497 1,783 40% 5 6 (17%) 255 184 39% 2,538 1,840 38%
UK & Europe Insurance Operations
Direct and Partnership Annuities 200 129 55% - - 0% 20 13 54% 200 129 55%
Intermediated Annuities 63 59 7% - - 0% 6 6 0% 63 59 7%
Internal Vesting Annuities 325 391 (17%) - - 0% 33 39 (15%) 325 391 (17%)
Total Individual Annuities 588 579 2% - - 0% 59 58 2% 588 579 2%
Corporate Pensions 68 63 8% 53 46 15% 60 52 15% 292 277 5%
On-shore Bonds 333 336 (1%) - - 0% 33 34 (3%) 333 336 (1%)
Other Products(10) 252 231 9% 15 12 25% 40 35 14% 337 292 15%
Wholesale 7 6 17% - - 0% 1 1 0% 7 6 17%
Total UK & Europe Insurance Ops 1,248 1,215 3% 68 58 17% 193 180 7% 1,557 1,490 4%
Group Total – ex Japan 3,961 3,128 27% 410 327 25% 807 640 26% 5,676 4,627 23%
6 References refer to Schedule 7 - basis of preparation

14
Schedule 1B - Current Exchange Rates PRUDENTIAL PLC - NEW BUSINESS – Q1 2010 INSURANCE OPERATIONS
Single
Regular
Annual Equivalents(3)
PVNBP
2010 Q1 YTD
2009 Q1 YTD
+/- (%) 2010 Q1YTD
2009 Q1YTD
+/- (%) 2010 Q1YTD
2009 Q1 YTD
+/- (%) 2010 Q1YTD
2009 Q1YTD
+/- (%)
£m £m £m £m £m £m £m £m
Group Insurance Operations
Asia – ex Japan(1b)(7) 216 127 70% 337 266 27% 359 279 29% 1,581 1,303 21%
US(1b)(7) 2,497 1,640 52% 5 6 (17%) 255 170 50% 2,538 1,693 50%
UK 1,248 1,215 3% 68 58 17% 193 180 7% 1,557 1,490 4% Group Total – ex Japan 3,961 2,982 33% 410 330 24% 807 629 28% 5,676 4,486 27% Japan(1b)(7) 7 15 (53%) 6 14 (57%) 7 16 (56%) 32 78 (59%) Group Total 3,968 2,997 32% 416 344 21% 814 645 26% 5,708 4,564 25%
Asian Insurance Operations(1b)(7) Hong Kong 13 8 63% 67 41 63% 68 42 62% 370 269 38%
Indonesia 17 6 183% 59 42 40% 61 43 42% 218 146 49%
Malaysia 10 5 100% 35 22 59% 36 23 57% 177 127 39%
Philippines 9 1 800% 4 2 100% 5 2 150% 18 8 125%
Singapore 78 29 169% 25 18 39% 33 21 57% 245 150 63%
Thailand 3 2 50% 5 4 25% 5 4 25% 20 13 54%
Vietnam - - 0% 8 5 60% 8 4 100% 28 20 40%
SE Asia Operations inc. Hong Kong 130 51 155% 203 134 51% 216 139 55% 1,076 733 47%
China(8) 36 25 44% 10 8 25% 14 11 27% 83 63 32%
India(5) 18 23 (22%) 71 54 31% 73 56 30% 192 198 (3%)
Korea 9 10 (10%) 21 41 (49%) 22 42 (48%) 108 208 (48%)
Taiwan 23 18 28% 32 29 10% 34 31 10% 122 101 21%
Total Asia Operations - ex Japan 216 127 70% 337 266 27% 359 279 29% 1,581 1,303 21%
US Insurance Operations(1b)(7)
Fixed Annuities 181 444 (59%) - - 0% 18 44 (59%) 181 444 (59%)
Fixed Index Annuities 303 227 33% - - 0% 30 23 30% 303 227 33%
Life 3 2 50% 5 6 (17%) 6 6 0% 44 55 (20%)
Variable Annuities 2,010 967 108% - - 0% 201 97 107% 2,010 967 108%
Total US Insurance Operations 2,497 1,640 52% 5 6 (17%) 255 170 50% 2,538 1,693 50%
UK & Europe Insurance Operations
Direct and Partnership Annuities 200 129 55% - - 0% 20 13 54% 200 129 55%
Intermediated Annuities 63 59 7% - - 0% 6 6 0% 63 59 7%
Internal Vesting Annuities 325 391 (17%) - - 0% 33 39 (15%) 325 391 (17%)
Total Individual Annuities 588 579 2% - - 0% 59 58 2% 588 579 2%
Corporate Pensions 68 63 8% 53 46 15% 60 52 15% 292 277 5%
Other Products(10) 333 336 (1%) - - 0% 33 34 (3%) 333 336 (1%)
On-Shore Bonds 252 231 9% 15 12 25% 40 35 14% 337 292 15%
Wholesale 7 6 17% - - 0% 1 1 0% 7 6 17%
Total UK & Europe Insurance Ops 1,248 1,215 3% 68 58 17% 193 180 7% 1,557 1,490 4%
Group Total – ex Japan 3,961 2,982 33% 410 330 24% 807 629 28% 5,676 4,486 27%
15
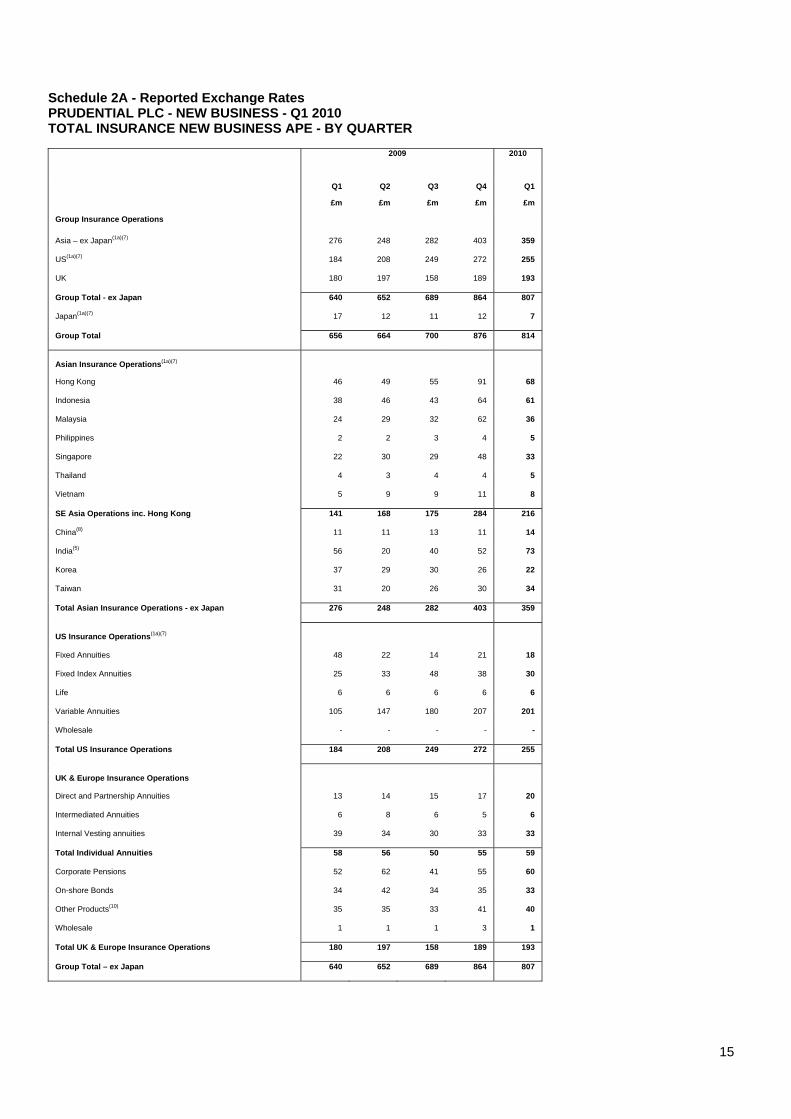
Schedule 2A - Reported Exchange Rates PRUDENTIAL PLC - NEW BUSINESS - Q1 2010 TOTAL INSURANCE NEW BUSINESS APE - BY QUARTER
2009 2010
Q1 Q2 Q3 Q4 Q1
£m £m £m £m £m
Group Insurance Operations
Asia – ex Japan(1a)(7) 276 248 282 403 359
US(1a)(7) 184 208 249 272 255
UK 180 197 158 189 193
Group Total - ex Japan 640 652 689 864 807
Japan(1a)(7) 17 12 11 12 7
Group Total 656 664 700 876 814
Asian Insurance Operations(1a)(7)
Hong Kong 46 49 55 91 68
Indonesia 38 46 43 64 61
Malaysia 24 29 32 62 36
Philippines 2 2 3 4 5
Singapore 22 30 29 48 33
Thailand 4 3 4 4 5
Vietnam 5 9 9 11 8
SE Asia Operations inc. Hong Kong 141 168 175 284 216
China(8) 11 11 13 11 14
India(5) 56 20 40 52 73
Korea 37 29 30 26 22
Taiwan 31 20 26 30 34
Total Asian Insurance Operations - ex Japan 276 248 282 403 359
US Insurance Operations(1a)(7)
Fixed Annuities 48 22 14 21 18
Fixed Index Annuities 25 33 48 38 30
Life 6 6 6 6 6
Variable Annuities 105 147 180 207 201
Wholesale - - - - -
Total US Insurance Operations 184 208 249 272 255
UK & Europe Insurance Operations
Direct and Partnership Annuities 13 14 15 17 20
Intermediated Annuities 6 8 6 5 6
Internal Vesting annuities 39 34 30 33 33
Total Individual Annuities 58 56 50 55 59
Corporate Pensions 52 62 41 55 60
On-shore Bonds 34 42 34 35 33
Other Products(10) 35 35 33 41 40
Wholesale 1 1 1 3 1
Total UK & Europe Insurance Operations 180 197 158 189 193
Group Total – ex Japan 640 652 689 864 807
16
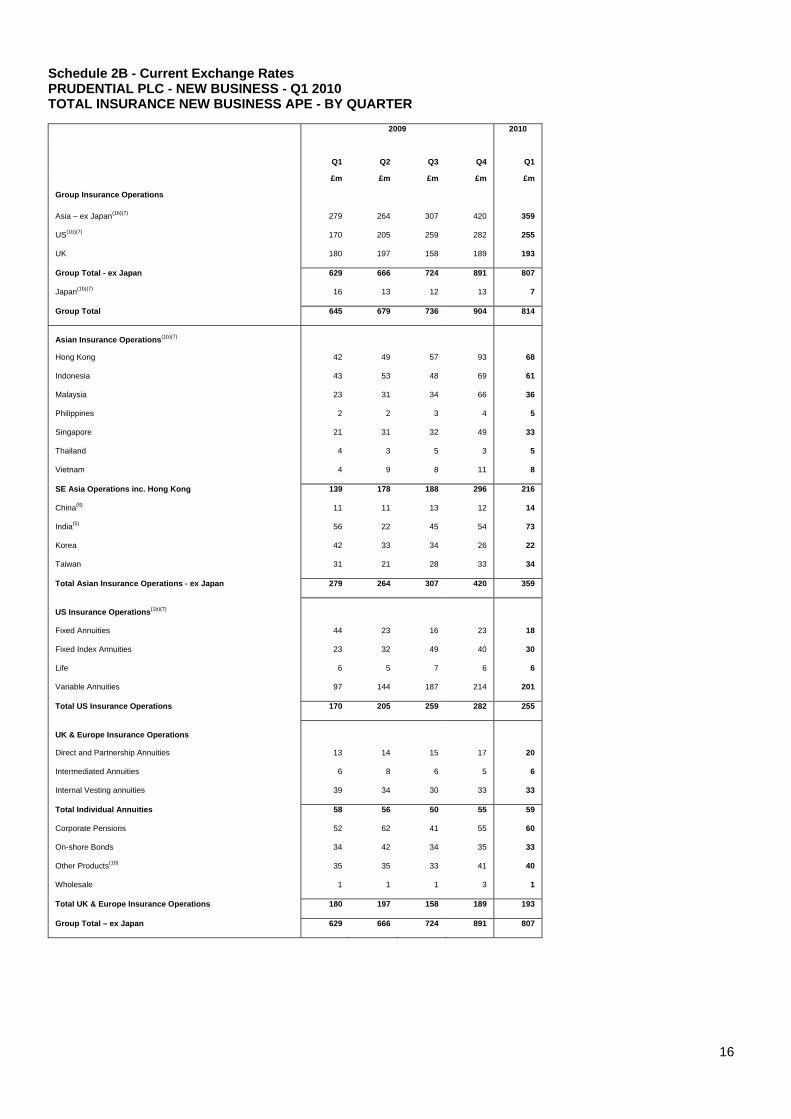
Schedule 2B - Current Exchange Rates PRUDENTIAL PLC - NEW BUSINESS - Q1 2010 TOTAL INSURANCE NEW BUSINESS APE - BY QUARTER
2009 2010
Q1 Q2 Q3 Q4 Q1
£m £m £m £m £m
Group Insurance Operations
Asia – ex Japan(1b)(7) 279 264 307 420 359
US(1b)(7) 170 205 259 282 255
UK 180 197 158 189 193
Group Total - ex Japan 629 666 724 891 807
Japan(1b)(7) 16 13 12 13 7
Group Total 645 679 736 904 814
Asian Insurance Operations(1b)(7)
Hong Kong 42 49 57 93 68
Indonesia 43 53 48 69 61
Malaysia 23 31 34 66 36
Philippines 2 2 3 4 5
Singapore 21 31 32 49 33
Thailand 4 3 5 3 5
Vietnam 4 9 8 11 8
SE Asia Operations inc. Hong Kong 139 178 188 296 216
China(8) 11 11 13 12 14
India(5) 56 22 45 54 73
Korea 42 33 34 26 22
Taiwan 31 21 28 33 34
Total Asian Insurance Operations - ex Japan 279 264 307 420 359
US Insurance Operations(1b)(7)
Fixed Annuities 44 23 16 23 18
Fixed Index Annuities 23 32 49 40 30
Life 6 5 7 6 6
Variable Annuities 97 144 187 214 201
Total US Insurance Operations 170 205 259 282 255
UK & Europe Insurance Operations
Direct and Partnership Annuities 13 14 15 17 20
Intermediated Annuities 6 8 6 5 6
Internal Vesting annuities 39 34 30 33 33
Total Individual Annuities 58 56 50 55 59
Corporate Pensions 52 62 41 55 60
On-shore Bonds 34 42 34 35 33
Other Products(10) 35 35 33 41 40
Wholesale 1 1 1 3 1
Total UK & Europe Insurance Operations 180 197 158 189 193
Group Total – ex Japan 629 666 724 891 807
17
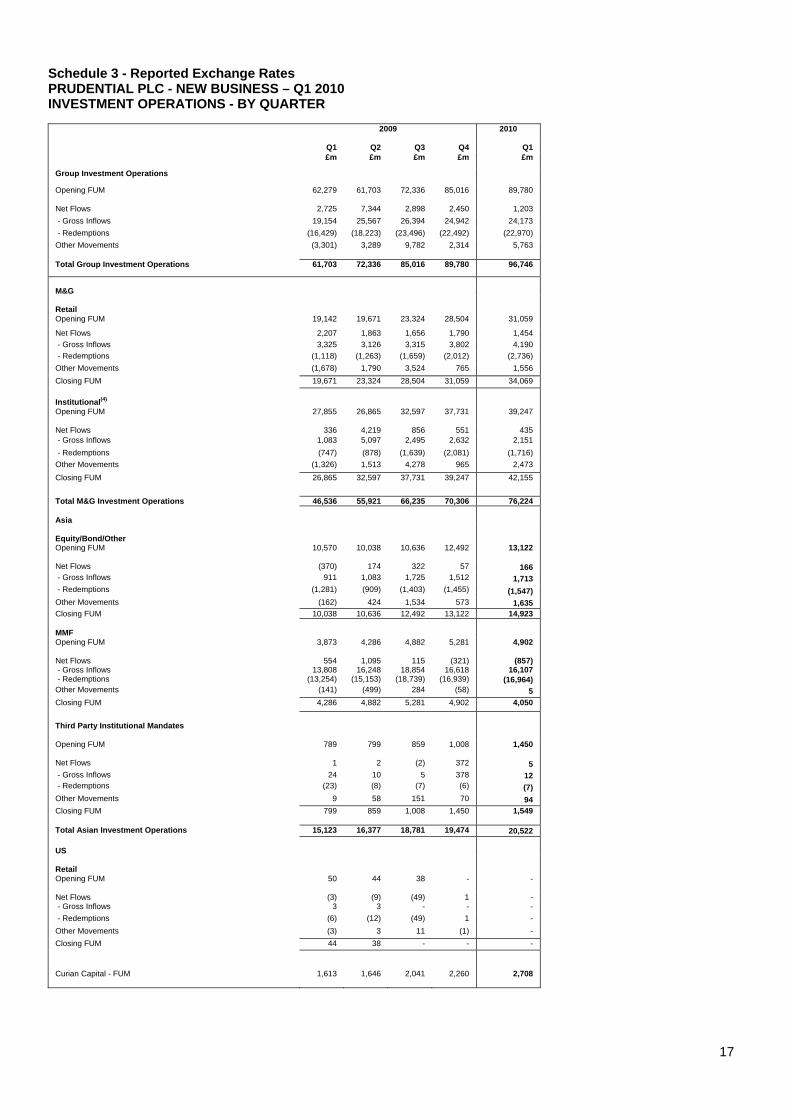
Schedule 3 - Reported Exchange Rates PRUDENTIAL PLC - NEW BUSINESS – Q1 2010 INVESTMENT OPERATIONS - BY QUARTER
2009 2010
Q1 Q2 Q3 Q4 Q1 £m £m £m £m £m
Group Investment Operations
Opening FUM 62,279 61,703 72,336 85,016 89,780
Net Flows 2,725 7,344 2,898 2,450 1,203 - Gross Inflows 19,154 25,567 26,394 24,942 24,173 - Redemptions (16,429) (18,223) (23,496) (22,492) (22,970) Other Movements (3,301) 3,289 9,782 2,314 5,763
Total Group Investment Operations 61,703 72,336 85,016 89,780 96,746
M&G Retail
Opening FUM 19,142 19,671 23,324 28,504 31,059
Net Flows 2,207 1,863 1,656 1,790 1,454 - Gross Inflows 3,325 3,126 3,315 3,802 4,190 - Redemptions (1,118) (1,263) (1,659) (2,012) (2,736) Other Movements (1,678) 1,790 3,524 765 1,556 Closing FUM 19,671 23,324 28,504 31,059 34,069 Institutional(4)
Opening FUM 27,855 26,865 32,597 37,731 39,247
Net Flows 336 4,219 856 551 435 - Gross Inflows 1,083 5,097 2,495 2,632 2,151 - Redemptions (747) (878) (1,639) (2,081) (1,716) Other Movements (1,326) 1,513 4,278 965 2,473 Closing FUM 26,865 32,597 37,731 39,247 42,155
Total M&G Investment Operations 46,536 55,921 66,235 70,306 76,224 Asia
Equity/Bond/Other
Opening FUM 10,570 10,038 10,636 12,492 13,122
Net Flows (370) 174 322 57 166 - Gross Inflows 911 1,083 1,725 1,512 1,713 - Redemptions (1,281) (909) (1,403) (1,455) (1,547) Other Movements (162) 424 1,534 573 1,635 Closing FUM 10,038 10,636 12,492 13,122 14,923 MMF
Opening FUM 3,873 4,286 4,882 5,281 4,902
Net Flows 554 1,095 115 (321) (857) - Gross Inflows 13,808 16,248 18,854 16,618 16,107 - Redemptions (13,254) (15,153) (18,739) (16,939) (16,964) Other Movements (141) (499) 284 (58) 5 Closing FUM 4,286 4,882 5,281 4,902 4,050
Third Party Institutional Mandates
Opening FUM 789 799 859 1,008 1,450
Net Flows 1 2 (2) 372 5 - Gross Inflows 24 10 5 378 12 - Redemptions (23) (8) (7) (6) (7) Other Movements 9 58 151 70 94 Closing FUM 799 859 1,008 1,450 1,549
Total Asian Investment Operations 15,123 16,377 18,781 19,474 20,522 US
Retail
Opening FUM 50 44 38 - -
Net Flows (3) (9) (49) 1 - - Gross Inflows 3 3 - - - - Redemptions (6) (12) (49) 1 - Other Movements (3) 3 11 (1) - Closing FUM 44 38 - - -
Curian Capital - FUM 1,613 1,646 2,041 2,260 2,708
18
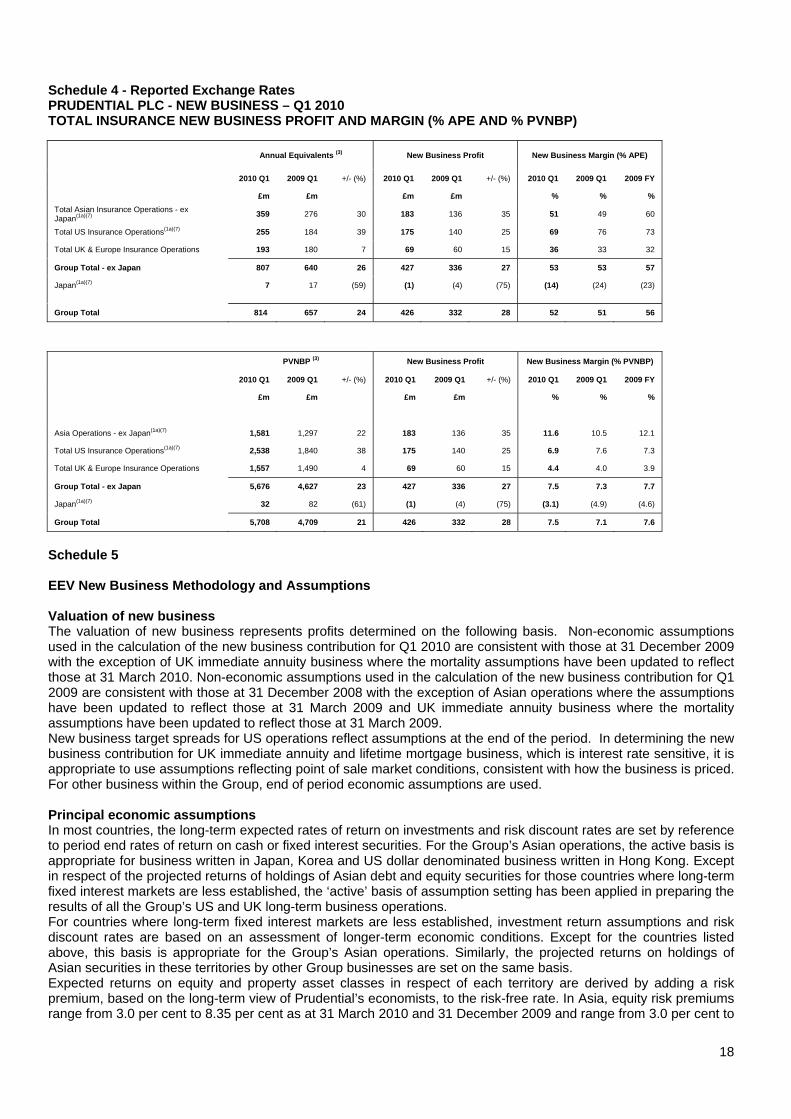
Schedule 4 - Reported Exchange Rates PRUDENTIAL PLC - NEW BUSINESS – Q1 2010 TOTAL INSURANCE NEW BUSINESS PROFIT AND MARGIN (% APE AND % PVNBP)
Annual Equivalents (3) New Business Profit New Business Margin (% APE)
2010 Q1 2009 Q1 +/- (%) 2010 Q1 2009 Q1 +/- (%) 2010 Q1 2009 Q1 2009 FY
£m £m £m £m % % % Total Asian Insurance Operations - ex Japan(1a)(7) 359 276 30 183 136 35 51 49 60
Total US Insurance Operations(1a)(7) 255 184 39 175 140 25 69 76 73
Total UK & Europe Insurance Operations 193 180 7 69 60 15 36 33 32
Group Total - ex Japan 807 640 26 427 336 27 53 53 57
Japan(1a)(7) 7 17 (59) (1) (4) (75) (14) (24) (23)
Group Total 814 657 24 426 332 28 52 51 56
PVNBP (3) New Business Profit New Business Margin (% PVNBP)
2010 Q1 2009 Q1 +/- (%) 2010 Q1 2009 Q1 +/- (%) 2010 Q1 2009 Q1 2009 FY
£m £m £m £m % % %
Asia Operations - ex Japan(1a)(7) 1,581 1,297 22 183 136 35 11.6 10.5 12.1
Total US Insurance Operations(1a)(7) 2,538 1,840 38 175 140 25 6.9 7.6 7.3
Total UK & Europe Insurance Operations 1,557 1,490 4 69 60 15 4.4 4.0 3.9
Group Total - ex Japan 5,676 4,627 23 427 336 27 7.5 7.3 7.7
Japan(1a)(7) 32 82 (61) (1) (4) (75) (3.1) (4.9) (4.6)
Group Total 5,708 4,709 21 426 332 28 7.5 7.1 7.6
Schedule 5 EEV New Business Methodology and Assumptions Valuation of new business The valuation of new business represents profits determined on the following basis. Non-economic assumptions used in the calculation of the new business contribution for Q1 2010 are consistent with those at 31 December 2009 with the exception of UK immediate annuity business where the mortality assumptions have been updated to reflect those at 31 March 2010. Non-economic assumptions used in the calculation of the new business contribution for Q1 2009 are consistent with those at 31 December 2008 with the exception of Asian operations where the assumptions have been updated to reflect those at 31 March 2009 and UK immediate annuity business where the mortality assumptions have been updated to reflect those at 31 March 2009. New business target spreads for US operations reflect assumptions at the end of the period. In determining the new business contribution for UK immediate annuity and lifetime mortgage business, which is interest rate sensitive, it is appropriate to use assumptions reflecting point of sale market conditions, consistent with how the business is priced. For other business within the Group, end of period economic assumptions are used. Principal economic assumptions In most countries, the long-term expected rates of return on investments and risk discount rates are set by reference to period end rates of return on cash or fixed interest securities. For the Group’s Asian operations, the active basis is appropriate for business written in Japan, Korea and US dollar denominated business written in Hong Kong. Except in respect of the projected returns of holdings of Asian debt and equity securities for those countries where long-term fixed interest markets are less established, the ‘active’ basis of assumption setting has been applied in preparing the results of all the Group’s US and UK long-term business operations. For countries where long-term fixed interest markets are less established, investment return assumptions and risk discount rates are based on an assessment of longer-term economic conditions. Except for the countries listed above, this basis is appropriate for the Group’s Asian operations. Similarly, the projected returns on holdings of Asian securities in these territories by other Group businesses are set on the same basis. Expected returns on equity and property asset classes in respect of each territory are derived by adding a risk premium, based on the long-term view of Prudential’s economists, to the risk-free rate. In Asia, equity risk premiums range from 3.0 per cent to 8.35 per cent as at 31 March 2010 and 31 December 2009 and range from 3.0 per cent to

19
7.1 per cent as at 31 March 2009. In the US and the UK, the equity risk premium is 4.0 per cent for all periods shown below. Assumed investment returns reflect the expected future returns on the assets held and allocated to the covered business at the valuation date. The tables below summarise the principal financial assumptions: Asian operations 31 March 2010 China Hong Kong India Indonesia Japan Korea Malaysia Philippines Singapore Taiwan Thailand Vietnam (notes ii, iii) (note iii) (note iii) % % % % % % % % % % % %New business risk discount rate 11.75 5.7 14.25 13.8 5.2 8.0 9.3 15.75 5.7 7.5 13.0 16.75Government bond yield 8.25 3.9 9.25 10.25 2.0 5.0 6.5 9.25 4.25 5.5 6.75 10.25 31 December 2009 China Hong Kong India Indonesia Japan Korea Malaysia Philippines Singapore Taiwan Thailand Vietnam (notes ii, iii) (note iii) (note iii) % % % % % % % % % % % %New business risk discount rate 11.75 5.5 14.25 13.8 5.1 8.2 9.4 15.75 5.7 7.5 13.0 16.75Government bond yield 8.25 3.9 9.25 10.25 1.9 5.5 6.5 9.25 4.25 5.5 6.75 10.25 31 March 2009 China Hong Kong India Indonesia Japan Korea Malaysia Philippines Singapore Taiwan Thailand Vietnam (notes ii, iii) (note iii) (note iii) % % % % % % % % % % % %New business risk discount rate 11.75 4.3 14.25 15.25 5.0 9.2 9.2 15.75 5.65 9.25 13.0 16.75Government bond yield 8.25 2.7 9.25 10.25 1.9 5.2 6.5 9.25 4.25 5.5 6.75 10.25
Asia Total 31 Mar
2010 31 Dec
2009 31 Mar
2009
% % %New business weighted risk discount rate (note (i)) (excluding Taiwan agency business in 2009) 9.6 9.1 9.5
Notes (i) The weighted risk discount rates for Asian operations shown above have been determined by weighting each country’s risk discount rates
by reference to the EEV basis new business result. (ii) The assumptions shown are for US dollar denominated business which comprises the largest proportion of the Hong Kong business. (iii) The mean equity return assumptions for the most significant equity holdings in the Asian operations were:
31 Mar 2010 31 Dec 2009 31 Mar 2009
% % %
Hong Kong 7.9 7.9 7.6
Malaysia 12.4 12.4 12.5
Singapore 10.2 10.2 10.2
To obtain the mean, an average over all simulations of the accumulated return at the end of the projection period is calculated. The annual average return is then calculated by taking the root of the average accumulated return minus 1. US operations 31 Mar
2010%
31 Dec2009
%
31 Mar 2009
%Assumed new business spread margins: note iii
Fixed Annuity business (including the proportion of variable annuity business invested in the general account):note i
First five years: January to June issues 2.25 2.75 2.75July to December issues n/a 2.25 n/a
Long-term assumption 2.0 2.0 2.0Fixed Index Annuity business
January to June issues 2.5 3.5 3.5July to December issues n/a 2.5 n/a
New business risk discount rate note ii Variable annuity 8.2 8.2 6.7Non-variable annuity 6.2 6.2 3.5Weighted average total 8.0 7.8 5.1
US 10-year treasury bond rate at end of period 3.9 3.9 2.7Pre-tax expected long-term nominal rate of return for US equities 7.9 7.9 6.7 Notes i The spread assumptions for new tranches of fixed annuity business (including the proportion of variable annuity business invested in the
general account) include a provision that crediting rates and spreads will normalise in the future. Thus, the assumption for new business spreads shown above applies for the first five years before normalising over the following 10 years to the long-term assumption of 2.0 per cent. The valuation of new business takes into account an assumed associated risk of increased lapse under certain interest rate scenarios.
ii The increase in the discount rates at 31 December 2009 reflects the increase in the US 10-year treasury bond rate of 120 bps from 31 March
2009, and an additional allowance for a combination of credit risk premium and short-term default allowance of 30 bps for VA business and 150 bps for other business.

20
iii Credit risk treatment The projected cash flows incorporate the expected long-term spread between the earned rate and the rate credited to policyholders. The
projected earned rates reflect book value yields which are adjusted over time to reflect projected reinvestment rates. Positive net cash flows are assumed to be reinvested in a mix of corporate bonds, commercial mortgages and limited partnerships. The yield on those assets is assumed to grade from the current level to a yield that allows for a long-term assumed credit spread of 1.25 per cent over 10 years. The expected spread on new business has been determined after allowing for a Risk Margin Reserve (RMR) allowance of 25 basis points for longer-term defaults for all periods shown above. In the event that longer-term default levels are higher then, unlike for UK annuity business where policyholder benefits are not changeable, Jackson has some discretion to adjust crediting rates, subject to contract guarantee levels and general market competition considerations.
UK operations 31 Mar 2010
%31 Dec 2009
%31 Mar 2009
%Shareholder-backed annuity business:note i New business risk discount rate 7.1 8.7 10.6 Pre-tax expected long-term nominal rate of return: Fixed annuities 5.0 5.7 6.0 Inflation-linked annuities 5.2 6.0 5.3 Other business: New business risk discount rate note ii 7.1 7.7 6.8 Pre-tax expected long-term nominal rates of investment return: UK equities 8.4 8.4 7.8 Gilts 4.4 4.4 3.8 Corporate bonds 6.1 6.1 5.2Post-tax expected long-term nominal rate of return for the PAC with-profits fund: Pension business (where no tax applies) 6.9 6.9 6.5 Life business 6.0 6.0 5.8 Notes i For Prudential’s UK shareholder-backed annuity business, Prudential has used a market consistent embedded value (MCEV) approach to
derive an implied risk discount rate which is then applied to the projected best estimate cash flows. In the annuity MCEV calculations, the future cash flows are discounted using the swap yield curve plus an allowance for liquidity premium based on Prudential’s assessment of the expected return on the assets backing the annuity liabilities after allowing for expected long-term defaults, credit risk premium and short-term downgrades and defaults. For the purposes of presentation in the EEV results, the results on this basis are reconfigured. Under this approach the projected earned rate of return on the debt securities held is determined after allowing for expected long-term defaults and, where necessary, an additional allowance for an element of short-term downgrades and defaults to bring the allowance in the earned rate up to best estimate levels. The allowances for credit risk premium and additional short-term default allowance are incorporated into the risk margin included in the discount rate. The credit assumptions used in the MCEV calculations and the residual liquidity premium element of the bond spread over swap rates for shareholder-backed annuity new business are as follows:
31 Mar
2010 (bps)
31 Dec 2009 (bps)
31 Mar 2009 (bps)
Bond spread over swap rates 105 198 267 Total credit risk allowance 35 54 80 Liquidity premium 70 144 187
ii The risk discount rates for new business for UK insurance operations other than shareholder-backed annuities reflect weighted rates based
on the type of business.

21
Schedule 6 Group Debt Securities at 31 March 2010 1 IFRS balance sheet fair value
The Group's investments in debt securities at 31 March 2010 excluding holdings attributable to external unit holders are as follows:
With-profit Unit-linked and variable annuity
Other shareholder backed business
Total
(note 1a) (note 1a) £bn £bn £bn £bn UK insurance operations (Notes 1b and 1c) 44.5 4.5 19.9 68.9
Jackson National Life (Notes 1d and 3) - - 25.4 25.4
Asia long-term business 1.2 2.3 3.7 7.2
Other operations - - 1.3 1.3
Total 45.7 6.8 50.3 102.8 Notes
1(a) Shareholders are not directly exposed to value movements on assets backing with-profit, unit linked, and variable annuity business.
1(b) Of the £19.9 bn of debt securities for UK annuity and other non-linked shareholder backed business 30.2% was rated AAA, 11.7% AA, 36.5% A, 18.8% BBB and 2.8% other.
1(c) For UK annuity business provision is made for possible future credit related losses. At 31 March 2010, a provision of £1.6bn was held.
1(d) Jackson debt securities comprise:
31 Mar 2010 31 Dec 2009
£m £m Corporate securities (95% investment grade) 18,694 16,455
Residential mortgage backed securities (62% government agency; 23% for pre 2006/2007 vintages; £514m for 2006/2007 vintages of which £383m is for the senior part of the capital structure)
3,314 3,316
Commercial mortgage backed securities 2,333 2,104
CDO funds 85 79
Other debt securities 977 877
Total 25,403 22,831
2 Defaults, losses from sales of impaired and deteriorating bonds and write-downs for non-linked shareholder backed business
2.1 Jackson National Life
In general, the debt securities of Jackson are purchased with the intention and the ability to hold them for the longer-term.
The majority of Jackson's debt securities are classified as available-for-sale under IAS 39. Under this classification realised losses from defaults, sales of impaired and deteriorating bonds and write-downs are recorded in the income statement. Changes in unrealised appreciation and depreciation are recorded as a movement directly in shareholders' equity.
Jackson continues to review its investments on a case-by-case basis to determine whether any decline in fair value represents an impairment and therefore requiring an accounting write-down. IFRS requires available-for-sale debt securities which are impaired to be written down to fair value through the profit and loss account.
The defaults, write-downs and losses on sales of impaired and deteriorating bonds (net of recoveries) for the three months to 31 March 2010 were as follows:
Defaults Bond write downs
Losses on sales of
impaired and deteriorating bonds (net of
recoveries) £m £m £m Corporate debt securities - - 18
Residential mortgage backed securities Prime - 5 33
Alt-A - 14 19
Sub-prime - 7 -

22
Other - 9 6
Total - 35 76

23
2.2 Other operations For the Group's operations, other than Jackson National Life, debt securities are accounted for on a fair value through P&L basis with all value movements recorded in the income statement. Excluding Jackson National Life there were no defaults in the first quarter of 2010 for other shareholder backed business (measured against market value) . 3 Jackson National Life - securities in an unrealised loss position For Jackson's securities classified as available-for-sale under IAS 39, at 31 March 2010 there was a net unrealised gain position of £438 million. This amount comprised £1,142 million of gross unrealised gains and £704 million of gross unrealised losses on individual securities. Under IFRS unrealised losses are only applicable for securities which have not been impaired during the period. Securities impaired during the period are written down to fair value through the profit and loss in full. Note 2.1 shows the element of write downs in 2010. Included within the gross unrealised losses is £454 million for securities which are valued at less than 80 per cent of book value, of which 14 per cent have been at this level for less than 6 months. IFRS requires securities to be carried at fair value, being the amount for which the security would be exchanged between knowledgeable, willing parties in an arm’s length transaction. The best evidence of fair value is quoted prices in an active market, but if the market is not active then a valuation technique is used to establish fair value.
a) Movements in the values for the 3 months to 31 March 2010: Movements in the values of available-for-sale securities for the three months to 31 March 2010 are included in the table shown below: Change reflected directly in shareholders' equity
31 March 2010
Movement in Quarter 1
Foreign exchange
translation*
Quarter 1 including Foreign exchange
31 December 2009
£m £m £m £m £m
Assets fair valued at below book value
Book value 7,589 (1,131) 500 (631) 8,220
Unrealised loss (704) 316 (54) 262 (966)
Fair value (as included in balance sheet)
6,885 (815) 446 (369) 7,254
Assets fair valued at or above book value
Book value 17,218 1,791 983 2,774 14,444
Unrealised gain 1,142 106 66 172 970
Fair value (as included in the balance sheet)
18,360 1,897 1,049 2,946 15,414
Total
Book value 24,807 660 1,483 2,143 22,664
Net unrealised gain 438 422 12 434 4
Fair value (as included in balance sheet)
25,245 1,082 1,495 2,577 22,668
b) Fair value of securities in an unrealised loss position as a percentage of book value (i) Fair value of securities as a percentage of book value The unrealised losses in the Jackson balance sheet on unimpaired securities are £704 million (31 December 2009: £966 million) relating to assets with fair market value and book value of £6,885million (31 December 2009: £7,254 million) and £7,589 million (31 December 2009: £8,220 million) respectively. The following table shows the fair value of the securities in a gross unrealised loss position for various percentages of book value: Fair value Unrealised
loss Fair value Unrealised
loss 31 Mar 2010 31 Mar 2010 31 Dec 2009 31 Dec 2009

24
£m £m £m £m
Between 90% and 100% 5,501 (130) 5,127 (169)
Between 80% and 90% 678 (120) 1,201 (203)
Below 80% 706 (454) 926 (594)
6,885 (704) 7,254 (966)

25
(ii) Fair value of sub-prime and Alt-A securities as a percentage of book value Included within the table above are amounts relating to sub-prime and Alt-A securities in a gross unrealised loss position for various percentages of book value of: Fair value Unrealised
loss Fair value Unrealised
loss 31 Mar 2010 31 Mar 2010 31 Dec 2009 31 Dec 2009
£m £m £m £m
Between 90% and 100% 67 (3) 102 (3)
Between 80% and 90% 32 (6) 160 (28)
Below 80% 124 (61) 159 (88)
223 (70) 421 (119)
c) Securities whose fair value were below 80 per cent of the book value As shown in the table above, £454 million (31 December 2009: £594 million) of the £704 million (31 December 2009: £966 million) of gross unrealised losses at 31 March 2010 related to securities whose fair value were below 80 per cent of the book value. The age analysis for this £454 million (31 December 2009: £594 million), indicating the length of time for which their fair value was below 80 per cent of the book value, is as follows: Fair value Unrealised
loss Fair value Unrealised
loss 31 Mar 2010 31 Mar 2010 31 Dec 2009 31 Dec 2009
£m £m £m £m
Less than 3 months 66 (19) 153 (45)
3 months to 6 months 33 (11) 5 (3)
More than 6 months 607 (424) 768 (546)
706 (454) 926 (594)
For securities valued at less than 80 per cent of book value, 70 per cent are investment grade. The analysis by category of debt securities whose fair value were below 80 per cent of the book value is as follows: Fair value Unrealised
loss Fair value Unrealised
loss 31 Mar 2010 31 Mar 2010 31 Dec 2009 31 Dec 2009
£m £m £m £m
RMBS
Prime 247 (115) 322 (153)
Alt-A 38 (17) 77 (33)
Sub-prime 86 (44) 82 (55)
371 (176) 481 (241)
Commercial mortgage backed securities
47 (63) 87 (86)
Other asset backed securities 178 (172) 183 (188)
Total structured securities 596 (411) 751 (515)
Corporates 110 (43) 175 (79)
706 (454) 926 (594)
* Balance sheet items for Jackson National Life have been translated at the closing rate for the period, being $1.5169 at 31 March 2010 (31 December 2009 $1.6149). Jackson National Life income statement movements have been translated at the average exchange rate for the period, being $1.5592 for 3 months to 31 March 2010. Schedule 7 - BASIS OF PREPARATION The new business schedules are provided as an indicative volume measure of transactions undertaken in the reporting period that have the potential to generate profits for shareholders. The amounts shown are not, and not intended to be, reflective of premium income recorded in the IFRS income statement. The format of the schedules is consistent with the distinction between insurance and investment products as applied for previous financial reporting periods. Products categorised as "insurance" refer to those classified as

26
contracts of long-term insurance business for regulatory reporting purposes, i.e. falling within one of the classes of insurance specified in part II of Schedule 1 to the Regulated Activities Order under FSA regulations. The details shown for insurance products include contributions for contracts that are classified under IFRS 4 "Insurance Contracts" as not containing significant insurance risk. These products are described as investment contracts or other financial instruments under IFRS. Contracts included in this category are primarily certain unit-linked and similar contracts written in UK Insurance Operations, and Guaranteed Investment Contracts and similar funding agreements written in US Operations. New business premiums for regular premium products are shown on an annualised basis. Department of Work and Pensions rebate business is classified as single recurrent business. Internal vesting business is classified as new business where the contracts include an open market option. Investment products referred to in the tables for funds under management are unit trusts, mutual funds and similar types of retail fund management arrangements. These are unrelated to insurance products that are classified as investment contracts under IFRS 4, as described in the preceding paragraph, although similar IFRS recognition and measurement principles apply to the acquisition costs and fees attaching to this type of business. New Business Profit has been determined using the European Embedded Value (EEV) methodology set out in our 2009 Annual Report and the assumptions set out in schedule 5. In determining the EEV basis value of new business written in the period policies incept, premiums are included in projected cash flows on the same basis of distinguishing annual and single premium business as set out for statutory basis reporting. New business values are all presented pre-tax.
Notes to Schedules 1 - 6
(1a) Insurance and investment new business for overseas operations has been calculated using average exchange rates. The applicable rate for Jackson for the first quarter of 2010 is 1.56.
(1b) Insurance and investment new business for overseas operations has been calculated using constant exchange rates. The applicable rate for Jackson is 1.56.
(2) Represents cash received from sale of investment products. (3) Annual Equivalents, calculated as regular new business contributions plus 10 per cent single new business contributions, are subject
to roundings. PVNBPs are calculated as equalling single premiums plus the present value of expected premiums of new regular premium business. In determining the present value, allowance is made for lapses and other assumptions applied in determining the EEV new business profit.
(4) Balance includes segregated and pooled pension funds, private finance assets and other institutional clients. Other movements reflect the net flows arising from the cash component of a tactical asset allocation fund managed by PPM South Africa.
(5) New business in India is included at Prudential's 26 per cent interest in the India life operation.
(6) Balance Sheet figures have been calculated at the closing exchange rate. Prior year balance is shown on a constant exchange rate. (7) Sales are converted using the year to date average exchange rate applicable at the time. The sterling results for individual quarters
represent the difference between the year to date reported sterling results at successive quarters and will include foreign exchange movements from earlier periods.
(8) New business in China is included at Prudential's 50 per cent interest in the China life operation.
(9) Mandatory Provident Fund (MPF) product sales in Hong Kong are included at Prudential's 36 per cent interest in Hong Kong MPF operation.