
Prtr non point estimate method in japan
49
Estimating Releases Outside Notification Yayoi Hayashi Research Institute for Environmental Strategies, Inc. 2012.7.20
-
Upload
research-institute-for-environmental-strategies-incries -
Category
Documents
-
view
88 -
download
0
Transcript of Prtr non point estimate method in japan

Estimating Releases Outside Notification
Yayoi Hayashi
Research Institute for Environmental Strategies, Inc.
2012.7.20

Presentation today
2
1. Overall picture of Estimated Releases Outside Notification
Release Sources Estimated; Overall PictureEstimated Releases; Overall Picture
2. Estimation Techniques; ExamplesGeneral descriptionsPesticidesCarsPaintsHouseholds (detergents; surfactants, insecticides; termite
control agents)Listed Industries under the Reporting ThresholdsVery Brief Notes on Prefectural Distribution
3. SummaryKeys for Estimating Releases

◆Estimated Releases
Composition (%) by Release Classification
Source: “PRTR 2010 Data,” MOE & METI
1. Overall picture
4
Classification
Release
(1,000 t/y)
Compos-ition
Notified 183 40%
Estimated
Listed Industries
47 10%
Non-listed Industries
90 20%
Households 59 13%
Mobile Sources 75 17%
Total 270 60%
Grand Total 453 100%

◆Estimated Releases
Grand Total Releases by Prefecture (※)
※ Local government unit
Source: “PRTR 2010 Data,” MOE & METI
1. Overall picture
5
0
届 出 排 出 量 ・ 届 出 外 排 出 量 の合 計
( / )単 位 : ト ン 年
21, 00014, 000 7, 000
Release (t/y)No. Pre-fectures
21,000 or more 2
14,000 - 21,000 10
7,000 - 14,000 11
0 - 7,000 24

◆Estimated Releases
Source: “PRTR 2010 Data,” MOE & METI
1. Overall picture
6
toluene
xylene
ethylbenzene
poly(oxyethylene)alkyl ether(alkyl C=12-15)
dichloromethane
n-hexane
n-alkylbenzenesulfonic acid and its salts(alkyl C=10-14)
chlorodifluoromethane
dichlorobenzene
benzene
0 50 100 150
63
32
14
0
14
13
0
0
0
1
50
45
17
28
2
3
15
14
12
9
Grand Total Top 10 Substances
Notified
Estimated
(113)
(77)
(32)
(9.8)
(28)
(16)
(16)
(15)
(14)
(12)
( ) : Grand total releases
( 1,000 t/y )

◆Estimated Releases
※ carcinogens※ 243 dioxins : mg-TEQ/y Source: “PRTR 2010 Data,” MOE & METI
1. Overall picture
7
Notified & Estimated Releases for Specific Class I Designated Chemical Substances (※)
PRTR SubstancesNotified( kg/y)
Estimated( kg/y) Grand Total( kg/y)Listed
IndustriesNon-listed Industries
Households Mobile Sources
Total
400 benzene 976,095 131,885 776,822 62,243 7,875,720 8,846,670 9,822,765
411 formaldehyde 384,925 614,900 131,413 94,050 6,793,502 7,633,866 8,018,791
305 lead compounds 3,622,822 63,322 40,166 103,488 3,726,310
351 1,3-butadiene 100,117 111 33,360 76,265 2,230,821 2,340,556 2,440,673
332arsenic and its inorganic compounds
1,150,558 483 483 1,151,041
309 nickel compounds 498,927 102,241 102,241 601,168
56 ethylene oxide 243,606 134,688 134,688 378,293
94 chloroethylene 231,257 1,800 1,800 233,057
75 cadmium and its compounds 122,543 100 100 122,643
88 chromium(VI) compounds 9,202 3,750 9,243 12,994 22,196
385 2-bromopropane 5,278 0.2 0.2 5,278
394 beryllium and its compounds 17 663 663 680
33 asbestos 0 70 70 70
397 benzylidyne trichloride 0.1 0 0.1
243 dioxins 353,659 34,943 14,824 60 1,000 50,827 404,486
Total 7,345,347 1,053,944 991,005 232,558 16,900,113 19,177,620 26,522,966

◆General descriptions
2. Estimation Techniques; Examples
8
Example Method Description
1. Paints Top–down Estimated from national shipment
2. Pesticides Semi-top down Estimated from prefectural shipment
3. Cars (hot start) Semi-bottom up Estimated from traffic volume & emission factor, but only highways are covered (smaller streets are not)
4. Listed Industries under the reporting thresholds
Top-down &Bottom-upCombined
One part estimated from national shipment,Another part estimated from mean amounts of substances handled per business operator
Discussion Points① Two estimation methods
Top-down & Bottom-up

◆General descriptions
2. Estimation Techniques; Examples
9
Discussion Points
② In general, the results from Top-down method are better in terms of uncertainty = preferred method
Statistics, other data = critical factor
for estimation projects common to all countries
③ When Top-down method is not possible; Bottom-up method can be envisaged through sample surveys
in order to gather emission factors, amounts of substances used, etc. it may be necessary to conduct a new set of survey
specifically for PRTR
④ In addition to ①-③ above; an estimation result needs to be assorted into notified release
& release outside notification, in order to avoid double-counting

◆General descriptions
<Step 1> Identifying Release Sources to be estimated
-> Estimation by release sources e.g. pesticides, paints, etc. is more effective than estimation by each substance
-> Japanese release sources can be categorized into 3 kinds;
2. Estimation Techniques; Examples
10
Categories Examples of Release Sources
Products containing substances
Pesticides, paints, adhesives, detergents, etc.
Mobile sources Cars, motorbikes, ships, aircrafts, etc.
Others Drinking water (trihalomethane), Listed Industries under the reporting thresholds
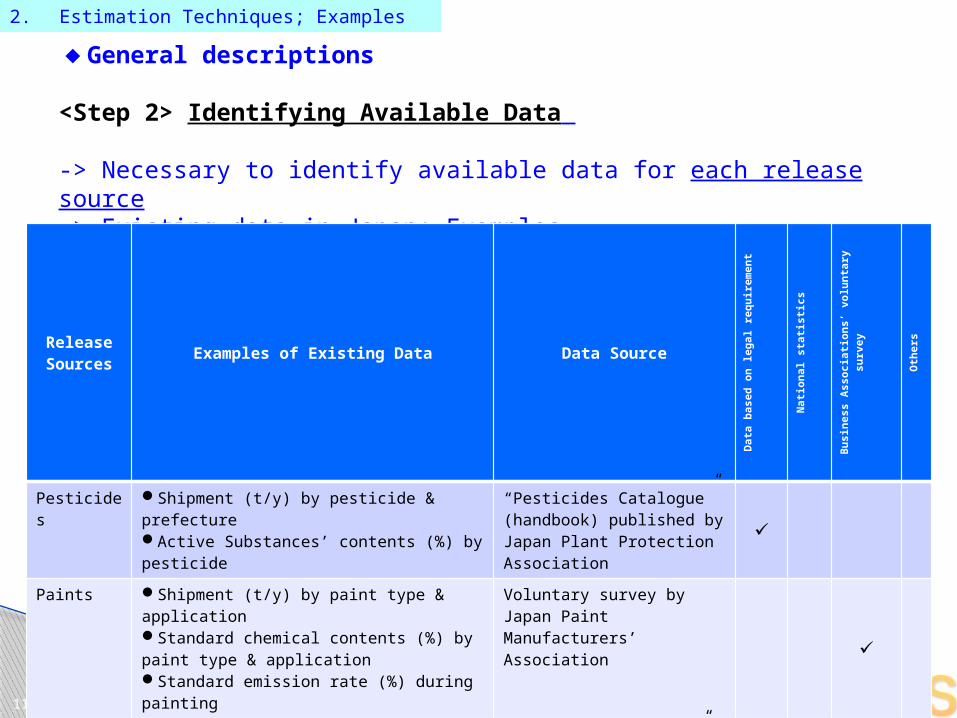
◆General descriptions
<Step 2> Identifying Available Data
-> Necessary to identify available data for each release source-> Existing data in Japan; Examples
2. Estimation Techniques; Examples
11
Release Sources
Examples of Existing Data Data Source
Data based on legal requireme
nt
National
statistics
Business
Associations’
voluntary
survey
Others
Pesticides Shipment (t/y) by pesticide & prefectureActive Substances’ contents (%) by pesticide
“Pesticides Catalogue” (handbook) published by Japan Plant Protection Association
✓
Paints Shipment (t/y) by paint type & applicationStandard chemical contents (%) by paint type & applicationStandard emission rate (%) during painting
Voluntary survey by Japan Paint Manufacturers’ Association ✓
Cars Traffic volume (no. of cars travelled/24h) by highway & its sector
“Road Traffic Census” by MLIT ✓
Emission factor (mg/km-travelled) Research by MOE ✓
Listed Industry under the reporting thresholds
Shipment (t/y) by paint type & application (same as “Paints” above) etc.
Business associations✓
Notified release (kg/y) by business category & substance
“PRTR Data” published by MOE/METI ✓

◆General descriptions
<Step 2> Identifying Available Data
-> When data sets are not available, it may be necessary to conduct a new set of survey specifically for PRTR
2. Estimation Techniques; Examples
12
Release SourcesExamples of Data
Specifically Collected for PRTR
Data Sources
Termite control agents Volume of substance (kg/y) used for producing the agents
Sample survey with manufacturers by MOE
Railroad (breaking pads’ abrasion etc.)
Number of breaking pads etc. (piece) containing asbestos
Survey with railroad companies by MLIT
Aircrafts Number of landing (time/y) by airport & fleet type
Survey results compiled by business association (Scheduled Airlines Association of Japan)
Listed Industries under the reporting thresholds
Volume of substance (kg/y-business operator) used by application
Sample survey with business operators in all business categories by METI
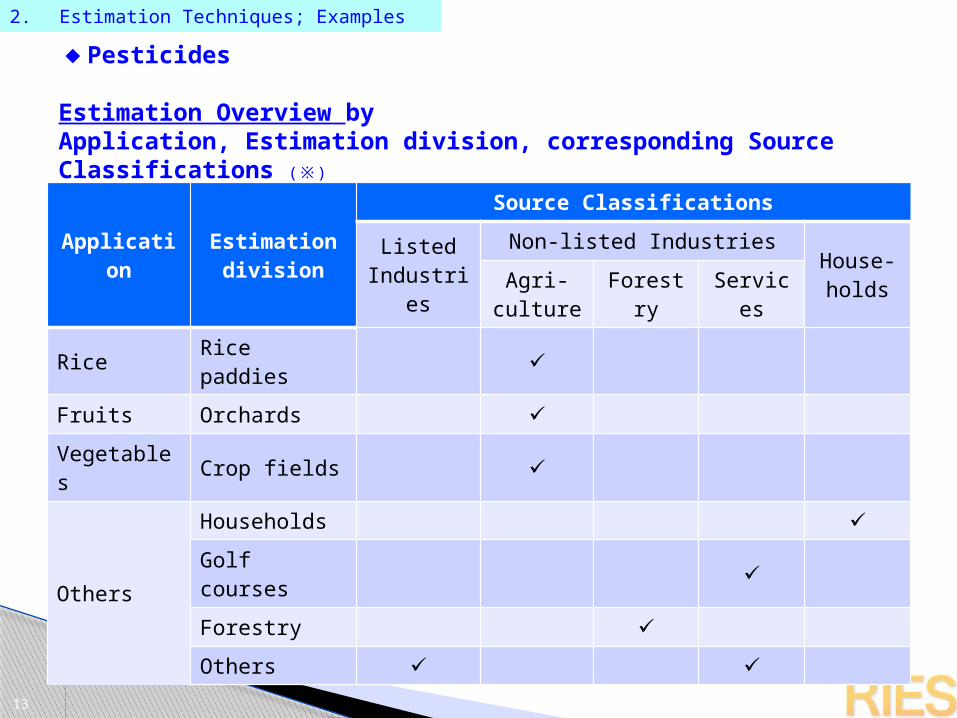
◆Pesticides
Estimation Overview by Application, Estimation division, corresponding Source Classifications (※)
※ Source Classifications; Listed Industries, Non-listed Industries, Households & Mobile Sources
2. Estimation Techniques; Examples
13
Application
Estimation division
Source Classifications
Listed Industries
Non-listed IndustriesHouse-holdsAgri-
cultureForestr
yService
s
Rice Rice paddies ✓
Fruits Orchards ✓
Vegetables Crop fields ✓
Others
Households ✓
Golf courses ✓
Forestry ✓
Others ✓ ✓

◆Pesticides
Example of Existing Data; Shipment By Pesticide Code & Name
(t/y or kl/y)
Note: Figures are fictitiousSource: “Pesticides Catalogue 2010,” Japan Plant Protection Association
2. Estimation Techniques; Examples
14
Pesticide name
Pesticide A
Pesticide B
Pesticide C
Pesticide D
Pesticide …
Pesticide code 10313 10316 1030 10353 10360
Prefecture
Hokkaido 1.6 4.8 - 98.2 2.6
Aomori 13.7 5.0 - 303.4 0.6
Iwate 2.1 9.5 - 15.7 6.9
…

◆Pesticides
Example of Existing Data; Active Agents, Support Agents by Pesticide Code & Name
Note: Figures are fictitiousSource: “Pesticides Application List 2011,” Japan Plant Protection Association
2. Estimation Techniques; Examples
15
Pesticide code Pesticide name Active agent Support agent
10809 BPMC/MEPEmulsion
MEP (251),BPMC (428) Xylene (80)
22300 thiram/TPN wettable powder
TPN (260),Thiram (268) N.A.
33987 xxxx powder N.A.poly(oxyethylene)alkyl ether(alkyl C=12-15) (407)
44562 xxxx emulsionpendimethalin (49),linuron (174)
Xylene (80), naphthalene (302),Methyl-naphthalene (438)

◆Pesticides
Estimation Flow Chart
※ hatched data are existing data.
2. Estimation Techniques; Examples
16
Content (%) of substance per pesticide
Release (t/y) by substance, prefecture & application
Shipment (t/y) by pesticide, prefecture & application
Composition of used amount (%) by application (rice, fruits, vegetables etc.) per pesticide
Shipment (t/y) by pesticide & prefecture

◆Pesticides
Estimation Result; MEP Composition of Used Amounts (%) by Application
Source: “PRTR 2010 Data,” MOE & METI
2. Estimation Techniques; Examples
17
Households
Crop fields
Orchards Rice paddies
Others
Hokkaido Aomori
Iwate National

◆Pesticides
Example of Estimation Result; MEP Release (t/y) by Application
Source: “PRTR 2010 Data,” MOE&METI
2. Estimation Techniques; Examples
18
Prefecture
Release (t/y)
Rice paddies
Orchards
Crop fields
Households
Golf courses Forests Others Total
Hokkaido 17 2 11 4 0 0.1 0.2 34
Aomori 4 6 1 0.5 0.001 0 0.02 12
Iwate 4 3 1 1 0.01 0.1 0.1 9
National Total 161 145 74 109 1 9 65 564

◆Cars
Scope of Estimation
2. Estimation Techniques; Examples
19
Release Estimation
Combustion EngineHot-start ✓
Cold-start ✓
Evaporation ✓
Abrasion ※ not estimated (necessary data not available)

◆Cars; Hot-start
Estimation Flow Chart
※ hatched data are existing data.
2. Estimation Techniques; Examples
20
Travelled Distance (km/y-car)
Release (kg/y-car) by substance
THC Emission Factor
(mg/km)
Substance/THC Ratio (weight %)
By substance

◆Cars; Hot-start
Example of Existing Data; Emission Factor (mg/km)
Note: Emission factors for gasoline-fueled cars are after adjustment by time & wear-outSource: MOE
2. Estimation Techniques; Examples
21
Travelling speed (km/h) Travelling speed (km/h) TH
C E
mis
sion
Fact
or
(mg/k
m-t
ravelle
d)
Passenger Cars Trucks
TH
C E
mis
sion
Fact
or
(mg/k
m-t
ravelle
d)
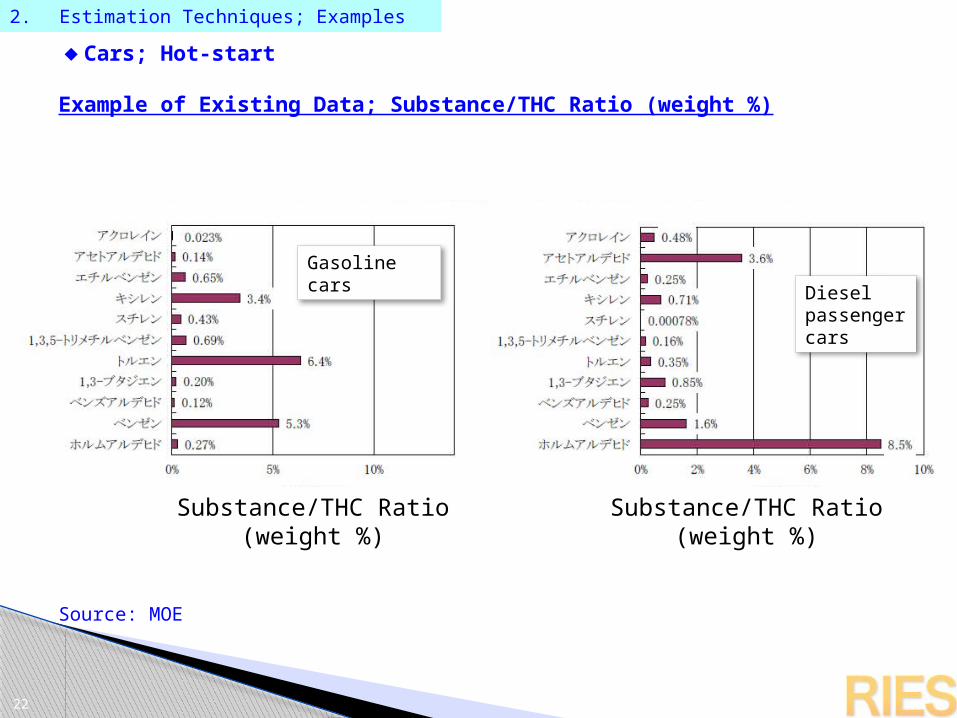
◆Cars; Hot-start
Example of Existing Data; Substance/THC Ratio (weight %)
Source: MOE
2. Estimation Techniques; Examples
22
Gasoline cars Diesel
passenger cars
Substance/THC Ratio(weight %)
Substance/THC Ratio(weight %)
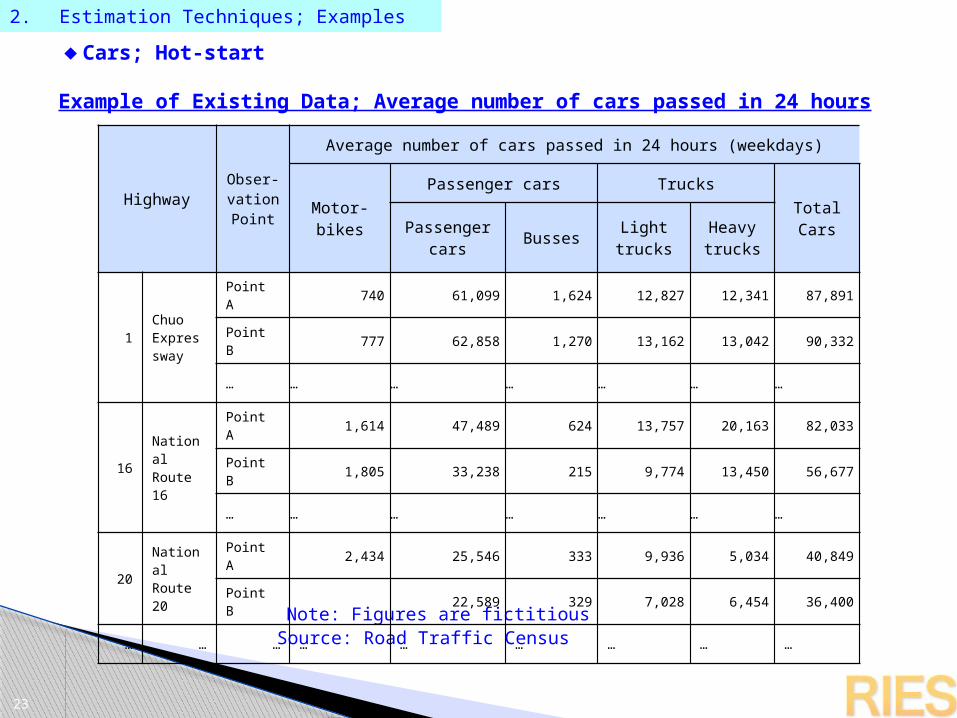
◆Cars; Hot-start
Example of Existing Data; Average number of cars passed in 24 hours
Note: Figures are fictitious Source: Road Traffic Census
2. Estimation Techniques; Examples
23
HighwayObser-vation Point
Average number of cars passed in 24 hours (weekdays)
Motor-bikes
Passenger cars TrucksTotal CarsPassenger
carsBusses
Light trucks
Heavy trucks
1Chuo Expressway
Point A 740 61,099 1,624 12,827 12,341 87,891
Point B 777 62,858 1,270 13,162 13,042 90,332
… … … … … … …
16National Route 16
Point A 1,614 47,489 624 13,757 20,163 82,033
Point B 1,805 33,238 215 9,774 13,450 56,677
… … … … … … …
20National Route 20
Point A 2,434 25,546 333 9,936 5,034 40,849
Point B 22,589 329 7,028 6,454 36,400
… … … … … … … … …

◆Paints
Estimation Overview by Application & corresponding Source Classifications (※)
※ Source Classifications; Listed Industries, Non-listed Industries, Households & Mobile Sources
2. Estimation Techniques; Examples
24
Paint Application
Releases Outside Notification
Notified Release
s
Non-listed Industries
Households
BuildingConstruction (excluding building)
Road pavingHousing
Other buildings
Building ✓ ✓
Other construction
✓
Traffic paints ✓
Households ✓
Other applications (e.g. manufacturing)
✓

◆Paints
Example of existing data; National Shipment by Paint type & Application
Note: Figures are fictitious Source: Japan Paint Manufacturers Association
2. Estimation Techniques; Examples
25
Paint type
Shipment (t/y)
Building
materials
ShipsCars (new)
Car repai
r
Machinery
Metal produc
t… Total
Solvents
Acrylic Synthetics
Room-temperature
2,131 1,785 2,432 5,096 585, 766 … 37,125
Bake & Dry … … … … … … … 40,775
Bake & Dry high solid
… … … … … … … 8,992
… … … … … … … … … …
Solution … … … … … … … … … …
… … … … … … … … … … …
Total 69,680 122,048 192,15926,49
736,551 118,585 … 1,362,939

◆Paints
Example of existing data; Standard Contents of Substances (%) by Paint type
Note: Figures are fictitiousSource: Japan Paint Manufacturers Association
2. Estimation Techniques; Examples
26
Paint type
Solvent Plasticizer Pigments Thinner
Subst-
amce A
ubst- amce B
…ubst- amce C
…ubst- amce D
…ubst- amce E
…Dilution Rate
Solvents
Acrylic Synthetics
Room-temperature
3% 11% … 0.5% … 0.2% … 8% … 16%
Bake & Dry 2% 8% … - … 5% … 15% … 25%
Bake &Dry high solid
… … … … … … … … … …
… … … … … … … … … … … …
Solution … … … … … … … … … … … …
… … … … … … … … … … … … …

◆Paints
Estimation flow Chart
※ hatched data are existing data.
2. Estimation Techniques; Examples
27
Standard Contents of Substances (%)
by Paint type
Release (t/y) by substance
Emission Rate (%)
National Shipment (t/y) by Paint type &
Application
Use (t/y) by substance
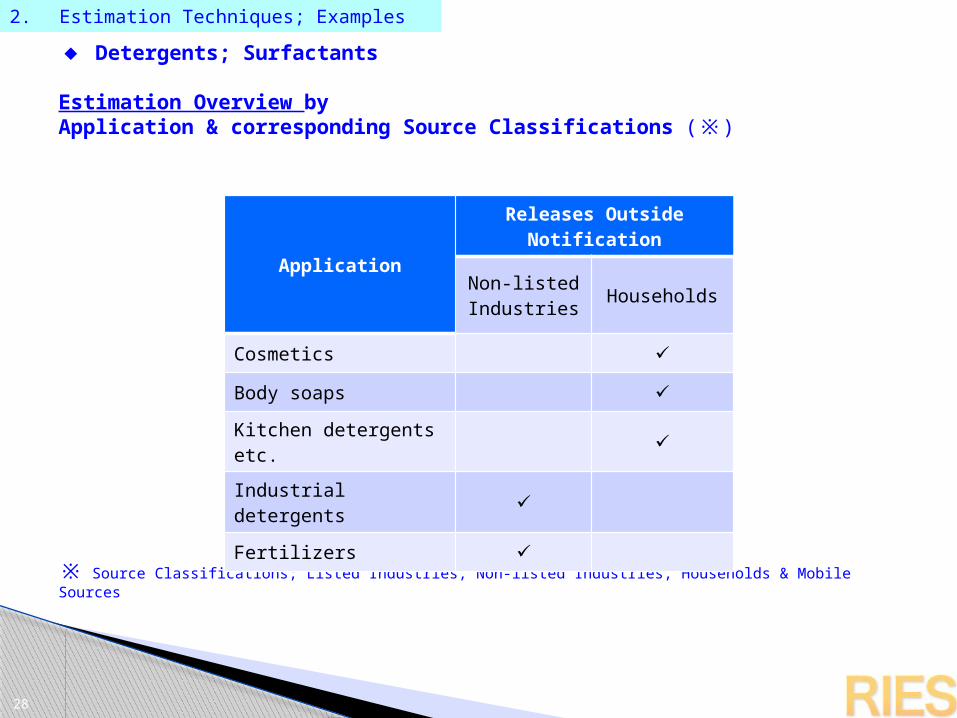
◆ Detergents; Surfactants
Estimation Overview by Application & corresponding Source Classifications (※)
※ Source Classifications; Listed Industries, Non-listed Industries, Households & Mobile Sources
2. Estimation Techniques; Examples
28
Application
Releases Outside Notification
Non-listed Industries
Households
Cosmetics ✓
Body soaps ✓
Kitchen detergents etc.
✓
Industrial detergents ✓
Fertilizers ✓

◆ Detergents; Surfactants
Example of existing data; National Shipment of Surfactant (t/y) by Application & Substance
Note: Figures are fictitiousSource: Based on Japan Soap and Detergent Association, and Japan Surfactant Industry Association
2. Estimation Techniques; Examples
29
ApplicationSubstance
ASubstanc
e B… Total
Perfume & medical products 113 29 … 6,602
Body soaps 67 5 … 7,745
Kitchen detergents … … … …
Laundry detergents … … … …
Industrial detergents (kitchens) … … … …
Industrial detergents (laundry & house cleaning)
… … … …
Fertilizers … … … …
Others … … … …
Total 54,836 3,747 … 199,575

◆Detergents; Surfactants
Estimation flow Chart
※ hatched data are existing data.
2. Estimation Techniques; Examples
30
Release (t/y) by substance
Emission Rate (%)
National Shipment (t/y)
by Application & Substance

◆ Insecticides; Termite Control Agents
Example of Survey; National Shipment of Termite Control Agents (kg/y) by Substance & Application
Note: Figures are fictitiousSource: Based on Survey with members of Japan Termite Control Association
2. Estimation Techniques; Examples
31
Substance
Shipment (kg/y)
TotalBusiness use
House-holds
22 5-amino-1-[2,6-dichloro-4-(trifluoromethyl)phenyl]-3-cyano-4-[(trifluoromethyl)sulfinyl]pyrazole
8,599 8,599
30 n-alkylbenzenesulfonic acid and its salts(alkyl C=10-14) 1,104 1,104
53 ethylbenzene 16 16
57 ethylene glycol monoethyl ether 546 546
64 2-(4-ethoxyphenyl)-2-methylpropyl 3-phenoxybenzyl ether 3,674 500 4,174
80 xylene 6,116 6,116
… … … …
Total 61,751 49,213 110,964

◆Insecticides; Termite Control Agents
Estimation flow Chart
※ hatched data are collected specifically for PRTR.
2. Estimation Techniques; Examples
32
Release (t/y) by substance
Emission Rate (%)
National Shipment (t/y) by Substance

◆Listed Industries under the reporting thresholds
Scope of Estimation
2. Estimation Techniques; Examples
33
Estimated releases
NotifiedreleasesA
mount
handle
d p
er
year
per
busi
ness
opera
tor
1t (0.5t)
21 Number of workersper business operator

◆Listed Industries under the reporting thresholds
Estimation Method
2. Estimation Techniques; Examples
34
2 Approaches Combined
I. Estimation By Release Sources
Focus on End Products (paints, adhesives, etc.)
Statistics on shipments are available
II. Estimation Based On Average Amounts Of Substances Handled
Focus on Average Amount of Substances Handled
Data by industry & by substance are specifically collected for PRTR
※ Releases overlapping 1. above will be subtracted later-on

◆Listed Industries under the reporting thresholds
Estimation Method I. Release Sources
2. Estimation Techniques; Examples
35
Release Sources Descriptions
1. Paints Solvents used in paints painted on industrial products, thinner
2. Adhesives Solvents used in adhesives for industrial products, pressure-sensitive tapes, sheets, etc.
3. Printing inks Solvents used in printing inks for industrial products, thinners
4. Industrial cleaners Industrial cleaning solvents, dry-cleaning solvents, etc.
5. Rubber glues Solvents used in adhesives for industrial rubber products
6. Fuel evaporation Vapor loss at gas stations
7. Chemical feedstock Feedstock, reaction solvent
8. Removers Paint removers
9. Sterilizer, disinfectants Chemical agents to remove microbes
10. Surface finishers Acid agents to clean metal surface etc.
…

◆Listed Industries under the reporting thresholds
Estimation Method I. Release Sources
Release (t/y) from business operators < thresholds※ Under-thresholds ratio (%) = -------------------------------------------- Release (t/y) from all business operators
2. Estimation Techniques; Examples
36
Releases from business operators < thresholds (kg/y)
in Industry A
= Release from Industry A (kg/y)
…(1)
x Under-thresholds ratio (%) (※)
…(2)

◆Listed Industries under the reporting thresholds
Estimation Method I. Release Sources
Ex. Paints; Flow chart (1) Release from Industry A
2. Estimation Techniques; Examples
37
Paint type
Shipment (t/y)
Building material
s
ShipsCars (new)
Car repair
Machinery
Metal product
… Total
Solvents
Acrylic Synthetics
Room-temperature
2,131 1,785 2,432 5,096 585, 766 … 37,125
Bake & Dry … … … … … … … 40,775
Bake & Dry high solid
… … … … … … … 8,992
… … … … … … … … … …
Solution
… … … … … … … … … …
… … … … … … … … … … …
Total 69,680 122,048192,15
926,497 36,551 118,585 … 1,362,939
Standard Contents of Substance (%) by
Paint typeIn Automobile
Industry
Release (t/y) by substanceIn Automobile Industry
Emission Rate (%)In Automobile
Industry
National Shipment (t/y) by Paint typeIn Automobile
Industry
Use (t/y) by substance
In Automobile Industry
Business Category using Paints e.g. “Cars (new)” => Listed Industry e.g.
Automobile Industry

◆Listed Industries under the reporting thresholds
Estimation Method I. Release Sources
Ex. Paints; Flow chart (2) under-thresholds ratio
※ are existing data※ are data specifically collected for PRTR
2. Estimation Techniques; Examples
38
Release (t/y) by substanceIn Industry A
Under-thresholds ratio (%)In Industry A
Release (t/y) of business operators < thresholds by
substanceIn Industry A
Data on number of workersIn Industry A
Data on standard amounts of substances handled per
yearIn Industry A (1)

◆Listed Industries under the reporting thresholds
Estimation Method I. Release Sources
Ex. Paints; Flow chart (2) under-thresholds ratio
Estimated releases
NotifiedreleasesA
mount
handle
d p
er
year
q = 1t (0.5t)
p = 21
2. Estimation Techniques; Examples
39
Parameters
p q
Workers < 21 Handled amount < 1t (0.5t)
E1 = A×p×( 1-q)E2 = A×q A: Release from Industry A
Number of workers
Estimated releases 1 (E1)
Estimated releases 2 (E2)
Release from Industry A

◆ Listed Industries under the reporting thresholds
Estimation Method I. Release Sources (2) under-thresholds ratio
2 Data sets used to determine p & q parameters
2. Estimation Techniques; Examples
40
p q
Workers < 21 Handled amount < 1t (0.5t)
“Economic Census” & other statistics concerning number of workers per business operator
Sample survey with business operators in all business categories, specifically conducted for PRTR

◆ Listed Industries under the reporting thresholds
Estimation Method I. Release Sources (2) under-thresholds ratio
Data sets used to determine p; Economic Census
Source: “Economic Census 2009”
2. Estimation Techniques; Examples
41
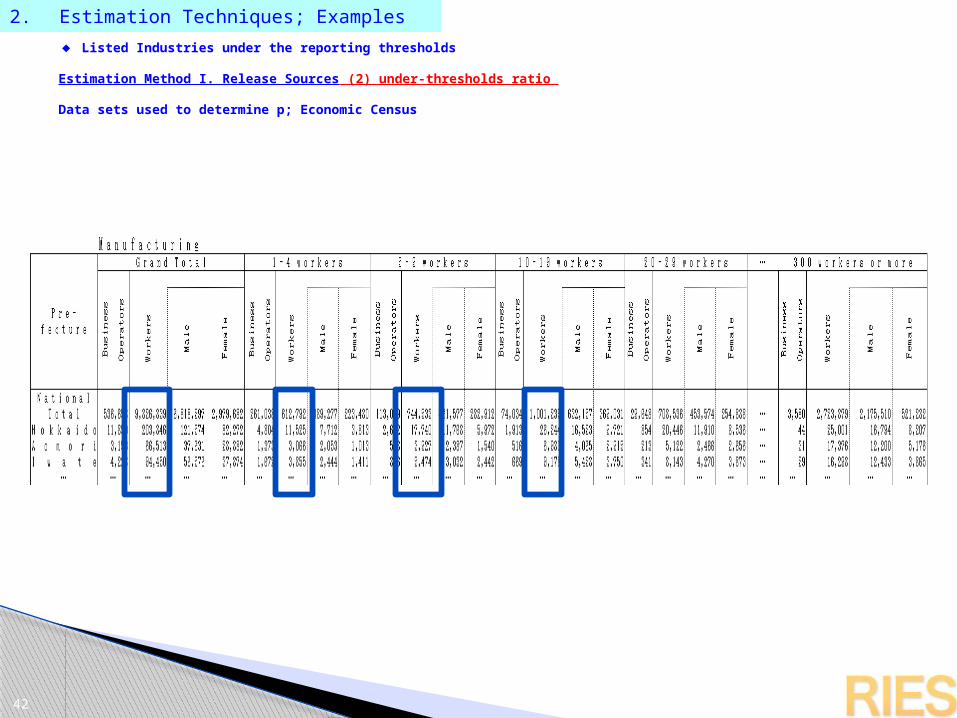
◆ Listed Industries under the reporting thresholds
Estimation Method I. Release Sources (2) under-thresholds ratio
Data sets used to determine p; Economic Census
Source: “Economic Census 2009”
2. Estimation Techniques; Examples
42

◆ Listed Industries under the reporting thresholds
Estimation Method I. Release Sources (2) under-thresholds ratio
Data sets used to determine q; Sample survey with business operators (Substance A)
Source: Based on Sample survey with business operators
2. Estimation Techniques; Examples
43
Rank Handle per Year
Total Release per Year1 2 3 4
Chemical Industry Metal/Machinery Manufacturing Other Manufacturing Non-
Manufacturing
kg/y Contribut-ion kg/y Contribut-
ion kg/y Contribut-ion kg/y Contribut-
ion1 100kg < 460 0.1% 1,816 0.1% 1,198 0.1% 352 2.3%2 100~ 500kg 1,878 0.4% 5,575 0.3% 10,677 0.6% 834 5.5%3 500kg~ 1t 1,732 0.4% 19,405 0.9% 11,718 0.7% 445 3.0%
4 1~ 10t 38,297 8.5% 401,939 18.2% 137,093 7.7% 13,444 89.2%
5 10~ 100t 230,952 51.0% 1,438,421 65.2% 924,117 51.7% 6 100~ 1,000t 127,456 28.2% 338,316 15.3% 703,345 39.3% 7 1,000~ 10,000t 51,832 11.5% 8 10,000 ~ 100,000t
9 100,000t or more
Grand Total 452,609 100.0% 2,205,471 100.0% 1,788,149 100.0% 15,076 100.0%

◆ Listed Industries under the reporting thresholds
Estimation Method I. Release Sources (2) under-thresholds ratio
Data sets used to determine q; Sample survey with business operators (Substance A)
Source: Based on Sample survey with business operators
2. Estimation Techniques; Examples
44
Rank Handle per Year
Total Release per Year1 2 3 4
Chemical Industry Metal/Machinery Manufacturing Other Manufacturing Non-
Manufacturing
kg/y Contribut-ion kg/y Contribut-
ion kg/y Contribut-ion kg/y Contribut-
ion1 100kg < 460 0.1% 1,816 0.1% 1,198 0.1% 352 2.3%2 100~ 500kg 1,878 0.4% 5,575 0.3% 10,677 0.6% 834 5.5%3 500kg~ 1t 1,732 0.4% 19,405 0.9% 11,718 0.7% 445 3.0%
4 1~ 10t 38,297 8.5% 401,939 18.2% 137,093 7.7% 13,444 89.2%
5 10~ 100t 230,952 51.0% 1,438,421 65.2% 924,117 51.7% 6 100~ 1,000t 127,456 28.2% 338,316 15.3% 703,345 39.3% 7 1,000~ 10,000t 51,832 11.5% 8 10,000 ~ 100,000t
9 100,000t or more
Grand Total 452,609 100.0% 2,205,471 100.0% 1,788,149 100.0% 15,076 100.0%
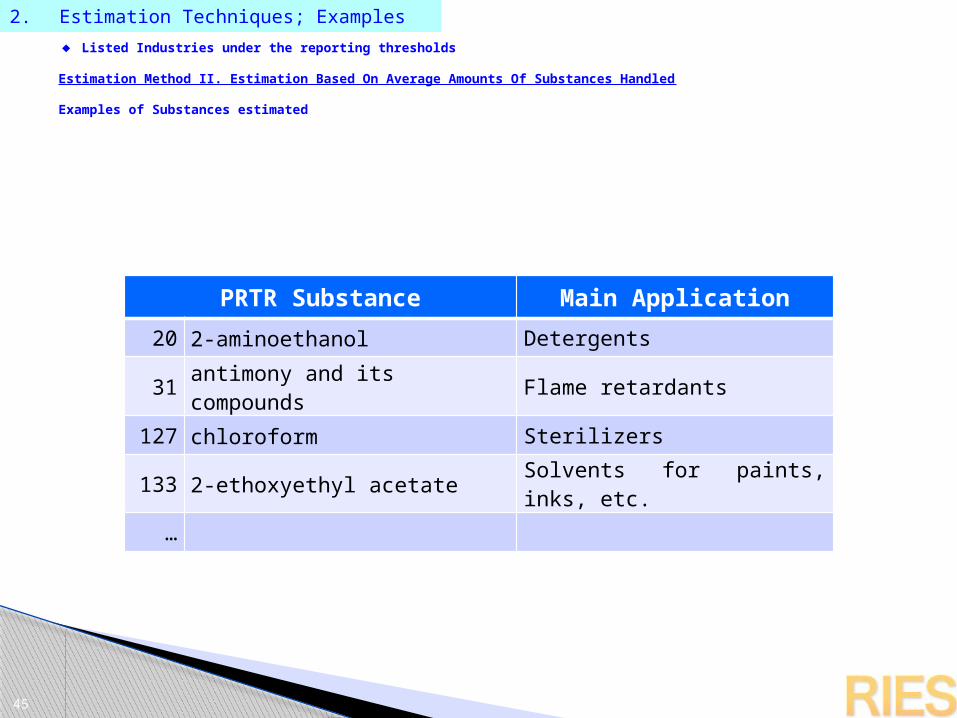
◆ Listed Industries under the reporting thresholds
Estimation Method II. Estimation Based On Average Amounts Of Substances Handled
Examples of Substances estimated
2. Estimation Techniques; Examples
45
PRTR Substance Main Application
20 2-aminoethanol Detergents
31 antimony and its compounds Flame retardants
127 chloroform Sterilizers
133 2-ethoxyethyl acetateSolvents for paints, inks, etc.
…

◆ Listed Industries under the reporting thresholds
Estimation Method II. Estimation Based On Average Amounts Of Substances Handled
Estimation Flow Chart
※ are existing data※ are data specifically collected for PRTR
2. Estimation Techniques; Examples
46
No. of business operators < thresholds by substance
In Industry A
Standard release (kg/y) per Substance
In Industry A
Release (t/y) of business operators < thresholds by
substanceIn Industry A
Data on standard amounts of substances handled per
yearIn Industry A
※ same as Sample Survey
Emission Rate (%) per Substance
In Industry A※ same as Sample Survey
No. of business operators In Industry A
※ same as “Economic Census”
Rate (%) of business operators by substance
In Industry A※ same as Sample Survey
No. of business operators which notified PRTR release
by substanceIn Industry A※ PRTR data

◆Very Brief Notes on Prefectural Distribution
2. Estimation Techniques; Examples
47
3 patterns for distribution
① Releases are proportional to industrial activities Distribution index based on economic data (e.g. Economic Census,
PRTR Notification Data) Ex. Listed Industries < thresholds, Paints etc. (excluding releases from
households)
② Releases are proportional to population or households Distribution index based on population data (e.g. Population Census)
Ex. Paints, Insecticides, etc. (only releases from households)
③ Releases are proportional to other index Distribution index based on other data (e.g. distance travelled by car,
number of breaking pads) Ex. Cars, Railroad Wagons, etc.
④ Estimation made at the prefecture level Ex. Pesticides, Aircrafts, etc.

3. Summary
48
Keys for Estimating Releases
① Shared interests among stakeholders regarding the target release sources & substances
Stakeholders include the regulators and regulated alike
The interests in estimating which substances and which release sources are commonly shared
② Availability of statistics and other data
Data include national statistics on business and population, as well as the data from the business associations
③ Close collaboration with business associations and inter-ministerial cooperation
Especially conducting surveys with enterprises
Data and statistics may be available from MLIT etc.

☺ Presentation materials are also available in electric forms
☺ Your enquiries are welcome at…
Yayoi Hayashi, Research Division<[email protected]>
Thank you for listening
49