Présentation PowerPoint - Xilam
20
2019 FINANCIAL RESULTS MARCH 2020 1
Transcript of Présentation PowerPoint - Xilam

2019 FINANCIAL RESULTSMARCH 2020
1
DISCLAIMER
2019 FINANCIAL RESULTS 2
This statement may contain estimated financial data, information on future projects and transactions and future business results/
performance. Such forward-looking data are provided for estimation purposes only. They are subject to market risks and uncertainties and
may vary significantly compared with the actual results that will be published. The estimated financial data have been presented to the
Board of Directors and have not been audited by the Statutory Auditors. More detailed information on the potential risks that could affect
our financial results is included in the 2018 Financial annual report in chapter 2.8. Other than as required by law, Xilam Animation does not
undertake any obligation to update them in light of new information or future developments.
OUR MISSION
2019 FINANCIAL RESULTS
Offer the best animation content to the world.
Attract and retain the most creative talent.
Be a long-term valuable partner to our distribution platforms.
Set an example as an inclusive business.
Bring sustainable and profitable growth to our investors.
3

STRONG ORGANIC GROWTH OVER 20+ YEARS
2019 FINANCIAL RESULTS 4
The dawn of a new scaling cycle(1) Kidscreen 2019 Hot50 winners: http://kidscreen.com/hot50/2019/
1999 2020
GLOBAL OPERATORLEADING ANIMATION GROUP INNOVATORDIGITAL PLAYER
FOUNDATIONS STRUCTURING SCALINGACCELERATION
AVOD sales
ramp-up
Emerging
markets
Consolidating
brands
Building
brands
Creating
expertise
Building a global
distribution networkGlobal
recognition
SVOD sales
ramp-up
Among the Top10 animation
studios(1)
5 production studios: Paris (2),
Lyon, Angouleme, Ho Chi Minh
500 employees (400 artists)
>20 original creations
>2,200 episodes produced
190 countries / >800m homes
>15bn views / 15M+
subscribers on YouTube
1 Oscar nomination, Best
Animation Film
A POWERFUL BUSINESS MODEL
2019 FINANCIAL RESULTS 5
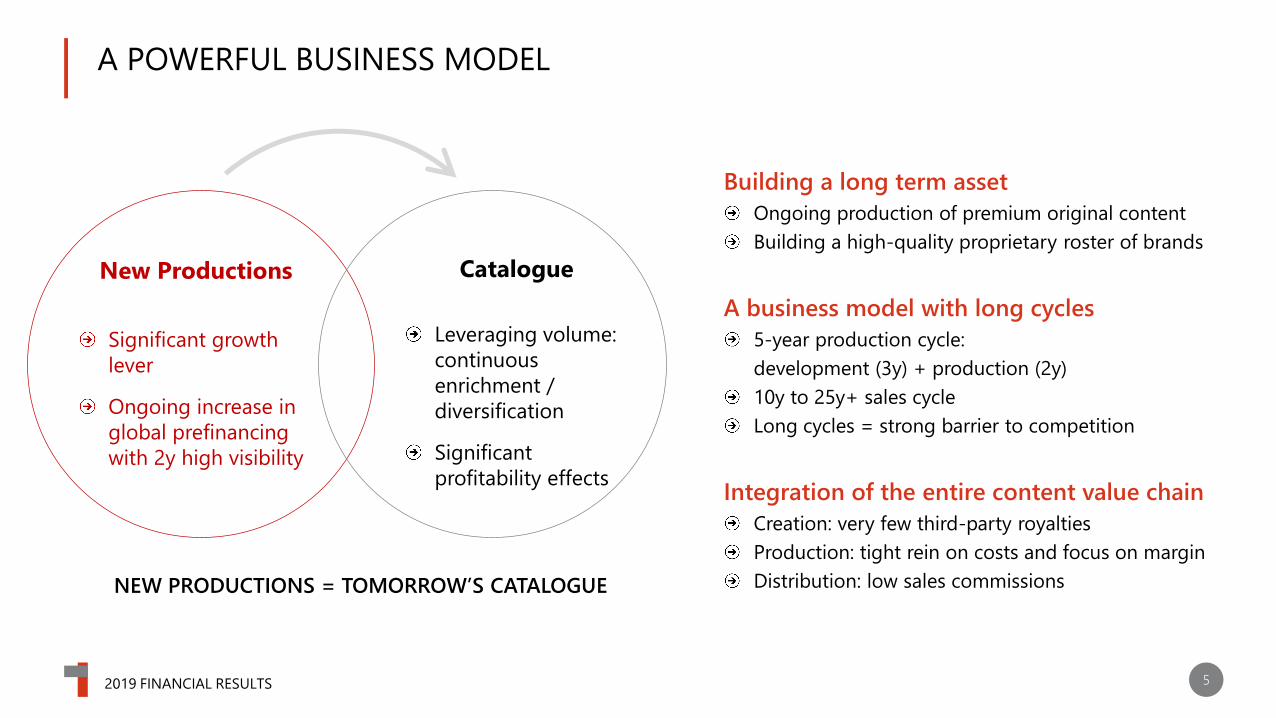
Building a long term asset
Ongoing production of premium original content
Building a high-quality proprietary roster of brands
A business model with long cycles
5-year production cycle:
development (3y) + production (2y)
10y to 25y+ sales cycle
Long cycles = strong barrier to competition
Integration of the entire content value chain
Creation: very few third-party royalties
Production: tight rein on costs and focus on margin
Distribution: low sales commissions
New Productions
Significant growth
lever
Ongoing increase in
global prefinancing
with 2y high visibility
Catalogue
Leveraging volume:
continuous
enrichment /
diversification
Significant
profitability effects
NEW PRODUCTIONS = TOMORROW’S CATALOGUE
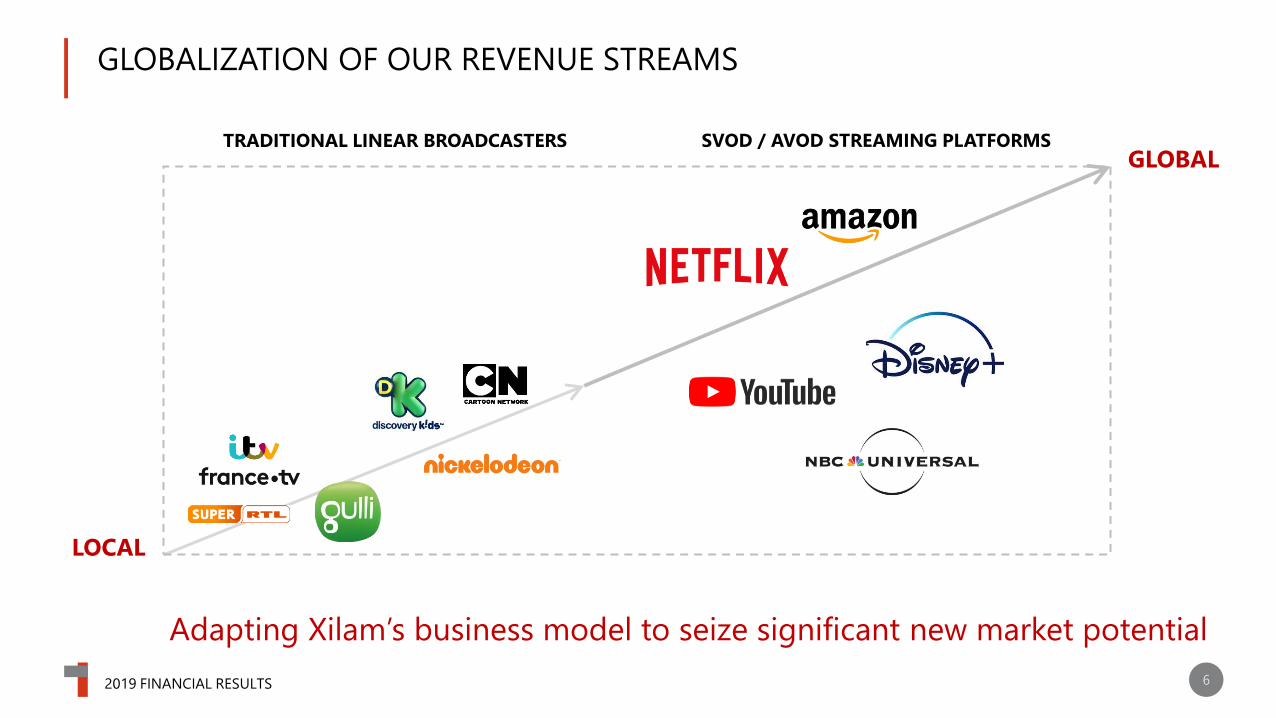
GLOBALIZATION OF OUR REVENUE STREAMS
2019 FINANCIAL RESULTS 6
Adapting Xilam’s business model to seize significant new market potential
SVOD / AVOD STREAMING PLATFORMSTRADITIONAL LINEAR BROADCASTERS
LOCAL
GLOBAL
7
FINANCIAL RESULTS 2019
SHARP INCREASE IN PROFITABILITY

8
A TRACK RECORD OF STRONG AND PROFITABLE GROWTH
2019 FINANCIAL RESULTS(1) According to IFRS15, revenue recognition is triggered by the effective content material delivery and the rights opening(2) Audiovisual tax credits = “Credit d’Impôt Audiovisuel”(3) Unaudited data
11.315.9
24.428.0 30.1
1.1 1.3 2.2 2.4 3.4
2015 2016 2017 2018 2019
12.4
17.1
26.6
30.3
16.5% 27.0% 31.3% 30.0%Current Operating Income /
Total Turnover and Subsidies (%)
33.5
+28% CAGRTotal operating revenue
Total turnover and
subsidies(1)
Other recurring revenue
(including audiovisual
tax credits(2))
30.7%
(3)

9
RESULTS DEMONSTRATING THE MODEL’S EFFECTIVENESS
2019 FINANCIAL RESULTS
(€k)2019 (1)
IFRS 16
2018 (3)
Change (%)
Turnover and subsidies from new productions 23,309 18,228
Turnover from catalogue 6,752 9,723
Total Turnover and Subsidies 30,061 27,951 +7.5%
Other recurring operating revenue (o/w audiov. tax credits) 3,410 2,350
Total Revenue and Other Income 33,471 30,301 +10.5%
Purchases (368) (181)
Staff costs (3,069) (2,867)
Other recurring operating expenses, net (1,933) (2,894)
Depreciation, amortisation and impairment, net (18,887) (15,965)
Curent Operating Income (2) 9,214 8,394 +9.8%
% Turnover 30.7% 30.0%
Other non-recurring operating income and expense (295) (1,212)
Operating Income 8,919 7,182 +24.2%
% Turnover 29.7% 25.7%
Net Income 6,854 5,159 +32.9%
% Turnover 22.8% 18.5%
(1) Unaudited data.
(2) Much reduced, the impact of free share plans no longer justifies publication of adjusted operating income from
recurring operations. It is therefore replaced here by profit from recurring operations.
(3) IFRS 16 Norm governing ‘Leasing Transactions’ applied as of 1 January 2019 no restatement of comparable periods.
10
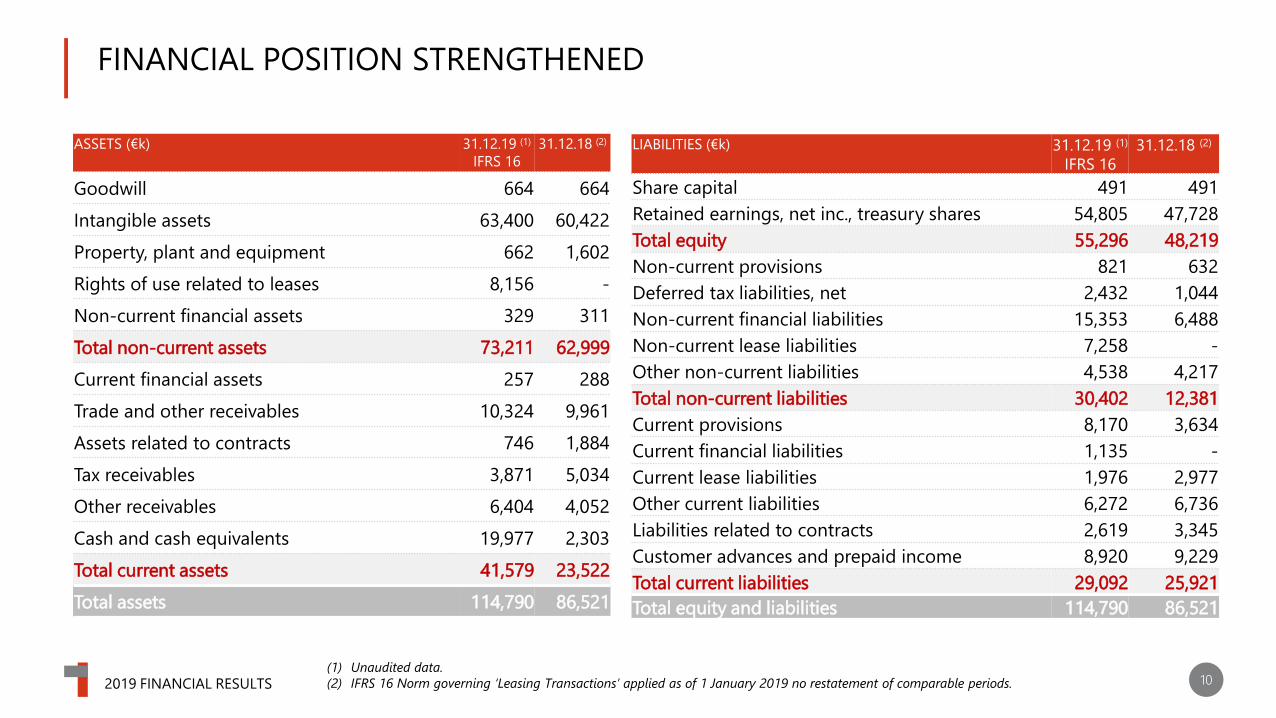
FINANCIAL POSITION STRENGTHENED
2019 FINANCIAL RESULTS
ASSETS (€k) 31.12.19 (1)
IFRS 16
31.12.18 (2)
Goodwill 664 664
Intangible assets 63,400 60,422
Property, plant and equipment 662 1,602
Rights of use related to leases 8,156 -
Non-current financial assets 329 311
Total non-current assets 73,211 62,999
Current financial assets 257 288
Trade and other receivables 10,324 9,961
Assets related to contracts 746 1,884
Tax receivables 3,871 5,034
Other receivables 6,404 4,052
Cash and cash equivalents 19,977 2,303
Total current assets 41,579 23,522
Total assets 114,790 86,521
LIABILITIES (€k) 31.12.19 (1)
IFRS 16
31.12.18 (2)
Share capital 491 491
Retained earnings, net inc., treasury shares 54,805 47,728
Total equity 55,296 48,219
Non-current provisions 821 632
Deferred tax liabilities, net 2,432 1,044
Non-current financial liabilities 15,353 6,488
Non-current lease liabilities 7,258 -
Other non-current liabilities 4,538 4,217
Total non-current liabilities 30,402 12,381
Current provisions 8,170 3,634
Current financial liabilities 1,135 -
Current lease liabilities 1,976 2,977
Other current liabilities 6,272 6,736
Liabilities related to contracts 2,619 3,345
Customer advances and prepaid income 8,920 9,229
Total current liabilities 29,092 25,921
Total equity and liabilities 114,790 86,521
(1) Unaudited data.
(2) IFRS 16 Norm governing ‘Leasing Transactions’ applied as of 1 January 2019 no restatement of comparable periods.
11
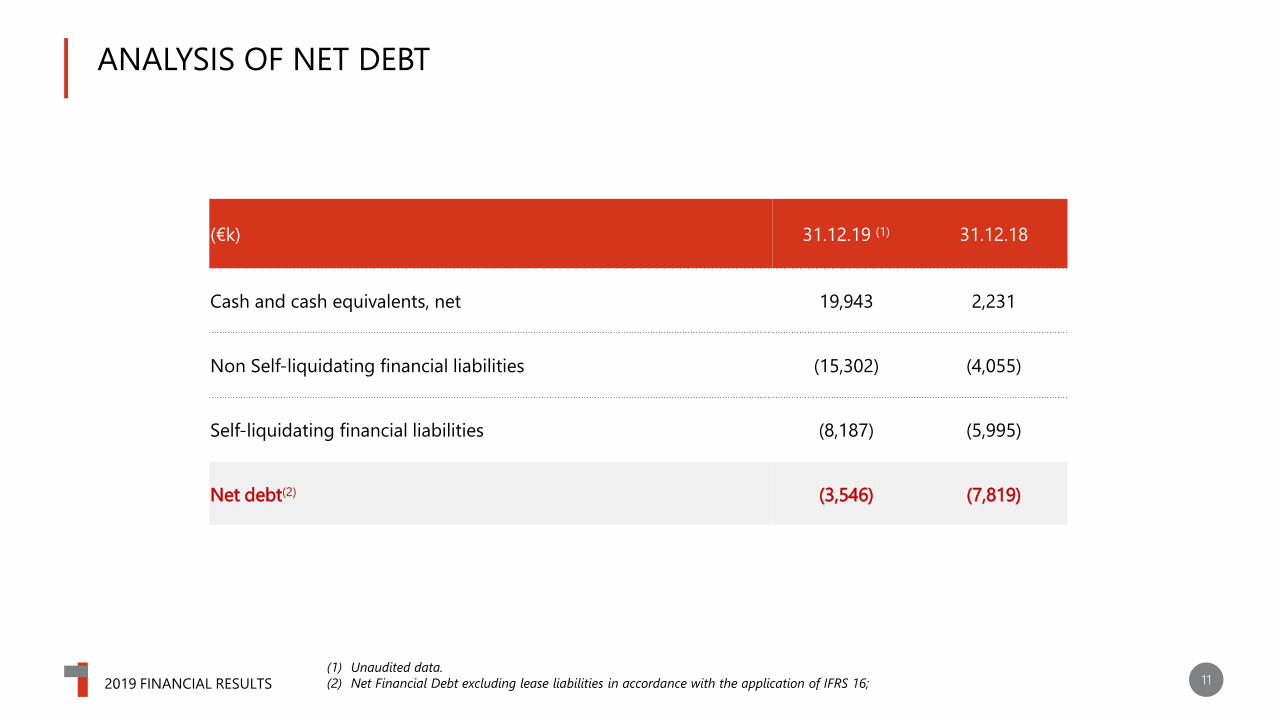
ANALYSIS OF NET DEBT
2019 FINANCIAL RESULTS
(€k) 31.12.19 (1) 31.12.18
Cash and cash equivalents, net 19,943 2,231
Non Self-liquidating financial liabilities (15,302) (4,055)
Self-liquidating financial liabilities (8,187) (5,995)
Net debt(2) (3,546) (7,819)
(1) Unaudited data.
(2) Net Financial Debt excluding lease liabilities in accordance with the application of IFRS 16;

AN INDEPENDENT FAMILY-OWNED GROUP
MDP Audiovisuel;
26,3%
Xilam Group; 10,1%
Treasury shares; 1,3%
4,4%
Free float; 57,9%
Majority of voting rights held
by the founder
(53.3%)
MDP Audiovisuel 38.4%
Xilam Group 14.9%
Treasury shares 0.9%
Other 3.3%
Free float 42.5%
(1) Xilam Group is wholly-owned by MDP Audiovisuel, which is in turn wholly-owned by Marc du Pontavice (2) Employees and other registered shareholders
Voting rights
1
Other2
122019 FINANCIAL RESULTS
13
Il faudra changer ce visuel
Nous devons montrer uniquement
des images nouvelles
SCALE 2023
ADDRESSING THE FULL POTENTIAL OF THE MARKET
DISRUPTION
2019 FINANCIAL RESULTS 14
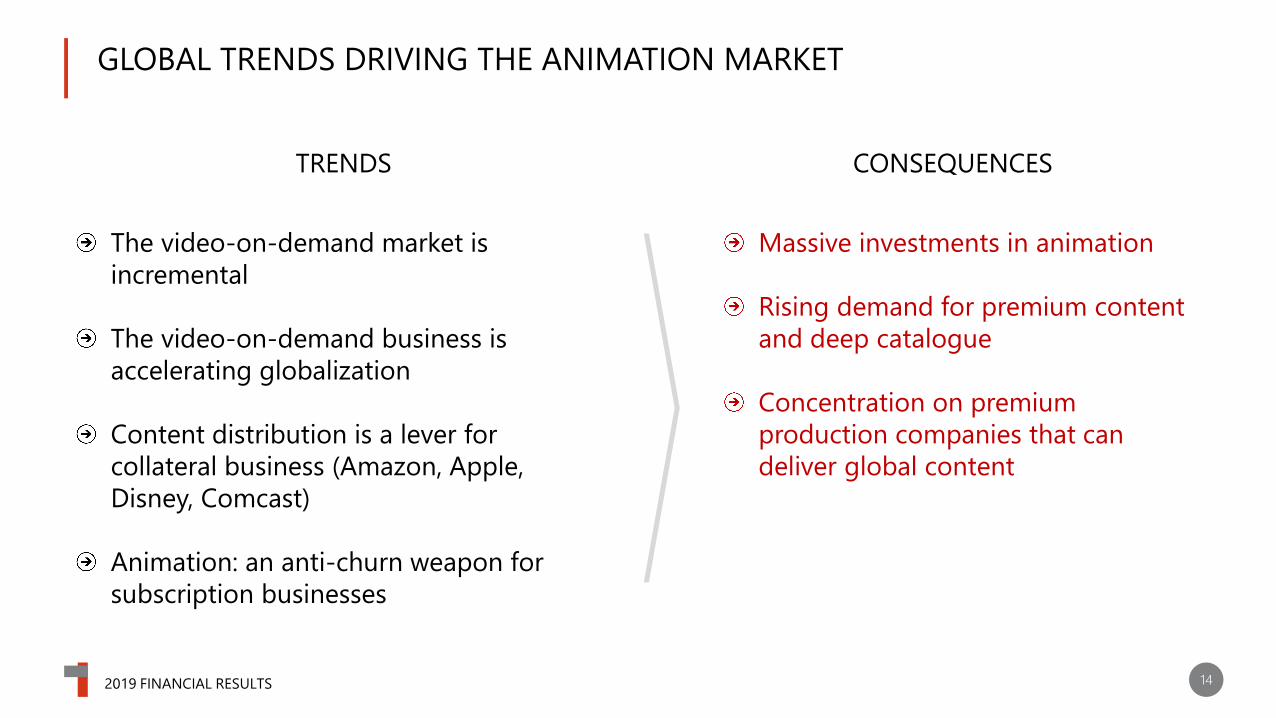
GLOBAL TRENDS DRIVING THE ANIMATION MARKET
The video-on-demand market is
incremental
The video-on-demand business is
accelerating globalization
Content distribution is a lever for
collateral business (Amazon, Apple,
Disney, Comcast)
Animation: an anti-churn weapon for
subscription businesses
Massive investments in animation
Rising demand for premium content
and deep catalogue
Concentration on premium
production companies that can
deliver global content
TRENDS CONSEQUENCES
15
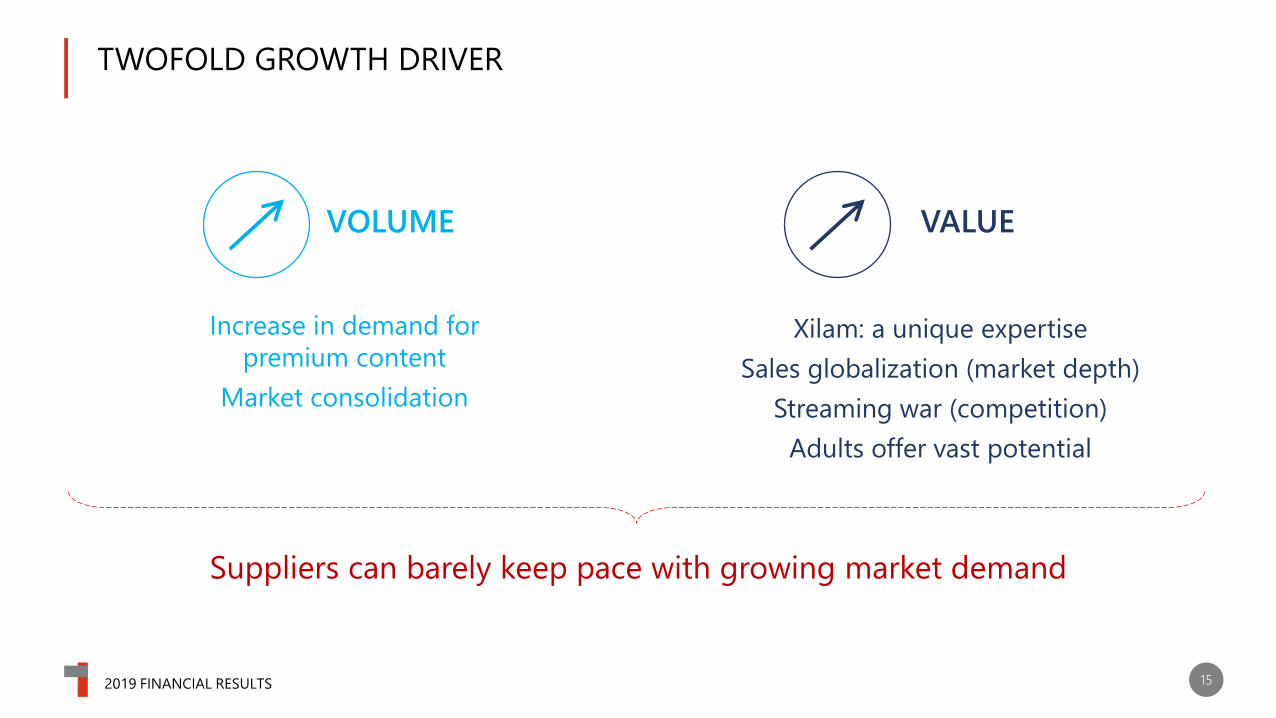
TWOFOLD GROWTH DRIVER
2019 FINANCIAL RESULTS
Suppliers can barely keep pace with growing market demand
Increase in demand for
premium content
Market consolidation
Xilam: a unique expertise
Sales globalization (market depth)
Streaming war (competition)
Adults offer vast potential
VOLUME VALUE
16
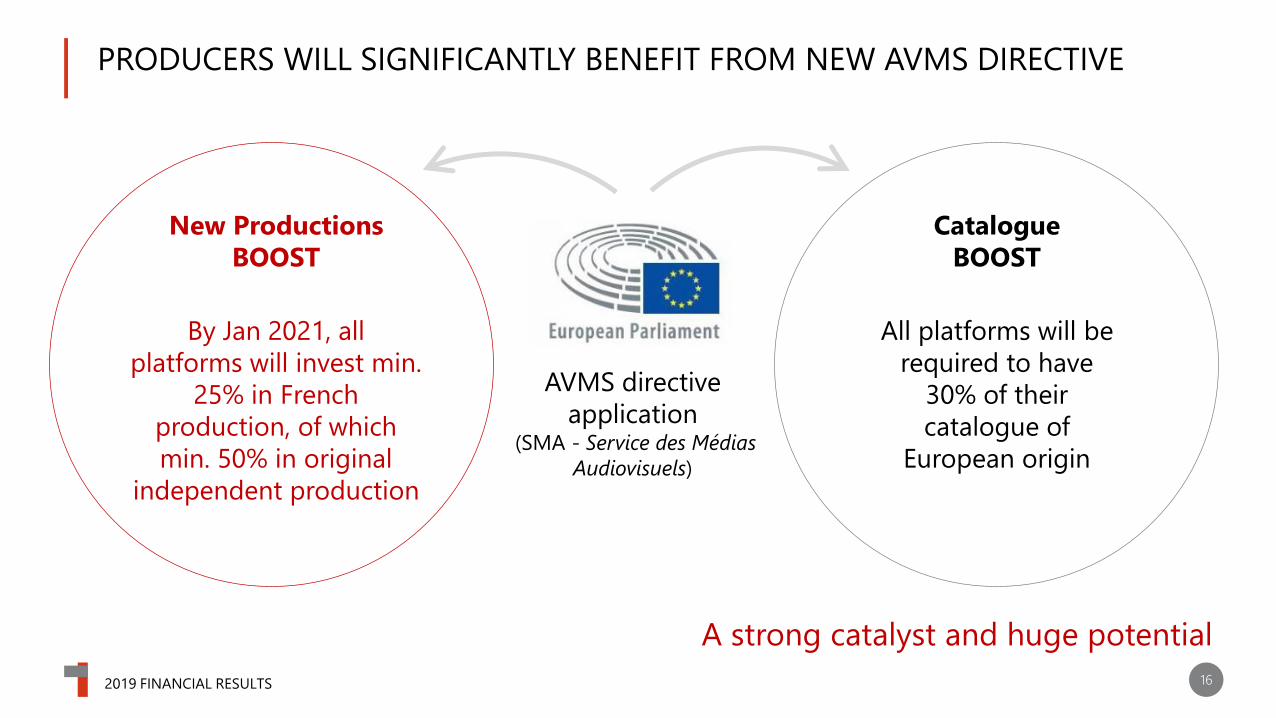
PRODUCERS WILL SIGNIFICANTLY BENEFIT FROM NEW AVMS DIRECTIVE
2019 FINANCIAL RESULTS
A strong catalyst and huge potential
AVMS directive
application(SMA - Service des Médias
Audiovisuels)
New Productions
BOOST
By Jan 2021, all
platforms will invest min.
25% in French
production, of which
min. 50% in original
independent production
Catalogue
BOOST
All platforms will be
required to have
30% of their
catalogue of
European origin
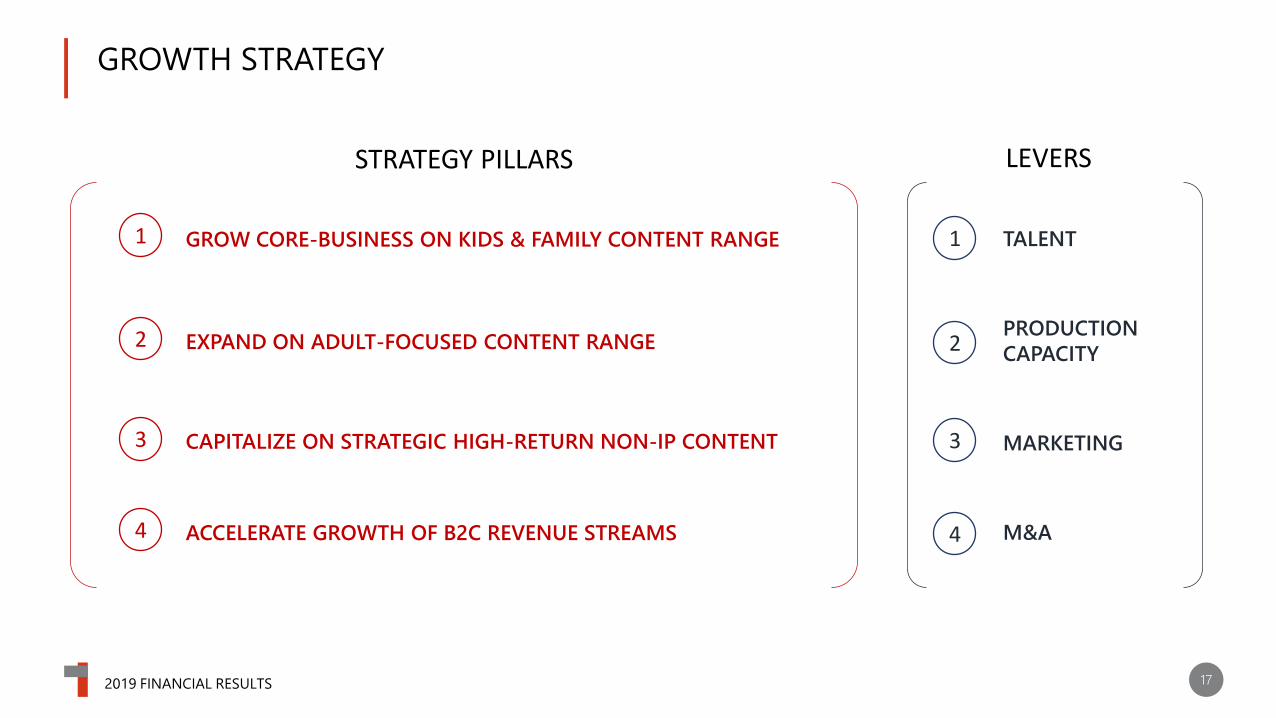
GROWTH STRATEGY
2019 FINANCIAL RESULTS 17
1
2
3
4
TALENT
PRODUCTION
CAPACITY
MARKETING
M&A
GROW CORE-BUSINESS ON KIDS & FAMILY CONTENT RANGE
EXPAND ON ADULT-FOCUSED CONTENT RANGE
CAPITALIZE ON STRATEGIC HIGH-RETURN NON-IP CONTENT
ACCELERATE GROWTH OF B2C REVENUE STREAMS
1
2
3
4
STRATEGY PILLARS LEVERS

18
10 SERIES IN PRODUCTION, A RECORD LEVEL
2019 FINANCIAL RESULTS
26 half-hours
Athleticus 3De Gaulle at the beach
Lupin’s tales
TangranimoOggy Oggy
Oggy Next Generation TricoMoka Chip ‘n’ Dale
Pfffirates
26 half-hours 26 half-hours 26 half-hours 13 half-hours
52 half-hours 3 half-hours26 half-hours 3 half-hours26 half-hours
227 half-hours being produced
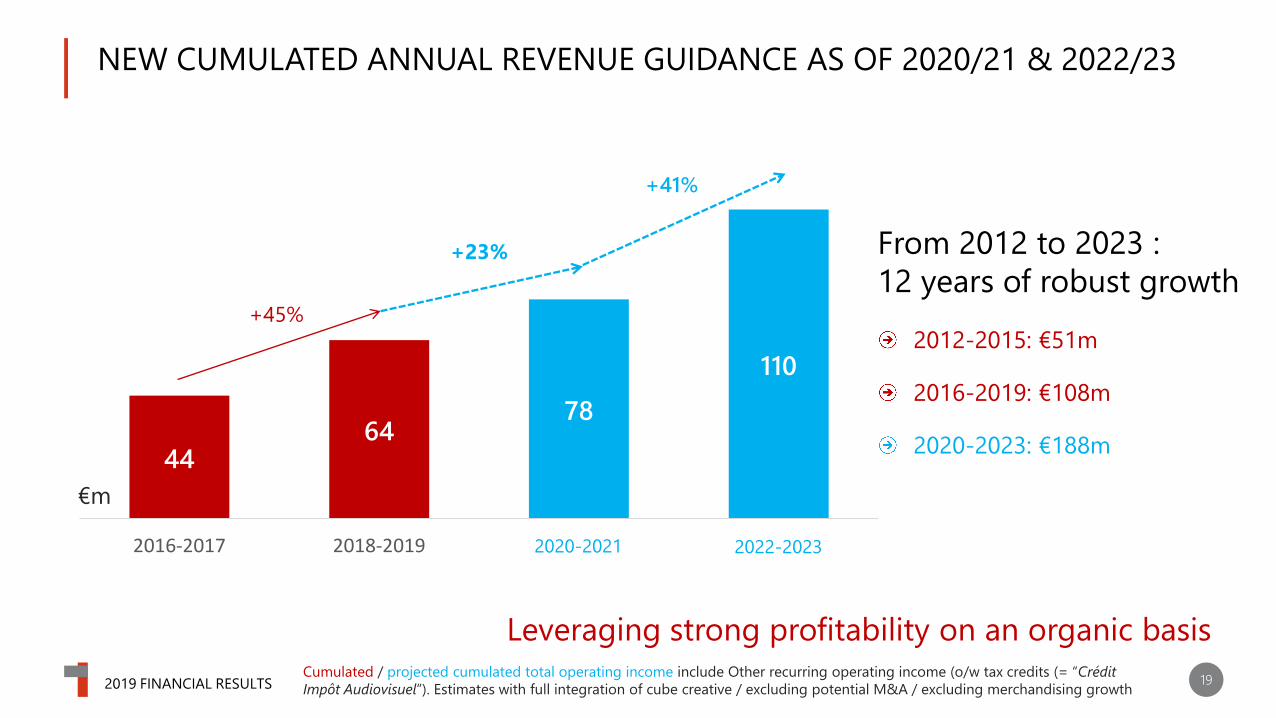
NEW CUMULATED ANNUAL REVENUE GUIDANCE AS OF 2020/21 & 2022/23
2019 FINANCIAL RESULTS 19
Leveraging strong profitability on an organic basisCumulated / projected cumulated total operating income include Other recurring operating income (o/w tax credits (= “Crédit
Impôt Audiovisuel”). Estimates with full integration of cube creative / excluding potential M&A / excluding merchandising growth
4464
78
110
2016-2017 2018-2019 2020-2021 2021-20222020-2021 2022-2023
+45%
€m
+23%
+41%
From 2012 to 2023 :
12 years of robust growth
2012-2015: €51m
2016-2019: €108m
2020-2023: €188m

SCALING FOR NEXT ERA OF PROFITABLE GROWTH
2019 FINANCIAL RESULTS 20
✓Promises delivered Strong visibility
2016-2019 2020-2023