Présentation PowerPoint · ♦ Currency impact of -7.0% (Q2 at -6.1%): appreciation of the Euro...
47
H1 results July 26, 2018 2018
Transcript of Présentation PowerPoint · ♦ Currency impact of -7.0% (Q2 at -6.1%): appreciation of the Euro...

H1 results
July 26, 2018
2018
H1 2018 results – July 26, 2018
DISCLAIMER
This presentation contains statements related to our future business and financial performance and future events or developments involving Bureau Veritas that may constitute forward-looking statements. These statements are based on current plans and forecasts of Bureau Veritas’ management and may be identified by words such as “expect”, “forecast”, “look forward to”, “anticipate”, “intend”, “plan”, “believe”, “seek”, “estimate”, “will”, “project” or words of similar meaning.
Such forward-looking statements are by their nature subject to a number of risks, uncertainties and factors, including without limitation those described in the Document de référence filed with the French Autorité des marchés financiers (“AMF”), that could cause actual results to differ from the plans, objectives and expectations expressed in such forward-looking statements.
These forward-looking statements speak only as of the date on which they are made, and Bureau Veritas undertakes no obligation, except to the extent required by law, to update or revise any of them, whether as a result of new information, future events or otherwise.
© Copyright Bureau Veritas
H1 2018 results agenda
► Highlights
► Financial Review
► Business Review
► Outlook
► Q&A
► Appendix

Highlights

H1 2018 results – July 26, 2018
H1 2018 highlights
5
► Group revenue at €2.34bn, up 6.1% y/y at constant exchange rates (Q2 at +7.4%)
♦ Organic revenue growth of +3.5% (Q2 at +4.4%) with 5 out of 6 businesses growing overall at 4.3% on average, and Growth Initiatives up 6.6% organically in H1 (+7.0% in Q2)
♦ External growth of +2.6% (Q2 at +3.0%) through 6 acquisitions YTD supporting Buildings & Infrastructure, Agri-Food and Opex Services Initiatives
♦ Currency impact of -7.0% (Q2 at -6.1%): appreciation of the Euro against the USD and pegged currencies as well as the depreciation of several emerging countries’ currencies
► Strong adjusted operating profit of €348.1 million in H1 2018, up 7.8% at cc
► High level of adjusted operating margin at 15.4% at cc (+20bps y/y)
► Adjusted net profit of €189.5 million (€0.44/share), up 12.9% at cc
► Improving Free Cash Flow at €62.9 million, up 182.4% at cc vs. H1 2017
► FY 2018 Outlook is confirmed

H1 2018 results – July 26, 2018
H1 2018 acquisitions, adding c.€85m of revenue1
6
Opex Oil & Gas, Power & Utilities, Chem.
January
€4m
Oil Conditioning Monitoring
Buildings & Infrastructure
February
c.€70m
Technical Assessment and Project
Management Assistance Services
(1) Annualized revenue ; including Permulab, signed on June 27, 2018 and closed on July 4, 2018
Agri-Food
March &
July1
Total of
€10m
Agri-Food testing
and analysis
Food &
Environment testing
Agri-Food
laboratory testing
and analysis
Food, Water and
Environment laboratory
testing services
1

H1 2018 results – July 26, 2018
Qatargas: Opex services wins largest ever contract
7
► Execution of a framework agreement, being the single source solution provider to the Client, to ensure the integrity of all production and operating facilities:
♦ plant inspection
♦ non-destructive testing
♦ asset integrity, and
♦ other specialized services
► Newly developed Integrated Solution approach which aims at being replicated in other countries
A few figures
largest ever contract in
the Middle East region
for Bureau Veritas
fixed duration
of 5 years and
2 years in option 5+2
years
€64 estimated
million
covered by Bureau
Veritas inspection &
NDT1 teams in Qatar 14
LNG trains
A major win highlighting the success
of Opex Services Growth Initiative
(1) NDT: Non-destructive testing
H1 2018 results – July 26, 2018
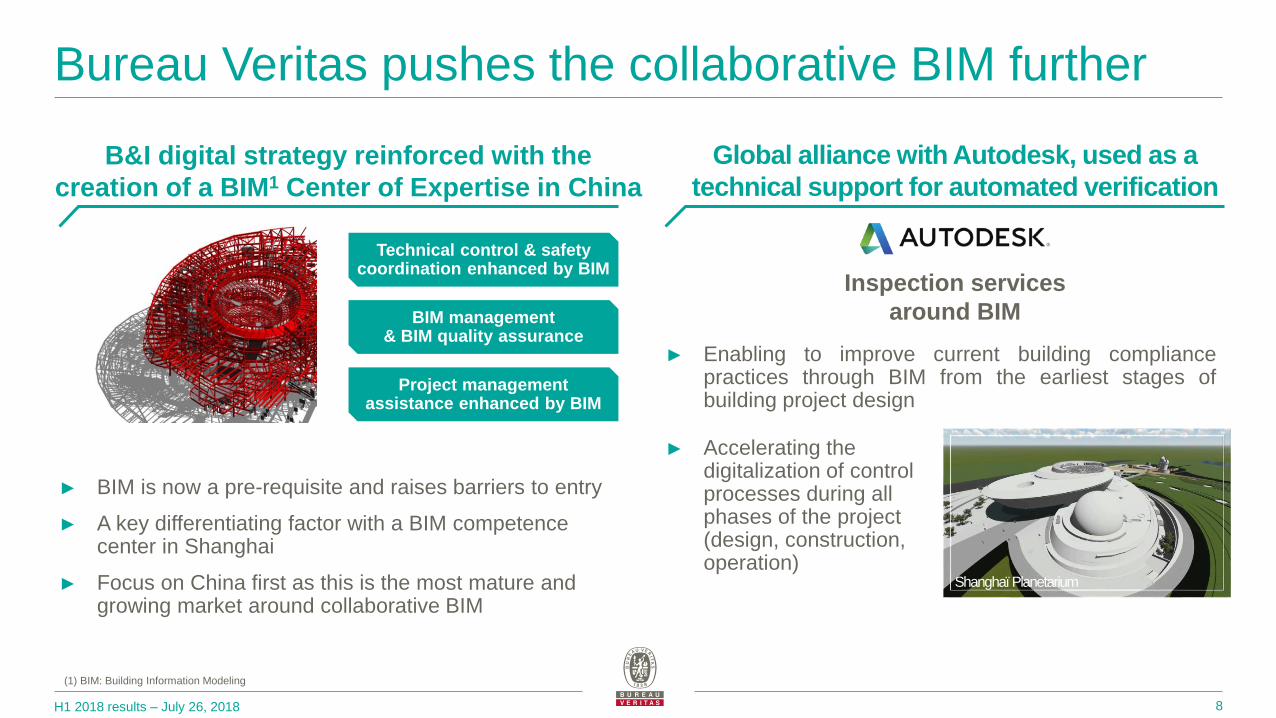
Bureau Veritas pushes the collaborative BIM further
8
► BIM is now a pre-requisite and raises barriers to entry
► A key differentiating factor with a BIM competence center in Shanghai
► Focus on China first as this is the most mature and growing market around collaborative BIM
Global alliance with Autodesk, used as a
technical support for automated verification
B&I digital strategy reinforced with the
creation of a BIM1 Center of Expertise in China
► Enabling to improve current building compliance practices through BIM from the earliest stages of building project design
BIM management & BIM quality assurance
Technical control & safety coordination enhanced by BIM
Inspection services
around BIM
Project management assistance enhanced by BIM
Shanghaï Planetarium
(1) BIM: Building Information Modeling
► Accelerating the digitalization of control processes during all phases of the project (design, construction, operation)

H1 2018 results – July 26, 2018
Business case: BIM comprehensive services over lifecycle
9
Shanghaï Planetarium The largest planetarium in the world
12% Change reduction1
14%
60%
70%
100% Key f
igu
res
Efficiency increase of decision-making1
List of problems in the construction
phase is put forward by the BIM team
Design changes discovered and
resolved by BIM technology
Participation of BIM team in solving
major technological problems
100% under BIM
► Technical and Management services of whole lifecycle based on BIM to provide comprehensive services to Owner
Examples of compliance tests in the model
UAV2 & progress comparison
(1) Compared to similar projects
(2) UAV: Unamed Aerial Vehicle
Evacuation simulation Net height analysis layout Complex area analysis Outdoor wind
environment simulation
Financial Review
H1 2018 results – July 26, 2018
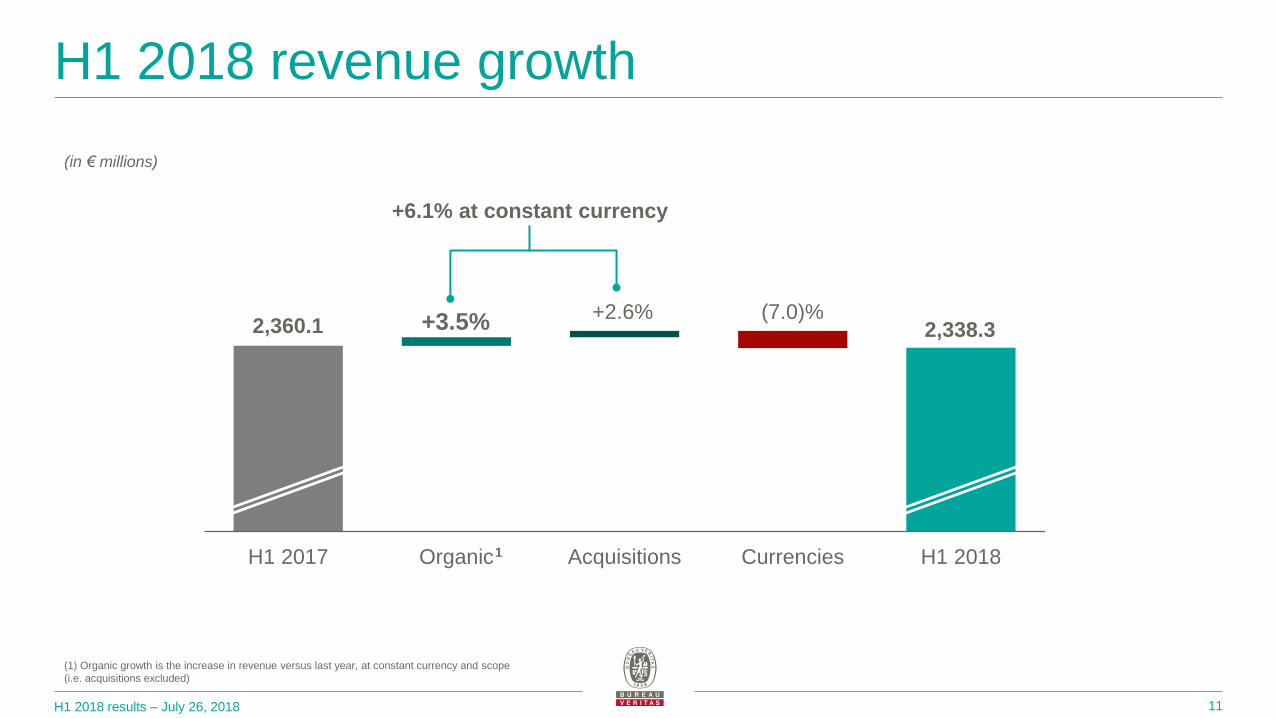
H1 2018 revenue growth
11
H1 2017 Organic Acquisitions Currencies H1 2018
(1) Organic growth is the increase in revenue versus last year, at constant currency and scope
(i.e. acquisitions excluded)
+3.5% +2.6% (7.0)% 2,338.3 2,360.1
(in € millions)
1
+6.1% at constant currency

H1 2018 results – July 26, 2018
Q2 2018 revenue growth
12
Q2 2017 Organic Acquisitions Currencies Q2 2018
(1) Organic growth is the increase in revenue versus last year, at constant currency and scope
(i.e. acquisitions excluded)
+4.4% +3.0% (6.1)% 1,238.0 1,222.1
(in € millions)
1
+7.4% at constant currency
H1 2018 results – July 26, 2018
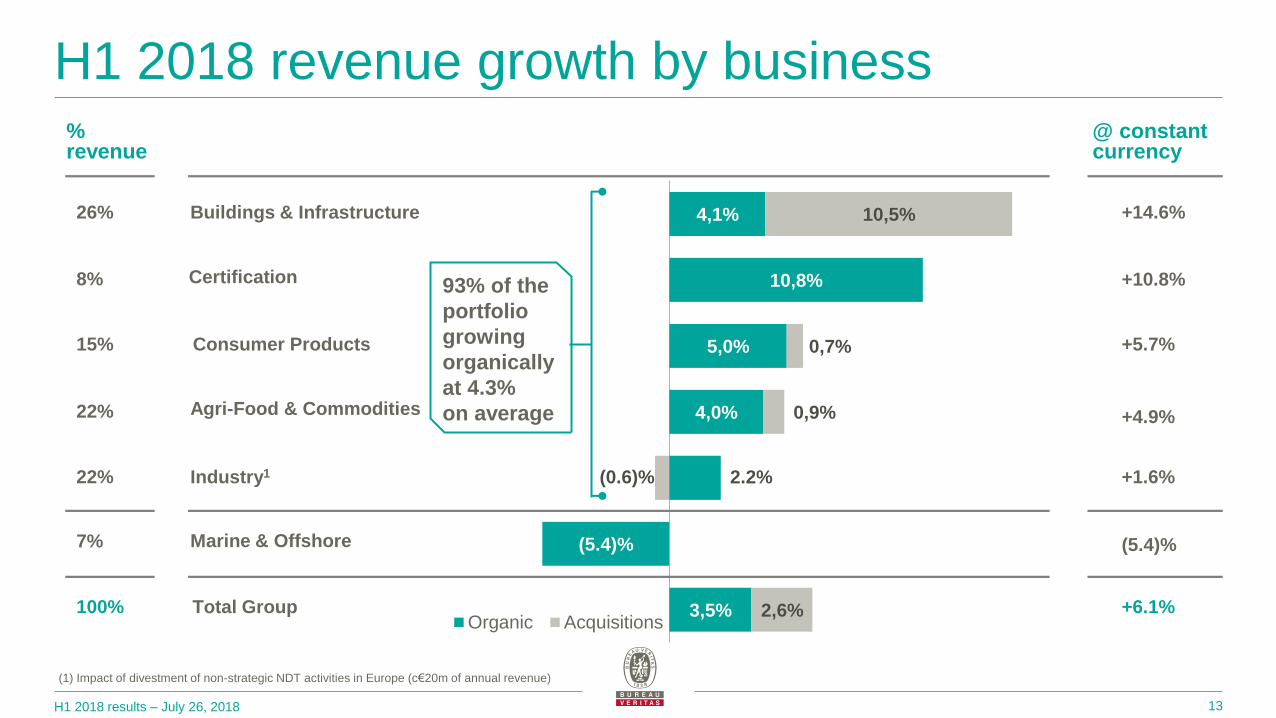
4,1%
10,8%
5,0%
4,0%
2.2%
(5.4)%
3,5%
10,5%
0,7%
0,9%
(0.6)%
2,6% Organic Acquisitions
+4.9%
+1.6%
+14.6%
+10.8%
+5.7%
(5.4)%
26%
% revenue
8%
15%
22%
22%
7%
@ constant currency
+6.1% 100%
Industry1
Certification
Buildings & Infrastructure
Total Group
Consumer Products
Agri-Food & Commodities
Marine & Offshore
H1 2018 revenue growth by business
13
(1) Impact of divestment of non-strategic NDT activities in Europe (c€20m of annual revenue)
93% of the
portfolio
growing
organically
at 4.3%
on average

H1 2018 results – July 26, 2018
Organic growth driven by both Base Business & Growth Initiatives
14
Organic revenue for the Base Business
Organic revenue for the Growth Initiatives
(3.7)%
(2.2)% (1.1)%
1.3% 0.9%
3.1%
-4%
-2%
0%
2%
4%
H1 16 H2 16 H1 17 H2 17 Q1 18 Q2 18
7.8%
3.3%
7.1% 6.8%
6.2%
7.0%
2%
3%
4%
5%
6%
7%
8%
9%
H1 16 H2 16 H1 17 H2 17 Q1 18 Q2 18
► Base Business improving organically at +2.0%
♦ Q2 acceleration to 3.1%
♦ Excluding M&O and O&G Capex, the Base Business grew 4.0% organically in H1 2018
► Growth Initiatives: delivering strong organic revenue growth at +6.6%
♦ Q2 acceleration to 7.0%
♦ High single-digit growth for B&I and Automotive
♦ Low to mid-single digit organic growth for Agri-Food and Opex services
♦ Double-digit for SmartWorld
Two-thirds
One-third
% of Group
revenue
H1 2018 performance Organic Growth
Organic Growth

H1 2018 results – July 26, 2018
0 400
SmartWorld
Automotive
Agri-Food
Opex services
Buildings & Infrastructure
5 Growth Initiatives maintained solid growth
15
+9.7%
+4.2%
+3.2%
+7.2%
+10.8%
H1 2018:
+15.5% growth overall
of which +6.6% organic vs. +6.9% organic in FY 2017
H1 2018 total revenue for all Growth
Initiatives (€m) and organic growth y/y
H1 2018 results – July 26, 2018
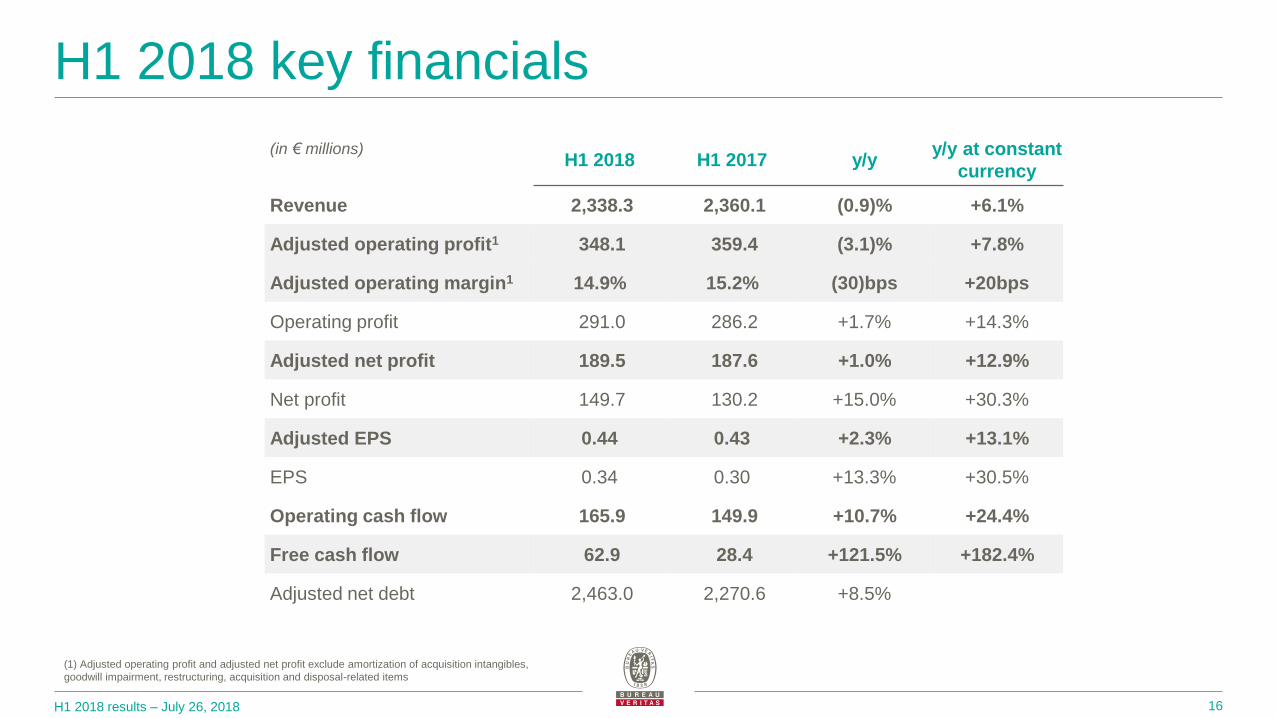
H1 2018 key financials
16
(in € millions)
H1 2018 H1 2017 y/y
y/y at constant
currency
Revenue 2,338.3 2,360.1 (0.9)% +6.1%
Adjusted operating profit1 348.1 359.4 (3.1)% +7.8%
Adjusted operating margin1 14.9% 15.2% (30)bps +20bps
Operating profit 291.0 286.2 +1.7% +14.3%
Adjusted net profit 189.5 187.6 +1.0% +12.9%
Net profit 149.7 130.2 +15.0% +30.3%
Adjusted EPS 0.44 0.43 +2.3% +13.1%
EPS 0.34 0.30 +13.3% +30.5%
Operating cash flow 165.9 149.9 +10.7% +24.4%
Free cash flow 62.9 28.4 +121.5% +182.4%
Adjusted net debt 2,463.0 2,270.6 +8.5%
(1) Adjusted operating profit and adjusted net profit exclude amortization of acquisition intangibles,
goodwill impairment, restructuring, acquisition and disposal-related items
H1 2018 results – July 26, 2018
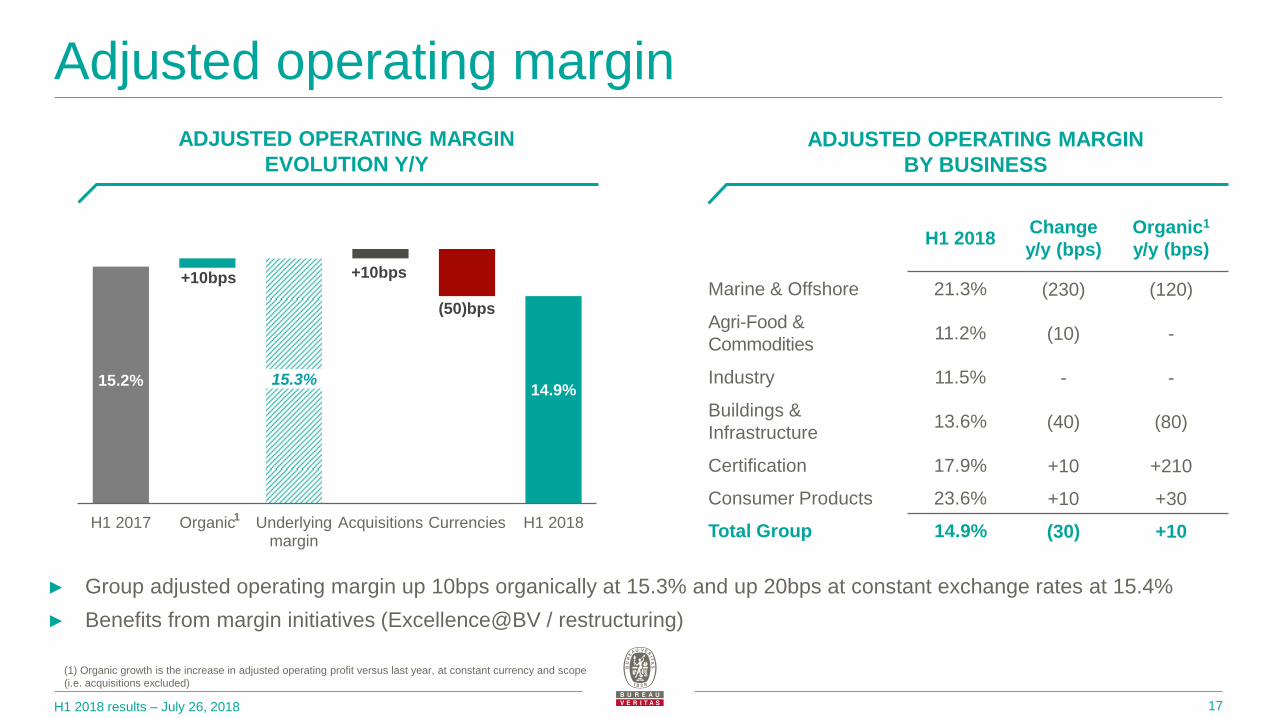
Adjusted operating margin
17
H1 2018 Change
y/y (bps)
Organic1
y/y (bps)
Marine & Offshore 21.3% (230) (120)
Agri-Food &
Commodities 11.2% (10) -
Industry 11.5% - -
Buildings &
Infrastructure 13.6% (40) (80)
Certification 17.9% +10 +210
Consumer Products 23.6% +10 +30
Total Group 14.9% (30) +10
15.2%
+10bps +10bps
(50)bps
14.9%
H1 2017 Organic Underlyingmargin
Acquisitions Currencies H1 20181
ADJUSTED OPERATING MARGIN
EVOLUTION Y/Y
ADJUSTED OPERATING MARGIN
BY BUSINESS
► Group adjusted operating margin up 10bps organically at 15.3% and up 20bps at constant exchange rates at 15.4%
► Benefits from margin initiatives (Excellence@BV / restructuring)
15.3%
(1) Organic growth is the increase in adjusted operating profit versus last year, at constant currency and scope
(i.e. acquisitions excluded)

H1 2018 results – July 26, 2018
From adjusted operating profit to operating profit
18
(in € millions)
H1 2018 H1 2017 y/y
Adjusted operating profit 348.1 359.4 (11.3)
Amortization of intangibles (35.8) (40.1) +4.3
Restructuring (19.5) (31.4) +11.9
Acquisitions and disposals (1.8) (1.7) (0.1)
Operating profit 291.0 286.2 +4.8
Actions taken mainly
in government services,
B&I and commodities
related-activities
H1 2018 results – July 26, 2018
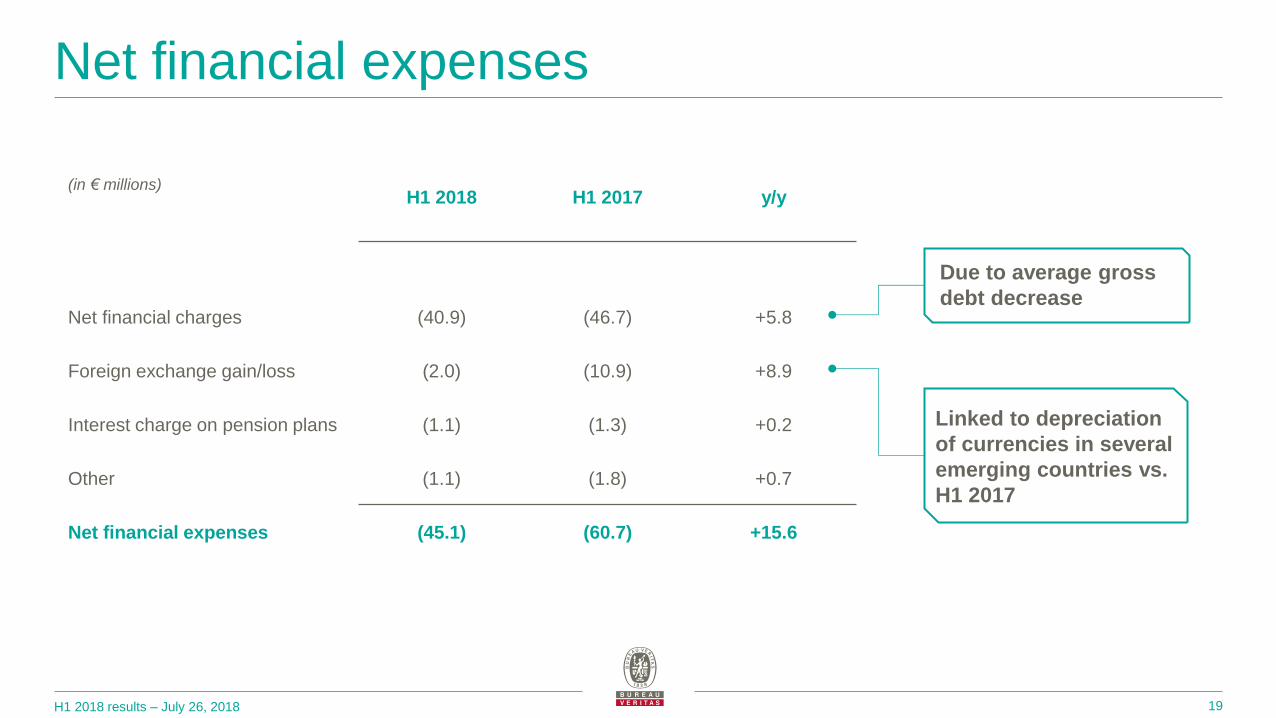
Net financial expenses
19
(in € millions)
H1 2018 H1 2017 y/y
Net financial charges (40.9) (46.7) +5.8
Foreign exchange gain/loss (2.0) (10.9) +8.9
Interest charge on pension plans (1.1) (1.3) +0.2
Other (1.1) (1.8) +0.7
Net financial expenses (45.1) (60.7) +15.6
Due to average gross
debt decrease
Linked to depreciation
of currencies in several
emerging countries vs.
H1 2017

H1 2018 results – July 26, 2018
(in € millions)
H1 2018 H1 2017 y/y
Profit before Tax 246.5 226.0 +20.5
Tax (84.4) (80.0) (4.4)
ETR1 34.2% 35.4% (120)bps
Adjusted ETR2 32.8% 33.9% (110)bps
Tax / Tax rate
20
(1) Effective tax rate (ETR) = Income tax expense / Profit before income tax (PBT)
(2) Adjusted ETR = Income tax expense adjusted for tax effect on non recurring items / PBT adjusted
for non-recurring items
Primarily resulting from
the absence of the 3%
dividend contribution in
France after this was
cancelled

H1 2018 results – July 26, 2018
Resulting from the
absence of the 3%
dividend contribution
in France vs. last year
and one-off payments
in 2017
Cash flow statement
21
(in € millions)
H1 2018 H1 2017 y/y
Profit before income tax 246.6 226.0 +20.6
Elimination of financing and investing activities 44.0 78.5 (34.5)
Provisions and other non-cash items 3.9 (16.8) +20.7
Depreciation, amortization and impairment 98.1 107.9 (9.8)
Income tax paid (77.9) (100.9) +23.0
Movements in working capital (148.8) (144.8) (4.0)
Net cash generated from operating activities 165.9 149.9 +16.0
Net capex (59.0) (58.2) (0.8)
% of revenue 2.5% 2.5% -
Interest paid (44.0) (63.3) (19.3)
Free Cash Flow 62.9 28.4 +34.5
► FCF progressed by 182% on a constant currency basis in H1 2018, from a low base
Notably explained by
the average gross debt
decrease
H1 2018 results – July 26, 2018
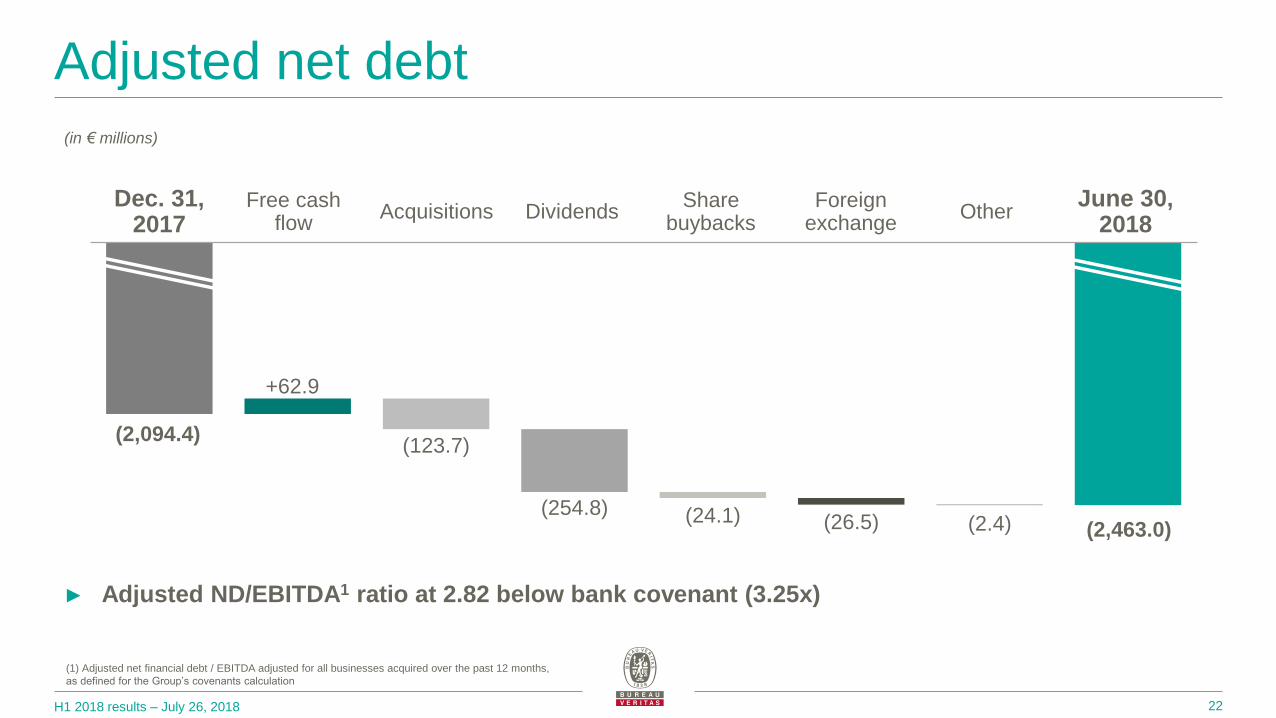
Adjusted net debt
► Adjusted ND/EBITDA1 ratio at 2.82 below bank covenant (3.25x)
(1) Adjusted net financial debt / EBITDA adjusted for all businesses acquired over the past 12 months,
as defined for the Group’s covenants calculation
(2,094.4)
+62.9
(123.7)
(254.8) (24.1) (26.5) (2.4) (2,463.0)
22
(in € millions)
June 30, 2018
Free cash flow
Acquisitions Dividends Share
buybacks Foreign
exchange Other
Dec. 31, 2017

Business Review

KEY FINANCIALS H1 2018 HIGHLIGHTS
2018 OUTLOOK
2020 AMBITION / KEY FIGURES
H1 2018 results – July 26, 2018
Marine & Offshore (7% of revenue, 10% of profit)
► New construction: high single-digit decline (low single-digit in Q2), improvement of new orders not yet impacting revenue
► Core In-Service: slight decline (classed fleet slightly up, price pressure)
► Services: mid-single digit decline due to depressed Offshore markets
► New orders up to 3.5m (GRTm) from 2.9m last year; backlog at 13.4m at the end of June, slightly up versus Dec. 2017
► Margin hit by volume decline and FX
► Slightly negative organic revenue growth
♦ New construction: H2 stable to positive
♦ In-service to remain resilient
♦ Services (incl. Offshore): offering extension / gradually recovering
► Focus on margin protection (restructuring)
38%
45%
17% New Construction
Core In-Service
Services (incl. Offshore)
24
2.9 3,5
13,6 13,4
116,5 119,1
50
60
70
80
90
100
110
120
0
5
10
15
20
25
30
June 2017 June 2018
New orders Order book In-Service fleet
(in € millions) H1 2018 H1 2017 Var.
Revenue
Organic 170.4 190.8
(10.7)%
(5.4)%
Acquisitions +0.0%
Currencies (5.3)%
AOP 36.3 45.0 (19.3)%
AOP margin 21.3 % 23.6% (230)bps
Million gross tons (GRTm)
► Commercial wins:
♦ LNG carriers (Korea)
♦ Bulk carriers (China and Japan)
♦ Containerships (China)
♦ Passenger ships (Norway)
♦ FPSO (China)
H1 2018 results – July 26, 2018
1
2
3
►
►
►
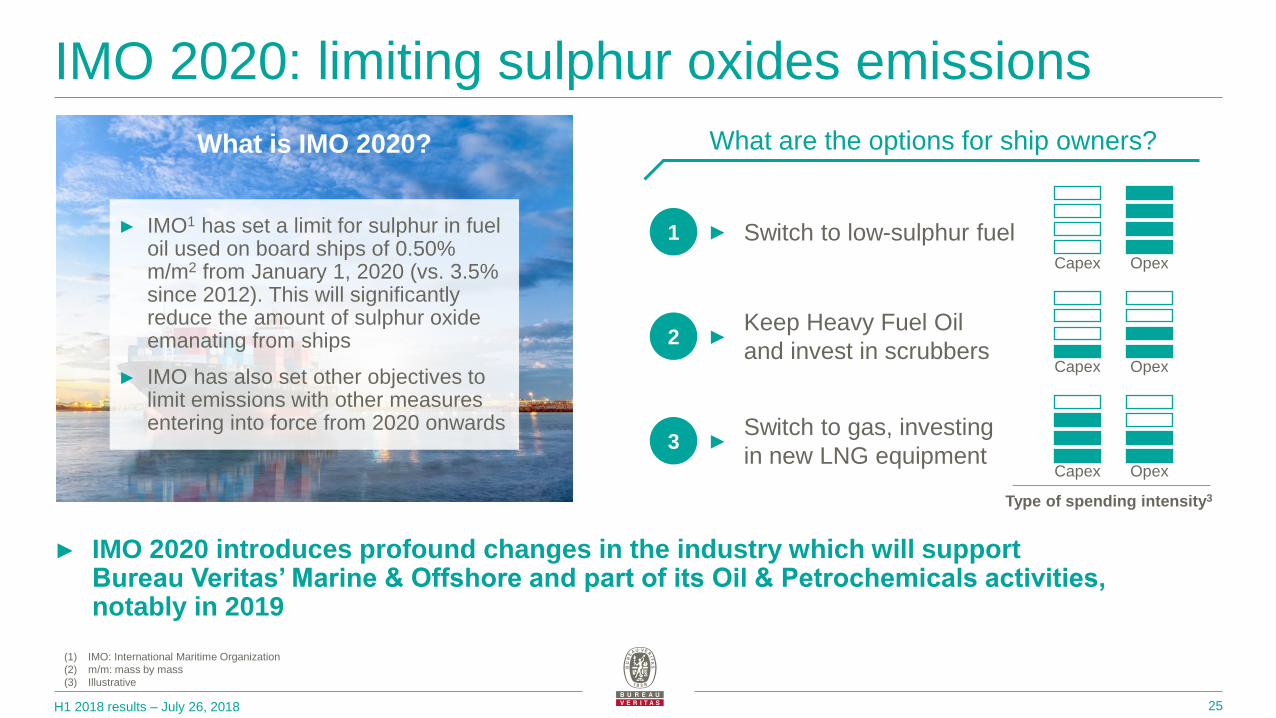
IMO 2020: limiting sulphur oxides emissions
25
► IMO1 has set a limit for sulphur in fuel oil used on board ships of 0.50% m/m2 from January 1, 2020 (vs. 3.5% since 2012). This will significantly reduce the amount of sulphur oxide emanating from ships
► IMO has also set other objectives to limit emissions with other measures entering into force from 2020 onwards
(1) IMO: International Maritime Organization
(2) m/m: mass by mass
(3) Illustrative
What is IMO 2020? What are the options for ship owners?
Keep Heavy Fuel Oil
and invest in scrubbers
Switch to low-sulphur fuel
Switch to gas, investing
in new LNG equipment
Capex Opex
Capex Opex
Capex Opex
Type of spending intensity3
► IMO 2020 introduces profound changes in the industry which will support Bureau Veritas’ Marine & Offshore and part of its Oil & Petrochemicals activities, notably in 2019
KEY FINANCIALS H1 2018 HIGHLIGHTS
2018 OUTLOOK
2020 AMBITION / KEY FIGURES
H1 2018 results – July 26, 2018
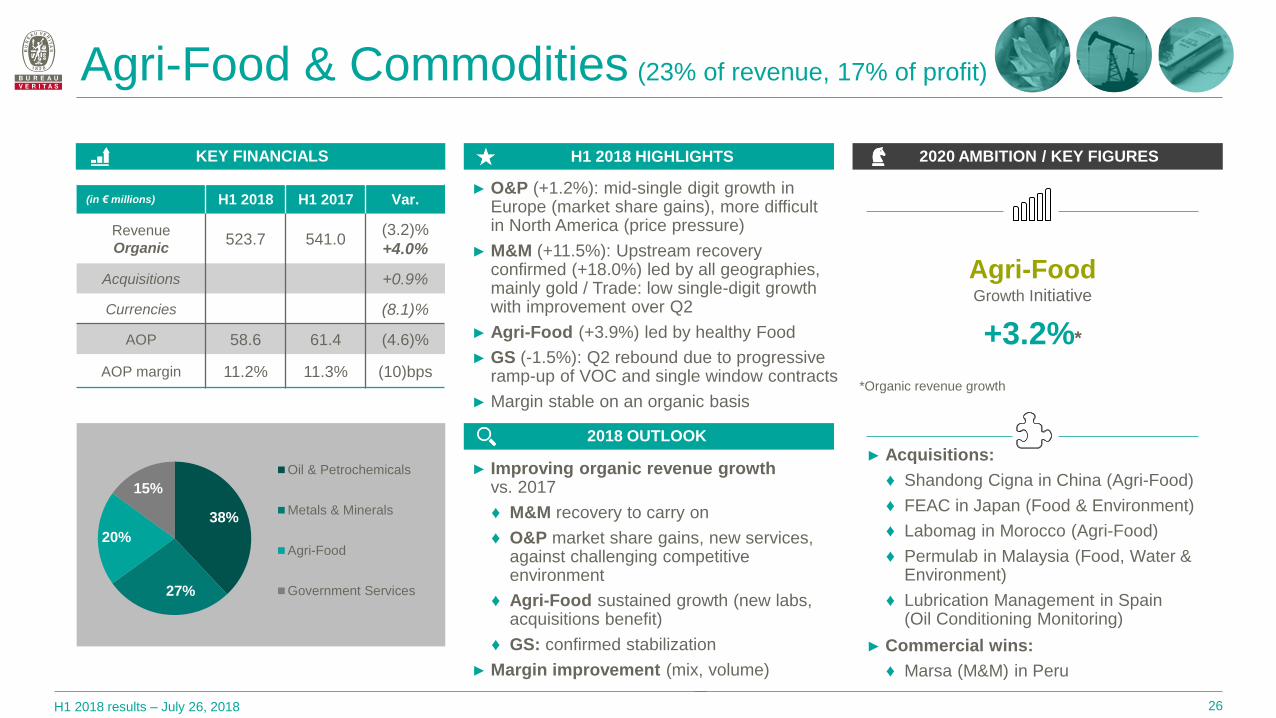
Agri-Food & Commodities (23% of revenue, 17% of profit)
► Acquisitions:
♦ Shandong Cigna in China (Agri-Food)
♦ FEAC in Japan (Food & Environment)
♦ Labomag in Morocco (Agri-Food)
♦ Permulab in Malaysia (Food, Water & Environment)
♦ Lubrication Management in Spain (Oil Conditioning Monitoring)
► Commercial wins:
♦ Marsa (M&M) in Peru
► O&P (+1.2%): mid-single digit growth in Europe (market share gains), more difficult in North America (price pressure)
► M&M (+11.5%): Upstream recovery confirmed (+18.0%) led by all geographies, mainly gold / Trade: low single-digit growth with improvement over Q2
► Agri-Food (+3.9%) led by healthy Food
► GS (-1.5%): Q2 rebound due to progressive ramp-up of VOC and single window contracts
► Margin stable on an organic basis
► Improving organic revenue growth vs. 2017
♦ M&M recovery to carry on
♦ O&P market share gains, new services, against challenging competitive environment
♦ Agri-Food sustained growth (new labs, acquisitions benefit)
♦ GS: confirmed stabilization
► Margin improvement (mix, volume)
26
38%
27%
20%
15%
Oil & Petrochemicals
Metals & Minerals
Agri-Food
Government Services
Agri-Food
Growth Initiative
+3.2%*
*Organic revenue growth
(in € millions) H1 2018 H1 2017 Var.
Revenue
Organic 523.7 541.0
(3.2)%
+4.0%
Acquisitions +0.9%
Currencies (8.1)%
AOP 58.6 61.4 (4.6)%
AOP margin 11.2% 11.3% (10)bps
KEY FINANCIALS H1 2018 HIGHLIGHTS
2018 OUTLOOK
2020 AMBITION / KEY FIGURES
H1 2018 results – July 26, 2018
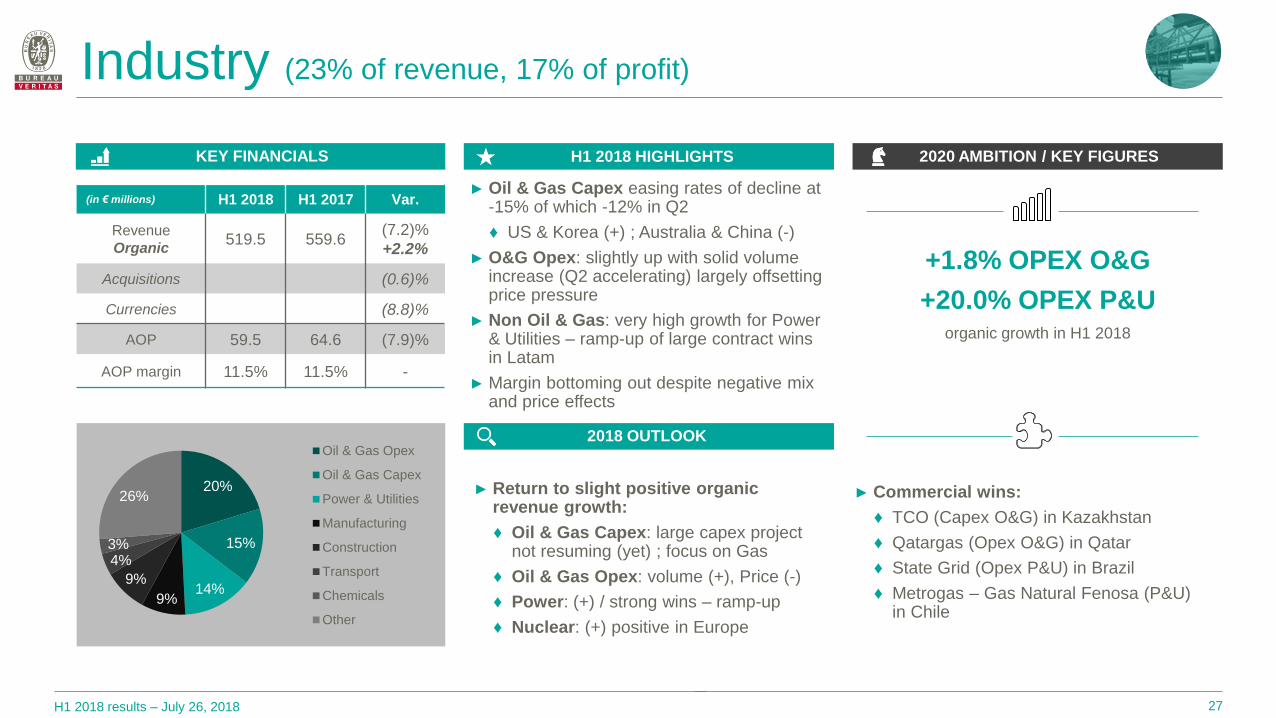
Industry (23% of revenue, 17% of profit)
20%
15%
14% 9%
9%
4% 3%
26%
Oil & Gas Opex
Oil & Gas Capex
Power & Utilities
Manufacturing
Construction
Transport
Chemicals
Other
► Oil & Gas Capex easing rates of decline at -15% of which -12% in Q2
♦ US & Korea (+) ; Australia & China (-)
► O&G Opex: slightly up with solid volume increase (Q2 accelerating) largely offsetting price pressure
► Non Oil & Gas: very high growth for Power & Utilities – ramp-up of large contract wins in Latam
► Margin bottoming out despite negative mix and price effects
► Return to slight positive organic revenue growth:
♦ Oil & Gas Capex: large capex project not resuming (yet) ; focus on Gas
♦ Oil & Gas Opex: volume (+), Price (-)
♦ Power: (+) / strong wins – ramp-up
♦ Nuclear: (+) positive in Europe
+1.8% OPEX O&G
+20.0% OPEX P&U organic growth in H1 2018
27
► Commercial wins:
♦ TCO (Capex O&G) in Kazakhstan
♦ Qatargas (Opex O&G) in Qatar
♦ State Grid (Opex P&U) in Brazil
♦ Metrogas – Gas Natural Fenosa (P&U) in Chile
(in € millions) H1 2018 H1 2017 Var.
Revenue
Organic 519.5 559.6
(7.2)%
+2.2%
Acquisitions (0.6)%
Currencies (8.8)%
AOP 59.5 64.6 (7.9)%
AOP margin 11.5% 11.5% -
KEY FINANCIALS H1 2018 HIGHLIGHTS
2018 OUTLOOK
2020 AMBITION / KEY FIGURES
H1 2018 results – July 26, 2018
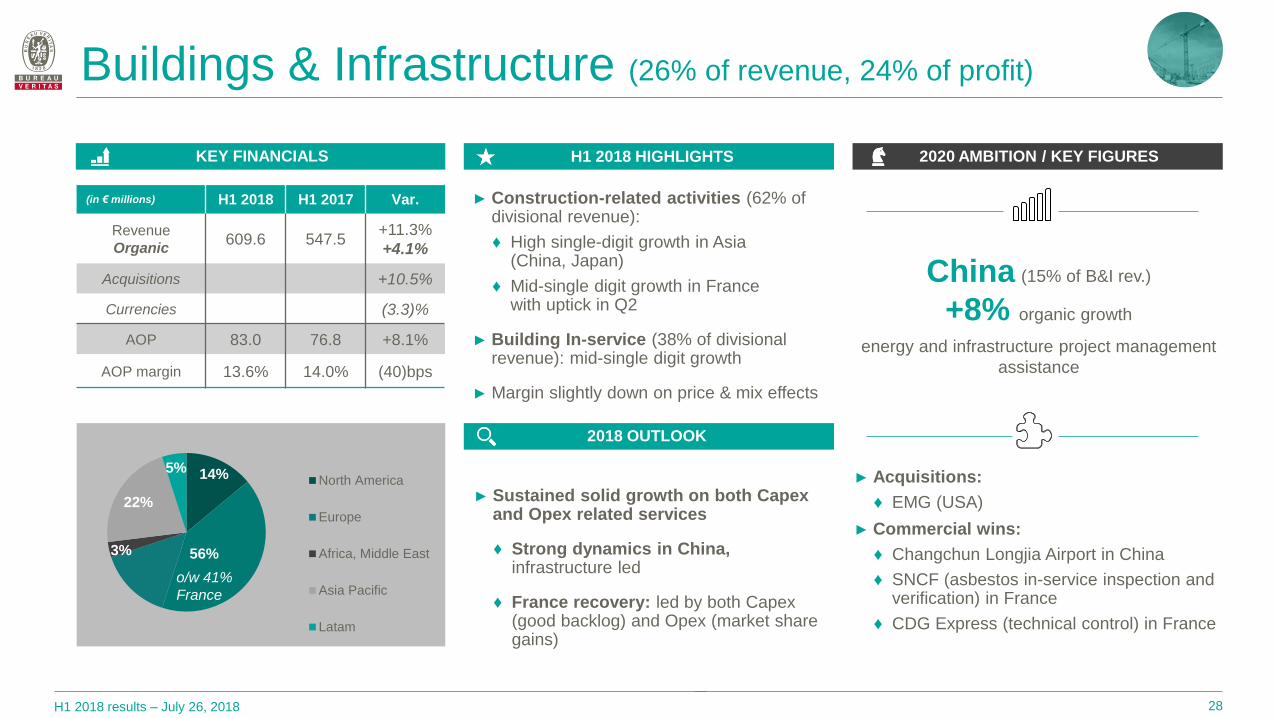
Buildings & Infrastructure (26% of revenue, 24% of profit)
► Construction-related activities (62% of divisional revenue):
♦ High single-digit growth in Asia (China, Japan)
♦ Mid-single digit growth in France with uptick in Q2
► Building In-service (38% of divisional revenue): mid-single digit growth
► Margin slightly down on price & mix effects
► Sustained solid growth on both Capex and Opex related services
♦ Strong dynamics in China, infrastructure led
♦ France recovery: led by both Capex (good backlog) and Opex (market share gains)
o/w 37%
France
28
► Acquisitions:
♦ EMG (USA)
► Commercial wins:
♦ Changchun Longjia Airport in China
♦ SNCF (asbestos in-service inspection and verification) in France
♦ CDG Express (technical control) in France
o/w 43%
France
14%
56% 3%
22%
5% North America
Europe
Africa, Middle East
Asia Pacific
Latam
o/w 41%
France
China (15% of B&I rev.)
+8% organic growth
energy and infrastructure project management
assistance
(in € millions) H1 2018 H1 2017 Var.
Revenue
Organic 609.6 547.5
+11.3%
+4.1%
Acquisitions +10.5%
Currencies (3.3)%
AOP 83.0 76.8 +8.1%
AOP margin 13.6% 14.0% (40)bps
KEY FINANCIALS H1 2018 HIGHLIGHTS
2018 OUTLOOK
2020 AMBITION / KEY FIGURES
H1 2018 results – July 26, 2018
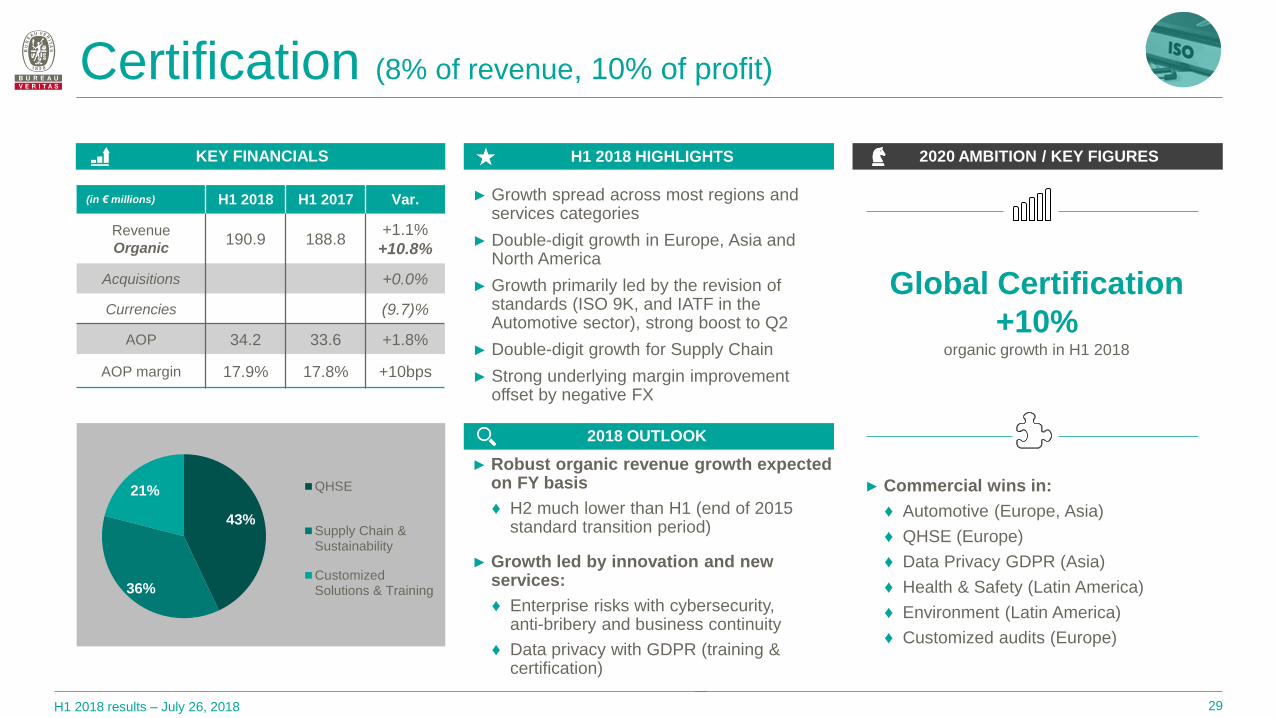
Global Certification
+10% organic growth in H1 2018
► Growth spread across most regions and services categories
► Double-digit growth in Europe, Asia and North America
► Growth primarily led by the revision of standards (ISO 9K, and IATF in the Automotive sector), strong boost to Q2
► Double-digit growth for Supply Chain
► Strong underlying margin improvement offset by negative FX
► Robust organic revenue growth expected on FY basis
♦ H2 much lower than H1 (end of 2015 standard transition period)
► Growth led by innovation and new services:
♦ Enterprise risks with cybersecurity, anti-bribery and business continuity
♦ Data privacy with GDPR (training & certification)
29
► Commercial wins in:
♦ Automotive (Europe, Asia)
♦ QHSE (Europe)
♦ Data Privacy GDPR (Asia)
♦ Health & Safety (Latin America)
♦ Environment (Latin America)
♦ Customized audits (Europe)
43%
36%
21% QHSE
Supply Chain &Sustainability
CustomizedSolutions & Training
Certification (8% of revenue, 10% of profit)
(in € millions) H1 2018 H1 2017 Var.
Revenue
Organic 190.9 188.8
+1.1%
+10.8%
Acquisitions +0.0%
Currencies (9.7)%
AOP 34.2 33.6 +1.8%
AOP margin 17.9% 17.8% +10bps
KEY FINANCIALS H1 2018 HIGHLIGHTS
2018 OUTLOOK
2020 AMBITION / KEY FIGURES
H1 2018 results – July 26, 2018
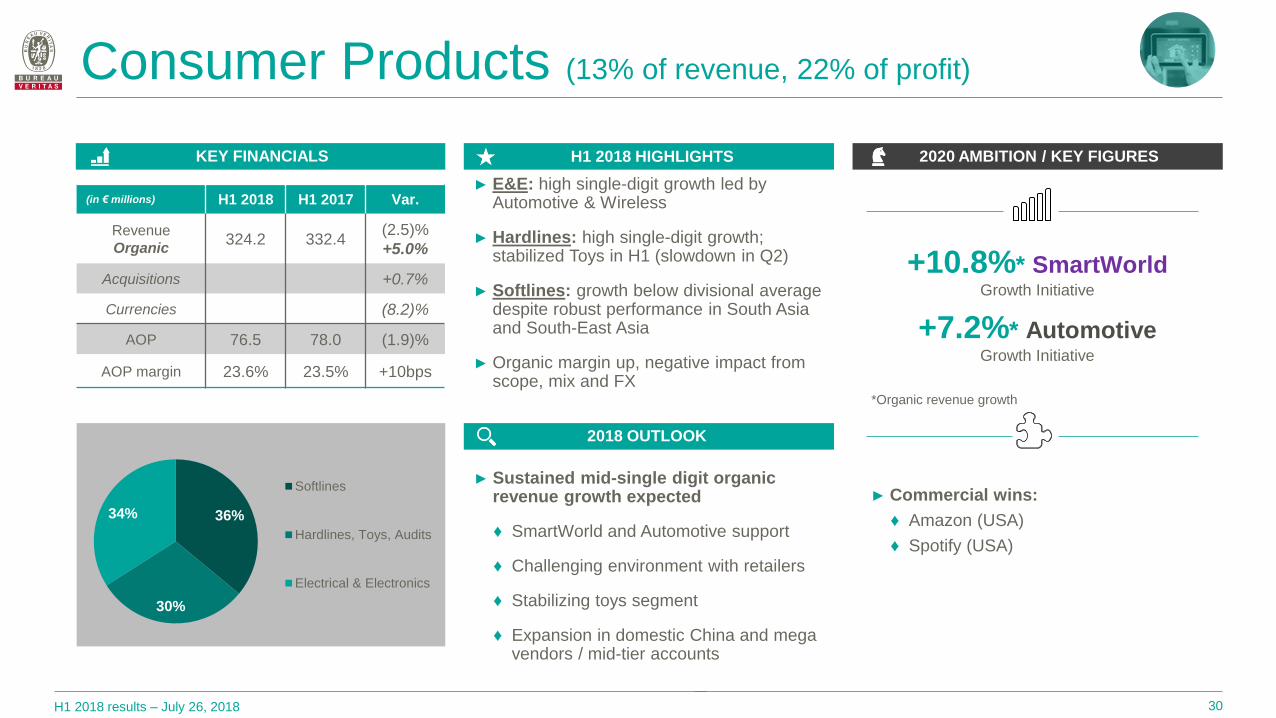
Consumer Products (13% of revenue, 22% of profit)
► E&E: high single-digit growth led by Automotive & Wireless
► Hardlines: high single-digit growth; stabilized Toys in H1 (slowdown in Q2)
► Softlines: growth below divisional average despite robust performance in South Asia and South-East Asia
► Organic margin up, negative impact from scope, mix and FX
► Sustained mid-single digit organic revenue growth expected
♦ SmartWorld and Automotive support
♦ Challenging environment with retailers
♦ Stabilizing toys segment
♦ Expansion in domestic China and mega vendors / mid-tier accounts
36%
30%
34%
Softlines
Hardlines, Toys, Audits
Electrical & Electronics
30
► Commercial wins:
♦ Amazon (USA)
♦ Spotify (USA)
+10.8%* SmartWorld Growth Initiative
+7.2%* Automotive Growth Initiative
*Organic revenue growth
(in € millions) H1 2018 H1 2017 Var.
Revenue
Organic 324.2 332.4
(2.5)%
+5.0%
Acquisitions +0.7%
Currencies (8.2)%
AOP 76.5 78.0 (1.9)%
AOP margin 23.6% 23.5% +10bps

Outlook
H1 2018 results – July 26, 2018
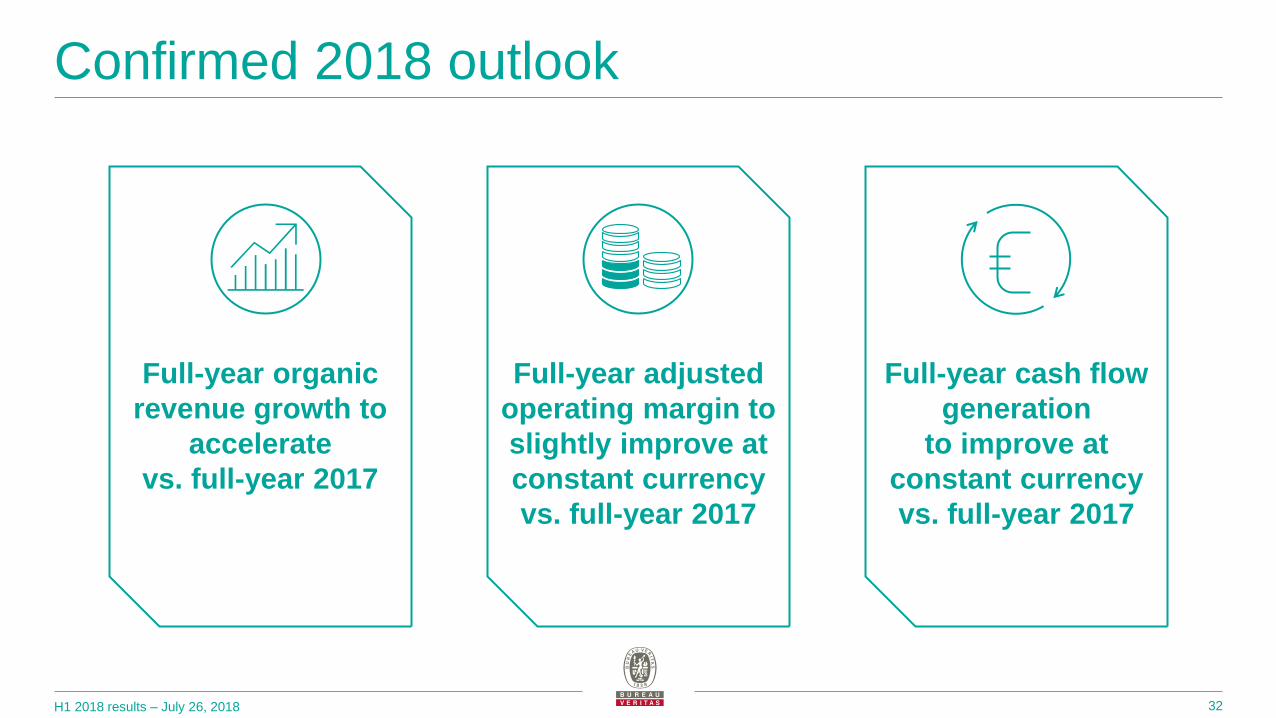
Confirmed 2018 outlook
32
Full-year adjusted
operating margin to
slightly improve at
constant currency
vs. full-year 2017
Full-year organic
revenue growth to
accelerate
vs. full-year 2017
Full-year cash flow
generation
to improve at
constant currency
vs. full-year 2017

H1 2018 results – July 26, 2018
Conclusion
33
1. FY 2018 guidance confirmed
2. Well underway with the Group transformation
3. 2020 ambition on track

Q&A

H1 2018 results – July 26, 2018
2018 Financial Calendar and Contacts
35
Investor Relations Information Bureau Veritas Head Office – 40/52 Boulevard du Parc
92200 Neuilly-sur-Seine, France
Laurent Brunelle
Head of Investor Relations
+33 (0)1 55 24 76 09 [email protected]
► Field Trip Canada @ Maxxam – September 20, 2018 – CLICK HERE TO REGISTER
► Q3 2018 Revenue – October 25, 2018
Florent Chaix
Investor Relations Manager
+33 (0)1 55 24 77 80 [email protected]

H1 2018 results – July 26, 2018
Discover our new website: https://group.bureauveritas.com
36

Appendix
H1 2018 results – July 26, 2018
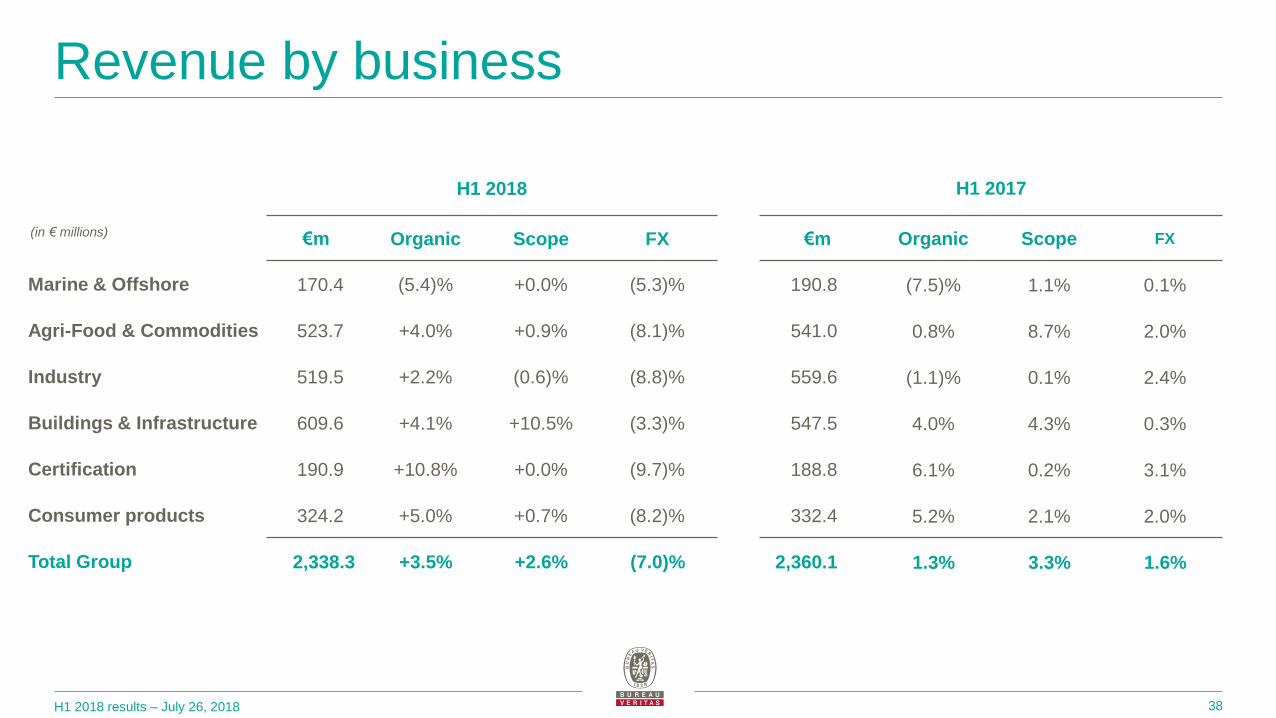
Revenue by business
38
H1 2018
€m Organic Scope FX
Marine & Offshore 170.4 (5.4)% +0.0% (5.3)%
Agri-Food & Commodities 523.7 +4.0% +0.9% (8.1)%
Industry 519.5 +2.2% (0.6)% (8.8)%
Buildings & Infrastructure 609.6 +4.1% +10.5% (3.3)%
Certification 190.9 +10.8% +0.0% (9.7)%
Consumer products 324.2 +5.0% +0.7% (8.2)%
Total Group 2,338.3 +3.5% +2.6% (7.0)%
H1 2017
€m Organic Scope FX
190.8 (7.5)% 1.1% 0.1%
541.0 0.8% 8.7% 2.0%
559.6 (1.1)% 0.1% 2.4%
547.5 4.0% 4.3% 0.3%
188.8 6.1% 0.2% 3.1%
332.4 5.2% 2.1% 2.0%
2,360.1 1.3% 3.3% 1.6%
(in € millions)

H1 2018 results – July 26, 2018
Revenue by business
39
Q2 2018
€m Organic Scope FX
Marine & Offshore 86.8 (2.2)% +0.0% (5.2)%
Agri-Food & Commodities 273.6 +4.8% +0.7% (6.9)%
Industry 269.3 +2.8% +0.1% (7.5)%
Buildings & Infrastructure 317.8 +4.1% +12.1% (2.5)%
Certification 106.0 +14.2% +0.0% (10.1)%
Consumer products 184.5 +4.3% +0.6% (6.4)%
Total Group 1,238.0 +4.4% +3.0% (6.1)%
Q2 2017
€m Organic Scope FX
93.7 (13.1)% +0.6% +0.9%
277.4 +1.0% +9.6% +0.8%
282.4 (0.4)% (1.2)% +1.2%
279.4 +3.5% +4.9% (0.2)%
101.8 +2.3% +0.2% +6.0%
187.4 +6.1% +1.6% +1.6%
1,222.1 +0.8% +3.1% +1.2%
(in € millions)

H1 2018 results – July 26, 2018
Adjusted operating profit by business
40
Adjusted operating profit (€m)
H1 2018 H1 2017 Var. (%)
Marine & Offshore 36.3 45.0 (19.3)%
Agri-Food & Commodities 58.6 61.4 (4.6)%
Industry 59.5 64.6 (7.9)%
Buildings & Infrastructure 83.0 76.8 +8.1%
Certification 34.2 33.6 +1.8%
Consumer products 76.5 78.0 (1.9)%
Total Group 348.1 359.4 (3.1)%
Adjusted operating margin (%)
H1 2018 H1 2017 Var. (bp)
21.3% 23.6% (230)
11.2% 11.3% (10)
11.5% 11.5% -
13.6% 14.0% (40)
17.9% 17.8% +10
23.6% 23.5% +10
14.9% 15.2% (30)
(in € millions)
H1 2018 results – July 26, 2018
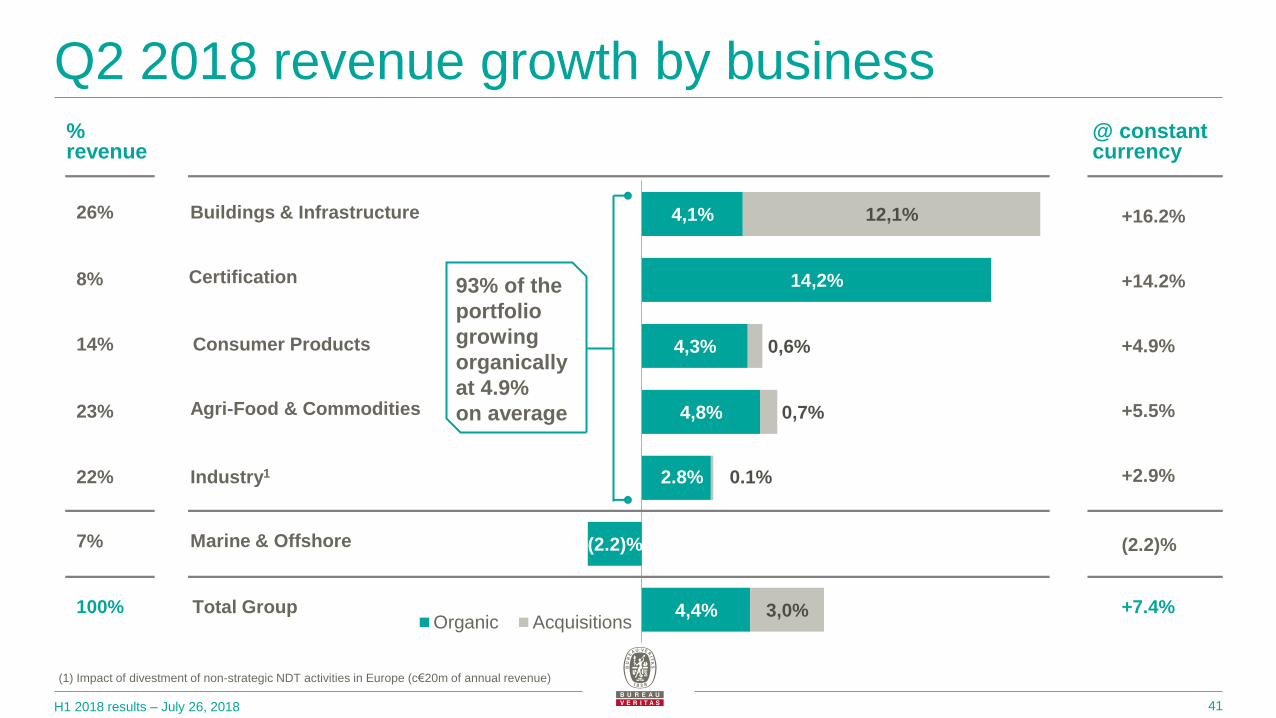
4,1%
14,2%
4,3%
4,8%
0.1%
(2.2)%
4,4%
12,1%
0,6%
0,7%
2.8%
3,0% Organic Acquisitions
+5.5%
+2.9%
+16.2%
+14.2%
+4.9%
(2.2)%
26%
% revenue
8%
14%
23%
22%
7%
@ constant currency
+7.4% 100%
Industry1
Certification
Buildings & Infrastructure
Total Group
Consumer Products
Agri-Food & Commodities
Marine & Offshore
Q2 2018 revenue growth by business
41
(1) Impact of divestment of non-strategic NDT activities in Europe (c€20m of annual revenue)
93% of the
portfolio
growing
organically
at 4.9%
on average
H1 2018 results – July 26, 2018
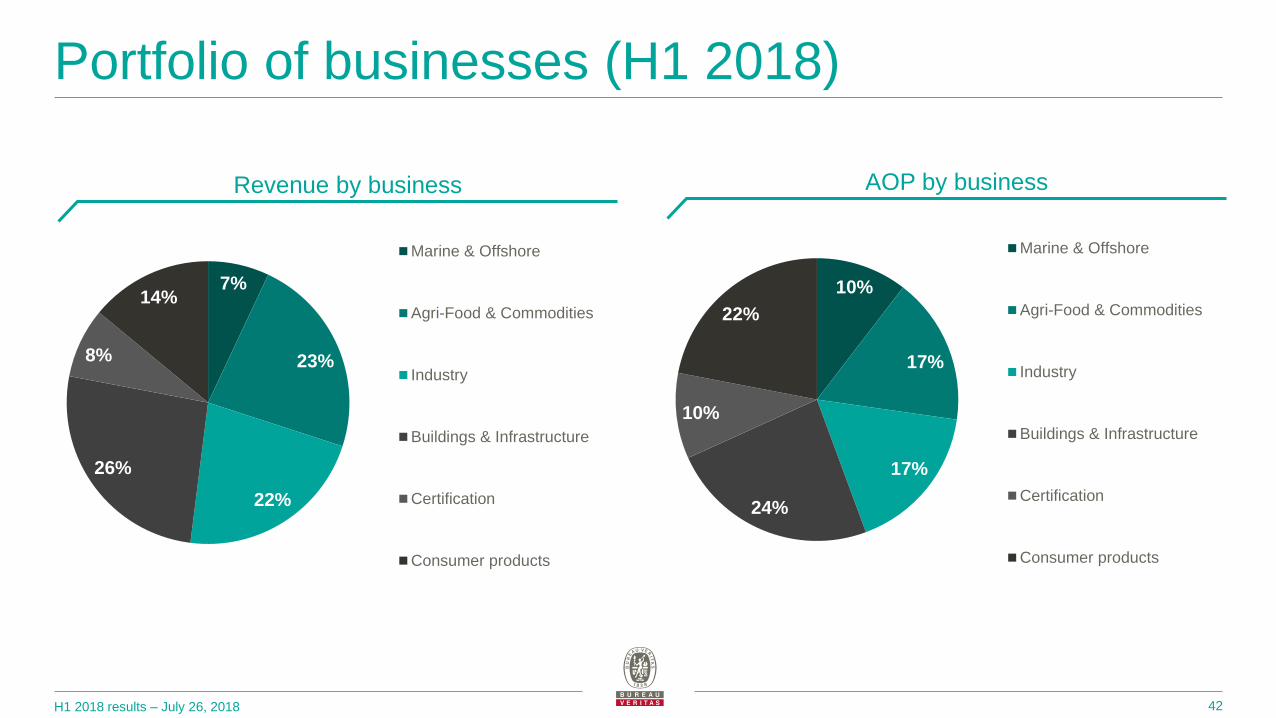
Portfolio of businesses (H1 2018)
42
7%
23%
22%
26%
8%
14%
Marine & Offshore
Agri-Food & Commodities
Industry
Buildings & Infrastructure
Certification
Consumer products
Revenue by business
10%
17%
17%
24%
10%
22%
Marine & Offshore
Agri-Food & Commodities
Industry
Buildings & Infrastructure
Certification
Consumer products
AOP by business

H1 2018 results – July 26, 2018 43
► Bureau Veritas is largely exposed to USD and emerging market currencies, weighting on both revenue and margin
H1 2018 revenue currency exposure
EUR 28,8%
USD (and pegged) 19,0% CNY 11,1%
CAD 3,6%
AUD 3,7%
BRL 3,4%
GBP 4,0%
CLP 2,7%
JPY 2,0%
SGD 1,5% TWD 1,5%
INR 1,6% ARS 1,1% KRW 1,4%
COP 1,2% PEN 0,9%
TRY 0,8%
OTHER 11,7%
Currency change y/y
(8.1)%
(5.1)%
(34.8)%
(10.5)%
(7.0)%
(5.3)%
(7.5)%
(10.5)%
(3.4)%
(2.2)%
(16.9)%
(8.4)%
(11.2)%
(6.5)%
(3.4)%
(10.5)%
COP
KRW
ARS
INR
TWD
SGD
JPY
AED
CLP
GBP
BRL
AUD
HKD
CAD
CNY
USD (and pegged)
Forex: sharp negative impact in H1 2018

H1 2018 results – July 26, 2018
H1 2018 restructuring: €19.5m
44
27%
28% 11%
9%
4%
21%
Agri-Food & Commodities
Buildings & Infrastructure
Consumer products
Marine & Offshore
Industry
Other (incl. HO)
64% 10%
13%
13% Europe
Africa / Middle East
Asia Pacific
Americas
By Business Activity By Geography
H1 2018 results – July 26, 2018
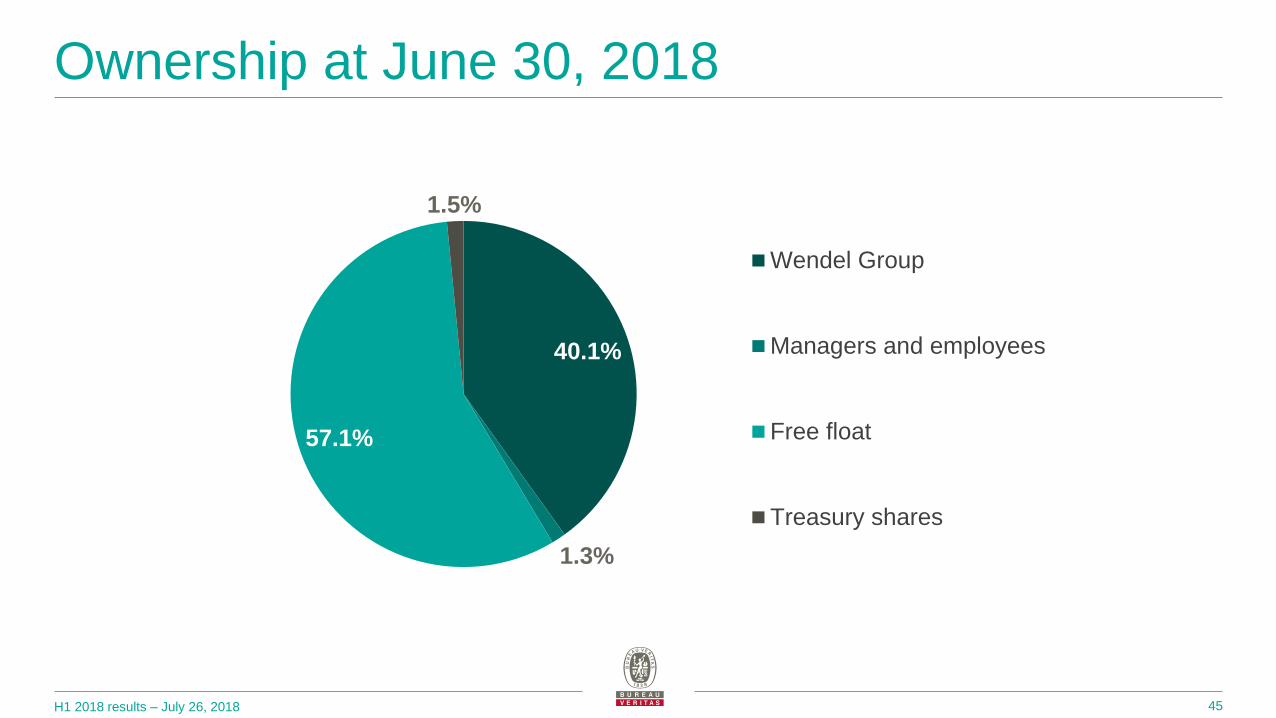
Ownership at June 30, 2018
45
40.1%
1.3%
57.1%
1.5%
Wendel Group
Managers and employees
Free float
Treasury shares

H1 2018 results – July 26, 2018
2020 ambition
46
(1) At 2015 plan initial exchange rates (as presented during October 2015 Investor Days)
Continuous
high
Free Cash Flow
generation
Add €1.5bn
of incremental
revenue1
Half organic
Half acquisition
5-7% organic
growth by 2020
Above 17%
adjusted
operating
margin1
H1 2018 results – July 26, 2018
Glossary
47
Adjusted Operating Profit (AOP) excludes amortization of acquisition intangibles, goodwill impairment, restructuring, acquisition and disposal-related items (non-recurring items)
Adjusted Operating Margin (AOP Margin) is defined as Adjusted Operating Profit / Revenue
Adjusted Net Profit is defined as net profit adjusted for non-recurring items after tax
Adjusted Net Debt is defined as net financial debt after currency hedging instruments, as defined in the calculation of banking covenants
AI: Artificial Intelligence
AIM: Asset Integrity Management
B&I: Buildings & Infrastructure
BIM: Building Information Modeling
E&E: Electronic & Equipment
E&P: Exploration & Production
EMC: Electromagnetic Compatibility
FPSO: Floating Production Storage and Offloading
FSO: Floating Storage and Offloading
GMO: Genetically Modified Organism
GRT (Marine): Gross Register Ton
GS: Government Services
IoT: Internet of Things
IMO: International Maritime Organization
LNG: Liquefied Natural Gas
M&M: Metals & Minerals
NDT: Non-destructive Testing
O&G: Oil & Gas
O&P: Oil & Petrochemicals
Organic growth: increase in revenue versus last year, at constant currency and scope (i.e. acquisitions excluded)
P&U: Power & Utilities
PSI: Pre-shipment Inspection
SSC: Shared Service Center
ULCS: Ultra Large Container Ships
VOC: Verification of Conformity
y/y: year-on-year
WC: Working Capital
WCR: Working Capital Requirement