Provisional agenda and presentation for the global atlas training workshop in lima, peru, EN
156
Seminar Schedule Spatial Planning Techniques for Renewable Power Generation 2 – 3 February 2015, Lima, Peru Monday, 2 February Tuesday, 3 February 09:00-10:45 FROM 8:30: REGISTRATION Opening/Welcome Address Solar power spatial planning techniques, L. Koerner Strategies: From the technical potential to the realizable potential; Dr. D. Jacobs Opening remarks, Edwin Quintanilla, Vice Minister of Energy Introduction of participants Overview on the seminar, L. Koerner 09:45 – 10:45 Introduction to IRENA’s Global Atlas and hot spot identification, A. Jain The availability of resources and setting of deployment targets based on resource assessments The availability of flexibility in the power sector Case study: Resource assessment and target setting in Saudi Arabia The availability of grid infrastructure o Using the existing grid, expanding the grid or developing renewables off-grid o Grid expansion planning and stakeholder involvement o Grid connection charging 10:45-11:00 Coffee break Coffee break 11:00-12:45 Solar and wind power spatial planning techniques; L. Koerner Strategies (continued) and Finance mechanisms; Dr. D. Jacobs Wind power spatial planning techniques Overview on wind energy estimation and formation of wind Spatial setup of wind farms Estimating wind electricity yield Worked example: Estimating wind capacity and yield at a given site Solar power spatial planning techniques Solar resource Spatial setup of large-scale PV plants The availability of space (spatial planning) o From technical potential to the realizable potential: o Spatial planning and RES deployment – the German framework Finance Mechanisms Designing finance mechanisms for different market segments Net Metering policies for small-scale installations? 12:45-13:45 Lunch Lunch 13:45-15:15 Solar power spatial planning techniques (continued) Hands-on exercise part 1: Hot spot analysis Economic assessment of PV and wind for energy planning L. Koerner Finance Mechanisms Dr. D. Jacobs Spatial power spatial planning techniques (continued) Estimating PV electricity yield Worked example: Estimating PV capacity and yield at a given site CSP: Direct normal irradiance and spatial requirements Hands-on exercise part 1 (ca. 20-30 minutes): Delegates use Global Atlas and identify hot spot areas in their country for wind and solar energy deployment. Economic assessment of PV and wind for energy planning: Levelised cost of electricity (LCOE) Worked example: LCOE sensitivity of PV projects FIT design and locational signals Hands-on exercise part 3 (ca. 40-50 minutes): Delegates use RENAC’s financial analysis tool for wind and solar feed-in-tariff estimation and present their tariffs. Finance Mechanisms (continued): Auction design and spatial planning Case study South Africa, China and Brazil 15:15-15:30 Coffee break Coffee break 15:30 -17:00 Economic assessment of PV and wind for energy planning (continued) Hands-on exercise part 2: LCOE estimation; L. Koerner Finance Mechanisms (continued) Project Development; Dr. D. Jacobs Worked example: LCOE sensitivity of wind projects Worked example: Effects of data uncertainty on the LCOE of PV Finance Mechanisms (continued): Combining FITs and auctions? Options for mini-grid finance
-
Upload
whitney-chen -
Category
Presentations & Public Speaking
-
view
235 -
download
1
Transcript of Provisional agenda and presentation for the global atlas training workshop in lima, peru, EN

Seminar Schedule Spatial Planning Techniques for Renewable Power Generation
2 – 3 February 2015, Lima, Peru
Monday, 2 February Tuesday, 3 February
09:00-10:45 FROM 8:30: REGISTRATION Opening/Welcome Address Solar power spatial planning techniques, L. Koerner
Strategies: From the technical potential to the realizable potential; Dr. D. Jacobs
Opening remarks, Edwin Quintanilla, Vice Minister of Energy
Introduction of participants
Overview on the seminar, L. Koerner
09:45 – 10:45 Introduction to IRENA’s Global Atlas and hot spot identification, A. Jain
The availability of resources and setting of deployment targets based on resource assessments
The availability of flexibility in the power sector
Case study: Resource assessment and target setting in Saudi Arabia
The availability of grid infrastructure o Using the existing grid, expanding the grid or developing
renewables off-grid o Grid expansion planning and stakeholder involvement o Grid connection charging
10:45-11:00 Coffee break Coffee break
11:00-12:45 Solar and wind power spatial planning techniques; L. Koerner Strategies (continued) and Finance mechanisms; Dr. D. Jacobs
Wind power spatial planning techniques
Overview on wind energy estimation and formation of wind
Spatial setup of wind farms
Estimating wind electricity yield
Worked example: Estimating wind capacity and yield at a given site
Solar power spatial planning techniques
Solar resource
Spatial setup of large-scale PV plants
The availability of space (spatial planning) o From technical potential to the realizable potential: o Spatial planning and RES deployment – the German
framework Finance Mechanisms
Designing finance mechanisms for different market segments
Net Metering policies for small-scale installations?
12:45-13:45 Lunch Lunch
13:45-15:15 Solar power spatial planning techniques (continued) Hands-on exercise part 1: Hot spot analysis Economic assessment of PV and wind for energy planning L. Koerner
Finance Mechanisms Dr. D. Jacobs
Spatial power spatial planning techniques (continued)
Estimating PV electricity yield
Worked example: Estimating PV capacity and yield at a given site
CSP: Direct normal irradiance and spatial requirements Hands-on exercise part 1 (ca. 20-30 minutes):
Delegates use Global Atlas and identify hot spot areas in their country for wind and solar energy deployment.
Economic assessment of PV and wind for energy planning:
Levelised cost of electricity (LCOE)
Worked example: LCOE sensitivity of PV projects
FIT design and locational signals Hands-on exercise part 3 (ca. 40-50 minutes):
Delegates use RENAC’s financial analysis tool for wind and solar feed-in-tariff estimation and present their tariffs.
Finance Mechanisms (continued):
Auction design and spatial planning
Case study South Africa, China and Brazil
15:15-15:30 Coffee break Coffee break
15:30 -17:00 Economic assessment of PV and wind for energy planning (continued) Hands-on exercise part 2: LCOE estimation; L. Koerner
Finance Mechanisms (continued)
Project Development; Dr. D. Jacobs
Worked example: LCOE sensitivity of wind projects
Worked example: Effects of data uncertainty on the LCOE of PV
Finance Mechanisms (continued):
Combining FITs and auctions?
Options for mini-grid finance

Monday, 2 February Tuesday, 3 February
Hands-on exercise part 2 (ca. 60 minutes):
Delegates estimate the LCOE for two solar and wind hot spots in their country and present their findings.
Financing support mechanisms: Design options and international experience
Project Development:
Reducing administrative barriers
The importance of resource mapping for investors and project developers
Assessment and revising of existing policies and frameworks 16:30 -17:00: Panel Discussion and closing remarks

Introduction
IRENA Global AtlasSpatial planning techniques 2-day seminar
About Renewables Academy (RENAC)
• RENAC is a berlin-based training specialist for Renewable Energy and Energy Efficiency.
• RENAC trained more than 4,000 persons from over 130 countries.
• RENAC’s clients are from public and private sectors.
• RENAC offers
� short-term trainings and
� academic education (MBA-Renewables, GPE-New Energy)
� Capacity Building Services (RENAC supports third parties to build up their own
capacities for trainings)
• RENAC is a private sector company with 27 employees.
• RENAC is independent.
2
About the tutor
Lars Koerner coordinates training programs at Renewables Academy
(RENAC) AG mainly in the field of solar energy. He holds a Diploma
in Environmental Engineering / Renewable Energies. Before joining
RENAC in 2014 he gained several years of experience as project
engineer and senior product manager at SolarWorld AG where he
also managed several PV-Diesel-Hybrid rural electrification projects.
His experience in the area of solar energy spans further through his
work at the German Aerospace Center (DLR) in Almeria/Spain and
Fraunhofer ISE in Freiburg/Germany. He is an expert in sizing and
simulation of solar energy systems and the co-author on off-grid and
hybrid systems in Earthscan’s 3rd edition of “Planning and Installing
Photovoltaic Systems”.
3
SETTING THE FRAME
4
5
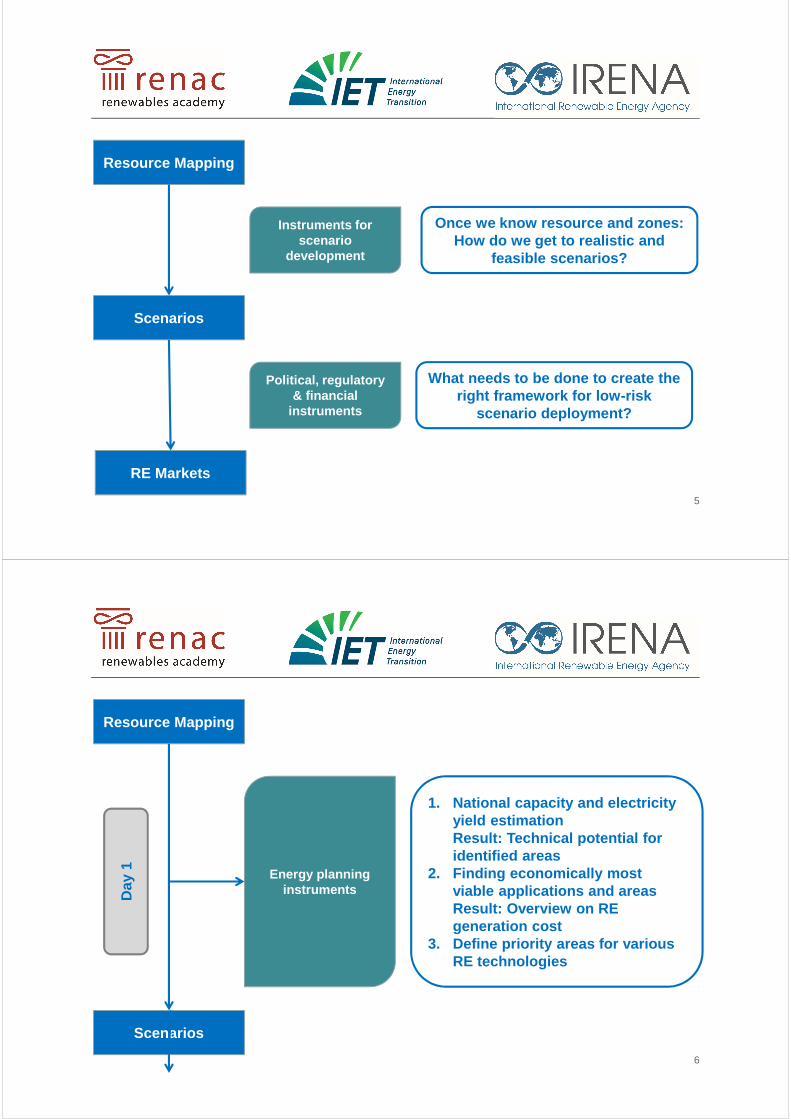
Resource Mapping
Scenarios
RE Markets
Once we know resource and zones: How do we get to realistic and
feasible scenarios?
What needs to be done to create the right framework for low-risk
scenario deployment?
Instruments for scenario
development
Political, regulatory & financial
instruments
6
Resource Mapping
Scenarios
Energy planning instrumentsD
ay 1
1. National capacity and electricity yield estimationResult: Technical potential for identified areas
2. Finding economically most viable applications and areas Result: Overview on RE generation cost
3. Define priority areas for various RE technologies

7
Scenarios
RE Market
Strategies:
1. Target setting 2. The availability of flexibility in the
power sector? 3. The availability of grid
infrastructure? 4. The availability of space (spatial
planning)?
Instruments:
5. Designing finance mechanisms for different market segments
6. Financing support mechanisms7. Reducing administrative barriers
Project development:
8. Resource mapping for investors and project developers
9. Monitoring and reviewing (target achievement)
Day
2
Thank you very much for your attention!
Lars KoernerRenewables Academy (RENAC)Phone +49 30 52 689 [email protected]

Global Atlas Training on Planning the
Renewable Energy Transition Solar and
Wind MapsLima, Peru, Feb. 2-3th 2015

Current Status of Capacity building
• Why capacity building?
Countries Renewable targets are
• 20% by 2020, 30% by 2030
• Detailed feasibility studies are not conducted to derive these targets
• Mismatch between Renewable Resource and Renewable potential
• Who is funding?
The module is financed by Flemish government, Germany, and the Brussels
Region.
• Who is attending?
The training module is specialised for policy and decision makers. It therefore
focuses on the strategic aspects of planning methods rather than on technical
aspects:
2
Current Status of Capacity building (contd.)
• Where is the capacity module delivered
The module is being deployed in 3 countries
• November 12th – 13th . First session – African Clean Energy Corridor. Arusha,
Tanzania
• December 17th -18th . Second session – MENA. Cairo, Egypt
• February 2nd – 3rd. Third session – Latin American. Lima, Peru
• What are the outcomes?
It presents the different approaches to evaluation of technical potentials, and in
particular emphasizes the sensitivity of the results to the selection of constraints, the
approach, which is chosen, and the way the calculations are performed.
Using the results of previous geospatial analysis performed by IRENA, the training
session builds capacity of the policy and decision makers to identify high-potential
developable renewable energy.
3
RENEWABLE RESOURCES
RENEWABLE POTENTIALS
4

Global Atlas
5
What share of my energy mix canbe supplied by renewable energy?
Where are the resources located?
What is the most cost-effective combination of technologies?
What amount of investments does it represent? How many jobs ?
Is there a large enough market for sustaining a supply chain?

6
Conceptual diagram of Renewable Energy Potentials (from NREL, 2012)
How competitive is it?
How much can it cost?
Where can it be
harvested? How much
power?
Where is the resource?
Complexity StandardsPrivate sector
interest Risks
• COUNTRY-DRIVEN
• LONG TERM PLANNING PROCESS
• COMMITMENT REQUIRED

8
Geospatial information. Resource, infrastructures, population density.. What next?
Energy modelers, general public,
lobbyists
Project developers, grid simulation, rural
electrification agencies, energy agencies
Need: number of MW that can be installed
for a given technology.
Outcome is in MW.
Often presented as tables with MW per
region / country.
Follow-up: high level discussions with policy
makers, broad grid simulations (power).
Need: locations of suitable areas for future
developments.
Outcome is a suitability map.
Follow-up: consultation process with policy
makers, zoom on a few select areas,
dynamic grid simulation using time series
(power).
On such areas, limited analysis on technical
potential into more detail.
Numbers are best guest, depend on
model. High disparity despite apparent
precision.
Outcome is a map and a consultation
process leading to spatial planning. MW are
closer to project reality.
IRENA: Estimating the renewable energy
potential in Africa.
IRENA: Global Atlas, ECOWAS zoning,
Africa Clean Energy Corridor
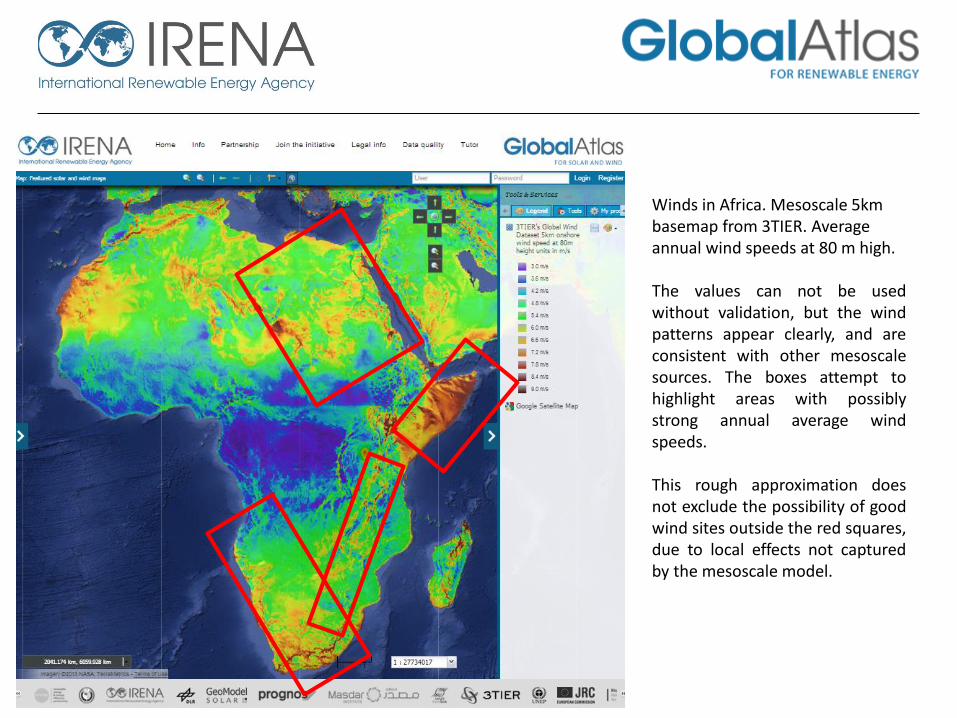
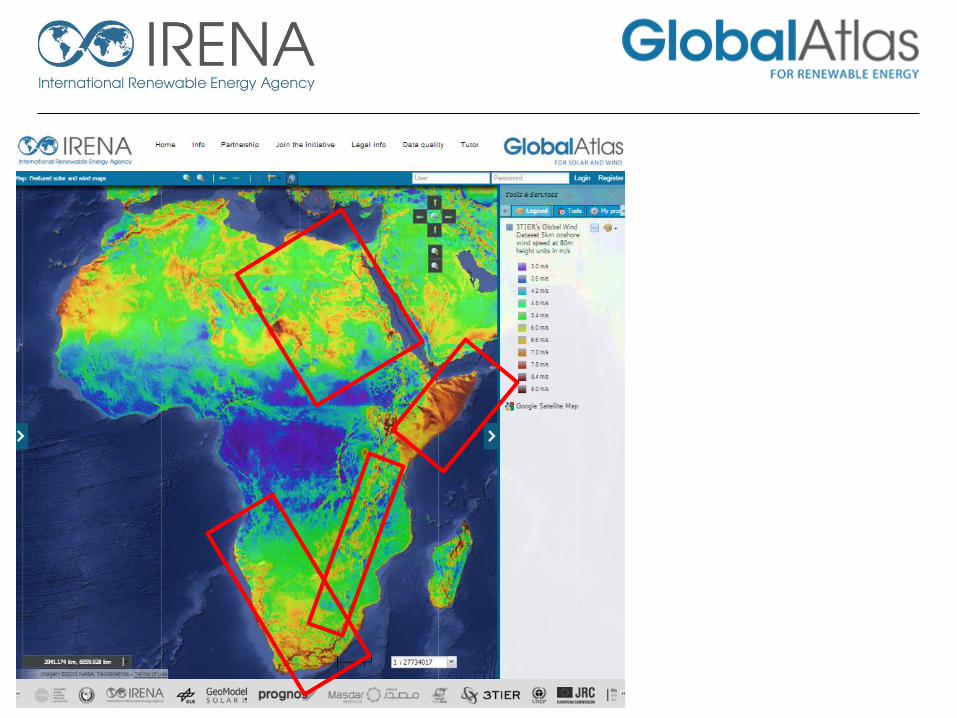
Winds in Africa. Mesoscale 5km basemap from 3TIER. Average annual wind speeds at 80 m high.
The values can not be usedwithout validation, but the windpatterns appear clearly, and areconsistent with other mesoscalesources. The boxes attempt tohighlight areas with possiblystrong annual average windspeeds.
This rough approximation doesnot exclude the possibility of goodwind sites outside the red squares,due to local effects not capturedby the mesoscale model.

10
Data
bankability
Investor’s
interest
PUBLICSECTOR EFFORT
Local measurements
PRIVATESECTOR EFFORT
Existing local measurements
Data quality
Zoning
NOT ‘BANKABLE’
‘BANKABLE’
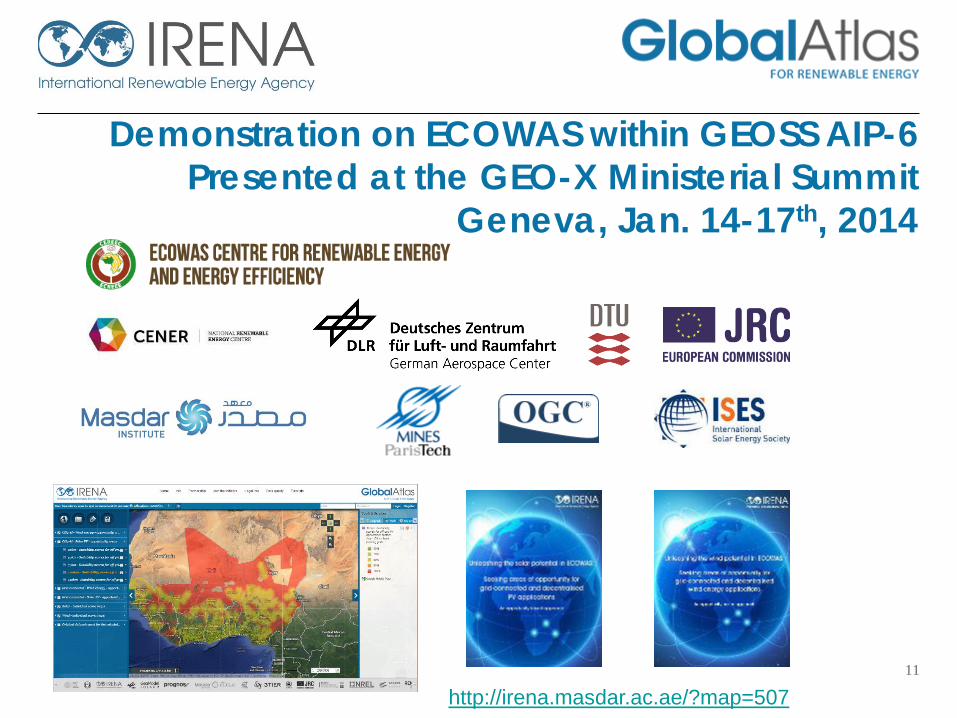
Demonstration on ECOWAS within GEOSS AIP-6
Presented at the GEO-X Ministerial Summit
Geneva, Jan. 14-17th, 2014
11
http://irena.masdar.ac.ae/?map=507

GLOBAL ATLAS – A UNIQUE
DATA INFRASTRUCTURE
12

Bridge the gap between nations having access to the
necessary funding, technologies, and expertise to evaluate
their national potentials, and those deprived of those
elements.
13

Bridge the gap between nations having access to the necessary funding,
technologies, and expertise to evaluate their national potentials, and those
deprived of those elements.
Access to data and methods
Building capacities on strategic planning
Mobilizing technical assistance
14

15
Albania, Australia, Austria, Belgium, Colombia, Denmark, Egypt, Ethiopia, Fiji island,France, Gambia, Germany, Greece, Grenada, Honduras, India, Iraq, Iran, Israel, Italy,Kazakhstan, Kenya, Kiribati, Kuwait, Lithuania, Luxembourg, Maldives, Mali,Mauritania, Mauritius, Mexico, Mongolia, Montenegro, Morocco, Mozambique,Namibia, Netherlands, New Zealand, Nicaragua, Niger, Nigeria, Norway, Peru,Philippines, Poland, Portugal, Qatar, Saudi Arabia, Senegal, Seychelles, South Africa,Spain, Sudan, Swaziland, Switzerland, Tonga, Tunisia, Turkey, UAE, Uganda, UK, UnitedRepublic of Tanzania, Uruguay, USA, Vanuatu, Yemen, Zimbabwe.

16

1,000 datasets. 45+ national atlases.
17

Map gallery – information accessed easily
19

Hot spot-LCOE-FIT/ Auction approach
20

Potential Collaboration opportunities?
• Integrate capacity module in existing programs
Freely available open source tool with webinars, online videos, presentations and
experts
E.g. UN-ESCAP and IRENA planning for resource mapping trainings
IRENA can works with other development partners to deliver this module
• Potential funding for two capacity sessions in Asia-Pacific
21
22
www.irena.org/GlobalAtlas
IRENA Global Atlas
@GlobalREAtlas
GlobalAtlasSolarandWind

Session 2: Wind power spatial planning techniques
IRENA Global AtlasSpatial planning techniques 2-day seminar
Central questions we want to answer
• After having identified those areas which are potentially available for renewables, we
want to estimate…
� what the potential wind capacity per km² and in total is (W/km²), and,
� how much electricity (Wh/km²/a) can be generated in areas with different wind
regimes.
• We also need to know which parameters are the most sensitive ones in order to identify
the most important input parameters.
2

3
© R
EN
AC
201
4
Wind speed at hub height (m/s)
Energy generation costs at specific site (€/Wh)
Wind speed extrapolation to turbine hub height
Roughness length or wind shear exponent
Hub height (m)
Energy output calculation
Power curve, wind turbine density (W/km2), air density
Weibull distribution (k, A)
Electrical losses (%)
CAPEX
OPEX
WACC
Life time
Economic parameters
(wind farm and grid connection)
Annual energy prod. (Wh/a/km2)Wind capacity per area (W/km2) C
AP
EX
= C
apita
l exp
endi
ture
, OP
EX
= O
pera
tion
expe
nditu
re, W
AC
C =
Wei
ghte
d av
erag
e co
st o
f ca
pita
l (de
bt, e
quity
)
Areas potentially suitable for wind farms (km2) Site assessment (wind atlas data, wind speed (m/s) for certain height (m))
Exclusion of non-suitable land areas and adding of buffer zones
Nature protected area
Urban area (buffer zone: 8–10 hub height)
Transport, supply and communication infrastructure
Areas technically not suitable (high slope and above certain altitude, etc.)
Landscape, historic area, other non-usable land (glaciers, rivers, etc.)
Areas potentially suitable for wind farms (km2)
Priority areas for wind power (km2), potentially installed capacity (W), potentially
generated energy (Wh/a) and costs
Energy policy analysis
Economic assessment
done
pend
ing
Agenda
1. Formation of wind
2. Technical aspects we need to know
3. Spatial setup of wind farms
4. Estimating wind electricity yield
5. Worked example: Estimating wind capacity and yield at a given site
4

1. FORMATION OF WIND
5
High and low pressure area
• High pressure area occurs when air becomes colder (winter high pressure areas can be quite strong and lasting). The air becomes heavier and sinks towards the earth. Skies are usually clear. The airflow is clockwise (northern hemi). The air flows towards the low pressure area over the ground.
Source: http://www.experimentalaircraft.info/weather/weather-info-1.phpar
Isobars
• Low pressure occurs when air becomes warmer. The air becomes lighter and rises. The pressure lowers towards the center and air flow is counterclockwise (northern hemi). Clouds will appear due to rising of the moist warm air and the weather will deteriorate. Air will flow back to the high pressure area at higher altitudes in the atmosphere.
6
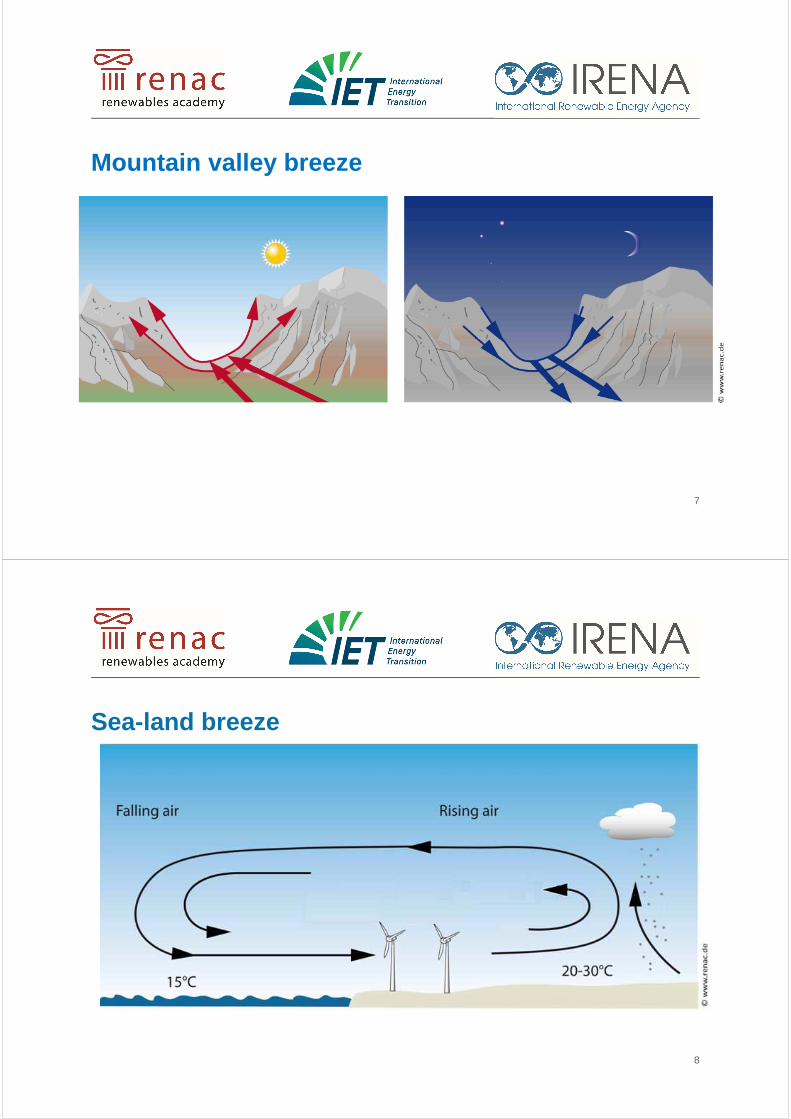
Mountain valley breeze
7
Sea-land breeze
8

2. TECHNICAL ASPECTSWE NEED TO KNOW
9
Vertical wind shear profile and roughness of surface
Profile above area with low roughness (sea, low grass)
Hei
ght
Hei
ght
Profile above area with high roughness (forest, town) 10

Roughness classes and roughness lengths (European wind atlas)
Rough-ness class
Roughnesslength Z 0 [m] Landscape type
0 0.0002 Water surface
0.5 0.0024 Completely open terrain with a smooth surface, e.g. concrete runways in airports, mowed grass, etc.
1 0.03 Open agricultural area without fences and hedgerows and very scattered buildings. Only softly rounded hills
1.5 0.055 Agricultural land with some houses and 8 meters tall sheltering hedgerows with a distance of approx. 1250 meters
2 0.1 Agricultural land with some houses and 8 meters tall sheltering hedgerows with a distance of approx. 500 meters
2.5 0.2 Agricultural land with many houses, shrubs and plants, or 8 metre tall sheltering hedgerows with a distance of approx. 250 meters
3 0.4 Villages, small towns, agricultural land with many or tall sheltering hedgerows, forests and very rough and uneven terrain
3.5 0.8 Larger cities with tall buildings 4 1.6 Very large cities with tall buildings and skyscrapers 11
Calculating wind speed at different heights
h2
h1
Where:
h1 : height [m]
h2 : height [m]
v1 : wind speed at h1 [m/s]
v2 : wind speed at h2 [m/s]
z0 : roughness length [m]
�2 = �1 ∗ln(
ℎ2
�0)
ln(ℎ1
�0)
12

Schematic wind shear for different roughness classes - wind speed measured at the same height
13
J.lie
rsch
; Key
Win
dEne
rgy,
200
9
Site specific wind resource assessment for wind farm planning• To calculate the annual energy production of
a wind turbine the distribution of wind speeds
is needed. It can be approximated by a
Weibull equation with parameters A and K
• The distribution of wind directions is important
for the siting of wind turbines in a wind farm.
The wind rose shows probability of a wind
from a certain sector.
• Wind speed distributions are measured for
different wind direction sectors.
14
h w(v
)

Weibull equation factors for different regions
• For regions with similar topography the k factors are also similar
� 1.2 < k < 1.7 Mountains
� 1.8 < k < 2.5 Typical North America and Europe
� 2.5 < k < 3.0 Where topography increases wind speeds
� 3.0 < k < 4.0 Winds in e.g. monsoon regions
• Scaling factor A is related to mean wind speed ( vavg ~ 0,8…0,9 · A)
• Relation of mean wind vavg, k und A (mean wind vavg, calculation)
• Warning: Only rough values! – On site monitoring is necessary !
Source: J.liersch; KeyWindEnergy, 2009
15
Wind Atlas based on modelling
• A suitable number of high quality
measurements is characterized for its local
effects
• The measurements are combined into an
atlas
• Sample: 3TIER’s Global Wind Dataset 5km
onshore wind speed at 80m height units in
m/s
• Limitations for complex terrain and costal
zones
16
Map: IRENA Global Atlas; Data: 3TIER’s Global WindDataset
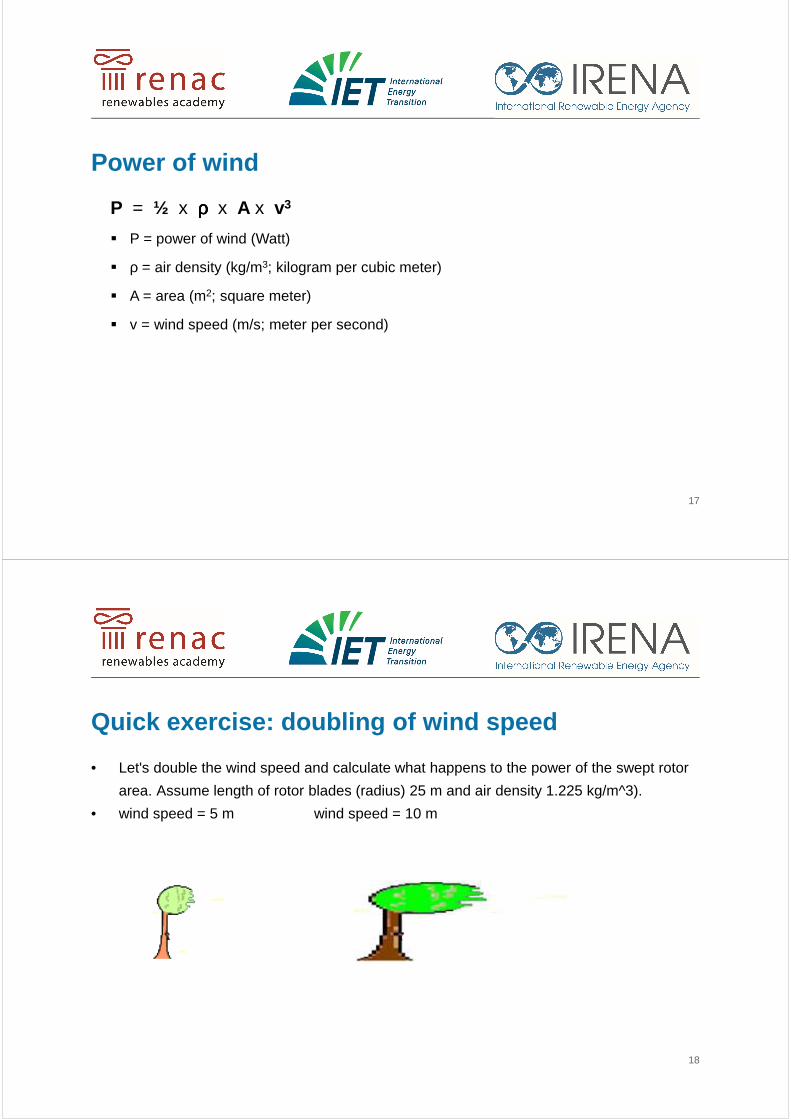
Power of wind
17
P = ½ x ρρρρ x A x v3
� P = power of wind (Watt)
� ρ = air density (kg/m3; kilogram per cubic meter)
� A = area (m2; square meter)
� v = wind speed (m/s; meter per second)
Quick exercise: doubling of wind speed
• Let's double the wind speed and calculate what happens to the power of the swept rotor
area. Assume length of rotor blades (radius) 25 m and air density 1.225 kg/m^3).
• wind speed = 5 m wind speed = 10 m
18

3. SPATIAL SETUP OFWIND FARMS
19
Wake effect
� Clouds form in the wake of the front row of wind turbines at the Horns Rev offshore wind farm in the North Sea
� Back-row wind turbines losing power relative to the front row Source: www.popsci.com/technology/article/2010-01/wind-turbines-leave-clouds-and-energy-inefficiency-their-wake
20

Legend:
Predominant wind direction
Position of wind turbine to beinstalled
One rotor diameter in order todetermine best position toinstall the desired wind turbines
5 rotordiameters
7 rotor diameters
Distance between turbines to reduce wake effects
21
4. ESTIMATING WIND ELECTRICITY YIELD
22

What needs to be done
1. Define a representative mix of suitable turbines (potentially site-specific).
2. Get power curve information for all turbine types.
3. Extrapollate average wind speeds to applicable hub heights.
4. Choose the wind speed distribution curve which is most likely at given site(s).
5. Calculate wind speed distributions for given hub heights.
6. Use wind speed distributions and power curves to calclulate representative wind energy
yield(s).
23
Wind energy yield calculation
• vi = wind speed class i [m/s]
• hi = relative frequency of wind
speed class in %
• Pi = power output of wind
turbine at wind speed class vi
[kW]
• Ei= energy yield of wind speed
class i [kWh] vi in m/s
Ei in kWh
vi in m/s
hi in % vi in m/s
Pi in kW
Power curve of a specific wind turbine
Wind speed distribution for a specific site
© R
EN
AC
201
4
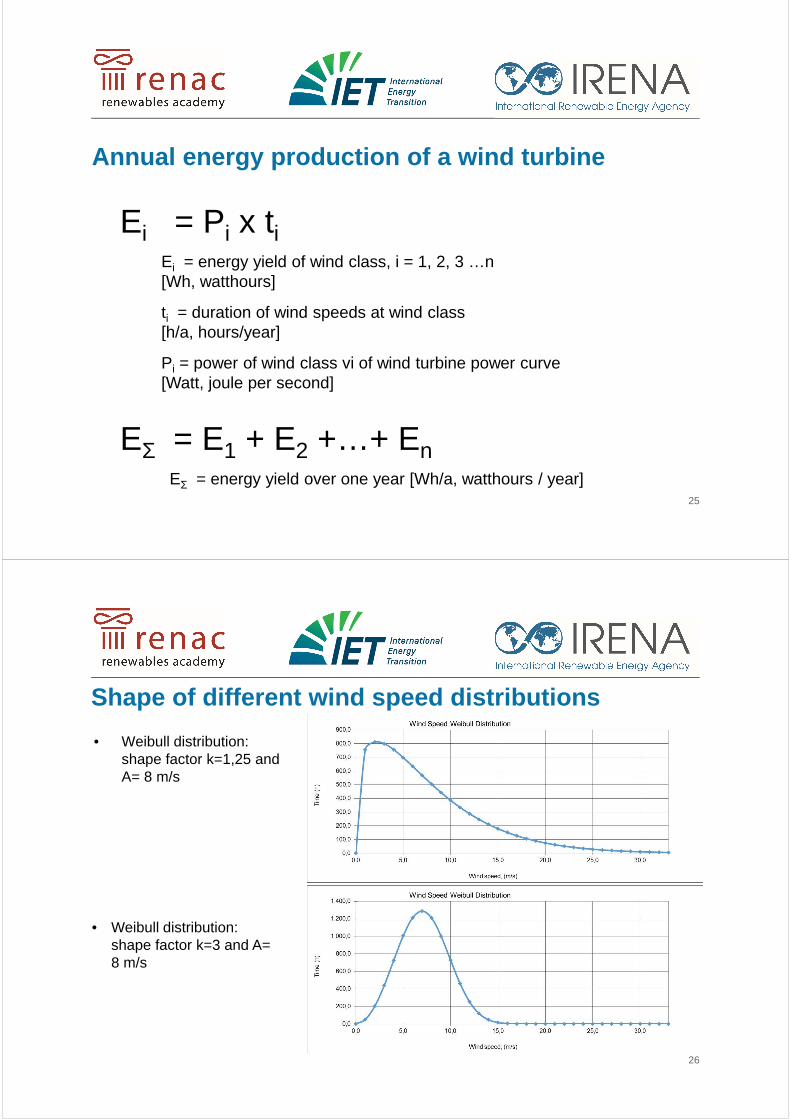
Annual energy production of a wind turbine
25
Ei = Pi x tiEi = energy yield of wind class, i = 1, 2, 3 …n[Wh, watthours]
ti = duration of wind speeds at wind class [h/a, hours/year]
Pi = power of wind class vi of wind turbine power curve [Watt, joule per second]
EΣ = E1 + E2 +…+ EnEΣ = energy yield over one year [Wh/a, watthours / year]
Shape of different wind speed distributions
• Weibull distribution: shape factor k=1,25 andA= 8 m/s
26
• Weibull distribution: shape factor k=3 and A= 8 m/s
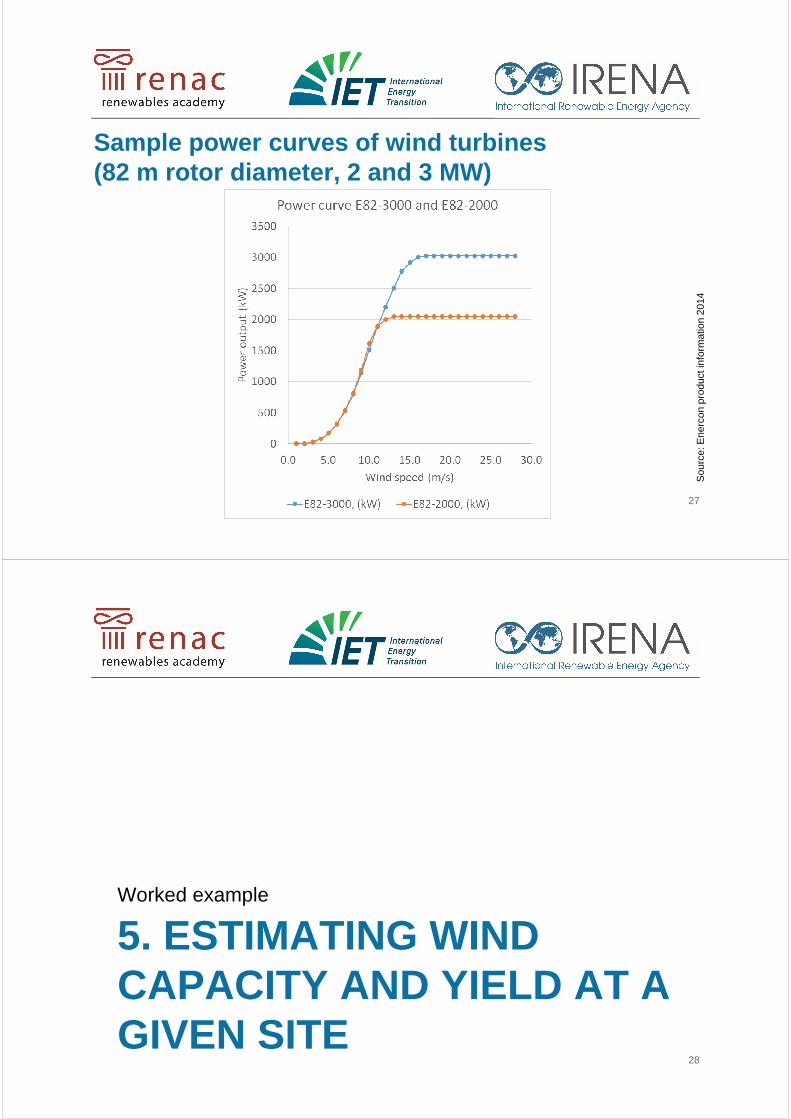
Sample power curves of wind turbines(82 m rotor diameter, 2 and 3 MW)
Sou
rce:
Ene
rcon
pro
duct
info
rmat
ion
2014
27
5. ESTIMATING WIND CAPACITY AND YIELD AT A GIVEN SITE
Worked example
28

Wind energy yield estimation south-west of Cairo
• Steps performed:
1) Retrieve average wind speed data from
Global Atlas
2) Estimate electricity yield of one wind
turbine
3) Estimate wind power capacity and
potential wind energy per km² at given
location
29
Pen and paper exercise (start)
30
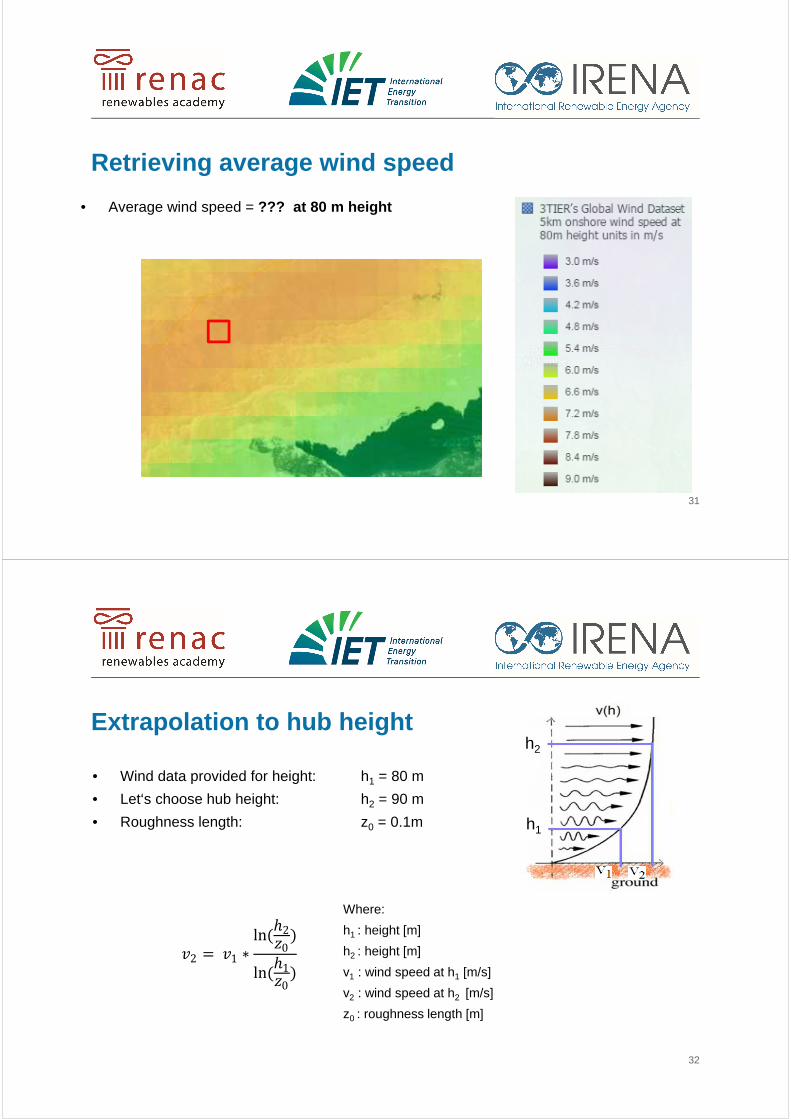
• Average wind speed = ??? at 80 m height
Retrieving average wind speed
31
Extrapolation to hub height
• Wind data provided for height: h1 = 80 m
• Let‘s choose hub height: h2 = 90 m
• Roughness length: z0 = 0.1m
32
h2
h1
Where:
h1 : height [m]
h2 : height [m]
v1 : wind speed at h1 [m/s]
v2 : wind speed at h2 [m/s]
z0 : roughness length [m]
�2 = �1 ∗ln(
ℎ2
�0)
ln(ℎ1
�0)
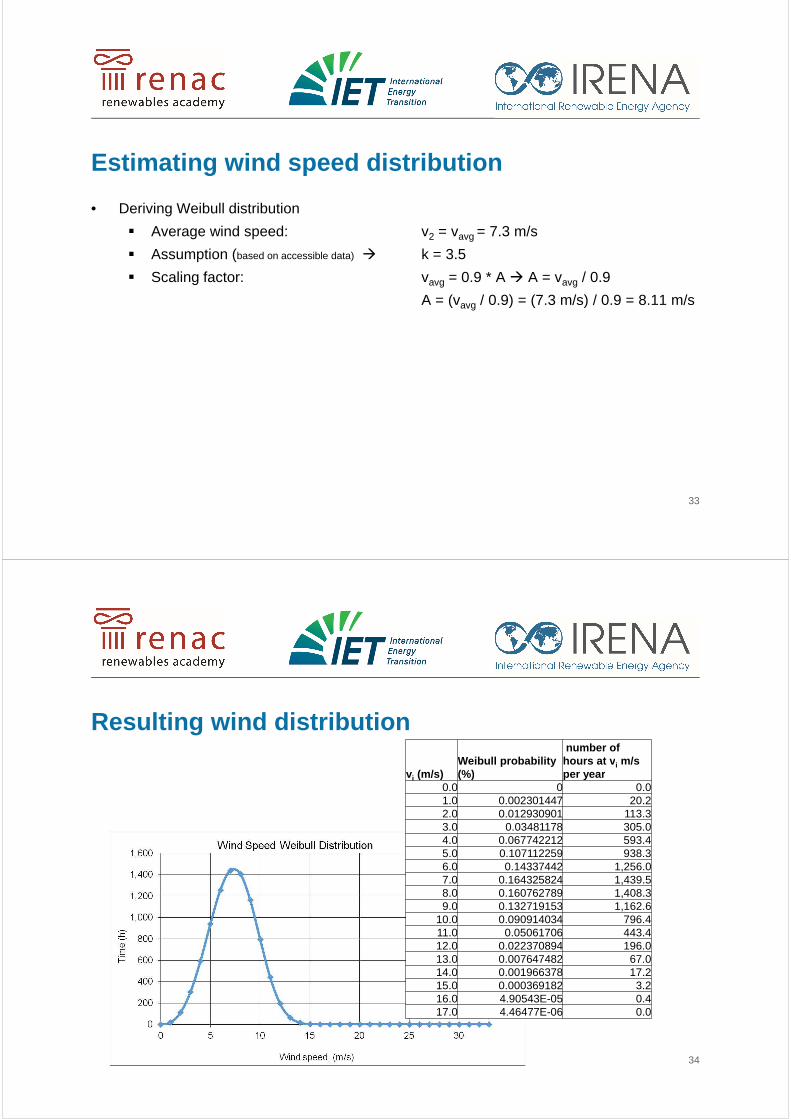
Estimating wind speed distribution
• Deriving Weibull distribution
� Average wind speed: v2 = vavg = 7.3 m/s
� Assumption (based on accessible data) � k = 3.5
� Scaling factor: vavg = 0.9 * A � A = vavg / 0.9
A = (vavg / 0.9) = (7.3 m/s) / 0.9 = 8.11 m/s
33
Resulting wind distribution
34
vi (m/s)Weibull probability(%)
number of hours at v i m/s per year
0.0 0 0.01.0 0.002301447 20.22.0 0.012930901 113.33.0 0.03481178 305.04.0 0.067742212 593.45.0 0.107112259 938.36.0 0.14337442 1,256.07.0 0.164325824 1,439.58.0 0.160762789 1,408.39.0 0.132719153 1,162.6
10.0 0.090914034 796.411.0 0.05061706 443.412.0 0.022370894 196.013.0 0.007647482 67.014.0 0.001966378 17.215.0 0.000369182 3.216.0 4.90543E-05 0.417.0 4.46477E-06 0.0

Choosing the wind turbine
• We choose enercon E82-2000
35
E82-2000
vi (m/s)
Output powerof E82-2000, (kW)
0.01.0 0
2.0 3
3.0 25
4.0 82
5.0 174
6.0 321
7.0 532
8.0 815
9.0 1180
10.0 1612
11.0 1890
12.0 2000
13.0 2050
14.0 2050
15.0 2050
16.0 2050
17.0 2050
���� Pen and paper exercise• Annual energy output of wind turbine at vi = 6 m/s = ???
• Annual energy output of wind turbine at vi = 7 m/s = ???
36
vi (m/s)Weibull probability(%)
number of hours at v i m/s per year
0.0 0 0.01.0 0.002301447 20.22.0 0.012930901 113.33.0 0.03481178 305.04.0 0.067742212 593.45.0 0.107112259 938.36.0 0.14337442 1,256.07.0 0.164325824 1,439.58.0 0.160762789 1,408.39.0 0.132719153 1,162.6
10.0 0.090914034 796.411.0 0.05061706 443.412.0 0.022370894 196.013.0 0.007647482 67.014.0 0.001966378 17.215.0 0.000369182 3.216.0 4.90543E-05 0.417.0 4.46477E-06 0.0
vi (m/s)
Output powerof E82-2000, (kW)
0.01.0 0
2.0 3
3.0 25
4.0 82
5.0 174
6.0 321
7.0 532
8.0 815
9.0 1180
10.0 1612
11.0 1890
12.0 2000
13.0 2050
14.0 2050
15.0 2050
16.0 2050
17.0 2050
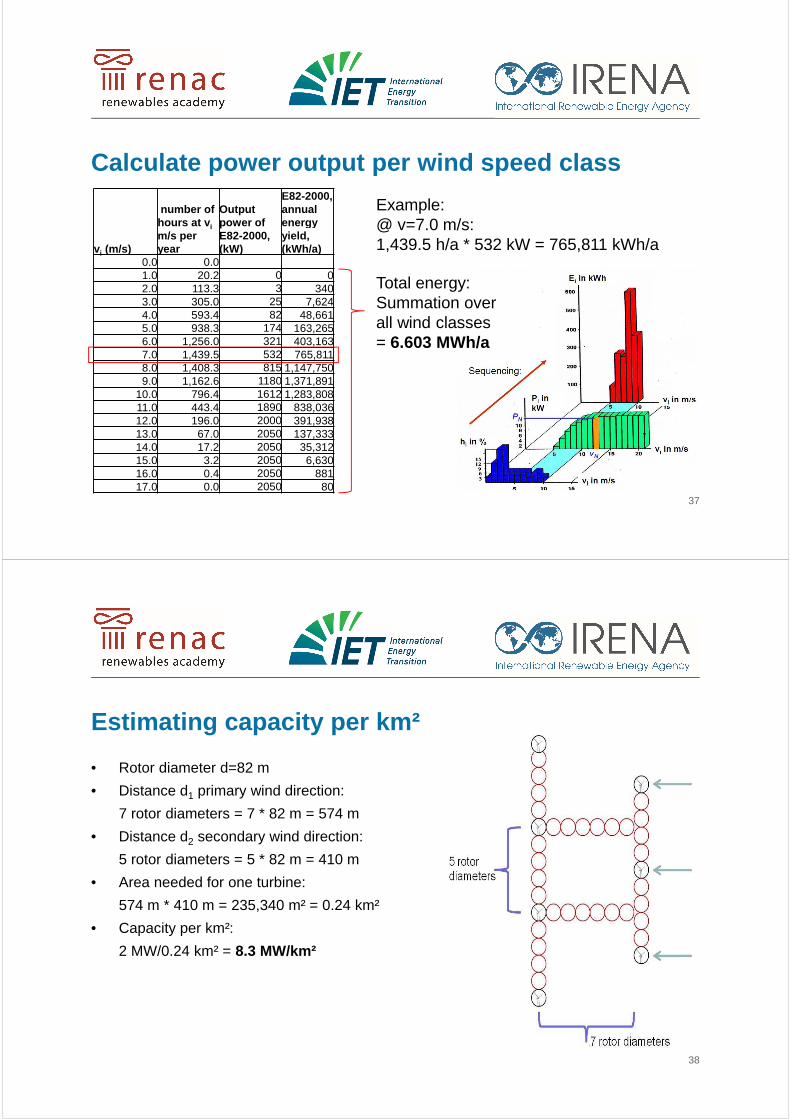
Calculate power output per wind speed class
vi (m/s)
number of hours at v im/s per year
Outputpower ofE82-2000, (kW)
E82-2000, annual energy yield, (kWh/a)
0.0 0.01.0 20.2 0 02.0 113.3 3 3403.0 305.0 25 7,6244.0 593.4 82 48,6615.0 938.3 174 163,2656.0 1,256.0 321 403,1637.0 1,439.5 532 765,8118.0 1,408.3 815 1,147,7509.0 1,162.6 1180 1,371,891
10.0 796.4 1612 1,283,80811.0 443.4 1890 838,03612.0 196.0 2000 391,93813.0 67.0 2050 137,33314.0 17.2 2050 35,31215.0 3.2 2050 6,63016.0 0.4 2050 88117.0 0.0 2050 80
37
Example:@ v=7.0 m/s:1,439.5 h/a * 532 kW = 765,811 kWh/a
Total energy:Summation overall wind classes= 6.603 MWh/a
Estimating capacity per km²
• Rotor diameter d=82 m
• Distance d1 primary wind direction:
7 rotor diameters = 7 * 82 m = 574 m
• Distance d2 secondary wind direction:
5 rotor diameters = 5 * 82 m = 410 m
• Area needed for one turbine:
574 m * 410 m = 235,340 m² = 0.24 km²
• Capacity per km²:
2 MW/0.24 km² = 8.3 MW/km²
38

Estimating energy per km² and capacity factor
• Capacity per km²:
2 MW/0.24 km² = 8.3 MW/km²
• Energy generation per wind turbine:
6,603 MWh per turbine (E82-2000) with 2 MW rated capacity,
OR: 6,603 MWh / 2 MW � 3,302 MWh / 1 MW
• Energy generated per km²:
3,302 MWh/MW * 8.3 MW/km² = 27,4 GWh/km²/a
• Capacity Factor: 3,302 MWh / 1 MW = 3,302 h
3,302 h / 8,760 h = 37.7%
39
Please remember
• The previous worked example is only a rough estimate and results are only true for the
given assumptions (specific site, one turbine type, wind distribution assumptions, etc.)
• The calculated energy yield should be considered as ideal result. In real-life power output
is likely to be slightly below these values due to downtimes (maintenance, grid outages),
cabling and transformation losses, deviation from ideal distribution of wind turbines on
the given site, etc.
40
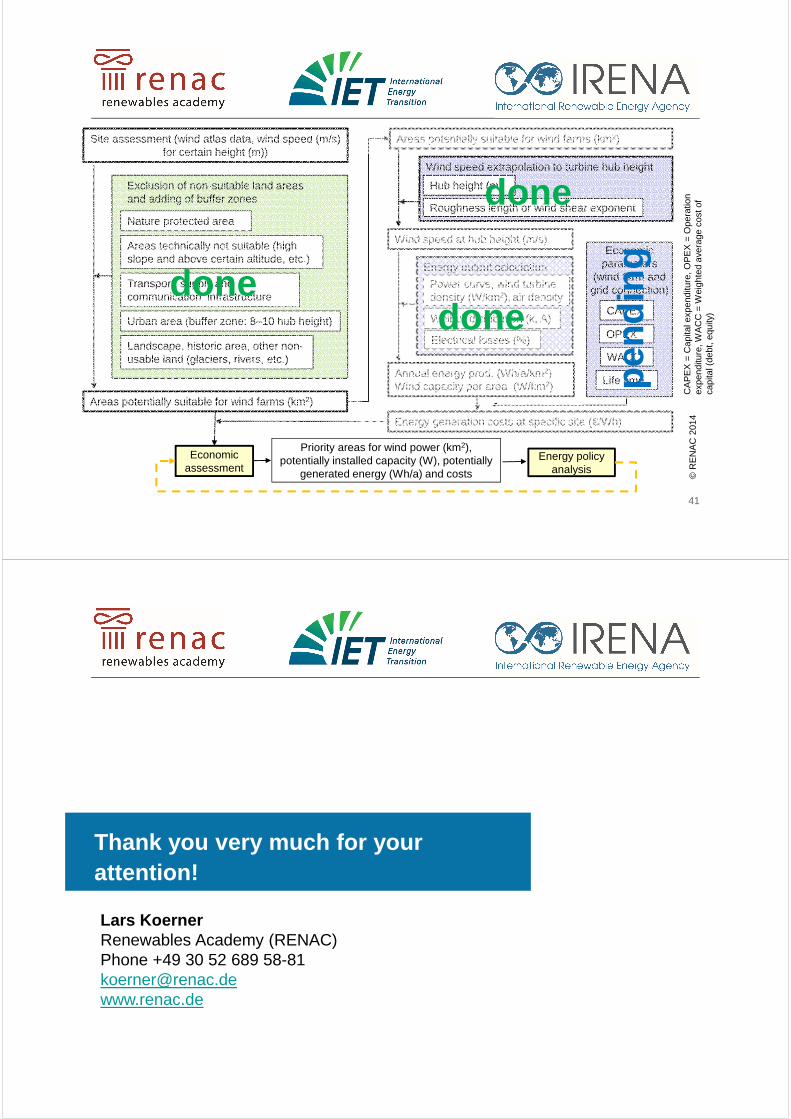
41
© R
EN
AC
201
4
Wind speed at hub height (m/s)
Energy generation costs at specific site (€/Wh)
Wind speed extrapolation to turbine hub height
Roughness length or wind shear exponent
Hub height (m)
Energy output calculation
Power curve, wind turbine density (W/km2), air density
Weibull distribution (k, A)
Electrical losses (%)
CAPEX
OPEX
WACC
Life time
Economic parameters
(wind farm and grid connection)
Annual energy prod. (Wh/a/km2)Wind capacity per area (W/km2) C
AP
EX
= C
apita
l exp
endi
ture
, OP
EX
= O
pera
tion
expe
nditu
re, W
AC
C =
Wei
ghte
d av
erag
e co
st o
f ca
pita
l (de
bt, e
quity
)
Areas potentially suitable for wind farms (km2) Site assessment (wind atlas data, wind speed (m/s) for certain height (m))
Exclusion of non-suitable land areas and adding of buffer zones
Nature protected area
Urban area (buffer zone: 8–10 hub height)
Transport, supply and communication infrastructure
Areas technically not suitable (high slope and above certain altitude, etc.)
Landscape, historic area, other non-usable land (glaciers, rivers, etc.)
Areas potentially suitable for wind farms (km2)
Priority areas for wind power (km2), potentially installed capacity (W), potentially
generated energy (Wh/a) and costs
Energy policy analysis
Economic assessment
done
pend
ing
done
done
Thank you very much for your attention!
Lars KoernerRenewables Academy (RENAC)Phone +49 30 52 689 [email protected]
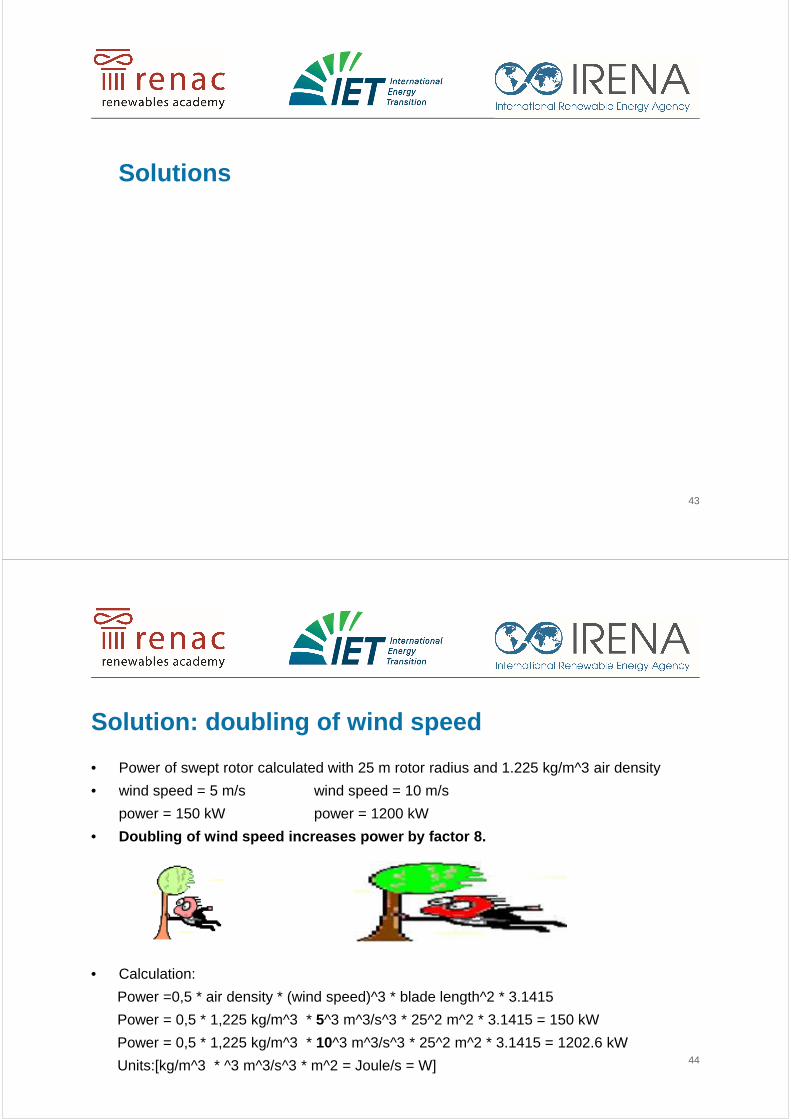
Solutions
43
Solution: doubling of wind speed
• Power of swept rotor calculated with 25 m rotor radius and 1.225 kg/m^3 air density
• wind speed = 5 m/s wind speed = 10 m/s
power = 150 kW power = 1200 kW
• Doubling of wind speed increases power by factor 8.
• Calculation:
Power =0,5 * air density * (wind speed)^3 * blade length^2 * 3.1415
Power = 0,5 * 1,225 kg/m^3 * 5^3 m^3/s^3 * 25^2 m^2 * 3.1415 = 150 kW
Power = 0,5 * 1,225 kg/m^3 * 10^3 m^3/s^3 * 25^2 m^2 * 3.1415 = 1202.6 kW
Units:[kg/m^3 * ^3 m^3/s^3 * m^2 = Joule/s = W] 44

Retrieving average wind speed
45
• Average wind speed 7.2 m/s at 80 m height
Extrapolation to hub height
• Wind data provided for height: h1 = 80 m
• Let‘s choose hub height: h2 = 90 m
• Roughness length: z0 = 0.1m
• Result: v 2 = 7.3 m/s
46
h2
h1
Where:
h1 : height [m]
h2 : height [m]
v1 : wind speed at h1 [m/s]
v2 : wind speed at h2 [m/s]
z0 : roughness length [m]
�2 = �1 ∗ln(
ℎ2
�0)
ln(ℎ1
�0)
Session 3: Solar power spatial planning techniques
IRENA Global AtlasSpatial planning techniques 2-day seminar
Central questions we want to answer
• After having identified those areas which are potentially available for renewables, we
want to estimate…
� what the potential solar PV capacity per km² and in total is (W/km²), and,
� how much electricity (Wh/km²/a) can be generated in areas with different solar
resource availability.
• We also need to know which parameters are the most sensitive ones in order to identify
the most important input parameters.
• In this section, we will focus on grid-tied PV but also provide useful numbers for CSP.
2

Contents
1. Solar resource
2. Spatial setup of large-scale PV plants
3. Estimating PV electricity yield
4. Worked example: Estimating PV capacity and yield at a given site
5. A few words on CSP
3
4
© R
EN
AC
201
4
Irradiation on tilted plane (Wh/m²/a)
Energy generation costs at specific site (€/Wh)
Conversion horizontal solar radiation to optimally tilted plane
Optimal tilt angle
Energy output calculation
Pre-conversion losses
Conversion losses
System losses (%)
CAPEX
OPEX
WACC
Life time
Economic parameters (PV plant and grid connection)
Annual energy prod. (Wh/km2/a)PV capacity per area (W/km2) C
AP
EX
= C
apita
l exp
endi
ture
, OP
EX
= O
pera
tion
expe
nditu
re, W
AC
C =
Wei
ghte
d av
erag
e co
st o
f ca
pita
l (de
bt, e
quity
) Areas potentially suitable for PV systems (km2) Site assessment (solar atlas data, solar radiation
(kWh/m²/a); open-land and settlements (roofs)
Exclusion of non-suitable areas
Nature conservation areas
Exclusion of non-suitable built-up areas (i.e. non-suitable roofs)
Transport, supply and communication infrastructure; very remote areas
Areas technically not suitable (high slope and above certain altitude, etc.)
Landscape, historic area, other non-usable land (glaciers, rivers, roads etc.)
Areas potentially suitable for PV systems (km2)
Priority areas for PV (km2), potentially installed capacity (W), potentially
generated energy (Wh/a) and costs
Energy policy analysis
Economic assessment
Perform
ance Ratio

5
© R
EN
AC
201
4
Irradiation on tilted plane (Wh/m²/a)
Energy generation costs at specific site (€/Wh)
Conversion horizontal solar radiation to optimally tilted plane
Optimal tilt angle
Energy output calculation
Pre-conversion losses
Conversion losses
System losses (%)
CAPEX
OPEX
WACC
Life time
Economic parameters (PV plant and grid connection)
Annual energy prod. (Wh/km2/a)PV capacity per area (W/km2) C
AP
EX
= C
apita
l exp
endi
ture
, OP
EX
= O
pera
tion
expe
nditu
re, W
AC
C =
Wei
ghte
d av
erag
e co
st o
f ca
pita
l (de
bt, e
quity
)
Areas potentially suitable for PV systems (km2) Site assessment (solar atlas data, solar radiation (kWh/m²/a); open-land and settlements (roofs)
Exclusion of non-suitable areas
Nature conservation areas
Exclusion of non-suitable built-up areas (i.e. non-suitable roofs)
Transport, supply and communication infrastructure; very remote areas
Areas technically not suitable (high slope and above certain altitude, etc.)
Landscape, historic area, other non-usable land (glaciers, rivers, roads etc.)
Areas potentially suitable for PV systems (km2)
Priority areas for PV (km2), potentially installed capacity (W), potentially
generated energy (Wh/a) and costs
Energy policy analysis
Economic assessment
Perform
ance Ratio
done
pend
ing
1. SOLAR RESOURCE
6

Solar radiation variation
� The sun’s power density when
its rays reach the earth’s
atmosphere is known as the
solar constant and equals
1366 ±7 W/m2
Graph: RENAC
7
Three component radiation model
• Global radiation is composed of
� direct radiation (coming
directly from sun, casting
shadows)
� diffuse radiation (scattered,
without clear direction),
and,
� reflected radiation (albedo).
8
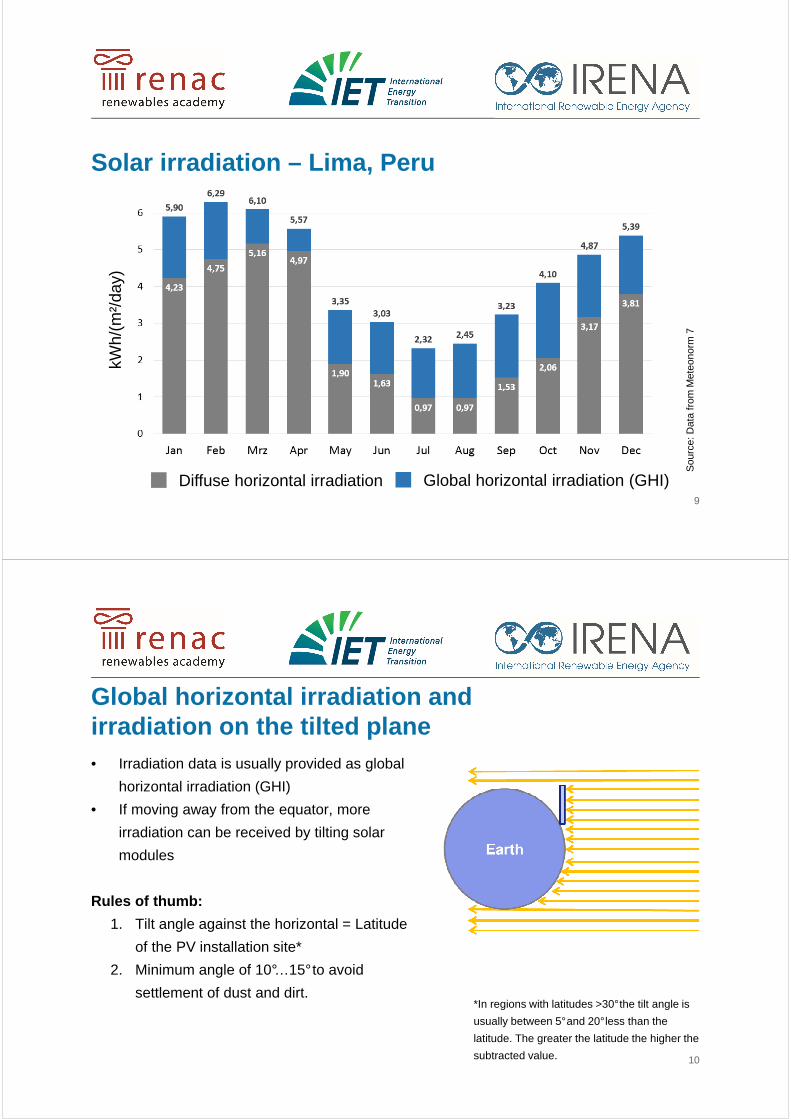
Solar irradiation – Lima, Peru
9
Sou
rce:
Dat
a fr
om M
eteo
norm
7
kWh/
(m²/
day)
Diffuse horizontal irradiation Global horizontal irradiation (GHI)
Global horizontal irradiation and irradiation on the tilted plane• Irradiation data is usually provided as global
horizontal irradiation (GHI)
• If moving away from the equator, more
irradiation can be received by tilting solar
modules
Rules of thumb:
1. Tilt angle against the horizontal = Latitude
of the PV installation site*
2. Minimum angle of 10°…15°to avoid
settlement of dust and dirt.
10
*In regions with latitudes >30°the tilt angle is
usually between 5°and 20°less than the
latitude. The greater the latitude the higher the
subtracted value.
2. SPATIAL SETUP OFLARGE-SCALE PV PLANTS
11
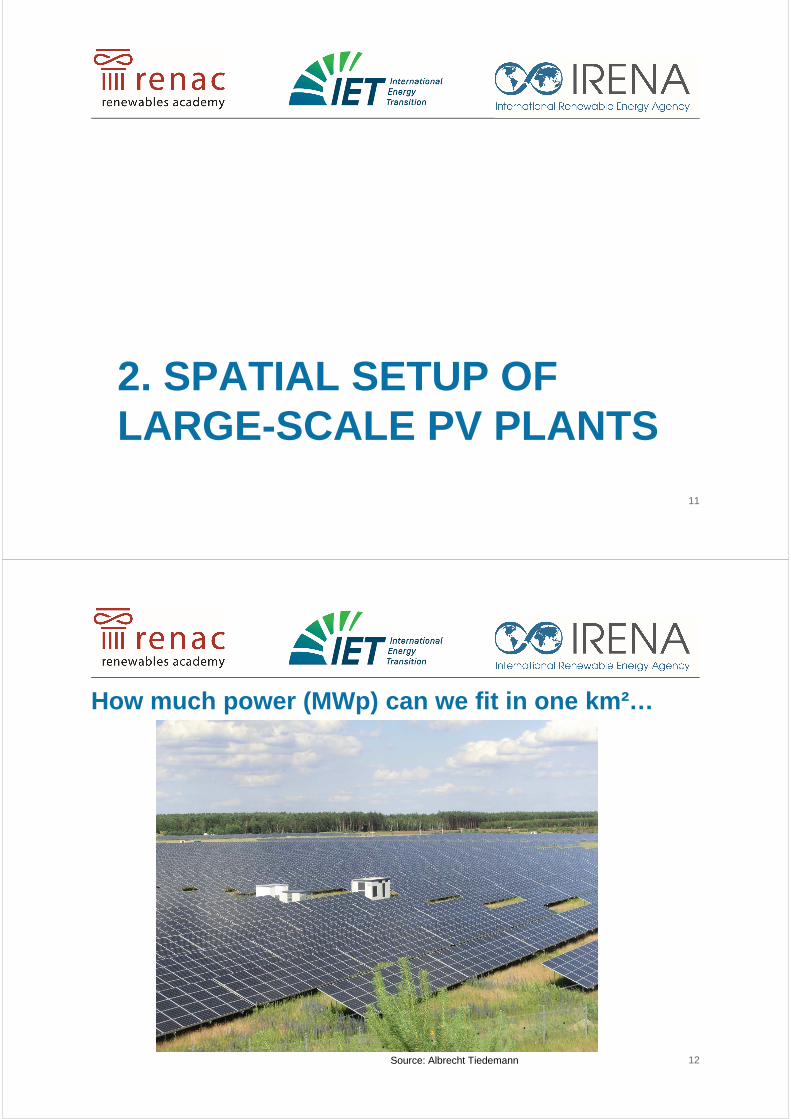
How much power (MWp) can we fit in one km²…
Source: Albrecht Tiedemann 12
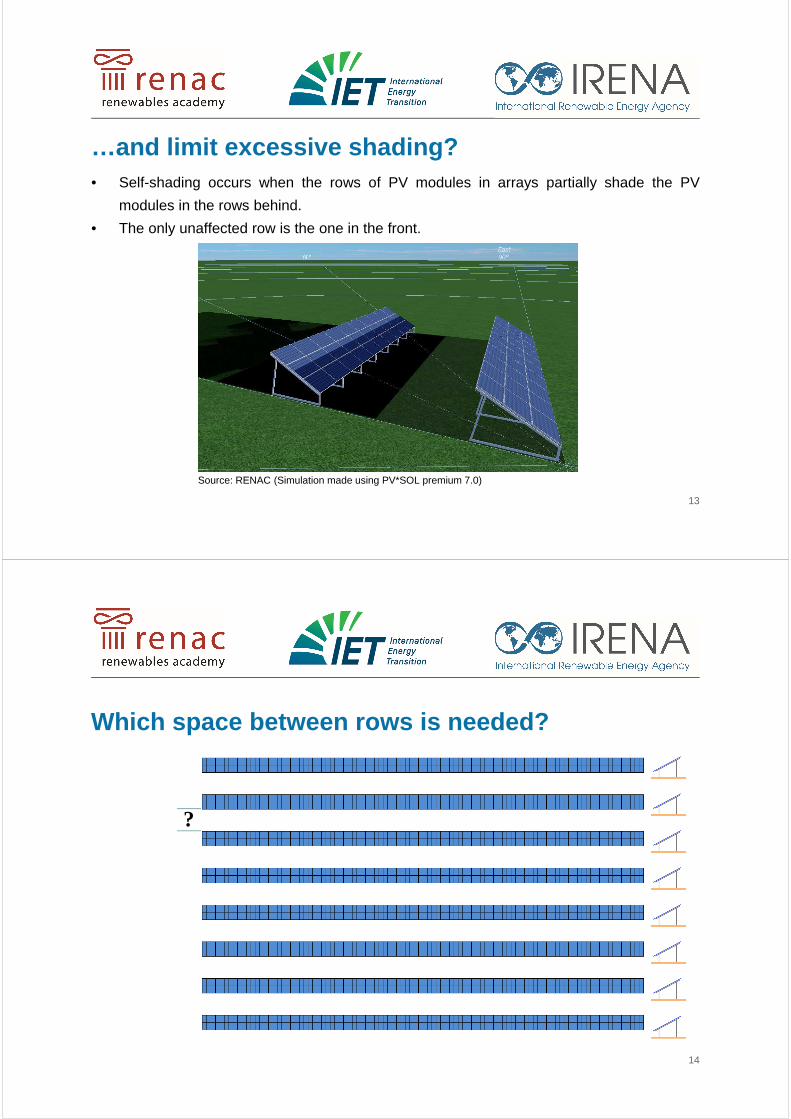
…and limit excessive shading?• Self-shading occurs when the rows of PV modules in arrays partially shade the PV
modules in the rows behind.
• The only unaffected row is the one in the front.
Source: RENAC (Simulation made using PV*SOL premium 7.0)
13
Which space between rows is needed?
14
?
Which space between rows is needed?• Space between rows depends on:
� Latitude (sun path)
� Inclination of solar panels
� Setup of solar panels on mounting structure
� Minimum space needed for O&M (car/small truck should fit through)
15
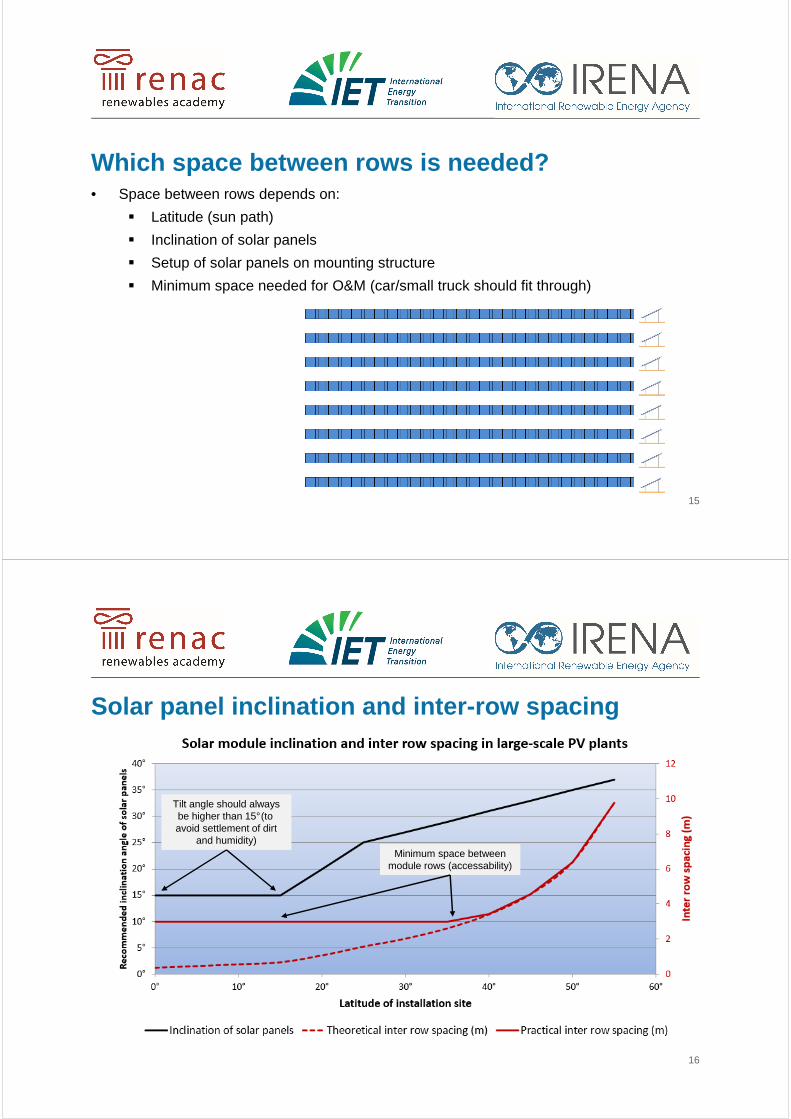
Solar panel inclination and inter-row spacing
16
Tilt angle should alwaysbe higher than 15°(toavoid settlement of dirt
and humidity)Minimum space between
module rows (accessability)
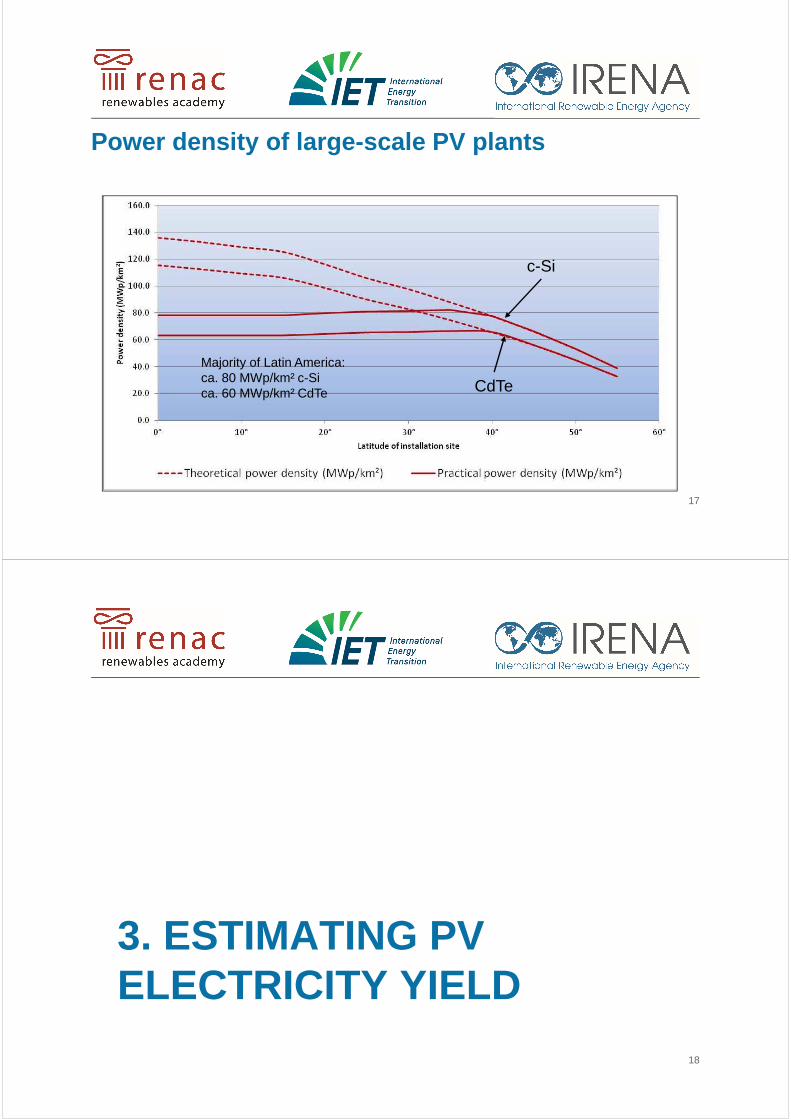
Power density of large-scale PV plants
17
c-Si
CdTe
Majority of Latin America:ca. 80 MWp/km² c-Sica. 60 MWp/km² CdTe
3. ESTIMATING PVELECTRICITY YIELD
18
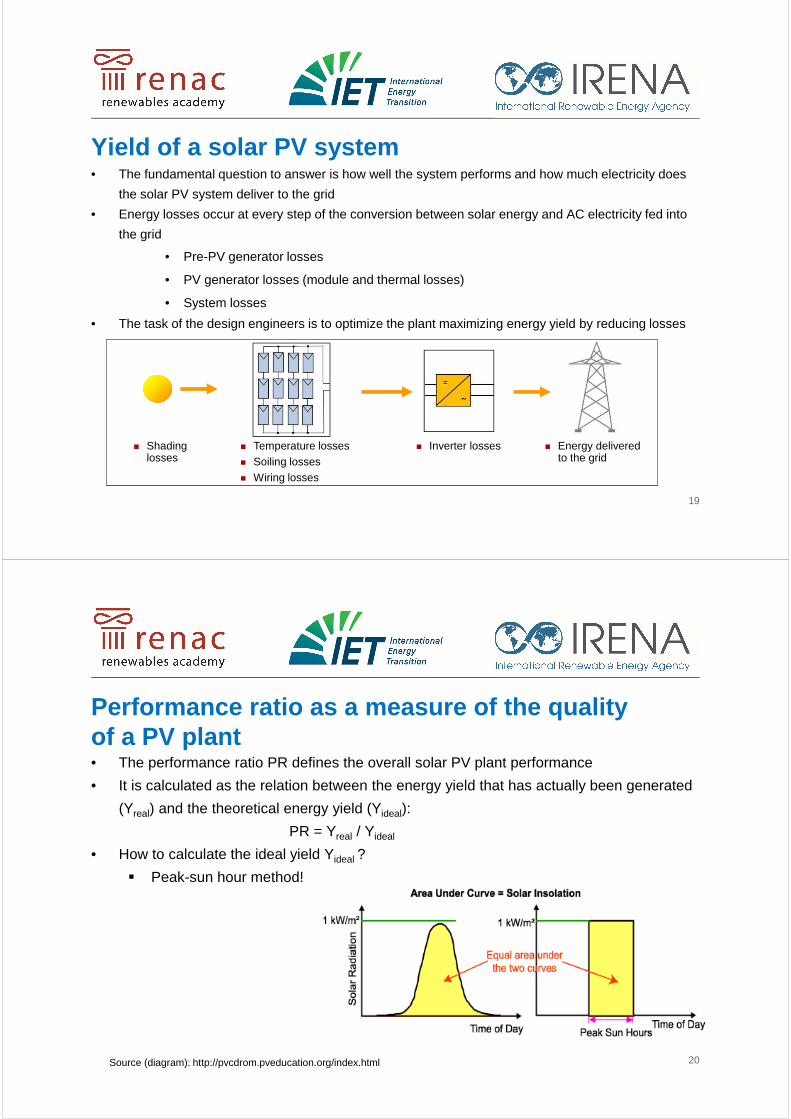
Yield of a solar PV system• The fundamental question to answer is how well the system performs and how much electricity does
the solar PV system deliver to the grid
• Energy losses occur at every step of the conversion between solar energy and AC electricity fed into
the grid
• Pre-PV generator losses
• PV generator losses (module and thermal losses)
• System losses
• The task of the design engineers is to optimize the plant maximizing energy yield by reducing losses
19
� Shading losses
� Temperature losses� Soiling losses� Wiring losses
� Inverter losses � Energy delivered to the grid
Performance ratio as a measure of the quality of a PV plant• The performance ratio PR defines the overall solar PV plant performance
• It is calculated as the relation between the energy yield that has actually been generated
(Yreal) and the theoretical energy yield (Yideal):
PR = Yreal / Yideal
• How to calculate the ideal yield Yideal ?
� Peak-sun hour method!
20Source (diagram): http://pvcdrom.pveducation.org/index.html

Estimating PV plant electricity yield using expecte d Performance Ratios• Note: Only for rough estimations!
• Electricity yield of a PV system:
• ‘h’ is Peak Sun Hours, unit: hrs (do not confuse with sunshine hours!)
Peak Sun Hours = Annual irradiation in kWh/(m²*a) / 1000 W/m²
21
h Peak Sun Hoursnpre Pre-conversion efficiencynsys System efficiencynrel Relative efficiencyPnom Nominal power at STC
4. ESTIMATING PV CAPACITY AND YIELD AT A GIVEN SITE
Worked example:
22
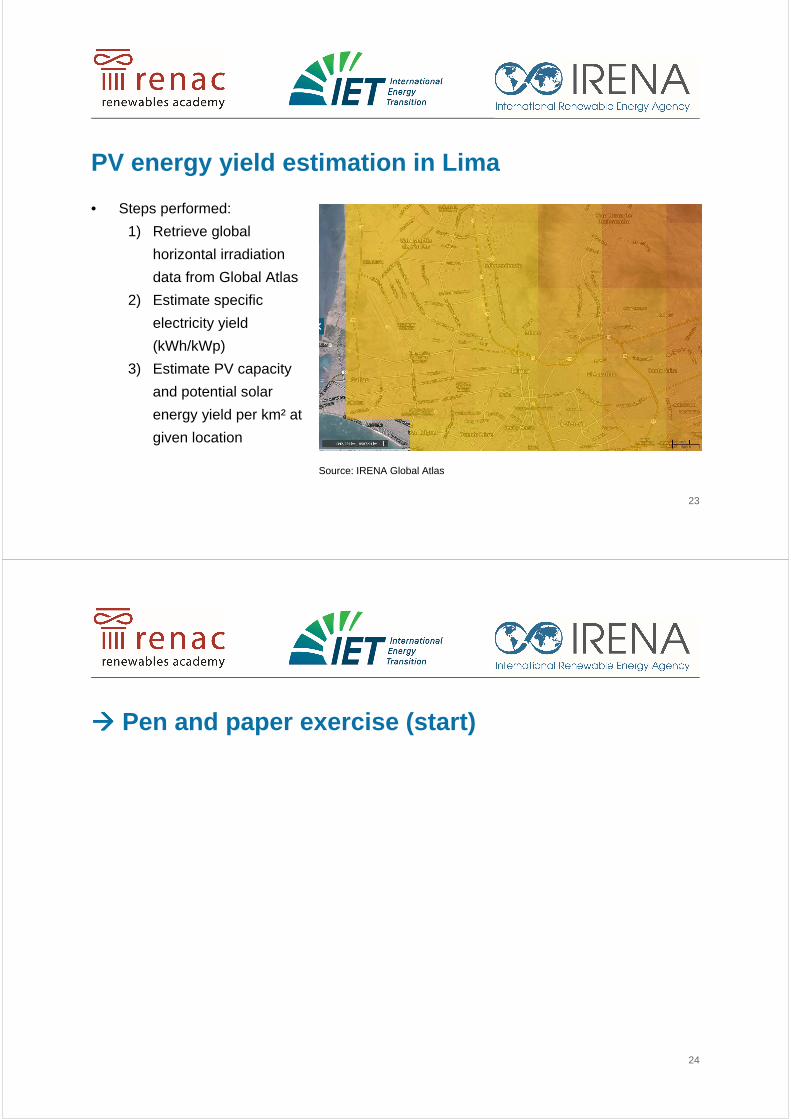
PV energy yield estimation in Lima
• Steps performed:
1) Retrieve global
horizontal irradiation
data from Global Atlas
2) Estimate specific
electricity yield
(kWh/kWp)
3) Estimate PV capacity
and potential solar
energy yield per km² at
given location
23
Source: IRENA Global Atlas
���� Pen and paper exercise (start)
24
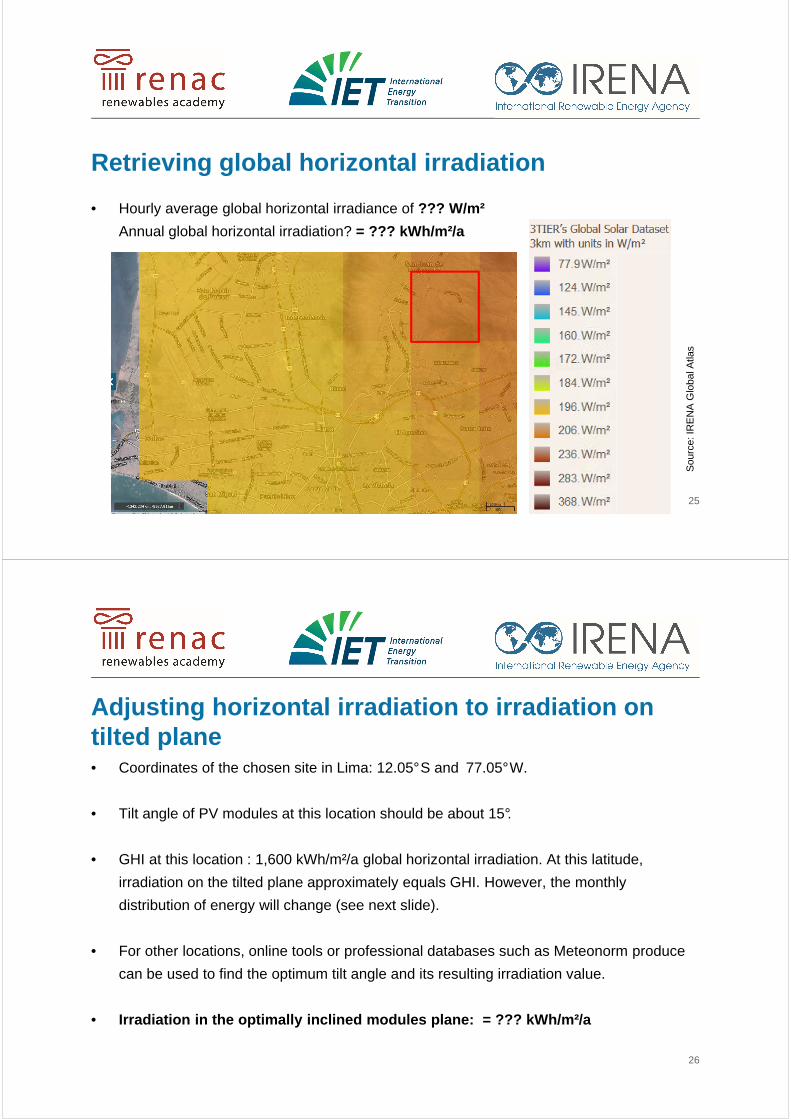
Retrieving global horizontal irradiation
• Hourly average global horizontal irradiance of ??? W/m²
Annual global horizontal irradiation? = ??? kWh/m²/a
25
Sou
rce:
IRE
NA
Glo
bal A
tlas
Adjusting horizontal irradiation to irradiation on tilted plane• Coordinates of the chosen site in Lima: 12.05°S and 77.05°W.
• Tilt angle of PV modules at this location should be about 15°.
• GHI at this location : 1,600 kWh/m²/a global horizontal irradiation. At this latitude,
irradiation on the tilted plane approximately equals GHI. However, the monthly
distribution of energy will change (see next slide).
• For other locations, online tools or professional databases such as Meteonorm produce
can be used to find the optimum tilt angle and its resulting irradiation value.
• Irradiation in the optimally inclined modules plane : = ??? kWh/m²/a
26
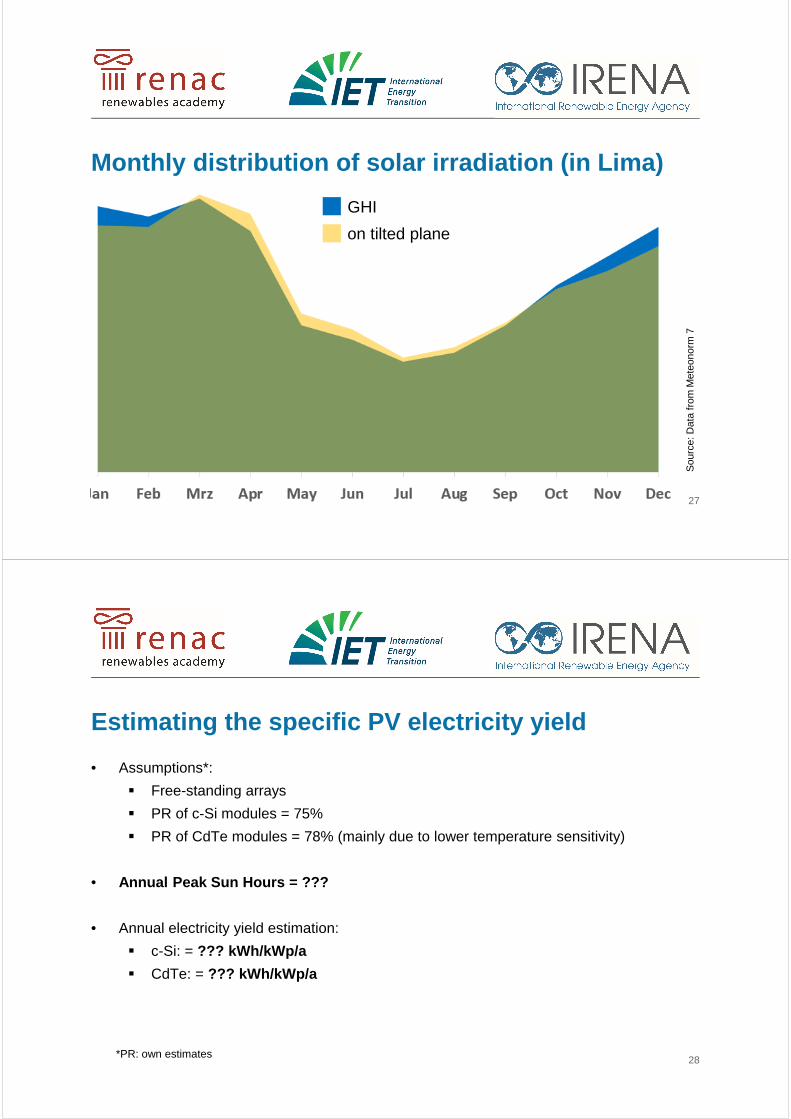
Monthly distribution of solar irradiation (in Lima)
27
GHI
on tilted plane
Sou
rce:
Dat
a fr
om M
eteo
norm
7
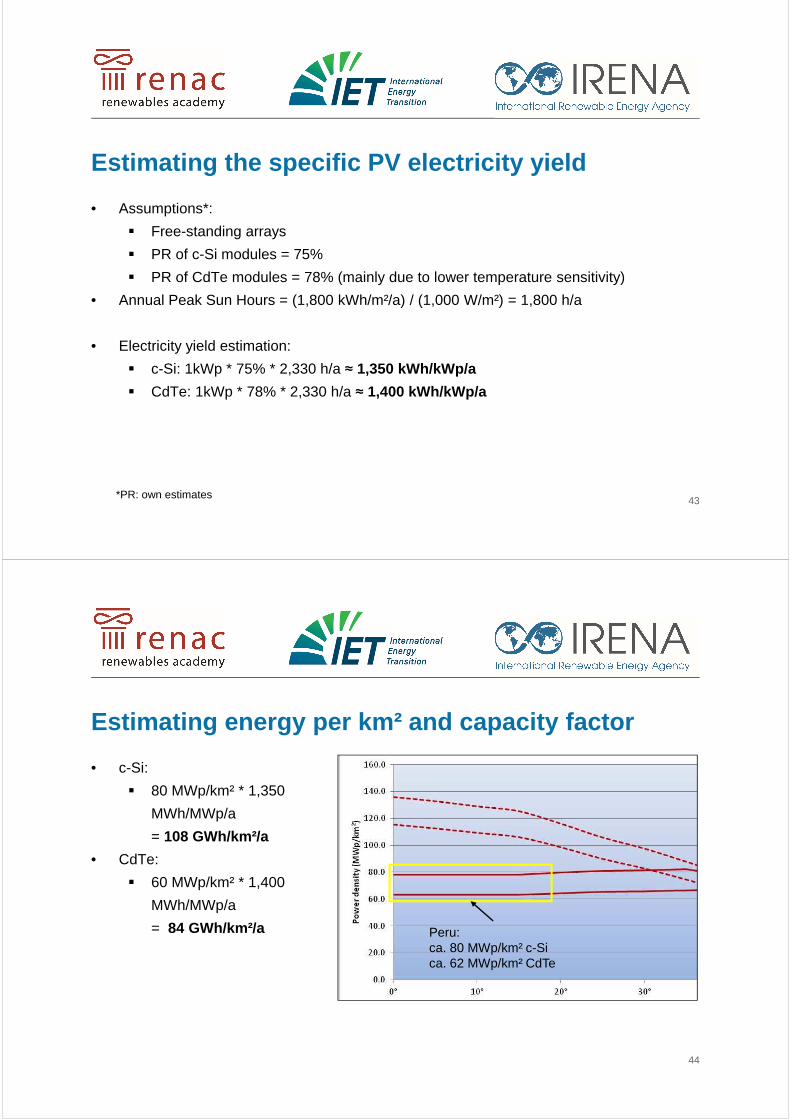
Estimating the specific PV electricity yield
• Assumptions*:
� Free-standing arrays
� PR of c-Si modules = 75%
� PR of CdTe modules = 78% (mainly due to lower temperature sensitivity)
• Annual Peak Sun Hours = ???
• Annual electricity yield estimation:
� c-Si: = ??? kWh/kWp/a
� CdTe: = ??? kWh/kWp/a
28*PR: own estimates

Power density of large-scale PV plants
29
c-Si
CdTe
Estimating energy per km² and capacity factor
• c-Si:
�
= ??? GWh/km²/a
• CdTe:
�
= ??? GWh/km²/a
• Capacity factor:
= ???%
30

Please remember
• The previous worked example is only a rough estimate and results are only true for the
given assumptions (open-land installation, module types, solar resource data,
Performance Ratio assumptions, etc.)
• Factors which might influence electricity output, which have not been considered in detail
here are for instance: heavy soiling of modules, shading from other objects, additional
temperature losses if ventilation is lower than in the case of free-standing arrays (e.g.
roof-parallel installation), etc.
31
32
© R
EN
AC
201
4
Irradiation on tilted plane (Wh/m²/a)
Energy generation costs at specific site (€/Wh)
Conversion horizontal solar radiation to optimally tilted plane
Optimal tilt angle
Energy output calculation
Pre-conversion losses
Conversion losses
System losses (%)
CAPEX
OPEX
WACC
Life time
Economic parameters (PV plant and grid connection)
Annual energy prod. (Wh/km2/a)PV capacity per area (W/km2) C
AP
EX
= C
apac
ity e
xpen
ditu
re, O
PE
X =
Ope
ratio
n ex
pend
iture
, WA
CC
= W
eigh
ted
aver
age
cost
of
capi
tal (
dept
h, e
quity
) Areas potentially suitable for PV systems (km2) Site assessment (solar atlas data, solar radiation
(kWh/m²/a); open-land and settlements (roofs)
Exclusion of non-suitable areas
Nature conservation areas
Exclusion of non-suitable built-up areas (i.e. non-suitable roofs)
Transport, supply and communication infrastructure; very remote areas
Areas technically not suitable (high slope and above certain altitude, etc.)
Landscape, historic area, other non-usable land (glaciers, rivers, roads etc.)
Areas potentially suitable for PV systems (km2)
Priority areas for PV (km2), potentially installed capacity (W), potentially
generated energy (Wh/a) and costs
Energy policy analysis
Economic assessment
Perform
ance Ratio
donedone
pend
ing

5. A FEW WORDS ON CSP
33
Geographical and irradiation requirements for CSP
• Map shows annual
Direct Normal
Irradiation (DNI) in
kWh/m²/day
• CSP needs not only
high levels of DNI (>
2,000 kWh/m²/year
considered
economically viable)
but also flat ground and
sufficient water supply
34
Map
: IR
EN
A G
loba
l Atla
s; N
AS
A d
ata
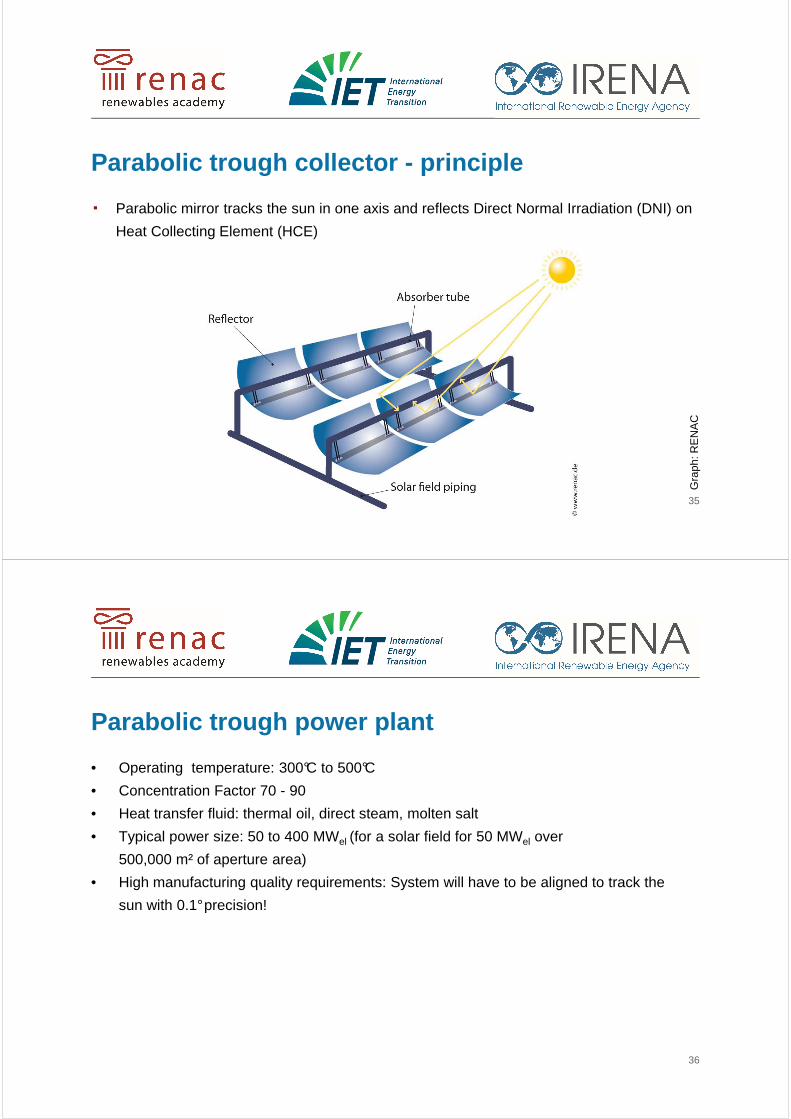
Parabolic trough collector - principle
▪ Parabolic mirror tracks the sun in one axis and reflects Direct Normal Irradiation (DNI) on
Heat Collecting Element (HCE)
35
Gra
ph: R
EN
AC
Parabolic trough power plant
• Operating temperature: 300°C to 500°C
• Concentration Factor 70 - 90
• Heat transfer fluid: thermal oil, direct steam, molten salt
• Typical power size: 50 to 400 MWel (for a solar field for 50 MWel over
500,000 m² of aperture area)
• High manufacturing quality requirements: System will have to be aligned to track the
sun with 0.1°precision!
36
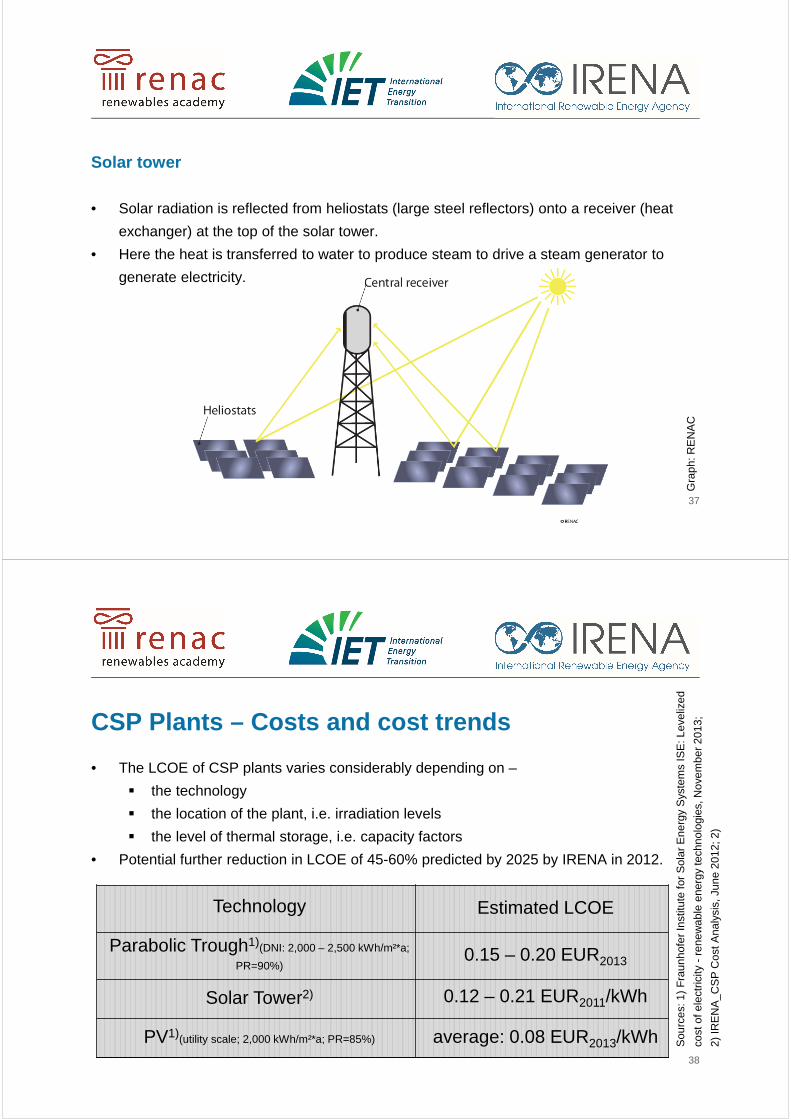
Solar tower
• Solar radiation is reflected from heliostats (large steel reflectors) onto a receiver (heat
exchanger) at the top of the solar tower.
• Here the heat is transferred to water to produce steam to drive a steam generator to
generate electricity.
37
Gra
ph: R
EN
AC
CSP Plants – Costs and cost trends
• The LCOE of CSP plants varies considerably depending on –
� the technology
� the location of the plant, i.e. irradiation levels
� the level of thermal storage, i.e. capacity factors
• Potential further reduction in LCOE of 45-60% predicted by 2025 by IRENA in 2012.
38
Sou
rces
: 1)
Fra
unho
fer
Inst
itute
for
Sol
ar E
nerg
y S
yste
ms
ISE
: Lev
eliz
ed
cost
of e
lect
ricity
-re
new
able
ene
rgy
tech
nolo
gies
, Nov
embe
r 20
13;
2) IR
EN
A_C
SP
Cos
t Ana
lysi
s, J
une
2012
; 2)
Technology Estimated LCOE
Parabolic Trough1)(DNI: 2,000 – 2,500 kWh/m²*a;
PR=90%) 0.15 – 0.20 EUR2013
Solar Tower2) 0.12 – 0.21 EUR2011/kWh
PV1)(utility scale; 2,000 kWh/m²*a; PR=85%) average: 0.08 EUR2013/kWh
Thank you very much for your attention!
Lars KoernerRenewables Academy (RENAC)Phone +49 30 52 689 [email protected]
���� Solutions
40
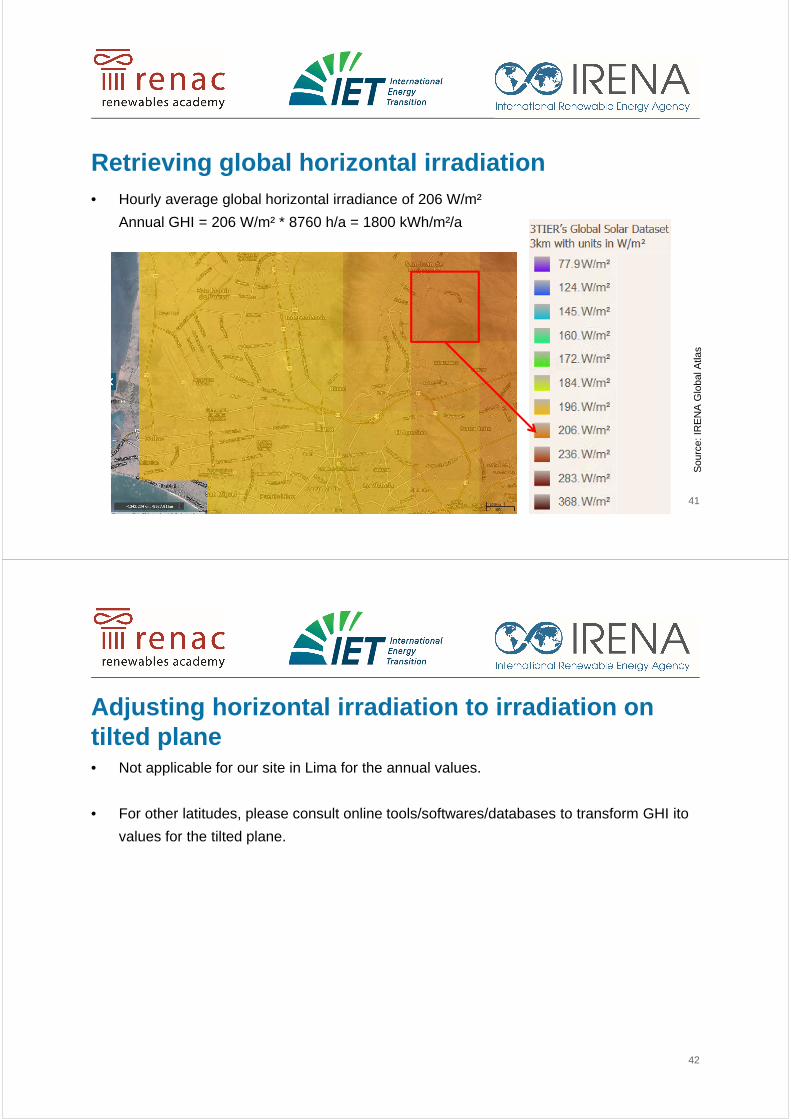
Retrieving global horizontal irradiation• Hourly average global horizontal irradiance of 206 W/m²
Annual GHI = 206 W/m² * 8760 h/a = 1800 kWh/m²/a
41
Sou
rce:
IRE
NA
Glo
bal A
tlas
Adjusting horizontal irradiation to irradiation on tilted plane• Not applicable for our site in Lima for the annual values.
• For other latitudes, please consult online tools/softwares/databases to transform GHI ito
values for the tilted plane.
42
Estimating the specific PV electricity yield
• Assumptions*:
� Free-standing arrays
� PR of c-Si modules = 75%
� PR of CdTe modules = 78% (mainly due to lower temperature sensitivity)
• Annual Peak Sun Hours = (1,800 kWh/m²/a) / (1,000 W/m²) = 1,800 h/a
• Electricity yield estimation:
� c-Si: 1kWp * 75% * 2,330 h/a ≈ 1,350 kWh/kWp/a
� CdTe: 1kWp * 78% * 2,330 h/a ≈ 1,400 kWh/kWp/a
43*PR: own estimates
Estimating energy per km² and capacity factor
• c-Si:
� 80 MWp/km² * 1,350
MWh/MWp/a
= 108 GWh/km²/a
• CdTe:
� 60 MWp/km² * 1,400
MWh/MWp/a
= 84 GWh/km²/a
44
Peru:ca. 80 MWp/km² c-Sica. 62 MWp/km² CdTe

Session 4: Economic assessment of PV and wind for energy planning
IRENA Global AtlasSpatial planning techniques 2-day seminar
Central questions we want to answer
1. Once we know how much electricity can be produced in our country with given resources
(technical potential), we will be able to estimate their generation costs
2. As all available data comes with uncertainties, we should know
a. how sensitive results react on changing input parameters, and,
b. what socio-economic effect highly uncertain input data could have.
2

3
© R
EN
AC
201
4
Irradiation on tilted plane (Wh/m²/a)
Energy generation costs at specific site (€/Wh)
Conversion horizontal solar radiation to optimally tilted plane
Optimal tilt angle
Energy output calculation
Pre-conversion losses
Conversion losses
System losses (%)
CAPEX
OPEX
WACC
Life time
Economic parameters (PV plant and grid connection)
Annual energy prod. (Wh/km2/a)PV capacity per area (W/km2)
Areas potentially suitable for PV systems (km2) Site assessment (solar atlas data, solar radiation (kWh/m²/a); open-land and settlements (roofs)
Exclusion of non-suitable areas
Nature conservation areas
Exclusion of non-suitable built-up areas (i.e. non-suitable roofs)
Transport, supply and communication infrastructure; very remote areas
Areas technically not suitable (high slope and above certain altitude, etc.)
Landscape, historic area, other non-usable land (glaciers, rivers, roads etc.)
Areas potentially suitable for PV systems (km2)
Priority areas for PV (km2), potentially installed capacity (W), potentially
generated energy (Wh/a) and costs
Energy policy analysis
Economic assessment
Perform
ance Ratio
donedone
CA
PE
X=
Cap
ital e
xpen
ditu
re, O
PE
X =
Ope
ratio
n ex
pend
iture
, WA
CC
= W
eigh
ted
aver
age
cost
of
capi
tal (
debt
, equ
ity)
Contents
1. Levelized cost of electricity (LCOE)
2. Worked example: LCOE sensitivity of PV projects
3. Worked example: LCOE sensitivity of wind projects
4. Worked example: Effects of data uncertainty on the LCOE of PV
4

1. LEVELIZED COST OFELECTRICITY (LCOE)
5
Levelized Cost of Electricity (LCOE)
• Calculates the average cost per unit electricity. LCOE takes into account the time value
of money (i.e. capital costs).
Where:
• LCOE: Average Cost of Electricity generation in $/unit electricity
• I0: Investment costs in $
• At: Annual total costs in $ in each year t
• Qel: Amount of electricity generated
• i: Discount interest rate in %
• n: useful economic life
• t: year during the useful life (1, 2, …n)6
2. LCOE SENSITIVITY OFPV PROJECTS
Worked example:
7
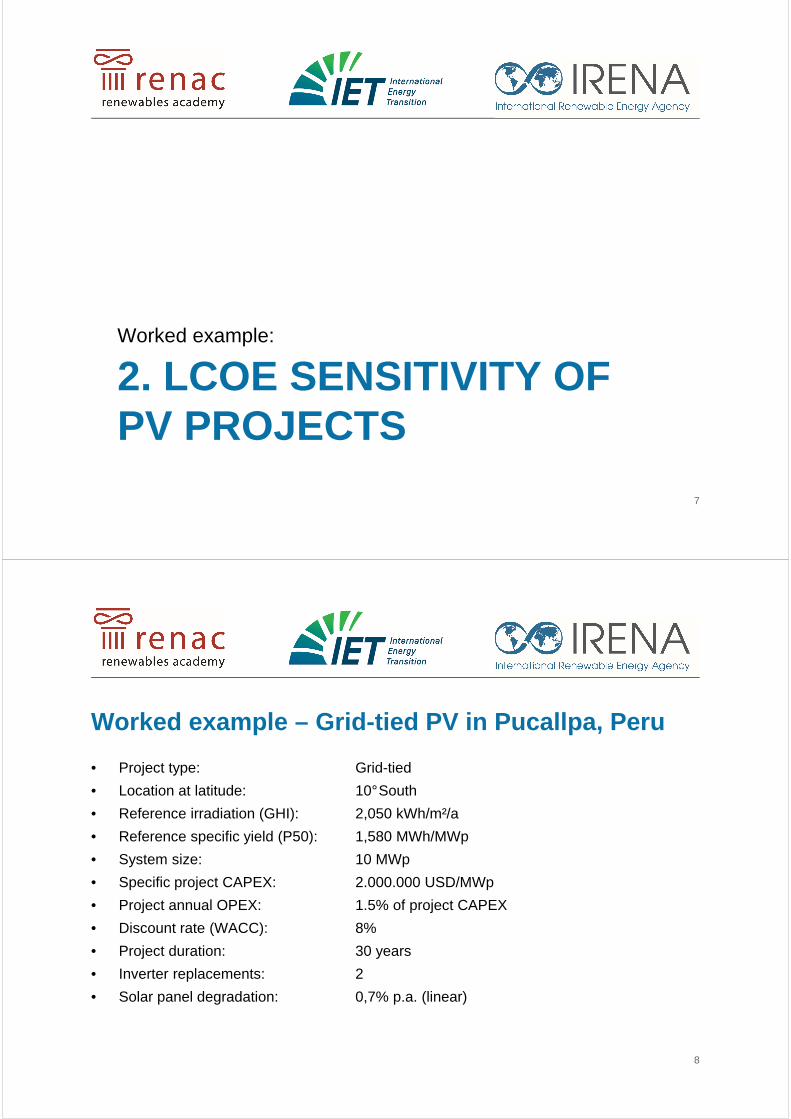
Worked example – Grid-tied PV in Pucallpa, Peru
• Project type: Grid-tied
• Location at latitude: 10°South
• Reference irradiation (GHI): 2,050 kWh/m²/a
• Reference specific yield (P50): 1,580 MWh/MWp
• System size: 10 MWp
• Specific project CAPEX: 2.000.000 USD/MWp
• Project annual OPEX: 1.5% of project CAPEX
• Discount rate (WACC): 8%
• Project duration: 30 years
• Inverter replacements: 2
• Solar panel degradation: 0,7% p.a. (linear)
8
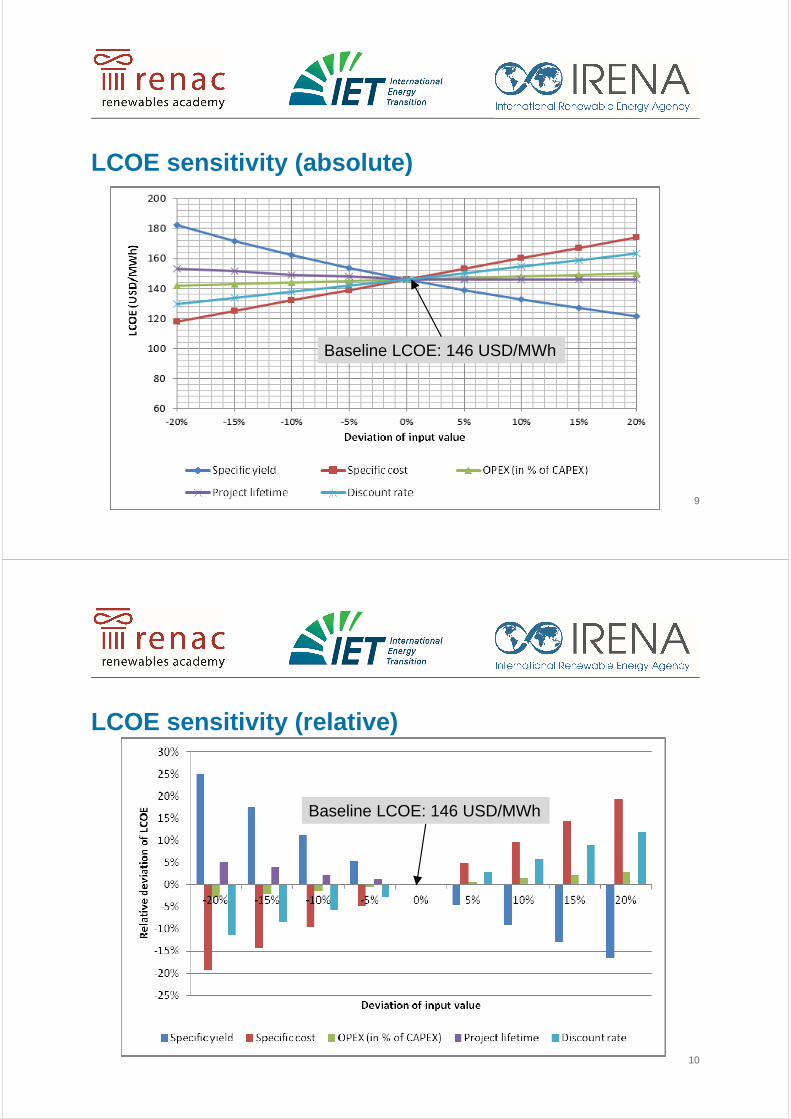
LCOE sensitivity (absolute)
9
Baseline LCOE: 146 USD/MWh
LCOE sensitivity (relative)
10
Baseline LCOE: 146 USD/MWh

3. LCOE SENSITIVITY OFWIND PROJECTS
Worked example:
11
Worked example – Grid-tied wind project Egypt (variation A)• Project type: Grid-tied wind
• Location: Peru / South of Lima
• Average wind speed @ 80m: 7.3 m/s
• Wind distribution, shape parameter: 3.5
• Wind distr., scale parameter: 8.11
• Technical availability: 97%
• Reference specific yield (P50): 3,202 MWh/MW (techn. availability considered)
• Capacity factor: 36.6%
• System size: 8 MW (4 turbines)
• Specific project CAPEX: 4.000.000 USD per turbine
• Project annual OPEX: 3.0% of project CAPEX
• Discount rate (WACC): 8%
• Project duration: 20 years12
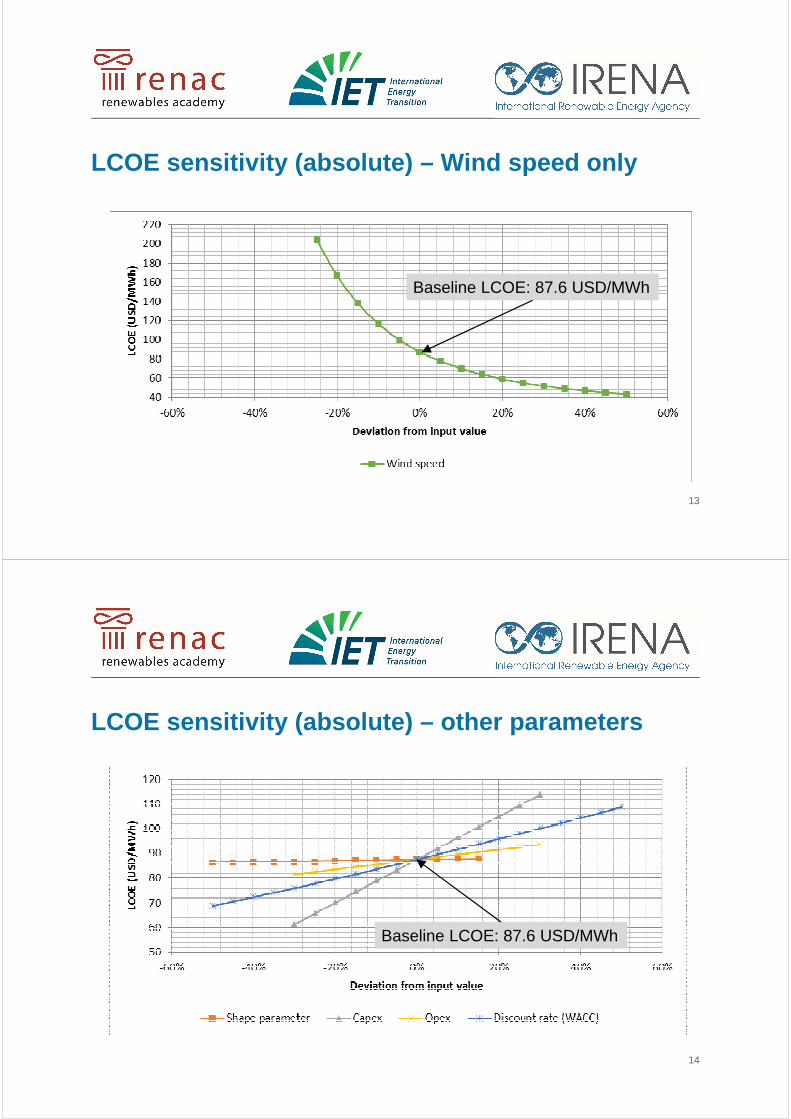
LCOE sensitivity (absolute) – Wind speed only
13
Baseline LCOE: 87.6 USD/MWh
LCOE sensitivity (absolute) – other parameters
14
Baseline LCOE: 87.6 USD/MWh
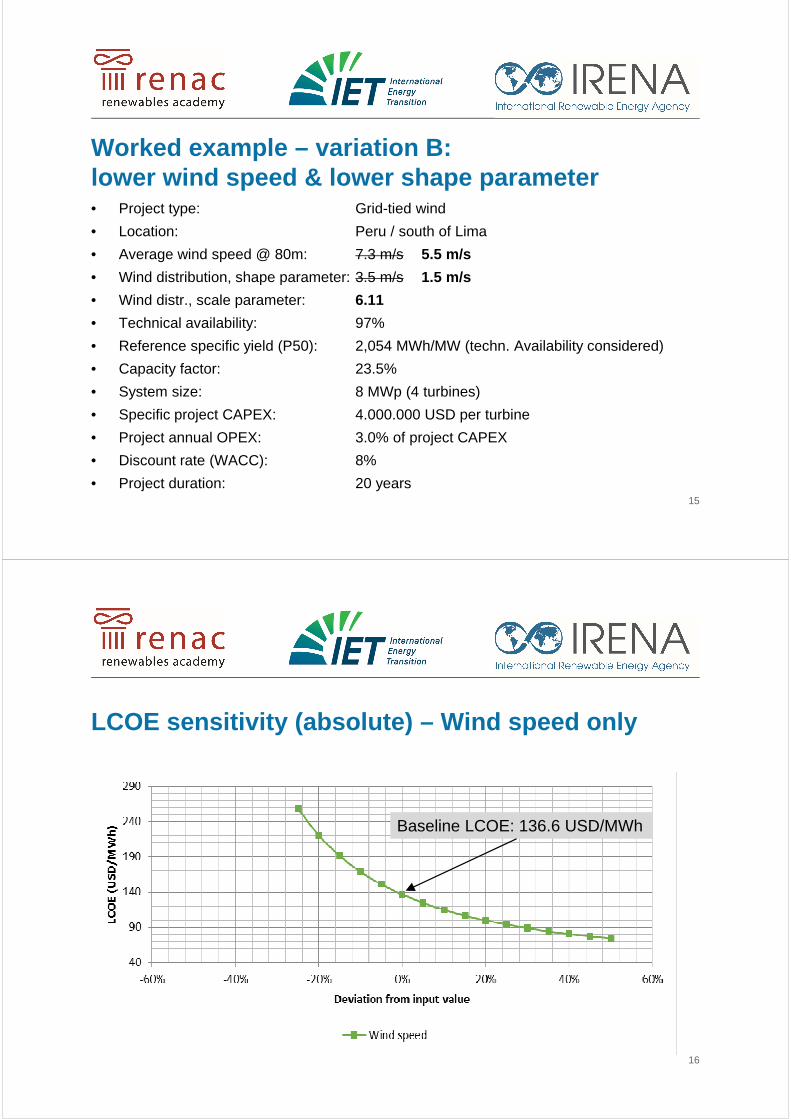
Worked example – variation B: lower wind speed & lower shape parameter• Project type: Grid-tied wind
• Location: Peru / south of Lima
• Average wind speed @ 80m: 7.3 m/s 5.5 m/s
• Wind distribution, shape parameter: 3.5 m/s 1.5 m/s
• Wind distr., scale parameter: 6.11
• Technical availability: 97%
• Reference specific yield (P50): 2,054 MWh/MW (techn. Availability considered)
• Capacity factor: 23.5%
• System size: 8 MWp (4 turbines)
• Specific project CAPEX: 4.000.000 USD per turbine
• Project annual OPEX: 3.0% of project CAPEX
• Discount rate (WACC): 8%
• Project duration: 20 years15
LCOE sensitivity (absolute) – Wind speed only
16
Baseline LCOE: 136.6 USD/MWh

LCOE sensitivity (absolute) – other parameters
17
Baseline LCOE: 136.6 USD/MWh
Shape parameter more sensitive!!!
Conclusions on sensitivities and for scenario development• Variations of the shape factor of the Weibull distribution of wind can have very different
effects depending on the chosen scenario
� In variation A (high wind, high shape factor), varying of the shape factor only had a
very little effect on the LCOE.
� In variation B (lower wind, lower shape factor), varying of the shape factor had a
considerable effect on the LCOE.
� Reason : The chosen wind turbine for the scenario has a power curve which
operates better under weaker winds.
� It is crucial for wind scenario developments, to chose appropriate turbines for sites
with different wind speeds and wind speed distributions.
18
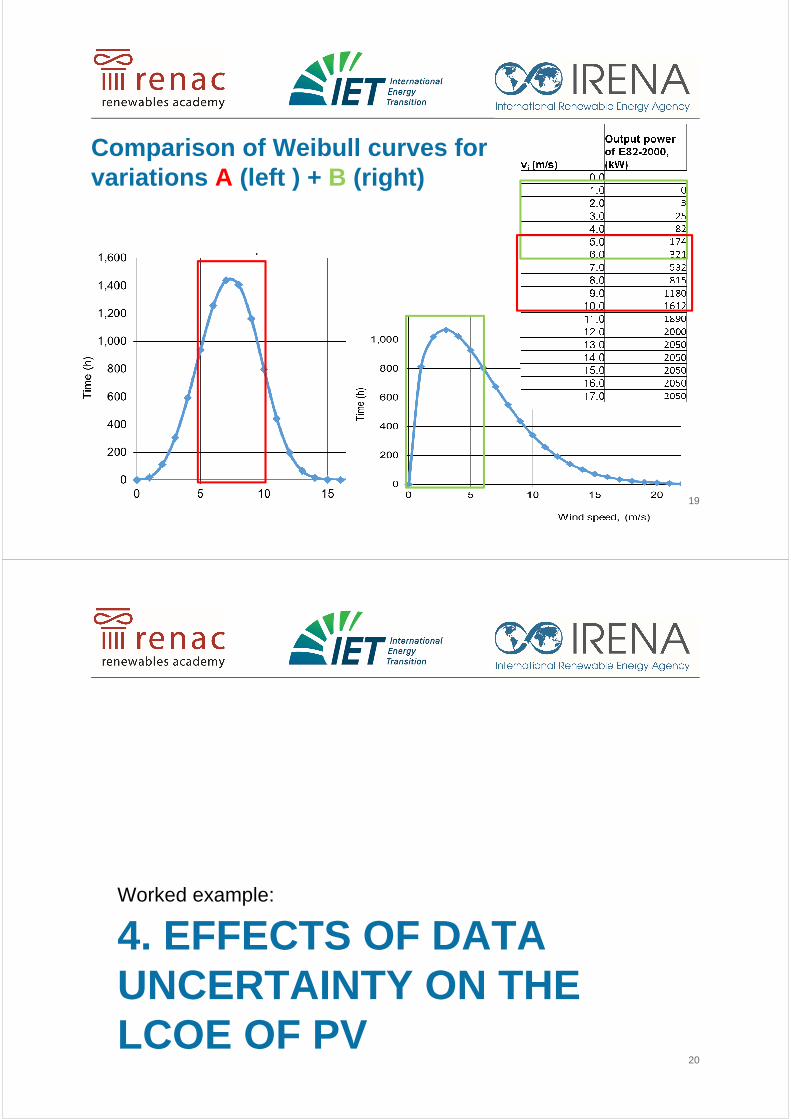
Comparison of Weibull curves for variations A (left ) + B (right)
19
4. EFFECTS OF DATAUNCERTAINTY ON THE LCOE OF PV
Worked example:
20

Why data quality is so important
• All data comes with uncertainties :
� Measurements are always subject to deviations, and ,
� models used for predictions can never simulate what happens in reality.
• It is obvious that the lower uncertainty is the more accurate predictions will be. This, in
turn, will enable us to make better estimates .
• In the following, we will demonstrate how good data (i.e. data with low uncertainties) will
potentially help saving funds for PV Power Purchase Agreements.
21
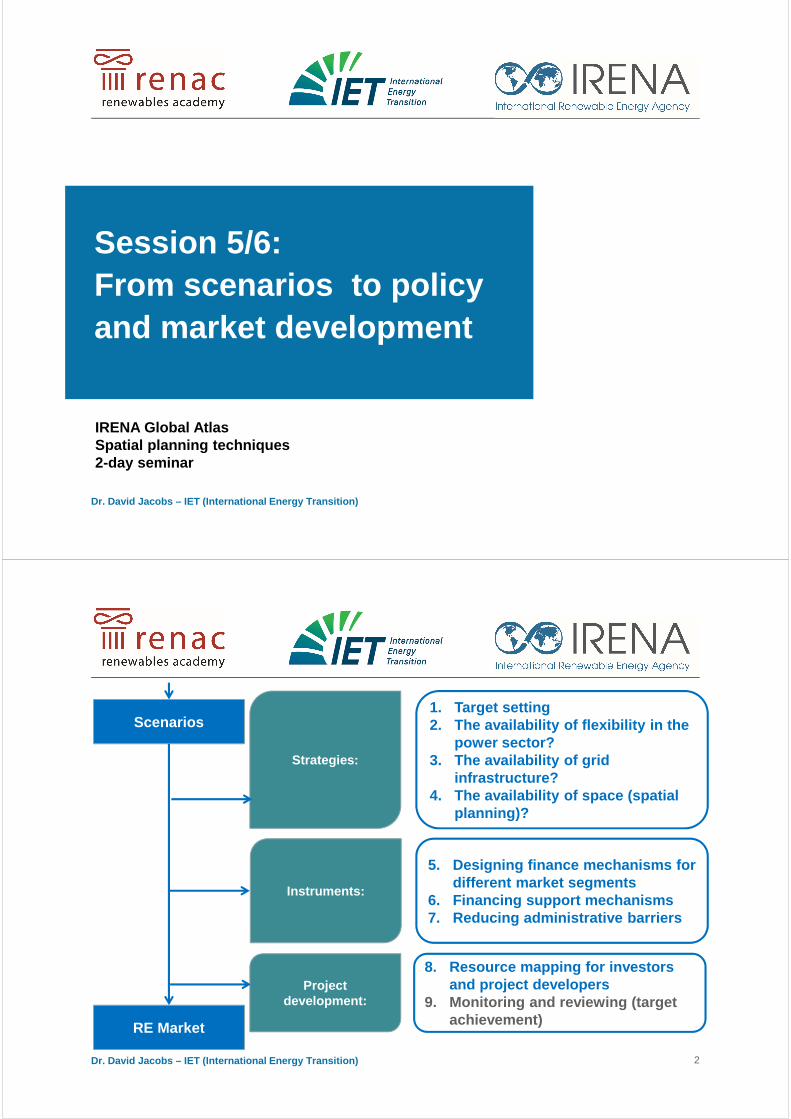
Uncertainty assumptions
• Low resolution NASA SSE data: +/- 13,7%
• Average Meteonorm 7 data: +/- 7,5%
• Best ground measurement at site: +/- 3,0%
• Important note : Besides uncertainty of irradiation data, there is also uncertainty within
the simulation model and nameplate capacity. However, the latter are comparably small
so that we will, to keep the example simple, only look at resource uncertainty. In real-life,
when it comes to detailed project development, one should always ask the project
developer to provide information about his uncertainty assumptions.
22
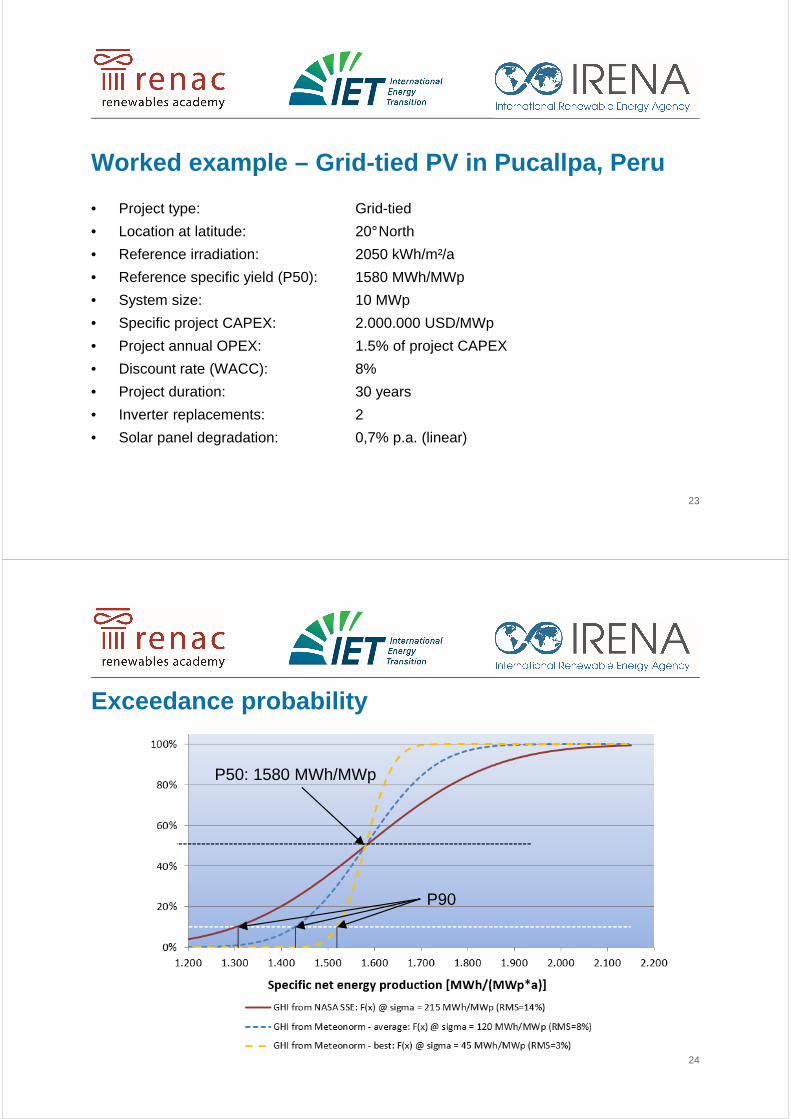
Worked example – Grid-tied PV in Pucallpa, Peru
• Project type: Grid-tied
• Location at latitude: 20°North
• Reference irradiation: 2050 kWh/m²/a
• Reference specific yield (P50): 1580 MWh/MWp
• System size: 10 MWp
• Specific project CAPEX: 2.000.000 USD/MWp
• Project annual OPEX: 1.5% of project CAPEX
• Discount rate (WACC): 8%
• Project duration: 30 years
• Inverter replacements: 2
• Solar panel degradation: 0,7% p.a. (linear)
23
Exceedance probability
24
P50: 1580 MWh/MWp
P90

LCOE depends on quality of meteo data
25
LCOE is key factor for PPA tariff calculation
• Assuming a 10% premium on the LCOE as margin for IPP
� Best case: 152 USD/MWh +10% = 167 USD/MWh
� Worst case: 177 USD/MWh +10% = 195 USD/MWh
� Delta: 28 USD/MWh (incl. 10% premium)
26

Country sets a 5% PV goal by 2020
• Sample: Peru
• Total electricity demand 2010: 37 TWh (Source: Google Public Data)
• 5% of total: 1.85 TWh
• PPA tariff difference: 28 USD/MWh
• „Unnecessary“ payments in 2020: 1,850,000 MWh * 28 USD/MWh =51.8 Mio USD
• PV power needed: 1,200 MWp (with best P90 value)
27
„Unnecessary“ payments due to inaccurate data• PV power needed by 2020: 1,200 MWp (with best P90 value)
• Avoidable payments: 155 Mio USD
28

29
© R
EN
AC
201
4
Irradiation on tilted plane (Wh/m²/a)
Energy generation costs at specific site (€/Wh)
Conversion horizontal solar radiation to optimally tilted plane
Optimal tilt angle
Energy output calculation
Pre-conversion losses
Conversion losses
System losses (%)
CAPEX
OPEX
WACC
Life time
Economic parameters (PV plant and grid connection)
Annual energy prod. (Wh/km2/a)PV capacity per area (W/km2) C
AP
EX
= C
apita
l exp
endi
ture
, OP
EX
= O
pera
tion
expe
nditu
re, W
AC
C =
Wei
ghte
d av
erag
e co
st o
f ca
pita
l (de
bt, e
quity
)
Areas potentially suitable for PV systems (km2) Site assessment (solar atlas data, solar radiation (kWh/m²/a); open-land and settlements (roofs)
Exclusion of non-suitable areas
Nature conservation areas
Exclusion of non-suitable built-up areas (i.e. non-suitable roofs)
Transport, supply and communication infrastructure; very remote areas
Areas technically not suitable (high slope and above certain altitude, etc.)
Landscape, historic area, other non-usable land (glaciers, rivers, roads etc.)
Areas potentially suitable for PV systems (km2)
Priority areas for PV (km2), potentially installed capacity (W), potentially
generated energy (Wh/a) and costs
Energy policy analysis
Economic assessment
Perform
ance Ratio
donedone done
Thank you very much for your attention!
Lars KoernerRenewables Academy (RENAC)Phone +49 30 52 689 [email protected]
Dr. David Jacobs – IET (International Energy Transit ion)
Session 5/6: From scenarios to policy and market development
IRENA Global AtlasSpatial planning techniques 2-day seminar
Dr. David Jacobs – IET (International Energy Transit ion) 2
Scenarios
RE Market
Strategies:
1. Target setting 2. The availability of flexibility in the
power sector? 3. The availability of grid
infrastructure? 4. The availability of space (spatial
planning)?
Instruments:
5. Designing finance mechanisms for different market segments
6. Financing support mechanisms7. Reducing administrative barriers
Project development:
8. Resource mapping for investors and project developers
9. Monitoring and reviewing (target achievement)
Dr. David Jacobs – IET (International Energy Transit ion)
Resource assessment and target setting
Dr. David Jacobs – IET (International Energy Transit ion)
The relation between resource mapping and target setting • Mapping results into availability of information on amount of available
resource and suitable areas
• Policymakers are enabled to set targets based on available resources
• HOWEVER: Resource mapping is only the first step:
� Limiting factors need to be taken into consideration to elaborate the
the economic potential
4

Dr. David Jacobs – IET (International Energy Transit ion)
From technical potential economic potential
5
Source: http://www.wbgu.de/fileadmin/templates/dateien/veroeffentlichungen/hauptgutachten/jg2003/wbgu_jg2003_engl.pdf
Dr. David Jacobs – IET (International Energy Transit ion)
From technical potential economic potential
6Source: Desertec Foundation 2009, http://www.desertec.org/fileadmin/downloads/DESERTEC-WhiteBook_en_small.pdf
Dr. David Jacobs – IET (International Energy Transit ion)
Questions
7
How did you set targets for
renewables in your country?
Did you analyse the available
resources first?
Dr. David Jacobs – IET (International Energy Transit ion)
Questions
8
How did you set targets for
renewables in your country?
Did you analyse the available
resources first? What were the reasons
objectives/reasons for setting
renewable energy targets in
your country?

Dr. David Jacobs – IET (International Energy Transit ion)
Objectives for setting renewable energy targets
• Make use of existing, national resources (Increasing energy security)
• Diversifying the fuel mix
• Reducing fossil fuel consumption (for both importers and exporters)
• Improving energy access
• Mitigating climate change and other environmental risks (fuel spills)
• Macro-economic benefits (i.e., job creation)
• Increasing private sector investment
9
Source: E3 Analytics, Toby Couture
Dr. David Jacobs – IET (International Energy Transit ion)
How to integrate target setting for renewables into integrated resource planning?
• What is the target function in your country for determining the optimal
electricity mix?
� least cost planning?
� Industry policy?
� Security of supply?
� Energy access?
� Climate policy?
10

Dr. David Jacobs – IET (International Energy Transit ion)
Renewable energy targets
11
• More countries are setting policy targets for renewable energy:
� 144 countries with targets as of 2013
• Countries are also enacting support policies to ensure fulfillment of
the target:
� 138 countries as of 2013
Source: REN21 Global Status Report (GSR) 2014
Dr. David Jacobs – IET (International Energy Transit ion)
Target characteristics
12
• Decision parameters for setting RE targets:
Option 1: Technology Neutral (generic RE target) vs. Technology
Differentiated (wind, solar, biomass, etc.)
Option 2: Short-term targets versus long-term target (harvest the low
hangging fruits first?)
Option 3: National targets versus regional planning (locational signals for
harvesting renewables in different “hot spots”?)

Dr. David Jacobs – IET (International Energy Transit ion)
How to Set Targets after Resource Assessment
Establishing targets requires a few essential components:
1. Identify resources – theoretical/technical potential
2. Identifying constraints (e.g. grid capacity, available land, financial
resources, etc.) – derive the economic potential
3. Substract areas dedicated to natural protection – ecological
potential
4. Model the current and future electricity mix – feasible level of
system integration of wind and PV? Cost effects?
Come up with the realizable potential and translate this into targets!
Dr. David Jacobs – IET (International Energy Transit ion)
Experience from emerging markets:
The rationale for target setting in Saudi Arabia
Dr. David Jacobs – IET (International Energy Transit ion)
Renewable energy programs in Saudi Arabia – identify ing the best locations
• The Kingdom of Saudi Arabia targets a newly installed renewable energy
capacity of 54 GW by 2032
• Rationale:
� cost savings (oil)
� technological leadership
� climate protection
� energy access
15
Source: KA-Care, https://www.irena.org/DocumentDownloads/masdar/Abdulrahman%20Al%20Ghabban%20Presentation.pdf
Dr. David Jacobs – IET (International Energy Transit ion)
Renewable energy programs in Saudi Arabia –Target setting approach
• Technology specific targets (for better system integration and
industrial policy)
� PV: 16 GW
� CSP: 25 GW
� Wind: 9 GW
� Waste-to-Energy: 3 GW
� Geothermal: 1 GW
16
Source: KA-Care, https://www.irena.org/DocumentDownloads/masdar/Abdulrahman%20Al%20Ghabban%20Presentation.pdf
Dr. David Jacobs – IET (International Energy Transit ion)
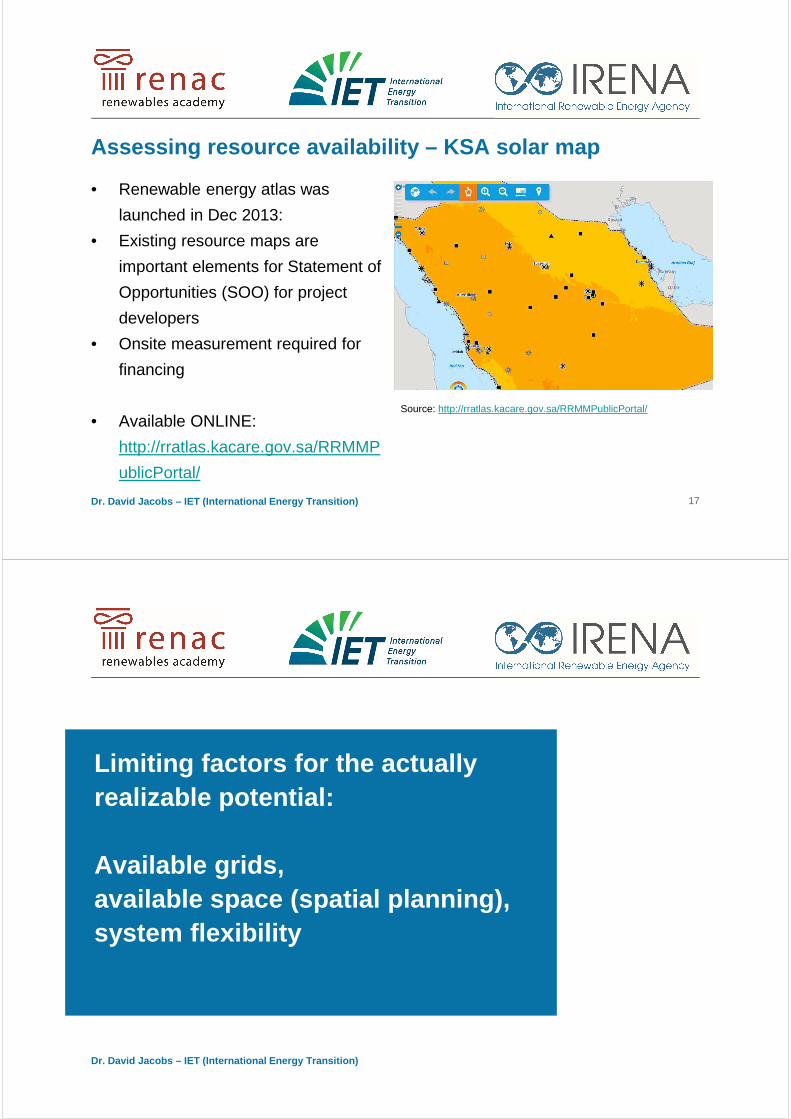
Assessing resource availability – KSA solar map
• Renewable energy atlas was
launched in Dec 2013:
• Existing resource maps are
important elements for Statement of
Opportunities (SOO) for project
developers
• Onsite measurement required for
financing
• Available ONLINE:
http://rratlas.kacare.gov.sa/RRMMP
ublicPortal/
17
Source: http://rratlas.kacare.gov.sa/RRMMPublicPortal/
Dr. David Jacobs – IET (International Energy Transit ion)
Limiting factors for the actually realizable potential:
Available grids, available space (spatial planning),system flexibility
Dr. David Jacobs – IET (International Energy Transit ion)
The relation between resource mapping limiting factors (grid, space, flexibility)
• To derive the actually realizable potential from the theoretical/technical
potential requires an analysis of all limiting factors
� The availability of grid infrastructure
� The availability of space (spatial planning and protected areas)
� The technical potential of the electricity system to absorb
fluctuating renewables (wind and solar)
19
Dr. David Jacobs – IET (International Energy Transit ion)
Availability of grid infrastructure?
Using the existing grid, expanding the grid or developing renewables off-grid

Dr. David Jacobs – IET (International Energy Transit ion)
Least cost grid expansion plan in Rwanda
• Grid expansion is a crucial component for rural electrification
• However, costs of transmission, distribution, and oil have gone up; costs of off-grid
solutions have come down
�
21
Source: World Bank http://siteresources.worldbank.org/EXTAFRREGTOPENERGY/Resources/717305-1327690230600/8397692-1327691237767/DAKARHVI_AEI_Practitioner_WorkshopNov14-15_2011_Nov7.pdf
Dr. David Jacobs – IET (International Energy Transit ion)
Rule of thumb for rural electrification and technology choice
� Due to dramatic reductions in PV costs
in the past years, PV mini-grids are a
viable alternatives to grid extension and
diesel mini-grids.
� The LCOE will generally be competitive
with that of grid extension when the
extension would imply less than 10
connections/km.
� Obstacles: the need for upfront
financing, ensuring proper maintenance,
etc.
22
Source: Norplan 2012

Dr. David Jacobs – IET (International Energy Transit ion)
Rule of thumb for rural electrification and technology choice
� Several factors influence the viability of off-grid solutions, including mini-
grids, solar-home-systems and hybrid systems, e.g. the level of market
penetration, transport cost for equipment, etc.
� The rules-of-thumb are fairly sensitive to the assumed consumption per
household (50kWh /HH/month).
• If lower, the number of connections would have to be higher to
justify grid extension.
• If higher, grid connection might already make sense with less
connections
23
Source: Norplan 2012
Dr. David Jacobs – IET (International Energy Transit ion)
Questions
24
What decision parameters do
you apply in your country for
grid expansion of off-grid
solutions?

Dr. David Jacobs – IET (International Energy Transit ion)
The availability of grid infrastructure
Anticipating required grid expansion to reach ambitious long-term targets (lessons learned from Germany)
Dr. David Jacobs – IET (International Energy Transit ion)
Insufficient grid capacity
• Insufficient grid capacity for new projects due to underdeveloped
grid infrastructure?
• Originally designed for conventional, centralized power system –
no grid at best locations for renewables?
• National grid extension plans has to be prepared (well in
advance!)

Dr. David Jacobs – IET (International Energy Transit ion)
Grid extension plans in Germany
� Transport renewable electricity from the
North (onshore and offshore wind) to the
load centers in the South
� Distribution grid upgrade:
• Most renewable energy projects in
Germany are connected to the
distribution grid
• High shares of renewables (PV) in
Bavarian distribution grids
• Bi-directional transformer stations
NEP 2013, Stand: Juli 2013 www.netzentwicklungsplan.de
Dr. David Jacobs – IET (International Energy Transit ion)
Grid expansion for the German Energiewende
• Part of European grid integration
process (TEN-E)
• Grid development plan for new
electricity lines from 2013
� 2,800 km of new transmission
lines
� 2,900 km of grid upgrades
28

Dr. David Jacobs – IET (International Energy Transit ion)
• 10-year network development plan
from ENTSO-e
• The latest report pinpoints about 100
spots on the European grid where
bottlenecks exist or may develop in
the future
• Transmission adequacy by 2030?
• Full market coupling with European
neigbours (e.g. one merit order for
Germany and Austria).
The expansion of the European transmission grid
Source: ENTSO-e 2014
Dr. David Jacobs – IET (International Energy Transit ion)
Stakeholder engagement
30
In how far are citizens and other
concerned actors involved in the
planning and siting process for
energy infrastructure in your
country? Is there a trade-off between quick
planning (and execution) of projects
and stakeholder engagement?
Dr. David Jacobs – IET (International Energy Transit ion)
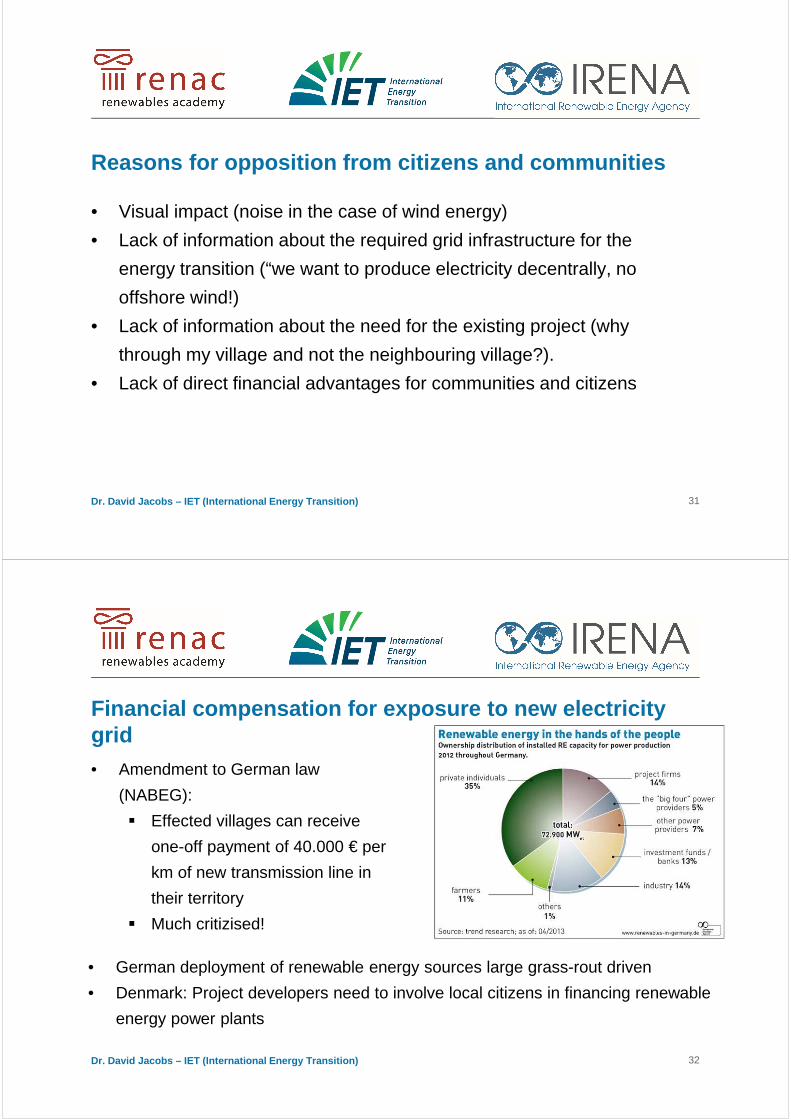
Reasons for opposition from citizens and communities
• Visual impact (noise in the case of wind energy)
• Lack of information about the required grid infrastructure for the
energy transition (“we want to produce electricity decentrally, no
offshore wind!)
• Lack of information about the need for the existing project (why
through my village and not the neighbouring village?).
• Lack of direct financial advantages for communities and citizens
31
Dr. David Jacobs – IET (International Energy Transit ion)
Financial compensation for exposure to new electric ity grid • Amendment to German law
(NABEG):
� Effected villages can receive
one-off payment of 40.000 € per
km of new transmission line in
their territory
� Much critizised!
32
• German deployment of renewable energy sources large grass-rout driven
• Denmark: Project developers need to involve local citizens in financing renewable
energy power plants
Dr. David Jacobs – IET (International Energy Transit ion)
New transmission technologies: underground cable
• Underground solutions are being discussed in more densely
populated areas
• more expensive than above-ground options (factor 3-10)
� more costly insulation is used
� more complex equipment
� larger cables are needed
33
Dr. David Jacobs – IET (International Energy Transit ion)
The availability of grid infrastructure
Which grid connection charging approach fits with your grid expansion plan?
Dr. David Jacobs – IET (International Energy Transit ion)
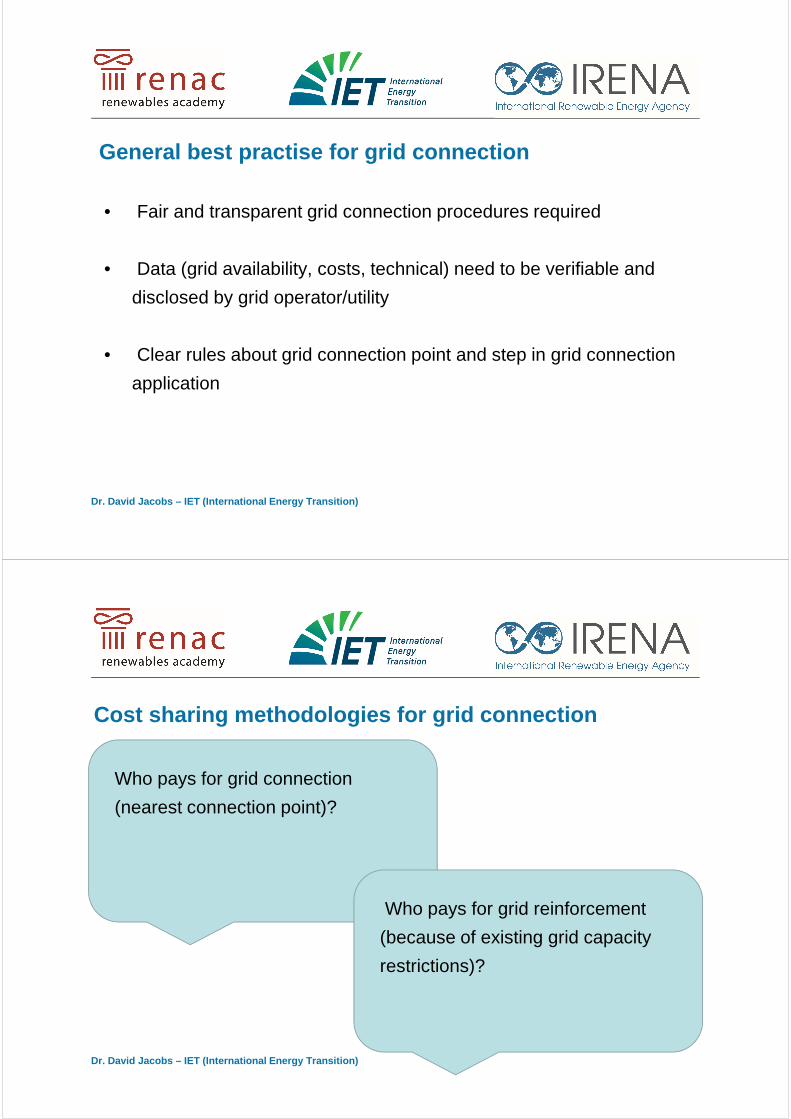
General best practise for grid connection
• Fair and transparent grid connection procedures required
• Data (grid availability, costs, technical) need to be verifiable and
disclosed by grid operator/utility
• Clear rules about grid connection point and step in grid connection
application
Dr. David Jacobs – IET (International Energy Transit ion)
Cost sharing methodologies for grid connection
Who pays for grid connection
(nearest connection point)?
Who pays for grid reinforcement
(because of existing grid capacity
restrictions)?

Dr. David Jacobs – IET (International Energy Transit ion)
Grid connection costs for different renewable energ y technologies
Source: Auer et al. 2007, http://greennet.i-generation.at/files/Report%20on%20Synthesis%20of%20Results%20on%20RES-E%20Grid%20Integration%20%28D11%20GreenNet-EU27%29.pdf
Dr. David Jacobs – IET (International Energy Transit ion)
Distribution and transmission grid reinforcement
Source: Auer et al. 2007, http://greennet.i-generation.at/files/Report%20on%20Synthesis%20of%20Results%20on%20RES-E%20Grid%20Integration%20%28D11%20GreenNet-EU27%29.pdf
Dr. David Jacobs – IET (International Energy Transit ion)
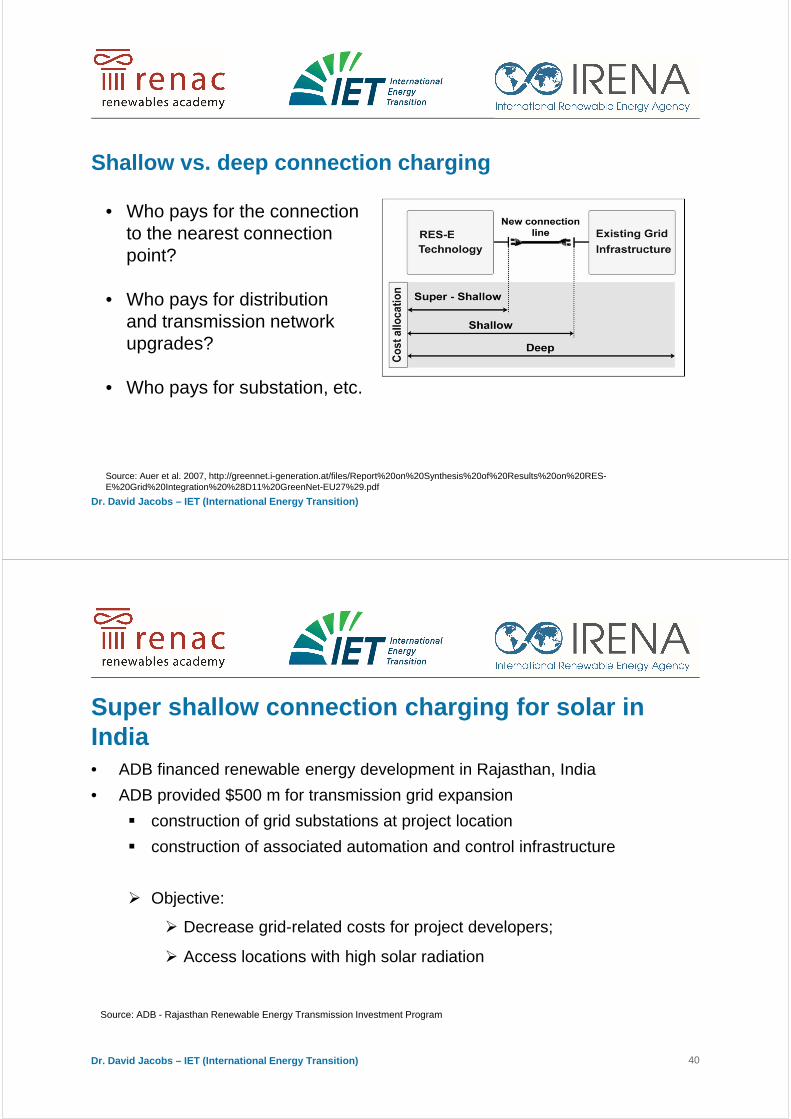
Shallow vs. deep connection charging
Source: Auer et al. 2007, http://greennet.i-generation.at/files/Report%20on%20Synthesis%20of%20Results%20on%20RES-E%20Grid%20Integration%20%28D11%20GreenNet-EU27%29.pdf
• Who pays for the connection to the nearest connection point?
• Who pays for distribution and transmission network upgrades?
• Who pays for substation, etc.
Dr. David Jacobs – IET (International Energy Transit ion)
Super shallow connection charging for solar in India• ADB financed renewable energy development in Rajasthan, India
• ADB provided $500 m for transmission grid expansion
� construction of grid substations at project location
� construction of associated automation and control infrastructure
� Objective:
� Decrease grid-related costs for project developers;
� Access locations with high solar radiation
40
Source: ADB - Rajasthan Renewable Energy Transmission Investment Program

Dr. David Jacobs – IET (International Energy Transit ion)
The availability of space
Spatial planning and the deployment of renewables
Dr. David Jacobs – IET (International Energy Transit ion)
Spatial planning: Introductory questions
42
Who is responsible for spatial
planning (national, regional,
local)?
How are (renewable) energy
projects integrated into spatial
planning legislation?
Is there competition for limited
space?
Dr. David Jacobs – IET (International Energy Transit ion)
General approach:
• Clarify responsibilities for spatial planning (interplay between regional level and
national planning programs)
• Identify areas which are definitely excluded from building renewable energy
projects (matrimonial heritage sites, natural parks, etc.).
• Identify areas which might be potentially excluded (environmentally and
culturally sensitive areas) or where there is potential competition with other
infrastructure development
43
Dr. David Jacobs – IET (International Energy Transit ion)
General approach – densely populated countries
• In densely populated countries:
� Determine the minimum distance of renewable energy projects from cities,
villages, houses, industrial complexes
� Reserve space for the future development of renewable energy projects
(especially in areas with high resource potential).
� Define the role of renewables in spatial planning (see case study
Germany)
44

Dr. David Jacobs – IET (International Energy Transit ion)
Spatial planning in Germany
45
• Complex interplay of planning legislation at national (Raumordnungsgesetz),
regional (Landesplanungsgesetze) and community level (Baugesetzbuch).
• Typical planning process:
� Spatial development plan from local government
� First planning draft from local planning authority
� In parallel: First draft for environmental impact assessment
� Start of first participation phase (written comments from citizens on
planned project)
http://www.kommunal-erneuerbar.de/fileadmin/content/PDF/62_Renews_Spezial_Planungsrecht_online.pdf
Dr. David Jacobs – IET (International Energy Transit ion)
Spatial planning in Germany
46
• Typical planning process (continued):
� Comments from citizens and other actors are included an first planning
draft is presented
� In parallel: Environmental Impact Assessment from responsible authority
� Start of second participation phase (at least one month for further
comments)
� Followed by weighting whether stakeholder statements should be
incorporated (if yes, another round of stakeholder participation is
necessary).
� Next step: crucial phase of approval process (approval from a higher
ranking planning level, e.g. regional or national).
http://www.kommunal-erneuerbar.de/fileadmin/content/PDF/62_Renews_Spezial_Planungsrecht_online.pdf

Dr. David Jacobs – IET (International Energy Transit ion)
Spatial planning in Germany – Land use plans
47
• Land use plans include:
� Determination of general spatial structure (settlements, free zones,
infrastructure such as streets, energy, industrial areas).
� Optional implementation of so-called special area classes
(Sondergebietsklassen)
http://www.kommunal-erneuerbar.de/fileadmin/content/PDF/62_Renews_Spezial_Planungsrecht_online.pdf
Dr. David Jacobs – IET (International Energy Transit ion)
Spatial planning in Germany – Indicated Areas
48
• Implementation of “Indicated Areas” (Sondergebietsklasse) for wind energy in
1995 accelerated market development
Indicated Area, here it is allowed to build wind energy
Here it is forbidden to build wind energy
Source: http://www.unendlich-viel-energie.de/mediathek/hintergrundpapiere/planungsrecht-und-erneuerbare-energien

Dr. David Jacobs – IET (International Energy Transit ion)
Spatial planning in Germany – Priority Areas
49
• Priority areas lead to exclusion from other spatial planning focuses. In this
areas, only wind energy projects can be realized
Priority Areas, here wind energy need to be build
Theoretically wind can also be build in these areas
Source: http://www.unendlich-viel-energie.de/mediathek/hintergrundpapiere/planungsrecht-und-erneuerbare-energien
Dr. David Jacobs – IET (International Energy Transit ion)
Spatial planning in Germany – The role of communities
50
• Communities have to comply with planning processes at the next higher political level
(regional). However, communities can determine details such as the maximum hight of
wind power plants and the distance to the next settlement
Source: http://www.unendlich-viel-energie.de/mediathek/hintergrundpapiere/planungsrecht-und-erneuerbare-energien

Dr. David Jacobs – IET (International Energy Transit ion)
Spatial planning in Germany – Compensation measures
51
• Re-create and ecological equilibrium via compensation measures
Source: http://www.unendlich-viel-energie.de/mediathek/hintergrundpapiere/planungsrecht-und-erneuerbare-energien
Dr. David Jacobs – IET (International Energy Transit ion)
The availability of system flexibility
Measures to integrate increasing shares of fluctuating renewables

Dr. David Jacobs – IET (International Energy Transit ion)
The relation between resource mapping and system flexibility • The technical potential for renewable energy sources in a give country
is not only limited by the availability of grid infrastructure and space
• The integration of fluctuating renewables might also be limited due to
technical issues (volatility, ramping capability, etc.)
• Therefore, an assessment of various flexibility options in the electricity
system is essential in order to assess the actually realizable potential
53
Dr. David Jacobs – IET (International Energy Transit ion)
• Options for integrating high shares of wind and solar PV
• Grid expansion/integration; smart grid
• Dispatch of conventional power plants • Dispatch and curtailment from renewable energy
sources
• Demand response
• Storage
Creating a flexible power market

Dr. David Jacobs – IET (International Energy Transit ion)
Electricity demand and renewable power generation in Germany in 2022
The electricity market is determined by wind and so lar PV
Source: Agora Energiewende 2012
Dr. David Jacobs – IET (International Energy Transit ion)
• High upfront investment
(capital costs)
• Almost zero marginal costs
• Fluctuating supply (depending
on the weather)
Important features of wind and solar
0%
10%
20%
30%
40%
50%
60%
70%
80%
90%
100%
CCGT Coal Nuclear Wind PV
OPEX
CAPEX
Share of fixed versus variable costs of selected power generation technologies
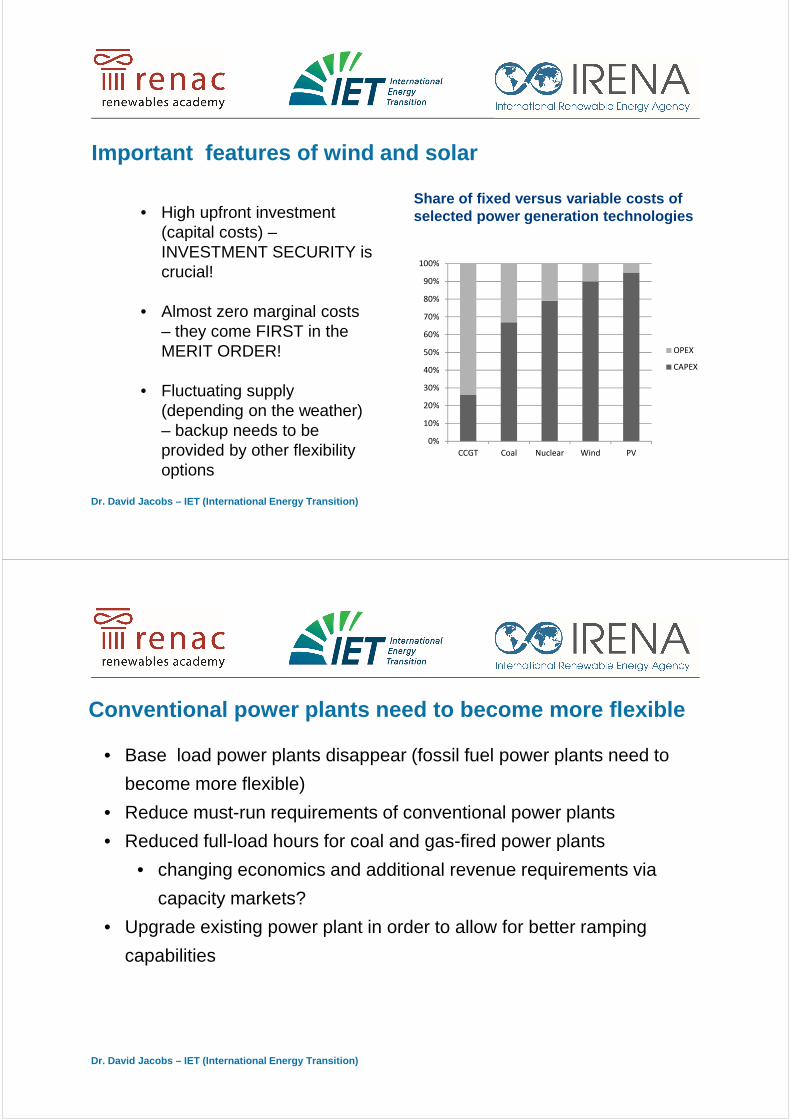
Dr. David Jacobs – IET (International Energy Transit ion)
• High upfront investment (capital costs) –INVESTMENT SECURITY is crucial!
• Almost zero marginal costs – they come FIRST in the MERIT ORDER!
• Fluctuating supply (depending on the weather) – backup needs to be provided by other flexibility options
0%
10%
20%
30%
40%
50%
60%
70%
80%
90%
100%
CCGT Coal Nuclear Wind PV
OPEX
CAPEX
Share of fixed versus variable costs of selected power generation technologies
Important features of wind and solar
Dr. David Jacobs – IET (International Energy Transit ion)
• Base load power plants disappear (fossil fuel power plants need to
become more flexible)
• Reduce must-run requirements of conventional power plants
• Reduced full-load hours for coal and gas-fired power plants
• changing economics and additional revenue requirements via
capacity markets?
• Upgrade existing power plant in order to allow for better ramping
capabilities
Conventional power plants need to become more flexi ble

Dr. David Jacobs – IET (International Energy Transit ion)
Making best use of the existing grid infrastructure:
Net Metering Policy Design
Dr. David Jacobs – IET (International Energy Transit ion)
Simplistic grid parity and “self-consumption”
60
Source: Eclareon 2013
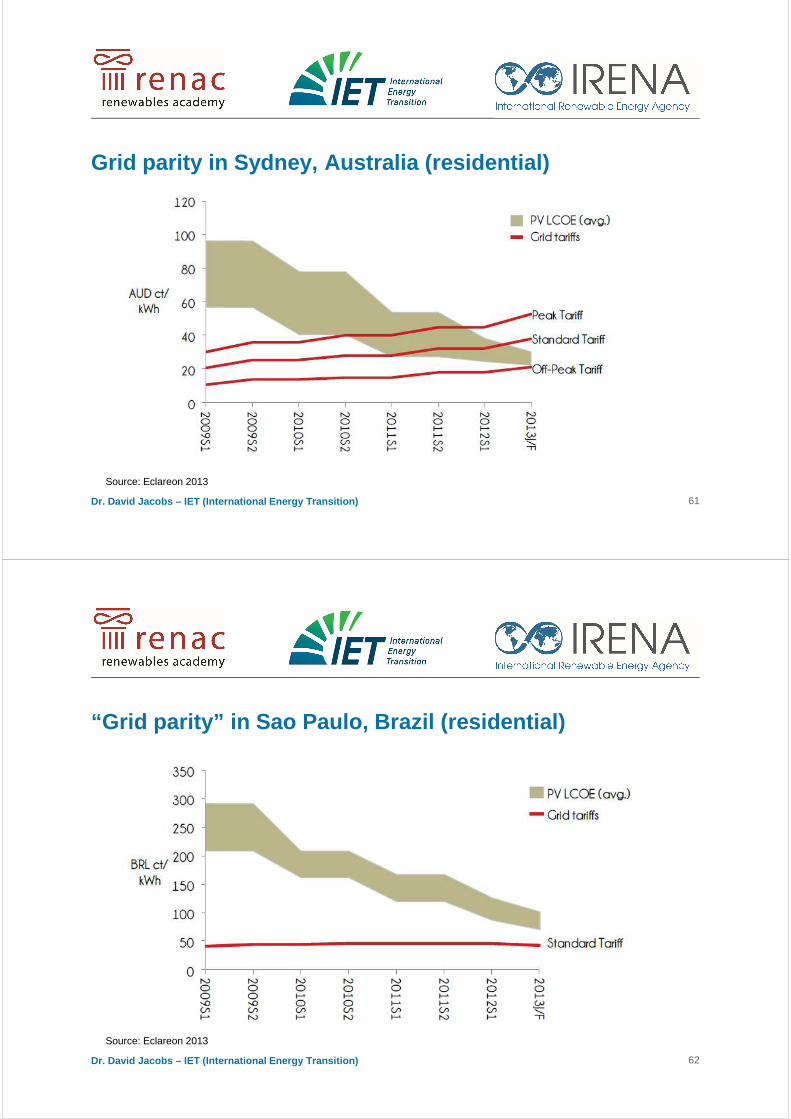
Dr. David Jacobs – IET (International Energy Transit ion)
Grid parity in Sydney, Australia (residential)
61
Source: Eclareon 2013
Dr. David Jacobs – IET (International Energy Transit ion)
“Grid parity” in Sao Paulo, Brazil (residential)
62
Source: Eclareon 2013
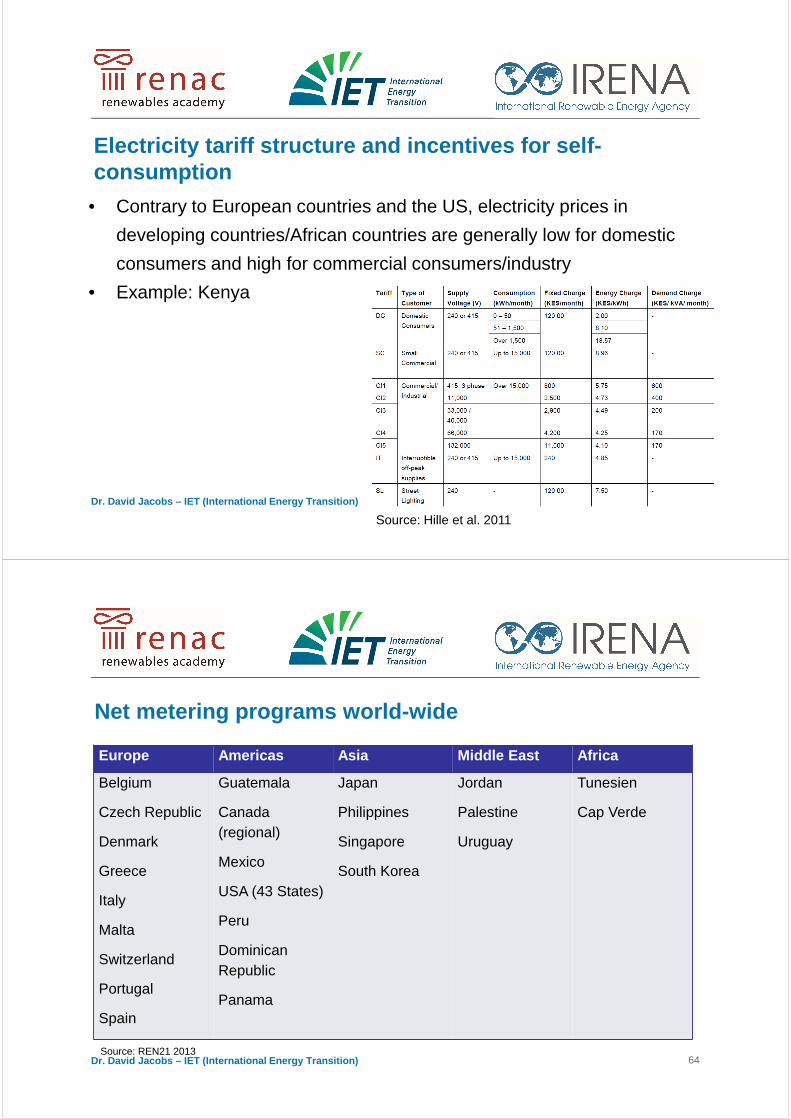
Dr. David Jacobs – IET (International Energy Transit ion)
Electricity tariff structure and incentives for sel f-consumption
• Contrary to European countries and the US, electricity prices in
developing countries/African countries are generally low for domestic
consumers and high for commercial consumers/industry
• Example: Kenya
63
Source: Hille et al. 2011
Dr. David Jacobs – IET (International Energy Transit ion)
Net metering programs world-wide
Europe Americas Asia Middle East Africa
Belgium
Czech Republic
Denmark
Greece
Italy
Malta
Switzerland
Portugal
Spain
Guatemala
Canada (regional)
Mexico
USA (43 States)
Peru
DominicanRepublic
Panama
Japan
Philippines
Singapore
South Korea
Jordan
Palestine
Uruguay
Tunesien
Cap Verde
64Source: REN21 2013
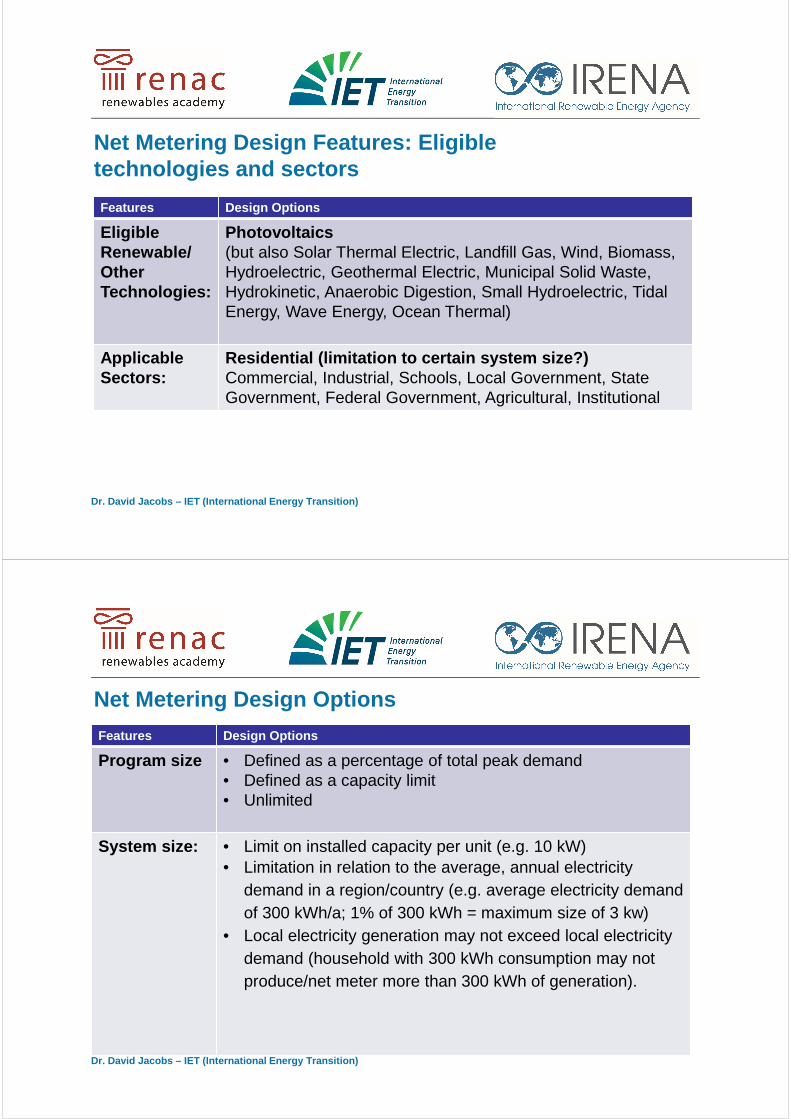
Dr. David Jacobs – IET (International Energy Transit ion)
Net Metering Design Features: Eligible technologies and sectors
Features Design Options
Eligible Renewable/Other Technologies:
Photovoltaics (but also Solar Thermal Electric, Landfill Gas, Wind, Biomass, Hydroelectric, Geothermal Electric, Municipal Solid Waste, Hydrokinetic, Anaerobic Digestion, Small Hydroelectric, Tidal Energy, Wave Energy, Ocean Thermal)
Applicable Sectors:
Residential (limitation to certain system size?)Commercial, Industrial, Schools, Local Government, State Government, Federal Government, Agricultural, Institutional
Dr. David Jacobs – IET (International Energy Transit ion)
Net Metering Design Options
Features Design Options
Program size • Defined as a percentage of total peak demand• Defined as a capacity limit • Unlimited
System size: • Limit on installed capacity per unit (e.g. 10 kW)• Limitation in relation to the average, annual electricity
demand in a region/country (e.g. average electricity demandof 300 kWh/a; 1% of 300 kWh = maximum size of 3 kw)
• Local electricity generation may not exceed local electricitydemand (household with 300 kWh consumption may not produce/net meter more than 300 kWh of generation).

Dr. David Jacobs – IET (International Energy Transit ion)
Roll-over provisions for excess electricity
Features Design Options
Program size • Indefinate• Yearly• Monthly• Hourly
The value of the role over:
• retail price• wholesale price• combinations
Dr. David Jacobs – IET (International Energy Transit ion)
Auto consumptions and the “solidarity”-based electri city system
• Are there major exemptions/privileges for electricity auto-consumption
in your country?
� Grid usage fees?
� Other taxes or levies?
• If industry subsidizes household electricity prices in Africa countries, do
you want them to auto-produce/consume electricity (and no longer pay
the higher industrial/commercial rate?
68
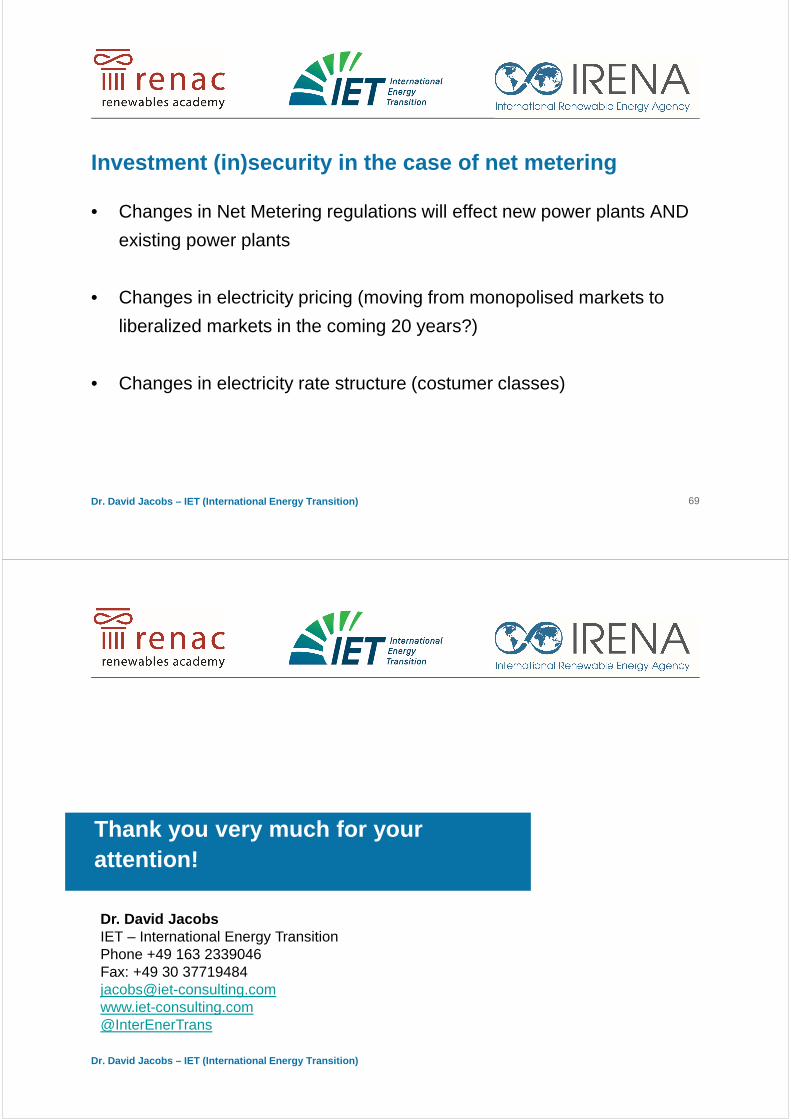
Dr. David Jacobs – IET (International Energy Transit ion)
Investment (in)security in the case of net metering
• Changes in Net Metering regulations will effect new power plants AND
existing power plants
• Changes in electricity pricing (moving from monopolised markets to
liberalized markets in the coming 20 years?)
• Changes in electricity rate structure (costumer classes)
69
Dr. David Jacobs – IET (International Energy Transit ion)
Thank you very much for your attention!
Dr. David JacobsIET – International Energy TransitionPhone +49 163 2339046Fax: +49 30 [email protected]@InterEnerTrans
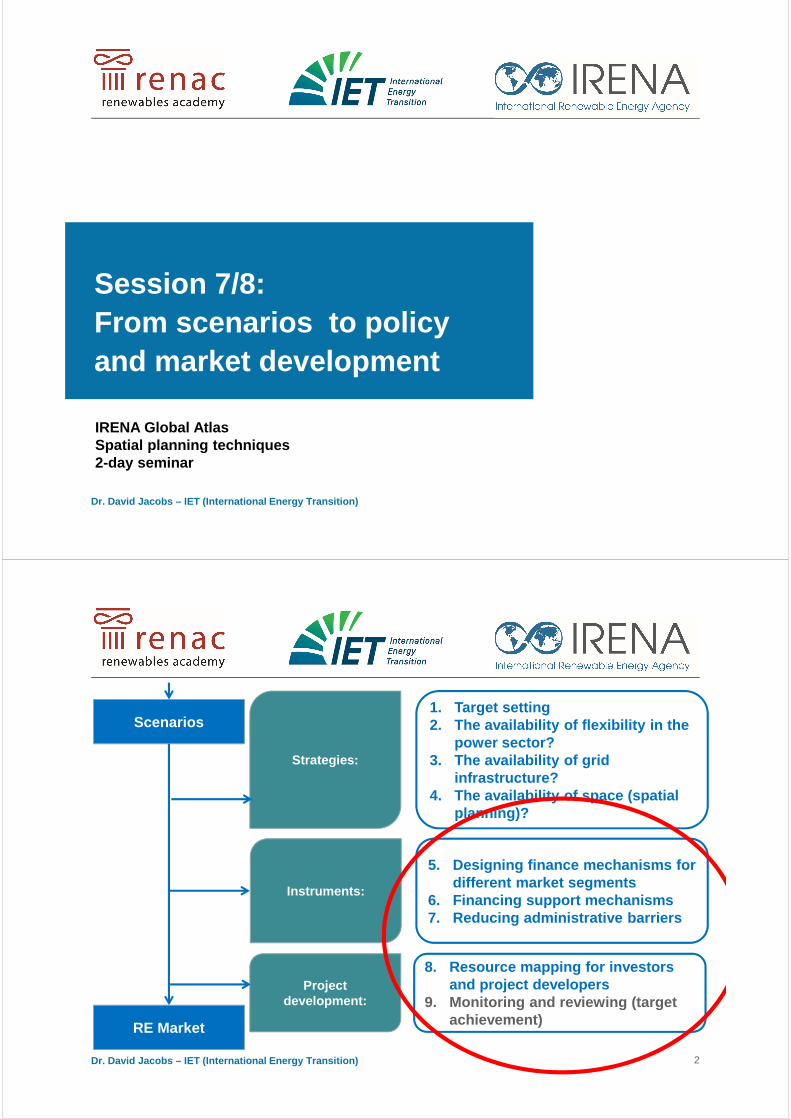
Dr. David Jacobs – IET (International Energy Transit ion)
Session 7/8: From scenarios to policy and market development
IRENA Global AtlasSpatial planning techniques 2-day seminar
Dr. David Jacobs – IET (International Energy Transit ion) 2
Scenarios
RE Market
Strategies:
1. Target setting 2. The availability of flexibility in the
power sector? 3. The availability of grid
infrastructure? 4. The availability of space (spatial
planning)?
Instruments:
5. Designing finance mechanisms for different market segments
6. Financing support mechanisms7. Reducing administrative barriers
Project development:
8. Resource mapping for investors and project developers
9. Monitoring and reviewing (target achievement)

Dr. David Jacobs – IET (International Energy Transit ion)
Establishing political and financial instruments:
Designing finance mechanisms for different market segments
Dr. David Jacobs – IET (International Energy Transit ion)
Overview of support mechanisms for RES-e
SUPPORT MECHANISMS
Price-based support Quantity basedsupport
Investment focussed Investment subsidies
Tax incentives
Generation focused Feed-in tariffs
Net metering
Tax incentives
Tender scheme
Quota obligation (TGC / RPS)

Dr. David Jacobs – IET (International Energy Transit ion)
Custom taxes
• Are there custom taxes for renewable energy equipment?
• If yes, what is the rational?
Pilot projects
• In emerging RE markets:
� Have you started with pilot projects in order to make actors
familiar with renewables (fluctuations, permitting, grid access,
etc.)?
Dr. David Jacobs – IET (International Energy Transit ion)
Local content requirement
• Several countries have introduced local content requirements in
national support mechanisms, i.e. obligations to produce a certain
share of renewable energy equipment locally/nationally (e.g. Spain,
China, India, Argentina - Chubut, Ontario - Canada, Malaysia, Italy)
• These requirements can be implemented in national feed-in tariff
mechanisms� Establish a national renewable energy industry
� Take advantage of positive macro-economic effects
Source: Mendonca et al. 2009
• Problem: potential confliction with international trade rules (WTO)
• Malaysia: Adder for nationally produced equipment:

Dr. David Jacobs – IET (International Energy Transit ion)
From scenarios to instruments:
FIT design and locational signals
Dr. David Jacobs – IET (International Energy Transit ion)
Basic feed-in tariff design
� Purchase obligation
� “Independent” from power demand
� Fixed tariff payment based on the actual power generation costs
� Price setting will be discussed later
� Long duration of tariff payment
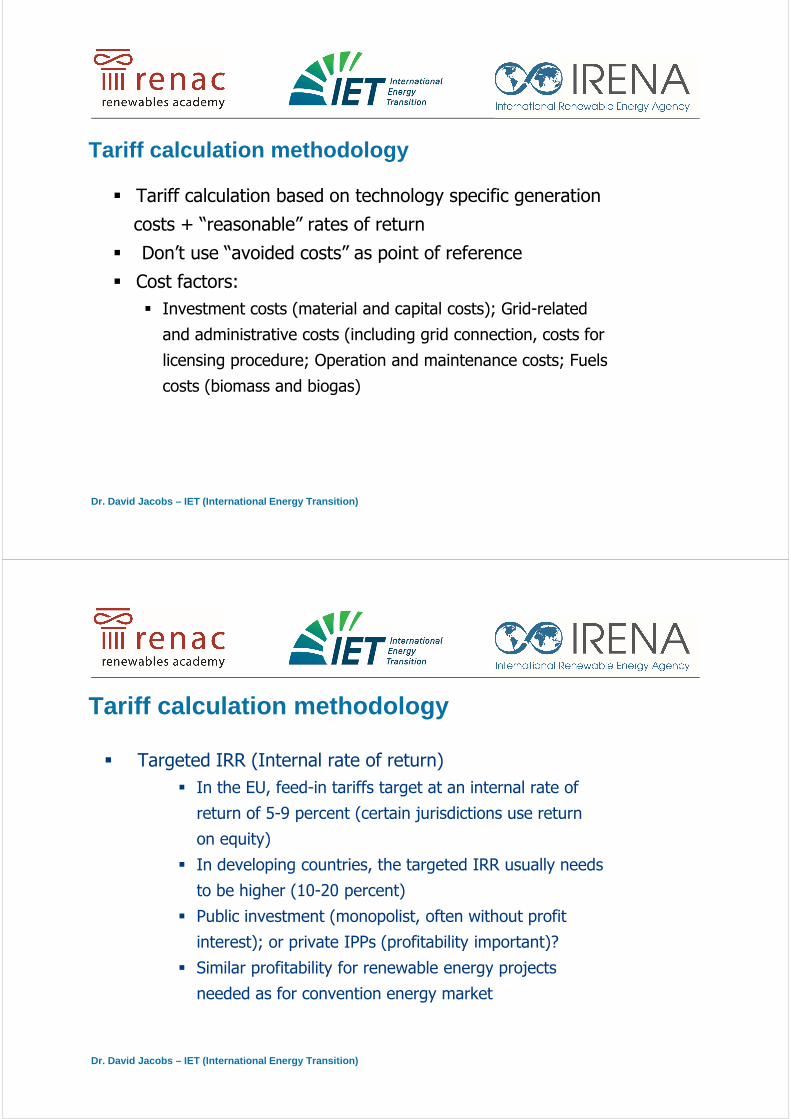
Dr. David Jacobs – IET (International Energy Transit ion)
Tariff calculation methodology
� Tariff calculation based on technology specific generation
costs + “reasonable” rates of return
� Don’t use “avoided costs” as point of reference
� Cost factors:
� Investment costs (material and capital costs); Grid-related
and administrative costs (including grid connection, costs for
licensing procedure; Operation and maintenance costs; Fuels
costs (biomass and biogas)
Dr. David Jacobs – IET (International Energy Transit ion)
Tariff calculation methodology
� Targeted IRR (Internal rate of return)
� In the EU, feed-in tariffs target at an internal rate of
return of 5-9 percent (certain jurisdictions use return
on equity)
� In developing countries, the targeted IRR usually needs
to be higher (10-20 percent)
� Public investment (monopolist, often without profit
interest); or private IPPs (profitability important)?
� Similar profitability for renewable energy projects
needed as for convention energy market
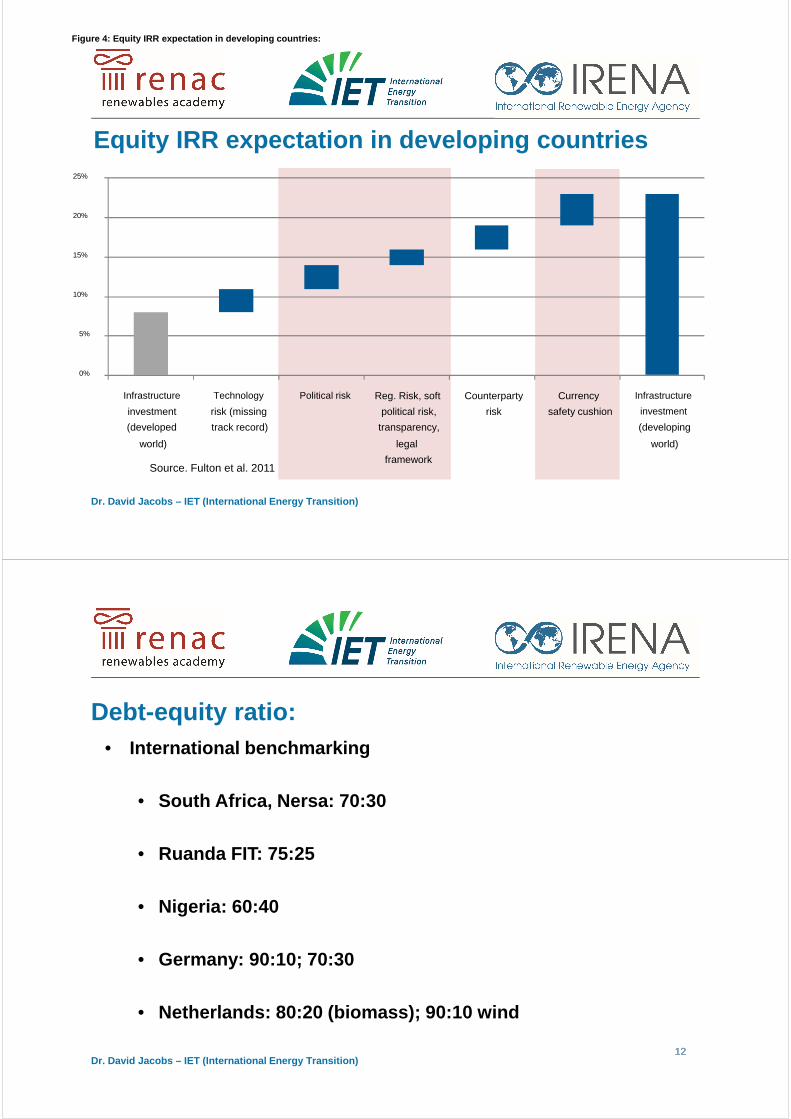
Dr. David Jacobs – IET (International Energy Transit ion)
Equity IRR expectation in developing countries
Figure 4: Equity IRR expectation in developing coun tries:
0%
5%
10%
15%
20%
25%
Infrastructure
investment
(developed
world)
Technology
risk (missing
track record)
Political risk Reg. Risk, soft
political risk,
transparency,
legal
framework
Counterparty
risk
Currency
safety cushion
Infrastructure
investment
(developing
world)
Source. Fulton et al. 2011
Dr. David Jacobs – IET (International Energy Transit ion) 12121212
Debt-equity ratio: • International benchmarking
• South Africa, Nersa: 70:30
• Ruanda FIT: 75:25
• Nigeria: 60:40
• Germany: 90:10; 70:30
• Netherlands: 80:20 (biomass); 90:10 wind

Dr. David Jacobs – IET (International Energy Transit ion)
Hands-on exercise: How to calculate FIT levels for your country?
Dr. David Jacobs – IET (International Energy Transit ion)
Important FIT design features (continued)
� Payment duration
� Eligibility
� Technology-specific tariffs
� Feed-in tariff calculation
� FIT degression
� Capacity caps
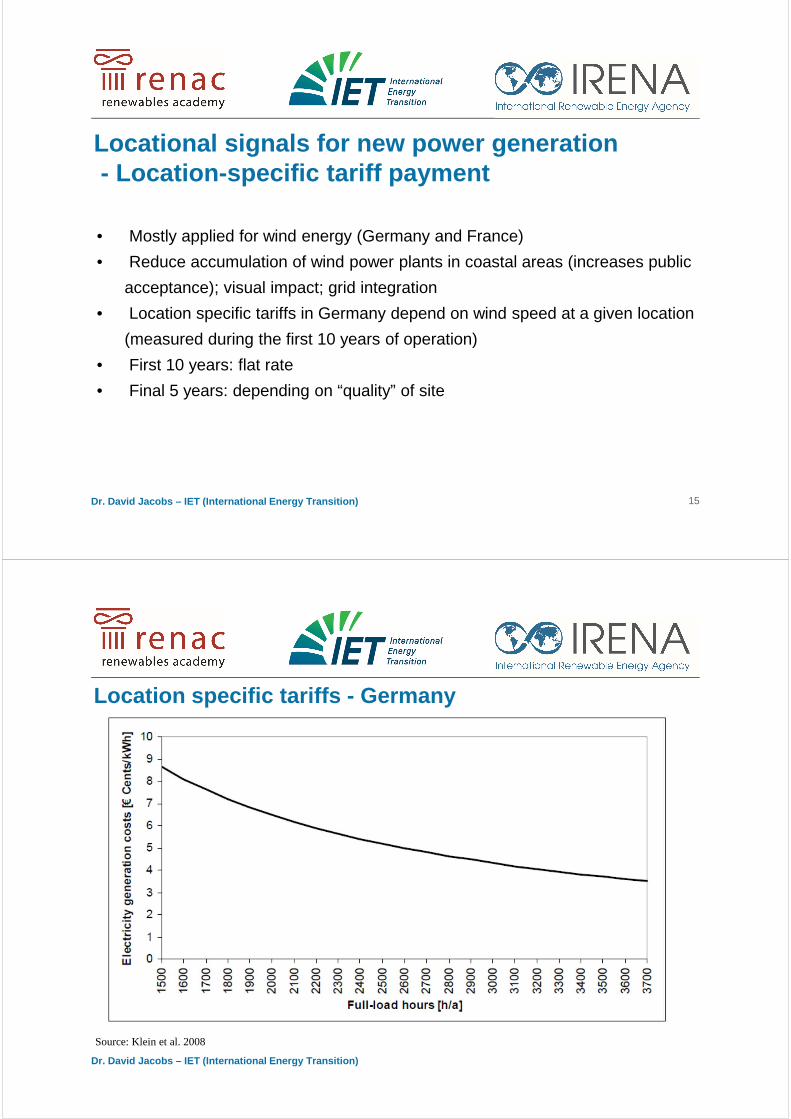
Dr. David Jacobs – IET (International Energy Transit ion)
Locational signals for new power generation- Location-specific tariff payment
15
• Mostly applied for wind energy (Germany and France)
• Reduce accumulation of wind power plants in coastal areas (increases public
acceptance); visual impact; grid integration
• Location specific tariffs in Germany depend on wind speed at a given location
(measured during the first 10 years of operation)
• First 10 years: flat rate
• Final 5 years: depending on “quality” of site
Dr. David Jacobs – IET (International Energy Transit ion)
Location specific tariffs - Germany
Source: Klein et al. 2008
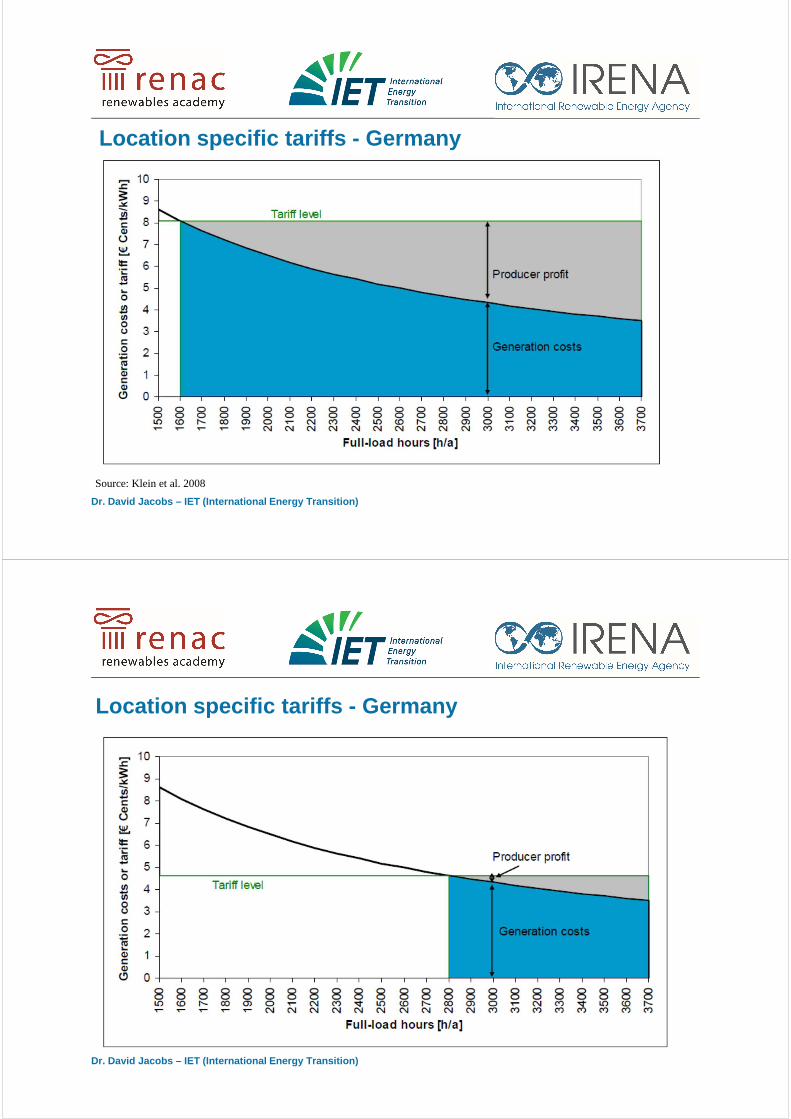
Dr. David Jacobs – IET (International Energy Transit ion)
Location specific tariffs - Germany
Source: Klein et al. 2008
Dr. David Jacobs – IET (International Energy Transit ion)
Location specific tariffs - Germany

Dr. David Jacobs – IET (International Energy Transit ion)
Location specific tariffs • French FIT for solar also includes location specific tariffs
Source: http://re.jrc.ec.europa.eu/pvgis/countries/europe.htm
Dr. David Jacobs – IET (International Energy Transit ion)
Additional measures for locational incentives
20
• Nodal pricing
• Using differentiated grid-usage fees
• Define areas with good, medium and no grid connection capability

Dr. David Jacobs – IET (International Energy Transit ion)
From scenarios to instruments:
Auction design and spatial planning
Dr. David Jacobs – IET (International Energy Transit ion)
Increasing use of auctions in emerging markets
Source: IRENA 2013
Dr. David Jacobs – IET (International Energy Transit ion)
Tender/auctioning mechanism
� Government issues call for tender
� Generally: bids for cost per unit of electricity (generation focused)
� Sometimes: bids for upfront investment cost of one project
(investment focused)
� For example: 100 MW wind energy onshore
� Bidder with the lowest price “wins” contract and has the exclusive right
for renewable electricity generation
Dr. David Jacobs – IET (International Energy Transit ion)
• Basic price finding mechanism:
• English (or Ascending)• Price for item is increased until only one bidder if left and the item
is sold to that bidder
• Dutch (or Descending clock) Multi-round bid
• Auctioner starts with a high price and then calls out successively
lower prices until quantity offered and quantity required match!
Auctions design: How to determine prices?

Dr. David Jacobs – IET (International Energy Transit ion)
• Sealed-bid auction
• Each bidder writes down a single bid which is not disclosed to
other bidders and the most competitive bidders win (“pay as
bid”).
• Other selection criteria than the price?
• Local content
• job creation
• ownership
• socioeconomic development
• Resource securitization in the case of biomass
• Locational incentives
Auctions design: How to determine prices?
Dr. David Jacobs – IET (International Energy Transit ion)
• Prequalification requirements for auctions – important for project
realization rate!
• Material pre-qualifications
• Project development experience
• Securitization of land, grid access
• Contracts for equipment
• Etc.
• Financial prequalification
• Bid bonds
• Etc.
Auction design: Who can participate? (Prequalifica tion)
Dr. David Jacobs – IET (International Energy Transit ion)
Auction design and site determination
• Option 1: Allow project developers to freely select sites (within the
existing spatial planning arrangement)
• Option 2: Package pre-selected sites in order to have better control
over land use (and help to shorten bidding process).
27
Dr. David Jacobs – IET (International Energy Transit ion)
• Which authority should be in charge of procurement?
• Technology neutral versus technology-specific aucti ons?
• How often will procurement take place (frequency)?
• Size of each procurement round? Technology-specific?
• Upper or lower limit on project size?
• Upper or lower limit on prices?
Auction design: Other important design decisions
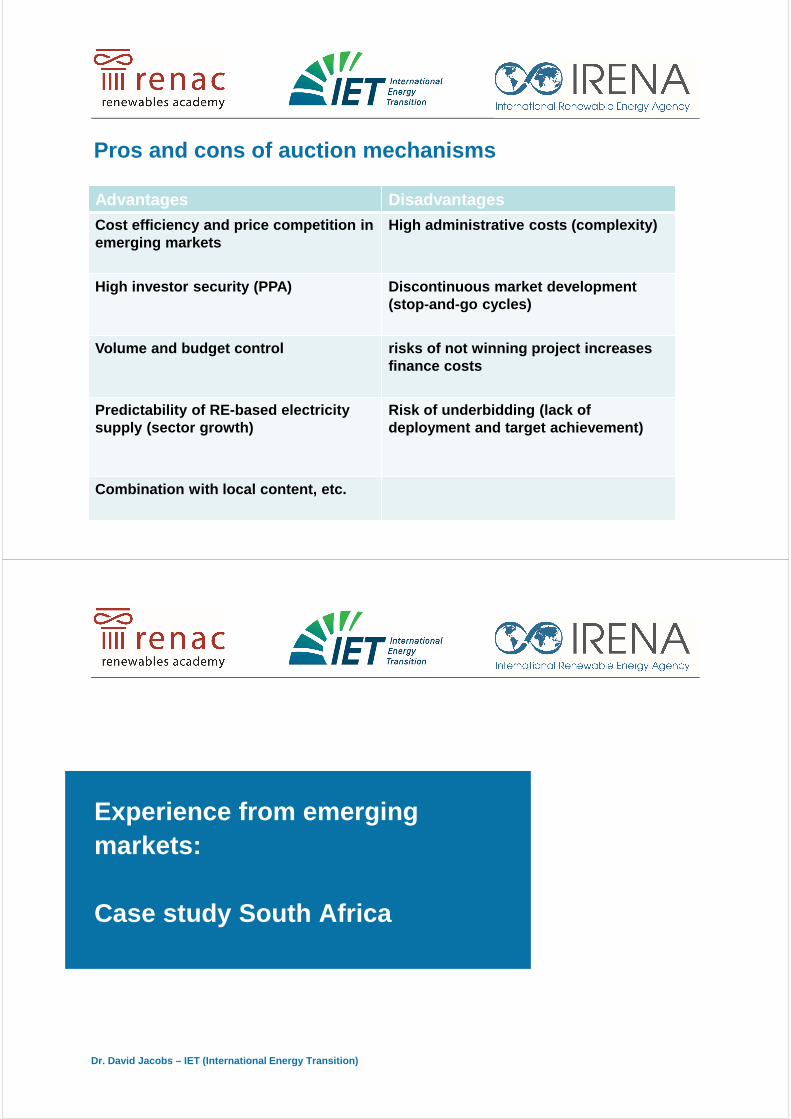
Dr. David Jacobs – IET (International Energy Transit ion)
Pros and cons of auction mechanisms
Advantages Disadvantages
Cost efficiency and price competition in emerging markets
High administrative costs (complexity)
High investor security (PPA) Discontinuous market de velopment (stop-and-go cycles)
Volume and budget control risks of not winning proje ct increases finance costs
Predictability of RE-based electricity supply (sector growth)
Risk of underbidding (lack of deployment and target achievement)
Combination with local content, etc.
Dr. David Jacobs – IET (International Energy Transit ion)
Experience from emerging markets:
Case study South Africa

Dr. David Jacobs – IET (International Energy Transit ion)
• In 2009, the government began exploring feed-in tar iffs (FITs)
• later rejected in favor of competitive tenders:
• Insecurity about “right tariff levels” (2009, 2011)
• FITs prohibited by the government’s public finance and
procurement regulations?
• Move back to FITs after several auction rounds?
South Africa: Moving from FITs to auctions
Source: Eberhard et al. 2014
Dr. David Jacobs – IET (International Energy Transit ion)
• Auction design and results:
• Department of Energy in charge of auction (not Esko m!)
• Strict pre-qualification (EIA; resource measurement )
• Bids needed to be fully underwritten with debt and equity (avoid
under-bidding)
• Selection of 28 projects with 1416 MW (investment of US$6 billion)
• Reasons for high prices:
• Most bids close to the maximum price (previously ca lculated FITs) -
Lack of competition
• significant upfront administrative requirements
• high bid costs
South Africa: First bidding round in 2011
Source: Eberhard et al. 2014

Dr. David Jacobs – IET (International Energy Transit ion)
• Second round in November 2011
• Tighter procurement process and increase competition
• Seventy-nine bids for 3233 MW – 19 projects selected
• Third round started in May 2013
• 93 bids for 6023 MW – 73 projects with 1456 MW selected
• Prices fell further in round three
• Increased local content
• wide variety of domestic and international project developers,
sponsors and equity shareholders
South Africa: Second and third round in 2011 and 20 13
Dr. David Jacobs – IET (International Energy Transit ion)
• Decline of submitted bids over time:
• Lack of competition in the 1st round – right benchmark?
• General cost decline of PV and wind in the past 3 years!
• How many projects will eventually be realized?
South Africa: Successful auctions?
Source: Eberhard et al. 2014

Dr. David Jacobs – IET (International Energy Transit ion)
Experience from emerging markets:
Case study China
Dr. David Jacobs – IET (International Energy Transit ion)
• Policy framework:
• 2005 Renewable Energy Law – clear roadmap and target s (15
percent of primary energy supply by 2020)
• Initially passed to support FITs but no consensus o f tariff level
based on experience with previous concession loans
China: Moving from auctions to FITs
Source: https://openknowledge.worldbank.org/handle/10986/18676
Dr. David Jacobs – IET (International Energy Transit ion)
• Policy framework:
• First auction for onshore wind started in 2003
• Sealed bid, single round determined prices
• Early auction rounds: bids below cost of production – projects were not
completed
• Loose prequalification requirements
• Large state-owned enterprises wanted to enter the market and could
cross subsidize their low bids with coal-generation business
• Effects:
• slow expansion of wind power sector
• insecurity for investors
China: Auction design features and effects
Dr. David Jacobs – IET (International Energy Transit ion)
• Adjustment of auction design:
• Minimum price
• Stricter pre-qualifications
• Local content requirement
• Further adjustment in 2007:
• Winner was no longer the lowest price but the bidder that was
closest to the average price resulting from all bids, after
excluding the highest and lowest bids
• Further adjustment:
• Move back to “lowest bid” design
China: Auction design adjustments

Dr. David Jacobs – IET (International Energy Transit ion)
• China used auction round as a price-discovery mecha nism for FIT program
(attract international investors)
• 2009: Establishment of location-differentiated feed -in tariffs for wind energy
• 2011: FITs for solar PV
• 2014: Offshore wind tariffs
• Emerging technologies such as CSP and offshore wind energy continue to
use bidding for contracts
China: Successful auctions?
Dr. David Jacobs – IET (International Energy Transit ion)
Experience from emerging markets:
Combining FITs and auctions?

Dr. David Jacobs – IET (International Energy Transit ion)
• Do you have experience in setting prices administratively?
• Is there sufficient interest in investing in renewables in your
country (competition in Least Developed Countries)?
• Is the market big enough to create competition (size of auction)?
• Which type of actors should invest (small vs. big)?
Auctions or FITs: No easy answer…
Dr. David Jacobs – IET (International Energy Transit ion)
• Use auctions to determine FIT prices (China)?
• Use auctions for emerging technologies and FITs for mature
technologies (Denmark, China)?
• Use auctions for large projects and FITs for small projects
(France, Taiwan)?
Auctions and FITs?
Dr. David Jacobs – IET (International Energy Transit ion)
Financing support mechanisms:
Design options and international experience
Dr. David Jacobs – IET (International Energy Transit ion)
Financing support programs in developing countries
� low electricity costs
� little acceptance of electricity price increases
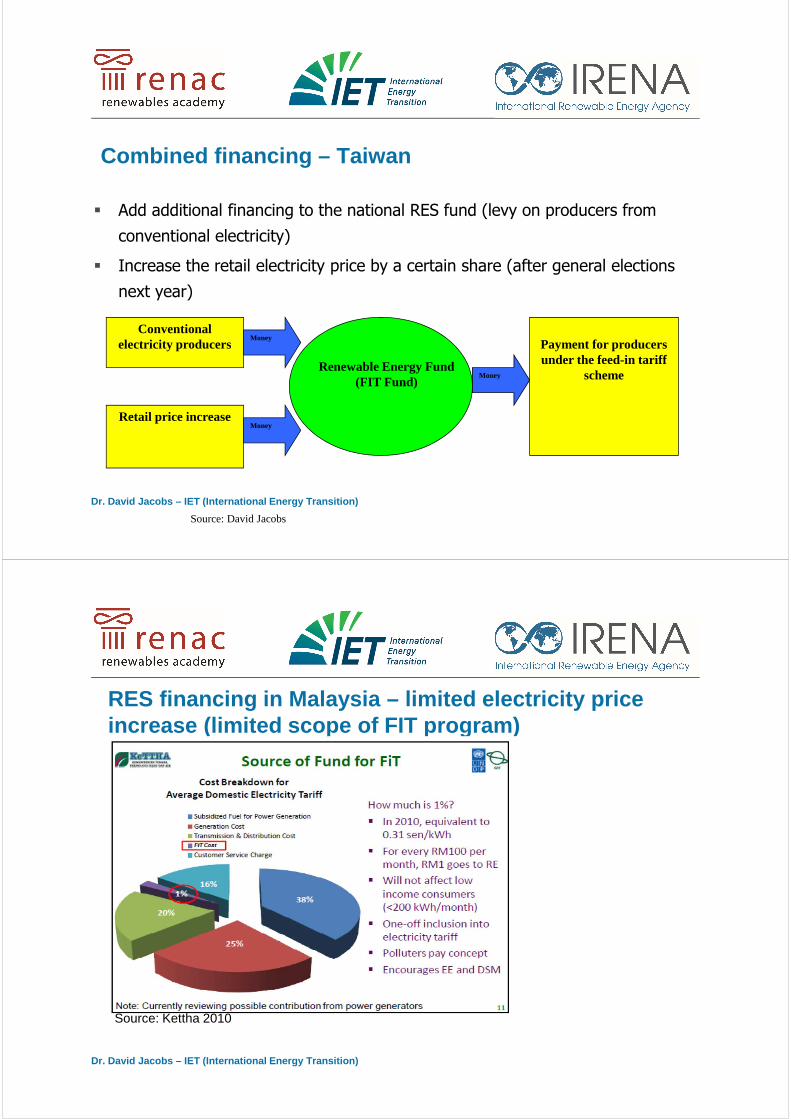
Dr. David Jacobs – IET (International Energy Transit ion)
Combined financing – Taiwan
Source: David Jacobs
� Add additional financing to the national RES fund (levy on producers from
conventional electricity)
� Increase the retail electricity price by a certain share (after general elections
next year)
Conventional electricity producers
Retail price increase
Renewable Energy Fund (FIT Fund)
Payment for producers under the feed-in tariff
scheme
Money
Money
Money
Dr. David Jacobs – IET (International Energy Transit ion)
RES financing in Malaysia – limited electricity pric e increase (limited scope of FIT program)
Source: Kettha 2010

Dr. David Jacobs – IET (International Energy Transit ion)
RES Fund in Malaysia
Dr. David Jacobs – IET (International Energy Transit ion)
International RES financing? – The future of interna tional climate talks?

Dr. David Jacobs – IET (International Energy Transit ion)
From scenarios to instruments:
Reducing administrative barriers
Dr. David Jacobs – IET (International Energy Transit ion)
High number of institutions involved in planning and permitting process
• Lengthy and complicated application process
• High number of rejections
• High administrative costs
Institution A
Institution C
Institution D
Institution B
Institution G
Institution E
Institution F
RES-e developer

Dr. David Jacobs – IET (International Energy Transit ion)
High number of institutions involved in planning and permitting process
• Solution: One-stop-shop institution
Institution A
Institution C
Institution D
Institution B
Institution G
Institution E
Institution F
RES-e developer
One-stop institution
Dr. David Jacobs – IET (International Energy Transit ion)
Long lead times
• Long lead times to obtain necessary permits
• Spain and Portugal: 12 year for small hydro
• France: 5 years for wind energy
• Approval rates (France - wind energy) = less than 30%
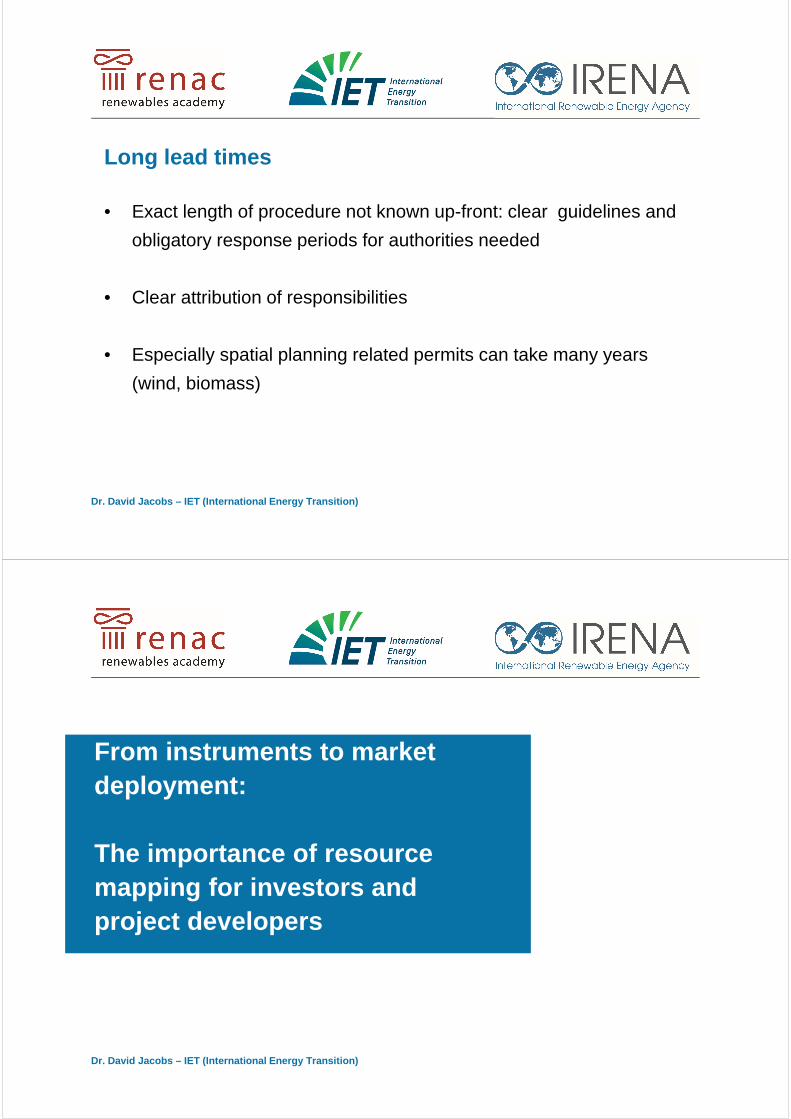
Dr. David Jacobs – IET (International Energy Transit ion)
Long lead times
• Exact length of procedure not known up-front: clear guidelines and
obligatory response periods for authorities needed
• Clear attribution of responsibilities
• Especially spatial planning related permits can take many years
(wind, biomass)
Dr. David Jacobs – IET (International Energy Transit ion)
From instruments to market deployment:
The importance of resource mapping for investors and project developers

Dr. David Jacobs – IET (International Energy Transit ion)
From resource mapping to the actual deployment of renewables
55
Dr. David Jacobs – IET (International Energy Transit ion)
Resource mapping and project development
• Purpose of resource mapping:
� Helping governments and utilities plan and guide investment
through improved understanding of resource availability and
constraints
� Providing commercial developers with information on
resource location
� Shortening project development times and access to finance by
providing ground-based datasets for resource validation purposes
56

Dr. David Jacobs – IET (International Energy Transit ion)
Resource mapping and project development
• The first step on a long process until project operation
57
Source: http://www1.eere.energy.gov/femp/pdfs/large-scalereguide.pdf
Dr. David Jacobs – IET (International Energy Transit ion)
Renewable energy project planning
• Site selection based on:
� Resource availability (maps)
� Grid availability
� Planning and support framework
• Feasibility Analysis (Site-specific assessment)
� identify physical and spatial issues
� determine technical performance potential
(onsite measurement) and economic viability
� identify environmental, social or other
constraints
58Source: http://www.epa.gov/oswercpa/docs/handbook_siting_repowering_projects.pdf
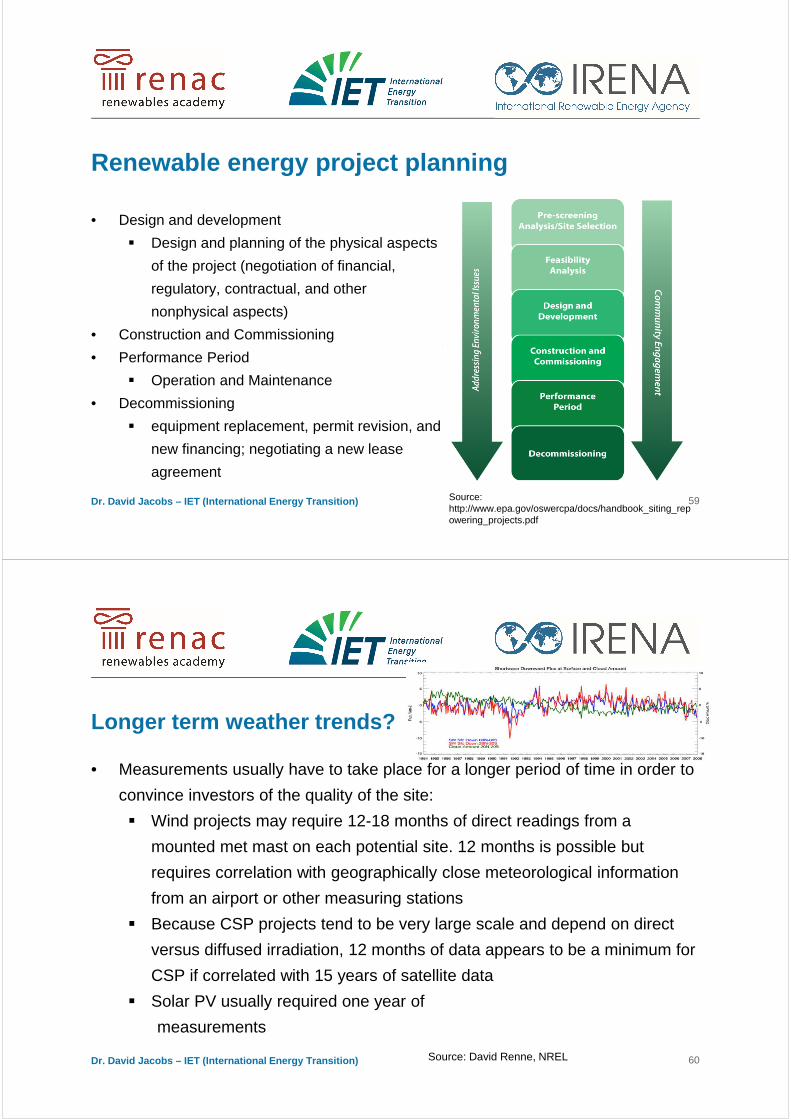
Dr. David Jacobs – IET (International Energy Transit ion)
Renewable energy project planning
• Design and development
� Design and planning of the physical aspects
of the project (negotiation of financial,
regulatory, contractual, and other
nonphysical aspects)
• Construction and Commissioning
• Performance Period
� Operation and Maintenance
• Decommissioning
� equipment replacement, permit revision, and
new financing; negotiating a new lease
agreement
59Source: http://www.epa.gov/oswercpa/docs/handbook_siting_repowering_projects.pdf
Dr. David Jacobs – IET (International Energy Transit ion)
Longer term weather trends?
• Measurements usually have to take place for a longer period of time in order to
convince investors of the quality of the site:
� Wind projects may require 12-18 months of direct readings from a
mounted met mast on each potential site. 12 months is possible but
requires correlation with geographically close meteorological information
from an airport or other measuring stations
� Because CSP projects tend to be very large scale and depend on direct
versus diffused irradiation, 12 months of data appears to be a minimum for
CSP if correlated with 15 years of satellite data
� Solar PV usually required one year of
measurements
60Source: David Renne, NREL
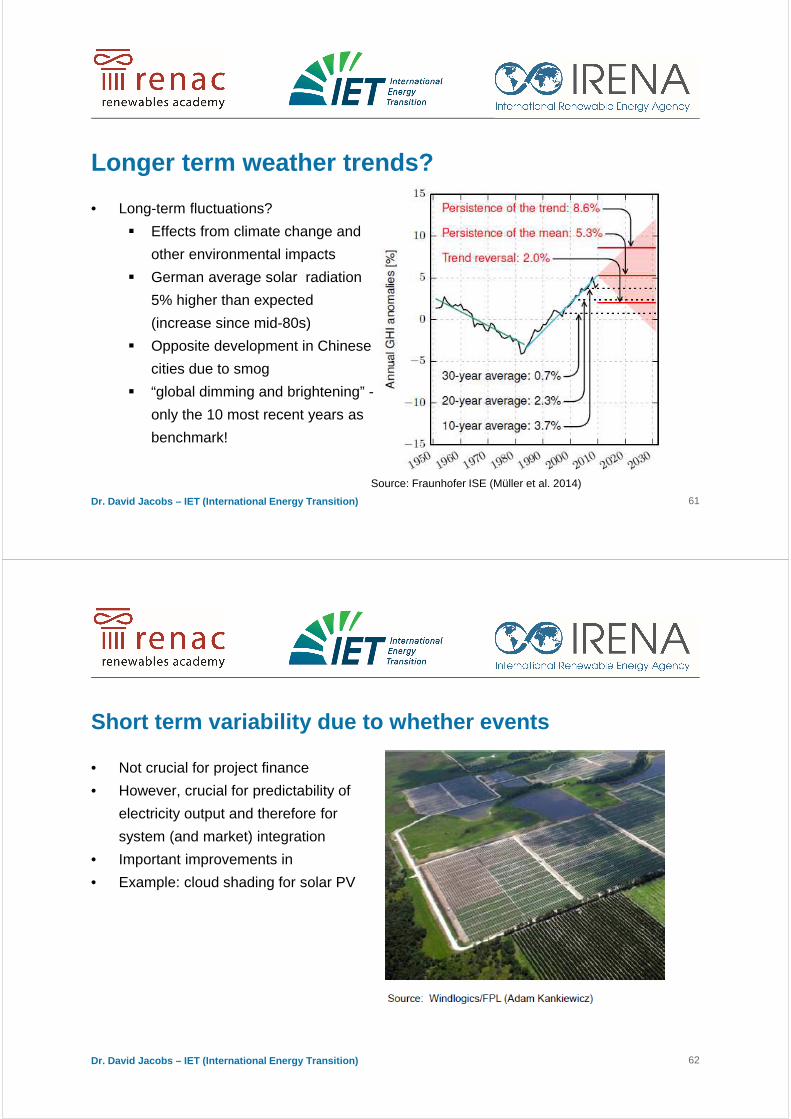
Dr. David Jacobs – IET (International Energy Transit ion)
Longer term weather trends?
• Long-term fluctuations?
� Effects from climate change and
other environmental impacts
� German average solar radiation
5% higher than expected
(increase since mid-80s)
� Opposite development in Chinese
cities due to smog
� “global dimming and brightening” -
only the 10 most recent years as
benchmark!
61
Source: Fraunhofer ISE (Müller et al. 2014)
Dr. David Jacobs – IET (International Energy Transit ion)
Short term variability due to whether events
• Not crucial for project finance
• However, crucial for predictability of
electricity output and therefore for
system (and market) integration
• Important improvements in
• Example: cloud shading for solar PV
62

Dr. David Jacobs – IET (International Energy Transit ion)
Assessment and revising of existing policies and frameworks?
Dr. David Jacobs – IET (International Energy Transit ion)
Review and assessment
• Assess target achievement (annually, bi-annually)
• Identify bottle-necks and barriers (finance, grid access, administrative
barriers, etc.).
• Adjust policies and framework conditions
64

Dr. David Jacobs – IET (International Energy Transit ion)
Thank you very much for your attention!
Dr. David JacobsIET – International Energy TransitionPhone +49 163 2339046Fax: +49 30 [email protected]@InterEnerTrans