Provident Energy
82
Clarity of Focus 2010 Annual Report
-
Upload
junewarren-nickles-energy-group -
Category
Documents
-
view
234 -
download
1
description
Provident is the leading Canadian pure-play natural gas liquids (NGL) infrastructure and marketing business. We are focused on generating stable fee-for-service and margin based revenue, augmented by managed leverage to commodity prices. Provident’s large scale strategic assets are ideally suited to drive dividend income and organic growth.
Transcript of Provident Energy

Clarity of Focus2010 Annual Report
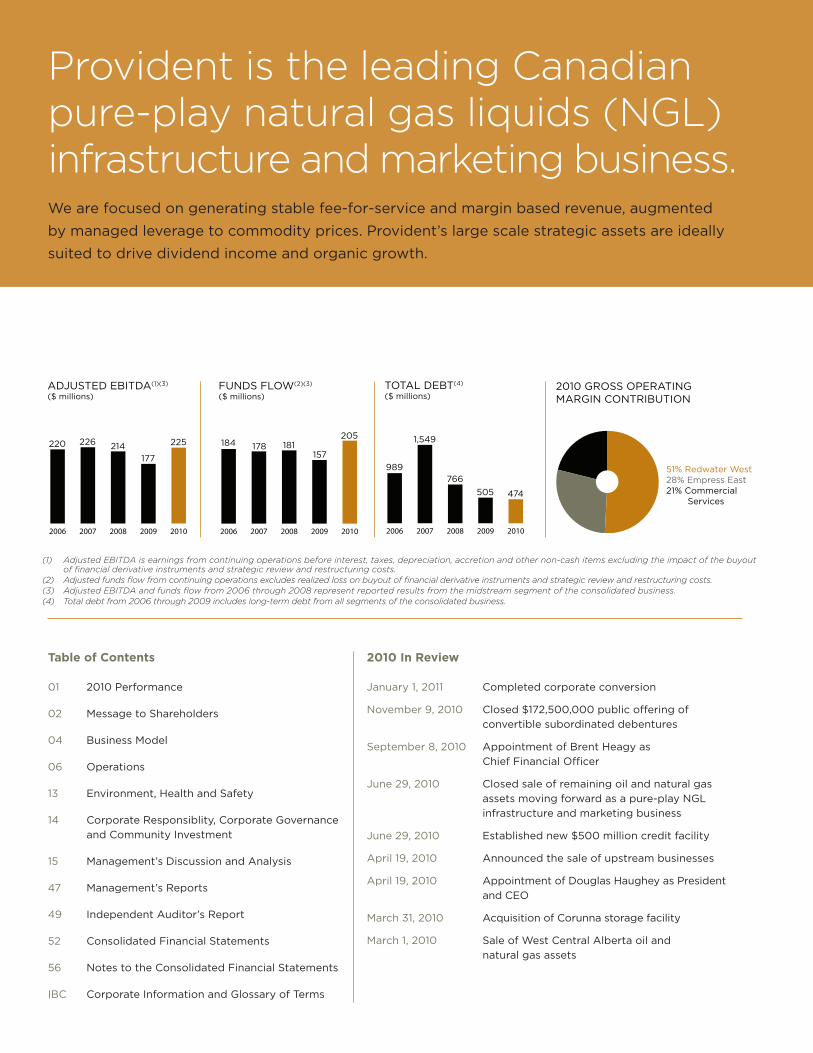
2010 GROSS OPERATING MARGIN CONTRIBUTION
51% Redwater West28% Empress East21% Commercial Services
Provident is the leading Canadian pure-play natural gas liquids (NGL) infrastructure and marketing business. We are focused on generating stable fee-for-service and margin based revenue, augmented by managed leverage to commodity prices. Provident’s large scale strategic assets are ideally suited to drive dividend income and organic growth.
2010 In Review
January 1, 2011 Completed corporate conversion
November 9, 2010 Closed $172,500,000 public offering of convertible subordinated debentures
September 8, 2010 Appointment of Brent Heagy as Chief Financial Officer
June 29, 2010 Closed sale of remaining oil and natural gas assets moving forward as a pure-play NGL infrastructure and marketing business
June 29, 2010 Established new $500 million credit facility
April 19, 2010 Announced the sale of upstream businesses
April 19, 2010 Appointment of Douglas Haughey as President and CEO
March 31, 2010 Acquisition of Corunna storage facility
March 1, 2010 Sale of West Central Alberta oil and natural gas assets
Table of Contents
01 2010 Performance
02 Message to Shareholders
04 Business Model
06 Operations
13 Environment, Health and Safety
14 Corporate Responsiblity, Corporate Governance and Community Investment
15 Management’s Discussion and Analysis
47 Management’s Reports
49 Independent Auditor’s Report
52 Consolidated Financial Statements
56 Notes to the Consolidated Financial Statements
IBC Corporate Information and Glossary of Terms
20102009200820072006
220 226 214177
225
ADJUSTED EBITDA(1)(3) ($ millions)
20102009200820072006
FUNDS FLOW(2)(3)
($ millions)
184157
181178205
20102009200820072006
989
1,549
766505 474
TOTAL DEBT(4)
($ millions)
(1) Adjusted EBITDA is earnings from continuing operations before interest, taxes, depreciation, accretion and other non-cash items excluding the impact of the buyout of financial derivative instruments and strategic review and restructuring costs.
(2) Adjusted funds flow from continuing operations excludes realized loss on buyout of financial derivative instruments and strategic review and restructuring costs. (3) Adjusted EBITDA and funds flow from 2006 through 2008 represent reported results from the midstream segment of the consolidated business.(4) Total debt from 2006 through 2009 includes long-term debt from all segments of the consolidated business.

Provident Energy AR2010 1
Consolidated financial and operational highlights ($000s except per unit data)
Year ended December 31,
2010 2009Revenue from continuing operations (net of financial derivative instruments) $ 1,621,757 $ 1,452,138Funds flow from continuing operations(1) $ (7,985) $ 147,854Funds flow from discontinued operations $ (2,436) $ 116,152Funds flow from operations $ (10,421) $ 264,006Adjusted EBITDA – continuing operations(2) $ 12,653 $ 168,229Adjusted funds flow from continuing operations(3) $ 204,856 $ 157,109 Per weighted average unit – basic $ 0.77 $ 0.60 Per weighted average unit – diluted(4) $ 0.73 $ 0.60Percent of adjusted funds flow from continuing operations, net of sustaining capital spending, paid out as declared distributions 96% 127%
Adjusted EBITDA excluding buyout of financial derivative instruments and strategic review and restructuring costs – continuing operations(2) $ 225,494 $ 177,484
Distributions to unitholders $ 191,639 $ 196,217 Per unit $ 0.72 $ 0.75Non-cash distribution in connection with the disposition of the Upstream business unit $ 308,690 $ - Per unit $ 1.16 $ -Net income from continuing operations $ 103,492 $ 5,168 Per weighted average unit – basic $ 0.39 $ 0.02 Per weighted average unit – diluted(4) $ 0.37 $ 0.02Capital expenditures – continuing operations $ 47,763 $ 36,632Acquisitions – continuing operations $ 22,456 $ 18,500Weighted average trust units outstanding (000s) basic 266,008 261,540 diluted(4) 282,282 261,540
Consolidated As at December 31, ($ 000s) 2010 2009Capitalization Long-term debt (including current portion) $ 473,754 $ 505,262Unitholders’ equity $ 587,218 $ 1,381,399
(1) Represents cash flow from operations before changes in working capital and site restoration expenditures.(2) Adjusted EBITDA is earnings before interest, taxes, depreciation, accretion and other non-cash items.(3) Adjusted funds flow from continuing operations excludes realized loss on buyout of financial derivative instruments and strategic review and restructuring costs.(4) Includes dilutive impact of convertible debentures.
Large integrated NGL footprint Strong, diversified cash flows Excellent growth opportunities

2
President’s Message To Our Shareholders
2010 marked a year of significant accomplishment for Provident. In addition to strong financial results, we achieved several milestones which have positioned us very well to move forward into 2011 and beyond. We sold our upstream business in June 2010, creating Canada’s only pure-play natural gas liquids (NGLs) midstream infrastructure and marketing business. We realigned our hedging strategy and significantly improved our overall transparency and disclosure. We made great strides on our business development efforts including completing the acquisition of our storage facility in Corunna, Ontario, and deploying $42 million of growth capital. Provident also completed the conversion from an Income Trust to a dividend-paying corporation.
On the financial front, the midstream business delivered $225 million in adjusted EBITDA and Provident paid out 72 cents per unit in cash distributions while exiting the year with a total debt to adjusted EBITDA ratio of 2.1 to one. Our overall performance in 2010 was driven in large part by an attractive NGL pricing environment throughout the year and particularly strong fourth quarter results from both Redwater West and Empress East.
Clarity of FocusAlthough recently reorganized as a pure-play NGL midstream company, Provident is by no means new to the Canadian midstream sector. Since 2003, Provident has acquired some of the newest and most efficient extraction and fractionation facilities in the country and developed a strong reputation as a respected, safe and responsible operator.
Provident has laid out four key financial objectives that align with the expectations of our shareholders. Based on a five year outlook of our core operations and a number of operating assumptions, Provident’s objective is to target adjusted EBITDA growth of 5 percent to 7 percent annually, maintain a total debt to adjusted EBITDA ratio of approximately 2.5 to 1 times, target a payout ratio of less than 80 percent of distributable cash flow, and provide dividend stability to shareholders.
We plan on accomplishing these objectives by deploying growth capital around our strategically located assets and by diversifying into new service opportunities as they arise. Provident plans on funding sustaining and growth capital with a combination of cash flow, Dividend Reinvestment Plan proceeds, and modest incremental debt. We will fund major expansion projects or acquisitions with new debt and equity.
Provident’s Executives from left: Lynn Rannelli Assistant Corporate Secretary, Andrew Gruszecki Co-President, Midstream Business, Brent Heagy Senior Vice President, Finance and Chief Financial Officer, Murray Buchanan Co-President, Midstream Business, Doug Haughey President and Chief Executive Officer and Sherry Bouvier Vice President, Human Resources and Administration.

Provident Energy AR2010 3
Growing Our BusinessWe have identified approximately $350 million of planned growth projects over the next five years. For 2011, Provident has announced a total capital budget of $95 million. We plan to allocate approximately $17 million of this budget towards the expansion and construction of new infrastructure at our Corunna, Ontario storage facility. We anticipate that the completion of these upgrades during the later half of 2011 will improve facility utilization and significantly enhance our commercial opportunities in the Sarnia/Corunna area. Additionally, these upgrades continue to strengthen our position to take advantage of new opportunities arising from the emerging Marcellus shale play in Pennsylvania.
At Redwater, Alberta, Provident will direct approximately $15 million towards constructing a 500,000 barrel cavern that will be commissioned in late 2011, continue work on two other caverns of equal size slated for completion in 2012 and 2013, commence work on a fourth cavern to be commissioned in early 2014, and complete work on a brine pond to facilitate future cavern operations.
At our Younger facility we announced the Septimus to Younger Pipeline project where Provident, AltaGas and a senior producer plan to construct a 16-inch liquids rich gas pipeline from a field plant in the Montney gas play to the Younger facility in northeastern British Columbia. Under the agreement, Provident will own a 30 percent interest in the 250 mmcfd pipeline project.
Provident will also undertake a one-time pipeline replacement and upgrade commencing in the first quarter of 2011. The project will replace an aging section of the Taylor-Boundary Lake Pipeline. The capital cost is estimated to be $28 million, half of which will be allocated as growth capital to expand the capabilities of the pipeline.
Moving Forward
Orchestrating the significant accomplishments that Provident achieved in 2010 has demanded the vision, dedication and commitment of an exceptionally strong group. I would like to thank our Provident team for that outstanding success. I would also like to thank the Provident board for its wise guidance, solid judgement, and strong leadership.
On behalf of the entire Provident team, I would like to acknowledge the support from our investors and other stakeholders. We look forward to continued success in 2011.
Doug Haughey, President and Chief Executive Officer
Doug HaugheyPresident & CEO

4
Business ModelProvident participates across the entire NGL value chain. Our integrated assets and commercial operations enable us to capture value along each step of the value chain.
1
2
3
1 2 3
NGL Extraction Large ScaleNGL Fractionation
Storage, Terminalling and Distribution
Empress
YoungerRedwater
Sarnia
Redwater
Sarnia
Corunna
Raw Gas
Third Party Field Plant NGL Extraction
Raw Gas
Empress Truck Terminal
Kerrobert/Enbridge Pipeline
Provident Liquids Gathering System/Pembina Pipeline
Extraction refers to the process of removing NGLs, such as ethane, propane,
butane and condensate from a natural gas stream. The extracted liquids are generally
removed in mixes, which are further processed to separate the individual products. Provident’s ownership in large-scale extraction facilities permit highly e�cient reprocessing of natural gas to extract higher-value liquid hydrocarbons. Margin is earned by the relative spread between natural gas prices and NGL product prices (the “frac spread”) after payment of all operating costs.
Fractionation refers to the process of using temperature and pressure to
separate NGL mix into individual products such as ethane, propane, butane and
condensate. Ownership in modern, large-scale fractionation facilities provides Provident with a significant competitive advantage. Located near the Edmonton and Sarnia NGL hubs, Provident’s major fractionation facilities are in close proximity to significant end-use markets. These facilities have access to continental markets through large scale rail facilities and extensive pipeline connectivity. Margin is earned through high-e�ciency processing of NGL mix supply and marketing of the specification products.
Storage, Terminalling & Distribution Revenue is earned
through transportation, storage, processing, blending and terminalling services
provided to third parties. Many of these services are integrated with Redwater West and Empress East operations to create operating synergies.
Milepost 73Truck Terminal
Redwater West
Empress EastSales Gas
Sales Gas
Propane Sales
Empress Debutanizer
Natural Gas
NGL Mix
Spec Product
Legend
Taylor Fractionator
Depropanizer
Superior Break Out Storage
Marketing and Distribution
Petrochemical Companies
Refineries
Propane Retailers
Heavy Oil Producers

Provident Energy AR2010 5
1
2
3
1 2 3
NGL Extraction Large ScaleNGL Fractionation
Storage, Terminalling and Distribution
Empress
YoungerRedwater
Sarnia
Redwater
Sarnia
Corunna
Raw Gas
Third Party Field Plant NGL Extraction
Raw Gas
Empress Truck Terminal
Kerrobert/Enbridge Pipeline
Provident Liquids Gathering System/Pembina Pipeline
Extraction refers to the process of removing NGLs, such as ethane, propane,
butane and condensate from a natural gas stream. The extracted liquids are generally
removed in mixes, which are further processed to separate the individual products. Provident’s ownership in large-scale extraction facilities permit highly e�cient reprocessing of natural gas to extract higher-value liquid hydrocarbons. Margin is earned by the relative spread between natural gas prices and NGL product prices (the “frac spread”) after payment of all operating costs.
Fractionation refers to the process of using temperature and pressure to
separate NGL mix into individual products such as ethane, propane, butane and
condensate. Ownership in modern, large-scale fractionation facilities provides Provident with a significant competitive advantage. Located near the Edmonton and Sarnia NGL hubs, Provident’s major fractionation facilities are in close proximity to significant end-use markets. These facilities have access to continental markets through large scale rail facilities and extensive pipeline connectivity. Margin is earned through high-e�ciency processing of NGL mix supply and marketing of the specification products.
Storage, Terminalling & Distribution Revenue is earned
through transportation, storage, processing, blending and terminalling services
provided to third parties. Many of these services are integrated with Redwater West and Empress East operations to create operating synergies.
Milepost 73Truck Terminal
Redwater West
Empress EastSales Gas
Sales Gas
Propane Sales
Empress Debutanizer
Natural Gas
NGL Mix
Spec Product
Legend
Taylor Fractionator
Depropanizer
Superior Break Out Storage
Marketing and Distribution
Petrochemical Companies
Refineries
Propane Retailers
Heavy Oil Producers
Redwater WestPurchases third party NGL mix, fractionates, markets finished products. Extracts NGLs at Taylor, transports NGL mix to Redwater
Empress EastExtracts NGLs from the natural gas stream at Empress. Ethane and condensate sold in Alberta under long-term contracts; propane and butane transported to Sarnia, fractionated and sold in premium eastern markets.
Commercial ServicesFee-for-service activity related to fractionation, storage, loading, transportation and marketing services charged directly to third parties.

6
The assets within Redwater West and Empress East are used for proprietary NGL operations and to provide services to third parties. Revenues from proprietary operations are included in either Redwater West or Empress East, while third-party service revenues generated by both systems are captured in Commercial Services.
Empress East and Redwater West are also supported by Provident’s integrated marketing arm which maintains marketing offices in Calgary, Alberta, Sarnia, Ontario, and Houston, Texas and operates under the brand name Kinetic. Rather than selling NGL produced by the Empress East and Redwater West facilities at the plant gate, the marketing and logistics group utilizes Provident’s integrated suite of transportation, storage and logistics assets to access premium markets across North America.
Due to its broad marketing scope, Provident’s NGL products are priced based on multiple pricing indices. These generally correspond with the four major NGL trading hubs in North America which are located in Mont Belvieu, Texas; Conway, Kansas; Edmonton, Alberta; and Sarnia, Ontario. Mont Belvieu, the largest NGL trading center, serves as the major reference point for NGL pricing in North America.
By strategically building inventories of specification products during lower demand periods which can be distributed into premium-priced markets across North America during periods of high seasonal demand, Provident is able to optimize the margins it earns from its extraction and fractionation operations. Provident’s marketing group also generates margins from arbitrage trading opportunities created by locational price differentials.
Provident has a large-scale integrated asset footprint with broad access to natural gas and natural gas liquids supply, low cost access to premium markets, and flexibility with distribution and logistics. Provident has identified numerous midstream growth areas including opportunities related to the Alberta Oilsands, and the Montney and Marcellus natural gas resource plays.
Oilsands OpportunitiesThe development of Alberta’s Oilsands provides a number of exciting growth opportunities. Regardless of production method, diluent (including condensate) is required to blend with the raw bitumen to facilitate pipeline transportation from the production site to market.
Provident is pursuing several growth opportunities that will enhance its position as a premier condensate supply, storage and services provider. In addition to the expansion of our existing base facilities, these include related rail and storage opportunities such as rail loading of other upgrader products, and bitumen blends (including dilbit and synbit blends).
OperationsProvident extracts, gathers, transports, stores, fractionates and markets NGL. Geographically, Provident can be separated into two broad systems. The Redwater West System and the Empress East System.
Provident Energy AR2010 7
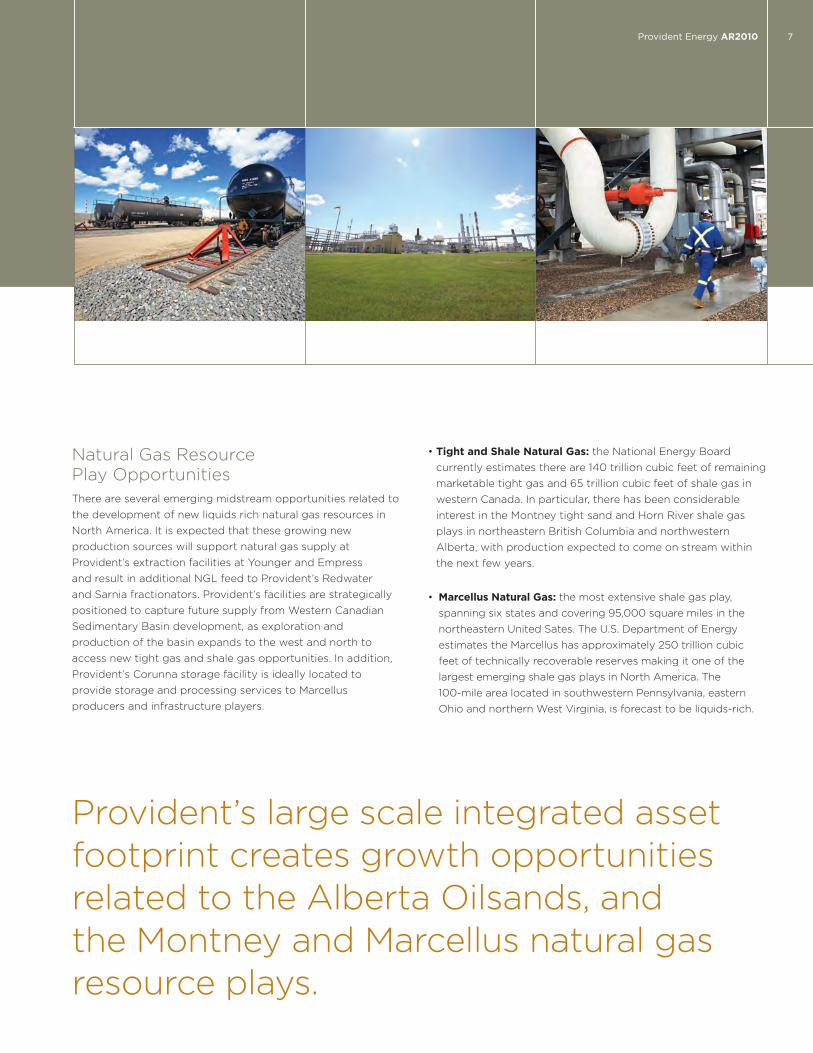
Natural Gas Resource Play OpportunitiesThere are several emerging midstream opportunities related to the development of new liquids rich natural gas resources in North America. It is expected that these growing new production sources will support natural gas supply at Provident’s extraction facilities at Younger and Empress and result in additional NGL feed to Provident’s Redwater and Sarnia fractionators. Provident’s facilities are strategically positioned to capture future supply from Western Canadian Sedimentary Basin development, as exploration and production of the basin expands to the west and north to access new tight gas and shale gas opportunities. In addition, Provident’s Corunna storage facility is ideally located to provide storage and processing services to Marcellus producers and infrastructure players.
• Tight and Shale Natural Gas: the National Energy Board currently estimates there are 140 trillion cubic feet of remaining marketable tight gas and 65 trillion cubic feet of shale gas in western Canada. In particular, there has been considerable interest in the Montney tight sand and Horn River shale gas plays in northeastern British Columbia and northwestern Alberta, with production expected to come on stream within the next few years.
• Marcellus Natural Gas: the most extensive shale gas play, spanning six states and covering 95,000 square miles in the northeastern United Sates. The U.S. Department of Energy estimates the Marcellus has approximately 250 trillion cubic feet of technically recoverable reserves making it one of the largest emerging shale gas plays in North America. The 100-mile area located in southwestern Pennsylvania, eastern Ohio and northern West Virginia, is forecast to be liquids-rich.
Provident’s large scale integrated asset footprint creates growth opportunities related to the Alberta Oilsands, and the Montney and Marcellus natural gas resource plays.

8
Redwater WestPurchases NGL mix from various natural gas producers and fractionates it into finished products at the Redwater fractionation facility near Edmonton, Alberta. Also includes natural gas supply volumes extracted at the Younger NGL extraction plant located at Taylor in northeastern British Columbia.
Redwater West includes the Younger extraction plant, LGS pipeline and the Redwater fractionation, storage and terminalling facility. This system captures supply from northeast British Columbia and northwest Alberta and generates revenues through extraction, gathering, transportation, storage and fractionation of NGL into finished products. Incremental marketing revenues are generated from the sale and distribution of these products.
The Redwater fractionator has several significant competitive advantages including the ability to process sour NGL and is one of only two fractionation facilities in the Fort Saskatchewan area capable of processing ethane-plus. These unique characteristics provide the Redwater West System with competitive access to a broad array of NGL streams.
Growth OpportunitiesA unique footprint at Redwater, located in the Alberta Industrial Heartland, coupled with key rail and pipeline infrastructure, strongly positions Provident to provide essential services to Alberta’s growing Oilsands industry.
Opportunities include: supply, terminalling and storage of condensate used for diluting bitumen to meet pipeline transportation specifications; storage of bitumen blends; extraction of natural gas liquids from upgrader offgas; as well as rail services for products including condensate and crude oil.
Edmonton
Calgary
Superior
Chicago
Fort McMurray
Conway
Mt.Belvieu
CorunnaSarniaMarysville
Lynchburg
Houston
Mile 73 West Stoddart
La Glace Redwater
Empress
Kerrobert
Younger Plant
Provident O�ce
Midstream Storage
Non-proprietary Pipeline
Provident Pipeline
Midstream Extraction/Fractionation Facility
Truck loading/o� loading
Rail loading/o� loading
Redwater West

Provident Energy AR2010 9
The Redwater West System is comprised of the following core assets:• 100 percent ownership of the Redwater NGL fractionation
facility, incorporating a 65,000 bpd fractionation, storage and transportation facility that includes:
o 12 pipeline receipt and delivery points.
o railcar loading facilities with direct access to CN rail and indirect access to CP rail.
o multi product truck loading facilities.
o seven million gross barrels of salt cavern storage.
o 75,000 bpd condensate rail off loading facility with a 500 rail car storage yard.
• 43.3 percent ownership and 100 percent control of all products from the Younger NGL extraction plant.
• 100 percent ownership of the 565 kilometer proprietary Liquids Gathering System that runs along the Alberta-British Columbia border.
• Long-term shipping rights on the Pembina pipeline system that extends the product delivery transportation network through to the Redwater fractionation facility.
• 700 rail cars under long-term lease agreements.
Redwater West
Product / Service Revenue Type Market End Use
Ethane Sales Fee-for-Service Alberta Petrochemical
Propane & Butane Sales Product Margin
Frac SpreadWestern Canada
Western & Midwest U.S.
Heating, Crop Drying, Petrochemical, Crude
Blending, Refining
Condensate Sales Product Margin
Frac SpreadWestern Canada Heavy Oil Diluent
20102009200820072006
7695
143 140160
GROSS OPERATING MARGINRedwater West($ millions)
2010 GROSS OPERATING MARGIN CONTRIBUTION
51% Redwater West28% Empress East21% Commercial Services

10
Empress EastUtilizes Provident’s interests in large-scale, high-efficiency gas processing facilities to extract NGLs from natural gas at the Empress straddle plants and sells finished products into markets in central and eastern Canada and the eastern and midwest United States.
The Empress East System is comprised of the following core assets:• Approximately 2.0 Bcfd in extraction capacity at Empress,
Alberta comprised of:
o 67.5 percent ownership of the 1.2 bcfd capacity Provident Empress Plant.
o 33.0 percent ownership in the 2.7 bcfd capacity BP Empress 1 Plant.
o 12.4 percent ownership in the 1.1 bcfd capacity ATCO Plant.
o 8.3 percent ownership in the 2.4 bcfd capacity Spectra Plant.
• 100 percent ownership of a 55,000 bpd debutanizer at Empress, Alberta.
• 50 percent ownership in the 130,000 bpd Kerrobert pipeline and 2.5 mmbbl underground storage facility near Kerrobert, Saskatchewan which facilitates injection of NGLs into the Enbridge pipeline system.
• 18.3 percent ownership of a 300,000 barrel storage staging facility and 18.3 percent ownership of a 10,000 bpd depropanizer along the Enbridge pipeline system in Superior, Wisconsin.
• 16.5 percent ownership of an approximately 150,000 bpd fractionator, 1.7 mmbbl of raw product storage capacity, and 18.0 percent of 5.7 mmbbl of finished product storage and a rail, truck and pipeline terminalling facility in Sarnia, Ontario.
• 100 percent ownership of the Provident Corunna storage facility. The 1,000 acre site has active cavern storage capacity of 12 million barrels, consisting of 5 million barrels of hydrocarbon storage and 7 million barrels currently used for brine storage. Also includes 13 pipeline connections and a small rail off loading facility.
• A propane distribution terminal at Lynchburg, Virginia.
• 300 rail cars under long-term lease agreement.
Edmonton
Calgary
Superior
Chicago
Fort McMurray
Conway
Mt.Belvieu
CorunnaSarniaMarysville
Lynchburg
Houston
Mile 73 West Stoddart
La GlaceRedwater
EmpressKerrobert
Younger Plant
Provident O�ce
Midstream Storage
Non-proprietary Pipeline
Provident Pipeline
Midstream Extraction/Fractionation Facility
Truck loading/o� loading
Rail loading/o� loading
The Empress facilities straddle the major export pipelines transporting natural gas from the Western Canadian Sedimentary Basin to eastern Canadian and U.S. markets. The Empress facilities are connected to Sarnia through the Enbridge Pipeline System via key proprietary pipeline and storage facilities located at Kerrobert, Saskatchewan and Superior, Wisconsin. This integrated west-to-east NGL system provides highly competitive access to premium-priced markets for the distribution and sale of specification products.
Empress East
Provident Energy AR2010 11
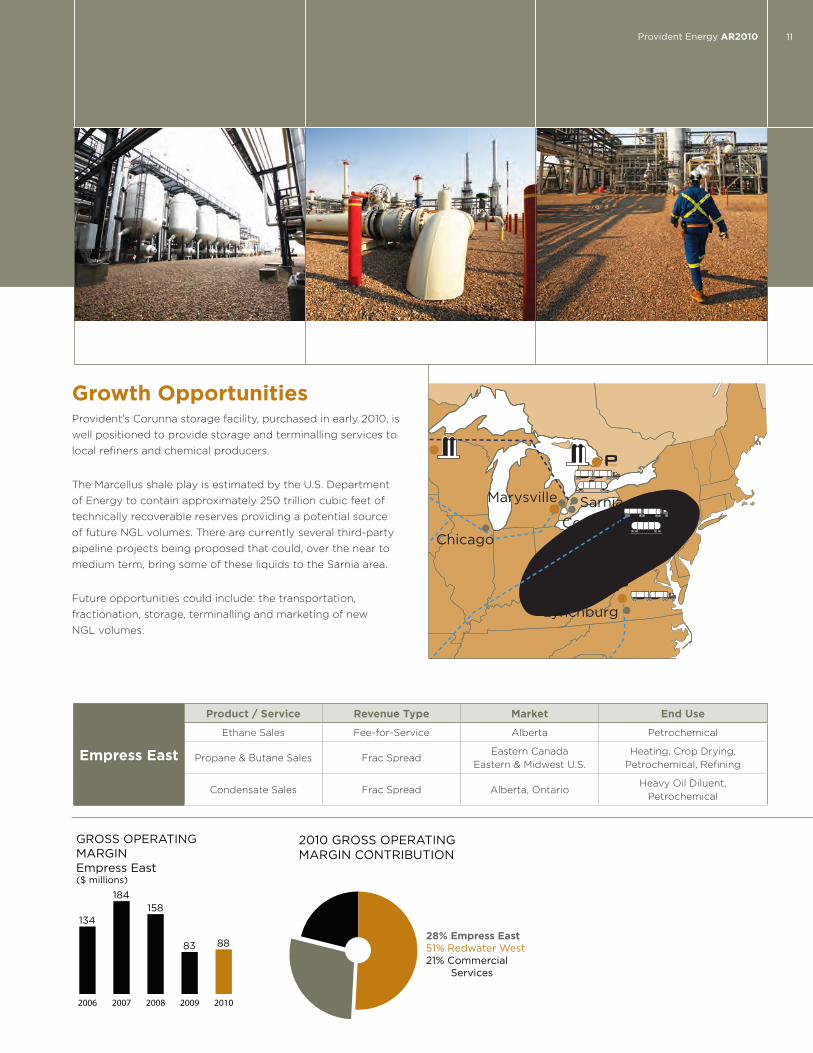
Growth OpportunitiesProvident’s Corunna storage facility, purchased in early 2010, is well positioned to provide storage and terminalling services to local refiners and chemical producers.
The Marcellus shale play is estimated by the U.S. Department of Energy to contain approximately 250 trillion cubic feet of technically recoverable reserves providing a potential source of future NGL volumes. There are currently several third-party pipeline projects being proposed that could, over the near to medium term, bring some of these liquids to the Sarnia area.
Future opportunities could include: the transportation, fractionation, storage, terminalling and marketing of new NGL volumes.
Edmonton
Calgary
Superior
Chicago
Fort McMurray
Conway
Mt.Belvieu
CorunnaSarniaMarysville
Lynchburg
Houston
Mile 73 West Stoddart
La Glace Redwater
Empress
Kerrobert
Younger Plant
Provident O�ce
Midstream Storage
Non-proprietary Pipeline
Provident Pipeline
Midstream Extraction/Fractionation Facility
Truck loading/o� loading
Rail loading/o� loading
Marcellus ShaleEmpress East
Product / Service Revenue Type Market End Use
Ethane Sales Fee-for-Service Alberta Petrochemical
Propane & Butane Sales Frac SpreadEastern Canada
Eastern & Midwest U.S.Heating, Crop Drying,
Petrochemical, Refining
Condensate Sales Frac Spread Alberta, OntarioHeavy Oil Diluent,
Petrochemical
20102009200820072006
134
184158
83 88
GROSS OPERATINGMARGINEmpress East($ millions)
2010 GROSS OPERATINGMARGIN CONTRIBUTION
28% Empress East51% Redwater West21% Commercial Services
Empress East

12
Commercial ServicesGenerates stable fee-for-service income primarily through the utilization of its Redwater West and Empress East assets to provide services to upstream, midstream and downstream customers. Services include, but are not limited to, pipeline transportation, fractionation, storage and terminalling for specification products, condensate and other products.
Commercial Services revenues are primarily generated through the utilization of Provident’s Redwater West System. Third-party storage and terminalling of specification products has been a long standing service provided by Provident for its customers. The condensate terminal, located at the Redwater facility, was originally commissioned in 2006. Rail capacity was doubled in 2007 along with the construction of additional re-delivery pipeline connections. The facility currently has a rail unloading capacity of 110 rail cars per day or 75,000 bpd, with further expansion expected as opportunities materialize and cavern storage becomes available.
Provident has recently commissioned two new, fully-contracted 500,000 bbl storage caverns, which were placed into condensate service. An additional four storage caverns are currently being developed and are forecast to be utilized for proprietary and third-party storage. Provident is also pursuing opportunities to store other products such as bitumen blends.
Provident has a long-term processing agreement with a third party for fractionation of up to 20,000 bpd of NGL mix delivered to Redwater. Fees for processing include:
• Fixed annual fee.
• Fixed operating cost charge per unit of throughput.
• Variable operating cost charge per unit of throughput.
• Delivery charges for fractionated products.
Provident owns three pipelines in the Hamburg area which are connected to the northern end of the LGS. These lines are operated on a fee-for-service basis and include the Border Extension, Border Lateral and Tanghe Creek pipelines.
Although the Kerrobert Pipeline and the Provident Debutanizer are contained within Empress East, third party income generated from these facilities is included in Commercial Services as the revenue streams are fee-based in nature.
Commercial Services
Product / Service Revenue Type Market Customers
Rail and Truck Terminalling
Fee-for-Service Alberta, Eastern CanadaCanadian E&P,
Midstream, Downstream
Third-party Storage Fee-for-Service Alberta, Eastern Canada Canadian E&P, Petrochemical,
Midstream, Downstream
Third-party Processing Fee-for-Service Alberta Canadian E&P, Midstream
Pipeline Tolling Fee-for-Service Western Canada Midstream,
Canadian E&P
20102009200820072006
4755
47
64 64
GROSS OPERATINGMARGINCommercial Services($ millions)
2010 GROSS OPERATING MARGIN CONTRIBUTION
21% Commercial Services51% Redwater West28% Empress East

Provident Energy AR2010 13
Environment, Health and SafetyEnvironmental Stewardship Provident is committed to minimizing environmental impacts in the areas in which we operate. As responsible stewards we conduct our operations in a manner that is consistent with industry standards and regulations pertaining to the environment, health and safety and to preserve the diverse wildlife and habitats.
Provident is a member of several industry organizations including:
• Northeast Capital Industrial Association (NCIA)
• Northeast Community Awareness Emergency Response (NRCAER)
• Western Canada Spill Cooperative (WCSC)
• Canadian Standards Association - Z341 Storage of Hydrocarbons in Underground Formations
• Alberta Industrial Heartland - Land Trust Society
• Sturgeon County - Community Advisory Panel Canadian Crude Quality Technical Association
• Community Awareness Emergency Response (CAER)
• Chemical Valley Emergency Coordinating Organization (CVECO)
• Canadian Association of Petroleum Producers (CAPP)
Our participation in these and other organizations highlight our continual commitment to ensuring continuous improvement in environmental, health and safety performance.
The EnvironmentProvident’s facilities are operated and maintained to minimize the environmental footprint. We continually monitor and evaluate emissions at our facilities to ensure we are meeting or exceeding all emission standards for our industry.
Asset IntegrityAsset integrity plays a critical role in how we plan and operate all of our facilities. In 2010, we continued to focus on key asset integrity items such as preventative maintenance, inspections and process improvements.
We also implemented a detailed Pipeline Integrity Management Plan that further enhances our pipeline management. We have established a group to oversee and implement the enhanced pipeline integrity process. They meet regularly and when neccesary to engage other stakeholders in the overall management, risk and planning regarding our pipeline interests.
Emergency PreparednessEach facility works with local authorities, other industry participants and the local community to prepare for emergencies and unplanned events. Detailed plans are in place at each facility, employees are trained in their use, and exercises are conducted to test the effectiveness of these plans. It is expected that response preparedness and capability will continue to further improve due to this collaborative approach.
SafetySafety performance is central to our success. We continually provide all workers with “site specific” training on processes and equipment in use at all plants using both in-house and an industry standard competency management program. Our training approach includes testing, on the job practical training sessions, and supervised on the job checks.
We are proud to report that throughout 2010 Provident did not have a single reported lost time injury to either an employee or contractor. In 2011 we strive to maintain this performance and further improve our proactive approach to safety.
In our drive for continuous improvement, our Environment, Health and Safety program and framework was externally reviewed in the fourth quarter of 2010. It is expected that this will provide a foundation from which further improvement to the Environment, Health and Safety management processes may be achieved in 2011 and beyond.

14
Corporate ResponsibilityProvident takes a disciplined and responsible approach to environmental protection, health and safety, and community relations. Provident’s philosophy and attitude toward all business and stakeholder relationships is captured in our RICE values – respect, integrity, creativity and excellence. Provident also has formal policies on environment, health and safety, and community investment.
Corporate GovernanceBoard of Directors and Governance SystemsProvident is committed to the principles of good governance and employs a variety of policies, programs and practices to manage corporate governance and ensure compliance.
The Board of Directors is responsible for the stewardship of Provident by overseeing the management of the business and affairs of Provident with the goal of providing long-term shareholder value. The Board will discharge its responsibilities directly and through its three committees, consisting of the Audit Committee, the Governance, Human Resources and Compensation Committee and the Environmental, Health and Safety Committee.
The Board of Directors have developed and implemented corporate governance practices to ensure it has the authority, expertise, systems and processes to review and evaluate Provident’s strategic direction, business risks, financial and operational performance, internal controls, communication strategy and executive performance. Provident’s corporate governance policies can be found on our website at www.providentenergy.com.
Community InvestmentAs part of our commitment to the highest standards of responsible leadership, Provident believes that we have a responsibility to be a good citizen and neighbour. We take pride in maintaining an active role in the communities in which we live, work and operate.
Our community investment program encourages the investment of human and financial resources in the communities in which we live and work. We primarily focus our resources in the following core areas:
• Education: programs that develop academic skills, self respect, self reliance and personal responsibility and entrepreneurship;
• Health & Wellness: programs that promote physical and mental health, rehabilitation and the treatment of disease; and
• Community Development: programs that positively affect the long-term quality of life in a community.
In addition to monetary donations, Provident embraces and supports other investment initiatives that include In-kind donations and employee programs.
Our community investment activities extend to our field locations, where we make charitable donations in communities where we operate. Provident continues to develop and maintain active relationships with our various stakeholders in our operating areas across the country. We regularly consult with our neighbours, and remain engaged through community initiatives, meetings and open houses.
MANAGEMENT TEAM Top Row: Lee Smith Senior Manager, Empress Operations, Bill Forward Director, Accounting & Financial Reporting, Chris Rousch Director, Engineering & Projects, Don Bannerman Vice President, Planning, Garry Dlouhy Senior Manager, Redwater Operations, Breton Smith Senior Manager, Condensate Services & Development, Kim Anderson Director, Finance & Information Services, Randy Alwood Senior Manager, Corunna Operations, Glen Nelson Senior Investor Relations/Communications Analyst, Sherry Bouvier Vice President, Human Resources & AdministrationMiddle Row: Trish Adams Director, Commercial Operations, Joel Zaleschuk Director, Marketing, Gord Fika Director, Taxation, Bob Lock Vice President, Supply and Extraction, Brent Heagy Senior VP Finance, CFO, Andy Gruszecki Co-President Midstream. Front Row: Carmen Swift Manager, Risk, Lynn Rannelli Assistant Corporate Secretary, Mike Hantzsch Vice President, Midstream Business Development, Doug Haughey President & CEO, Murray Buchanan Co-President Midstream
Management’s Discussion & Analysis The following analysis provides a detailed explanation of Provident’s operating results for the year ended December 31, 2010 compared to the year ended December 31, 2009 and should be read in conjunction with the consolidated financial statements of Provident. This analysis has been prepared using information available up to March 9, 2011. Provident operates a midstream business in Canada and the United States and extracts, processes, markets, transports and offers storage of natural gas liquids (NGLs) within the integrated facilities at Younger in British Columbia, Redwater and Empress in Alberta, Kerrobert in Saskatchewan, Sarnia in Ontario, Superior in Wisconsin and Lynchburg in Virginia. Effective in the second quarter of 2010, Provident’s Canadian oil and natural gas production business (“Provident Upstream” or “COGP”) was accounted for as discontinued operations and comparative figures have been reclassified to conform with this presentation (see note 17 of the consolidated financial statements). The reporting focuses on the financial and operating measurements management uses in making business decisions and evaluating performance. This analysis contains forward-looking information and statements. See “Forward-looking information” at the end of the analysis for further discussion. The analysis refers to certain financial and operational measures that are not defined in generally accepted accounting principles (GAAP) in Canada. These non-GAAP measures include funds flow from operations, adjusted funds flow from continuing operations, adjusted EBITDA and further adjusted EBITDA to exclude realized loss on buyout of financial derivative instruments and strategic review and restructuring costs. Management uses funds flow from operations to analyze operating performance. Funds flow from operations is reviewed, along with debt repayments and capital programs in setting monthly distributions. Funds flow from operations as presented is not intended to represent cash flow from operations or operating profits for the period nor should it be viewed as an alternative to cash provided by operating activities, net earnings or other measures of financial performance calculated in accordance with Canadian GAAP. All references to funds flow from operations throughout this report are based on cash provided by operating activities before changes in non-cash working capital and site restoration expenditures. See “reconciliation of non-GAAP measures”. Management uses adjusted EBITDA to analyze the operating performance of the business. Adjusted EBITDA as presented does not have any standardized meaning prescribed by Canadian GAAP and therefore it may not be comparable with the calculation of similar measures for other entities. Adjusted EBITDA as presented is not intended to represent cash provided by operating activities, net earnings or other measures of financial performance calculated in accordance with Canadian GAAP. All references to adjusted EBITDA throughout this report are based on earnings before interest, taxes, depreciation, accretion, and other non-cash items (“adjusted EBITDA”). See “reconciliation of non-GAAP measures”. Recent developments Corporate conversion and corporate dividend policy On January 1, 2011, the Trust completed a conversion from an income trust structure to a corporate structure pursuant to a plan of arrangement. The conversion resulted in the reorganization of the Trust into a publicly traded, dividend-paying corporation under the name “Provident Energy Ltd.” Under the plan of arrangement, former holders of trust units of the Trust received one common share in Provident Energy Ltd. in exchange for each trust unit held in the Trust. Holders of the outstanding convertible debentures will be entitled, upon conversion, to receive common shares in Provident Energy Ltd. on the same basis that they were entitled to receive trust units of the Trust prior to the corporate conversion.
This arrangement will be accounted for on a continuity of interests basis and accordingly, the consolidated financial statements will reflect the financial position, results of operations and cash flows as if Provident Energy Ltd. had always carried on the business formerly carried on by the Trust. Assets, liabilities and equity balances will carryover at the same amount as was recognized in the Trust.
Provident Energy AR 2010 15
Provident Energy Ltd.’s dividend level, beginning with the January 2011 dividend is currently set at $0.045 per share per month, which reflects a reduction from the previous monthly cash distribution of $0.06 per unit. This dividend level is intended to allow for internally generated cash flow to support organic growth, maintain a strong balance sheet and provide sustainable monthly dividends to shareholders.
Offer to purchase convertible debentures On January 13, 2011, in connection with the recently completed corporate conversion, Provident Energy Ltd. announced an offer to purchase for cash its 6.5% convertible unsecured debentures maturing on August 31, 2012 (the “C series”) and its 6.5% convertible debentures maturing on April 30, 2011 (the “D series”) at a price equal to 101 percent of their principal amounts plus accrued and unpaid interest. The offer was completed on February 21, 2011 and resulted in Provident taking up and cancelling approximately $4 million principal amount of C series debentures and $81 million principal amount of D series debentures. The total offer price, including any accrued and unpaid interest, was funded by Provident Energy Ltd.’s existing revolving term credit facility. Following the completion of the offer, approximately $95 million principal amount of the C series debentures and approximately $69 million principal amount of the D series debentures remain outstanding in accordance with their terms. For holders of the 6.5% debentures who elected not to accept the purchase offer, the debentures will mature as originally set out in their respective indentures. The 6.5% debentures continue to trade on the TSX following the corporate conversion and Provident Energy Ltd. has assumed all covenants and obligations in respect of the debentures following the conversion. Holders of the 6.5% debentures who convert their debentures following the effective date of the conversion will receive common shares of Provident Energy Ltd. Public offering of convertible unsecured subordinated debentures In November 2010, Provident issued $172.5 million aggregate principal amount of convertible unsecured subordinated debentures. The debentures bear interest at 5.75% per annum, payable semi-annually in arrears on June 30 and December 31 each year commencing June 30, 2011, and mature on December 31, 2017. The net proceeds from the offering were initially used to repay existing indebtedness under Provident’s revolving term credit facility which was then drawn to fund the purchase of Provident’s previously issued 6.5% convertible debentures which were deposited in acceptance of the purchase offer described above, and will be further drawn to fund the payment on maturity of the remaining 6.5% convertible debentures which mature on April 30, 2011, which currently have a current face value of $68.6 million. The 5.75% debentures continue to trade on the TSX following the corporate conversion and Provident Energy Ltd. has assumed all covenants and obligations in respect of the debentures following the conversion. Holders of the 5.75% debentures who convert their debentures following the effective date of the conversion will receive common shares of Provident Energy Ltd. Upon conversion of the 5.75% debentures, Provident Energy Ltd. may elect to pay the holder cash at the option of Provident Energy Ltd. Non-recurring events In the second quarter of 2010, two non–recurring events impacted earnings, adjusted EBITDA and funds flow from operations significantly. First, Provident sold the remainder of its Upstream business unit to move forward as a pure-play Midstream infrastructure business. This transaction completed the sales process of the Upstream business and the Upstream business unit is classified as discontinued operations. Strategic review and restructuring costs associated with the continued divestment of upstream properties, the final sale of Provident’s Upstream business and the related separation of the business units were also incurred. The second significant transaction was the execution of a buyout of the fixed price financial derivative contracts that related to the Midstream business. “Adjusted funds flow from continuing operations” and “Adjusted EBITDA excluding buyout of financial derivative instruments and strategic review and restructuring costs” Given the significant impact of the transactions summarized in the preceding paragraph and detailed below, the two additional non-GAAP measures of “Adjusted funds flow from continuing operations” and “Adjusted EBITDA excluding buyout of financial derivative instruments and strategic review and restructuring costs” have been provided and are also used in the calculation of certain ratios. The adjusted non-GAAP measures are provided as an additional measure to evaluate the performance of Provident’s pure-play Midstream infrastructure business and to
16

provide additional information to assess future funds flow and earnings generating capability. See “reconciliation of non-GAAP measures”. Sale of Provident’s Upstream business On June 29, 2010, Provident completed the arrangement (the “Arrangement”) effecting the merger of Provident’s oil and natural gas production business with Midnight Oil Exploration Ltd. (Midnight) to form Pace Oil & Gas Ltd. (Pace). The transaction completed the final divestment of Provident’s Upstream business in a series of transactions between September 2009 and June 2010. As a result of this transaction, Provident’s Upstream business is accounted for as discontinued operations, commencing with the second quarter of 2010 (see note 17 of the consolidated financial statements). Total consideration from the transaction was $423.7 million, consisting of $115 million in cash, and approximately 32.5 million shares of Pace valued at $308.7 million. Associated transaction costs were $8.1 million. Under the terms of the Arrangement, Provident unitholders divested a portion of each of their Provident units to receive 0.12225 shares of Pace, which was recorded as a non-cash distribution by Provident, valued at $308.7 million. Provident recorded a loss on sale of the Upstream business, amounting to $317.7 million, net of tax, as part of net loss from discontinued operations. In the second quarter of 2010, Provident completed an internal reorganization to reflect the continued divestment of its upstream properties and incurred costs to complete the separation of the business units. This resulted in staff reductions at all levels of the organization, including senior management. For the year ended December 31, 2010, strategic review and restructuring costs were $31.7 million, of which $13.8 million were attributable to continuing operations (2009 – $12.3 million and $9.3 million, respectively). The costs are comprised primarily of severance, consulting and legal costs related to the sale of the Upstream business. In the fourth quarter of 2010, $1.9 million in costs were incurred related to Provident’s reorganization into a dividend paying corporation effective January 1, 2011. Midstream financial derivative contract buyout In April 2010, Provident completed the buyout of all fixed price crude oil and natural gas swaps associated with the Midstream business for a total realized loss of $199.1 million. The carrying value of the specific contracts at March 31, 2010 was a liability of $177.7 million, resulting in an offsetting unrealized gain in the second quarter of 2010. The $199.1 million buyout represents a cash cost and reduces funds flow from operations and adjusted EBITDA. The offsetting unrealized gain of $177.7 million is not reflected in Provident’s funds flow from operations or adjusted EBITDA as it is a non-cash recovery. See “Commodity price risk management program”.
Provident Energy AR 2010 17

Funds flow from continuing operations and distributions
($ 000s, except per unit data) 2010 2009 % Change
$ (7,985) $ 147,854 - $ 204,856 $ 157,109 30
$ 0.77 $ 0.60 28 $ 0.73 $ 0.60 22 $ 191,639 $ 196,217 (2)$ 0.72 $ 0.75 (4)
94% 125% (25)
96% 127% (24)
Adjusted funds flow from continuing operations(1)
Year ended December 31,
Declared distributions
Funds flow from continuing operations and distributionsFunds flow from continuing operations
Per weighted average unit
- diluted (2) - basic
Per unit
Percent of adjusted funds flow from continuing operations, net of sustaining capital spending, paid out as declared distributions
(2) Includes dilutive impact of convertible debentures.
(1) Adjusted funds flow from operations excludes realized loss on buyout of financial derivative instruments and strategic review and restructuring costs.
Percent of adjusted funds flow from continuing operations paid out as declared distributions
Funds flow from operations includes the impact of the Midstream financial derivative contract buyout, as well as strategic review and restructuring costs associated with the separation and divestment of Provident’s Upstream business and the corporate conversion. Adjusted funds flow from continuing operations is presented as a measure to evaluate the performance of Provident’s pure-play Midstream infrastructure business and to provide additional information to assess future funds flow generating capability. For the year ended December 31, 2010, adjusted funds flow from continuing operations was $204.9 million, 30 percent above the $157.1 million in 2009. The increase is attributed to a nine percent increase in gross operating margin in 2010, as well as lower realized losses on financial derivative instruments, lower general and administrative expenses, and a current income tax recovery. Declared distributions in 2010 totaled $191.6 million, 94 percent of adjusted funds flow from continuing operations. This compares to $196.2 million of declared distributions in the comparable period of 2009, 125 percent of adjusted funds flow from continuing operations. These ratios are impacted by realized losses on financial derivative instruments incurred prior to the buyout of the contracts in April 2010. In addition to cash distributions, Provident also made a non-cash distribution to unitholders in the second quarter of 2010 relating to the disposition of Provident’s Upstream business. This distribution was valued at $308.7 million, or $1.16 per unit. Reconciliation of non-GAAP measures Provident calculates earnings before interest, taxes, depreciation, accretion and other non-cash items (adjusted EBITDA) and adjusted EBITDA excluding buyout of financial derivative instruments and strategic review and restructuring costs within its MD&A disclosure. These are non-GAAP measures. A reconciliation to income (loss) from continuing operations before taxes follows:
18

Continuing operations($ 000s) 2010 2009 % Change
Income (loss) before taxes from continuing operations $ 64,842 $ (30,019) - Adjusted for:Interest expense 29,723 24,810 20Unrealized gain offsetting buyout of financial derivative instruments (177,723) - - Unrealized loss on financial derivative instruments 52,599 111,610 (53)Depreciation and accretion 45,718 53,164 (14)Unrealized foreign exchange (gain) loss and other (3,786) 4,095 - Non-cash unit based compensation expense 1,280 4,569 (72)
Adjusted EBITDA $ 12,653 $ 168,229 (92)
Adjusted for:Realized loss on buyout of financial derivative instruments $ 199,059 $ - - Strategic review and restructuring costs $ 13,782 $ 9,255 49Adjusted EBITDA excluding buyout of financial derivative instruments and strategic review and restructuring costs $ 225,494 $ 177,484 27
Year ended December 31,
The following table reconciles funds flow from operations and adjusted funds flow from continuing operations with cash (used in) provided by operating activities:
Reconciliation of funds flow from continuing operations($ 000s) 2010 2009 % Change
Cash (used in) provided by operating activities $ (39,669) $ 304,248 - Change in non-cash operating working capital 27,207 (45,641) - Site restoration expenditures - discontinued operations 2,041 5,399 (62) Funds flow (used in) from operations (10,421) 264,006 - Funds flow from discontinued operations 2,436 (116,152) - Realized loss on buyout of financial derivative instruments 199,059 - - Strategic review and restructuring costs 13,782 9,255 49 Adjusted funds flow from continuing operations $ 204,856 $ 157,109 30
Year ended December 31,
Outlook The following outlook contains forward-looking information regarding possible events, conditions or results of operations in respect of Provident that is based on assumptions about future economic conditions and courses of action. There are a number of risks and uncertainties which could cause actual events or results to differ materially from those anticipated by Provident and described in the forward-looking information. See “Forward-looking information” in this MD&A for additional information regarding assumptions and risks in respect of Provident’s forward-looking information. Provident’s financial objectives are based on a five year outlook for our core operations. Over that period Provident has targeted an average annualized adjusted EBITDA growth rate of 5% to 7%, a ratio of total debt to adjusted EBITDA of approximately 2.5 to 1 times, a payout ratio of 80% of adjusted funds flow from continuing operations, net of sustaining capital spending, and to provide dividend stability to our shareholders. These objectives are based on a number of assumptions around Provident’s ability to deploy capital, the interval between capital deployment
Provident Energy AR 2010 19

and resulting earnings contributions, maintenance costs, commodity pricing and natural gas and natural gas liquids supply and associated extraction premiums. Management anticipates that in 2011 Provident will generate adjusted EBITDA in the range of $200 million to $250 million, subject to market and operational assumptions including normal weather conditions. This guidance is based, in part, on 2011 average price assumptions of U.S. WTI crude $98.30/bbl, AECO natural gas $3.40/gj, Cdn/U.S. dollar exchange rate of $0.99, and a Mont Belvieu propane price at 57 percent of crude oil. The average U.S. WTI crude price of $98.30 includes a January, 2011 price of $89.23 escalating to a December, 2011 price of $101.00. This guidance also assumes that extraction premiums at Empress for 2011 will be near the high end of the historical average range of between $1 and $7 per gigajoule (gj). Similar to prior years, due to the seasonal nature of the demand and pricing for natural gas liquids (NGL) products, Provident anticipates higher adjusted EBITDA will be generated in the first and fourth quarters of 2011. Provident further anticipates that a plus or minus Cdn$1.00 change in Market Frac Spread will impact annual adjusted EBITDA by approximately $7 million, excluding the impact of our commodity risk management program. Provident’s Market Frac Spread sensitivity is based on NGL acquired through extraction from the natural gas stream. Currently, frac spread sales volumes at Empress and Redwater average approximately 20,000 barrels per day. Provident calculates Market Frac Spread as the difference between Mont Belvieu NGL prices converted to Canadian dollars per barrel and the AECO gas price per gj converted to Canadian dollars per barrel at 4.24 gj’s purchased to extract one barrel of NGL product. The average Market Frac Spread NGL barrel is assumed to be comprised of 65% propane, 14% normal butane, 11% iso-butane, and 10% condensate. A complete summary of Provident’s commodity risk management program can be found on our website at www.providentenergy.com. Provident has a capital budget of approximately $95 million for 2011. The company plans to allocate approximately $17 million of this budget towards the expansion and construction of rail and truck terminalling infrastructure at the Corunna storage facility near Sarnia, Ontario. Once complete, these expansions will allow Provident to terminal and store NGL for the local markets as well as from eastern Canada and the U.S. In addition, Provident is also reviewing future joint venture opportunities to facilitate the pipeline and rail movement of NGL from the Marcellus Shale play in Pennsylvania to the storage facility at Corunna. Provident’s Corunna facility is ideally located to be a terminalling hub for NGL from the rapidly growing Marcellus natural gas play. In combination with its ownership in the Sarnia fractionator, future services could include extraction, transportation, fractionation, storage and marketing of Marcellus NGL products beginning within the next two to five years. At Redwater, Provident will direct approximately $15 million towards advancing a 500,000 barrel cavern that will be commissioned in late 2011, continue work on two other caverns of equal size scheduled for completion in 2012 and 2013, commence work on a fourth cavern to be commissioned in early 2014, and complete work on a brine pond to facilitate these future cavern operations. Provident also plans to undertake a $4 million flare stack recovery initiative to capture and consume certain byproduct gases, increasing efficiency and reducing emissions. At Younger, under a joint venture arrangement, Provident plans to construct a 16-inch rich gas pipeline from a Montney gas plant to the AltaGas/Provident Younger deep cut natural gas processing facility in northeastern British Columbia. The 25 km Younger Septimus Pipeline will support the gathering of up to 250 million cubic feet per day of natural gas from the liquids-rich Montney area. Provident estimates the pipeline will become fully operational by the fourth quarter of 2011. Existing capacity at the Younger Plant will be used for the recovery of ethane plus natural gas liquids and delivery of the remaining sales gas to downstream natural gas pipelines. Through the recovery of the ethane plus liquids, producers should benefit from improved netback prices for their natural gas and increased barrel equivalent production. The estimated cost to complete the pipeline is approximately $30 million, of which Provident has committed $9 million. Provident plans to begin construction to upgrade and replace an aging section of the Taylor to Boundary Lake Pipeline on its Liquids Gathering System. Project start-up is anticipated during the first quarter of 2011. The total project cost is estimated to be $28 million with half being allocated to growth capital to extend the operational life of the pipeline.
20
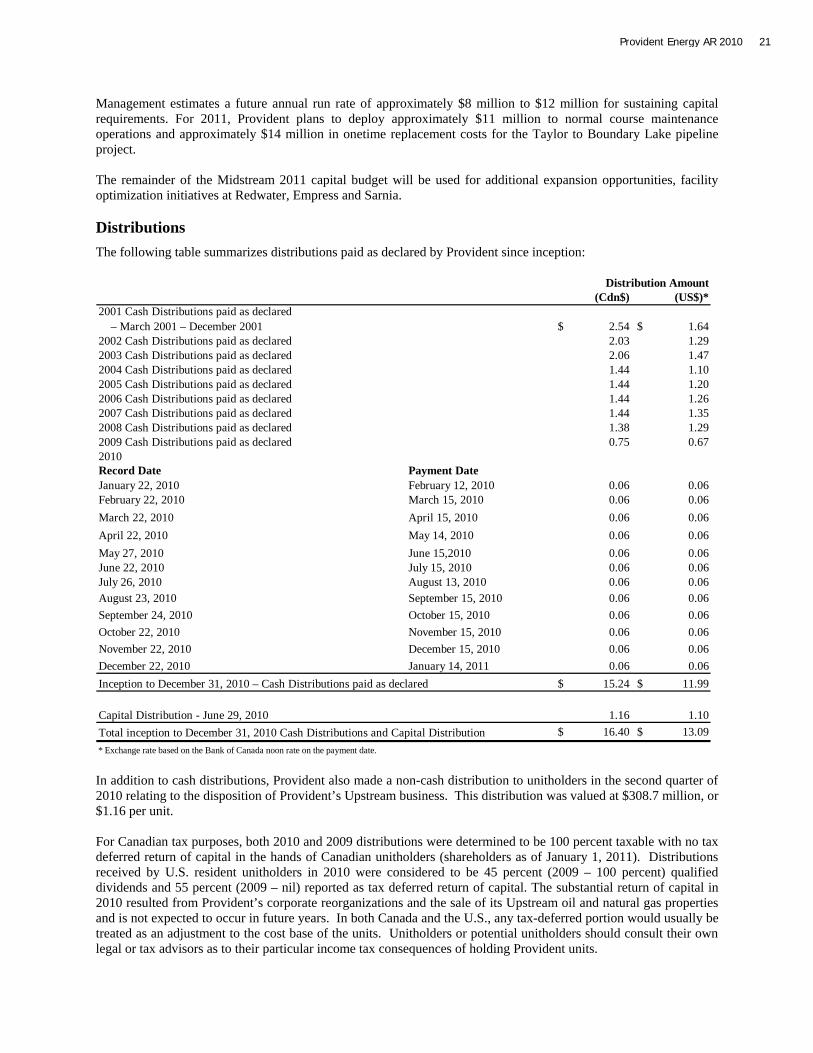
Management estimates a future annual run rate of approximately $8 million to $12 million for sustaining capital requirements. For 2011, Provident plans to deploy approximately $11 million to normal course maintenance operations and approximately $14 million in onetime replacement costs for the Taylor to Boundary Lake pipeline project. The remainder of the Midstream 2011 capital budget will be used for additional expansion opportunities, facility optimization initiatives at Redwater, Empress and Sarnia. Distributions The following table summarizes distributions paid as declared by Provident since inception:
(Cdn$) (US$)*2001 Cash Distributions paid as declared – March 2001 – December 2001 $ 2.54 $ 1.64 2002 Cash Distributions paid as declared 2.03 1.29 2003 Cash Distributions paid as declared 2.06 1.47 2004 Cash Distributions paid as declared 1.44 1.10 2005 Cash Distributions paid as declared 1.44 1.20 2006 Cash Distributions paid as declared 1.44 1.26 2007 Cash Distributions paid as declared 1.44 1.35 2008 Cash Distributions paid as declared 1.38 1.29 2009 Cash Distributions paid as declared 0.75 0.67 2010Record Date Payment DateJanuary 22, 2010 February 12, 2010 0.06 0.06 February 22, 2010 March 15, 2010 0.06 0.06 March 22, 2010 April 15, 2010 0.06 0.06 April 22, 2010 May 14, 2010 0.06 0.06 May 27, 2010 June 15,2010 0.06 0.06 June 22, 2010 July 15, 2010 0.06 0.06 July 26, 2010 August 13, 2010 0.06 0.06 August 23, 2010 September 15, 2010 0.06 0.06 September 24, 2010 October 15, 2010 0.06 0.06 October 22, 2010 November 15, 2010 0.06 0.06 November 22, 2010 December 15, 2010 0.06 0.06 December 22, 2010 January 14, 2011 0.06 0.06
$ 15.24 $ 11.99
Capital Distribution - June 29, 2010 1.16 1.10 $ 16.40 $ 13.09
Distribution Amount
Total inception to December 31, 2010 Cash Distributions and Capital Distribution* Exchange rate based on the Bank of Canada noon rate on the payment date.
Inception to December 31, 2010 – Cash Distributions paid as declared
In addition to cash distributions, Provident also made a non-cash distribution to unitholders in the second quarter of 2010 relating to the disposition of Provident’s Upstream business. This distribution was valued at $308.7 million, or $1.16 per unit. For Canadian tax purposes, both 2010 and 2009 distributions were determined to be 100 percent taxable with no tax deferred return of capital in the hands of Canadian unitholders (shareholders as of January 1, 2011). Distributions received by U.S. resident unitholders in 2010 were considered to be 45 percent (2009 – 100 percent) qualified dividends and 55 percent (2009 – nil) reported as tax deferred return of capital. The substantial return of capital in 2010 resulted from Provident’s corporate reorganizations and the sale of its Upstream oil and natural gas properties and is not expected to occur in future years. In both Canada and the U.S., any tax-deferred portion would usually be treated as an adjustment to the cost base of the units. Unitholders or potential unitholders should consult their own legal or tax advisors as to their particular income tax consequences of holding Provident units.
Provident Energy AR 2010 21
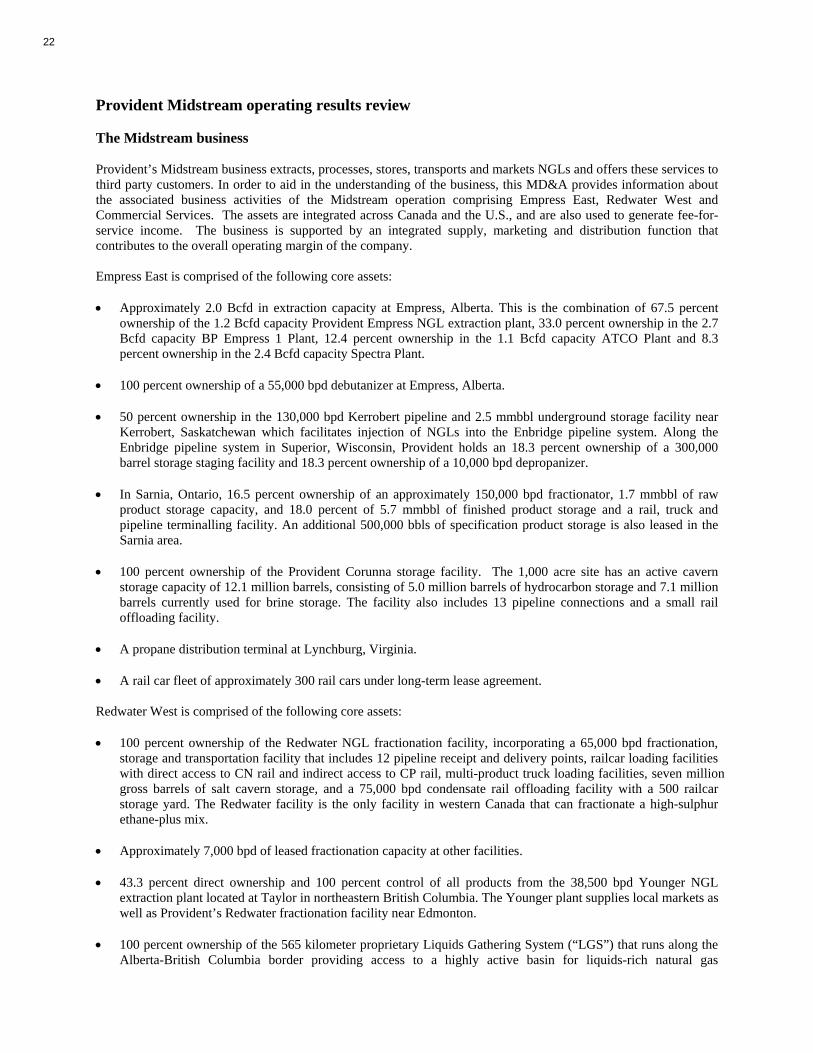
Provident Midstream operating results review The Midstream business Provident’s Midstream business extracts, processes, stores, transports and markets NGLs and offers these services to third party customers. In order to aid in the understanding of the business, this MD&A provides information about the associated business activities of the Midstream operation comprising Empress East, Redwater West and Commercial Services. The assets are integrated across Canada and the U.S., and are also used to generate fee-for-service income. The business is supported by an integrated supply, marketing and distribution function that contributes to the overall operating margin of the company.
Empress East is comprised of the following core assets: • Approximately 2.0 Bcfd in extraction capacity at Empress, Alberta. This is the combination of 67.5 percent
ownership of the 1.2 Bcfd capacity Provident Empress NGL extraction plant, 33.0 percent ownership in the 2.7 Bcfd capacity BP Empress 1 Plant, 12.4 percent ownership in the 1.1 Bcfd capacity ATCO Plant and 8.3 percent ownership in the 2.4 Bcfd capacity Spectra Plant.
• 100 percent ownership of a 55,000 bpd debutanizer at Empress, Alberta. • 50 percent ownership in the 130,000 bpd Kerrobert pipeline and 2.5 mmbbl underground storage facility near
Kerrobert, Saskatchewan which facilitates injection of NGLs into the Enbridge pipeline system. Along the Enbridge pipeline system in Superior, Wisconsin, Provident holds an 18.3 percent ownership of a 300,000 barrel storage staging facility and 18.3 percent ownership of a 10,000 bpd depropanizer.
• In Sarnia, Ontario, 16.5 percent ownership of an approximately 150,000 bpd fractionator, 1.7 mmbbl of raw
product storage capacity, and 18.0 percent of 5.7 mmbbl of finished product storage and a rail, truck and pipeline terminalling facility. An additional 500,000 bbls of specification product storage is also leased in the Sarnia area.
• 100 percent ownership of the Provident Corunna storage facility. The 1,000 acre site has an active cavern
storage capacity of 12.1 million barrels, consisting of 5.0 million barrels of hydrocarbon storage and 7.1 million barrels currently used for brine storage. The facility also includes 13 pipeline connections and a small rail offloading facility.
• A propane distribution terminal at Lynchburg, Virginia. • A rail car fleet of approximately 300 rail cars under long-term lease agreement. Redwater West is comprised of the following core assets: • 100 percent ownership of the Redwater NGL fractionation facility, incorporating a 65,000 bpd fractionation,
storage and transportation facility that includes 12 pipeline receipt and delivery points, railcar loading facilities with direct access to CN rail and indirect access to CP rail, multi-product truck loading facilities, seven million gross barrels of salt cavern storage, and a 75,000 bpd condensate rail offloading facility with a 500 railcar storage yard. The Redwater facility is the only facility in western Canada that can fractionate a high-sulphur ethane-plus mix.
• Approximately 7,000 bpd of leased fractionation capacity at other facilities. • 43.3 percent direct ownership and 100 percent control of all products from the 38,500 bpd Younger NGL
extraction plant located at Taylor in northeastern British Columbia. The Younger plant supplies local markets as well as Provident’s Redwater fractionation facility near Edmonton.
• 100 percent ownership of the 565 kilometer proprietary Liquids Gathering System (“LGS”) that runs along the
Alberta-British Columbia border providing access to a highly active basin for liquids-rich natural gas
22

exploration and exploitation. Provident also has long-term shipping rights on the Pembina pipeline system that extends the product delivery transportation network through to the Redwater fractionation facility.
• A rail car fleet of approximately 700 rail cars under long-term lease agreement. Commercial Services includes services such as fractionation, storage, LPG terminalling, loading and offloading that are provided to third parties on a fee basis utilizing assets at Provident’s Redwater facility. In addition, pipeline tariff income is generated from Provident’s ownership of the Liquids Gathering System in Northwest Alberta which flows into Pembina’s pipeline from LaGlace to Redwater. Provident also collects tariff income from its 50 percent ownership in the Kerrobert Pipeline which transports NGLs from Empress to Kerrobert for injection into the Enbridge pipeline for delivery to Sarnia. Provident owns a debutanizer at its Empress facility, which removes condensate from the NGL mix for sale as a diluent to blend with heavy oil. This service is provided to a major energy company on a long term cost of service basis. Earnings from these activities have little direct exposure to market price volatility and are thus relatively stable. The assets used to generate this fee-for service income are also employed to generate proprietary income in Empress East and Redwater West. Provident’s integrated marketing arm has offices in Calgary, Alberta, Sarnia, Ontario, and Houston, Texas and operates under the brand name Kinetic. Rather than selling NGL produced by the Empress East and Redwater West facilities at the plant gate, the marketing and logistics group utilizes Provident’s integrated suite of transportation, storage and logistics assets to access markets across North America. Due to its broad marketing scope, Provident’s NGL products are priced based on multiple pricing indices. These indices generally correspond with the four major NGL trading hubs in North America which are located in Mont Belvieu, Texas, Conway, Kansas, Edmonton, Alberta, and Sarnia, Ontario. Mont Belvieu, the largest NGL trading center, serves as the reference point for NGL pricing in North America. By strategically building inventories of specification products during lower priced periods which can then be distributed into premium-priced markets across North America during periods of high seasonal demand, Provident is able to optimize the margins it earns from its extraction and fractionation operations. Provident’s marketing group also generates margins by benefitting from location price differentials and arbitrage trading opportunities. Midstream asset acquisitions On March 31, 2010, Provident purchased a storage facility in Corunna, Ontario. The facility is located in close proximity to Provident’s existing operations in Sarnia, Ontario. The 1,000 acre site has an active cavern storage capacity of 12.1 million barrels, consisting of 5.0 million barrels of hydrocarbon storage and 7.1 million barrels currently used for brine storage. The facility also includes 13 pipeline connections and a small rail offloading facility. This facility is well situated to be a terminalling hub for NGLs from the rapidly growing Marcellus Gas play. Provident allocated a significant portion of its 2010 capital budget towards the expansion and construction of pipeline, rail and truck terminalling infrastructure at the Corunna storage facility. Provident anticipates that these upgrades will enhance operating flexibility and commercial opportunities at Sarnia in the future. The Corunna storage facility significantly enhances the flexibility by allowing Provident to strategically build inventories during lower priced summer months, which are then sold into premium priced markets during the peak winter season. The Corunna storage facility will also be used to generate revenues from third-party storage of NGLs. In 2010 Provident used the Corunna facility to store product produced in summer months for sale in the higher priced winter market. On August 12, 2009, Provident purchased an additional 6.15 percent interest in the Sarnia fractionation facilities for $14.8 million and a deferred payment of $3.7 million for a future facility enhancement. This acquisition increased Provident’s ownership in the Sarnia fractionator, effective August 1, 2009, to approximately 16.5 percent, increasing propane-plus fractionation capacity in the Empress East system by approximately 7,400 bpd to 20,000 bpd in total. This acquisition replaced the 6,000 bpd of formerly leased capacity at Sarnia that expired on April 1, 2009. Long term contracts Provident has several long-term contracts in place to help ensure product availability and to secure long-term revenue streams. These contracts include: • A long-term purchase agreement for NGL mix at the Younger NGL extraction plant.
Provident Energy AR 2010 23
• A significant portion of the available propane, butane and condensate (“propane-plus”) fractionation capacity at the Redwater fractionation facility is contracted through a long term fee-for-service arrangement with third parties.
• The ethane produced from Provident’s facilities at Empress and Redwater is largely sold under long-term
contracts. • A significant portion of Provident’s 75,000 bpd capacity of condensate rail off-loading is under long-term
contracts with two major energy producers. • The majority of the condensate storage capacity of 500,000 barrels at Redwater is sold under long-term
contracts to various third parties, a number of which are major energy producers, with terms averaging from two to five years.
• A long-term significant propane sales contract at Redwater. • A long-term contract on a cost of service basis for the majority of its 50,000 bbl/d Empress debutanizer facility
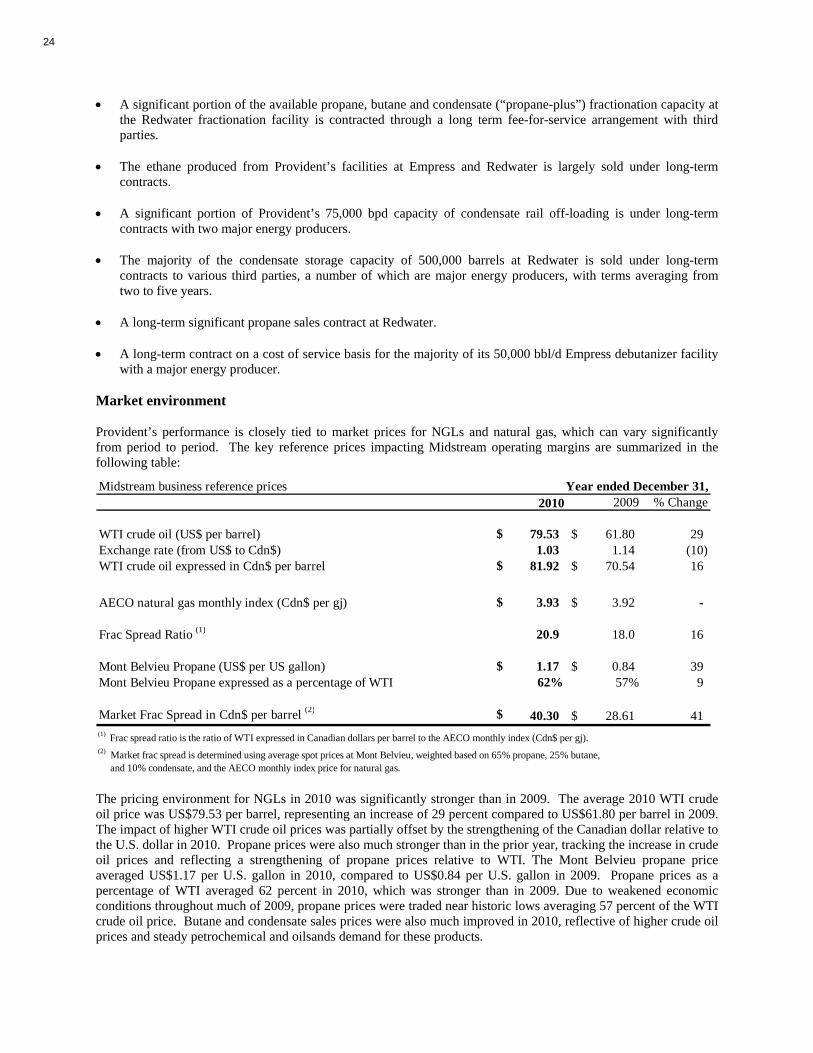
with a major energy producer. Market environment Provident’s performance is closely tied to market prices for NGLs and natural gas, which can vary significantly from period to period. The key reference prices impacting Midstream operating margins are summarized in the following table:
Midstream business reference prices2010 2009 % Change
WTI crude oil (US$ per barrel) $ 79.53 $ 61.80 29Exchange rate (from US$ to Cdn$) 1.03 1.14 (10)WTI crude oil expressed in Cdn$ per barrel $ 81.92 $ 70.54 16
AECO natural gas monthly index (Cdn$ per gj) $ 3.93 $ 3.92 -
Frac Spread Ratio (1) 20.9 18.0 16
Mont Belvieu Propane (US$ per US gallon) $ 1.17 $ 0.84 39Mont Belvieu Propane expressed as a percentage of WTI 62% 57% 9
Market Frac Spread in Cdn$ per barrel (2) $ 40.30 $ 28.61 41
Year ended December 31,
(1) Frac spread ratio is the ratio of WTI expressed in Canadian dollars per barrel to the AECO monthly index (Cdn$ per gj).(2) Market frac spread is determined using average spot prices at Mont Belvieu, weighted based on 65% propane, 25% butane, and 10% condensate, and the AECO monthly index price for natural gas. The pricing environment for NGLs in 2010 was significantly stronger than in 2009. The average 2010 WTI crude oil price was US$79.53 per barrel, representing an increase of 29 percent compared to US$61.80 per barrel in 2009. The impact of higher WTI crude oil prices was partially offset by the strengthening of the Canadian dollar relative to the U.S. dollar in 2010. Propane prices were also much stronger than in the prior year, tracking the increase in crude oil prices and reflecting a strengthening of propane prices relative to WTI. The Mont Belvieu propane price averaged US$1.17 per U.S. gallon in 2010, compared to US$0.84 per U.S. gallon in 2009. Propane prices as a percentage of WTI averaged 62 percent in 2010, which was stronger than in 2009. Due to weakened economic conditions throughout much of 2009, propane prices were traded near historic lows averaging 57 percent of the WTI crude oil price. Butane and condensate sales prices were also much improved in 2010, reflective of higher crude oil prices and steady petrochemical and oilsands demand for these products.
24

Natural gas prices in 2010 were consistent with 2009 pricing. Flat AECO natural gas pricing combined with the increase in the WTI crude oil price has improved market frac spreads in 2010 compared to 2009. While low natural gas prices are generally favorable to NGL extraction and fractionation economics, a sustained period in a low priced gas environment may impact the availability and overall cost of natural gas and NGL mix supply in western Canada, as natural gas producers may elect to shut-in production or reduce drilling activities. Continued softness in natural gas prices have improved market frac spreads but have also caused increased extraction premiums paid for natural gas supply in western Canada, particularly at Empress. Market frac spreads averaged $40.30 per barrel in 2010, representing a 41 percent increase from $28.61 per barrel in 2009. The benefit to Provident of higher market frac spreads in 2010 was partially offset by increased costs for natural gas supply in western Canada, particularly at Empress. Empress extraction premiums have increased by approximately 94 percent in 2010 relative to the prior year. Higher premiums are primarily as a result of reduced volumes of natural gas flowing past the Empress straddle plants. In 2010, natural gas throughput at the Empress Eastern border averaged approximately 4.9 bcf per day, in line with 2009 but lower than historical averages. While extraction premiums are not included in the calculation of market frac spreads, they are included, along with other costs, when determining actual extraction operating margins. Lower natural gas throughput directly impacts production at the Empress facilities which in turn reduces the propane-plus inventories available for sale in Sarnia and in surrounding eastern markets. Tighter supply at Sarnia may have a positive impact on eastern sales prices relative to other major propane hubs, including Mont Belvieu and Sarnia, during periods of high demand. Provident has partially mitigated the impact of lower natural gas based NGL supply at Empress through the purchase of NGL mix supply in western Canada. In the first quarter of 2010, Provident completed the construction of a truck rack at its Provident Empress facility and began trucking in NGL mix supply starting April 1. The mix is then transported to the premium-priced Sarnia market for fractionation and sale. Provident is also purchasing NGL mix supply from other Empress plant owners and in the Edmonton market. Unit margins are impacted by the addition of this NGL mix supply, as margins earned on frac spread gas extraction are typically higher than margins earned on NGLs purchased on a mix basis. Industry propane inventories in the United States were approximately 53 million barrels as at the end of the fourth quarter of 2010, representing an increase of approximately two million barrels compared to the prior year, and approximately three million barrels below the five year historical average. Inventory levels are trending towards the lower range of historical averages primarily due to the continued strong demand from the petrochemical sector and above average exports from the U.S. Gulf Coast to Central and South American markets. Year end 2010 Canadian industry propane inventories were approximately seven million barrels, two million barrels higher than the end of 2009 and one million barrels higher than the historic five year average. Year end 2010 propane inventories have risen at the end of 2010 compared to 2009 primarily as a result of weaker crop drying demand in the last quarter of 2010.
Provident Energy AR 2010 25

Midstream business performance Provident Midstream results can be summarized as follows:
(bpd) 2010 2009 % Change
Empress East NGL sales volumes 43,069 45,589 (6)Redwater West NGL sales volumes 63,006 67,939 (7)Total NGL sales volumes 106,075 113,528 (7)
Year ended December 31,
($ 000s) 2010 2009 (1) % Change
Empress East Margin $ 88,296 $ 83,244 6 Redwater West Margin 159,611 139,793 14 Commercial Services Margin 63,803 63,746 - Gross operating margin 311,710 286,783 9 Realized loss on financial derivative instruments (50,865) (66,743) (24) Cash general and administrative expenses (35,391) (40,754) (13) Gain on sale of assets, realized foreign exchange and other 40 (1,802) - Adjusted EBITDA excluding buyout of financial derivative instruments and strategic review and restructuring costs 225,494 177,484 27 Realized loss on buyout of financial derivative instruments (199,059) - - Strategic review and restructuring expenses (13,782) (9,255) 49 Adjusted EBITDA $ 12,653 $ 168,229 (92)
Year ended December 31,
(1) Certain transportation expenses and product margins relating to the prior year have been reclassified from Redwater West to Empress East to conform with current year presentation.
Gross operating margin
Midstream gross operating margin was $311.7 million for the year ended December 31, 2010 compared to $286.8 million in 2009. The nine percent increase was due to a higher contribution from both Empress East and Redwater West, which increased contribution by six percent and 14 percent, respectively. Gross operating margin related to Commercial Services was consistent year-over-year. Empress East Provident extracts NGLs from natural gas at the Empress straddle plants and sells finished products into markets in central Canada and the eastern United States. Demand for propane is seasonal and results in inventory that generally builds over the second and third quarters of the year and is sold in the fourth quarter and the first quarter of the following year. The margin in this business is determined primarily by the “frac spread”, which represents the difference between the selling prices for propane-plus and the input cost of the natural gas required to produce the respective NGL products. The frac spread can change significantly from period to period depending on the relationship between crude oil and natural gas prices (the “frac spread ratio”), absolute commodity prices, and changes in the Canadian to U.S. dollar foreign exchange rate. Traditionally a higher frac spread ratio and higher crude oil prices will result in stronger Empress East margins. Differentials between propane-plus and crude oil prices, as well as location price differentials will also impact the frac spread. Natural gas extraction premiums and costs relating to transportation, fractionation, storage and marketing are not included within the frac spread, however these costs are included in the operating margin. Empress East gross operating margin in 2010 was $88.3 million compared to $83.2 million in 2009. The increase in operating margin was primarily attributable to improved frac spreads brought on by the combination of increased market prices for propane-plus products combined with consistent year-over-year pricing for natural gas. The benefit of the higher frac spreads was offset by higher natural gas extraction premiums at Empress.
26

Overall, Empress East sales volumes decreased six percent to 43,069 bpd in 2010 compared to the prior year. Slight gains in condensate sales volumes were offset by decreased sales in ethane, propane and butane. Redwater West Provident purchases NGL mix from various natural gas producers and fractionates it into finished products at the Redwater fractionation facility near Edmonton, Alberta. Redwater West also includes natural gas supply volumes from the Younger NGL extraction plant located at Taylor in northeastern British Columbia. The Younger plant supplies specification NGLs to local markets as well as NGL mix supply to the Redwater fractionation facility. The feedstock for Redwater West is primarily NGL mix rather than natural gas, therefore frac spreads have a smaller impact on operating margin than in Empress East. Also located at the Redwater facility is Provident’s industry leading rail-based condensate terminal, which serves the heavy oil industry and its need for diluent. Provident’s condensate terminal is the largest of its size in western Canada and over the past several years, Provident has continuously increased its condensate market presence at Redwater through marketing, third-party terminalling and, more recently, condensate storage. In the latter half of 2009, Provident placed two 500,000 barrel storage caverns into condensate service at Redwater, and is currently developing a third cavern which will be commissioned in 2011. Income generated from the condensate terminal and caverns which relates to third-party terminalling and storage is included within Commercial Services, while income relating to proprietary condensate marketing activities remains within Redwater West. The operating margin for Redwater West in 2010 was $159.6 million, an increase of 14 percent compared to $139.8 million in 2009. Stronger 2010 results when compared to 2009 were partly the result of an increased contracted price for ethane sales and increased ethane sales volumes. In addition, increases in NGL prices were beneficial to the operating margin for propane and butane despite reduced sales volumes. Overall, Redwater West NGL sales volumes averaged 63,006 bpd in 2010, a decrease of seven percent from 2009. Ethane operating margin benefitted from increased sales volumes associated with increased NGL mix supply at Redwater as well as improved NGL market pricing in 2010. During the contracting season for the April 2010/2011 NGL year, Provident was able to replace prior year production declines and gain new incremental sources of NGL mix supply. Provident has also started to benefit from additional gas supply volumes at the Younger extraction plant as a result of the recently completed South Peace Pipeline. The South Peace Pipeline brings natural gas from the rapidly developing Montney area in northeast British Columbia to Younger for processing. Higher propane and butane margins were primarily attributable to the increase in NGL market prices which offset decreased sales volumes for these two products. The condensate margin benefitted from increased market pricing but the increase in pricing was offset by reduced sales volumes. Condensate sales volumes were lower primarily due to reduced condensate railed into Redwater from the U.S. Gulf Coast. Condensate railed to Redwater is generally purchased based on a Mt. Belvieu natural gasoline price and is sold in Edmonton using a price that is based on WTI crude. In 2010, Mt. Belvieu natural gasoline prices as a percentage of WTI averaged 97 percent, which is significantly higher than in the prior year where Mt. Belvieu natural gasoline prices averaged 88 percent of WTI. These changing market conditions impacted the economics of railing in of condensate from the U.S. Gulf Coast, and reduced overall condensate sales volumes. Commercial Services Provident also utilizes its assets to generate income from fee-for-service contracts to provide fractionation, storage, NGL terminalling, loading and offloading services. Income from pipeline tariffs from Provident’s ownership in NGL pipelines is also included in this activity. The gross operating margin for commercial services in 2010 was $63.8 million consistent with the gross operating margin in 2009. Lower fees earned for condensate terminalling, partly as a result of the termination of a multi-year condensate storage and terminalling services agreement as well as the start-up in mid-2010 of the Enbridge Southern Lights Pipeline, which transports condensate from the United States to the Edmonton area, were offset by increases in storage revenue.
Provident Energy AR 2010 27

Earnings before interest, taxes, depreciation, accretion, and other non-cash items (“adjusted EBITDA”) Adjusted EBITDA includes the impact of the Midstream financial derivative contract buyout, as well as strategic review and restructuring costs associated with the separation and divestment of Provident’s Upstream business and the corporate conversion. Management has presented a metric excluding these items as an additional measure to evaluate Provident’s performance in the period and to assess future earnings generating capability. Adjusted EBITDA excluding buyout of financial derivative instruments and strategic review and restructuring costs for 2010 increased to $225.5 million from $177.5 million in 2009 reflecting higher margins, lower realized losses on financial derivative instruments as a result of the midstream financial derivatives contract buyout program and lower general and administrative expenses. Capital expenditures Midstream capital expenditures in 2010 totaled $47.8 million. Of this total, $17.8 million was spent on the continued development of cavern storage and brine pond improvements at the Redwater fractionation facility in Redwater, Alberta, $15.0 million was spent on upgrades to caverns and rail and truck terminalling infrastructure at the Provident Corunna facility near Sarnia, Ontario, $9.1 million was spent on various infrastructure improvements related to pipelines, terminals, facilities and office related capital and $5.9 million was directed towards sustaining capital activities. In 2009, capital expenditures totaled $36.6 million with $31.1 million primarily directed towards the continued development of cavern storage, as well as condensate terminalling and storage facilities at the Redwater fractionation facility, $2.7 million was directed to sustaining capital activities, $2.1 million was added to capitalized linefill and $0.7 million was spent on office related capital. Net loss Consolidated($ 000s, except per unit data) 2010 2009 % Change
Net income from continuing operations $ 103,492 $ 5,168 1,903 Net loss from discontinued operations (438,587) (94,188) 366 Net loss $ (335,095) $ (89,020) 276 Per weighted average unit – basic (1) $ (1.26) $ (0.34) 271 – diluted (2) $ (1.18) $ (0.34) 247
Year ended December 31,
(1) Based on weighted average number of trust units outstanding.(2) Based on weighted average number of trust units outstanding including the dilutive impact of the convertible debentures.
In 2010, Provident recorded a net loss of $335.1 million. The net income from continuing operations of $103.5 million in 2010 was offset by a net loss from discontinued operations of $438.6 million attributed to the sale of the Upstream business in the second quarter of 2010. Net income from continuing operations in 2010 was $103.5 million, compared to $5.2 million in 2009. This increase was due to higher adjusted EBITDA, increased current tax recoveries, and a significant change in unrealized financial derivative instruments from a $111.6 million unrealized loss on financial derivative instruments in 2009 to a $52.6 million unrealized loss on financial derivative instruments in 2010. Under Canadian generally accepted accounting principles (Canadian GAAP), there is a requirement to “mark-to-market” all financial derivative instruments at a point in time and, as Provident does not apply hedge accounting, these unrealized gains or losses are reported as part of current period income. Because Provident’s commodity price risk management program involves the use of financial derivative instruments with terms that currently extend over two years into the future, net earnings can show substantial variation that is not necessarily related to current operations. In addition, a $12.4 million intangible asset impairment charge was recorded in depreciation and accretion in 2009. These factors were partially offset by increased interest expenses and the impact of the buyout of the financial derivative instruments in 2010.
28

Taxes
Continuing operations($ 000s) 2010 2009 % Change
Current tax (recovery) expense $ (6,956) $ 225 - Future income tax recovery (31,694) (35,412) (10)
$ (38,650) $ (35,187) 10
Year ended December 31,
The current tax recovery in 2010 of $7.0 million (2009 - $0.2 million current tax expense) is attributed to applying tax loss carryback allowing the recovery of taxes paid in prior periods. The tax losses were generated primarily by the realized loss on buyout of financial derivative instruments incurred in the second quarter of 2010.
The future income tax recovery in 2010 was $31.7 million compared to a recovery of $35.4 million in 2009. In both 2010 and 2009, future income tax recoveries were recorded as a result of losses created by interest deductions at the incorporated subsidiary level and unrealized losses on financial derivative instruments. In 2010, additional future income tax recoveries were recorded related to tax loss carryforwards generated at the Trust level.
Provident has estimated its future income taxes based on estimates of results of operations and tax pool claims and cash dividends in the future. Provident’s estimate of its future income taxes will vary as these underlying estimates change and such variations may be material.
On January 1, 2011, the Trust completed a conversion from an income trust structure to a corporate structure pursuant to a plan of arrangement. The conversion resulted in the reorganization of the Trust into a publicly traded, dividend-paying corporation under the name “Provident Energy Ltd.” (see note 19 of the consolidated financial statements). Unitholders exchanged all of their trust units for common shares in Provident Energy Ltd. on a one-for-one basis.
Subsequent to the corporate conversion, Canadian shareholders receive taxable dividends eligible for the dividend tax credit. The tax impact of the dividends and the Canadian withholding tax may be different for shareholders depending on their jurisdiction and whether they are holding their investment in a taxable account or tax-deferred account. Dividends received by U.S. residents after 2010 may be treated as qualified dividends or return of capital, depending on U.S. tax legislation.
At December 31, 2010 Provident has approximately $1.0 billion of tax pools and non-capital losses available to claim against taxable income under a corporate structure.
Interest expense
Continuing operations($ 000s, except as noted) 2010 2009 % Change
Interest on bank debt $ 9,316 $ 9,634 (3)Interest on convertible debentures 17,538 17,355 1 Discontinued operations portion (2,501) (6,839) (63) Total cash interest $ 24,353 $ 20,150 21
Weighted average interest rate on all long-term debt 4.8% 3.6% 33 Debenture accretion and other non-cash interest expense 5,370 4,828 11Discontinued operations portion - (168) (100)Total interest expense $ 29,723 $ 24,810 20
Year ended December 31,
Interest expense increased in 2010 compared to 2009. Although, Provident maintained lower debt levels as a result of the strategic asset dispositions that closed in the third and fourth quarters of 2009 and in the first and second quarters of 2010, higher market interest rates in 2010 and the prior period allocation of interest expense to discontinued operations have resulted in higher interest expense in 2010.
Provident Energy AR 2010 29
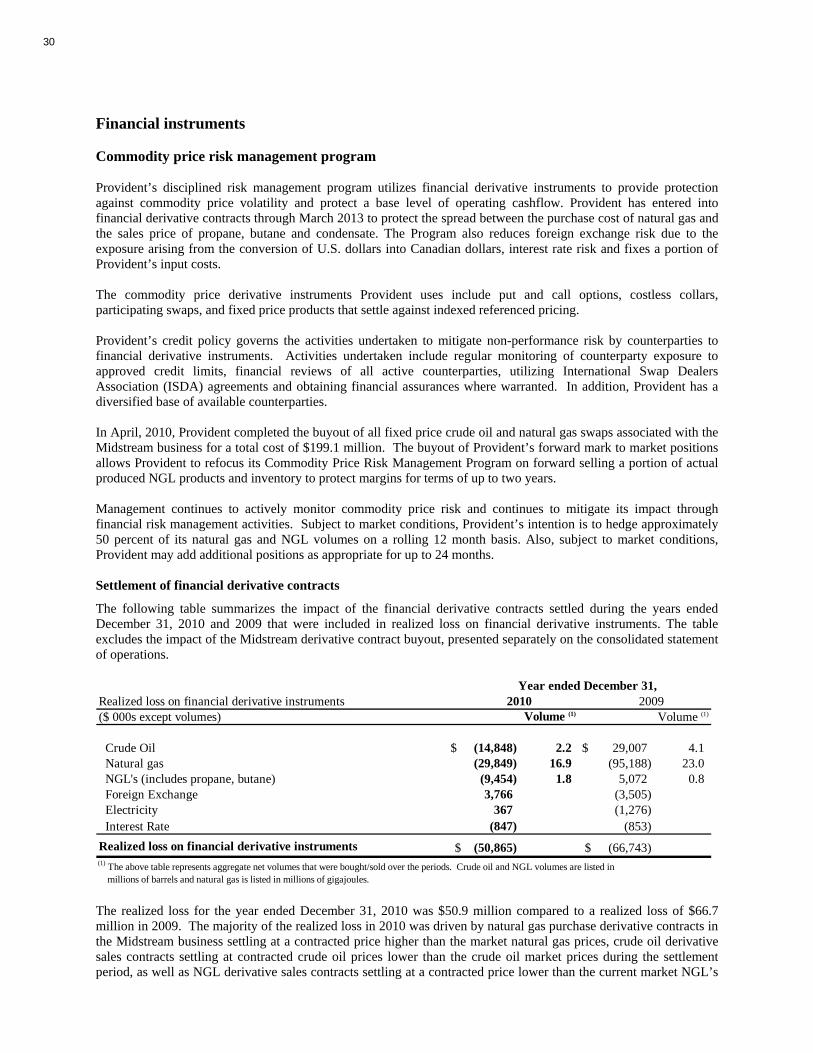
Financial instruments Commodity price risk management program Provident’s disciplined risk management program utilizes financial derivative instruments to provide protection against commodity price volatility and protect a base level of operating cashflow. Provident has entered into financial derivative contracts through March 2013 to protect the spread between the purchase cost of natural gas and the sales price of propane, butane and condensate. The Program also reduces foreign exchange risk due to the exposure arising from the conversion of U.S. dollars into Canadian dollars, interest rate risk and fixes a portion of Provident’s input costs. The commodity price derivative instruments Provident uses include put and call options, costless collars, participating swaps, and fixed price products that settle against indexed referenced pricing. Provident’s credit policy governs the activities undertaken to mitigate non-performance risk by counterparties to financial derivative instruments. Activities undertaken include regular monitoring of counterparty exposure to approved credit limits, financial reviews of all active counterparties, utilizing International Swap Dealers Association (ISDA) agreements and obtaining financial assurances where warranted. In addition, Provident has a diversified base of available counterparties. In April, 2010, Provident completed the buyout of all fixed price crude oil and natural gas swaps associated with the Midstream business for a total cost of $199.1 million. The buyout of Provident’s forward mark to market positions allows Provident to refocus its Commodity Price Risk Management Program on forward selling a portion of actual produced NGL products and inventory to protect margins for terms of up to two years. Management continues to actively monitor commodity price risk and continues to mitigate its impact through financial risk management activities. Subject to market conditions, Provident’s intention is to hedge approximately 50 percent of its natural gas and NGL volumes on a rolling 12 month basis. Also, subject to market conditions, Provident may add additional positions as appropriate for up to 24 months. Settlement of financial derivative contracts
The following table summarizes the impact of the financial derivative contracts settled during the years ended December 31, 2010 and 2009 that were included in realized loss on financial derivative instruments. The table excludes the impact of the Midstream derivative contract buyout, presented separately on the consolidated statement of operations.
Realized loss on financial derivative instruments($ 000s except volumes) Volume (1) Volume (1)
Crude Oil $ (14,848) 2.2 $ 29,007 4.1 Natural gas (29,849) 16.9 (95,188) 23.0 NGL's (includes propane, butane) (9,454) 1.8 5,072 0.8 Foreign Exchange 3,766 (3,505) Electricity 367 (1,276) Interest Rate (847) (853) Realized loss on financial derivative instruments $ (50,865) $ (66,743)
Year ended December 31,
(1) The above table represents aggregate net volumes that were bought/sold over the periods. Crude oil and NGL volumes are listed in millions of barrels and natural gas is listed in millions of gigajoules.
2010 2009
The realized loss for the year ended December 31, 2010 was $50.9 million compared to a realized loss of $66.7 million in 2009. The majority of the realized loss in 2010 was driven by natural gas purchase derivative contracts in the Midstream business settling at a contracted price higher than the market natural gas prices, crude oil derivative sales contracts settling at contracted crude oil prices lower than the crude oil market prices during the settlement period, as well as NGL derivative sales contracts settling at a contracted price lower than the current market NGL’s
30

market prices. The comparable 2009 realized loss was driven mostly natural gas purchase derivative contracts in the midstream business settling at a contracted price higher than the current market natural gas prices, partially offset by crude oil derivative sales contracts in settling at contracted crude oil prices higher than the crude oil market prices during the settlement period.
The following table is a summary of the net financial derivative instruments liability:
($ 000s) 2009
Provident Upstream $ - $ 2,438
Provident Midstream Crude oil 28,313 103,022 Natural gas 19,102 79,847 NGL's (includes propane, butane) 10,363 (330) Foreign exchange (28) (623) Electricity (421) (26) Interest rate (366) 202 Total $ 56,963 $ 184,530
2010As at December 31,
The net liability in both periods represents unrealized “mark-to-market” opportunity costs related to financial derivative instruments with contract settlements ranging from January 1, 2010 through June 30, 2013. The balances are required to be recognized in the financial statements under generally accepted accounting principles. These financial derivative instruments were entered into in order to manage commodity prices and protect future Midstream product margins. Fluctuations in the market value of these instruments impact earnings prior to their settlement dates but have no impact on funds flow from operations until the instrument is actually settled. Goodwill and intangible assets Goodwill represents the excess of the cost of an acquired enterprise over the net of the amounts assigned to assets acquired and liabilities assumed. Goodwill is assessed for impairment at least annually, and if an impairment exists, it would be charged to income in the period in which the impairment occurs. The impairment test includes a comparison of the net book value of Provident’s assets to the estimated fair value of the Midstream business. The fair value of the Midstream business was in excess of the respective carrying value, therefore no write down of goodwill was required in 2009 or 2010. Valuation methodologies included discounted cash flow, a transaction-based approach and a market-based approach, using trading multiples. Goodwill is not amortized. Provident’s intangible assets primarily relate to Midstream contracts and customer relationships. In 2009, Provident recognized an impairment of $12.4 million on a specific Midstream marketing contract. The impairment reflects a revision of the amortization period of this agreement and lower volume expectations for the remainder of the contract. The impairment was recognized in the statement of operations in depreciation and accretion expense.
Provident Energy AR 2010 31

Liquidity and capital resources
Consolidated($ 000s) % Change
Long-term debt - revolving term credit facility $ 72,882 $ 264,776 (72) Long-term debt - convertible debentures (including current portion) 400,872 240,486 67 Working capital surplus (excluding financial derivative instruments) (56,848) (31,152) 82 Net debt $ 416,906 $ 474,110 (12)
Unitholders' equity (at book value) 587,218 1,381,399 (57) Total capitalization at book value $ 1,004,124 $ 1,855,509 (46)
Total net debt as a percentage of total book value capitalization 42% 26% 62
December 31, 2009December 31, 2010
Midstream revenues are received at various times throughout the month. Provident’s working capital position is affected by seasonal fluctuations that reflect commodity price changes, and inventory balances in the Midstream business. Provident relies on funds flow from operations, external lines of credit and access to equity markets to fund capital programs and acquisitions. Substantially all of Provident's accounts receivable are due from customers in the oil and gas and midstream services and marketing industries and are subject to credit risk. Provident partially mitigates associated credit risk by limiting transactions with certain counterparties to limits imposed by Provident based on management’s assessment of the creditworthiness of such counterparties. In certain circumstances, Provident will require the counterparties to provide payment prior to delivery, letters of credit and/or parental guarantees. The carrying value of accounts receivable reflects management's assessment of the associated credit risks.
Contractual obligations Consolidated
($ 000s) TotalLess than
1 year1 to 3 years
3 to 5 years
More than 5 years
Long-term debt - revolving term credit facility (1) (3) $ 83,557 $ 3,096 $ 80,461 $ - $ - Long-term debt - convertible debentures (2) (3) 504,885 169,583 123,126 19,838 192,338 Operating lease obligations 131,631 15,235 20,115 18,426 77,855 Total $ 720,073 $ 187,914 $ 223,702 $ 38,264 $ 270,193 (1) The terms of the Canadian credit facility have a revolving three year period expiring on June 28, 2013.(2) Includes current portion of convertible debentures.(3) Includes associated interest and principal payments.
Payment due by period
Long-term debt and working capital The Trust entered into a credit agreement (the "Credit Facility") as of June 29, 2010, among the Trust, National Bank of Canada as administrative agent and a syndicate of Canadian chartered banks and other Canadian and foreign financial institutions (the "Lenders"). Pursuant to the Credit Facility, the Lenders have agreed to provide Provident with a credit facility of $500 million which under an accordion feature can be increased to $750 million at the option of the Trust, subject to obtaining additional commitments. The Credit Facility also provides for a separate $60 million Letter of Credit facility. As part of the recently completed corporate conversion on January 1, 2011, the Credit Facility was amended to reflect the assignment of the Credit Facility from the Trust to Provident Energy Ltd. who has assumed all covenants and obligations in respect of the Credit Facility following the conversion. The terms of the Credit Facility provide for a revolving three year period expiring on June 28, 2013. Provident may draw on the facility by way of Canadian prime rate loans, U.S. base rate loans, banker’s acceptances, LIBOR loans, or letters of credit. As at December 31, 2010, Provident had drawn $75.5 million or 15 percent of its Credit Facility. At December 31, 2010 the effective interest rate of the outstanding Credit Facility was 4.1 percent (December 31,
32

2009 – 1.4 percent). At December 31, 2010 Provident had $47.9 million in letters of credit outstanding (December 31, 2009 - $27.2 million) that guarantee Provident’s performance under certain commercial and other contracts. In November 2010, Provident issued $172.5 million aggregate principal amount of convertible unsecured subordinated debentures ($164.7 million, net of issue costs). The debentures bear interest at 5.75% per annum, payable semi-annually in arrears on June 30 and December 31 each year commencing June 30, 2011, and mature on December 31, 2017. The debentures may be converted into equity at the option of the holder at a conversion price of $10.60 per share prior to the earlier of December 31, 2017 and the date of redemption and may be redeemed by Provident under certain circumstances. Upon conversion of the 5.75% debentures, Provident may elect to pay the holder cash at the option of Provident. The debentures were initially recorded at fair value of $163.3 million ($155.5 million, net of issue costs). The difference between the fair value and net proceeds of $9.2 million was recorded as a component of equity. The following table shows the change in Provident’s working capital position. Note that the balances at December 31, 2009 include the Upstream business which was sold on June 29, 2010.
($ 000s) 2010 2009 ChangeCurrent AssetsCash and cash equivalents $ 4,400 $ 7,187 $ (2,787) Accounts receivable 206,631 216,786 (10,155) Petroleum product inventory 83,868 37,261 46,607 Prepaid expenses and other current assets 2,539 4,803 (2,264) Financial derivative instruments 487 5,314 (4,827)
Current Liabilities Accounts payable and accrued liabilities 227,944 221,417 (6,527) Cash distribution payable 12,646 13,468 822 Current portion of convertible debentures 148,981 - (148,981) Financial derivative instruments 37,849 86,441 48,592 Working capital deficit $ (129,495) $ (49,975) $ (79,520)
As at December 31,
The ratio of long-term debt to adjusted EBITDA from continuing operations excluding buyout of financial derivative instruments and strategic review and restructuring costs in 2010 was 2.1 to one, compared to 2.8 to one in 2009. Trust units Under Provident’s Premium Distribution, Distribution Reinvestment (DRIP) program 4.4 million units were issued or are to be issued in 2010 representing proceeds of $32.1 million (2009 – 5.2 million units for proceeds of $28.1 million). At December 31, 2010 management and directors held less than one percent of the outstanding trust units. On January 1, 2011, the Trust completed a conversion from an income trust structure to a corporate structure pursuant to a plan of arrangement. The conversion resulted in the reorganization of the Trust into a publicly traded, dividend-paying corporation under the name “Provident Energy Ltd.” (see note 19 of the consolidated financial statements).
Provident Energy AR 2010 33

Capital related expenditures and funding Continuing operations($ 000s) 2010 2009 % Change
Capital related expendituresCapital expenditures $ (77,959) $ (127,369) (39) Site restoration expenditures - discontinued operations (2,041) (5,399) (62) Buyout of financial derivative instruments (199,059) - - Acquisitions (27,573) (18,833) 46 Net capital related expenditures $ (306,632) $ (151,601) 102
Funded byFunds flow from operations net of declared distributions to unitholders and DRIP proceeds $ 29,090 $ 95,895 (70) Cash proceeds on sale of assets 318,910 306,345 4 Issuance of convertible debentures, net of issue costs 164,654 - - Decrease in long-term debt (192,380) (265,245) (27) Change in working capital, including cash (13,642) 14,606 - Net capital related expenditure funding $ 306,632 $ 151,601 102
Year ended December 31,
Provident has funded its net capital expenditures with funds flow from operations and long-term debt. In 2010, proceeds on sale of assets, which includes the first quarter sales of oil and natural gas assets in West Central Alberta and the investment in Emerge Oil and Gas Inc. as well as the second quarter sale of the remaining Upstream business, were applied to Provident’s revolving term credit facility. Strategic review and restructuring expenses In continuation with the previously announced strategic review process, on April 19, 2010, Provident announced a strategic transaction to separate its Upstream and Midstream businesses. An agreement was reached with Midnight to combine the remaining Provident Upstream business with Midnight in a $416 million transaction. The arrangement received the approval of Provident unitholders and Midnight shareholders, as well as court and regulatory approvals that are typical for transactions of this nature. Closing of this arrangement occurred on June 29, 2010. In conjunction with this transaction and other initiatives, Provident completed an internal reorganization which resulted in staff reductions at all levels of the organization, including senior management. On January 1, 2011, the Trust completed a conversion from an income trust structure to a corporate structure pursuant to a plan of arrangement. The conversion resulted in the reorganization of the Trust into a publicly traded, dividend-paying corporation under the name “Provident Energy Ltd.” (see note 19 of the consolidated financial statements). For the year ended December 31, 2010, strategic review and restructuring costs were $31.7 million, of which $13.8 million were attributable to continuing operations (2009 – $12.3 million and $9.3 million, respectively). The costs are comprised primarily of severance, consulting and legal costs related to the sale of the Upstream business. In the fourth quarter of 2010, $1.9 million in costs were incurred related to Provident’s reorganization into a dividend paying corporation effective January 1, 2011. Unit based compensation Unit based compensation includes expenses or recoveries associated with Provident’s restricted and performance unit plan. Unit based compensation is recorded at the estimated fair value of the notional units granted. Compensation expense associated with the plans is recognized in earnings over the vesting period of each plan. The expense or recovery associated with each period is recorded as non-cash unit based compensation (a component of general and administrative expense). A portion relating to operational employees at field and plant locations is also allocated to operating expense. For the year ended December 31, 2010, Provident recorded unit based compensation expense from continuing operations of $8.4 million (2009 - $10.4 million) and made related cash payments of $6.9
34

million (2009 - $5.0 million). Although the Provident trust unit trading price upon which the compensation is based was higher in 2010 than in 2009, the expense was lower in 2010 due to staff reductions resulting in cancelled and exercised units. At December 31, 2010, the current portion of the liability totaled $7.4 million (December 31, 2009 - $12.2 million) and the long-term portion totaled $10.4 million (December 31, 2009 - $12.5 million). Discontinued operations (Provident Upstream)
On June 29, 2010, Provident completed a strategic transaction in which Provident combined the remaining Provident Upstream business with Midnight to form Pace pursuant to a plan of arrangement under the Business Corporations Act (Alberta). Under the Arrangement, Midnight acquired all outstanding shares of Provident Energy Resources Inc., a wholly-owned subsidiary of Provident Energy Trust which held all of the producing oil and gas properties and reserves associated with Provident’s Upstream business. Effective in the second quarter of 2010, Provident’s Upstream business is accounted for as discontinued operations and comparative figures have been reclassified to conform with this presentation. Total consideration from the transaction was $423.7 million, consisting of $115 million in cash and approximately 32.5 million shares of Pace valued at $308.7 million as at the time of the closing of the transaction. Associated transaction costs were $8.1 million. Under the terms of the Arrangement, Provident unitholders divested a portion of each of their Provident units to receive 0.12225 shares of Pace, which was recorded as a non-cash distribution by Provident, valued at $308.7 million. Provident recorded a loss on sale of the Upstream business, amounting to $317.7 million, net of tax, as part of net loss from discontinued operations. This transaction completed the full sale of the Provident Upstream business in a series of transactions between September 2009 to June 2010.
As reflected in Provident’s reconciliation to United States generally accepted accounting principles (U.S. GAAP), the impact of the sale of the Upstream business is different under U.S. GAAP than under Canadian GAAP. Due to differences in carrying values under U.S. GAAP for property, plant and equipment, goodwill, and future income taxes attributable to prior years’ asset impairment charges associated with the Upstream business, net loss from discontinued operations under U.S. GAAP was $29.0 million, compared to a net loss of $438.6 million as reported under Canadian GAAP, a difference of $409.6 million (see note 20 of the consolidated financial statements). Internal controls over financial reporting / Disclosure controls and procedures: U.S. Sarbanes-Oxley Act In 2002, the United States Congress enacted the Sarbanes-Oxley Act (SOX), which requires that issuers that are required to file reports with the United States Securities and Exchange Commission must assess and report upon the effectiveness of their “internal control over financial reporting” as of the end of each fiscal year. As an entity listed on the New York Stock Exchange, Provident is subject to the rules. See “Management’s Report on Internal Control Over Financial Reporting” and “Independent Auditors’ Report”. As of December 31, 2010, an evaluation of the effectiveness of Provident’s “disclosure controls and procedures” (as such term is defined in Rules 13a-15(e) and 15d-15(e) of the United States Securities Exchange Act of 1934, as amended (the “Exchange Act”)) was carried out by the management of Provident, with the participation of the Chief Executive Officer (“CEO”) and Chief Financial Officer (“CFO”). Based upon that evaluation, the CEO and CFO have concluded that as of December 31, 2010, Provident’s disclosure controls and procedures are effective to ensure that information required to be disclosed by Provident in reports that it files or submits to Canadian and United States securities authorities are (i) recorded, processed, summarized and reported within the time periods specified by Canadian and United States securities laws and (ii) accumulated and communicated to Provident’s management, including its principal executive officer and principal financial officer, to allow timely decisions regarding required disclosure. It should be noted that while the CEO and CFO believe that Provident’s disclosure controls and procedures provide a reasonable level of assurance that they are effective, they do not expect that Provident’s disclosure controls and procedures or internal control over financial reporting will prevent all errors and fraud. A control system, no matter how well conceived or operated, can provide only reasonable, not absolute, assurance that the objectives of the control system are met. Provident will continue to periodically evaluate its disclosure controls and procedures and internal controls over financial reporting and will make modifications from time to time as deemed necessary.
Provident Energy AR 2010 35

During the year ended December 31, 2010, there were no changes in Provident’s internal control over financial reporting that have materially affected, or are reasonably likely to materially affect, Provident’s internal control over financial reporting. Foreign ownership Until December 31, 2010, Provident qualified as a Mutual Fund Trust under the Canadian Income Tax Act because substantially all the value of its asset portfolio was derived from non-taxable Canadian properties, comprised principally of royalties and interest on inter-company debt. Prior to the conversion of the Trust, Provident monitored on an ongoing basis the value of its asset portfolio to confirm that substantially all of the value of its asset portfolio was derived from non-taxable Canadian properties. Following the completion of the conversion of the Trust from an income trust structure to a corporate structure, Provident is no longer subject to these restrictions. Critical accounting estimates Provident’s significant accounting policies are described in note 2 to the consolidated financial statements. Certain accounting policies include critical accounting estimates. These policies require management to make judgments and estimates based on conditions and assumptions that are inherently uncertain. These accounting policies could result in materially different results should the underlying assumptions or conditions change. Management assumptions are based on Provident’s historical experience, management’s experience, and other factors that, in management’s opinion, are relevant and appropriate. Management assumptions may change over time, as further experience is gained or as operating conditions change. Provident’s financial and operating results incorporate certain estimates including:
• operating revenues, operating expenses and product purchases; • depreciation and accretion based on estimated useful lives of assets; • future recoverable value of property, plant and equipment and goodwill (see “Goodwill and intangible
assets”) based on estimated future cash flows; • value of asset retirement obligations based on estimated future costs and timing of expenditures; • fair values of derivative contracts that are subject to fluctuation depending upon underlying commodity
prices and foreign exchange rates (see note 13 of the consolidated financial statements); and • income taxes based on estimates of future income and tax pool claims (see “Taxes”).
Operating revenues, operating expenses and product purchases For each month, actual volumes purchased, processed and sold and related invoices for the supply of goods and services necessary for the operation of Provident’s facilities are generally not known until the following month. Accordingly, the financial statements contain an estimate of approximately one month of product purchases, revenue and operating costs. The estimate is based on contracted quantities, historic trends, estimated prices and other known events. The estimates are reversed in the following month and replaced with actual results. Property, plant and equipment and intangible assets Midstream facilities, including natural gas liquids storage facilities and natural gas liquids processing and extraction facilities are carried at cost and depreciated on a straight-line basis over the estimated service lives of the assets. Intangible assets are amortized over the estimated useful lives of the assets. Capital assets related to pipelines and office equipment are carried at cost and depreciated using the straight-line method over their economic lives.
Management periodically reviews the estimated useful lives of property, plant and equipment and intangible assets. These estimates are based on management’s experience and other factors, including expectations of future events that are believed to be reasonable under the circumstances. However, actual results could differ from those estimated. By their very nature, these estimates are subject to measurement uncertainty and the effect on the financial statements of future periods could be material.
36

Asset retirement obligation Under the asset retirement obligation (ARO) standard, the fair value of asset retirement obligations is recorded as a liability on a discounted basis, when incurred. The value of the related assets is increased by the same amount as the liability and depreciated over the useful life of the asset. Over time the liability is adjusted for the change in present value of the liability or as a result of changes to either the timing or amount of the original estimate of undiscounted future cash flows. The ARO standard requires that management make estimates and assumptions regarding future liabilities and cash flows involving environmental reclamation and remediation. Such assumptions are inherently uncertain and subject to change over time due to factors such as historical experience, changes in environmental legislation or improved technologies. Changes in underlying assumptions, based on the above noted factors, could have a material impact on Provident’s financial results. Change in accounting policies (i) Recent accounting pronouncements
The CICA released a number of conforming amendments to existing handbook sections effective January 1, 2011 in order to reduce the number of GAAP differences for entities transitioning to International Financial Reporting Standards (IFRS) that choose to early adopt these sections. The new standards are intended to converge with International Financial Reporting Standards. Amended sections include CICA handbook sections 1582 “Business Combinations”, 1601 “Consolidated Financial Statements”, and 3855 “Financial Instruments – recognition and measurement”. Provident did not elect to early adopt these amended sections and thus the amendments have no effect on the current year’s financial statements.
(ii) International Financial Reporting Standards (IFRS) The Canadian Accounting Standards Board (AcSB) has confirmed that publicly accountable enterprises are required to adopt International Financial Reporting Standards (IFRS) in place of Canadian GAAP for interim and annual reporting purposes. The required changeover date is for fiscal years beginning on or after January 1, 2011. This adoption date requires the restatement, for comparative purposes, of amounts reported by Provident for the year ended December 31, 2010, including the opening balance sheet as at January 1, 2010.
In 2008, Provident commenced the process to transition from current Canadian GAAP to IFRS. A project plan and a project team were established. The project team is led by finance management and includes representatives from various areas of the organization as necessary to plan for a smooth transition to IFRS.
The project plan consists of three phases: initiation, detailed assessment and design and implementation. Provident has completed the first phase, which involved the development of a detailed timeline for assessing resources and training and the completion of a high level review of the major differences between current Canadian GAAP and IFRS. Education and training sessions for employees throughout the organization, participation in industry discussion groups and discussions with Provident’s external auditors have been held throughout the phases. Regular reporting on the project status is provided to Provident’s senior management and to the Audit Committee of the Board of Directors.
During 2009, Provident was engaged in the detailed assessment and design phase of the project. The detailed assessment and design phase involves a comprehensive analysis of the impact of the IFRS differences identified in the initial scoping assessment. In addition, an evaluation of IFRS 1 transition exemptions, as further described below, and an analysis of financial systems has been performed.
During the implementation phase which began in the first quarter of 2010, Provident is executing the required changes to business processes, financial systems, accounting policies, IT systems, disclosure controls and internal controls over financial reporting as discussed below. Internal staff within the financial reporting group continue to lead the conversion project along with sponsorship from the management team. The project continues to progress
Provident Energy AR 2010 37
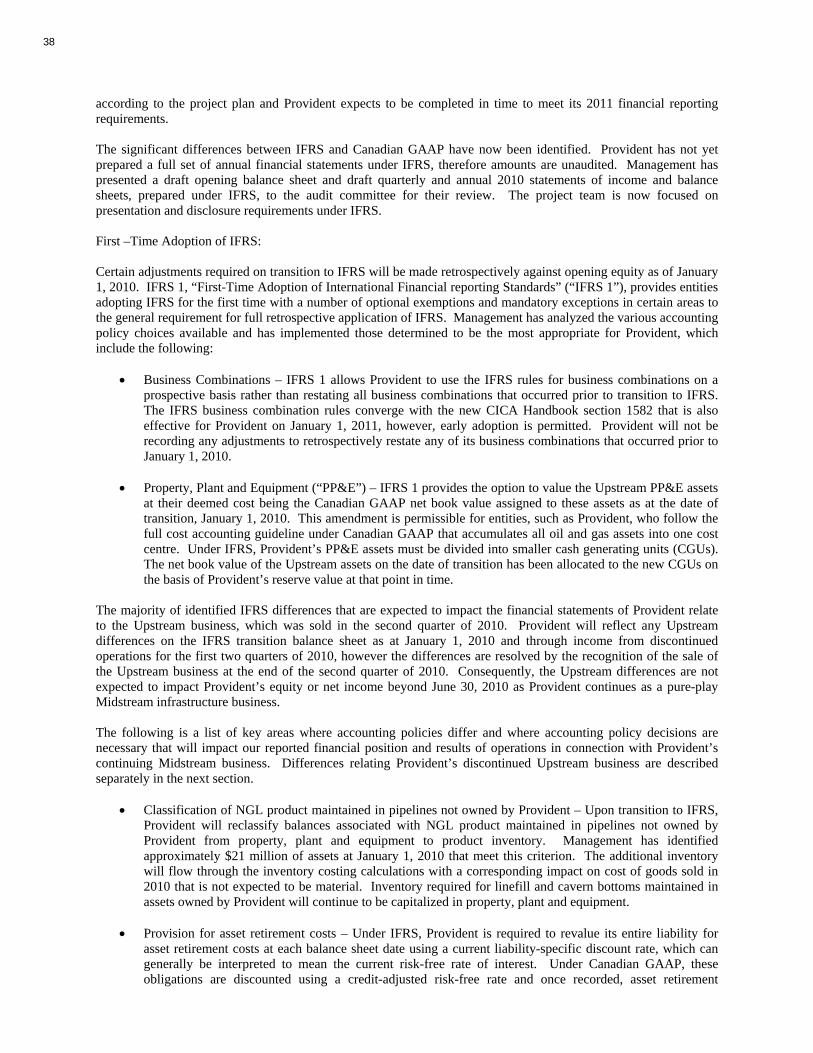
according to the project plan and Provident expects to be completed in time to meet its 2011 financial reporting requirements. The significant differences between IFRS and Canadian GAAP have now been identified. Provident has not yet prepared a full set of annual financial statements under IFRS, therefore amounts are unaudited. Management has presented a draft opening balance sheet and draft quarterly and annual 2010 statements of income and balance sheets, prepared under IFRS, to the audit committee for their review. The project team is now focused on presentation and disclosure requirements under IFRS.
First –Time Adoption of IFRS:
Certain adjustments required on transition to IFRS will be made retrospectively against opening equity as of January 1, 2010. IFRS 1, “First-Time Adoption of International Financial reporting Standards” (“IFRS 1”), provides entities adopting IFRS for the first time with a number of optional exemptions and mandatory exceptions in certain areas to the general requirement for full retrospective application of IFRS. Management has analyzed the various accounting policy choices available and has implemented those determined to be the most appropriate for Provident, which include the following:
• Business Combinations – IFRS 1 allows Provident to use the IFRS rules for business combinations on a
prospective basis rather than restating all business combinations that occurred prior to transition to IFRS. The IFRS business combination rules converge with the new CICA Handbook section 1582 that is also effective for Provident on January 1, 2011, however, early adoption is permitted. Provident will not be recording any adjustments to retrospectively restate any of its business combinations that occurred prior to January 1, 2010.
• Property, Plant and Equipment (“PP&E”) – IFRS 1 provides the option to value the Upstream PP&E assets at their deemed cost being the Canadian GAAP net book value assigned to these assets as at the date of transition, January 1, 2010. This amendment is permissible for entities, such as Provident, who follow the full cost accounting guideline under Canadian GAAP that accumulates all oil and gas assets into one cost centre. Under IFRS, Provident’s PP&E assets must be divided into smaller cash generating units (CGUs). The net book value of the Upstream assets on the date of transition has been allocated to the new CGUs on the basis of Provident’s reserve value at that point in time.
The majority of identified IFRS differences that are expected to impact the financial statements of Provident relate to the Upstream business, which was sold in the second quarter of 2010. Provident will reflect any Upstream differences on the IFRS transition balance sheet as at January 1, 2010 and through income from discontinued operations for the first two quarters of 2010, however the differences are resolved by the recognition of the sale of the Upstream business at the end of the second quarter of 2010. Consequently, the Upstream differences are not expected to impact Provident’s equity or net income beyond June 30, 2010 as Provident continues as a pure-play Midstream infrastructure business. The following is a list of key areas where accounting policies differ and where accounting policy decisions are necessary that will impact our reported financial position and results of operations in connection with Provident’s continuing Midstream business. Differences relating Provident’s discontinued Upstream business are described separately in the next section.
• Classification of NGL product maintained in pipelines not owned by Provident – Upon transition to IFRS, Provident will reclassify balances associated with NGL product maintained in pipelines not owned by Provident from property, plant and equipment to product inventory. Management has identified approximately $21 million of assets at January 1, 2010 that meet this criterion. The additional inventory will flow through the inventory costing calculations with a corresponding impact on cost of goods sold in 2010 that is not expected to be material. Inventory required for linefill and cavern bottoms maintained in assets owned by Provident will continue to be capitalized in property, plant and equipment.
• Provision for asset retirement costs – Under IFRS, Provident is required to revalue its entire liability for
asset retirement costs at each balance sheet date using a current liability-specific discount rate, which can generally be interpreted to mean the current risk-free rate of interest. Under Canadian GAAP, these obligations are discounted using a credit-adjusted risk-free rate and once recorded, asset retirement
38
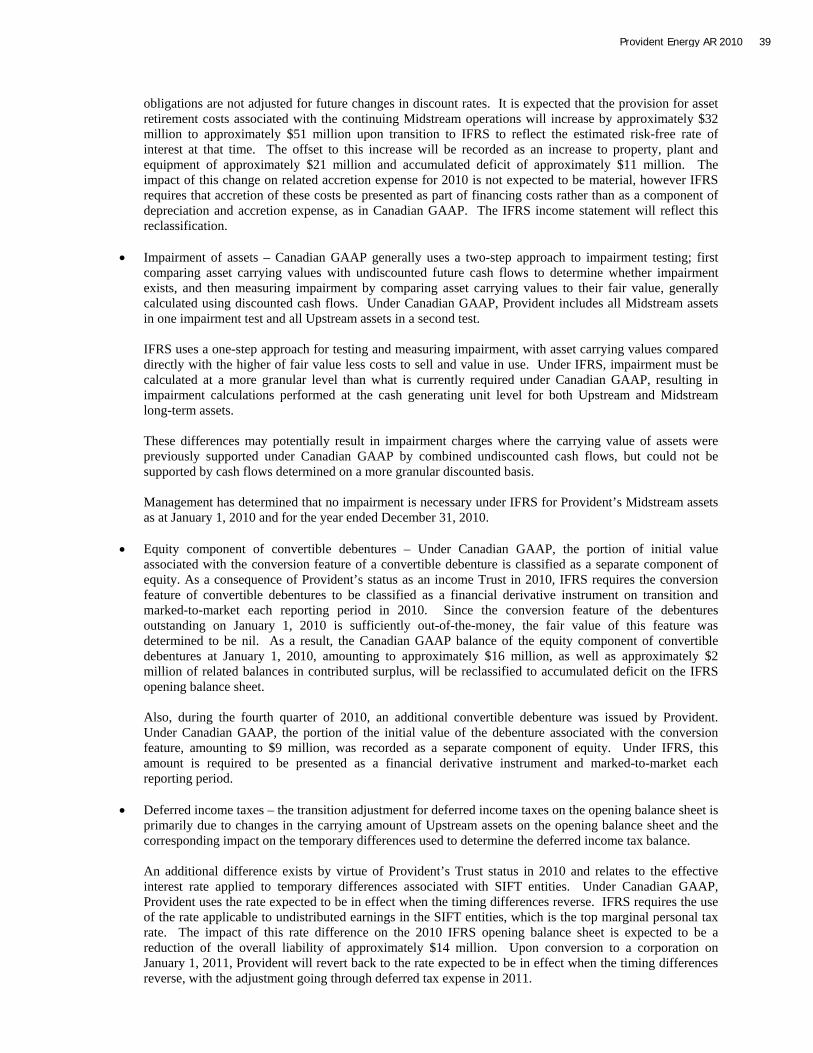
obligations are not adjusted for future changes in discount rates. It is expected that the provision for asset retirement costs associated with the continuing Midstream operations will increase by approximately $32 million to approximately $51 million upon transition to IFRS to reflect the estimated risk-free rate of interest at that time. The offset to this increase will be recorded as an increase to property, plant and equipment of approximately $21 million and accumulated deficit of approximately $11 million. The impact of this change on related accretion expense for 2010 is not expected to be material, however IFRS requires that accretion of these costs be presented as part of financing costs rather than as a component of depreciation and accretion expense, as in Canadian GAAP. The IFRS income statement will reflect this reclassification.
• Impairment of assets – Canadian GAAP generally uses a two-step approach to impairment testing; first
comparing asset carrying values with undiscounted future cash flows to determine whether impairment exists, and then measuring impairment by comparing asset carrying values to their fair value, generally calculated using discounted cash flows. Under Canadian GAAP, Provident includes all Midstream assets in one impairment test and all Upstream assets in a second test.
IFRS uses a one-step approach for testing and measuring impairment, with asset carrying values compared directly with the higher of fair value less costs to sell and value in use. Under IFRS, impairment must be calculated at a more granular level than what is currently required under Canadian GAAP, resulting in impairment calculations performed at the cash generating unit level for both Upstream and Midstream long-term assets. These differences may potentially result in impairment charges where the carrying value of assets were previously supported under Canadian GAAP by combined undiscounted cash flows, but could not be supported by cash flows determined on a more granular discounted basis. Management has determined that no impairment is necessary under IFRS for Provident’s Midstream assets as at January 1, 2010 and for the year ended December 31, 2010.
• Equity component of convertible debentures – Under Canadian GAAP, the portion of initial value
associated with the conversion feature of a convertible debenture is classified as a separate component of equity. As a consequence of Provident’s status as an income Trust in 2010, IFRS requires the conversion feature of convertible debentures to be classified as a financial derivative instrument on transition and marked-to-market each reporting period in 2010. Since the conversion feature of the debentures outstanding on January 1, 2010 is sufficiently out-of-the-money, the fair value of this feature was determined to be nil. As a result, the Canadian GAAP balance of the equity component of convertible debentures at January 1, 2010, amounting to approximately $16 million, as well as approximately $2 million of related balances in contributed surplus, will be reclassified to accumulated deficit on the IFRS opening balance sheet.
Also, during the fourth quarter of 2010, an additional convertible debenture was issued by Provident. Under Canadian GAAP, the portion of the initial value of the debenture associated with the conversion feature, amounting to $9 million, was recorded as a separate component of equity. Under IFRS, this amount is required to be presented as a financial derivative instrument and marked-to-market each reporting period.
• Deferred income taxes – the transition adjustment for deferred income taxes on the opening balance sheet is
primarily due to changes in the carrying amount of Upstream assets on the opening balance sheet and the corresponding impact on the temporary differences used to determine the deferred income tax balance.
An additional difference exists by virtue of Provident’s Trust status in 2010 and relates to the effective interest rate applied to temporary differences associated with SIFT entities. Under Canadian GAAP, Provident uses the rate expected to be in effect when the timing differences reverse. IFRS requires the use of the rate applicable to undistributed earnings in the SIFT entities, which is the top marginal personal tax rate. The impact of this rate difference on the 2010 IFRS opening balance sheet is expected to be a reduction of the overall liability of approximately $14 million. Upon conversion to a corporation on January 1, 2011, Provident will revert back to the rate expected to be in effect when the timing differences reverse, with the adjustment going through deferred tax expense in 2011.
Provident Energy AR 2010 39

The following is a list of areas where accounting policies differ in connection with Provident’s Upstream business, which was sold in the second quarter of 2010. While these differences impact the opening balance sheet as at January 1, 2010 and net income (loss) from discontinued operations in the first two quarters of 2010, the differences are effectively offset through a recalculation of the loss on sale of discontinued operations. Consequently, the differences will no longer appear on the December 31, 2010 IFRS balance sheet, nor are they expected to impact earnings in 2011 or beyond.
• Presentation of Exploration and Evaluation (“E&E”) expenditures separate from PP&E – Upon transition to
IFRS, Provident will present all Upstream E&E expenditures as a separate component on the Consolidated Balance Sheet. This will include the book value for Provident’s land that relates to Upstream undeveloped properties. Management has identified approximately $25 million of its property, plant and equipment that meets the criteria to be classified as E&E on the opening balance sheet prepared under IFRS as at January 1, 2010. E&E assets will not be depleted and must be assessed for impairment when indicators suggest the possibility of impairment.
• Impairment and depletion of Upstream property, plant and equipment – The IFRS impairment test
calculation is different than that required under Canadian GAAP for full cost Upstream businesses. The IFRS tests are performed at a more granular level and generally require the use of higher discount rates. As a result, Provident expects to recognize an opening impairment of its Upstream assets amounting to approximately $392 million. The offset to this reduction in carrying value will be recorded as an increase to accumulated deficit at January 1, 2010.
In addition, upon transition to IFRS, Provident has the option to calculate depletion using a reserve base of proved reserves or both proved and probable reserves, as compared to the Canadian GAAP method of calculating depletion using only proved reserves. Provident has elected to use proved plus probable reserves under IFRS. The combination of a lower carrying value due to the impairment charge and the larger depletion base will result in approximately $41 million lower Upstream depletion charges under IFRS in the first six months of 2010.
• Provision for asset retirement costs – Due to a change in discount rates applied under IFRS to estimated asset retirement costs, it is expected that the provision for asset retirement costs associated with the discontinued Upstream operations will increase by approximately $37 million upon transition to IFRS to reflect the estimated risk-free rate of interest at that time. The offset to this increase will be recorded as an increase to accumulated deficit.
• Loss on sale of discontinued operations – Each of the differences described above is expected to have an
equal and offsetting impact on the loss on sale of discontinued operations, such that the net impact of the Upstream differences on equity after recognition of the sale of the business in the second quarter of 2010 is expected to be nil.
In addition to accounting policy differences, Provident’s transition to IFRS is expected to impact the internal controls over financial reporting, disclosure controls and procedures and IT systems as follows:
• Internal controls over financial reporting (“ICFR”) – Provident is currently in the process of reviewing its
ICFR documentation and is identifying instances where controls must be amended or added in order to address the accounting policy changes required under IFRS. No material changes in control procedures are expected as a result of the transition to IFRS.
• IT systems – Provident has completed the system updates required for IFRS reporting. The modifications
while not significant were, however, deemed critical in order to allow for reporting of both Canadian GAAP and IFRS statements in 2010 as well as the modifications required to track PP&E costs at a more granular level of detail for IFRS reporting.
• Disclosure controls and procedures – Provident has assessed the impact of transition to IFRS on its
disclosure controls and procedures and has not identified any material changes required in its control environment. It is expected that there will be increased note disclosure around certain financial statement
40

elements than what is currently required under Canadian GAAP. Management is currently drafting its IFRS note disclosure in accordance with current IFRS standards and continues to monitor requirements put forth by the IASB in discussion papers and exposure drafts for future disclosure requirements. Throughout the transition process, Provident has been assessing its stakeholders’ information requirements and will ensure that adequate and timely information is provided to meet these needs.
Business risks The energy industry is subject to risks that can affect the amount of funds flow from operations available for the payment of dividends to shareholders, and the ability to grow. These risks include but are not limited to:
• capital markets, credit and liquidity risks and the ability to finance future growth; and
• the impact of Canadian governmental regulation on Provident.
The midstream industry is subject to risks that can affect the amount of cash flow available for the payment of dividends to shareholders, and the ability to grow. These risks include but are not limited to:
• operational matters and hazards including the breakdown or failure of equipment, information systems or processes, the performance of equipment at levels below those originally intended, operator error, labour disputes, disputes with owners of interconnected facilities and carriers and catastrophic events such as natural disasters, fires, explosions, fractures, acts of eco-terrorists and saboteurs, and other similar events, many of which are beyond the control of Provident;
• the Midstream NGL assets are subject to competition from other gas processing plants, and the pipelines and storage, terminal and processing facilities are also subject to competition from other pipelines and storage, terminal and processing facilities in the areas they serve, and the gas products marketing business is subject to competition from other marketing firms;
• exposure to commodity price, exchange rate and interest rate fluctuations;
• reduction in the volume of throughput or the level of demand;
• the ability to attract and retain employees;
• increasing operating and capital costs;
• regulatory intervention in determining processing fees and tariffs;
• reliance on significant customers;
• government and regulatory risk;
• changes to environmental regulations; and
• environmental, health and safety risks.
Provident strives to minimize these business risks by:
• employing and empowering management and technical staff with extensive industry experience and providing competitive remuneration;
• adhering to a disciplined Commodity Price Risk Management Program to mitigate the impact that volatile commodity prices have on cash flow available for the payment of dividends;
• marketing natural gas liquids and related services to selected, credit worthy customers at competitive rates;
• maintaining a competitive cost structure to maximize cash flow and profitability;
• maintaining prudent financial leverage and developing strong relationships with the investment community and capital providers;
• adhering to strict guidelines and reporting requirements with respect to environmental, health and safety practices; and
Provident Energy AR 2010 41

• maintaining an adequate level of property, casualty, comprehensive and directors’ and officers’ insurance coverage.
Readers should be aware that the risks set forth herein are not exhaustive. Readers are referred to Provident’s annual information form, which is available at www.sedar.com, for a detailed discussion of risks affecting Provident. Unit trading activity The following table summarizes the unit trading activity of the Provident units for each of the four quarters in the year ended December 31, 2010 on both the Toronto Stock Exchange and the New York Stock Exchange:
Q1 Q2 (1) Q3 Q4TSE – PVE.UN (Cdn$)High $ 8.61 $ 8.51 $ 7.36 $ 8.26 Low $ 7.07 $ 5.14 $ 6.25 $ 7.14 Close $ 7.88 $ 7.29 $ 7.30 $ 7.91 Volume (000s) 19,046 27,674 28,776 48,556 NYSE – PVX (US$)High $ 8.40 $ 8.51 $ 7.58 $ 8.18 Low $ 6.76 $ 5.21 $ 5.86 $ 7.02 Close $ 7.71 $ 6.87 $ 7.06 $ 7.95 Volume (000s) 99,239 104,579 78,977 93,092 (1) Second quarter unit trading lows were disproportionately impacted by a market wide, one day trading anomaly originating with the NYSE on May 6, 2010. While some transactions were cancelled by the NYSE, trades on the Toronto Stock Exchange were upheld. Forward-looking information
This MD&A contains forward-looking information under applicable securities legislation. Statements which include forward-looking information relate to future events or Provident's future performance. Such forward-looking information is provided for the purpose of providing information about management's current expectations and plans relating to the future. Readers are cautioned that reliance on such information may not be appropriate for other purposes, such as making investment decisions. All statements other than statements of historical fact are forward-looking information. In some cases, forward-looking information can be identified by terminology such as "may", "will", "should", "expect", "plan", "anticipate", "believe", "estimate", "predict", "potential", "continue", or the negative of these terms or other comparable terminology. Forward looking information in this MD&A includes, but is not limited to, business strategy and objectives, capital expenditures, acquisition and disposition plans and the timing thereof, operating and other costs, budgeted levels of cash distributions and the performance associated with Provident's natural gas midstream, NGL processing and marketing business. Specifically, the “Outlook” section in this MD&A may contain forward-looking information about prospective results of operations, financial position or cash flows of Provident. Forward-looking information is based on current expectations, estimates and projections that involve a number of risks and uncertainties which could cause actual events or results to differ materially from those anticipated by Provident and described in the forward-looking information. In addition, this MD&A may contain forward-looking information attributed to third party industry sources. Undue reliance should not be placed on forward-looking information, as there can be no assurance that the plans, intentions or expectations upon which they are based will occur. By its nature, forward-looking information involves numerous assumptions, known and unknown risks and uncertainties, both general and specific, that contribute to the possibility that the predictions, forecasts, projections and other forward-looking information will not occur. Forward-looking information in this MD&A includes, but is not limited to, statements with respect to:
• Provident's ability to benefit from the combination of growth opportunities and the ability to grow through the capital markets;
• Provident's acquisition strategy, the criteria to be considered in connection therewith and the benefits to be derived therefrom;
• the emergence of accretive growth opportunities; • the ability to achieve an appropriate level of monthly cash dividends;
42

• the impact of Canadian governmental regulation on Provident; • the existence, operation and strategy of the commodity price risk management program; • the approximate and maximum amount of forward sales and hedging to be employed; • changes in oil, natural gas and NGL prices and the impact of such changes on cash flow after financial
derivative instruments; • the level of capital expenditures; • currency, exchange and interest rates; • the performance characteristics of Provident's midstream, NGL processing and marketing business; • the growth opportunities associated with the midstream, NGL processing and marketing business; • the availability and amount of tax pools available to offset Provident’s cash taxes; and • the nature of contractual arrangements with third parties in respect of Provident's midstream, NGL
processing and marketing business.
Although Provident believes that the expectations reflected in the forward-looking information are reasonable, there can be no assurance that such expectations will prove to be correct. Provident can not guarantee future results, levels of activity, performance, or achievements. Moreover, neither Provident nor any other person assumes responsibility for the accuracy and completeness of the forward-looking information. Some of the risks and other factors, some of which are beyond Provident's control, which could cause results to differ materially from those expressed in the forward-looking information contained in this MD&A include, but are not limited to:
• general economic and credit conditions in Canada, the United States and globally; • industry conditions associated with the NGL services, processing and marketing business; • fluctuations in the price of crude oil, natural gas and natural gas liquids; • interest payable on notes issued in connection with acquisitions; • governmental regulation in North America of the energy industry, including income tax and environmental
regulation; • fluctuation in foreign exchange or interest rates; • stock market volatility and market valuations; • the impact of environmental events; • the need to obtain required approvals from regulatory authorities; • unanticipated operating events; • failure to realize the anticipated benefits of acquisitions; • competition for, among other things, capital reserves and skilled personnel; • failure to obtain industry partner and other third party consents and approvals, when required; • risks associated with foreign ownership; • third party performance of obligations under contractual arrangements; and • the other factors set forth under "Business risks" in this MD&A.
Readers are cautioned that the foregoing list is not exhaustive of all possible risks and uncertainties. With respect to developing forward-looking information contained in this MD&A, Provident has made assumptions regarding, among other things:
• future natural gas, crude oil and NGL prices; • the ability of Provident to obtain qualified staff and equipment in a timely and cost-efficient manner to
meet demand; • the regulatory framework regarding royalties, taxes and environmental matters in which Provident conducts
its business; • the impact of increasing competition; • Provident's ability to obtain financing on acceptable terms; • the general stability of the economic and political environment in which Provident operates; • the timely receipt of any required regulatory approvals; • the timing and costs of pipeline, storage and facility construction and expansion and the ability of Provident
to secure adequate product transportation; • currency, exchange and interest rates; and • the ability of Provident to successfully market its oil and natural gas products.
Provident Energy AR 2010 43
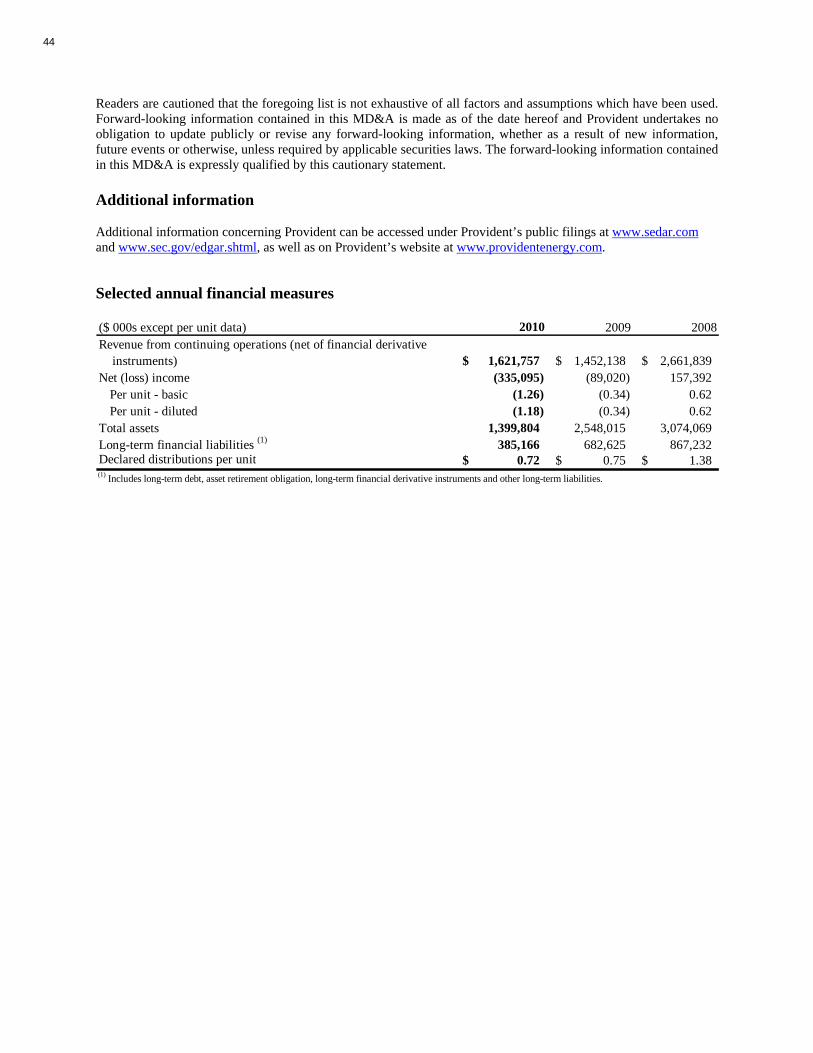
Readers are cautioned that the foregoing list is not exhaustive of all factors and assumptions which have been used. Forward-looking information contained in this MD&A is made as of the date hereof and Provident undertakes no obligation to update publicly or revise any forward-looking information, whether as a result of new information, future events or otherwise, unless required by applicable securities laws. The forward-looking information contained in this MD&A is expressly qualified by this cautionary statement. Additional information Additional information concerning Provident can be accessed under Provident’s public filings at www.sedar.com and www.sec.gov/edgar.shtml, as well as on Provident’s website at www.providentenergy.com. Selected annual financial measures
($ 000s except per unit data) 2010 2009 2008Revenue from continuing operations (net of financial derivative instruments) $ 1,621,757 $ 1,452,138 $ 2,661,839 Net (loss) income (335,095) (89,020) 157,392
Per unit - basic (1.26) (0.34) 0.62 Per unit - diluted (1.18) (0.34) 0.62
Total assets 1,399,804 2,548,015 3,074,069 Long-term financial liabilities (1) 385,166 682,625 867,232 Declared distributions per unit $ 0.72 $ 0.75 $ 1.38 (1) Includes long-term debt, asset retirement obligation, long-term financial derivative instruments and other long-term liabilities.
44

Quarterly table
Financial information by quarter($ 000s except for per unit and operating amounts)
First Second Third Fourth AnnualQuarter Quarter Quarter Quarter Total
Revenue - continuing operations $ 419,250 $ 354,982 $ 332,570 $ 514,955 $ 1,621,757Funds flow from continuing operations (1) $ 46,481 $ (170,646) $ 43,997 $ 72,183 $ (7,985) Funds flow from continuing operations per unit - basic $ 0.18 $ (0.64) $ 0.17 0.27 $ (0.03) - diluted $ 0.18 $ (0.64) $ 0.17 0.26 $ (0.02) Adjusted EBITDA - continuing operations (2) $ 51,084 $ (175,715) $ 52,894 $ 84,390 $ 12,653
Adjusted funds flow from continuing operations (3) $ 46,967 $ 39,840 $ 43,997 $ 74,052 $ 204,856 Adjusted funds flow from continuing operations per unit - basic $ 0.18 $ 0.15 $ 0.17 $ 0.28 $ 0.77 - diluted (4) $ 0.18 $ 0.15 $ 0.17 $ 0.27 $ 0.73 Adjusted EBITDA excluding buyout of financial derivative instruments and strategic review and restructuring costs - continuing operations (2) $ 51,570 $ 34,771 $ 52,894 $ 86,259 $ 225,494
Net (loss) income $ (60,459) $ (344,875) $ 8,924 $ 61,315 $ (335,095) Net (loss) income per unit - basic $ (0.23) $ (1.30) $ 0.03 $ 0.23 $ (1.26) - diluted (4) $ (0.23) $ (1.30) $ 0.03 $ 0.22 $ (1.18) Unitholder distributions $ 47,634 $ 47,794 $ 47,990 $ 48,221 $ 191,639 Distributions per unit $ 0.18 $ 0.18 $ 0.18 $ 0.18 $ 0.72 Provident Midstream NGL sales volumes (bpd) 113,279 94,030 95,388 121,627 106,075 (1) Represents cash flow from operations before changes in working capital and site restoration expenditures.
(4) Includes dilutive impact of convertible debentures.
2010
(3) Adjusted funds flow from continuing operations excludes realized loss on buyout of financial derivative instruments and strategic review and restructuring costs.
(2) Adjusted EBITDA is earnings before interest, taxes, depreciation, accretion and other non-cash items - see "Reconciliation of Non-GAAP measures".
Provident Energy AR 2010 45

Quarterly table
Financial information by quarter($ 000s except for per unit and operating amounts)
First Second Third Fourth AnnualQuarter Quarter Quarter Quarter Total
Revenue - continuing operations $ 406,650 $ 235,669 $ 395,661 $ 414,158 $ 1,452,138Funds flow from continuing operations (1) $ 57,349 $ 14,456 $ 24,859 $ 51,190 $ 147,854 Funds flow from continuing operations per unit - basic and diluted $ 0.22 $ 0.06 $ 0.09 $ 0.19 $ 0.57 Adjusted EBITDA - continuing operations (2) $ 65,095 $ 20,383 $ 25,569 $ 57,182 $ 168,229
Adjusted funds flow from continuing operations (3) $ 57,623 $ 21,858 $ 24,859 $ 52,769 $ 157,109 Adjusted funds flow from continuing operations per unit - basic and diluted $ 0.22 $ 0.08 $ 0.09 $ 0.20 $ 0.60
Adjusted EBITDA excluding buyout of financial derivative instruments and strategic review and restructuring costs - continuing operations (2) $ 65,369 $ 27,785 $ 25,569 $ 58,761 $ 177,484
Net (loss) income $ (40,284) $ (80,061) $ 51,663 $ (20,338) $ (89,020) Net (loss) income per unit - basic and diluted $ (0.16) $ (0.31) $ 0.20 $ (0.08) $ (0.34) Unitholder distributions $ 54,511 $ 47,012 $ 47,238 $ 47,456 $ 196,217 Distributions per unit $ 0.21 $ 0.18 $ 0.18 $ 0.18 $ 0.75 Provident Midstream NGL sales volumes (bpd) 141,669 102,799 98,229 111,912 113,528 (1) Represents cash flow from operations before changes in working capital and site restoration expenditures.(2) Adjusted EBITDA is earnings before interest, taxes, depreciation, accretion and other non-cash items - see "Reconciliation of Non-GAAP measures".(3) Adjusted funds flow from continuing operations excludes realized loss on buyout of financial derivative instruments and strategic review and restructuring costs.
2009
(1) Includes Provident Upstream and Provident Midstream businesses but excludes the United States oil and natural gas production (USOGP) business which was sold and accounted for as discontinued operations in 2008.
46

MANAGEMENT’S REPORT ON INTERNAL CONTROL OVER FINANCIAL REPORTING The management of Provident is responsible for establishing and maintaining adequate internal control over financial reporting for the Trust. Under the supervision of our Chief Executive Officer and our Chief Financial Officer we have conducted an evaluation of the effectiveness of our internal control over financial reporting based on the Internal Control-Integrated Framework issued by the Committee of Sponsoring Organizations of the Treadway Commission (COSO). Based on our assessment, we have concluded that as of December 31, 2010, our internal control over financial reporting was effective. Because of its inherent limitations, internal control over financial reporting may not prevent or detect misstatements. Also, projections of any evaluation of effectiveness to future periods are subject to the risk that controls may become inadequate because of changes in conditions, or that the degree of compliance with the policies or procedures may deteriorate. The effectiveness of the Trust’s internal control over financial reporting as of December 31, 2010, has been audited by PricewaterhouseCoopers LLP, independent auditors, as stated in their report which appears herein. Douglas J. Haughey Brent C. Heagy Chief Executive Officer Chief Financial Officer Calgary, Alberta March 9, 2011
Provident Energy AR 2010 47

MANAGEMENT’S RESPONSIBILITY FOR FINANCIAL STATEMENTS The management of Provident is responsible for the information included in this Annual Report. The financial statements have been prepared in accordance with accounting principles generally accepted in Canada and in accordance with accounting policies detailed in the notes to the financial statements. Where necessary, the statements include amounts based on management’s informed judgments and estimates. Financial information in the Annual Report is consistent with that presented in the financial statements. PricewaterhouseCoopers LLP, Chartered Accountants, appointed by the unitholders, have audited the financial statements and conducted a review of internal accounting policies and procedures to the extent required by generally accepted auditing standards, and performed such tests as they deemed necessary to enable them to express an opinion on the financial statements. The Board of Directors, through its Audit Committee, is responsible for ensuring that management fulfills its responsibility for financial reporting and internal control. The Audit Committee is composed of three independent directors. The Audit Committee reviews the financial content of the Annual Report and reports its findings to the Board of Directors for its consideration in approving the financial statements. Douglas J. Haughey Brent C. Heagy Chief Executive Officer Chief Financial Officer Calgary, Alberta March 9, 2011
48

“PricewaterhouseCoopers” refers to PricewaterhouseCoopers LLP, an Ontario limited liability partnership, or, as the context requires, the
PricewaterhouseCoopers global network or other member firms of the network, each of which is a separate legal entity.
PricewaterhouseCoopers LLP
Chartered Accountants
111 5 Avenue SW, Suite 3100
Calgary, Alberta
Canada T2P 5L3
Telephone +1 403 509 7500
Facsimile +1 403 781 1825
www.pwc.com/caIndependent Auditor’s Report
To the Unitholders of Provident Energy Trust
We have completed integrated audits of Provident Energy Trust’s (the “Trust”) 2010 and 2009consolidated financial statements and of its internal control over financial reporting as at December 31,2010. Our opinions, based on our audits, are presented below.
Report on the consolidated financial statementsWe have audited the accompanying consolidated financial statements of Provident Energy Trust,which comprise the consolidated balance sheets as at December 31, 2010 and December 31, 2009and the related consolidated statements of operations and accumulated income, comprehensive andaccumulated other comprehensive income and cash flows for each of the years then ended, and therelated notes.
Management’s responsibility for the consolidated financial statementsManagement is responsible for the preparation and fair presentation of these consolidated financialstatements in accordance with Canadian generally accepted accounting principles and for suchinternal control as management determines is necessary to enable the preparation of consolidatedfinancial statements that are free from material misstatement, whether due to fraud or error.
Auditor’s responsibilityOur responsibility is to express an opinion on these consolidated financial statements based on ouraudits. We conducted our audits in accordance with Canadian generally accepted auditing standardsand the standards of the Public Company Accounting Oversight Board (United States). Thosestandards require that we plan and perform an audit to obtain reasonable assurance about whether theconsolidated financial statements are free from material misstatement. Canadian generally acceptedauditing standards require that we comply with ethical requirements.
An audit involves performing procedures to obtain audit evidence, on a test basis, about the amountsand disclosures in the consolidated financial statements. The procedures selected depend on theauditor’s judgment, including the assessment of the risks of material misstatement of the consolidatedfinancial statements, whether due to fraud or error. In making those risk assessments, the auditorconsiders internal control relevant to the company’s preparation and fair presentation of theconsolidated financial statements in order to design audit procedures that are appropriate in thecircumstances. An audit also includes evaluating the appropriateness of accounting principles andpolicies used and the reasonableness of accounting estimates made by management, as well asevaluating the overall presentation of the consolidated financial statements.
We believe that the audit evidence we have obtained in our audits is sufficient and appropriate toprovide a basis for our audit opinion on the consolidated financial statements.
Provident Energy AR 2010 49

OpinionIn our opinion, the consolidated financial statements present fairly, in all material respects, the financialposition of the Trust as at December 31, 2010 and December 31, 2009 and the results of its operationsand its cash flows for each of the years then ended in accordance with Canadian generally acceptedaccounting principles.
Report on internal control over financial reportingWe have also audited Provident Energy Trust’s internal control over financial reporting as at December31, 2010, based on criteria established in Internal Control - Integrated Framework, issued by theCommittee of Sponsoring Organizations of the Treadway Commission (COSO).
Management’s responsibility for internal control over financial reportingManagement is responsible for maintaining effective internal control over financial reporting and for itsassessment of the effectiveness of internal control over financial reporting included in theaccompanying Management’s Report on Internal Control Over Financial Reporting.
Auditor’s responsibilityOur responsibility is to express an opinion on the company’s internal control over financial reportingbased on our audit. We conducted our audit of internal control over financial reporting in accordancewith the standards of the Public Company Accounting Oversight Board (United States). Thosestandards require that we plan and perform the audit to obtain reasonable assurance about whethereffective internal control over financial reporting was maintained in all material respects.
An audit of internal control over financial reporting includes obtaining an understanding of internalcontrol over financial reporting, assessing the risk that a material weakness exists, testing andevaluating the design and operating effectiveness of internal control, based on the assessed risk, andperforming such other procedures as we consider necessary in the circumstances.
We believe that our audit provides a reasonable basis for our audit opinion on the company’s internalcontrol over financial reporting.
Definition of internal control over financial reportingA company’s internal control over financial reporting is a process designed to provide reasonableassurance regarding the reliability of financial reporting and the preparation of financial statements forexternal purposes in accordance with generally accepted accounting principles. A company’s internalcontrol over financial reporting includes those policies and procedures that (i) pertain to themaintenance of records that, in reasonable detail, accurately and fairly reflect the transactions anddispositions of the assets of the company; (ii) provide reasonable assurance that transactions arerecorded as necessary to permit preparation of financial statements in accordance with generallyaccepted accounting principles, and that receipts and expenditures of the company are being madeonly in accordance with authorizations of management and directors of the company; and (iii) providereasonable assurance regarding prevention or timely detection of unauthorized acquisition, use, ordisposition of the company’s assets that could have a material effect on the financial statements.
50

Inherent limitationsBecause of its inherent limitations, internal control over financial reporting may not prevent or detectmisstatements. Also, projections of any evaluation of effectiveness to future periods are subject to therisk that controls may become inadequate because of changes in conditions or that the degree ofcompliance with the policies or procedures may deteriorate.
OpinionIn our opinion, the Trust maintained, in all material respects, effective internal control over financialreporting as at December 31, 2010 based on criteria established in Internal Control - IntegratedFramework, issued by COSO.
Chartered AccountantsMarch 9, 2011
Provident Energy AR 2010 51
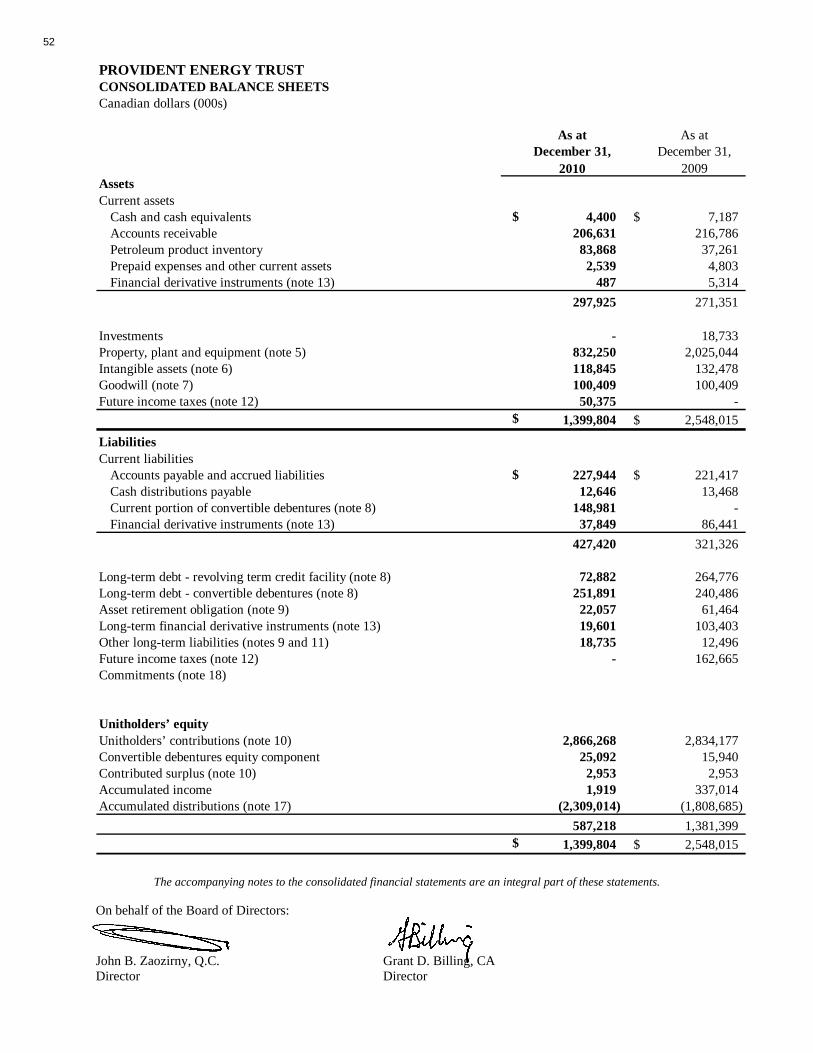
PROVIDENT ENERGY TRUSTCONSOLIDATED BALANCE SHEETSCanadian dollars (000s)
As at As atDecember 31, December 31,
2010 2009AssetsCurrent assets
Cash and cash equivalents $ 4,400 $ 7,187 Accounts receivable 206,631 216,786 Petroleum product inventory 83,868 37,261 Prepaid expenses and other current assets 2,539 4,803 Financial derivative instruments (note 13) 487 5,314
297,925 271,351
Investments - 18,733 Property, plant and equipment (note 5) 832,250 2,025,044 Intangible assets (note 6) 118,845 132,478 Goodwill (note 7) 100,409 100,409 Future income taxes (note 12) 50,375 -
$ 1,399,804 $ 2,548,015
LiabilitiesCurrent liabilities
Accounts payable and accrued liabilities $ 227,944 $ 221,417 Cash distributions payable 12,646 13,468 Current portion of convertible debentures (note 8) 148,981 - Financial derivative instruments (note 13) 37,849 86,441
427,420 321,326
Long-term debt - revolving term credit facility (note 8) 72,882 264,776 Long-term debt - convertible debentures (note 8) 251,891 240,486 Asset retirement obligation (note 9) 22,057 61,464 Long-term financial derivative instruments (note 13) 19,601 103,403 Other long-term liabilities (notes 9 and 11) 18,735 12,496 Future income taxes (note 12) - 162,665 Commitments (note 18)
Unitholders’ equityUnitholders’ contributions (note 10) 2,866,268 2,834,177 Convertible debentures equity component 25,092 15,940 Contributed surplus (note 10) 2,953 2,953 Accumulated income 1,919 337,014 Accumulated distributions (note 17) (2,309,014) (1,808,685)
587,218 1,381,399 $ 1,399,804 $ 2,548,015
The accompanying notes to the consolidated financial statements are an integral part of these statements. On behalf of the Board of Directors: John B. Zaozirny, Q.C. Grant D. Billing, CA Director Director
52
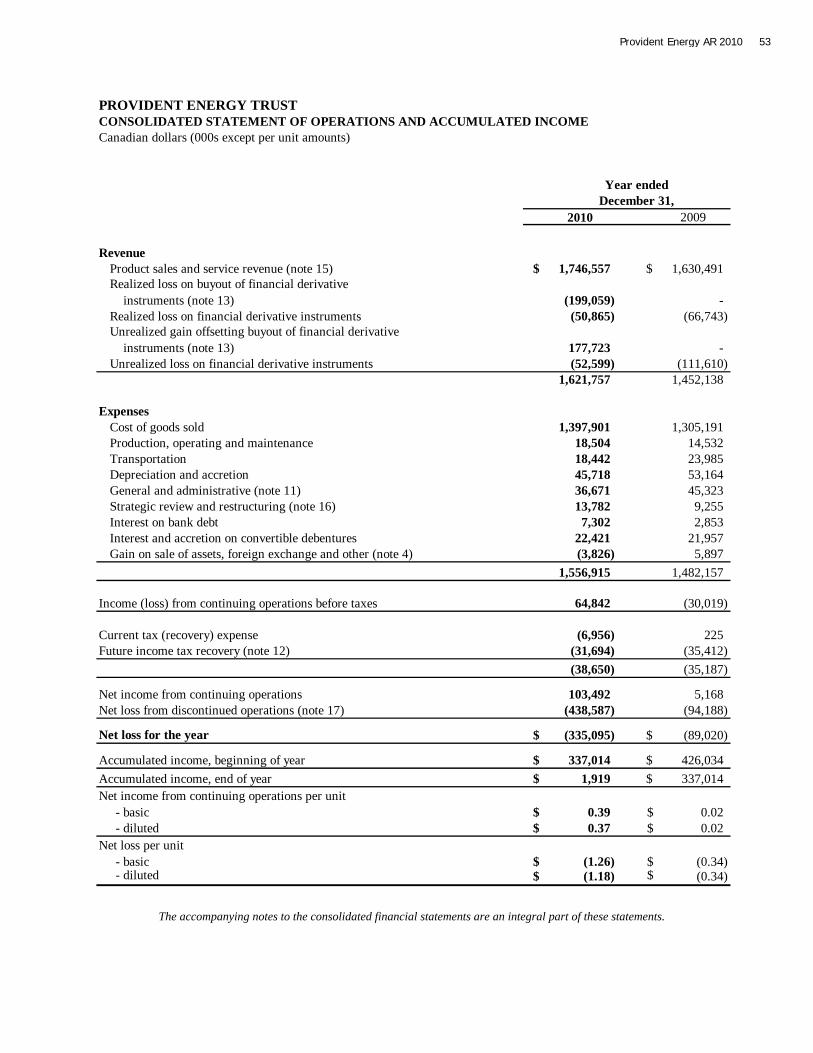
PROVIDENT ENERGY TRUST
Canadian dollars (000s except per unit amounts)
2010 2009
Revenue Product sales and service revenue (note 15) $ 1,746,557 $ 1,630,491 Realized loss on buyout of financial derivative instruments (note 13) (199,059) - Realized loss on financial derivative instruments (50,865) (66,743) Unrealized gain offsetting buyout of financial derivative instruments (note 13) 177,723 - Unrealized loss on financial derivative instruments (52,599) (111,610)
1,621,757 1,452,138
ExpensesCost of goods sold 1,397,901 1,305,191 Production, operating and maintenance 18,504 14,532 Transportation 18,442 23,985 Depreciation and accretion 45,718 53,164 General and administrative (note 11) 36,671 45,323 Strategic review and restructuring (note 16) 13,782 9,255 Interest on bank debt 7,302 2,853 Interest and accretion on convertible debentures 22,421 21,957 Gain on sale of assets, foreign exchange and other (note 4) (3,826) 5,897
1,556,915 1,482,157
Income (loss) from continuing operations before taxes 64,842 (30,019)
Current tax (recovery) expense (6,956) 225 Future income tax recovery (note 12) (31,694) (35,412)
(38,650) (35,187)
Net income from continuing operations 103,492 5,168 Net loss from discontinued operations (note 17) (438,587) (94,188)
Net loss for the year $ (335,095) $ (89,020)
Accumulated income, beginning of year $ 337,014 $ 426,034 Accumulated income, end of year $ 1,919 $ 337,014 Net income from continuing operations per unit - basic $ 0.39 $ 0.02 - diluted $ 0.37 $ 0.02 Net loss per unit - basic $ (1.26) $ (0.34) - diluted $ (1.18) $ (0.34)
CONSOLIDATED STATEMENT OF OPERATIONS AND ACCUMULATED INCOME
Year endedDecember 31,
The accompanying notes to the consolidated financial statements are an integral part of these statements.
Provident Energy AR 2010 53

PROVIDENT ENERGY TRUSTCONSOLIDATED STATEMENT OF CASH FLOWS Canadian dollars (000s)
2010 2009
Cash (used for) provided by operating activitiesNet income for the period from continuing operations $ 103,492 $ 5,168 Add (deduct) non-cash items:
Depreciation and accretion 45,718 53,164 Non-cash interest expense and other 5,429 4,660 Non-cash unit based compensation expense (note 11) 1,280 4,569 Unrealized gain offsetting buyout of financial derivative instruments (177,723) - Unrealized loss on financial derivative instruments 52,599 111,610 Unrealized foreign exchange (gain) loss and other (note 4) (3,786) 4,095 Gain on sale of assets (note 4) (3,300) - Future income tax recovery (31,694) (35,412)
Continuing operations (7,985) 147,854 Discontinued operations (2,436) 116,152
(10,421) 264,006 Site restoration expenditures related to discontinued operations (2,041) (5,399) Change in non-cash operating working capital (27,207) 45,641
(39,669) 304,248
Cash used for financing activitiesIssuance of convertible debentures, net of issue costs (note 8) 164,654 - Decrease in long-term debt (192,380) (265,245) Distributions to unitholders (191,639) (196,217) Issue of trust units 32,091 28,106 Change in non-cash financing working capital (822) (6,620)
(188,096) (439,976)
Cash provided by investing activitiesCapital expenditures (77,959) (127,369) Acquisitions (27,573) (18,833) Proceeds on sale of assets 212,131 306,345 Proceeds on sale of discontinued operations (note 17) 106,779 - Change in non-cash investing working capital 11,600 (21,857)
224,978 138,286
(Decrease) increase in cash and cash equivalents (2,787) 2,558 Cash and cash equivalents, beginning of year 7,187 4,629 Cash and cash equivalents, end of year $ 4,400 $ 7,187
Supplemental disclosure of cash flow information Cash interest paid including debenture interest $ 25,448 $ 27,826 Cash taxes (received) paid $ (2,576) $ 3,199
Year endedDecember 31,
The accompanying notes to the consolidated financial statements are an integral part of these statements.
54

PROVIDENT ENERGY TRUST
Canadian dollars (000s)
2010 2009
Net loss for the year $ (335,095) $ (89,020)
Other comprehensive income, net of taxesReclassification adjustment of loss on available-for-sale investment included in net income - 2,111 Unrealized gain on available-for-sale investments (net of taxes) - 72
- 2,183
Comprehensive loss $ (335,095) $ (86,837)
Accumulated other comprehensive loss, beginning of year - (2,183) Other comprehensive income - 2,183 Accumulated other comprehensive income, end of year $ - $ -
Accumulated income, end of year 1,919 337,014 Accumulated distributions, end of year (2,309,014) (1,808,685) Retained earnings (deficit), end of year (2,307,095) (1,471,671) Accumulated other comprehensive income, end of year - - Total retained earnings (deficit) and accumulated other comprehensive income, end of year $ (2,307,095) $ (1,471,671)
Year endedDecember 31,
CONSOLIDATED STATEMENT OF COMPREHENSIVE INCOMEAND ACCUMULATED OTHER COMPREHENSIVE INCOME
The accompanying notes to the consolidated financial statements are an integral part of these statements.
Provident Energy AR 2010 55

Notes to the Consolidated Financial Statements (Tabular amounts in Cdn $ 000’s, except unit and per unit amounts, and as noted)
December 31, 2010 1. Structure of the Trust
Provident Energy Trust (the “Trust” or “Provident”) is an open-end unincorporated investment trust created under the laws of Alberta pursuant to a trust indenture dated January 25, 2001, amended from time to time. The beneficiaries of the Trust are the unitholders. The Trust was established to hold, directly and indirectly, all types of petroleum and natural gas and energy related assets, including without limitation facilities of any kind, oil sands interests, electricity or power generating assets and pipeline, gathering, processing and transportation assets. The Trust commenced operations March 6, 2001. Cash flow is provided to the Trust from properties owned and operated by directly and indirectly owned subsidiaries of the Trust. Cash flow is paid to the Trust by way of royalty payments, interest payments, principal debt repayments and dividends or partnership distributions. The cash payments received by the Trust are subsequently distributed to the unitholders monthly. On January 1, 2011, the Trust completed a conversion from an income trust structure to a corporate structure pursuant to a plan of arrangement. The conversion resulted in the reorganization of the Trust into a publicly traded, dividend-paying corporation under the name “Provident Energy Ltd.” (see note 19).
2. Significant accounting policies
i) Principles of consolidation
The consolidated financial statements include the accounts of Provident, including the consolidated accounts of all wholly and partially owned subsidiaries, and are presented in accordance with Canadian generally accepted accounting principles. Certain comparative figures have been reclassified to conform to the current year presentation. In particular, the comparative figures have been reclassified to reflect discontinued operations presentation for the Canadian oil and natural gas production (“Provident Upstream” or “COGP”) business (see note 17).
ii) Financial instruments
All financial instruments, including derivatives, are recognized on Provident’s Consolidated Balance Sheet. Derivatives are measured at fair value with unrealized gains and losses reported in net income. Investments in equity instruments that are not quoted in an active market are recorded at cost. Investments in equity instruments that are quoted in an active market are measured at fair value, with reference to published price quotations, and unrealized gains and losses are reported in accumulated other comprehensive income. Provident’s other financial instruments (accounts receivable, accounts payable and accrued liabilities, cash distributions payable, and long-term debt) are measured at amortized cost using the effective interest rate method. Transaction costs are included with the associated financial instruments and amortized accordingly.
iii) Cash and cash equivalents
Cash and cash equivalents include short-term investments, such as money market deposits or similar type instruments, with an original maturity of three months or less when purchased.
56

iv) Inventory
Inventories of products are valued at the lower of average cost and net realizable value based on market prices.
v) Property, plant & equipment and intangible assets
Provident follows the full cost method of accounting for oil and natural gas exploration and development activities. Costs associated with the acquisition and development of oil and natural gas reserves are capitalized and accumulated in one cost centre as all of the oil and natural gas assets are in Canada. Such costs include lease acquisition, lease rentals on non-producing properties, geological and geophysical activities, drilling of productive and non-productive wells, and tangible well equipment. Gains or losses on the disposition of oil and gas properties are not recognized unless the resulting change to the depletion and depreciation rate is 20 percent or more. All other property, plant and equipment, including midstream assets, are recorded at cost. Expenditures relating to renewals or betterments that improve the productive capacity or extend the life of property, plant and equipment are capitalized. Maintenance and repairs are expensed as incurred. Products required for line-fill and cavern bottoms are presented as part of property, plant and equipment and are stated at the lower of historic cost and net realizable value and are not depreciated. a) Depletion, depreciation and accretion
Midstream facilities, including natural gas liquids storage facilities and natural gas liquids processing and extraction facilities are carried at cost and depreciated on a straight-line basis over the estimated service lives of the assets, which range from 30 to 40 years. Intangible assets are amortized over the estimated useful lives of the assets, which range from 15 months to 15 years. Capital assets related to pipelines and office equipment are carried at cost and depreciated using the straight-line method over their economic lives.
The provision for depletion and depreciation for oil and natural gas assets is calculated using the unit-of-production method based on current production divided by Provident’s share of estimated total proved oil and natural gas reserve volumes, before royalties. Production and reserves of natural gas and associated liquids are converted at the energy equivalent ratio of 6,000 cubic feet of natural gas to one barrel of oil. In determining its depletion base, Provident includes estimated future costs for developing proved reserves, and excludes estimated salvage values of tangible equipment and the cost of unproved properties.
b) Impairment
For Midstream property, plant and equipment, and intangible assets, an impairment loss is recognized when the carrying amount exceeds the fair value. Oil and natural gas assets accounted for using the full cost method are subject to a ceiling test. The ceiling test calculation is performed by comparing the carrying value of the assets to the sum of the undiscounted proved reserve cash flows using future price estimates. If the carrying value is not recoverable, the assets are written down to their fair value. Fair value is determined by the future cash flows from the proved plus probable reserves discounted at Provident’s risk free interest rate. Any excess carrying value of the assets on the balance sheet above fair value would be recorded in depletion, depreciation and accretion expense as a permanent impairment.
vi) Joint venture
Provident conducts many of its activities through joint ventures and the accounts reflect only Provident’s proportionate interest in such activities.
vii) Goodwill
Goodwill, which represents the excess of cost of an acquired enterprise over the net of the amounts assigned to assets acquired and liabilities assumed, is assessed at least annually for impairment. To assess
Provident Energy AR 2010 57

impairment, the fair value of the reporting unit is determined and compared to the book value of the reporting unit. If the fair value is less than the book value, then a second test is performed to determine the amount of the impairment. The amount of the impairment is determined by deducting the fair value of the reporting unit’s assets and liabilities from the fair value of the reporting unit to determine the implied fair value of goodwill and comparing that amount to the book value of the reporting unit’s goodwill. Any excess of the book value of goodwill over the implied fair value of goodwill is the impaired amount. Goodwill is not amortized.
viii) Asset retirement obligation
Under the asset retirement obligation (“ARO”) standard the fair value of a liability for an ARO is recorded in the period where a reasonable estimate of the fair value can be determined. When the liability is recorded, the carrying amount of the related asset is increased by the same amount of the liability. The asset recorded is depleted over the useful life of the asset. Additions to asset retirement obligations due to the passage of time are recorded as accretion expense. Actual expenditures incurred are charged against the obligation.
ix) Unit based compensation
Provident has a unit based compensation plan whereby notional units are granted to employees. The fair value of these notional units is estimated and recorded as non-cash unit based compensation (a component of general and administrative expenses). A portion relating to operational employees at field and plant locations is allocated to operating expense. The offsetting amount is recorded as accrued liabilities or other long-term liabilities. A realization of the expense and a resulting reduction in cash provided by operating activities occurs when a cash payment is made.
x) Trust unit calculations
The dilutive effect of convertible debentures is determined using the "if-converted" method whereby the outstanding debentures at the end of the period are assumed to have been converted at the beginning of the period or at the time of issue if issued during the year. Amounts charged to income or loss relating to the outstanding debentures are added back to net income for the diluted calculation. The units issued upon conversion are included in the denominator of per unit - basic calculations from the date of issue.
xi) Income taxes
Provident follows the liability method for calculating income taxes. Differences between the amounts reported in the financial statements of the corporate subsidiaries and their respective tax bases are applied to tax rates in effect to calculate the future tax liability. The effect of any change in income tax rates is recognized in the current period income. Provident is a taxable entity under the Income Tax Act (Canada) and, until December 31, 2010, was currently taxable only on income that is not distributed or distributable to the unitholders. As Provident distributes all of its taxable income to the unitholders and meets the requirements of the Income Tax Act (Canada) applicable to the Trust, no provision for current income taxes has been made in the Trust.
xii) Revenue recognition
Revenue associated with the sales of Provident’s natural gas, natural gas liquids (“NGLs”) and crude oil owned by Provident is recognized when title passes from Provident to its customer. Revenues associated with the services provided where Provident acts as agent are recorded on a net basis when the services are provided. Revenues associated with the sale of natural gas liquids storage services are recognized when the services are provided.
xiii) Foreign currency translation
The accounts of integrated foreign operations are translated using the temporal method, under which monetary assets and liabilities are translated at the period-end exchange rate, other assets and liabilities at
58
the historical rates, and revenues and expenses at the rates for the period, except depreciation, depletion and accretion which is translated on the same basis as the related assets. Translation gains and losses are included in income in the period in which they arise.
xiv) Use of estimates
The preparation of financial statements requires management to make estimates based on currently available information. Actual results could differ from those estimated. In particular, management makes estimates for amounts recorded for depletion and depreciation of the property, plant and equipment, financial derivative instruments, asset retirement obligation, unit based compensation and income taxes. The ceiling test uses factors such as estimated reserves, production rates, estimated future petroleum and natural gas prices and future costs. Due to the inherent limitations in metering and the physical properties of storage caverns and pipelines, the determination of precise volumes of NGLs held in inventory at such locations is subject to estimation. Actual inventories of NGLs can only be determined by draining of the caverns. By their very nature, these estimates are subject to measurement uncertainty and the effect on the financial statements of future periods could be material.
3. Changes in accounting policies and practices A. Recent accounting pronouncements
The Canadian Institute of Chartered Accountants (CICA) released a number of conforming amendments to existing handbook sections effective January 1, 2011 in order to reduce the number of GAAP differences for entities transitioning to International Financial Reporting Standards (IFRS) that choose to early adopt these sections. The new standards are intended to converge with International Financial Reporting Standards. Amended sections include CICA Handbook sections 1582 “Business Combinations”, 1601 “Consolidated Financial Statements”, and 3855 “Financial Instruments – recognition and measurement”. Provident did not elect to early adopt these amended sections and thus the amendments have no effect on the current year’s financial statements.
International Financial Reporting Standards
The Canadian Accounting Standards Board (AcSB) has confirmed that publicly accountable enterprises are required to adopt International Financial Reporting Standards (IFRS) in place of Canadian GAAP for interim and annual reporting purposes. The required changeover date is for fiscal years beginning on or after January 1, 2011. This adoption date requires the restatement, for comparative purposes, of amounts reported by Provident for the year ended December 31, 2010, including the opening balance sheet as at January 1, 2010. Provident’s IFRS conversion continues to progress according to the project plan and Provident expects to meet its 2011 financial reporting requirements under IFRS.
Provident Energy AR 2010 59

4. Gain on sale of assets, foreign exchange and other
Gain on sale of assets, foreign exchange and other is comprised of:
Gain on sale of assets, foreign exchange and other($ 000s) 2010 2009Realized loss on foreign exchange $ 3,425 $ 1,802 Gain on sale of assets (3,300) - Other (165) -
(40) 1,802 Unrealized loss on foreign exchange 808 4,095 Gain on termination of agreement (4,900) - Other 306 -
(3,786) 4,095 Total $ (3,826) $ 5,897
Year ended December 31,
During the third quarter of 2010, Provident agreed to terminate a multi-year condensate storage and terminalling services agreement with a third party in exchange for a parcel of land valued at $4.9 million. The transaction was accounted for as a non-monetary transaction and included in property, plant and equipment on the Consolidated Balance Sheet with a corresponding gain included in “Gain on sale of assets, foreign exchange and other” on the Consolidated Statement of Operations. In the third quarter of 2010, Provident received proceeds of $3.3 million from the sale of certain asset-backed commercial paper investments that had previously been written off. Provident recorded a gain on sale in “Gain on sale of assets, foreign exchange and other” on the Consolidated Statement of Operations.
5. Property, plant and equipment
As at December 31, 2010 CostAccumulated depreciation
Net book value
Midstream assets $ 959,604 $ 138,863 $ 820,741 Office equipment 45,491 33,982 11,509 Total $ 1,005,095 $ 172,845 $ 832,250
As at December 31, 2009 Cost
Accumulated depletion and
depreciationNet book
valueOil and natural gas properties $ 2,893,330 $ 1,657,694 $ 1,235,636 Midstream assets 883,840 113,820 770,020 Office equipment 47,174 27,786 19,388 Total $ 3,824,344 $ 1,799,300 $ 2,025,044
As at December 31, 2010, Midstream assets include land of $4.9 million (December 31, 2009 - nil) and products required for line-fill and cavern bottoms of $43.9 million (2009 - $43.9 million) which are excluded from costs subject to depreciation.
60
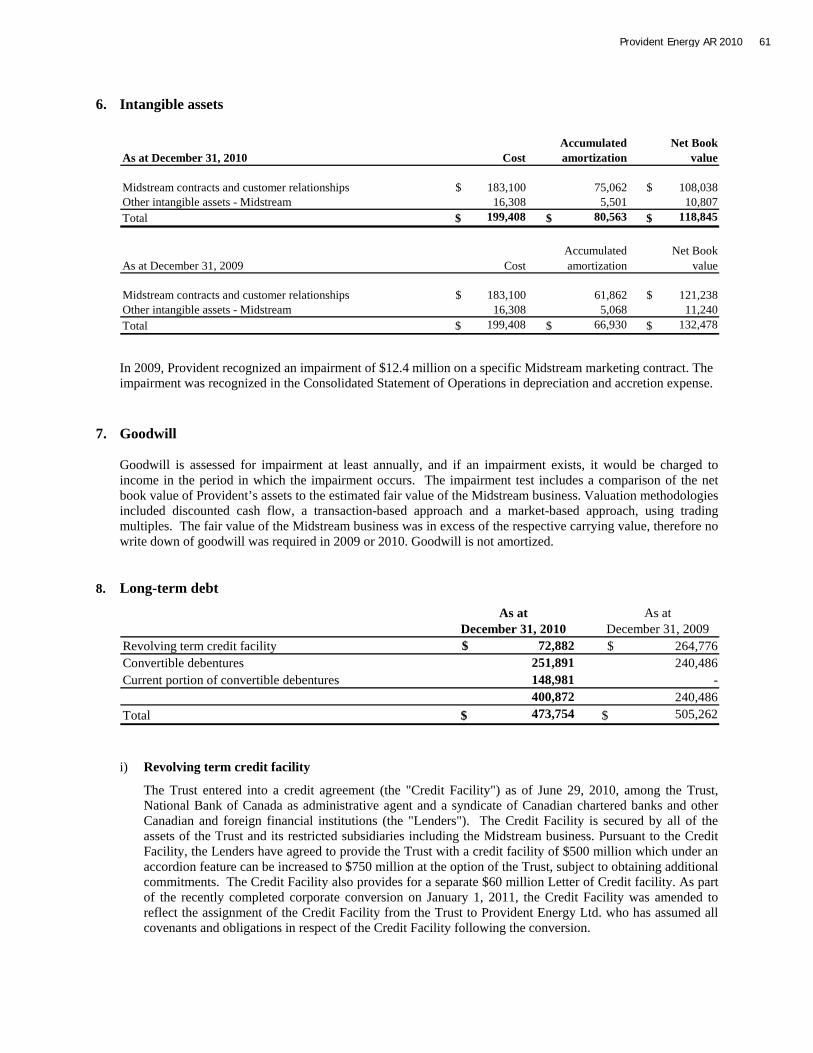
6. Intangible assets
As at December 31, 2010 CostAccumulated amortization
Net Book value
Midstream contracts and customer relationships $ 183,100 75,062 $ 108,038 Other intangible assets - Midstream 16,308 5,501 10,807 Total $ 199,408 $ 80,563 $ 118,845
As at December 31, 2009 CostAccumulated amortization
Net Book value
Midstream contracts and customer relationships $ 183,100 61,862 $ 121,238 Other intangible assets - Midstream 16,308 5,068 11,240 Total $ 199,408 $ 66,930 $ 132,478
In 2009, Provident recognized an impairment of $12.4 million on a specific Midstream marketing contract. The impairment was recognized in the Consolidated Statement of Operations in depreciation and accretion expense.
7. Goodwill
Goodwill is assessed for impairment at least annually, and if an impairment exists, it would be charged to income in the period in which the impairment occurs. The impairment test includes a comparison of the net book value of Provident’s assets to the estimated fair value of the Midstream business. Valuation methodologies included discounted cash flow, a transaction-based approach and a market-based approach, using trading multiples. The fair value of the Midstream business was in excess of the respective carrying value, therefore no write down of goodwill was required in 2009 or 2010. Goodwill is not amortized.
8. Long-term debt
Revolving term credit facility $ 72,882 $ 264,776 Convertible debentures 251,891 240,486 Current portion of convertible debentures 148,981 -
400,872 240,486 Total $ 473,754 $ 505,262
December 31, 2010 December 31, 2009As at As at
i) Revolving term credit facility
The Trust entered into a credit agreement (the "Credit Facility") as of June 29, 2010, among the Trust, National Bank of Canada as administrative agent and a syndicate of Canadian chartered banks and other Canadian and foreign financial institutions (the "Lenders"). The Credit Facility is secured by all of the assets of the Trust and its restricted subsidiaries including the Midstream business. Pursuant to the Credit Facility, the Lenders have agreed to provide the Trust with a credit facility of $500 million which under an accordion feature can be increased to $750 million at the option of the Trust, subject to obtaining additional commitments. The Credit Facility also provides for a separate $60 million Letter of Credit facility. As part of the recently completed corporate conversion on January 1, 2011, the Credit Facility was amended to reflect the assignment of the Credit Facility from the Trust to Provident Energy Ltd. who has assumed all covenants and obligations in respect of the Credit Facility following the conversion.
Provident Energy AR 2010 61

The terms of the Credit Facility provide for a revolving three year period expiring on June 28, 2013 (subject to customary extension provisions). Provident may draw on the facility by way of Canadian prime rate loans, U.S. base rate loans, banker’s acceptances, LIBOR loans, or letters of credit. As at December 31, 2010, Provident had drawn $75.5 million or 15 percent of its Credit Facility. Included in the carrying value at December 31, 2010 were financing costs of $2.4 million (December 31, 2009 – nil). At December 31, 2010 the effective interest rate of the outstanding Credit Facility was 4.1 percent (December 31, 2009 – 1.4 percent). At December 31, 2010 Provident had $47.9 million in letters of credit outstanding (December 31, 2009 - $27.2 million) that guarantee Provident’s performance under certain commercial and other contracts.
ii) Convertible debentures
In November 2010, Provident issued $172.5 million aggregate principal amount of convertible unsecured subordinated debentures ($164.7 million, net of issue costs). The debentures bear interest at 5.75% per annum, payable semi-annually in arrears on June 30 and December 31 each year commencing June 30, 2011 and mature on December 31, 2017. The debentures may be converted into equity at the option of the holder at a conversion price of $10.60 per trust unit prior to the earlier of December 31, 2017 and the date of redemption, and may be redeemed by Provident under certain circumstances. Upon conversion of the 5.75% debentures, Provident may elect to pay the holder cash at the option of Provident. The debentures were initially recorded at fair value of $163.3 million ($155.5 million, net of issue costs). The difference between the fair value and net proceeds of $9.2 million was recorded as a component of equity. On closing of the plan of arrangement effecting the merger of Provident’s oil and natural gas production business with Midnight Oil Exploration Ltd. to form Pace Oil & Gas Ltd. (see note 17), Provident’s 6.5% debentures conversion prices were adjusted in accordance with the applicable debenture indenture. The conversion price for Provident’s 6.5% debentures maturing on August 31, 2012 was adjusted from $13.75 per trust unit to $11.56 per trust unit. The conversion price for Provident’s 6.5% debentures maturing on April 30, 2011 was adjusted from $14.75 to $12.40 per trust unit. Upon maturity in 2009, Provident repaid $25.1 million to the holders of its 8.0% convertible debentures and the balance of the equity component of the 8.0% convertible debentures of $1.3 million was transferred to contributed surplus. Provident may elect to satisfy interest and principal obligations by the issue of trust units. For the year ended December 31, 2010, no debentures were converted to trust units at the election of debenture holders (2009 – nil). Included in the carrying value at December 31, 2010 were financing costs of $9.0 million (2009 – $3.0 million). At December 31, 2010, the fair value of convertible debentures approximates the face value of the instruments. The following table details each series of outstanding convertible debentures:
Convertible Debentures
($000s except conversion pricing)Carrying Value (1)
Face Value
Carrying Value (1)
Face Value Maturity Date
Conversion Price per
unit (2)
6.5% Convertible Debentures $ 148,981 $ 149,980 $ 146,028 $ 149,980 April 30, 2011 $ 12.40 6.5% Convertible Debentures 96,084 98,999 94,458 98,999 Aug. 31, 2012 11.56 5.75% Convertible Debentures 155,807 172,500 Dec. 31, 2017 10.60
$ 400,872 $ 421,479 $ 240,486 $ 248,979 (1) Excluding equity component of convertible debentures.(2) The debentures may be converted into trust units at the option of the holder of the debenture at the conversion price per unit.
As at As atDecember 31, 2010 December 31, 2009
62

9. Asset retirement obligation Provident’s asset retirement obligation is based on its net ownership in property, plant and equipment and represents management’s estimate of the costs to abandon and reclaim those assets as well as an estimate of the future timing of the costs to be incurred. Estimated cash flows have been discounted at Provident’s average credit-adjusted risk free rate of seven percent and an inflation rate of two percent has been estimated for future years.
The total undiscounted amount of future cash flows required to settle the midstream asset retirement obligations is estimated to be $210.9 million (2009 - $195.5 million and $307.0 million related to the Upstream oil and gas discontinued operations). The estimated costs include such activities as dismantling, demolition and disposal of the facilities as well as remediation and restoration of the surface land. Payments to settle the midstream asset retirement obligations are expected to occur subsequent to the closure of the facilities and related assets. Settlement of these obligations is expected to occur in 27 to 37 years.
As at As atDecember 31, December 31,
($ 000s) 2010 2009Carrying amount, beginning of year $ 61,464 $ 59,432 Acquisitions 1,442 875 Dispositions (32,016) (9,550) Change in estimate - 10,992 Increase in liabilities incurred during the period 220 856 Settlement of liabilities during the period - discontinued operations (2,041) (5,399) Transfer to other long-term liabilities (1) (9,928) - Accretion of liability - continuing operations 1,416 1,126 Accretion of liability - discontinued operations 1,500 3,132 Carrying amount, end of year $ 22,057 $ 61,464 (1) Commencing on June 30, 2010, obligations associated with residual Upstream properties million have been classified as other long-term liabilities on the balance sheet.
10. Unitholders’ contributions
Provident has authorized capital of an unlimited number of voting trust units. On January 1, 2011, the Trust completed a conversion from an income trust structure to a corporate structure pursuant to a plan of arrangement on the basis of one common share in Provident Energy Ltd. in exchange for each trust unit held in the Trust. The conversion resulted in the reorganization of the Trust into a publicly traded, dividend-paying corporation under the name “Provident Energy Ltd.” (see note 19). Provident’s premium distribution, distribution reinvestment and optional unit purchase plan (the “DRIP”) provides unitholders with a means to automatically reinvest sums received on account of distributions on Trust units. Pursuant to the corporate conversion, the Trust assigned the DRIP to Provident Energy Ltd. (“PEL DRIP”). As a result, all existing participants in the DRIP were deemed to be participants in the PEL DRIP without any further action on their part and holders of common shares may participate in the PEL DRIP with respect to any cash dividends declared and paid by Provident Energy Ltd. on the common shares.
Trust UnitsNumber of
unitsAmount
(000s)Number of
unitsAmount
(000s)Balance at beginning of year 264,336,636 $ 2,834,177 259,087,789 $ 2,806,071 Issued pursuant to the distribution reinvestment plan 4,002,565 28,635 4,913,799 25,732 To be issued pursuant to the distribution reinvestment plan 426,291 3,456 335,048 2,374 Balance at end of year 268,765,492 $ 2,866,268 264,336,636 $ 2,834,177
2010 2009Year ended December 31,
Provident Energy AR 2010 63

The basic per trust units amounts for 2010 were calculated based on the weighted average number of units outstanding of 266,008,193 (2009 – 261,540,079). The diluted per trust units amounts for 2010 are calculated including an additional 16,273,585 trust units (2009 – nil) as well as an add-back to earnings of $1.3 million (2009 – nil) for the dilutive effect of the convertible debentures. The following table reconciles the movement in the contributed surplus balance.
2010 2009Contributed surplus, beginning of the year $ 2,953 $ 1,695Transferred from convertible debentures equity component on maturity (see note 8) - 1,258 Contributed surplus, end of year $ 2,953 $ 2,953
Year ended December 31,
11. Unit based compensation
Restricted trust units (RTU)/Performance trust units (PTU)
Certain employees of Provident are granted restricted trust units (RTUs) and/or performance trust units (PTUs), both of which entitle the employee to receive cash compensation in relation to the value of a specific number of underlying notional trust units. The grants are based on criteria designed to recognize the long term value of the employee to the organization. RTUs typically vest evenly over a period of three years commencing at the grant date. Payments are made on the anniversary dates of the RTU to the employees entitled to receive them on the basis of a cash payment equal to the value of the underlying notional units. PTUs vest three years from the date of grant and can be increased to a maximum of double the PTUs granted or a minimum of nil PTUs depending on Provident’s annualized total unitholder return. The fair value estimate associated with the RTUs and PTUs is expensed in the statement of operations over the vesting period. At December 31, 2010, $7.4 million (2009 - $12.2 million) is included in accounts payable and accrued liabilities for this plan and $10.4 million (2009 - $12.5 million) is included in other long-term liabilities. The following table reconciles the expense recorded for RTUs and PTUs.
2010 2009Cash general and administrative $ 6,880 $ 5,047 Non-cash unit based compensation (included in general and administrative) 1,280 4,569 Production, operating and maintenance expense 288 790
$ 8,448 $ 10,406
Year ended December 31,
The following table provides a continuity of Provident’s RTU and PTU plans:
RTUs PTUsOpening balance January 1, 2009 1,139,835 3,400,330 Grants 911,263 1,813,312 Reinvested through notional distributions 218,283 569,119 Exercised (530,556) (1,602,482) Forfeited (162,702) (221,157) Ending balance December 31, 2009 1,576,123 3,959,122 Grants 672,155 1,385,636 Reinvested through notional distributions 105,956 328,868 Exercised (857,751) (2,873,270) Forfeited (321,475) (356,775) Ending balance December 31, 2010 1,175,008 2,443,581
At December 31, 2010, all RTUs and PTUs have been valued at market price.
64

12. Income taxes
The future income tax asset (liability) is comprised of the following: As at As at
December 31, December 31,2010 2009
Property, plant and equipment in excess of tax value $ (132,602) $ (343,095) Asset retirement obligation 7,696 15,502 Financial derivative instruments 18,454 55,240 Non-capital losses 145,153 105,811 Capital losses - 49,114 Other 21,817 15,863 Valuation allowance (10,143) (61,100)
$ 50,375 $ (162,665) Included in the future income tax asset is estimated non-capital loss carry forwards that expire in 2026 through 2030. Provident’s valuation allowance applies to attributed Canadian royalty income (ACRI) and other temporary differences that reduce the amount recorded to the expected amount to be realized. The amount and timing of reversals of temporary differences depends on Provident’s future operating results, acquisitions and dispositions of assets and liabilities, and distribution policy. A significant change in any of the preceding assumptions could materially affect Provident’s estimate of the future tax liability. The income tax provision differs from the expected amount calculated by applying the Provident’s combined federal and provincial/state income tax rate of 28.03 percent (2009 – 29.51 percent) as follows:
2010 2009Expected income tax expense (recovery), from continuing operations $ 18,175 $ (8,859) Increase (decrease) resulting from:
Income of the Trust (53,667) (37,278) Withholding tax - 1,172 Change in future tax asset held in the Trust 1,668 2,734 Other (4,826) 6,414
Income tax recovery, from continuing operations $ (38,650) $ (35,817)
Year ended December 31,
13. Financial instruments
Risk Management overview
Provident has a comprehensive Enterprise Risk Management program that is designed to identify and manage risks that could negatively affect its business, operations or results. The program’s activities include risk identification, assessment, response, control, monitoring and communication. Provident’s Risk Management group executes the program with oversight from the Risk Management Committee (“RMC”), which provides regular reports to the Audit Committee and Board of Directors. Provident has established and implemented Risk Management strategies, policies and limits that are monitored by Provident’s Risk Management group. The derivative instruments Provident uses include put and call options, costless collars, participating swaps, and fixed price products that settle against indexed referenced pricing. The purchase of put option contracts effectively create a floor price for the commodity, while allowing for full participation if prices increase. The purchase of call options allow for a commodity to be purchased at a fixed price at the option of the contract holder. Costless collars are contracts that provide a floor and a ceiling price and allowing participation within a set range. Participating swaps are contracts that provide a floor and
Provident Energy AR 2010 65

also provide a ceiling for a certain percentage of the volume of the contract. Fixed price swaps are contracts that specify a fixed price at which a certain volume of product will be bought or sold at in the future. The Risk Management group monitors risk exposure by generating and reviewing mark-to-market reports and counterparty credit exposure of Provident’s outstanding derivative contracts. Additional monitoring activities include reviewing available derivative positions, regulatory changes and bank and analyst reports. Provident’s commodity price risk management program utilizes derivative instruments to provide for protection against lower commodity prices and product margins, as well as fluctuating interest and foreign exchange rates. Provident may also use derivative instruments to protect acquisition economics. The program is designed to stabilize cash flows in order to support cash distributions, capital programs and bank financing. The risk management strategy provides price stabilization and protection of a percentage of inventory values and fractionation spread margin associated with the midstream business. Provident seeks to use products that allow participation in a rising commodity price environment where possible and economic. As well, the Provident risk management strategy reduces foreign exchange risk due to the exposure arising from the conversion of U.S. dollars into Canadian dollars.
Fair Values
During 2009, CICA Handbook Section 3862, Financial Instruments – Disclosures (“Section 3862”), was amended to require disclosures about the inputs to fair value measurements, including their classification within a hierarchy that prioritizes the inputs to fair value measurement. The three levels of the fair value hierarchy are:
• Level 1 – Unadjusted quoted prices in active markets for identical assets or liabilities; • Level 2 – Inputs other than quoted prices that are observable for the asset or liability either directly or
indirectly; and • Level 3 – Inputs that are not based on observable market data. Provident’s financial derivative instruments have been classified as Level 2 instruments and are the only financial instruments carried at fair value as at December 31, 2010 and 2009. The fair values of financial derivative instruments are determined by reference to independent monthly forward settlement prices, interest rate yield curves, currency rates, and volatility rates at the period-end dates. All of Provident’s financial derivative instruments are executed in liquid markets.
Provident has also reflected management’s assessment of nonperformance risk, including credit risk, into the fair value measurement. In evaluating the credit risk component of nonperformance risk, Provident has considered prevailing market credit spreads.
66

As at December 31, 2010Held for Trading
Loans and Receivables
Other Liabilities
Total Carrying
Value
AssetsCash and cash equivalents $ 4,400 $ - $ - $ 4,400 Accounts receivable - 206,631 - 206,631 Financial derivative instruments - current assets 487 - - 487
$ 4,887 $ 206,631 $ - $ 211,518
LiabilitiesAccounts payable and accrued liabilities $ - $ - $ 227,944 $ 227,944 Cash distributions payable - - 12,646 12,646 Current portion of convertible debentures - - 148,981 148,981 Financial derivative instruments - current liabilities 37,849 - - 37,849 Long-term debt - revolving term credit facilities - - 72,882 72,882 Long-term debt - convertible debentures - - 251,891 251,891 Financial derivative instruments - long-term liabilities 19,601 - - 19,601 Other long-term liabilities - - 18,735 18,735
$ 57,450 $ - $ 733,079 $ 790,529
As at December 31, 2009Held for Trading
Available for Sale
Loans and Receivables
Other Liabilities
Total Carrying
Value
AssetsCash and cash equivalents $ 7,187 $ - $ - $ - $ 7,187 Accounts receivable - - 216,786 - 216,786 Financial derivative instruments - current assets 5,314 - - - 5,314 Investments and other long-term assets - 18,733 - - 18,733
$ 12,501 $ 18,733 $ 216,786 $ - $ 248,020
LiabilitiesAccounts payable and accrued liabilities $ - $ - $ - $ 221,417 $ 221,417 Cash distributions payable - - - 13,468 13,468 Financial derivative instruments - current liabilities 86,441 - - - 86,441 Long-term debt - revolving term credit facilities - - - 264,776 264,776 Long-term debt - convertible debentures - - - 240,486 240,486 Financial derivative instruments - long -term liabilities 103,403 - - - 103,403 Other long-term liabilities - - - 12,496 12,496
$ 189,844 $ - $ - $ 752,643 $ 942,487 Except as disclosed in note 8 in connection with the convertible debentures, there were no significant differences between the carrying value of these financial instruments and their estimated fair value as at December 31, 2010.
Provident Energy AR 2010 67

The following table is a summary of the net financial derivative instruments liability:
As at December 31, As at December 31,($ 000s) 2010 2009
Provident Upstream $ - $ 2,438
Provident Midstream Crude oil 28,313 103,022 Natural gas 19,102 79,847 NGL's (includes propane, butane) 10,363 (330) Foreign exchange (28) (623) Electricity (421) (26) Interest (366) 202 Total $ 56,963 $ 184,530
Market Risk
Market risk is the risk that the fair value of a financial instrument will fluctuate because of changes in market prices. Market risk generally comprises of price risk, currency risk and interest rate risk.
a) Price risk
The decisions to enter into financial derivative positions and to execute the risk management strategy are made by senior officers of Provident who are also members of the RMC. The RMC receives input and commodity expertise from the business managers in the decision making process. Strategies are selected based on their ability to help Provident provide stable cash flow and distributions per unit rather than to simply lock in a specific commodity price. Commodity price volatility and market location differentials affect the Midstream business. In addition, Midstream is exposed to possible price declines between the time Provident purchases natural gas liquid (NGL) feedstock and sells NGL products, and to narrowing frac spread ratios. Frac spread ratio is the ratio between crude oil prices and natural gas prices. There is also a differential between NGL product prices (propane, butane and condensate) and crude oil prices.
Provident responds to these risks using a risk management program that protects a margin or floor level of operating income on a portion of its NGL inventory and production, while retaining some ability to participate in a widening margin environment. Subject to market conditions, Provident’s intention is to hedge approximately 50 percent of its natural gas and natural gas liquids (NGL) volumes on a rolling 12 month basis. Also, subject to market conditions, Provident may add additional hedges as appropriate for up to 24 months. b) Currency risk
Provident’s commodity sales are exposed to both positive and negative effects of fluctuations in the Canadian/U.S. exchange rate. Provident manages this exposure by matching a significant portion of the cash costs that it expects with revenues in the same currency. As well, Provident uses derivative instruments to manage the U.S. cash requirements of its business.
Provident regularly sells or purchases forward a portion of expected U.S. cashflows. Provident’s strategy also manages the exposure it has to fluctuations in the U.S./Canadian dollar exchange rate when the underlying commodity price is based upon a U.S. index price. Provident may also use derivative products that provide for protection against a stronger Canadian dollar, while allowing it to participate if the currency weakens relative to the U.S. dollar.
68

c) Interest rate risk
Provident’s revolving term credit facilities bear interest at a floating rate. Using debt levels as at December 31, 2010, an increase/decrease of 50 basis points in the lender’s base rate would result in an increase/decrease of annual interest expense of approximately $0.4 million (2009 - $1.3 million). Provident has mitigated this risk by entering into interest rate financial derivative contracts for a portion of the outstanding long term debt. The contracts settle against Canadian Bankers Acceptance CDOR rates.
Financial derivative sensitivity analysis
The following tables show the impact on unrealized gain (loss) on financial derivative instruments if the underlying risk variables of the financial derivative instruments changed by a specified amount, with other variables held constant.
($ 000s) As at December 31, 2010 + Change - Change
Frac spread relatedCrude Oil (WTI +/- $5.00 per bbl) $ (9,964) $ 9,892 Natural Gas (AECO +/- $1.00 per gj) 22,264 (22,272) NGL's (includes propane, butane) (Belvieu +/- US $0.10 per gal) (9,160) 9,330 Foreign Exchange ($U.S. vs $Cdn) (FX rate +/- $ 0.05) (2,839) 2,840
Inventory, margin and otherCrude Oil (WTI +/- $5.00 per bbl) (5,506) 5,509 NGL's (includes propane, butane, natural gasoline) (Belvieu +/- US $0.10 per gal) 2,480 (2,482) Electricity (AESO +/- $5.00 per MW/h) 435 (435)
Interest Rate (Rate +/- 50 basis points) $ 239 $ (239)
($ 000s) As at December 31, 2009 + Change - ChangeProvident Upstream
Crude Oil (WTI +/- $10.00 per bbl) $ (259) $ 490 Natural Gas (AECO +/- $1.00 per gj) (1,326) 2,915 Foreign exchange (FX rate +/- $0.01) (202) 203
Provident MidstreamFrac spread related
Crude Oil (WTI +/- $10.00 per bbl) $ (74,887) $ 75,054 Natural Gas (AECO +/- $1.00 per gj) 46,731 (46,565)NGL's (includes propane, butane) (Belvieu +/- US $0.15 per gal) (1,488) 1,487 Foreign Exchange ($U.S. vs $Cdn) (FX rate +/- $ 0.01) (1,386) 1,385
Inventory, margin and otherCrude Oil (WTI +/- $10.00 per bbl) (4,389) 4,388 NGL's (includes propane, butane, natural gasoline) (Belvieu +/- US $0.15 per gal) 2,633 (2,632) Electricity (AESO +/- $5.00 per MW/h 437 (437)
CorporateInterest Rate (Rate +/- 50 basis points) $ 1,765 $ (1,765)
Liquidity Risk
Liquidity risk is the risk Provident will not be able to meet its financial obligations as they come due. Provident’s approach to managing liquidity risk is to ensure that it always has sufficient cash and credit facilities to meet its obligations when due, without incurring unacceptable losses or damage to Provident’s reputation.
Provident Energy AR 2010 69

Management typically forecasts cash flows for a period of twelve months to identify financing requirements. These requirements are then addressed through a combination of committed and demand credit facilities and access to capital markets, as discussed in note 14. The following table outlines the timing of the cash outflows relating to financial liabilities.
As at December 31, 2010
($ 000s) TotalLess than
1 year1 to 3 years
3 to 5 years
More than 5 years
Accounts payable and accrued liabilities $ 227,944 $ 227,944 $ - $ - $ - Cash distributions payable 12,646 12,646 - - - Financial derivative instruments - current 37,849 37,849 - - - Long-term debt - revolving term credit facilities (1) (3) 83,557 3,096 80,461 - - Long-term debt - convertible debentures (2) (3) 504,885 169,583 123,126 19,838 192,338 Long-term financial derivative instruments 19,601 - 19,601 - - Other long-term liabilities (3) 21,136 1,736 13,541 2,433 3,426 Total $ 907,618 $ 452,854 $ 236,729 $ 22,271 $ 195,764
(2) Includes current portion of convertible debentures.
(1) The terms of the Canadian credit facility have a revolving three year period expiring on June 28, 2013.
Payment due by period
(3) Includes associated interest or accretion and principal payments.
Credit Risk
Provident's Credit Policy governs the activities undertaken to mitigate the risks associated with counterparty (customer) non-payment. The Policy requires a formal credit review for counterparties entering into a commodity contract with Provident. This review determines an approved credit limit. Activities undertaken include regular monitoring of counterparty exposures to approved credit limits, financial review of all active counterparties, utilizing master netting arrangements and International Swap Dealers Association (ISDA) agreements and obtaining financial assurances where warranted. Financial assurances include guarantees, letters of credit and cash. In addition, Provident has a diversified base of creditors.
Substantially all of Provident’s accounts receivable are due from customers and joint venture partners in the oil and gas and midstream services and marketing industries and are subject to credit risk. Provident partially mitigates associated credit risk by limiting transactions with certain counterparties to limits imposed by Provident based on management’s assessment of the creditworthiness of such counterparties. The carrying value of accounts receivable reflects management's assessment of the associated credit risks. Settlement of financial derivative contracts Midstream financial derivative contract buyout
In April 2010, Provident completed the buyout of all fixed price crude oil and natural gas swaps associated with the Midstream business for a total realized loss of $199.1 million. The carrying value of these specific contracts at March 31, 2010 was a liability of $177.7 million resulting in an offsetting unrealized gain in the second quarter of 2010. The buyout of Provident’s forward mark to market positions allows Provident to refocus its Commodity Price Risk Management Program on forward selling a portion of actual produced NGL products and inventory to protect margins for terms of up to two years. The following table summarizes the impact of financial derivative contracts settled during the year ended December 31, 2010 and 2009 that are included in realized loss on financial derivative instruments. The table excludes the impact of the Midstream financial derivative contract buyout, presented separately on the Consolidated Statement of Operations.
70

($ 000s except volumes) Volume (1) Volume (1)
Crude oil $ (14,848) 2.2 $ 29,007 4.1 Natural gas (29,849) 16.9 (95,188) 23.0 NGL's (includes propane, butane) (9,454) 1.8 5,072 0.8 Foreign exchange 3,766 (3,505) Electricity 367 (1,276) Interest rate (847) (853) Realized loss on financial derivative instruments $ (50,865) $ (66,743)
Year ended December 31,2010 2009Realized loss on financial derivative instruments
(1) The above table represents aggregate net volumes that were bought/sold over the periods. Crude oil and NGL volumes are listed in millions of barrels and natural gas is listed in millions of gigajoules.
The contracts in place at December 31, 2010 are summarized in the following tables:
Provident Midstream
Year Product Terms Effective Period2011 Crude Oil 1,000 Bpd US $84.57 per bbl (4) (11) January 1 - March 31
701 Bpd US $76.40 per bbl (4) (11) January 1 - March 311,944 Bpd US $83.25 per bbl (4) (12) January 1 - March 311,151 Bpd US $83.18 per bbl (4) (10) January 1 - December 311,833 Bpd US $81.83 per bbl (4) (11) April 1 - December 31
815 Bpd US $87.13 per bbl (4) (11) October 1 - December 311,005 Bpd Costless Collar US $60.64 floor, US $73.45 ceiling January 1 - September 30
416 BpdParticipating Swap Cdn $84.38 per bbl (Average Participation 25% above the floor price) October 1 - December 31
250 BpdParticipating Swap US $63.00 per bbl (Average Participation 64% above the floor price) January 1 - December 31
Natural Gas (62,630) Gjpd Cdn $4.03 per gj (3) January 1 - December 31
(2,337) GjpdParticipating Swap Cdn $8.28 per gj (Average Participation 25% below the ceiling price) October 1 - December 31
Propane 5,507 Bpd US $1.0963 per gallon (5) (10) January 1 - December 316,722 Bpd US $1.088 per gallon (5) (12) January 1 - March 31
(3,273) Bpd US $1.009 per gallon (5) (11) April 1 - December 31Normal Butane (536) Bpd US $1.3975 per gallon (6) (11) January 1 - March 31
2,389 Bpd US $1.39 per gallon (6) (12) January 1 - March 312,500 Bpd US $1.43 per gallon (6) (10) January 1 - March 31
ISO Butane (288) Bpd US $1.4375 per gallon (7) (11) January 1 - March 31Natural Gasoline (1,000) Bpd US $1.83 per gallon (8) (11) January 1 - March 31Electricity (10) MW/hpd Cdn $45.45 per MW/h (9) January 1 - December 31Foreign Exchange Sell US $479,063 per month @ 0.9725 (13) January 1 - December 31
Sell US $980,417 per month @ 1.0805 (13) January 1 - June 30Sell US $3,588,000 per month @ 1.0918 (13) July 1 - September 30
Volume(Buy)/Sell
Provident Energy AR 2010 71
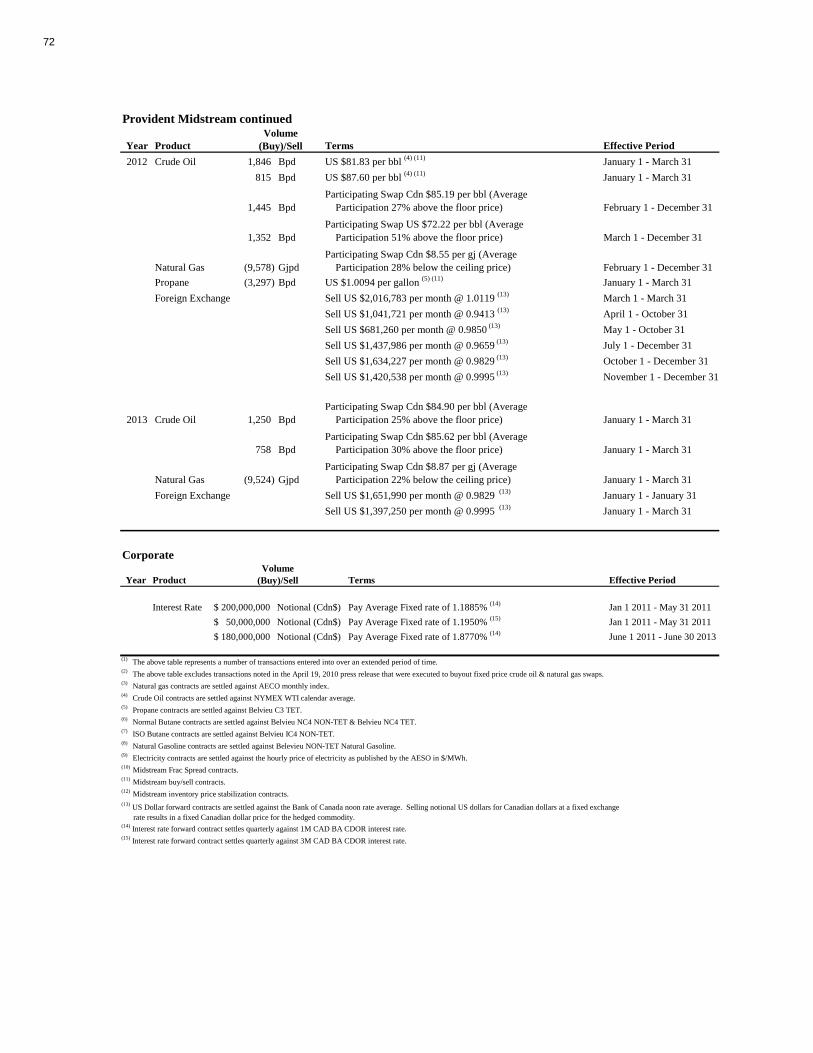
Provident Midstream continued
Year Product Terms Effective Period2012 Crude Oil 1,846 Bpd US $81.83 per bbl (4) (11) January 1 - March 31
815 Bpd US $87.60 per bbl (4) (11) January 1 - March 31
1,445 BpdParticipating Swap Cdn $85.19 per bbl (Average Participation 27% above the floor price) February 1 - December 31
1,352 BpdParticipating Swap US $72.22 per bbl (Average Participation 51% above the floor price) March 1 - December 31
Natural Gas (9,578) GjpdParticipating Swap Cdn $8.55 per gj (Average Participation 28% below the ceiling price) February 1 - December 31
Propane (3,297) Bpd US $1.0094 per gallon (5) (11) January 1 - March 31Foreign Exchange Sell US $2,016,783 per month @ 1.0119 (13) March 1 - March 31
Sell US $1,041,721 per month @ 0.9413 (13) April 1 - October 31Sell US $681,260 per month @ 0.9850 (13) May 1 - October 31Sell US $1,437,986 per month @ 0.9659 (13) July 1 - December 31Sell US $1,634,227 per month @ 0.9829 (13) October 1 - December 31Sell US $1,420,538 per month @ 0.9995 (13) November 1 - December 31
2013 Crude Oil 1,250 BpdParticipating Swap Cdn $84.90 per bbl (Average Participation 25% above the floor price) January 1 - March 31
758 BpdParticipating Swap Cdn $85.62 per bbl (Average Participation 30% above the floor price) January 1 - March 31
Natural Gas (9,524) GjpdParticipating Swap Cdn $8.87 per gj (Average Participation 22% below the ceiling price) January 1 - March 31
Foreign Exchange Sell US $1,651,990 per month @ 0.9829 (13) January 1 - January 31Sell US $1,397,250 per month @ 0.9995 (13) January 1 - March 31
Volume(Buy)/Sell
Corporate
Year Product Terms Effective Period
Interest Rate 200,000,000$ Notional (Cdn$) Pay Average Fixed rate of 1.1885% (14) Jan 1 2011 - May 31 201150,000,000$ Notional (Cdn$) Pay Average Fixed rate of 1.1950% (15) Jan 1 2011 - May 31 2011
180,000,000$ Notional (Cdn$) Pay Average Fixed rate of 1.8770% (14) June 1 2011 - June 30 2013
(14) Interest rate forward contract settles quarterly against 1M CAD BA CDOR interest rate.(15) Interest rate forward contract settles quarterly against 3M CAD BA CDOR interest rate.
(1) The above table represents a number of transactions entered into over an extended period of time.
(3) Natural gas contracts are settled against AECO monthly index.
Volume(Buy)/Sell
(2) The above table excludes transactions noted in the April 19, 2010 press release that were executed to buyout fixed price crude oil & natural gas swaps.
(4) Crude Oil contracts are settled against NYMEX WTI calendar average.
(9) Electricity contracts are settled against the hourly price of electricity as published by the AESO in $/MWh.
(5) Propane contracts are settled against Belvieu C3 TET.(6) Normal Butane contracts are settled against Belvieu NC4 NON-TET & Belvieu NC4 TET.
(8) Natural Gasoline contracts are settled against Belevieu NON-TET Natural Gasoline.
(10) Midstream Frac Spread contracts.
(7) ISO Butane contracts are settled against Belvieu IC4 NON-TET.
(13) US Dollar forward contracts are settled against the Bank of Canada noon rate average. Selling notional US dollars for Canadian dollars at a fixed exchange rate results in a fixed Canadian dollar price for the hedged commodity.
(12) Midstream inventory price stabilization contracts.
(11) Midstream buy/sell contracts.
72

14. Capital management
Provident considers its total capital to be comprised of net debt and Unitholders’ Equity. Net debt is comprised of long-term debt and working capital surplus, excluding balances for the current portion of financial derivative instruments. The balance of these items at December 31, 2010 and December 31, 2009 were as follows:
As at As atDecember 31, December 31,
($000s) 2010 2009Working capital surplus (1) $ (56,848) $ (31,152) Long-term debt (including current portion) 473,754 505,262 Net debt 416,906 474,110 Unitholders' equity 587,218 1,381,399 Total capitalization $ 1,004,124 $ 1,855,509
Net debt to total capitalization 42% 26%(1) The working capital surplus excludes balances for the current portion of financial derivative instruments.
Provident’s primary objective for managing capital is to maximize long-term Unitholder value by:
• providing an appropriate return to unitholders relative to the risk of Provident’s underlying assets; and • ensuring financing capacity for Provident’s internal development opportunities and acquisitions of
energy related assets that are expected to add value to our Unitholders. Provident makes adjustments to its capital structure based on economic conditions and Provident’s planned requirements. Provident has the ability to adjust its capital structure by issuing new equity or debt, controlling the amount it returns to unitholders, and making adjustments to its capital expenditure program. Provident relies on cash flow from operations, external lines of credit and access to equity markets to fund capital programs and acquisitions. On January 1, 2011, the Trust completed a conversion from an income trust structure to a corporate structure pursuant to a plan of arrangement. The conversion resulted in the reorganization of the Trust into a publicly traded, dividend-paying corporation under the name “Provident Energy Ltd.” (see note 19).
15. Product sales and service revenue
For the year ended December 31, 2010, included in product sales and service revenue is $202.7 million (2009 - $202.8 million) associated with the U.S. midstream operations.
16. Strategic review and restructuring In continuation with the previously announced strategic review process, on April 19, 2010, Provident announced a strategic transaction to separate its Upstream and Midstream businesses. An agreement was reached with Midnight Oil Exploration Ltd. (“Midnight”) to combine the remaining Provident Upstream business with Midnight in a $416 million transaction. The arrangement received the approval of Provident unitholders and Midnight shareholders, as well as court and regulatory approvals that are typical for transactions of this nature. Closing of this arrangement occurred on June 29, 2010. In conjunction with this transaction and other initiatives, Provident completed an internal reorganization to continue as a pure play, cash distributing natural gas liquids (NGL) infrastructure and services business which resulted in staff reductions at all levels of the organization, including senior management.
Provident Energy AR 2010 73

On January 1, 2011, the Trust completed a conversion from an income trust structure to a corporate structure pursuant to a plan of arrangement. The conversion resulted in the reorganization of the Trust into a publicly traded, dividend-paying corporation under the name “Provident Energy Ltd.” (see note 19). For the year ended December 31, 2010, strategic review and restructuring costs were $31.7 million, of which $13.8 million were attributable to continuing operations (2009 – $12.3 million and $9.3 million, respectively). The costs are comprised primarily of severance, consulting and legal costs related to the sale of the Upstream business. In the fourth quarter of 2010, $1.9 million in costs were incurred related to Provident’s reorganization into a dividend paying corporation effective January 1, 2011.
17. Discontinued operations (Provident Upstream) On June 29, 2010, Provident completed a strategic transaction in which Provident combined the remaining Provident Upstream business with Midnight to form Pace Oil & Gas Ltd. (“Pace”) pursuant to a plan of arrangement under the Business Corporations Act (Alberta) (the “Arrangement”). Under the Arrangement, Midnight acquired all outstanding shares of Provident Energy Resources Inc., a wholly-owned subsidiary of Provident Energy Trust which held all of the producing oil and gas properties and reserves associated with Provident’s Upstream business. Effective in the second quarter of 2010, Provident’s Upstream business is accounted for as discontinued operations and comparative figures have been reclassified to conform with this presentation. Total consideration from the transaction was $423.7 million, consisting of $115 million in cash and approximately 32.5 million shares of Pace valued at $308.7 million at the time of the closing. Associated transaction costs were $8.1 million. Under the terms of the Arrangement, Provident unitholders divested a portion of each of their Provident units to receive 0.12225 shares of Pace, which was recorded as a non-cash distribution by Provident, valued at $308.7 million. Provident recorded a loss on sale of $475.3 million and $157.6 million in future tax recovery related to this transaction. This transaction completed the full sale of the Provident Upstream business in a series of transactions between September 2009 to June 2010. The following table presents information on the net loss from discontinued operations.
Net loss from discontinued operationsCanadian dollars (000's) 2010 2009Revenue $ 77,114 $ 277,596 Loss from discontinued operations before taxes and impact of sale of discontinued operations (1) (144,774) (163,545) Loss on sale of discontinued operations (475,335) - Capital tax expense - (2,313) Current tax expense (1) (12) Future income tax recovery 181,523 71,682 Net loss from discontinued operations for the period $ (438,587) $ (94,188) Per unit - basic $ (1.65) $ (0.36)
- diluted $ (1.55) $ (0.36)
Year ended December 31,
(1) In 2010, interest expense of $2.5 million (2009 - $7.0 million) was allocated to discontinued operations on a prorata basis calculated as the proportion of net assets of the Upstream business to the sum of total net assets of the Trust plus long-term debt.
The carrying amounts of major classes of assets and liabilities included as part of the Upstream business as at the date of the sale were as follows:
74

Canadian dollars (000s)
Property, plant and equipment $ 928,465 Asset retirement obligation (29,224) Other (8,340)
$ 890,901
18. Commitments
Provident has entered into operating leases for offices that extend through June 2022. However, a significant portion will be recovered through subleases with third parties. In relation to the Midstream business, Provident is committed to minimum lease payments under the terms of various tank car leases for five years. Additionally, under an arrangement to use a third party interest in the Younger Plant, Provident has a commitment to make payments calculated with reference to a number of variables including return on capital. Future minimum lease payments under non-cancelable operating leases are as follows:
As at December 31, 2010
($ 000s) TotalLess than
1 year 1 to 3 years 3 to 5 yearsOperating LeasesOffice leases $ 58,432 $ 11,349 $ 23,484 $ 23,599 Sublease recovery (42,490) (8,861) (18,985) (14,644)
15,942 2,488 4,499 8,955 Rail tank cars 15,195 7,711 6,405 1,079 Younger plant 22,639 5,036 9,211 8,392 Total $ 53,776 $ 15,235 $ 20,115 $ 18,426
Payment due by period
19. Subsequent events
Corporate conversion and corporate dividend policy On January 1, 2011, the Trust completed a conversion from an income trust structure to a corporate structure pursuant to a plan of arrangement. The conversion resulted in the reorganization of the Trust into a publicly traded, dividend-paying corporation under the name “Provident Energy Ltd.” Under the plan of arrangement, former holders of trust units of the Trust received one common share in Provident Energy Ltd. in exchange for each trust unit held in the Trust. Holders of the outstanding convertible debentures will be entitled, upon conversion, to receive common shares in Provident Energy Ltd. on the same basis that they were entitled to receive trust units of the Trust prior to the corporate conversion. This arrangement will be accounted for on a continuity of interests basis and accordingly, the consolidated financial statements will reflect the financial position, results of operations and cash flows as if Provident Energy Ltd. had always carried on the business formerly carried on by the Trust. Assets, liabilities and equity balances will carryover at the same amount as was recognized in the Trust. Provident Energy Ltd.’s dividend level, beginning with the January 2011 dividend is currently set at $0.045 per share per month, which reflects a reduction from the previous monthly cash distribution of $0.06 per unit. This dividend level is intended to allow for internally generated cash flow to support organic growth, maintain a strong balance sheet and provide sustainable monthly dividends to shareholders.
Provident Energy AR 2010 75

Offer to purchase convertible debentures On January 13, 2011, in connection with the recently completed corporate conversion, Provident Energy Ltd. announced an offer to purchase for cash its 6.5% convertible unsecured debentures maturing on August 31, 2012 (the “C series”) and its 6.5% convertible debentures maturing on April 30, 2011 (the “D series”) at a price equal to 101 percent of their principal amounts plus accrued and unpaid interest. The offer was completed on February 21, 2011 and resulted in Provident taking up and cancelling approximately $4 million principal amount of C series debentures and $81 million principal amount of D series debentures. The total offer price, including any accrued and unpaid interest, was funded by Provident Energy Ltd.’s existing revolving term credit facility. Following the completion of the offer, approximately $95 million principal amount of the C series debentures and approximately $69 million principal amount of the D series debentures remain outstanding in accordance with their terms.
20. Reconciliation of financial statements to United States generally accepted accounting
principles (U.S. GAAP) The consolidated financial statements have been prepared in accordance with accounting principles generally accepted in Canada (“Canadian GAAP”). Any differences in accounting principles to U.S. GAAP as they pertain to the accompanying financial statements are not material except as described below. All adjustments are measurement differences. The majority of differences relate to the Upstream business, which was sold in the second quarter of 2010. Accordingly, Provident’s Upstream business is accounted for as discontinued operations and comparative figures have been reclassified to conform with this presentation. Disclosure items are not noted. Consolidated Statements of Earnings - U.S. GAAP
For the year ended December 31, (Cdn $000s) 2010 2009
Net loss as reported $ (335,095) $ (89,020) Adjustments Loss on sale of discontinued operations, net of tax (g) 291,005 - Other adjustments to net income from discontinued operations (a) (b) 118,633 118,875 Net income – U.S. GAAP $ 74,543 $ 29,855 Other comprehensive income - 2,183 Comprehensive income $ 74,543 $ 32,038 Net income from continuing operations per unit - basic $ 0.39 $ 0.02 - diluted $ 0.37 $ 0.02 Net income per unit - basic $ 0.28 $ 0.11 - diluted $ 0.27 $ 0.11
76

Condensed Consolidated Balance Sheet
As at December 31, (Cdn$ 000s)Canadian
GAAP U.S. GAAPCanadian
GAAP U.S. GAAPAssetsDeferred financing charges (d) $ - $ 11,385 $ - $ 2,956 Property, plant and equipment (a) 832,250 832,250 2,025,044 916,683 Goodwill (f) 100,409 100,409 100,409 517,299 Liabilities and unitholders’ equity Current portion of convertible debentures (d) 148,981 149,358 - - Long-term debt - revolving term credit facilities (d) 72,882 75,317 264,776 264,776 Long-term debt - convertible debentures (d) 251,891 260,464 240,486 243,442 Future income tax (asset) liability (a) (b) (50,375) (50,375) 162,665 (119,168) Units subject to redemption (e) - 1,965,831 - 1,855,405 Unitholders' equity (e) (f) 587,218 (1,378,613) 1,381,399 (883,644)
2010 2009
(a) Under the Canadian cost recovery ceiling test the recoverability of the oil and natural gas assets is tested by
comparing the carrying value of the assets to the sum of the undiscounted proved reserve cash flows expected using future price estimates. If the carrying value is not recoverable, the assets are written down to their fair value determined by comparing the future cash flows from the proved plus probable reserves discounted at Provident’s risk free interest rate. Any excess carrying value of the assets on the balance sheet above fair value would be recorded in depletion, depreciation and accretion expense as a permanent impairment. Under U.S. GAAP, companies utilizing the full cost method of accounting for oil and natural gas activities perform a ceiling test using discounted future net revenue from proved oil and natural gas reserves discounted at 10 percent. Prices used in the U.S. GAAP ceiling tests are those that represent an average of the prices on the first day of each month in the calendar year. The amounts recorded for depletion and depreciation have been adjusted in the periods as a result of differences in write down amounts recorded pursuant to U.S. GAAP compared to Canadian GAAP.
Under Canadian GAAP, Provident performed an impairment test of its Upstream oil and gas assets and recorded a ceiling test impairment of $99.1 million in the first quarter of 2010 (2009 – nil). However, under U.S. GAAP the book value of the reporting unit was lower than the Canadian GAAP book value, primarily due to prior years’ U.S. GAAP ceiling test impairments. Using the lower book value under U.S. GAAP resulted in no ceiling test impairment for U.S. GAAP purposes in 2010. Related to the reduced impairment loss of $99.1 million is reduced future income tax recoveries of approximately $25.2 million (2009 – nil) under U.S. GAAP. In 2010, the Upstream business was sold and therefore the associated property, plant and equipment was removed from the balance sheet, thus eliminating any ongoing GAAP difference for property, plant and equipment.
(b) The Canadian liability method of accounting for income taxes in CICA handbook Section 3465 “Income
taxes” is similar to the requirements for U.S. GAAP, which requires the recognition of deferred tax assets and liabilities for the expected future tax consequences of events that have been recognized in Provident’s financial statements or tax returns. Pursuant to U.S. GAAP, enacted tax rates are used to calculate future taxes, whereas Canadian GAAP uses substantively enacted rates. In addition, U.S. GAAP uses a single model to address uncertainty in tax positions and clarifies the accounting for income taxes by prescribing the minimum recognition threshold a tax position is required to meet before being recognized in the financial statements. U.S. GAAP also provides guidance on de-recognition, measurement, classification, interest and penalties, accounting in interim periods, disclosures and transitions as well as specifically scopes out accounting for contingencies. In 2010, the Upstream business was sold and therefore associated future income tax balances were removed from the balance sheet, thus eliminating any ongoing GAAP difference for future income taxes.
Provident Energy AR 2010 77
(c) The consolidated statements of cash flows and operations and accumulated income are prepared in accordance with Canadian GAAP and conform in all material respects with U.S. GAAP except for that U.S. GAAP requires disclosure on the consolidated statement of operations when depreciation, depletion and amortization are excluded from cost of goods sold. This disclosure has not been noted on the face of the consolidated statement of operations.
(d) U.S. GAAP requires debt issue costs to be recorded as deferred charges. Under Canadian GAAP, these
costs are recorded against long-term debt. (e) Under U.S. GAAP, a redemption feature of equity instruments exercisable at the option of the holder
requires that such equity be excluded from classification as permanent equity and be reported as temporary equity at the equity’s redemption value. Changes in redemption value in the period (2010 - $78.3 million increase; 2009 - $445.9 million increase) are recorded to accumulated earnings. Under Canadian GAAP, such equity instruments are considered to be permanent equity and are presented as unitholder’s equity. Provident’s units have a redemption feature, which qualify them to be considered under this guidance.
(f) Under both Canadian and U.S. GAAP, goodwill is tested for impairment at least annually. Both GAAPs
require that the fair value of the reporting unit be determined and compared to the book value of the reporting unit. Under Canadian GAAP, this resulted in impairment being recorded in 2008 relating to the Upstream business. Under U.S. GAAP the book value of the reporting unit was lower than the Canadian GAAP book value, primarily due to ceiling test impairments. Using the lower book value under U.S. GAAP resulted in no goodwill impairment in 2008. In 2010, the Upstream business was sold and therefore the associated goodwill was removed from the U.S. GAAP balance sheet, thus eliminating any ongoing GAAP difference for goodwill.
(g) On June 29, 2010, Provident completed a strategic transaction in which Provident combined the remaining
Provident Upstream business with Midnight to form Pace Oil & Gas Ltd. (“Pace”) pursuant to a plan of arrangement under the Business Corporations Act (Alberta) (the “Arrangement”). Under the Arrangement, Midnight acquired all outstanding shares of Provident Energy Resources Inc., a wholly-owned subsidiary of Provident Energy Trust which held all of the producing oil and gas properties and reserves associated with Provident’s Upstream business. Effective in the second quarter of 2010, Provident’s Upstream business is accounted for as discontinued operations and comparative figures have been reclassified to conform with this presentation. Under Canadian GAAP, Provident recorded a loss on sale of discontinued operations of $317.7 million, net of tax. Due to differences in carrying values under U.S. GAAP for property, plant and equipment, goodwill, and future income taxes associated with the Upstream business, the loss on sale of discontinued operations under U.S. GAAP was $26.7 million, net of tax. This transaction completed the full sale of the Provident Upstream business in a series of transactions between September 2009 to June 2010.
78
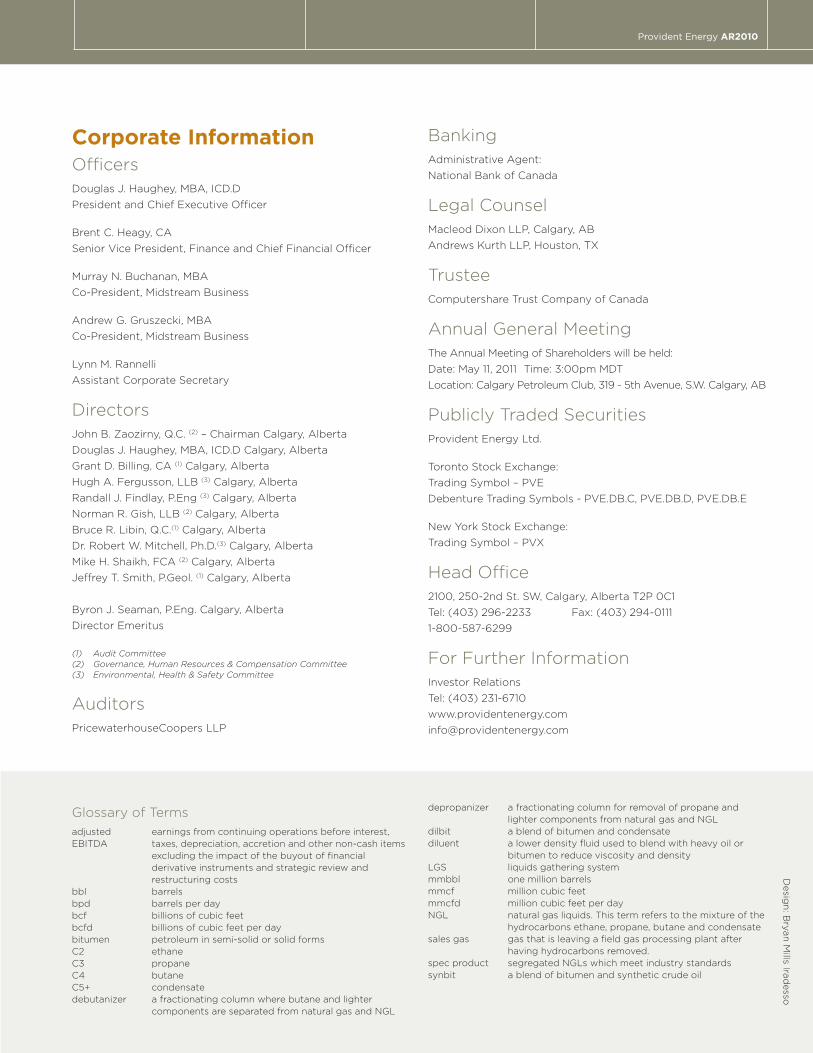
Provident Energy AR2010
Corporate InformationOfficersDouglas J. Haughey, MBA, ICD.D President and Chief Executive Officer
Brent C. Heagy, CA Senior Vice President, Finance and Chief Financial Officer
Murray N. Buchanan, MBA Co-President, Midstream Business
Andrew G. Gruszecki, MBA Co-President, Midstream Business
Lynn M. Rannelli Assistant Corporate Secretary
DirectorsJohn B. Zaozirny, Q.C. (2) – Chairman Calgary, AlbertaDouglas J. Haughey, MBA, ICD.D Calgary, AlbertaGrant D. Billing, CA (1) Calgary, AlbertaHugh A. Fergusson, LLB (3) Calgary, AlbertaRandall J. Findlay, P.Eng (3) Calgary, AlbertaNorman R. Gish, LLB (2) Calgary, AlbertaBruce R. Libin, Q.C.(1) Calgary, AlbertaDr. Robert W. Mitchell, Ph.D.(3) Calgary, AlbertaMike H. Shaikh, FCA (2) Calgary, AlbertaJeffrey T. Smith, P.Geol. (1) Calgary, Alberta
Byron J. Seaman, P.Eng. Calgary, Alberta Director Emeritus
(1) Audit Committee(2) Governance, Human Resources & Compensation Committee(3) Environmental, Health & Safety Committee
AuditorsPricewaterhouseCoopers LLP
BankingAdministrative Agent: National Bank of Canada
Legal CounselMacleod Dixon LLP, Calgary, AB Andrews Kurth LLP, Houston, TX
TrusteeComputershare Trust Company of Canada
Annual General MeetingThe Annual Meeting of Shareholders will be held: Date: May 11, 2011 Time: 3:00pm MDT Location: Calgary Petroleum Club, 319 - 5th Avenue, S.W. Calgary, AB
Publicly Traded SecuritiesProvident Energy Ltd.
Toronto Stock Exchange: Trading Symbol – PVE Debenture Trading Symbols - PVE.DB.C, PVE.DB.D, PVE.DB.E
New York Stock Exchange: Trading Symbol – PVX
Head Office2100, 250-2nd St. SW, Calgary, Alberta T2P 0C1 Tel: (403) 296-2233 Fax: (403) 294-0111 1-800-587-6299
For Further InformationInvestor Relations Tel: (403) 231-6710 www.providentenergy.com [email protected]
Desig
n: B
ryan M
ills Iradesso
Glossary of Termsadjusted earnings from continuing operations before interest, EBITDA taxes, depreciation, accretion and other non-cash items excluding the impact of the buyout of financial derivative instruments and strategic review and restructuring costs bbl barrels bpd barrels per day bcf billions of cubic feet bcfd billions of cubic feet per day bitumen petroleum in semi-solid or solid forms C2 ethane C3 propane C4 butane C5+ condensate debutanizer a fractionating column where butane and lighter
components are separated from natural gas and NGL
depropanizer a fractionating column for removal of propane and lighter components from natural gas and NGLdilbit a blend of bitumen and condensatediluent a lower density fluid used to blend with heavy oil or
bitumen to reduce viscosity and densityLGS liquids gathering systemmmbbl one million barrels mmcf million cubic feet mmcfd million cubic feet per day NGL natural gas liquids. This term refers to the mixture of the
hydrocarbons ethane, propane, butane and condensatesales gas gas that is leaving a field gas processing plant after
having hydrocarbons removed. spec product segregated NGLs which meet industry standardssynbit a blend of bitumen and synthetic crude oil

2100, 250-2nd St. SW Calgary, Alberta T2P 0C1
1-800-587-6299
www.providentenergy.com
TSX: PVE NYSE: PVX


![Provident Fund [1]](https://static.fdocuments.in/doc/165x107/577d29e31a28ab4e1ea82754/provident-fund-1.jpg)