Prov Find Report
92
WIENERBERGER / BAGGERIDGE MERGER INQUIRY Provisional findings report Published: 12 April 2007 The Competition Commission has excluded from this published version of the provisional findings report information which the inquiry group considers should be excluded having regard to the three considerations set out in section 244 of the Enterprise Act 2002 (specified information: considerations relevant to disclosure). The omissions are indicated by . Some numbers have been replaced by a range. These are shown with square brackets.
-
Upload
muhaimin-halim -
Category
Documents
-
view
33 -
download
1
Transcript of Prov Find Report
WIENERBERGER / BAGGERIDGE MERGER INQUIRY
Provisional findings report
Published: 12 April 2007
The Competition Commission has excluded from this published version of the provisional findings report information which the inquiry group considers should be
excluded having regard to the three considerations set out in section 244 of the Enterprise Act 2002 (specified information: considerations relevant to disclosure). The omissions are indicated by . Some numbers have been replaced by a range. These
are shown with square brackets.
Provisional findings report
Anticipated acquisition by Wienerberger Finance Service BV of Baggeridge Brick Plc
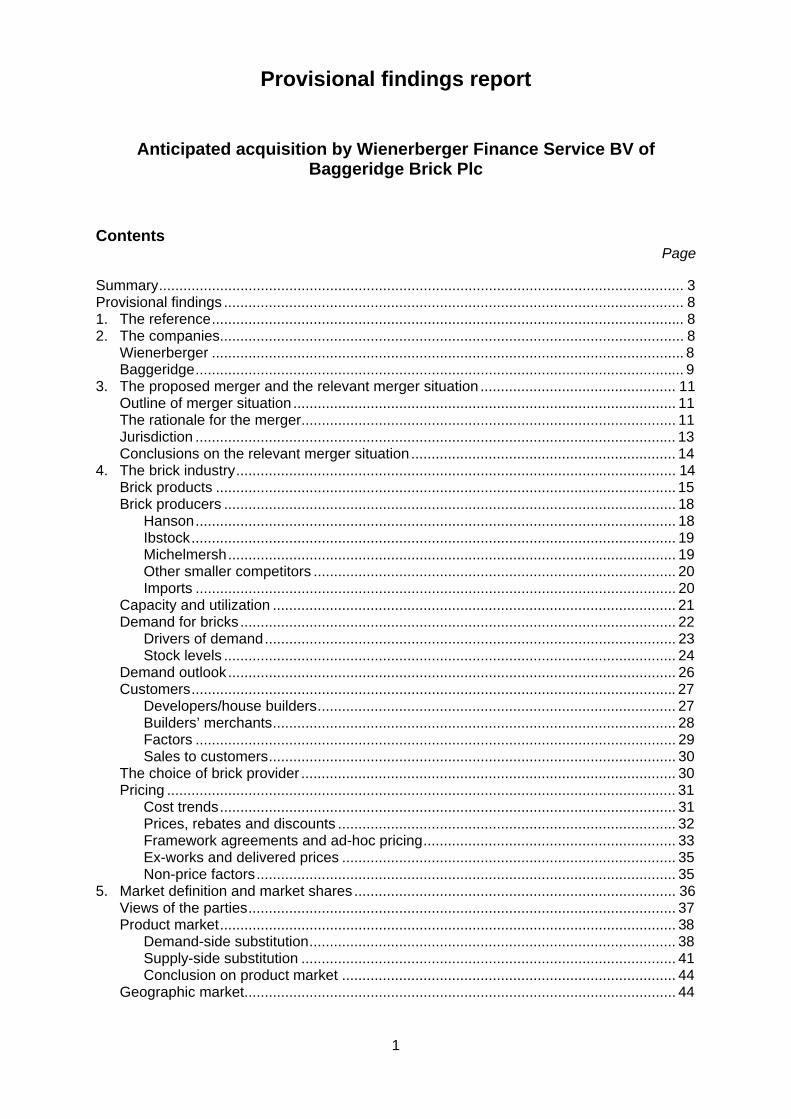
Contents Page
Summary................................................................................................................................. 3 Provisional findings ................................................................................................................. 8 1. The reference.................................................................................................................... 8 2. The companies.................................................................................................................. 8
Wienerberger .................................................................................................................... 8 Baggeridge........................................................................................................................ 9
3. The proposed merger and the relevant merger situation ................................................ 11 Outline of merger situation .............................................................................................. 11 The rationale for the merger............................................................................................ 11 Jurisdiction ...................................................................................................................... 13 Conclusions on the relevant merger situation ................................................................. 14
4. The brick industry............................................................................................................ 14 Brick products ................................................................................................................. 15 Brick producers ............................................................................................................... 18
Hanson...................................................................................................................... 18 Ibstock....................................................................................................................... 19 Michelmersh.............................................................................................................. 19 Other smaller competitors ......................................................................................... 20 Imports ...................................................................................................................... 20
Capacity and utilization ................................................................................................... 21 Demand for bricks........................................................................................................... 22
Drivers of demand..................................................................................................... 23 Stock levels ............................................................................................................... 24
Demand outlook.............................................................................................................. 26 Customers....................................................................................................................... 27
Developers/house builders........................................................................................ 27 Builders’ merchants................................................................................................... 28 Factors ...................................................................................................................... 29 Sales to customers.................................................................................................... 30
The choice of brick provider ............................................................................................ 30 Pricing ............................................................................................................................. 31
Cost trends................................................................................................................ 31 Prices, rebates and discounts ................................................................................... 32 Framework agreements and ad-hoc pricing.............................................................. 33 Ex-works and delivered prices .................................................................................. 35 Non-price factors....................................................................................................... 35
5. Market definition and market shares ............................................................................... 36 Views of the parties......................................................................................................... 37 Product market................................................................................................................ 38
Demand-side substitution.......................................................................................... 38 Supply-side substitution ............................................................................................ 41 Conclusion on product market .................................................................................. 44
Geographic market.......................................................................................................... 44
1
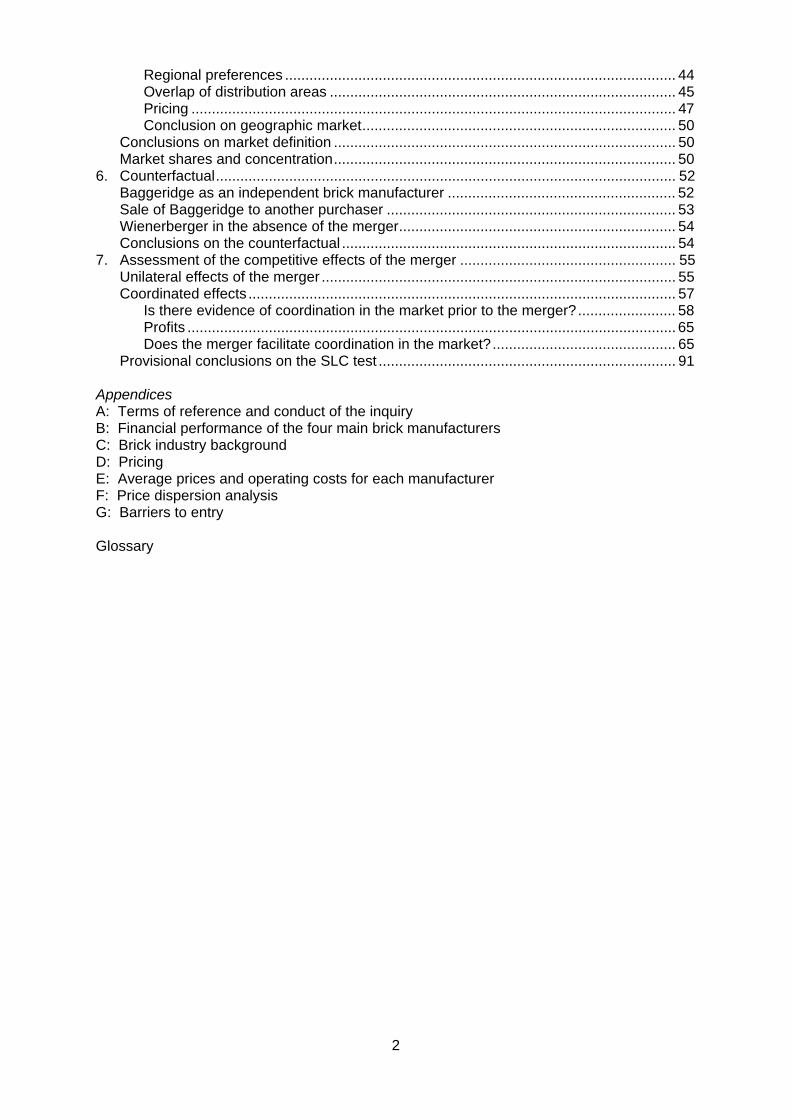
Regional preferences ................................................................................................ 44 Overlap of distribution areas ..................................................................................... 45 Pricing ....................................................................................................................... 47 Conclusion on geographic market............................................................................. 50
Conclusions on market definition .................................................................................... 50 Market shares and concentration.................................................................................... 50
6. Counterfactual................................................................................................................. 52 Baggeridge as an independent brick manufacturer ........................................................ 52 Sale of Baggeridge to another purchaser ....................................................................... 53 Wienerberger in the absence of the merger.................................................................... 54 Conclusions on the counterfactual .................................................................................. 54
7. Assessment of the competitive effects of the merger ..................................................... 55 Unilateral effects of the merger ....................................................................................... 55 Coordinated effects ......................................................................................................... 57
Is there evidence of coordination in the market prior to the merger?........................ 58 Profits ........................................................................................................................ 65 Does the merger facilitate coordination in the market?............................................. 65
Provisional conclusions on the SLC test ......................................................................... 91 Appendices A: Terms of reference and conduct of the inquiry B: Financial performance of the four main brick manufacturers C: Brick industry background D: Pricing E: Average prices and operating costs for each manufacturer F: Price dispersion analysis G: Barriers to entry Glossary
2
Summary 1. On 11 December 2006, the Office of Fair Trading (OFT), in exercise of its duty under
section 33(1) of the Enterprise Act 2002 (the Act), referred to the Competition
Commission (CC) for investigation and report the anticipated acquisition by
Wienerberger Finance Service BV (Wienerberger Finance), a wholly-owned
subsidiary of Wienerberger AG, of Baggeridge Brick Plc (Baggeridge). We are
required to report by 28 May 2007.
2. Wienerberger Ltd (Wienerberger) is the third-largest manufacturer of bricks in Great
Britain. It now operates nine plants in separate locations, and in 2006 had a market
share of 15 to 20 per cent of non-fletton bricks in Great Britain. In the year ended
31 December 2006, Wienerberger made an operating profit of £11 million on turnover
of £87 million. Baggeridge is the fourth-largest brick manufacturer in Great Britain. It
operates seven brick plants from five locations, and in 2006 had a market share of 10
to 15 per cent. In the year ended 30 September 2006, Baggeridge made an
operating profit of £4 million on turnover of £55 million.
3. In addition to Wienerberger and Baggeridge (the parties), there are two other large
manufacturers of clay bricks in Great Britain (collectively, the four firms). Hanson
Building Products Ltd (Hanson) operates 20 plants in England and Wales, focused in
the South-East, Midlands, North and North-West. In 2006, Hanson had a market
share of 20 to 25 per cent. Ibstock Brick Ltd (Ibstock) has 23 plants in Great Britain,
and in 2006 had a market share of 30 to 35 per cent.
4. On 17 August 2006, Wienerberger Finance announced that it had agreed to
purchase for cash the entire issued and to be issued share capital of Baggeridge
through a court sanctioned scheme of arrangement. The proposed acquisition is a
relevant merger situation over which we have jurisdiction.
3
5. Bricks are used primarily as a cladding material for the external faces of buildings.
Demand for bricks has been on a declining trend for many years. There has been a
steeper decline in the last few years and there is currently a higher than normal level
of stocks held by the manufacturers. We were also told that the four firms all had
significant excess capacity.
6. We concluded that the relevant product market affected by the merger included all
clay facing and engineering bricks. We concluded that the relevant product market
does not include (a) fletton bricks; (b) concrete bricks or (c) alternative cladding
materials such as timber and render, because we did not consider any of those
products to be demand-side or supply-side substitutes for non-fletton clay bricks. We
concluded that the relevant geographic market was Great Britain.
7. Bricks are supplied by manufacturers primarily to three categories of customers:
larger housing developers, builders’ merchants and brick factors. Larger customers in
all three categories tend to multi-source bricks, buying from some or all of the four
firms in varying proportions during the course of a year.
8. There are a large number of brick products, with a wide range of prices and
production costs. Although all of the four firms have, or are in the process of,
introducing published price lists, bricks are rarely sold at listed price but at a price
determined by negotiation. The prices paid for bricks vary, depending in particular on
the level of discount and rebate that may have been negotiated between supplier and
individual customers, and on the delivery distance (bricks are heavy and transport
costs are a significant factor).
9. In considering the effects of the merger, we focused first on whether the merger
would have any adverse unilateral effects on competition. The evidence suggested
4
that at least Hanson and Ibstock produce and supply bricks which are close
substitutes for the vast majority of bricks that would be produced by the merged
entity. Customers are already multi-sourcing between the four firms, and face no
major switching costs; some customers are sophisticated large-scale buyers while
others are in buying groups. Furthermore, Ibstock and Hanson have a wide
geographic network and appear able to provide a competitive offer throughout Great
Britain. Accordingly, the existence of alternative suppliers with national distribution
capabilities, the relative ease with which customers may switch between suppliers,
and the existence both of substantial excess stocks and spare capacity make it
unlikely that unilateral action by the merged Parties would be profitable. We
concluded that we did not expect the merger to give rise to substantial lessening of
competition (SLC) through unilateral effects.
10. We then considered whether there would be any coordinated effects arising from the
merger. In order to determine this, we looked first at whether coordinated effects
existed before the merger and then whether the merger would increase the likelihood
of coordinated effects so as to give rise to an SLC.
11. We looked first at whether there was evidence of coordination on prices or capacity
over the last five years. We considered evidence relating to prices, costs, market
shares, capacity and profits. The evidence indicated that there had not been
coordination between the four firms during the last five years.
12. We then looked at whether the merger would increase the likelihood of coordinated
effects so as to give rise to an SLC. Our guidelines set out three conditions which are
necessary for coordination to occur and be sustainable over time.1 These are: first,
the market must be sufficiently coordinated for firms to be aware of the behaviour of
1CC2 Merger References: Competition Commission Guidelines, June 2003, paragraphs 3.37 to 3.40.
5
their competitors, and for any significant deviation from the prevailing behaviour by a
firm to be observed by other firms in the market; second, it must be clear that it will
be costly for firms to deviate from the prevailing behaviour, so costly that it will be in a
firm’s interests to go along with the prevailing behaviour rather than seek to deviate
from it; and third, there must be weak competitive constraints in the market.
. 13. In considering condition one, we analysed the effect of the merger on three issues.
First, whether there would be focal points for price or capacity coordination. Second,
whether there would be incentives to coordinate on price or capacity. Third, whether
deviation from coordinated behaviour would be detectable.
14. We found that it would not be easy to identify focal points for coordination. The
complexity of the mechanisms by which prices are set and sales made militates
strongly against the identification of competitors’ pricing structures. Changes in
capacity, notably incremental changes, are difficult to observe, particularly at the
plant level. We also found that there would not be incentives to coordinate. We based
this finding on the absence of sufficient symmetry between the firms in the market
after the merger, and in particular the absence of symmetry in operating costs, gross
margin percentages, and absolute gross margins. Consequently, we did not think
that there would be coordinated behaviour from which firms would then have to try to
observe deviation. We could have concluded that condition one was not met either
on grounds of lack of ability or lack of incentive. However, we also found that had
there been coordinated behaviour the complex price setting mechanisms, and the
complex way in which sales are made, together with market instability, would have
made deviation difficult to detect. We therefore found that condition one was not met.
15. For completeness, we considered whether conditions two of three might also be met
should the merger proceed. We found that condition two would not be met. Given
that we could identify no incentive to coordinate, incentives to deviate would likewise
6

be significant. The difficulty of detecting deviation from coordinated behaviour would
mean that firms would not know when punishment was required and that the threat of
punishment would not act as a deterrent to deviation. In considering condition three,
we found that while barriers to entry are high, imports are limited, and there is no
significant excess capacity in the hands of smaller producers, we consider that there
are strategies that brick purchasers might employ to undermine coordinated
behaviour. However, we did not have sufficient evidence to conclude on the
likelihood of such strategies proving successful. We therefore did not reach a
conclusion on condition three.
16. Our conclusions on the three conditions are reinforced by Wienerberger’s strategic
plans for the UK. This strategic direction does not lend itself to tacitly coordinated
behaviour on either prices or capacity.
17. We therefore provisionally concluded that we did not expect the merger to give rise to
an SLC.
7
Provisional findings 1. The reference
1.1
1.2
2.1
On 11 December 2006, the OFT, in exercise of its duty under section 33(1) of the
Act, referred to the CC for investigation and report the anticipated acquisition by
Wienerberger Finance, a wholly-owned subsidiary of Wienerberger AG, of
Baggeridge. We are required to report by 28 May 2007. Our terms of reference are in
Appendix A.
This document (together with its appendices) constitutes the provisional findings that
we are required to notify to the parties and publish under the CC’s rules of procedure.
Non-sensitive versions of the main-party and third-party submissions are on our
website, along with other documents relevant to this inquiry. We refer to them where
appropriate.
2. The companies
Wienerberger
Wienerberger AG is the world’s largest producer of bricks and the second-largest
producer of clay roof tiles in Europe. It has more than 260 plants in 24 countries
across Europe and the USA and a global workforce of over 13,000.2 Founded in
Vienna in 1819, we were told that it is now either the largest or second-largest
producer of bricks in every European country in which it operates, apart from Italy
and the UK.
2www.wienerberger.co.uk.
8

2.2
2.3
2.4
Wienerberger AG’s UK operation is Wienerberger, which has been active in the brick
market in Great Britain3 since January 2001, when it acquired the Optiroc brick
distributor (which became Terca), a small importing business. Through the
acquisition of Galileo Brick and thebrickbusiness (TBB) it subsequently became the
third-largest manufacturer of bricks in Great Britain. It now operates nine plants. The
locations of Wienerberger’s plants are shown in Figure 1. Wienerberger’s plants have
a total optimum capacity of [ ] million bricks per annum and produce both extruded
and soft mud bricks. In 2006, Wienerberger produced [ ] million bricks in Great
Britain; in addition it imported [ ] million bricks. In the year ended 31 December
2006, Wienerberger made an operating profit of £11million on turnover of £87 million.
Summary financial information on Wienerberger is provided in paragraphs 20 to 27 of
Appendix B.
Baggeridge
Baggeridge was founded in 1944 in the West Midlands. It now operates seven brick
plants from five locations: one of its plants is in Sussex, the others are all in the West
Midlands (see Figure 1). Its plants have a total optimum capacity of [ ] million bricks
a year. It manufactures both soft mud and extruded bricks. It is the fourth-largest
producer of bricks in Great Britain. In 2006 it produced [ ] million bricks. In the year
ended 30 September 2006, Baggeridge made an operating profit of £4 million on
turnover of £55 million. Summary financial information on Baggeridge is provided in
paragraphs 4 to 19 of Appendix B.
Although its principal business is the manufacture of clay bricks, Baggeridge also
manufactures a brick tile cladding system (Corium). In addition, Baggeridge derives
3Both Wienerberger and Baggeridge have brick plants in Great Britain, but not in Northern Ireland. For the majority of this report we refer, therefore, to brick supply in Great Britain. However, the only information available on imports cover imports into the UK, and so we refer to UK when considering imports.
9
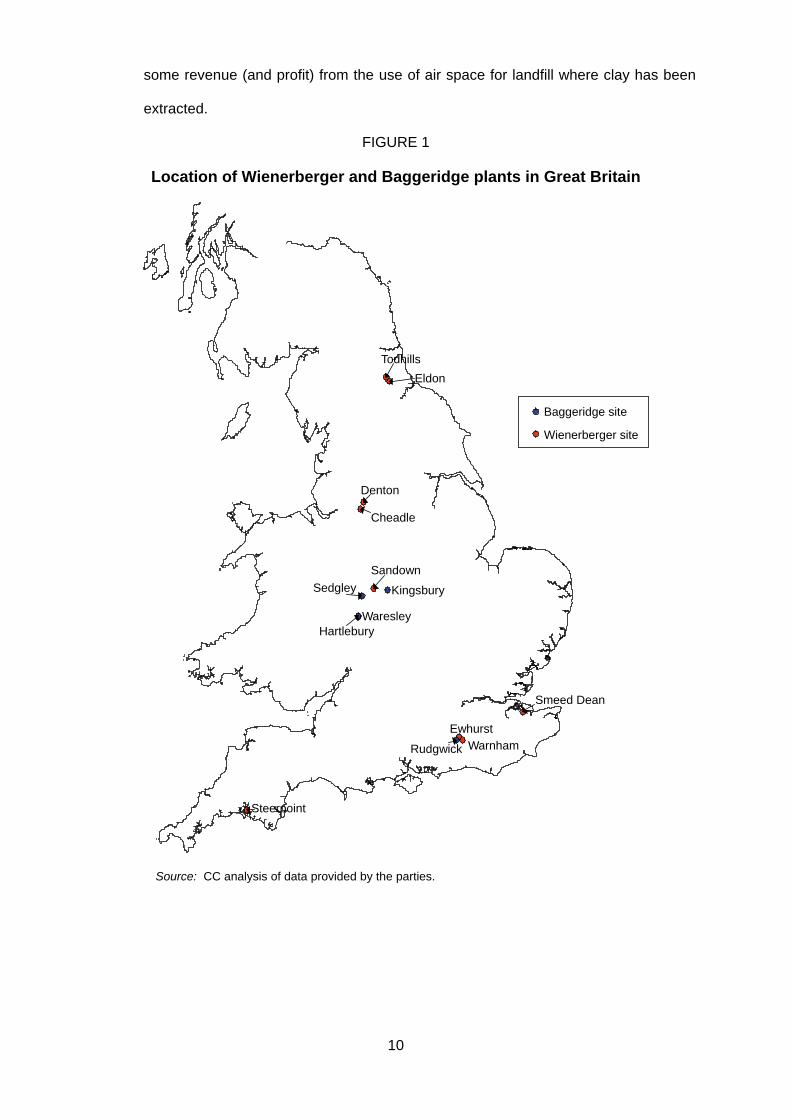
some revenue (and profit) from the use of air space for landfill where clay has been
extracted.
FIGURE 1
Location of Wienerberger and Baggeridge plants in Great Britain
Eldon
Source: CC analysis of data provided by the parties.
Sandown
Cheadle
EwhurstWarnham
Denton
Todhills
Waresley
Kingsbury
Wienerberger site
Baggeridge site
Smeed Dean
Sedgley
Hartlebury
Rudgwick
Steerpoint
10
3. The proposed merger and the relevant merger situation
Outline of merger situation
3.1
3.2
3.3
3.4
Both Wienerberger and Baggeridge told us that Wienerberger had been interested in
acquiring Baggeridge for around ten years, and that during this time Alan Baxter, the
Chief Executive Officer of Baggeridge, had met Wolfgang Reithofer, the Chief
Executive Officer of Wienerberger, on several occasions.
On 17 August 2006, Wienerberger Finance announced that it had agreed to
purchase for cash the entire issued and to-be-issued share capital of Baggeridge
through a court sanctioned scheme of arrangement.4 The implementation of the
scheme is conditional on the merger either being cleared unconditionally, or cleared
subject to conditions satisfactory to Wienerberger Finance, by the OFT or the CC.5
The transaction has been recommended by the Baggeridge board; Wienerberger has
received irrevocable undertakings from the Ward trusts and the Baggeridge board to
vote in favour of the scheme in respect of their shareholdings.
The transaction value is £89.2 million, which represents a price of 216p per
Baggeridge share. This is towards the top end of the range of valuations given by
applying a set of conventional valuation methods.6
The rationale for the merger
Wienerberger told us that it believed that the acquisition of Baggeridge will provide it
with complementary capabilities:
• it told us that it had limited reserves of clay[ ].7[ ] of its nine plants have clay
reserves that are expected to [ ]. Wienerberger told us that Hanson and Ibstock
4Parties’ joint initial submission, 9 January 2007, section 2. 5Notification of the proposed merger of Wienerberger Finance Service BV and Baggeridge Brick plc, paragraph 8. 6Including comparison to precedent transactions, comparable companies and Baggeridge’s historical trading range. 7Joint initial submission, page 10.
11
both had large amounts of clay. Wienerberger also said that it was generally
difficult to gain access to any new greenfield clay sites.
• it also told us that it and Baggeridge had plants in complementary geographic
locations (in particular, Baggeridge had a strong presence in the Midlands, where
Wienerberger was weak), and the combination would achieve a better national
coverage with which to compete with Hanson and Ibstock.8
• since Wienerberger did not produce a full range of bricks, Baggeridge will give
Wienerberger the ability to make products which it does not currently produce in
the UK, including: blue engineering bricks, yellow stock bricks, Corium (providing
an introduction into the alternative cladding market in the UK for Wienerberger),
and clay pavers.
3.5
3.6
3.7
3.8
Wienerberger anticipates up to £[ ] a year in synergy benefits (after [ ] years).
In addition to the synergies available from [ ], Wienerberger believed that there
were [ ] synergies available to it from rationalizing [ ].
Wienerberger told us that [ ].
Baggeridge told us that it had grown to its current size through acquisition and
investment in new plant; however, in common with the rest of the industry, it had not
made any significant investment in new plant since 1989 due to market uncertainties.
It had substantial greenfield clay reserves which remain unexploited because it
considers prospective returns from expanding production are inadequate. It had also
been outbid when trying to grow further through acquisition, and currently finds itself
with limited growth opportunities.
8Joint initial submission, page 10.
12
Jurisdiction
3.9
3.10
3.11
3.12
Under our terms of reference (see Appendix A), we are required to investigate and
report on whether arrangements are in progress or in contemplation which, if carried
into effect, will result in the creation of a ‘relevant merger situation‘ as defined by the
Act. Under section 23 of the Act, a relevant merger situation is created if two or more
enterprises have ceased to be distinct and if either the share of supply test or the
turnover test is satisfied.
The acquisition by Wienerberger Finance of all the share capital of Baggeridge under
the scheme of arrangement proposed will, if it proceeds, result in two enterprises
ceasing to be distinct. Under the scheme Wienerberger and Baggeridge will come
under common ownership and control and therefore cease to be distinct enterprises.
Neither of the parties has disputed that this is the case.
The share of supply test is met if as a result of the merger a share of at least one-
quarter of the supply of goods or services of any description in the UK, or in a
substantial part of the UK, is created or increased. Section 23 of the Act affords the
CC the discretion to apply such criteria as it considers appropriate to decide whether
the 25 per cent share of supply test is met, in relation to both the particular supply of
goods or services on which jurisdiction will rest and the measure by which the share
of supply is assessed.
The parties overlap in relation to the provision of bricks in Great Britain. The parties,
in their joint initial submission to us, said that the share of supply test was not
satisfied, since, having regard to commercial and practical usage, the only
appropriate description of the goods supplied by the parties was ‘all bricks’, and, after
13
the acquisition, the parties would not produce one-quarter of all bricks supplied within
the UK.9
3.13
3.14
3.15
3.16
4.1
For the purposes of assessing whether the share of supply test is met, we consider
here the supply of non-fletton clay bricks in Great Britain (flettons are described in
paragraph 4.5). Data we have collected (see Table 2) indicates that in 2006,
Wienerberger produced an estimated [15–20] per cent of non-fletton clay bricks sold
in Great Britain, and Baggeridge produced an estimated [10–15] per cent.
On that basis, the merger would increase Wienerberger’s share of the supply of non-
fletton clay bricks to [25–35] per cent, and the share of supply test is satisfied.10
Under our terms of reference, if the share of supply test is satisfied, we are not
required to consider the application of the turnover test.
Conclusions on the relevant merger situation
We conclude that the merger will result in a relevant merger situation: arrangements
are in progress or in contemplation which if carried into effect will result in enterprises
ceasing to be distinct and the share of supply test is satisfied.
4. The brick industry
Bricks are shaped pieces of clay fired to over 1,0000C (see Appendix C,
paragraphs 2 to 4, for further information on different types of clay and the
manufacturing process). They are a traditional building material which has been in
9Parties’ joint initial submission, 9 January 2007, paragraph 3.2. 10We noted that our calculations of market share did not agree with those of the parties. We had access to individual transaction data for Wienerberger, Baggeridge, Hanson and Ibstock, and received details from Michelmersh on the number of bricks it produced in 2006. We tested the sensitivity of our market share calculations to uncertainties in the number of bricks produced by other manufacturers in Great Britain and the number of bricks imported. We received several different estimates for each of these. Taking the maximum reasonable estimates for the number of bricks produced by other British manufacturers and the number of bricks imported into the UK, we still found that the share of supply test was comfortably met, with Wienerberger’s share of supply after the merger amounting to [ ] per cent. Taking the minimum reasonable estimates for these variables we calculated that Wienerberger’s maximum possible share of supply after the merger would be [ ] per cent.
14
use for thousands of years. In recent years, they have been predominantly used for
the external facing and footings of buildings, with internal load-bearing walls now
predominantly made from concrete blocks.
Brick products
4.2
4.3
4.4
There are two principal types of brick: facing and engineering bricks. Facing bricks
comprise the vast majority of bricks sold in Great Britain ([80–90] per cent of
Wienerberger’s and Baggeridge’s brick production consists of facing bricks).
Facing bricks are used primarily in the construction of external walls in domestic and
commercial applications. They are chosen for their aesthetic appeal and technical
characteristics, including their speed of use in construction. They must also meet
minimum standards for weather resistance.
Facing bricks are made using either soft mud or extruded techniques. Soft mud
bricks are generally more expensive to produce than extruded bricks. Soft mud bricks
are made by throwing clay into a mould. This throwing process is generally
automated, but some soft mud bricks are hand-made (with the clay thrown by hand
into the mould). Hand-made bricks are considerably more expensive to produce than
machine-made soft mud bricks and represent only a small proportion of soft mud
bricks made in Great Britain. Extruded bricks are made by extruding clay through a
nozzle, with the resultant lengths of clay being cut by wire into individual bricks.
Extruded bricks have a more regular appearance than soft mud bricks. Soft mud
bricks have been the predominant form of brick made and used in the South of
England, with extruded bricks predominantly made and used in the Midlands and
North.
15

4.5
4.6
4.7
Another form of brick is the fletton. Flettons are made from Lower Oxford clay, and
were widely used in London and the surrounding areas, particularly from the 1930s to
the 1980s. We were told that they have inferior technical properties to other bricks (in
particular lower frost resistance) and that they are now mainly used in the repair,
maintenance and improvement (RMI) sector, where a brick is required for repairs or
for an extension to a house made with flettons. Flettons are now [ ] more expensive
for customers to purchase than other bricks used for facing applications, on average
around [ ] per cent (£[ ]) per 1,000 more expensive than soft mud bricks and
around [ ] per cent (£[ ]) per 1,000 more expensive than extruded facing bricks.
Flettons are designed as another form of facing brick. However, for the purposes of
this report we use the term ‘facing brick’ to refer to soft mud and extruded facing
bricks; we refer to flettons separately.
Engineering bricks are designed for use where the strength of the brick or the need
for a brick to have a low level of water absorption is paramount (eg in the
construction of retaining walls or for ground works; see Appendix C, paragraphs 5 to
6 for the technical specifications of engineering bricks). Engineering bricks are
usually extruded bricks. The majority of engineering bricks sold are smooth red Class
B bricks, which are also among the cheapest bricks sold. Class A engineering bricks
have lower water absorption than Class B engineering bricks and are more
expensive to buy. They are often blue-grey in appearance, and are generally used in
facing applications on account of their distinctive appearance. It is possible to use
engineering bricks in facing applications, although they can be slower to lay. In most,
but not all, facing applications, Class B engineering bricks are considered to be less
attractive than facing bricks, and their colour may be less uniform. However, there
are some situations where they are used in place of facing bricks, such as in string
courses to provide contrast in the appearance of brick clad buildings. The parties told
16
us they were also used in applications where a facing brick could be used but a
customer wanted to buy a cheap brick and appearance was less important—for
example garden walls. For the remainder of this report we refer to Class B
engineering bricks, as ‘engineering bricks’; we refer to Class A engineering bricks
separately.
4.8
4.9
In addition to facing bricks and engineering bricks, there are also common bricks and
specials. Common bricks are bricks produced as engineering or facing bricks which
fail quality thresholds but can be used in less specified uses such as non-load-
bearing partitions. Specials are facing bricks which differ in size or shape from
standard-sized or -shaped bricks.
There is a very large number of clay brick products produced in Great Britain, each
with their own product name. Wienerberger estimated there were more than 1,000
individual brick products, which is supported by evidence from Ibstock and Hanson,
who each supply around 40011 brick products. There are a wide variety of bricks with
different appearances, colours and textures, and the prices charged to customers
vary considerably. However, evidence from both manufacturers—Baggeridge,
Wienerberger, Hanson, Ibstock, (the ‘four firms’ except where otherwise specified)—
and customers suggests that the product ranges offered by the four firms overlap
substantially in appearance, price and functionality, so that they each have broadly
comparable portfolios of brick products. This is particularly the case in the bricks that
are widely used in medium to large housing developments (referred to by a number
of parties as ‘developer bricks’).
11See Summary of a hearing with Ibstock, paragraph 2.
17
Brick producers
4.10
4.11
4.12
4.13
In addition to Baggeridge and Wienerberger, there are 29 other brick manufacturers
in the UK (there is only one clay brick plant in Northern Ireland; all the others are in
Great Britain). Of these, only three manufacturers operate more than two plants:
Hanson, Ibstock, and Michelmersh Brick Holdings plc (Michelmersh).
Hanson
Hanson’s brick business was formed through the acquisition of Butterley Brick in
1969 and London Brick (the only manufacturer of flettons) in 1984. The Hanson Brick
division was formed in 1994, with the amalgamation of these two businesses. In 2003
the division called Hanson Building Products was formed, combining Hanson’s brick
operations12 with its other building products divisions. Since the formation of Hanson
Building Products, Hanson has acquired the following brick businesses: Redbank
Manufacturing in 2003, Wilnecote Brick in 2004 and Marshalls Clay Products in 2005.
Hanson operates 20 plants in England and Wales. Its plants are focussed in the
South-East, Midlands, North and North-West (see Figure 4 for the location of
Hanson’s plants). The plants have a total optimum capacity of [ ] million bricks (this
includes approximately [ ] million flettons). In 2006 Hanson produced [ ] million
bricks. Of Hanson’s 20 plants, [ ] produce flettons. Flettons represent [ ] per cent
by volume and [ ] per cent by value of Hanson’s UK brick sales.
In 2002 Hanson sold its Continental European brick manufacturing operations to
Wienerberger, and as a part of the terms of this sale Hanson has continued to import
bricks from Wienerberger’s (ex-Hanson) plants in Belgium and the Netherlands.
12Within Hanson Building Products the only brick company is Hanson Building Products Ltd. Hanson Building Products includes the manufacture and supply of aggregate blocks, aircrete blocks, precast concrete and flooring, and packed products, as well as bricks, and is wholly-owned, via various intermediate holding companies, by Hanson plc.
18
4.14
4.15
4.16
4.17
Hanson Building Products does not produce separate accounts for its brick business.
Financial details of Hanson can be found in Appendix B.
Ibstock
Ibstock is the largest brick manufacturer in the UK. It started as an ancillary brick
business to the colliery at Ibstock in Leicestershire in 1825. In 1999, Ibstock became
part of CRH plc (CRH), which is registered in Ireland and listed on the Irish, London,
and New York Stock Exchanges.
CRH has the largest geographic spread of brick manufacturing in the UK, with 23
plants spread throughout Great Britain. CRH owns Tyrone Brick Limited, the only
brick manufacturer in Northern Ireland (with a single plant). Ibstock told us that
Tyrone Brick operates entirely independently of Ibstock. The location of Ibstock’s
plants is shown in Figure 4. Ibstock has an optimum capacity of [ ] million bricks per
year13 in Great Britain, and produced [ ] million bricks in 2006. It is the only large
producer in Scotland. In the year ended 31 December 2006 Ibstock made an
operating profit of £[ ] on turnover of £[ ]. Financial information on Ibstock can be
found in Appendix B.
Michelmersh
Michelmersh started with a small plant in the Chilterns and has grown through
acquisition. It is the holding company for four brick companies: Blockleys Brick Ltd,
Charnwood Forest Brick Ltd, Dunton Brothers Ltd, and Michelmersh Brick and Tile
Company Ltd. Michelmersh also has non-brick interests, in particular in property
development.
13This figure is the maximum number of bricks Ibstock’s factories can produce in a year taking into account essential maintenance.
19
4.18
4.19
4.20
4.21
Blockleys is the largest Michelmersh plant (it produced around 60 million bricks in
2006) and dates from 1986. At the Blockleys site Michelmersh is able to produce
both soft mud and extruded bricks and also clay pavers. It became part of the
Michelmersh group in 2000. Michelmersh’s other plants produce only soft mud
bricks. Michelmersh has invested in significant plant improvement and expansion in
recent years.
Other smaller competitors
There are 27 small manufacturers in addition to the four firms. Other than
Michelmersh, the most significant smaller manufacturers include Carlton Brick
(capacity approximately [ ] bricks), Freshfield Lane Brickworks and Caradale Brick
(both with a capacity of approximately [ ] bricks), Raeburn Brick (capacity
approximately [ ] bricks), Errol Brick (capacity approximately [ ]) and Hammill
Brick (capacity approximately [ ]).
Imports
A shortage of capacity in the mid-1980s led to the first significant imports of bricks
into the UK. Imports come principally from Belgium and the Netherlands where large
plants have been adapted to produce soft mud bricks to the size of the UK standard.
Wienerberger told us that these bricks were produced significantly more cheaply on
the Continent than in Great Britain.
Imports account for approximately 8 per cent of total brick sales in the UK.
Approximately [ ] per cent of all imported bricks are supplied to customers by
Wienerberger and Hanson. Other importers include Banbury Brick, Hoskins Brick,
and Traditional Brick and Stone.
20
4.22
4.23
The great majority of imported bricks are of the soft mud variety and in general their
average selling price is higher than for domestically produced bricks. This is due at
least in part to transport costs (we were told that it cost £40 to £60 per thousand
bricks to transport bricks from Belgium or the Netherlands to a UK port). We were
also told that imported bricks were predominantly used for more expensive housing
developments and commercial properties (though one brick distributor that
specialized in imports told us that it was targeting the popular developer market).
Capacity and utilization
Manufacturers have told us it was most efficient to run brick plants as close to full
capacity as possible. There appears to be little flexibility in the utilization of capacity.
Brick manufacturers have used longer-than-normal Christmas shutdowns as a
means of reducing production when brick sales have been lower than normal, as it is
more efficient to stop production at a plant for a few weeks than to run it at below
capacity for extended periods. According to Ibstock, it is possible to run a plant at 50
to 60 per cent of capacity for a period of time in response to low demand or for
maintenance purposes, but it would not be efficient to do so for long periods14—
manufacturers faced with excess production capacity would choose to ‘mothball’
plants (usually the least efficient) instead. Mothballing is essentially a temporary
closure (albeit one which could turn into a permanent closure). Mothballed plants can
be brought back into production, but, according to Ibstock, once a plant has been
closed for six months it is unlikely to open again without considerable expenditure, as
the manufacturer will have lost its labour and the equipment would be likely to have
deteriorated and require expensive recommissioning. This has been confirmed by
Wienerberger. Hanson has provided examples of mothballed plants that have been
reopened. The majority of those plants are no longer in operation.
14See Summary of a hearing with Ibstock, paragraph 23.
21
4.24
4.25
4.26
4.27
Stock levels at the manufacturers are currently relatively high (see paragraphs 4.33
to 4.37) as reductions in demand have not been fully reflected in reduced production
and capacity levels notwithstanding that there have been a number of plant closures
in recent years. These closures include Wienerberger’s Wealden plant in 2005,
Ibstock’s Pinhoe plant in 2006 and Hanson’s Star Lane plants in 2005 and 2006
respectively. In addition Hanson has mothballed its Calder, Heather and Waingroves
plants.
Increasing capacity without building new facilities appears possible to a limited
extent. It may be possible to make relatively small increases in capacity at some
plants by capital investment to eliminate process ‘bottlenecks’. Plants that are
running at single shifts of, say, 10 to 11 hours a day, could potentially increase output
by operating a second shift—though this may not be possible at all plants, due to
other capacity limitations such as kiln capacity. Introducing a second shift is not
something that would be done lightly, since it would entail a major increase of costs
and, if the demand for extra bricks were not sustained, then there could be significant
redundancy costs associated with returning to a single shift.
Demand for bricks
The parties told us that there had been a slow decline in demand for bricks over the
last 50 years. In terms of trends over the last 25 years, after a sharp decline at the
start of the 1980s the brick market improved throughout the rest of the 1980s to
reach a peak around 1989 (see Appendix C, Figure 1). There was another decrease
in demand in 1989/1990. After that the market remained relatively static for over a
decade, before another decrease in demand in the last few years.
The fluctuations in demand have had an impact upon the investment decisions of
brick manufacturers: the most recent new plant built was by Baggeridge at Waresley
22
which was completed 18 years ago. No new plants have been built since 1989;
however, manufacturers have continued to invest to maintain or improve the
efficiency of existing plants and in some cases increase their capacity. For example
Wienerberger is currently extending the capacity of its Ewhurst plant from [ ] to [ ]
bricks per annum.
4.28
4.29
4.30
Demand for bricks is highest in London and the South-East of England: Baggeridge
told us that one-third of the demand for bricks in the UK was in the South-East.
Drivers of demand
The principal drivers of demand are the number and size of new residential
properties being built and the proportion of these properties using brick as cladding
material.
Although there has been an increase in the number of house starts and completions
since 1990 (see Appendix C Figure 2) brick demand has fallen. We were told that
there has been a change in housing mix from detached and semi-detached houses
towards flats and apartments, which require fewer bricks per dwelling. We were also
told that the proportion of new-build housing stock represented by detached houses,
which typically use between 7,000 and 10,000 bricks per dwelling, had fallen from
about 40 per cent in 2001 to 22 per cent in 2005. At the same time, the share
represented by apartments, which typically use only around 3,000 to 5,000 bricks per
dwelling, has increased from 20 per cent in 2001 to 46 per cent in 2005. Whilst the
latest government planning policy statement places more emphasis on family
houses, it was only announced in November 2006 and so it is not yet possible to
forecast with any certainty whether it will have any impact on brick demand and, if so,
to what extent.
23
4.31
4.32
4.33
Demand for bricks has also been adversely affected by the use of alternative
cladding materials instead of bricks, particularly, but not exclusively, for apartments
and commercial buildings. There has been support from the Government for off-site
fabrication and other modern methods of construction which may be contributing to
this trend. Alternatives to brick include render, timber and steel (see Appendix C,
paragraphs 12 to 19, for further details).
The choice of cladding is made by the developer or architect (or in some cases by
the end user) at an early stage of the design process, taking into account any
planning requirements or preferences. Whilst planners may stipulate brick or stone
cladding in sensitive or conservation areas, it has been suggested to us that in some
areas planners are actively encouraging timber and other forms of cladding to
provide a more varied ‘street scene’. We were given evidence to show that the use of
brick as the external wall cladding was declining as a percentage of all cladding (see
Appendix C, Table 1). However, the evidence also suggested that brick remains the
cladding material of choice for the vast majority of new houses and that, as a
consequence, the market demand for bricks as a whole is likely to be relatively price-
inelastic even though customers may be sensitive to price levels of individual brick
products.
Stock levels
We were told by Baggeridge, as well as others, that the reduction in demand for
bricks had led to excess production capacity in the market which had led to high
levels of stock (around 900 million bricks, which was more than one-third of total
annual production in Great Britain). Stock levels over the last four years are shown in
Figure 2.
24
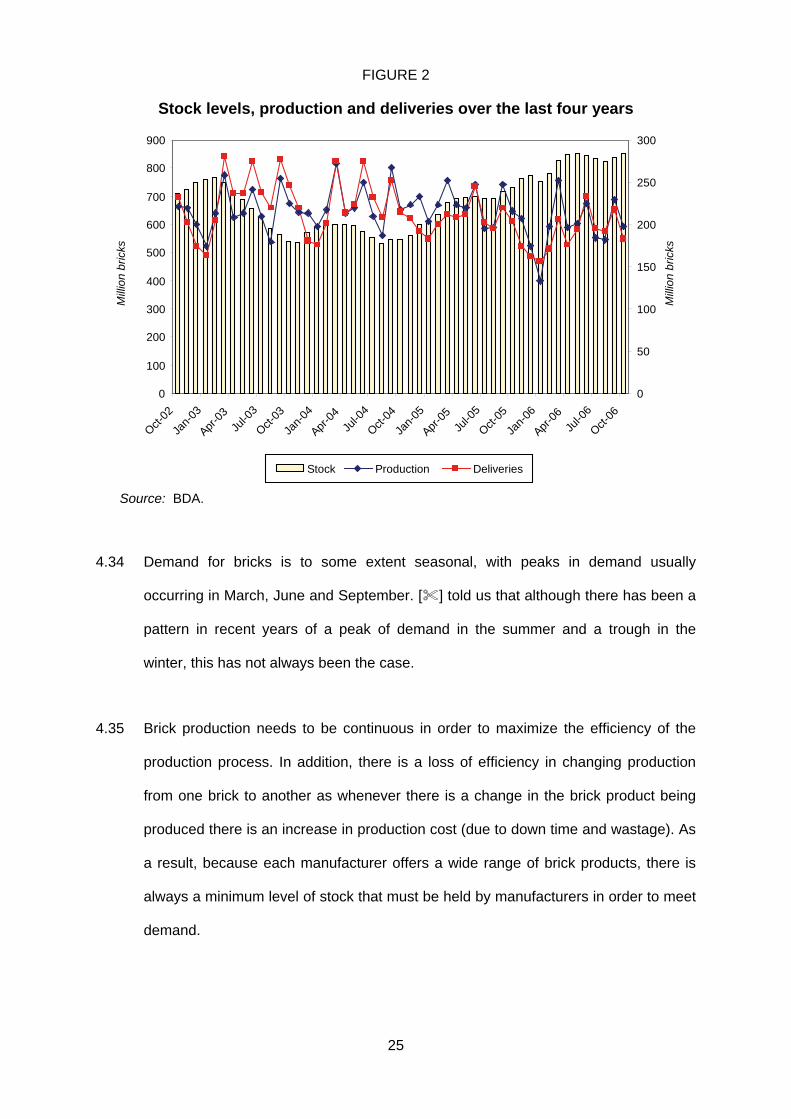
FIGURE 2
Stock levels, production and deliveries over the last four years
0
100
200
300
400
500
600
700
800
900
Oct-02
Jan-0
3
Apr-03
Jul-0
3
Oct-03
Jan-0
4
Apr-04
Jul-0
4
Oct-04
Jan-0
5
Apr-05
Jul-0
5
Oct-05
Jan-0
6
Apr-06
Jul-0
6
Oct-06
Mill
ion
bric
ks
0
50
100
150
200
250
300
Mill
ion
bric
ks
Stock Production Deliveries
Source: BDA.
4.34
4.35
Demand for bricks is to some extent seasonal, with peaks in demand usually
occurring in March, June and September. [ ] told us that although there has been a
pattern in recent years of a peak of demand in the summer and a trough in the
winter, this has not always been the case.
Brick production needs to be continuous in order to maximize the efficiency of the
production process. In addition, there is a loss of efficiency in changing production
from one brick to another as whenever there is a change in the brick product being
produced there is an increase in production cost (due to down time and wastage). As
a result, because each manufacturer offers a wide range of brick products, there is
always a minimum level of stock that must be held by manufacturers in order to meet
demand.
25
4.36
4.37
4.38
4.39
The four firms have given different estimates of optimum stock levels within a range
of 6 to 12 weeks of production (ie, between 11.5 and 23 per cent of annual
production). Hanson has indicated that stock levels falling below 8 to 10 weeks of
supply would be inefficient, whilst Ibstock has told us that it would not want to have
more than [ ] per cent of its annual production in stock. Since all the four firms have
indicated optimum stock levels well below current levels, this implies that there are
currently excess stocks.
Brick manufacturers hold most of the brick stock in the market as they aim to supply
from stock and to respond quickly to satisfy customers’ demand. Merchants will hold
stock of brick products in their yards, particularly of the most popular bricks, including
engineering bricks. The number of brick products they stock will depend on available
space and local demand, but they will not hold a large range of bricks in stock.
Developers will usually aim to minimize their stock holdings.
Demand outlook
We have been told that for some years manufacturers had expected the housing
market to improve in order to meet the requirements of increasing numbers of
households and the persistent shortfall of supply in new housing. Figure 3 of
Appendix C shows a recent demand forecast provided by the parties.
It is unclear to what extent demand may be expected to continue to decline, or
whether a plateau has been, or will shortly be, reached. However, in the light of past
trends, there is no reliable basis on which to determine what demand will be in the
next two to three years with any confidence. On balance the evidence suggested to
us that demand for bricks over the next two to three years would be broadly static.
26
Customers
4.40
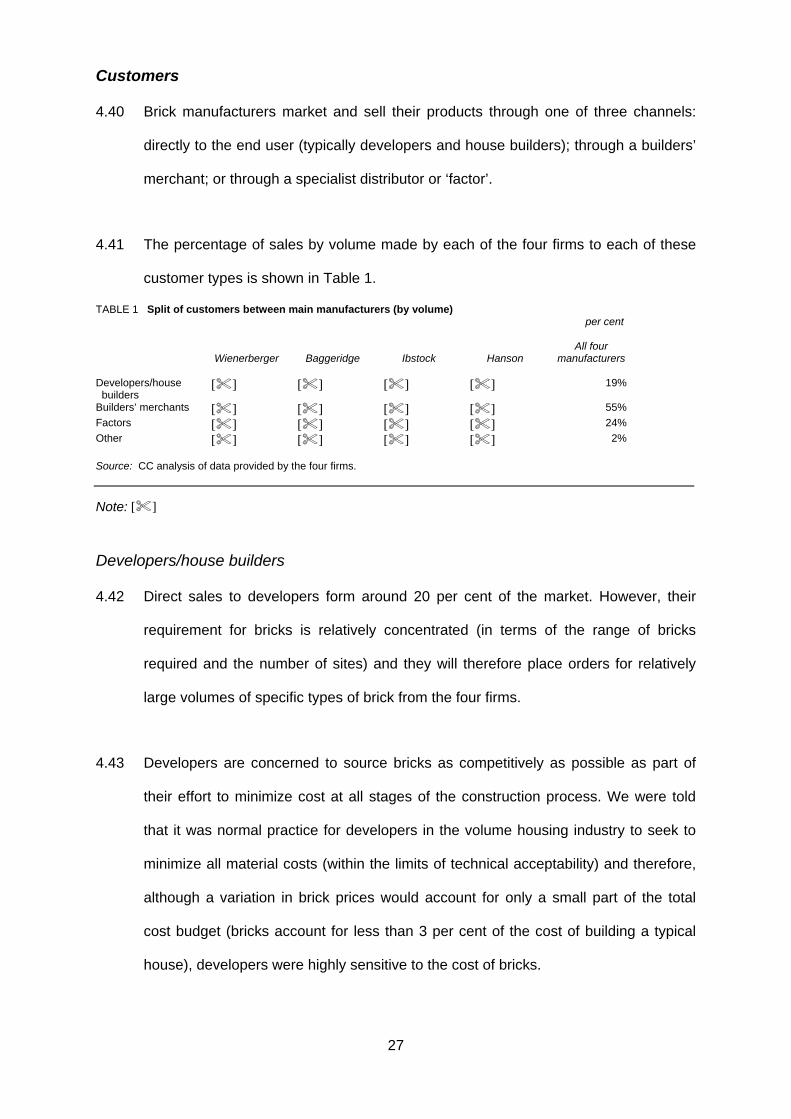
4.41
Brick manufacturers market and sell their products through one of three channels:
directly to the end user (typically developers and house builders); through a builders’
merchant; or through a specialist distributor or ‘factor’.
The percentage of sales by volume made by each of the four firms to each of these
customer types is shown in Table 1.
TABLE 1 Split of customers between main manufacturers (by volume) per cent
Wienerberger
Baggeridge
Ibstock
Hanson All four
manufacturers
Developers/house builders
[ ] [ ] [ ] [ ] 19%
Builders’ merchants [ ] [ ] [ ] [ ] 55% Factors [ ] [ ] [ ] [ ] 24% Other [ ] [ ] [ ] [ ] 2% Source: CC analysis of data provided by the four firms. Note: [ ]
Developers/house builders
4.42
4.43
Direct sales to developers form around 20 per cent of the market. However, their
requirement for bricks is relatively concentrated (in terms of the range of bricks
required and the number of sites) and they will therefore place orders for relatively
large volumes of specific types of brick from the four firms.
Developers are concerned to source bricks as competitively as possible as part of
their effort to minimize cost at all stages of the construction process. We were told
that it was normal practice for developers in the volume housing industry to seek to
minimize all material costs (within the limits of technical acceptability) and therefore,
although a variation in brick prices would account for only a small part of the total
cost budget (bricks account for less than 3 per cent of the cost of building a typical
house), developers were highly sensitive to the cost of bricks.
27
4.44
4.45
4.46
4.47
Developers generally require a just-in-time delivery and therefore rely on the
manufacturers’ ability to hold sufficient stock and deliver bricks at short notice. Some
will hold some stock on site in order to avoid any disruption caused by late or
inaccurate deliveries.
There has been a high degree of consolidation among the major developers in recent
years. Recent examples of mergers and acquisitions include Persimmon/Second City
Homes and Westbury Homes) and Barratt Homes/Wilson Bowden. Also, Taylor
Woodrow has recently announced an agreed offer for George Wimpey. In addition to
the relatively small number of national house builders, there is a large number of
regional or local house builders. These smaller companies will generally source
bricks through factors or from builders’ merchants.
Whilst some major developers deal with all the four firms, a few place the great
majority of their business with only one of them.
Builders’ merchants
Builders’ merchants supply bricks as part of a diversified range of construction
products. Their customers include the smaller developers and much of their business
is directed towards the RMI market. Merchants tend to buy bricks in bulk and divide
these into smaller loads in their yards for sale to the smaller buyers or to buy mixed
loads. They will typically stock a relatively limited volume of bricks to meet customers’
demand. Merchants require deliveries of a wide range of bricks to large numbers of
sites and cannot accurately predict the volume and types of bricks their customers
will order.
28
4.48
4.49
4.50
4.51
4.52
In recent years the larger national builders’ merchants (such as Jewson, Travis
Perkins and the Grafton group) have acquired numerous independent merchants,
leading to greater concentration within this sector.
Small builders’ merchants often join buying groups (such as Cemco or the Combined
Buying Association), and we were told that almost 85 per cent of the smaller,
independent builders’ merchants now belong to a buying group. The function of
buying groups is to achieve purchases of higher volumes which increases their ability
to negotiate a better price than their members could achieve by themselves.
In addition, a small proportion of bricks are sold via retail outlets, such as such as
B&Q, Celco and Wickes, to individual retail customers. Baggeridge told us that these
large outlets now supplied an increasing share of the market.
Factors
Factors are specialist sellers of bricks; they have been described as merchants
without the physical storage capabilities (although in fact some do have storage—for
example those importing bricks). They act as principals (rather than agents) and will
tend to market and sell bricks to the end-user before committing to a purchase.
Whilst acting as principals, they perform a similar role to a broker in bringing together
buyers and brick manufacturers/importers. In common with the builders’ merchants,
factors deal with all of the major manufacturers. The major UK brick factors include
Taylor Maxwell (the only factor offering national coverage), Brickability, the NBS
Group, and Southern Brick and Tile.
A factor will routinely deal with architects, developers and planners, and offers advice
on the choice of a brick for a particular purpose and the availability of different bricks
in the domestic and international markets.
29
4.53
4.54
4.55
4.56
Factors may also offer other forms of alternative external wall cladding in competition
with brick: Taylor Maxwell offers all types of cladding, Southern Brick and Tile is more
focused on brick.
Sales to customers
Generally, distribution is carried out by third party hauliers using purpose-built
vehicles. Haulage may be arranged either by the manufacturer or the customer.
According to the four firms, different customers pay different prices depending on the
volume they plan to purchase, their historic relationship with the manufacturer (ie,
customer loyalty), their size, the customer segment and whether the purchase is
made on an ad-hoc basis or within a framework agreement (see paragraphs 4.65 to
4.68 for more detail).
The choice of brick provider
Most customers multi-source their brick requirements. Whilst developers do not
change brick supplier part way through a development they will source from different
manufacturers for different developments. Builders’ merchants and factors have to
multi-source in order to satisfy customer demand. Customers told us that they
consider themselves to have a certain degree of buyer power, in the sense that they
multi-source and play off different manufacturers against each other in individual
negotiations. Customers suggested to us that the exercise of their buyer power
results in their purchasing brick at prices below list price (though, given we were told
by the parties that very few people pay according to the price list, the level of
discount is probably a better indicator of a degree of buyer power than the simple
existence of a discount). Our regression analysis (see paragraph 4.70 and Appendix
D) suggested that multi-sourcing reduces prices.
30
Pricing
Cost trends
4.57
4.58
Aside from labour, the two most significant costs associated with the production and
sale of bricks are energy costs associated with manufacture, and transport costs
associated with delivery.
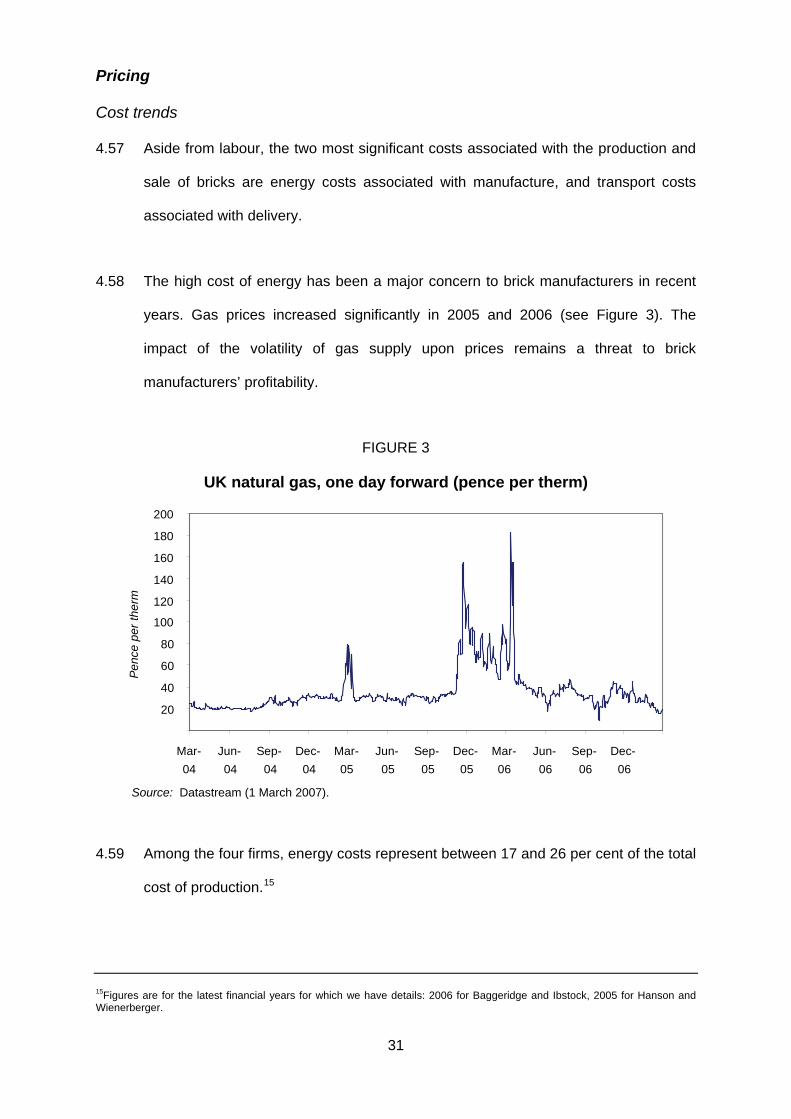
The high cost of energy has been a major concern to brick manufacturers in recent
years. Gas prices increased significantly in 2005 and 2006 (see Figure 3). The
impact of the volatility of gas supply upon prices remains a threat to brick
manufacturers’ profitability.
FIGURE 3
UK natural gas, one day forward (pence per therm)
20
40
60
80
100
120
140
160
180
200
Mar-04
Jun-04
Sep-04
Dec-04
Mar-05
Jun-05
Sep-05
Dec-05
Mar-06
Jun-06
Sep-06
Dec-06
Penc
e pe
r the
rm
Source: Datastream (1 March 2007).
4.59
Among the four firms, energy costs represent between 17 and 26 per cent of the total
cost of production.15
15Figures are for the latest financial years for which we have details: 2006 for Baggeridge and Ibstock, 2005 for Hanson and Wienerberger.
31
4.60
4.61
4.62
Transport costs are a significant part of brick manufacturers’ total costs and of brick
prices for customers. We were told that transport costs could be up to nearly one-
quarter of the cost of delivered bricks; that there was a significant charge for loading
and unloading bricks, and that, according to Wienerberger, the incremental cost per
mile (per thousand bricks) was approximately £[ ]. For an average transport
distance of [ ] miles (the average distance Wienerberger’s bricks are transported to
customers), this equates to an incremental cost of £[ ] per 1,000 bricks, or [ ] to
[ ] per cent of the ex-works brick price, depending on the type of brick.
We have also been told by manufacturers that brick production is characterized by
economies of scale. Econometric analysis of costs appeared to confirm this,
suggesting that there is a negative relation between scale and costs. We received
evidence from some of the competitive fringe16 that they have a higher cost base per
unit of output and/or higher sales prices than the large manufacturers. The fringe
competitors produce mostly facing bricks, often to supply local demand, and often to
meet the demand of planning authorities and/or heritage bodies for an authentic local
appearance. However, some of the larger fringe players (in particular Michelmersh
and Carlton) have brick plants large enough to produce bricks which can meet
demand over substantial distances (in the case of Michelmersh we were told that
such supply covers a radius of up to 90 miles).
Prices, rebates and discounts
Until recently, only two out of the four firms had published price lists. Baggeridge
introduced a price list at the beginning of 2006 and [ ] However, prices actually paid
by customers tend to be negotiated on an individual basis, using the price lists as a
benchmark for subsequent price negotiation. The three large manufacturers with
16The term ‘competitive fringe’ is often used by economists to describe a group of relatively small firms in the market.
32
published price lists have indicated they sell a very small proportion of their total brick
sales at the prices on these lists.
4.63
4.64
4.65
In general, each of the four firms negotiates prices with individual customers. [ ]
and [ ] have indicated that the average price differential between final prices and
list prices, across different customer segments, is [ ] per cent and [ ] per cent,
respectively, with the price differential ranging between [ ] per cent and [ ] per
cent ([ ]) and between [ ] per cent and [ ] per cent ([ ]).
In addition, all four firms offer end-of-year rebates, particularly to builders’ merchants.
Evidence from the parties and from customers suggests that such volume- or value-
based rebates are a very small proportion of total annual spend. The parties and
Hanson have indicated that in recent years rebate levels have increased (under
customer pressure). Due to a lack of scale (and, in some cases, to a different product
mix), the smaller manufacturers generally have a higher average cost base per unit
of output than the average cost of the four firms (see paragraph 4.61). Most smaller
manufacturers appear to compete mainly on non-price factors (see paragraph 4.71).
The fringe players with relatively large plants, such as Michelmersh and Carlton (see
paragraphs 4.17 to 4.19), may be somewhat more competitive on price than the
other fringe competitors, albeit largely limited to the area around their plants.
Framework agreements and ad-hoc pricing
Framework agreements between brick manufacturers and individual customers or
buyer groups generally cover a range of brick products, target volumes, rebate
parameters and (with limited exceptions) prices, in most cases for a 12-month period.
Evidence suggests that all of the substantial customers have framework agreements
with more than one large brick manufacturer. However, all respondents (including
customers) have stressed that these agreements are generally not formal contracts
33
in the sense of creating purchase obligations, and that they merely set out the
commercial conditions for business between the manufacturer and a particular
customer when the latter decides to take delivery. A customer will typically ‘call off’
bricks from its framework agreement at, we were told, typically one week’s notice.
The larger developers appear all to have framework agreements with more than one
manufacturer but do not necessarily purchase bricks from all of the four firms.
4.66
4.67
4.68
Not all sales are conducted within the framework agreements. Prices agreed outside
framework agreements are ‘ad-hoc’ or spot prices. Ad-hoc pricing generally occurs
when either a customer without a framework agreement in place wants to purchase
bricks; the customer has a framework agreement but wants to buy a brick which is
not listed under the agreement; or a manufacturer offers a special deal, generally to
deal with excess amount of stock of a particular brick. In such cases the customer
and the manufacturer will agree a price at the time of the order which is valid only for
that single purchase. According to some developers, the purchase will still be
benchmarked against the terms and conditions under the framework agreement, if
one is in place.
The four firms differ in the proportions of sales made through framework agreements
and spot business. Baggeridge told us that [ ] its sales were made through its
framework agreements. Similarly, Ibstock appears to make [ ] of its sales through
framework agreements. Hanson makes [ ]. Wienerberger told us that [ ] its sales
were [ ].
Further details of framework agreements, ad-hoc pricing and price lists can be found
in Appendix C, paragraphs 23 to 34.
34
Ex-works and delivered prices
4.69
4.70
4.71
Brick prices are generally quoted both on a delivered basis (ie, including haulage
costs from the plant of manufacture) and on an ‘ex-works’ basis (ie excluding
haulage costs). We received somewhat mixed evidence with respect to which prices
manufacturers compete on. On the one hand some customers have told us that ex-
works prices generally do not vary throughout Great Britain, such that delivered
prices vary reflecting the distance of the customer site from the place of manufacture.
On the other hand manufacturers have told us that they frequently vary their ex-
works prices to compensate for higher haulage costs associated with deliveries
further away from their plants, in order that they can compete with more locally based
manufacturers.
We conducted regression analysis on the basis of transaction data from three of the
four firms (see Appendix D). This suggested that brick manufacturers lower their ex-
works price to compensate for higher transport costs associated with supplying areas
further away from their plants. The analysis also suggested that customers which
multi-source pay less for their bricks, and that customers also pay less, the greater
the volume of bricks they purchase.17
Non-price factors
Non-price factors that customers consider important in addition to price are the range
of bricks produced by a manufacturer, availability and continuity of supply, consistent
quality and geographic location/coverage. Brick manufacturers also offer
complementary services in the form of IT systems that allow electronic ordering,
(just-in-time) delivery (carried out by third parties), after-sales services and marketing
support. Most customers have indicated that the service quality offered by the large
17Although the regression analysis suggests that this effect is small, it should be noted that the prices in the transaction dataset that was used in this analysis are exclusive of end-of-year rebates. The actual volume effect is expected to be larger, given the common practice of volume rebates.
35
manufacturers is broadly comparable. The smaller brick manufacturers consider non-
price factors such as their individuality and the associated unique appeal of their
bricks, short communication lines and their readiness to produce to order as their
competitive strengths.
5. Market definition and market shares
5.1
5.2
5.3
This section considers the definition of the market, for which there are normally two
dimensions: the product market and the geographic market, and assesses the shares
of that market held by the four firms. The products that should be included in the
relevant market and the geographic boundaries of that market are determined by
substitutability, ie the extent to which customers can readily switch between
substitute products, or suppliers can readily switch their facilities between the supply
of different products. The generally accepted approach to defining the relevant
market, which is set out in our Guidelines,18 seeks to identify the extent to which
customers could readily demand, or suppliers readily supply, adequate substitute
products in response to a small but significant non-transitory increase in price
(SSNIP) imposed by a hypothetical monopolist of a certain product or products and
geographic candidate markets, such that the price increase would be unprofitable.
The vast majority ([80–90] per cent) of clay bricks produced by the parties are soft
mud and extruded facing bricks. In addition, the parties both produce engineering
bricks. The parties have indicated that they do not compete across the entire range
of bricks. In particular, Wienerberger does not produce or supply blue bricks.
The following analysis of market definition therefore starts by considering the extent
to which different types of bricks form separate product markets or part of one or
more larger markets. We did this looking at both demand-side substitution and
18See Merger References: Competition Commission Guidelines (CC2), paragraph 2.4 et seq. Paragraphs 2.7 and 2.8 explain that the CC will normally hypothesize an increase of around 5 per cent, whilst assuming all other prices remain unchanged.
36
supply-side substitution. Having considered the relevant product market, the analysis
moves on to consider whether the relevant geographic market is regional, national or
international in scope.
Views of the parties
5.4
5.5
The parties’ views on the relevant product market developed during the course of the
inquiry. Their eventual view was that the relevant product market included all clay
bricks including flettons and concrete bricks. The parties told us that flettons were
part of the relevant product market because other facing bricks could be used instead
of fletton bricks,19 they accepted, however, that flettons did not constrain the price of
other facing bricks. They said that concrete bricks were part of the market given that
houses, in particular in south Wales and Northern Ireland, were made from concrete
bricks, and that concrete bricks were additionally a substitute for commons. They
said that if clay bricks rose in price by 5 to 10 per cent then the relatively large price
difference between concrete and clay bricks that existed in south Wales would
extend over a larger area, making concrete bricks attractive over a wider area.
The parties said that the relevant geographic market was Great Britain, because:
• in practice, very substantial volumes of brick are transported over significant
distances and sold profitably, notwithstanding that the further the distance, the
greater impact that transport costs will have on the profit margin of a supplier;
and
• the number and distribution of brick plants is such that the distribution areas of
the vast majority of these plants overlap to a material degree with the distribution
areas of other competing plants. They told us that this created a robust chain of
19See the Joint Initial Submission to the OFT, paragraphs 33 to 39.
37
substitution20 linking the entirety of Great Britain, evidenced by limited price
differences between similar type bricks sold throughout Great Britain.
5.6
5.7
5.8
5.9
The parties said that the island of Ireland was a separate geographic market as the
scope for widespread substitution from suppliers in Great Britain was limited.
However, the parties said that brick supply from Northern Ireland might act as a
competitive constraint. Similarly, the parties submitted that imported bricks may act
as a competitive constraint—but from a separate geographic market.
We took these views into account in carrying out our own analysis and assessment.
Product market
Demand-side substitution
Demand-side substitution occurs where an increase in price makes a product less
attractive to customers, who therefore decide to purchase less of it and more of
substitute products.
We considered first whether soft mud and extruded bricks were in the same relevant
market from a demand-side perspective. We noted that some customers would be
constrained from switching between soft mud and extruded bricks by planning
requirements or customer preferences. However, soft mud and extruded bricks are
used for the same purposes—customers told us that these two types of bricks were
generally interchangeable from a demand-side perspective on the basis of
functionality and aesthetics, and several major customers told us that they saw the
two types of brick as substitutes. We also noted that the realized prices of soft mud
and extruded bricks had moved together in recent years. Taking account of this
20The chain of substitution argument essentially considers that (brick) plants whose distribution areas do not overlap directly still pose a (indirect) competitive constraint on each other because their respective distribution areas overlap with one or more competing plants’ distribution areas, that ‘pass on’ the competitive constraint.
38
information, we concluded that if the price of all soft mud bricks increased by 5 per
cent without a corresponding increase in the price of extruded bricks, a sufficiently
large number of customers would switch from soft mud to extruded bricks to make
the price increase unprofitable. Similarly, if the price of all extruded bricks increased
by 5 per cent, a sufficient number of customers would switch from extruded to soft
mud bricks to make the price increase unprofitable. Therefore, we decided that the
two types of bricks were sufficiently substitutable from a demand-side perspective to
be in the same product market.
5.10
5.11
We considered whether flettons were in the same market as facing bricks from a
demand-side perspective. It should be noted that the question of whether other
facing bricks may constrain the price of flettons is irrelevant for the purposes of this
inquiry, as neither of the parties produces flettons. We noted (see paragraph 4.5) that
flettons are used predominantly for RMI work where a match is required for flettons in
situ, and we were told that flettons are not generally used for new-build houses.
Flettons are [ ] more expensive to buy than either soft mud or extruded bricks, and
the rate of increase in price of flettons over the period 2001 to 2006 was [ ] higher
than for other brick products. We concluded that there would therefore be only very
limited switching from other types of facing bricks to flettons in response to a 5 per
cent increase in the prices of all other facing bricks. We concluded that flettons were
not in the same market as other types of facing brick from a demand-side
perspective.
We next considered whether there was demand-side substitution between facing
bricks and engineering bricks. We distinguished between the higher priced blue
engineering bricks (produced by Baggeridge and Ibstock, which according to the
main parties and Taylor Maxwell, are generally used in facing applications) and
engineering bricks (which are red). We considered blue engineering bricks to be part
39
of the facing brick continuum, and focused our analysis on the scope for demand-
side substitution between facing bricks and engineering bricks.
5.12
5.13
5.14
The evidence we received on the extent of switching between engineering and facing
bricks was both limited and mixed.21,22 It was therefore difficult to evaluate to what
extent such switching would occur in practice in response to a 5 per cent increase in
the price of engineering bricks. We therefore left open the question of whether facing
bricks and engineering bricks were in the same market because of demand-side
substitution.
We also looked at whether facing bricks would be a demand-side substitute for
engineering bricks. We concluded that they would not. Only a small percentage of
facing bricks have appropriate technical properties to be used in applications for
which engineering bricks are designed. Taking this into account, we concluded that a
5 per cent rise in the price of engineering bricks would not induce a sufficient number
of customers to switch to buying facing bricks for use as engineering bricks—such a
price rise would be profitable. We therefore concluded that, from a demand-side
perspective, other types of facing brick were not in the same relevant market as
engineering bricks.
We then considered whether concrete bricks were a demand-side substitute for
(clay) facing bricks. We noted the views of the parties (see paragraph 5.4).
Customers we spoke to did not consider concrete bricks to be substitutes for clay
bricks other than in limited parts of Great Britain, in particular in South Wales. The
leading provider of concrete bricks said that [ ] clay was the preferred product in
21As with extruded and soft mud facing bricks, higher priced Class B engineering bricks are similar in price to relatively low priced extruded facing bricks. This may imply that at least part of these segments are substitutable on price. 22Many customers told us they would not consider substituting facing bricks with engineering bricks, primarily because the latter do not have the aesthetic qualities required by end users. In contrast, the parties consider that ‘a very substantial proportion’ of the bricks that are sold as engineering bricks are actually used in facing applications, and that, in consequence, engineering bricks compete with other facing bricks—albeit at the bottom end of the spectrum of facing bricks.
40
many cases. In response to a 5 per cent price rise for clay facing bricks, there would
be insufficient switching to concrete facing bricks—such a price rise would be
profitable. We therefore concluded, on balance, that concrete bricks were not a
demand-side substitute for facing bricks.
5.15
5.16
5.17
We also considered whether other cladding materials (such as render, steel and
timber) were demand-side substitutes for facing bricks. The parties told us that other
cladding materials were being used in preference to brick in increasing numbers of
housing developments. They also told us that alternative cladding materials were
widely used for commercial buildings (and that bricks were now used as the main
cladding material in only a minority of commercial building applications). Various
factors determined the choice of cladding, including the desired type of street scene,
planning requirements and construction issues (such as speed of construction and
an actual or perceived shortage of bricklayers). This evidence, and evidence from
some developers, suggested to us that price is not the primary driver in choosing
between bricks and other cladding materials and therefore there would be insufficient
switching to other cladding materials in response to a 5 per cent rise in the price of
facing bricks. We therefore concluded that other cladding materials are not economic
substitutes for clay facing bricks from a demand-side perspective.
Supply-side substitution
Supply-side substitution refers to the extent to which a 5 per cent increase in the
price of a certain type of brick will prompt other firms to start supplying at short notice
bricks of a similar type and function.23
For the purposes of market definition, we only need to find either supply-side
substitution or demand-side substitution between two products for them to be in the
23This supply-side substitution will usually come from firms with existing facilities producing similar products.
41
same product market. We therefore focused on whether there was supply-side
substitution between products for which we had not found demand-side substitution.
We therefore looked only at whether there was supply-side substitution between
facing bricks and flettons, facing bricks and engineering bricks, and clay bricks and
concrete bricks.
5.18
5.19
5.20
We looked first at whether there was supply-side substitution between flettons and
facing bricks. Given the distinct clay and production process required to manufacture
flettons, we considered it highly unlikely that the only fletton producer in the UK
(Hanson) would have the ability and the incentive to switch production from flettons
to facing bricks (because the different fabrication processes require different
equipment and because of the high transport costs associated with transporting
appropriate brick clay to the fletton plants for use). We therefore considered that
supply-side substitution was highly unlikely.
We also looked at whether there was supply-side substitution between facing bricks
and engineering bricks.24 Although Ibstock and Hanson told us that not all clay and
kiln specifications were suitable for the production of engineering bricks, we found
that currently, the great majority of engineering bricks are produced at plants where
extruded facing bricks are also produced. We therefore focused on supply-side
substitution between extruded bricks and engineering bricks.
Switching production from engineering bricks to facing bricks can be achieved at
minimal cost. It also appears that slightly higher margins are earned on facing bricks
than on engineering bricks. We thought that some producers of engineering bricks
24We are not aware of large-scale production of soft mud engineering bricks in Great Britain. As engineering bricks are the cheapest bricks on the market it would not appear attractive to produce them using a more expensive manufacturing process than is necessary.
42
would have the incentive and ability to switch to producing facing bricks in response
to a 5 per cent price rise in facing bricks.
5.21
5.22
We also considered the scope for supply-side substitution from facing bricks to
engineering bricks. Because the two types of brick were generally produced in the
same plants, we would expect that such supply-side substitution would be possible.
[ ] told us that the margins earned from the sales of engineering bricks at those of
its plants which are able to supply both types of brick are within 5 per cent of the
margins earned from the sales of facing bricks. This suggests that, even if such
plants were operating at optimum capacity, it would be profitable to switch production
at the margin from facing to engineering bricks if the price of facing bricks increased
by 5 per cent. However, if plants producing facing bricks are operating below
optimum capacity, it may be profitable to produce engineering bricks alongside facing
bricks even if the margins earned on the engineering bricks were less than those
earned on facing bricks. Baggeridge told us that it had not produced any engineering
bricks prior to 2006, because the need to import suitable clay from other sites meant
that production costs of such bricks were relatively high, and margins unattractive.
However, it started to do so in 2006 in order to make efficient use of its capacity at a
time when there was insufficient demand for facing bricks, despite the fact that the
margins earned on sales of engineering bricks were lower than those on facing
bricks. We concluded that it would be both feasible and profitable for producers of
extruded facing bricks profitably to switch to producing engineering bricks in
response to a 5 per cent price rise in these bricks.
We looked at whether there was supply-side substitution between clay bricks and
concrete bricks. We concluded there was not, as the raw materials and
manufacturing processes are completely different. Similarly there is no scope for
supply-side substitution between other cladding materials and bricks.
43
5.23
5.24
5.25
5.26
On the basis of the analysis of supply-side substitution we therefore concluded that
engineering bricks and facing bricks were supply-side substitutes for each other, but
that concrete bricks and other cladding materials were not supply-side substitutes for
clay bricks.
Conclusion on product market
We found extruded and soft mud facing bricks were demand-side substitutes for
each other, and that engineering bricks were supply-side substitutes for facing bricks
(and vice versa). We therefore concluded that the relevant product market included
all clay bricks except for flettons.
Geographic market
We next turned to consider the geographic market. We considered first whether there
were regional markets within Great Britain, then the scope of a possible national
market, and finally whether the market might include bricks which were manufactured
outside Great Britain.
Regional preferences
We considered first whether there are supply and demand differences between
regions, reflecting distinct regional preferences. We received evidence of differences.
These seemed to be driven by historical factors, particularly customer preferences for
bricks which historically had been produced locally. As a result, soft mud bricks were,
we were told, predominantly used in the South, and extruded bricks in the Midlands
and North. However, we were told by the parties that these distinctions were blurring;
for example, Wienerberger told us that it was now producing extruded bricks in
Surrey [ ] despite the traditional local preference for soft mud bricks.
44
5.27
5.28
Generally, the major brick manufacturers told us that they supplied bricks across
Great Britain, which suggested to us that regional preferences were not strong
enough to justify the adoption of any regional markets for market definition purposes.
Overlap of distribution areas
We noted that transport costs formed a significant part of the price paid for bricks
(see paragraph 4.60). We also noted that, in spite of their bulk and weight, more than
50 per cent of bricks were transported over 70 miles. We found that, at current
prices, typically around 80 per cent of the bricks produced by a plant were sold within
a 125 mile radius of the plant. We found that, even if we assumed that all bricks were
sold within 125 miles of a plant, the distribution areas of the parties overlapped with
each other, and with those of Hanson and Ibstock. These overlaps are shown in
simplified form in Figure 4.
45
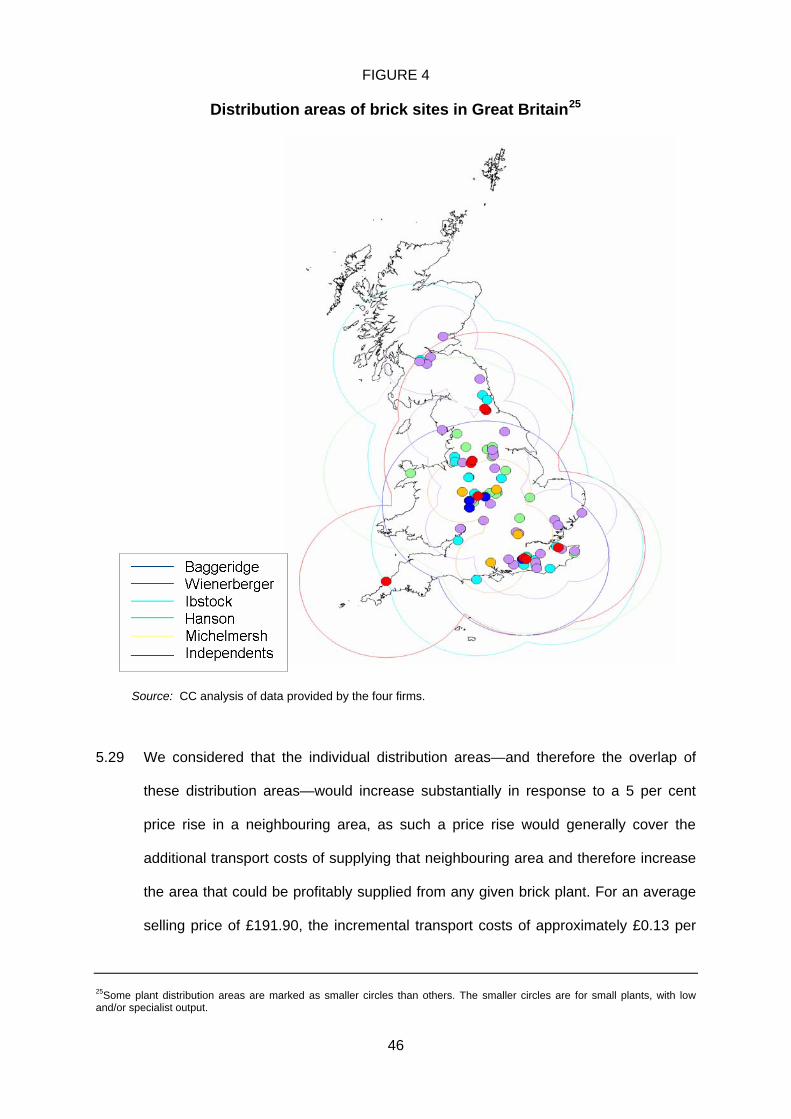
FIGURE 4
Distribution areas of brick sites in Great Britain25
Source: CC analysis of data provided by the four firms.
5.29
We considered that the individual distribution areas—and therefore the overlap of
these distribution areas—would increase substantially in response to a 5 per cent
price rise in a neighbouring area, as such a price rise would generally cover the
additional transport costs of supplying that neighbouring area and therefore increase
the area that could be profitably supplied from any given brick plant. For an average
selling price of £191.90, the incremental transport costs of approximately £0.13 per
25Some plant distribution areas are marked as smaller circles than others. The smaller circles are for small plants, with low and/or specialist output.
46
mile per 1,000 bricks would make it profitable to transport bricks an extra 74 miles in
the case of a 5 per cent price increase.
5.30
5.31
5.32
We noted that, when looking at the conservatively drawn distribution areas (with 125
mile radii), there was less overlap in Scotland than in the rest of Great Britain.
However, if prices rose by 5 per cent manufacturers would be able to transport bricks
profitably over significantly larger distances, and we believed that if this happened
there would be sufficient overlap for Scotland to be considered in the same relevant
geographic market as the rest of Great Britain. We also took account of evidence
which suggested that there is already significant supply into locations in Scotland of
bricks from plants in England over 125 miles distant.
We also noted that customers who buy bricks through national or multi-regional
framework agreements (including buying groups) would be aware of the prices they
could obtain from competing manufacturers supplying from other (overlapping) or
adjacent distribution areas. Customers said that switching between manufacturers
was in general easy and that switching costs were not significant. Taking these
factors into account, we would expect customers of one manufacturer in one region
to switch to competing manufacturers in another region in response to a 5 per cent
price increase, which would argue against the existence of discrete regional markets.
Pricing
We conducted a regression analysis on the basis of transaction data of three of the
four firms (see paragraph 4.70 and Appendix D), which suggested that ex-works
prices were negatively related to transport distance (all other things being equal),
confirming evidence from the parties and Hanson that manufacturers vary their ex-
works price to compensate for higher haulage costs—and generally compete on the
47
basis of delivered prices. [ ] noted that there was no systematic relationship
between distance and price.
5.33
5.34
5.35
5.36
5.37
We then compared delivered prices of extruded facing bricks, soft mud facing bricks
and engineering bricks between different regions in Great Britain and found
substantial overlap in the respective price ranges across regions, albeit with prices
being somewhat higher in the Midlands and the South-East, notwithstanding that
there are significant numbers of brick plants in those regions. We did not find prices
in Scotland to be substantially different from prices in other regions in Great Britain.
We considered that the finding that delivered prices were similar across Great Britain
was consistent with there being a national market.
The impact of bricks made in Northern Ireland
The parties noted that some bricks are imported from Northern Ireland. We therefore
considered whether Northern Ireland should form part of the relevant geographic
market.
The only clay brick manufacturer in Northern Ireland is Tyrone Brick, which is part of
the CRH Group (see paragraph 4.16). Tyrone told us that it was difficult for it to
compete in Great Britain because it had a higher cost base than the large
manufacturers in Great Britain, and because of the high cost of transporting bricks
across the Irish Sea.
Customers located in Northern Ireland indicated that they sourced their brick
purchases almost entirely from manufacturers in Northern Ireland and the Republic of
Ireland due to the relatively high transport costs associated with purchases from
manufacturers in Great Britain.
48
5.38
5.39
5.40
5.41
Because of the limited potential for demand-side and supply-side substitution to and
from Northern Ireland, we concluded that Northern Ireland was outside the relevant
geographic market for the purposes of this inquiry.
The impact of imported bricks
In order to determine to what extent brick prices in Great Britain are constrained by
brick prices outside the UK (primarily Belgium and the Netherlands), we considered
whether it is likely that increased demand for bricks in Great Britain and/or supply of
bricks from outside Great Britain would constrain a 5 per cent increase in the price of
UK manufactured bricks. The parties told us that imported bricks acted as a
competitive constraint on the four firms’ ability to raise prices for bricks in Great
Britain—but from outside the relevant market for the purposes of our inquiry.
Imports account for about 8 per cent of bricks sold in the UK (see notes to Table 2).
We were told that the great majority of imported bricks are of the soft mud variety and
that imports also account for around 20 per cent of soft mud bricks sold in Great
Britain. However, we noted that Wienerberger and Hanson together accounted for
over half of bricks imported into Great Britain, implying that the overall level of
imports from independent third parties was less than 4 per cent of the UK market for
non-fletton bricks, and around 10 per cent of the soft mud brick sales.
We were told that it cost £40 to £60 per thousand bricks to transport bricks from
Belgium or the Netherlands to a UK port, meaning that imported bricks would in most
cases be more expensive to buy than similar bricks produced in Great Britain (though
[ ] did tell us that production costs overseas were significantly lower than those in
the UK, principally as a result of more modern plants and lower energy charges).
Import activity is mostly confined to more highly-priced soft mud bricks.
49
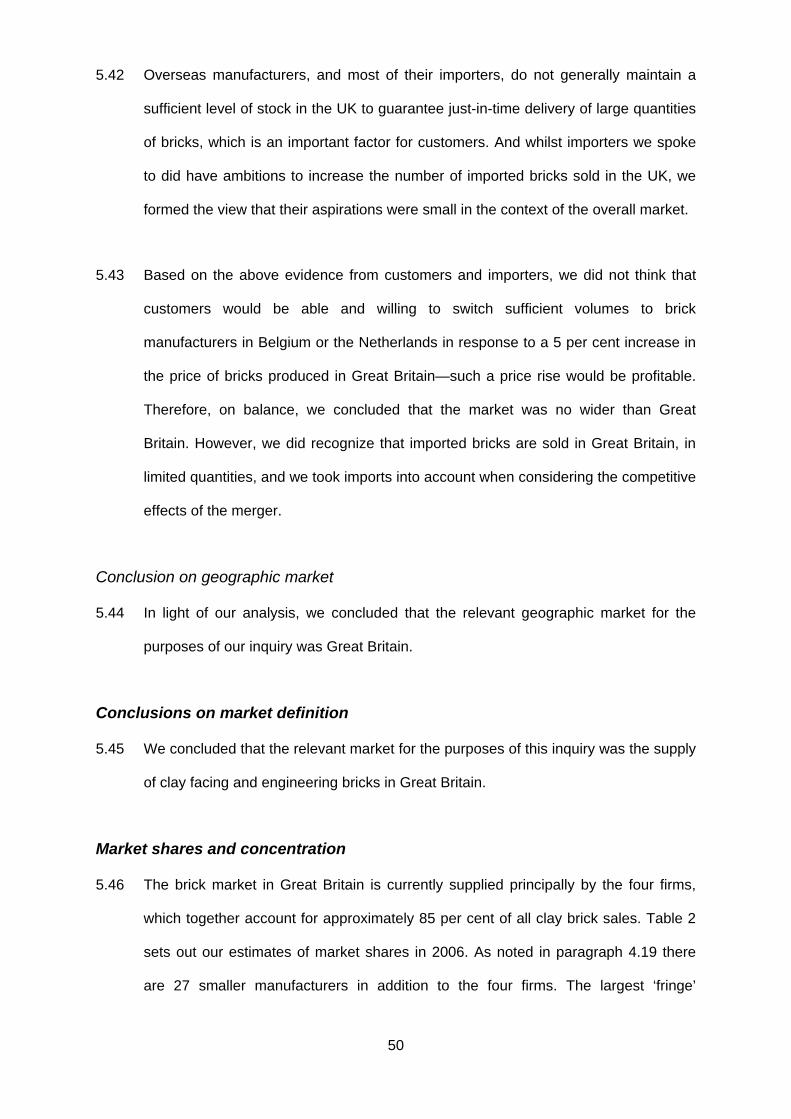
5.42
5.43
5.44
5.45
5.46
Overseas manufacturers, and most of their importers, do not generally maintain a
sufficient level of stock in the UK to guarantee just-in-time delivery of large quantities
of bricks, which is an important factor for customers. And whilst importers we spoke
to did have ambitions to increase the number of imported bricks sold in the UK, we
formed the view that their aspirations were small in the context of the overall market.
Based on the above evidence from customers and importers, we did not think that
customers would be able and willing to switch sufficient volumes to brick
manufacturers in Belgium or the Netherlands in response to a 5 per cent increase in
the price of bricks produced in Great Britain—such a price rise would be profitable.
Therefore, on balance, we concluded that the market was no wider than Great
Britain. However, we did recognize that imported bricks are sold in Great Britain, in
limited quantities, and we took imports into account when considering the competitive
effects of the merger.
Conclusion on geographic market
In light of our analysis, we concluded that the relevant geographic market for the
purposes of our inquiry was Great Britain.
Conclusions on market definition
We concluded that the relevant market for the purposes of this inquiry was the supply
of clay facing and engineering bricks in Great Britain.
Market shares and concentration
The brick market in Great Britain is currently supplied principally by the four firms,
which together account for approximately 85 per cent of all clay brick sales. Table 2
sets out our estimates of market shares in 2006. As noted in paragraph 4.19 there
are 27 smaller manufacturers in addition to the four firms. The largest ‘fringe’
50
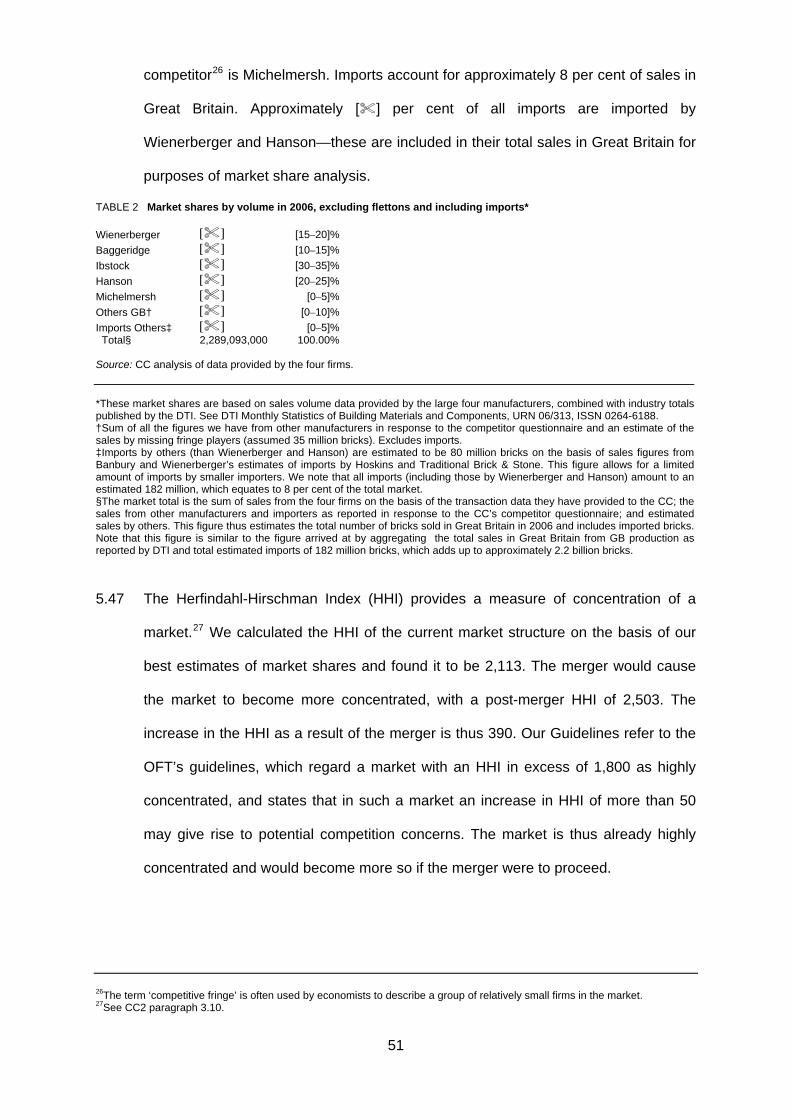
competitor26 is Michelmersh. Imports account for approximately 8 per cent of sales in
Great Britain. Approximately [ ] per cent of all imports are imported by
Wienerberger and Hanson—these are included in their total sales in Great Britain for
purposes of market share analysis.
TABLE 2 Market shares by volume in 2006, excluding flettons and including imports* Wienerberger [ ] [15–20]% Baggeridge [ ] [10–15]% Ibstock [ ] [30–35]% Hanson [ ] [20–25]% Michelmersh [ ] [0–5]% Others GB† [ ] [0–10]% Imports Others‡ [ ] [0–5]% Total§ 2,289,093,000 100.00% Source: CC analysis of data provided by the four firms. *These market shares are based on sales volume data provided by the large four manufacturers, combined with industry totalspublished by the DTI. See DTI Monthly Statistics of Building Materials and Components, URN 06/313, ISSN 0264-6188. †Sum of all the figures we have from other manufacturers in response to the competitor questionnaire and an estimate of the sales by missing fringe players (assumed 35 million bricks). Excludes imports. ‡Imports by others (than Wienerberger and Hanson) are estimated to be 80 million bricks on the basis of sales figures from Banbury and Wienerberger’s estimates of imports by Hoskins and Traditional Brick & Stone. This figure allows for a limitedamount of imports by smaller importers. We note that all imports (including those by Wienerberger and Hanson) amount to an estimated 182 million, which equates to 8 per cent of the total market. §The market total is the sum of sales from the four firms on the basis of the transaction data they have provided to the CC; thesales from other manufacturers and importers as reported in response to the CC’s competitor questionnaire; and estimatedsales by others. This figure thus estimates the total number of bricks sold in Great Britain in 2006 and includes imported bricks.Note that this figure is similar to the figure arrived at by aggregating the total sales in Great Britain from GB production asreported by DTI and total estimated imports of 182 million bricks, which adds up to approximately 2.2 billion bricks.
5.47
The Herfindahl-Hirschman Index (HHI) provides a measure of concentration of a
market.27 We calculated the HHI of the current market structure on the basis of our
best estimates of market shares and found it to be 2,113. The merger would cause
the market to become more concentrated, with a post-merger HHI of 2,503. The
increase in the HHI as a result of the merger is thus 390. Our Guidelines refer to the
OFT’s guidelines, which regard a market with an HHI in excess of 1,800 as highly
concentrated, and states that in such a market an increase in HHI of more than 50
may give rise to potential competition concerns. The market is thus already highly
concentrated and would become more so if the merger were to proceed.
26The term ‘competitive fringe’ is often used by economists to describe a group of relatively small firms in the market. 27See CC2 paragraph 3.10.
51
6. Counterfactual
6.1
6.2
6.3
6.4
6.5
In considering the competitive effects of an anticipated completed merger, we
compare the effects of the merger with what we expect would happen if the merger
did not take place (the counterfactual). We therefore considered what would have
happened to Baggeridge in the absence of the merger. We decided that we should
look at what would happen over the next two to three years, which we thought was
the appropriate period for this inquiry, given the characteristics of the industry.
The evidence suggested to us that Baggeridge is not under financial pressure:
• it has generated profits in each of the last five years (see Appendix B Table 1);
• it had net assets of approximately £55 million as at 30 September 2006 and no
debt (see Appendix B Table 1); and
• both Baggeridge and Wienerberger have forecast that Baggeridge will make
profits in the future and there is no evidence that Baggeridge is likely to be
subject to any sharp decline of market share or other form of market failure.
In addition Baggeridge has sufficient clay reserves [ ].
Given this, we considered that there were two main options open to Baggeridge in
the absence of the merger: continuing to operate as an independent brick
manufacturer, or sale to another purchaser. We considered each of these options in
turn.
Baggeridge as an independent brick manufacturer
Baggeridge told us that if the merger did not go ahead it would review its strategic
options. Prior to merger discussions, Baggeridge’s Board had received a
presentation on strategic options, which had included [ ]
52
6.6
6.7
6.8
6.9
6.10
On the basis of the evidence summarized in paragraphs 6.2 and 6.5 we concluded
that, if the merger does not go ahead, Baggeridge could continue to operate as an
independent brick producer over at least the next two to three years.
Sale of Baggeridge to another purchaser
We considered whether, in the absence of the merger, Baggeridge might be acquired
by a purchaser other than Wienerberger.
We did not think that Baggeridge would be acquired by either Hanson or Ibstock.
Neither company told us that it was interested in acquiring Baggeridge, and we
thought it likely that an acquisition by either company would be likely to raise
competition concerns.
During the course of our inquiry we heard that given the right conditions Michelmersh
might be interested in acquiring Baggeridge. We did not need to form a view as to
whether Michelmersh would actually seek to acquire Baggeridge if this merger did
not proceed, because an acquisition by Michelmersh would not create a significant
change in the market structure compared with the situation in the absence of any
merger. We thought it unlikely that any other UK brick manufacturer was big enough
to acquire Baggeridge.
We considered whether Baggeridge might be an attractive proposition to a brick
manufacturer not currently operating in the UK, or a manufacturer or supplier of
building materials other than brick in the UK. We considered that this was a possible
outcome, but we did not need to form a view as to whether this was the most likely
outcome as such an acquisition would not result in a change in market structure.
Similarly, we did not rule out the possibility of a management buyout or acquisition by
53
a private equity company, but as such an acquisition would not result in a significant
change in market structure we did not need to reach a conclusion on its likelihood.
Wienerberger in the absence of the merger
6.11
6.12
6.13
6.14
We also considered what Wienerberger would do if the merger did not proceed. We
noted that Wienerberger had been interested in [ ]. It told us that, in the absence of
the merger, it would [ ].
Wienerberger is the world’s largest brick manufacturer. It has been interested in the
UK for at least the last ten years and has already invested substantially in its UK
operations. It told us that it saw the UK not only as the largest facing brick market in
Europe but one which is likely to produce long-term opportunities. Its objective was to
be [ ]. It told us that it was prepared to take a long-term view of the markets in
which it operated, including Great Britain.
It therefore appeared likely to us that Wienerberger would continue brick production
in Great Britain, [ ], if the merger does not proceed.
Conclusions on the counterfactual
We concluded that Baggeridge would remain a brick manufacturer in the UK,
independent of the other UK large brick manufacturers. We did not need to reach a
view as to whether it would remain under its current ownership or under other
ownership because, for the purposes of analysing the competitive effects, the
possible changes in ownership would not result in a significant change to the market
structure.
54
6.15
7.1
7.2
7.3
We concluded that, if the merger did not go ahead, Wienerberger would also remain
an independent brick manufacturer in the UK, possibly seeking to expand its existing
plants where clay reserves are available.
7. Assessment of the competitive effects of the merger
In this section we set out our assessment of the competitive effects of the merger.
We look at the expected effects of the merger compared with what would have
happened in the counterfactual, to see if we expect there to be any SLC as a result of
the merger. We do this by first considering whether there are any adverse effects of
the merger because of unilateral actions the merged entity would be able to take. We
then look at whether the market has exhibited coordination28 among the four firms,
and whether the merger would either strengthen the conditions for such coordination
(if evidence of coordination is found) or create conditions which we would expect to
give rise to coordination (if no evidence of current coordination is found).
Unilateral effects of the merger
In this section we consider whether the merger is likely to result in unilateral effects
on competition, enabling the merged firm to exercise market power independently,
without the need to second-guess the strategies of other firms in the market.
Market shares and concentration are often considered an indication of the relative
market power of firms in a market. The extent of the increase in a firm’s market share
and concentration as a result of a merger can be interpreted as the extent to which
that firm’s relative market power increases and, hence, to what extent intra-market
rivalry is reduced. The proposed merger would bring together Wienerberger, which
has a market share (of non-fletton clay bricks in Great Britain) of [15–20] per cent
(see Table 2), with Baggeridge, which has a market share of [10–15] per cent. The
28CC2, paragraphs 3.32 to 3.36.
55
merged entity would become the second largest brick manufacturer in the market,
with a market share of [25–35] per cent. Concentration, as measured by the HHI,
increases from over 2,100 to about 2,500 (see paragraph 5.47).
7.4
7.5
7.6
7.7
As noted in paragraph 4.9 the market for all clay bricks includes over 1,000 products
(made in different ways and of varying, colour, texture and technical properties). We
considered the possibility that the degree of rivalry between different manufacturers
might not be adequately reflected by the four firms’ respective market shares, in that
their products might not be perfect substitutes for each other. In differentiated
markets, the degree of rivalry (or ‘closeness of competition’) between the two
merging firms is often examined to assess the potential reduction in competition
resulting from the merger.
We looked, therefore, at the extent to which the product ranges of Wienerberger and
Baggeridge overlapped. With a few exceptions, such as Baggeridge being the only
one of the two companies able to offer blue engineering bricks and Wienerberger
offering a much larger volume of soft mud bricks, we found that the parties offered
similar products to cater for most customer preferences, and were in head-to-head
competition for sales.
We then looked at the parties’ facing and engineering brick portfolios compared with
those of Hanson and Ibstock. With a few exceptions (see paragraph 7.5), all four
firms produce a comprehensive range of bricks and where a certain type of brick is
popular all companies will produce a brick of similar price and appearance, even
though it may be sold under a different product name.
The evidence suggested that at least Hanson and Ibstock produce and supply bricks
which are closely comparable in price and appearance with the vast majority of bricks
56
in respect of which the parties compete. This would be consistent with Baggeridge’s
comment that all of the four firms offer bricks in the ‘middle’ product range of popular
bricks. Customers are already multi-sourcing between the four firms, and face no
significant switching costs; also, some customers are sophisticated large-scale
buyers while others are in buying groups. Furthermore, Ibstock and Hanson have a
wide geographic network and appear able to provide a competitive offer throughout
Great Britain.
7.8
7.9
Accordingly, the existence of alternative suppliers with national distribution
capabilities, the relative ease with which customers may switch between suppliers,
and the existence both of substantial excess stocks (see paragraph 4.36) and spare
capacity (see Figure 9) make it extremely unlikely that any unilateral action by the
merged parties would be profitable. We therefore concluded that the merger would
not result in any adverse unilateral effects on competition.
Coordinated effects
In assessing the likelihood of coordinated effects as a result of the merger, we
addressed the following questions:
(a) whether coordinated effects existed before the merger;
(b) where such effects were found to have existed before the merger, whether the
merger was likely to make coordination more sustainable or more effective so as
to give rise to an SLC; or
(c) where such effects were found not to have existed before the merger, whether
the merger would increase the likelihood of coordinated effects so as to give rise
to an SLC.
We first looked at (a) whether there was evidence of coordination prior to the merger.
Then, as we had found no evidence of coordination before the merger, we looked at
point (c) in order to assess the ability and incentives for coordination post-merger.
57
We considered whether the three conditions necessary for coordinated effects
identified in the CC’s guidelines would be satisfied in the event of the completion of
the merger, taking account of the features of the market including the various matters
referred to in the CC’s guidelines.
Is there evidence of coordination in the market prior to the merger?
7.10
7.11
We considered whether there was evidence that coordination had occurred in the
market in the last few years. We looked at prices, costs, market shares, capacity and
profits. We focused on the four firms because of their respective market shares
(together they account for over 85 per cent of the market) and their ability to offer a
similarly broad range of brick products due to the number and size of their plants.
Baggeridge, currently the smallest of the four firms, has a market share of [10–15]
per cent, over three times as large a market share as the next largest producer. We
consider this a significant difference justifying the conclusion that the incentives and
abilities of the four firms should be analysed separately from those of other
producers.
We looked at whether there was any evidence of coordination on prices or capacity
over the last five years. In doing so we looked at:
• trends in prices (to see the extent to which prices had moved together);
• price announcements (to see if there had been any significant pattern of
behaviour as to who set prices when, whether price increases were the same,
and whether manufacturers followed each other in a predictable way);
• prices and costs (to see whether there were fluctuations in delivered prices and
costs and whether prices had increased more quickly than costs over the time
period we were considering);
• price variations (to see the extent to which the prices for a particular brick
product varied between customers);
58
• market shares (to assess the stability of market shares and see if this provided
any indication as to the extent to which there had been strong competition
between the four firms);
• capacity (to see how excess capacity had changed over time and whether there
were any discernible trends among the four firms); and
• profitability (to see if there had been any obvious indications of the firms making
excessive profits from their brick businesses).
Trends in prices
7.12
Figures 5, 6 and 7 show, for each of the four firms, the average monthly ex-works
prices in real terms29 for extruded facing bricks, soft mud facing bricks and
engineering bricks respectively.
FIGURE 5
Extruded facing bricks real price change (ex-works)
[ ]
Source: CC analysis of data provided by the four firms.
FIGURE 6
Soft mud facing bricks real price change (ex-works)
[ ]
Source: CC analysis of data provided by the four firms.
29Prices are inflation-adjusted on the basis of RPI figures from the National Office of Statistics. We recognize that due to the high level of energy inputs, an index weighted to reflect the actual input price rises would show a rate of inflation higher than RPI. However, we do not think that this makes a difference for the purpose of considering whether or not comparative movements in prices would support the conclusion that there has been coordination.
59
FIGURE 7
Engineering bricks real price change (ex-works)
[ ]
Source: CC analysis of data provided by the four firms.
7.13
7.14
7.15
For both types of facing brick, prices did not move together closely. Prices of
engineering bricks appear to have converged to some degree in the past two years
(particularly in 2006). Taken overall, we thought that divergence in the movements of
ex-works prices of the four firms provided evidence that there had not been
coordination in the market.
Price announcements
We looked at a selection of letters from the four firms setting out their annual price
increases, in order to see whether there was a fixed or habitual order in which
manufacturers announced price changes. For example, if it were found that it was
always the same manufacturer that announced its price changes first, this could be
an indication of price leadership.30 In the letters we saw, over the last three years
either Hanson or Ibstock announced a price change first, before Wienerberger and
Baggeridge. The letters did not indicate that the companies were all seeking identical
or near-identical price rises, which could have suggested that there had been
coordination in the market.
Prices and costs
We looked at the relationship between average monthly delivered prices (for soft
mud, extruded and engineering bricks) and operating costs (for brick products as a
whole) for each of the four firms (see Appendix E). On the whole the trend in prices
30However, there could still be a form of price leadership if there were a consistent pattern that one company increasing its prices is always a signal for the others to do likewise, without that first firm always being the same firm.
60
and costs were similar. For all four there was more fluctuation in costs than in prices
over the period 2001 to 2006, but little to suggest that prices were systematically
rising more quickly than costs. We thought that this suggested that the four firms
were not increasing prices more quickly than they needed to in order to cover cost
increases, which provided some further evidence that the four firms had not been
coordinating (although we recognized that it would be possible for coordination to be
established to prevent price cuts in a declining market).
Variations in price
7.16
7.17
7.18
As noted in paragraph 4.62, we found that, in general, prices in the brick market are
negotiated for each individual customer. We noted that the multiplicity of prices
resulting from individual negotiations might complicate coordination, although
coordination might still occur if prices varied in a consistent way.
The parties told us that there was wide variation in the actual prices charged even for
equivalent volumes, due to individual customer discounts.31 They provided us with an
analysis of prices achieved for individual brick products, as scattergram plots. These
scattergram plots showed, for the best-selling brick produced at each Wienerberger
and Baggeridge plant, variations in price against (i) volume transactions for different
customer segments, (ii) season (to see if there had been any effect of the time of
year), and (iii) distance to deliver bricks. They told us that this evidence showed that
the variation in realised prices across customers did not follow a systematic,
predictable pattern which might provide the basis for a tacit understanding. They also
set out cumulative volume against average net price plots for these bricks.
In considering the evidence provided by the parties, we noted that the scattergram
plots did appear to show that prices for individual brick products could vary
31See the RBB Economics paper An Evaluation of the Potential Theories of Harm Arising from the Merger of Wienerberger and Baggeridge, submitted as Annex 5 to the parties’ Informal merger notification to the OFT, pages 10 to 13.
61
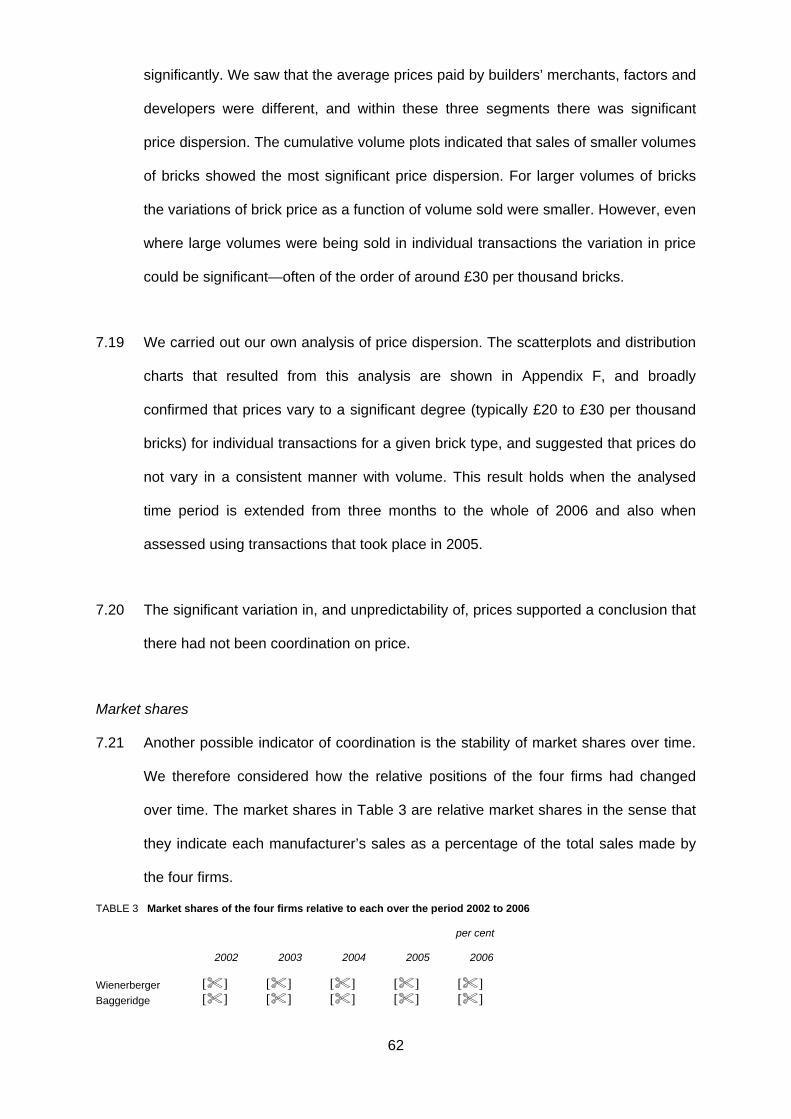
significantly. We saw that the average prices paid by builders’ merchants, factors and
developers were different, and within these three segments there was significant
price dispersion. The cumulative volume plots indicated that sales of smaller volumes
of bricks showed the most significant price dispersion. For larger volumes of bricks
the variations of brick price as a function of volume sold were smaller. However, even
where large volumes were being sold in individual transactions the variation in price
could be significant—often of the order of around £30 per thousand bricks.
7.19
7.20
7.21
We carried out our own analysis of price dispersion. The scatterplots and distribution
charts that resulted from this analysis are shown in Appendix F, and broadly
confirmed that prices vary to a significant degree (typically £20 to £30 per thousand
bricks) for individual transactions for a given brick type, and suggested that prices do
not vary in a consistent manner with volume. This result holds when the analysed
time period is extended from three months to the whole of 2006 and also when
assessed using transactions that took place in 2005.
The significant variation in, and unpredictability of, prices supported a conclusion that
there had not been coordination on price.
Market shares
Another possible indicator of coordination is the stability of market shares over time.
We therefore considered how the relative positions of the four firms had changed
over time. The market shares in Table 3 are relative market shares in the sense that
they indicate each manufacturer’s sales as a percentage of the total sales made by
the four firms.
TABLE 3 Market shares of the four firms relative to each over the period 2002 to 2006
per cent
2002 2003 2004 2005 2006
Wienerberger [ ] [ ] [ ] [ ] [ ] Baggeridge [ ] [ ] [ ] [ ] [ ]
62
Hanson [ ] [ ] [ ] [ ] [ ] Ibstock [ ] [ ] [ ] [ ] [ ] Total 100 100 100 100 100 Source: CC analysis of data provided by the four firms. Note: During the period under consideration there were some company acquisitions which affected market shares: Wienerberger acquired TBB in September 2004, and Hanson acquired Marshalls in January 2005.
7.22
7.23
Table 3 shows that although the relative positions of the four firms (in terms of the
largest manufacturer, the second-largest etc) have not changed in the past five
years, there has been a degree of variation in relative market shares beyond those
attributable to acquisitions. Such variation seemed to us in line with other evidence
as to how some of the four firms had gained or lost market shares. We were told by
three customers that around three years ago Hanson had imposed a large price rise
on its bricks on a ‘take it or leave it’ basis, and that those customers had in response
reduced their orders from Hanson, causing it to lose market share. Similarly,
Baggeridge told us that it had lost sales in 2005 as a result of setting prices too high.
Conversely, we heard that Wienerberger had targeted the engineering brick sector in
2006, in a successful attempt to increase its sales of engineering bricks
(Wienerberger told us that its market share of engineering bricks had almost doubled
between 2005 and 2006). We thought that this evidence argued against coordination
having taken place.
Capacity
We analysed optimum capacity and output figures over time for the four firms to
evaluate whether there was evidence that coordination of capacity had taken place
during the last five years. Our estimates of excess capacity between 2001 and 2006
are shown in Figures 8 and 9. Figure 8 shows excess capacity as a proportion of
capacity; Figure 9 shows excess capacity in volume terms. We recognized, in
preparing these data, that there may be different methods and assumptions about
optimum utilization of capacity used by the four firms and therefore the data which
follow should be regarded as approximations when comparisons are being made.
63
FIGURE 8
Excess capacity (%) for the four firms, 2001-2006 (moving average)
[ ]
Source: CC analysis of data provided by the four firms
7.24
7.25
7.26
7.27
Figure 8 shows fluctuations in excess capacity. Up to 2003, [ ] had the most excess
capacity, after which [ ] had the most. [ ] excess capacity began to rise from late
2004. In terms of broad trends, excess capacity has risen for [ ] and [ ] but has
fallen for [ ] and [ ]. There appears to be considerable fluctuation in excess
capacity when measured as a proportion of capacity.
However, it is possible that looking at capacity in percentage terms could be
misleading because of the different sizes of the firms. Figure 9 therefore looks at
excess capacity in terms of volume of bricks.
FIGURE 9
Excess capacity for the four firms, 2001 to 2006 (moving average)
[ ]
Source: CC analysis of data provided by the four firms
Figure 9 shows that on the whole [ ] had the highest excess capacity. [ ] excess
capacity was close to that of [ ] for a six-month period in 2005/06 period but, apart
from this, there have been significant and varying differences between the amounts
of excess capacity held by the four firms throughout the period.
Whilst recognizing the possible limitations of the data upon which these figures are
based, we considered that the trends shown were consistent with there not having
been coordination on capacity during the last five years.
64
Profits
7.28
7.29
7.30
7.31
7.32
Our guidelines32 state that ‘indicators, or ways of distinguishing intense competition
and oligopoly pricing, include first, the level of profitability generated by the price
levels established. If profits are excessive then this may be an indicator of existing
oligopoly pricing’.
We therefore assessed the returns on capital employed (ROCE) generated by three
of the four firms,33 and compared these ROCE figures to a range of weighted
average cost of capital (WACC) figures in order to see if there were any indications of
excessive profits in the market.34
Our analysis, as set out in Appendix B, indicated that none of the three firms for
which we have evidence has made returns on their capital employed which are both
substantially and persistently in excess of their WACC.
Conclusion on coordinated effects over the last five years
The evidence on prices, costs, market shares, capacity and profits indicated that
there had not been coordination between the four firms during the last five years.
Does the merger facilitate coordination in the market?
Having found that the answer to the question set out in paragraph 7.9(a) was that the
evidence indicated that there had not been coordination during the last five years, we
did not need to consider whether the merger was likely to make coordination more
sustainable (paragraph 7.9(b)). Instead we addressed the question set out in
paragraph 7.9(c)—whether the merger would increase the likelihood of coordinated
effects so as to give rise to an SLC.
32CC2 paragraph 3.43 33One firm has only provided margin data, which are not sufficient to allow us to make a finding on its profitability. 34Whilst we used ROCE for the purposes of this analysis, both Baggeridge and Wienerberger told us that they do not use ROCE to assess their profitability.
65
7.33
7.34
Our guidelines set out three conditions which are necessary for coordination to occur
and to be sustainable over time.35 These are:
(a) awareness of competitor behaviour: the market must be sufficiently concentrated
for firms to be aware of the behaviour of their competitors, and for any significant
deviation from the prevailing behaviour by a firm to be observed by other firms in
the market;
(b) incentives to conform to the prevailing behaviour: it must be clear that it would
be costly for firms to deviate from the prevailing behaviour; so costly that it will
be in a firm’s interests to conform to the prevailing behaviour rather than seek to
deviate from it; and
(c) weak competitive constraints: such parallelism can only be sustained in markets
where there are relatively weak competitive constraints.
In line with our guidelines36 we therefore looked at characteristics of the market
which may facilitate, or otherwise impinge upon, coordinated effects, and what
changes, if any, may be caused by the merger. We then considered whether, in light
of this analysis, the three conditions for coordination would be met after the merger.
We considered that coordination in the brick industry in Great Britain would most
likely occur on the basis of prices or on the basis of capacity, as these parameters
appeared to be key to competition. We considered whether the merger might
facilitate coordination on either price or capacity. Coordination is in principle possible
on any (observable) aspect of the process of competition in a market.37 Coordination
within geographic areas of Great Britain appeared less likely given the geographic
spread of brick suppliers across Great Britain. The scope for coordination on
customer allocation also appeared to be limited, given that most customers multi-
source bricks from different suppliers.
35CC2 Merger References: Competition Commission Guidelines, June 2003, paragraphs 3.37 to 3.40. 36CC2 Merger References: Competition Commission Guidelines, June 2003, paragraph 3.41. 37For example, price, output, capacity, geographic areas, or customer allocation.
66
Characteristics of the merger which might facilitate coordinated effects
7.35
7.36
7.37
We considered characteristics of the market which might facilitate, or otherwise
impinge upon, coordinated effects. We looked at:
• degree of concentration;
• feasibility of establishing focal points for coordination;
• transparency of deviation from prevailing behaviour;
• market stability;
• symmetry;
• switching;
• innovation;
• feasibility of punishment;
• potential for new entry;
• imports;
• the competitive fringe; and
• buyer power.
• Degree of concentration
As noted in paragraph 5.47, the market is already highly concentrated, and if the
merger went ahead would become significantly more so. All other things equal, this
high degree of concentration would tend to facilitate the emergence of coordination.
• Feasibility of establishing focal points for coordination
• • Products
Generally, the more similar, or homogenous, firms’ products or services are, the
easier it is for manufacturers to reach the same conclusion on price or capacity, as
the product’s price reflects the same, or substantially the same, value for all suppliers
and customers and its production requires the same, or substantially the same,
67
amount of capacity. We therefore considered the degree of homogeneity in the bricks
market.
7.38
7.39
7.40
We noted that the portfolios of brick products of the four firms are similar in many
ways—they all produce similar ‘palettes’ of bricks which compete against each other
to meet the requirements of prospective customers. However, as we noted in
paragraph 7.5, there are a few exceptions, for example blue engineering bricks
(which are not produced by two of the four firms).
As noted in paragraph 4.9, there are over 1,000 brick products for sale in Great
Britain. We examined whether a small proportion of these products accounted for a
high proportion of sales, as the more concentrated the sales the easier it is to
establish a focal point. We looked at the proportion of bricks sold by each of the
parties for a small number of their brick products to see how concentrated their sales
were. We chose the ten most popular brick products. For both Wienerberger and
Baggeridge the percentage of sales accounted for by their respective top ten bricks
varied over time but was of the order of only one-third of all brick sales. This
demonstrated that the parties’ bricks sales are not highly concentrated on a small
number of brick products.
• • Transparency on prices and capacity
In order for coordination to occur successfully it is necessary for the coordinating
parties to reach consensus on one or more focal points. This is easier to achieve if
market outcomes (such as prices) are relatively non-complex and/or transparent. We
therefore looked at the complexity of market outcomes. We focused first on price. We
later considered transparency on capacity.
68
7.41
7.42
The parties told us that the price paid for bricks by a given customer would be
influenced by a range of factors, including: the manufacturer’s list price or internal
guide price for the bricks; the customer’s location; whether the bricks are delivered or
to be collected; the volume of bricks to be purchased; any discounts negotiated; and
any rebate arrangements in place. The parties told us that the outcome of the price-
setting process was the establishment of a multitude of individual transaction prices,
and that, in such circumstances, it was not feasible to reach a tacitly coordinated
understanding of the appropriate terms for individual transaction prices. The parties
also told us that they could not directly observe competitors’ prices, notwithstanding
that they had access to competitors’ published price lists (which, they said, did not
reflect prices actually paid for bricks in the overwhelming majority of cases) and that
customers frequently informed them of price changes by other manufacturers. (They
pointed out that customers’ incentives in discussions about competitors’ pricing
would be to try and negotiate the parties’ prices down, and hence the parties said
that they could not take what customers said at face value.) Ibstock38 and a builders’
merchant made the same point to us. The parties stated that direct monitoring of
rivals’ prices was not feasible.
As noted in paragraphs 4.62 and 7.16, we found that prices in the brick market are
negotiated for each customer. Prices are negotiated with customers differently:
irrespective of whether pricing matrices are agreed as part of the framework
agreement between manufacturer and customer (as usually occurs between
Baggeridge and its customers); or whether prices for individual orders are negotiated
on an ad-hoc basis (which [ ] told us was its normal way of conducting business for
all but its major developer customers). This individual pattern of negotiation,
accompanied by the variety of outcomes shown by the price dispersion data to which
38See Summary of a hearing with Ibstock, paragraph 19.
69
we have already referred, implies that prices are hard to observe, making
coordination difficult to establish and sustain.
7.43
7.44
7.45
7.46
Suppliers have access to each other’s published price lists. The parties told us that
these did not reflect actual prices in the overwhelming majority of cases. However,
the parties also said that customers frequently informed them of price changes by
other manufacturers. While suppliers may not necessarily take this information at
face value, we note that customers have an ongoing relationship with suppliers,
giving them some incentive to be reasonably honest in order to maintain credibility in
future negotiations. In addition, the supplier may be better able to rely on information
(of a competitor’s price reduction) when it is reported by a number of customers.
Given that the customer base is fairly concentrated, that most customers multi-
source and that there is frequent contact between manufacturers’ sales personnel
and customers’ buyers/depot managers, there is obvious potential for manufacturers
to learn quickly about prices of another manufacturer. Ibstock said that it would hear
of a competitor discounting prices within 24 hours.39 However, we did not think that
this would be sufficient for transparency of prices to enable coordination.
Even so, if prices vary in a consistent and predictable way then outcomes may not be
too complex to facilitate coordination. We therefore looked at the extent to which
prices varied between customers for individual brick products.
The evidence we saw (see paragraphs 4.62 to 4.70) suggested that there were a
variety of factors driving the price of bricks—many different customers negotiating
individually; a wide variation in the volumes sold in transactions (see, for example,
the scatterplots in Appendix F), different distances to deliver bricks, different delivery
39See Summary of a hearing with Ibstock, paragraph 24.
70
requirements (with merchants requiring smaller volumes of individual products and—
in some cases—mixed loads); and many different products. This led us to believe
that there was unlikely to be sufficient transparency of pricing for the three firms post-
merger to find it easy to find focal points for coordination on price.
7.47
7.48
7.49
We then turned to consider whether it would be possible to coordinate on capacity.
Although aggregate sales and stock data are available from the Department of Trade
and Industry (DTI) and Brick Development Association (BDA) (with a time lag, see
paragraph 7.50), capacity data are not. Though the large manufacturers appear to
have a rough idea of large changes in capacity (in the form of mothballing or
acquiring new plants), smaller incremental changes in capacity are more difficult to
observe, particularly at plant level, which would complicate coordination on capacity.
This suggested to us that it would be difficult to coordinate on capacity.
• Transparency of deviation from prevailing behaviour
Transparency facilitates the monitoring of other manufacturers’ behaviour, including
potential deviation from the prevailing behaviour. We considered whether suppliers
could observe one another’s prices or capacity, with sufficient clarity to detect if a
supplier were to cheat on a coordinated arrangement (by reducing prices or
increasing capacity and hence increasing its sales). However, the evidence on
transparency of prices and capacity (see paragraphs 7.42 and 7.47) suggested that
they could not.
In order to coordinate on price or capacity, the large brick manufacturers would not
necessarily need to be able to observe each other’s final prices or capacities; any
deviation from the prevailing behaviour by another brick manufacturer might also be
inferred from a loss in sales volume (which could be linked to price cuts or capacity
increases by another manufacturer). The parties argued that it was practically
71
impossible to track the sales volumes of rivals to particular customers or areas with
any accuracy due to the lack of volume commitment from customers; the pattern of
multi-sourcing by customers; the fact that some customers have their bricks delivered
while others collect them; and the fact that both use third party hauliers.40 [ ] told us
that its sales people would quickly find out if they lost volume to a competitor
although they did not accept that this information could be used to monitor the pricing
strategy of its competitors.
7.50
7.51
Industry data are available through the BDA and the DTI, which both produce
monthly aggregate statistics on production, sales and stocks. In addition, the BDA
publishes average prices on a monthly basis. The DTI statistics distinguish between
concrete and clay bricks, and between facing, engineering, and common bricks. The
parties and Hanson argued that, from these aggregate data, they were able to infer
their own market share (and how this changes over time), but not the market shares
of others. They also pointed out that the time lag in publishing industry data (several
months) would reduce their usefulness to competitors in assessing the pricing
strategies of their competitors.
The evidence suggested to us that, with the published data from the DTI and BDA,
and use of its sales force, a manufacturer should have a reasonable idea of what is
happening in the market. We noted that in order to punish deviation, it was not
necessary to know who had deviated from the prevailing behaviour, only that
deviation had taken place. However, the DTI and BDA data is published with a time
lag of three months, and we think that several months’ such data would be required
before a manufacturer could see whether a downturn in sales was because of a loss
in market share relative to its competitors and therefore whether a competitor
appeared to be deviating from prevailing behaviour. The question also arises as to
40See the RBB Economics paper An Evaluation of the Potential Theories of Harm Arising from the Merger of Wienerberger and Baggeridge, submitted as Annex 5 to the parties’ informal merger notification to the OFT, p13–14.
72
what amount of lost sales would trigger retaliatory actions from rivals—this may be
further complicated by the fact that in the brick industry, framework agreements are
not firm orders, but merely indications of potential purchases.
7.52
7.53
7.54
We therefore concluded that in terms of coordination on prices, on balance, while
companies would have some idea of the level of prices charged by competitors there
were too many factors affecting prices for them to know this with any certainty. Nor
because of these factors (and because of the degree of market instability referred to
in paragraphs (7.53 to 7.58) could they detect directly or indirectly with certainty (by
observing changes in volume or capacity) whether a competitor was deviating from
the prevailing behaviour. Accordingly, these factors pointed to a conclusion that
coordination on prices could not feasibly be achieved by observing competitors’
behaviour. Similarly, the difficulty in observing small or incremental changes in
capacity pointed to coordination on capacity not being feasible.
• Market stability
Stability, or at least predictability, of demand is desirable if coordination is to emerge
and endure. With imperfect information about the actions of rivals, one of the ways in
which a supplier may be able to assess how their rivals are behaving is by deducing
their conduct from changes in market share and win/loss information. This is harder if
demand conditions vary unpredictably as it will be harder to deduce whether a
change in sales is due to, for example, the actions of rivals or a change in overall
demand. The more likely it is that a firm mistakenly considers its rivals to have
deviated from a tacit arrangement, the more likely it is that retaliatory action will be
erroneously instigated.
The parties initially analysed the changes in Wienerberger’s sales (in volume terms)
between 2004 and 2006 to its [ ] largest customers, and Baggeridge’s top [ ]
73
customers for 2005 and 2006. They argued that the pattern of sales to individual
large customers varied significantly, which in their view meant it was not possible to
predict accurately a customer’s future demand based on its current order volume.
They argued that the lack of a clear pattern in purchasing behaviour further
demonstrated the uncertainty regarding the future development of demand in the
brick market, making it impossible to make inferences about competitors’ behaviour
from demand observations. The parties told us that the extent of variability and
unpredictability in the data made it impossible to be able to make inferences about
competitors’ behaviour from demand observations. [ ].
7.55
7.56
The parties’ analysis raised a number of queries: it only looked at data from 2004; it
did not calculate the average change for these customers; and it looked at only their
29 largest customers.
We looked at the degree to which demand has been stable by analysing DTI data on
brick sales. On the basis of these data41 the parties argued that demand for bricks at
an aggregate level routinely varied significantly. They noted that DTI data showed
that aggregate demand had generally declined over the last five years (other than
2003), but has done so at a variable rate.42 The parties said that within such a
volatile overall environment, it would be impossible to know whether a decline in
one’s own volumes was the result of overall market changes or deviation by rivals
from coordinated pricing.
41See the RBB Economics paper An Evaluation of the Potential Theories of Harm Arising from the Merger of Wienerberger and Baggeridge, submitted as Annex 5 to the parties’ informal merger notification to the OFT. 42They used all bricks, 2000 to 2005.
74
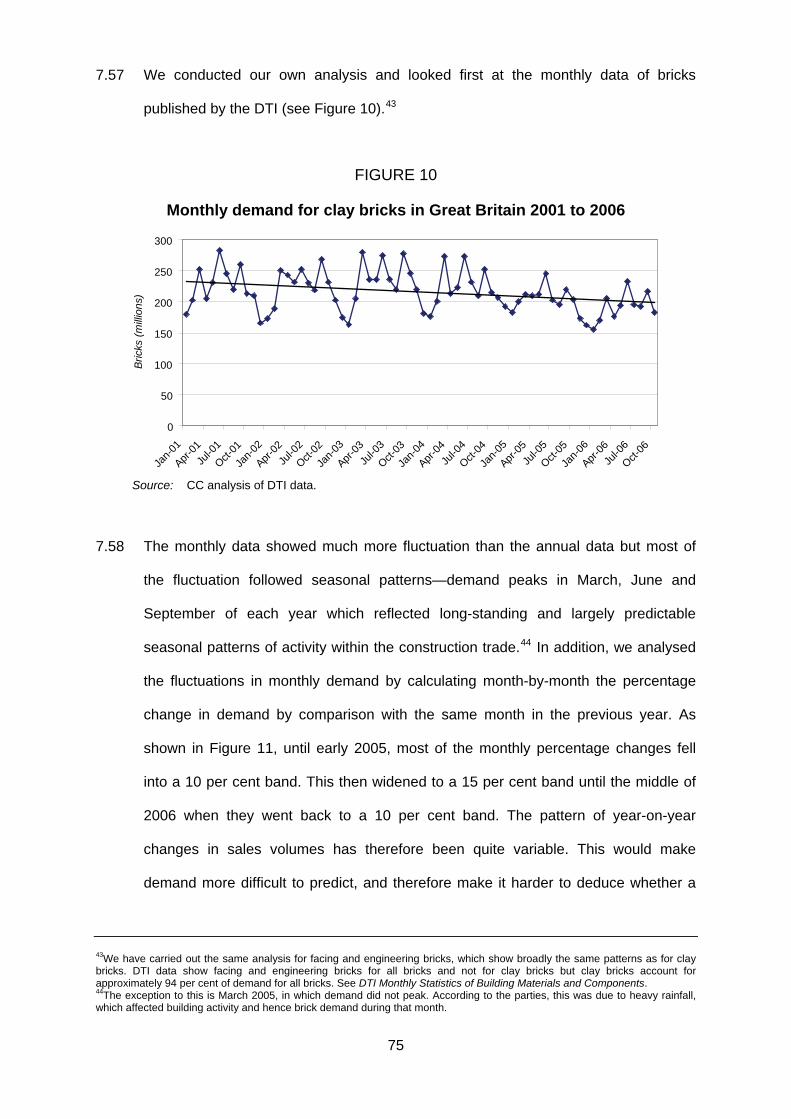
7.57 We conducted our own analysis and looked first at the monthly data of bricks
published by the DTI (see Figure 10).43
FIGURE 10
Monthly demand for clay bricks in Great Britain 2001 to 2006
0
50
100
150
200
250
300
Jan-0
1
Apr-01
Jul-0
1
Oct-01
Jan-0
2
Apr-02
Jul-0
2
Oct-02
Jan-0
3
Apr-03
Jul-0
3
Oct-03
Jan-0
4
Apr-04
Jul-0
4
Oct-04
Jan-0
5
Apr-05
Jul-0
5
Oct-05
Jan-0
6
Apr-06
Jul-0
6
Oct-06
Bric
ks (m
illion
s)
Source: CC analysis of DTI data.
7.58
The monthly data showed much more fluctuation than the annual data but most of
the fluctuation followed seasonal patterns—demand peaks in March, June and
September of each year which reflected long-standing and largely predictable
seasonal patterns of activity within the construction trade.44 In addition, we analysed
the fluctuations in monthly demand by calculating month-by-month the percentage
change in demand by comparison with the same month in the previous year. As
shown in Figure 11, until early 2005, most of the monthly percentage changes fell
into a 10 per cent band. This then widened to a 15 per cent band until the middle of
2006 when they went back to a 10 per cent band. The pattern of year-on-year
changes in sales volumes has therefore been quite variable. This would make
demand more difficult to predict, and therefore make it harder to deduce whether a
43We have carried out the same analysis for facing and engineering bricks, which show broadly the same patterns as for clay bricks. DTI data show facing and engineering bricks for all bricks and not for clay bricks but clay bricks account for approximately 94 per cent of demand for all bricks. See DTI Monthly Statistics of Building Materials and Components. 44The exception to this is March 2005, in which demand did not peak. According to the parties, this was due to heavy rainfall, which affected building activity and hence brick demand during that month.
75
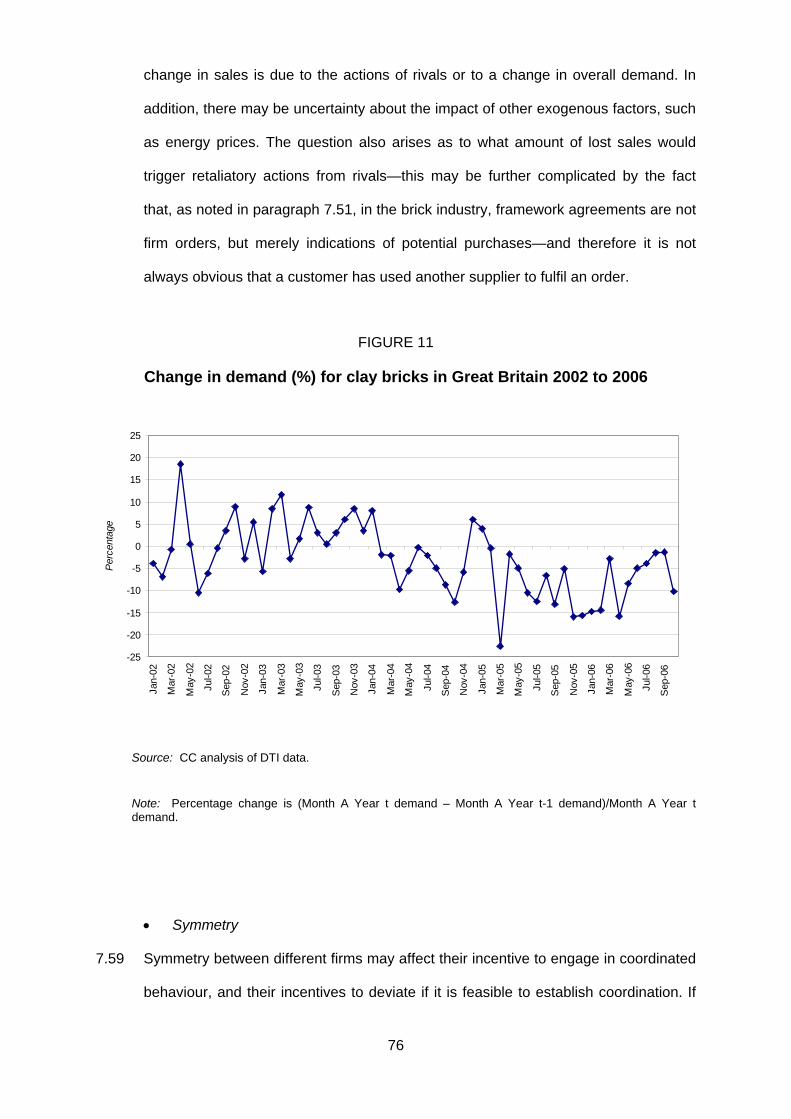
change in sales is due to the actions of rivals or to a change in overall demand. In
addition, there may be uncertainty about the impact of other exogenous factors, such
as energy prices. The question also arises as to what amount of lost sales would
trigger retaliatory actions from rivals—this may be further complicated by the fact
that, as noted in paragraph 7.51, in the brick industry, framework agreements are not
firm orders, but merely indications of potential purchases—and therefore it is not
always obvious that a customer has used another supplier to fulfil an order.
FIGURE 11
Change in demand (%) for clay bricks in Great Britain 2002 to 2006
-25
-20
-15
-10
-5
0
5
10
15
20
25
Jan-
02
Mar
-02
May
-02
Jul-0
2
Sep
-02
Nov
-02
Jan-
03
Mar
-03
May
-03
Jul-0
3
Sep
-03
Nov
-03
Jan-
04
Mar
-04
May
-04
Jul-0
4
Sep
-04
Nov
-04
Jan-
05
Mar
-05
May
-05
Jul-0
5
Sep
-05
Nov
-05
Jan-
06
Mar
-06
May
-06
Jul-0
6
Sep
-06
Per
cent
age
Source: CC analysis of DTI data.
Note: Percentage change is (Month A Year t demand – Month A Year t-1 demand)/Month A Year t demand.
• Symmetry
7.59 Symmetry between different firms may affect their incentive to engage in coordinated
behaviour, and their incentives to deviate if it is feasible to establish coordination. If
76
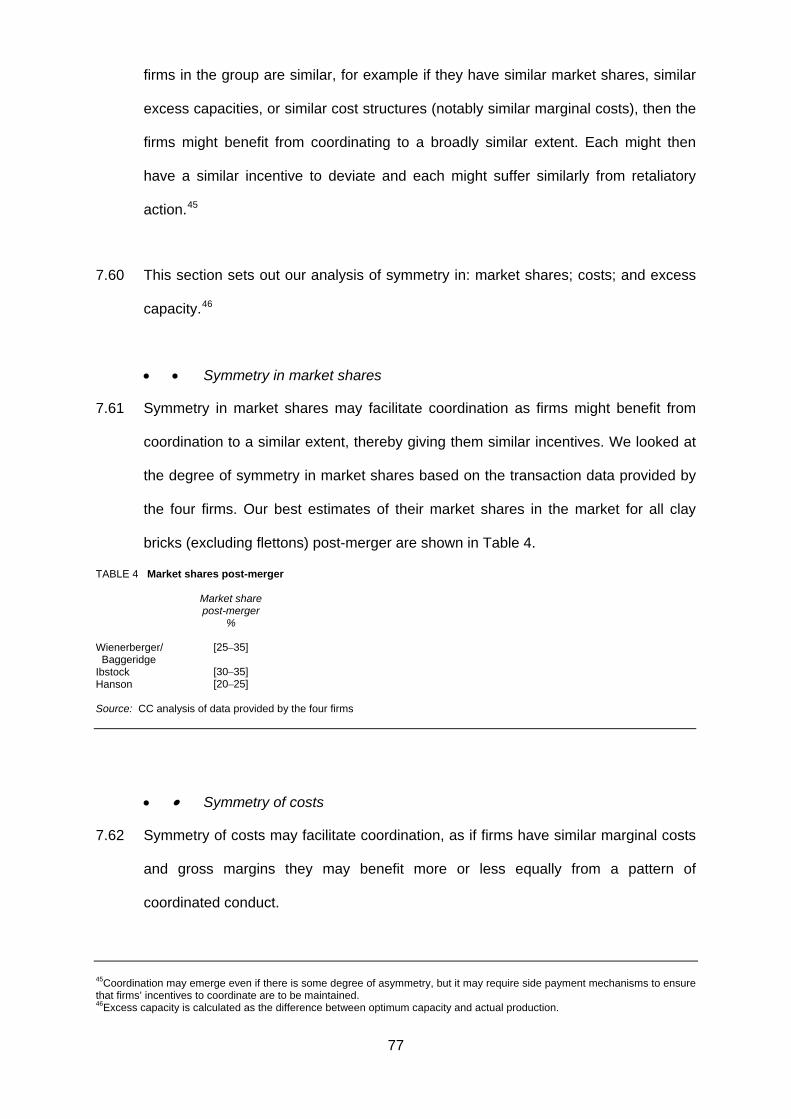
firms in the group are similar, for example if they have similar market shares, similar
excess capacities, or similar cost structures (notably similar marginal costs), then the
firms might benefit from coordinating to a broadly similar extent. Each might then
have a similar incentive to deviate and each might suffer similarly from retaliatory
action.45
7.60
7.61
This section sets out our analysis of symmetry in: market shares; costs; and excess
capacity.46
• • Symmetry in market shares
Symmetry in market shares may facilitate coordination as firms might benefit from
coordination to a similar extent, thereby giving them similar incentives. We looked at
the degree of symmetry in market shares based on the transaction data provided by
the four firms. Our best estimates of their market shares in the market for all clay
bricks (excluding flettons) post-merger are shown in Table 4.
TABLE 4 Market shares post-merger
Market share post-merger
%
Wienerberger/ Baggeridge
[25–35]
Ibstock [30–35] Hanson [20–25] Source: CC analysis of data provided by the four firms
• • Symmetry of costs
7.62
Symmetry of costs may facilitate coordination, as if firms have similar marginal costs
and gross margins they may benefit more or less equally from a pattern of
coordinated conduct.
45Coordination may emerge even if there is some degree of asymmetry, but it may require side payment mechanisms to ensure that firms’ incentives to coordinate are to be maintained. 46Excess capacity is calculated as the difference between optimum capacity and actual production.
77
7.63
7.64
7.65
7.66
7.67
The parties told us that there were a number of common elements to the costs of all
brick manufacturers (particularly labour and energy costs), but that that there
remained important differences in the marginal cost conditions faced by different
plants due to differences in the ages and capacities of the plant, the technology used
and the amount of labour required.
We considered the extent of symmetry in costs. We looked first at operating costs,
comparing the trend in operating costs (including haulage costs) per thousand bricks
produced for each of the four firms between 2001 and 2006 (see Appendix B,
Figure 1).
We saw a number of significant differences in the trend and level of operating costs
of the four firms. We noted that the merger would bring together a low-cost
manufacturer and a high-cost manufacturer, and that, as a result, the merged entity
would have average operating costs more in line with those of Hanson and Ibstock.
However, we noted that Wienerberger intended to drive costs down throughout the
merged entity by a combination of investment, reorganization of production to
increase plant specialization and cost reduction at Baggeridge plants, where it had
identified specific opportunities for reducing costs.
Further, we recognized that most innovations in the brick industry are improvements
in the efficiency of the brick making processes, such as installing robotic packing
systems to reduce labour costs, more energy efficient and productive kilns, and
mechanical handling of bricks in plant. To the extent that there are process
innovations, these would change margins.
We then considered whether there was symmetry in gross margins. We compared
gross margin percentages at a plant and company level for the period 2002 to 2006,
78
showing figures for the plants with the minimum and maximum variable costs, as well
as the range over all their plants and the overall company average (see Appendix B,
Table10). This shows much greater fluctuation and variation in gross margins at the
plant level than at the company level, but on both measures, there is little symmetry.
When we looked at the absolute margins per thousand bricks at a plant level we also
saw a large degree of variation.
7.68
7.69
7.70
The degree to which the merger would have an impact upon the incentives to deviate
would also be related to any changes in levels of gross margin achieved by
Wienerberger as a result of the merger. If its gross margins rise as a consequence of
the synergies and efficiencies it expects to gain post-merger (see paragraphs 3.6 and
3.7), it would have a stronger incentive to deviate and try to win more business. In
considering the degree of symmetry post-merger we also bore in mind the different
strategies of the firms—in particular that Wienerberger told us that its strategy was to
focus plants on a small number of products in order to increase throughput (as it has
already done in concentrating on engineering brick production at its Sandown plant)
and to take advantage of its experience as the world’s largest manufacturer of clay
bricks to make process innovations to improve the efficiency of the merged group’s
plants. These ambitions did not appear to us to be consistent with a pattern of
coordinated behaviour.
We considered how marginal costs (using variable costs as a proportion of total
costs) varied between the four firms and between each of their plants over the period
2002 to 2006 (see Appendix B, Table 9).
We looked at the degree of symmetry in costs at plant level and at company level.
We found little symmetry in the proportion of variable costs as a proportion of total
costs at a plant level and at the company level.
79
7.71
7.72
7.73
On balance we thought that there were significant divergences in gross margins and
operating costs between the four firms during the period we looked at, and that the
merger would be more likely to accentuate asymmetry than to introduce symmetry.
We found little symmetry in marginal costs.
• • Symmetry of excess capacity
We looked at the degree of symmetry of excess capacity, to evaluate the incentives
of the four firms to coordinate on capacity and to evaluate the possibility of retaliation
in the case of deviation from the prevailing behaviour, be it coordination on price or
on capacity (see paragraph 7.81). The parties told us that they both had excess
capacity. They provided us with data which they said showed that over the last five
years the parties had very different levels of excess capacity and the trends over time
had been different, with one party’s excess capacity increasing as the other
decreased. They estimated that both parties currently had greater excess capacity
than Hanson, which they estimated as having [ ] per cent spare capacity, and
Ibstock, which they estimated as having spare capacity of just [ ] per cent. They
said that this precluded effective punishment: the relatively low excess capacity of
[ ] would permit only relatively limited punishment; Wienerberger’s and
Baggeridge’s higher levels of excess capacity would allow for far more severe
punishment. They said that the difference in excess capacities of the large producers
was a source of asymmetry which would complicate the establishment of stable
coordination.
We carried out our own analysis of excess capacity—see Figures 8 and 9—which
was consistent with the parties’ views that there is little symmetry of capacity
between the four firms pre-merger. Nor did we expect that symmetry would be
increased materially if the merger went ahead.
80
• • Conclusion on symmetry
7.74
7.75
7.76
Although we had some doubts as to the comparability of the cost data used to
assess cost and gross margin symmetry, we found no evidence of symmetry of costs
between the four firms over the last five years, and we saw no reason to expect the
degree of symmetry to increase significantly after the merger. We also found little
symmetry of capacity among the four firms. Whilst we did think that the merger would
increase the degree of symmetry in market shares, particularly between the merged
entity and Ibstock, we thought that there would remain a significant degree of
asymmetry after the merger. We therefore concluded that overall the merger would
not lead to an increase in symmetry.
• Switching
If switching is relatively easy (ie, there are no significant switching costs or other
barriers to switching), this may give manufacturers an incentive to deviate from the
prevailing behaviour, because a price cut is likely to be met by increased demand for
its bricks at the expense of its rivals. However, if switching is relatively easy, this also
means that the other manufacturers could potentially easily win such business back
by retaliating against any deviating behaviour, providing a deterrent to deviation.
Whether the feasibility of switching will increase or decrease a manufacturer’s
incentive to deviate from the prevailing behaviour will depend on how it values short-
term profits gained from ‘cheating’ versus the long-term profits associated with
coordination.
Both manufacturers and customers have told us that, generally, switching between
manufacturers is relatively easy.47 This is particularly true when that switching entails
shifting part of, but not necessarily all of a customer’s purchases to another
manufacturer. We found no significant contractual barriers to switching between
47We were told, however, that switching cannot take place part way through a development, as a change in the brick products used would be noticeable and would detract from the overall desired effect.
81
manufacturers. The framework agreements in place between manufacturers and
customers do not contain purchase obligations, penalties, exclusivity clauses or other
barriers to switching, and most customers do in fact multi-source. Equally,
developers have told us that planning requirements do not normally stipulate the use
of a particular manufacturer’s bricks.
7.77
7.78
7.79
7.80
In the great majority of cases, the only limitations to customers’ ability to switch
between manufacturers stems from the differences in range offered by the different
manufacturers. For example, builders’ merchants need to be able to offer their
customers a wide range of bricks and might choose not to reduce their purchases
from one manufacturer if they could not replace these purchases with sufficiently
similar bricks from another manufacturer to meet customers’ requirements.
The evidence led us to conclude that switching is generally easy, and can be
achieved in a relatively short timeframe.
• Innovation
Innovation makes coordination less easy to sustain, as it reduces both the value of
future coordination and the amount of harm that rivals will be able to inflict through
retaliatory actions to deviation. On the other hand, innovation is likely to be less of an
(or no) impediment to coordination where the degree or intensity of innovation is
relatively low.
The brick market appears to be characterized by a low intensity of product
innovation. The brick product has remained technically the same for many years and
innovation has been limited. We do not expect this to change if the merger goes
ahead.
82
• Feasibility of punishment
7.81
7.82
7.83
7.84
The presence of spare capacity in a market can, in principle, either support or
undermine coordination. An individual firm with unused capacity has an incentive to
reduce prices (‘cheating’ on any coordinated price), and so increase output and
efficiency. On the other hand, if its rivals also have spare capacity, they can react to,
or ‘punish’ such cheating by also reducing prices, thereby destroying the competitive
advantage which the ‘cheating’ firm hoped to achieve. Knowing that others can
respond in this way may deter cheating and sustain a coordinated outcome.
In practice, if one supplier cheated on coordination, and the others lowered prices as
a punishment, it appears unlikely that any supplier, whether cheating or punishing,
would find itself with a higher sales volume for a prolonged period: other suppliers,
wishing to sell their own output, would have a strong incentive to match or undercut
its price. In addition, lower prices generally are unlikely to lead to increased
aggregate demand for bricks, which we think is likely to be relatively price inelastic. In
this sense, the most likely result would be similar sales levels as before, but with
lower prices (than the coordinated outcome). Consequently, the threat of punishment
would not act as a deterrent to deviation in the same way that it would in a more
transparent market.
• Potential for new entry
If barriers to entry are high, any coordinated or parallel behaviour is less likely to be
destabilized by new entrants, who might, for example, undercut incumbents’ prices. If
entry is readily feasible, on the other hand, coordination is more difficult to sustain.
Our analysis shows that barriers to new entry appear to be high and possibly
prohibitive as new entrants face difficulties in obtaining clay, obtaining planning
83
permission, and the risk of high sunk costs in the form of manufacturing facilities of
commercial size and exit costs (see Appendix G for further details).
• Imports
7.85
7.86
7.87
7.88
We considered whether imports would act as a competitive constraint on brick prices
in Great Britain. The evidence (set out in paragraphs 5.40 to 5.43) suggested that
imported bricks, especially those sold in Great Britain by companies other than
Wienerberger and Hanson, were a small part of the market, and that there was at
best a limited ability to switch to using imported bricks.
We did not, therefore, think that imported bricks were likely to act as a competitive
constraint to prevent brick prices increasing.
• Competitive fringe
There are 27 smaller brick manufacturers in Great Britain. To the extent that the
competitive fringe has excess capacity, it may increase supply in response to a
coordinated price increase by the three large manufacturers after the merger,
potentially frustrating such coordination.
The production of bricks is characterized by economies of scale (see paragraph
4.61). Most of the fringe players lack such scale and their competitive strengths seem
predominantly based on non-price factors. The scope for increased supply by the
competitive fringe seems limited. All fringe competitors we spoke to indicated that
they do not currently have excess capacity. Only York Handmade told us that it was
planning to expand its capacity, by 30 per cent over the next few months. In addition
to the apparent lack of current excess capacity, we think it unlikely that there would
be significant expansion by the competitive fringe within the next two to three years,
84
as the high capital investment required for expansion of current capacity and the
limited overall growth potential of the brick market may act as a barrier to expansion.
7.89
7.90
7.91
7.92
Based on the above, we do not consider that the competitive fringe would pose a
constraint on the three large manufacturers following the merger sufficient to frustrate
or prevent coordination.
• Buyer power
The customer base of brick manufacturers is fairly concentrated. The parties have
indicated that around one-third of all new homes are built by the five largest house
builders and around two-thirds of all builders’ and plumbers’ merchant sales are
made by the top five merchants, and the parties have argued that, with a small
number of firms accounting for sizeable share of sales, it is possible for individual
buyers to take strategic actions to optimize the extent of competition in the market.
We thought that at present larger buyers do have a degree of buyer power, which is
based on their purchase of large volumes (which, if lost to a competitor could be
significant for suppliers) and their ability to multi-source. If the merger went ahead
there would be a reduction in the ability to multi-source, but large customers should
still be able to choose between suppliers for most of their requirements. We saw
evidence that one, at least, of Wienerberger’s major customers was threatening to
reduce its purchases substantially if Wienerberger did not reduce its prices following
the recent reductions in energy prices.
We were unclear whether buyer power would still exist if there were coordination
between the three large manufacturers following the merger, as the competitive
fringe (including imports) would not, in our view, be able to supply enough bricks as
an alternative to the large manufacturers. However, customers could seek to break
85
the coordination by either offering significant additional volumes to a particular
manufacturer, or switching away from a manufacturer, thereby putting pressure on
the individual manufacturers to deviate from the prevailing behaviour. This would
require a conscious change in buying strategy on the part of customers.
Conditions for coordinated effects
7.93
7.94
7.95
We have found that there is no evidence of coordinated effects in the market at
present. We have then to consider whether the merger will change market conditions
sufficiently that we may expect an SLC based on coordination. Having set out in
paragraphs 7.35 to 7.92 the facts that we consider relevant in considering the effects
of the merger on the market, we make the following findings on the three conditions
that must under our guidelines be met if the merger is to be found to give rise to
coordinated effects. In paragraphs 7.94 to 7.111, references to ‘the three firms’ are
references to Hanson, Ibstock and the merged firm of Wienerberger and Baggeridge.
• Condition one
In considering condition one, we have concentrated on three issues. First, whether
the post-merger market would be sufficiently transparent that firms could identify one
or more focal points for price or capacity coordination. Second, whether the
symmetries of the three firms in the post-merger market would provide an incentive
to coordinate should a focal point for price or capacity coordination be achievable.
Third, we have considered whether deviation from parallel behaviour could be
identified.
First, we do not consider that it would be easy for the three firms to identify a focal
point to enable them to coordinate on price or capacity. The evidence that we have
received shows that at present:
86
(a) the ranges of bricks produced by the firms are not homogenous and that brick
sales are not highly concentrated on a small number of bricks within each range;
(b) the price of bricks is negotiated on a customer-by-customer basis and is subject
to considerable variation according to, among other things, the type of
purchaser, the volume of bricks purchased, delivery requirements and the
delivery distance;
(c) variation in brick prices is neither consistent nor predictable: there is significant
variation in prices between sales to different purchasers of the same customer
type and this variation is not necessarily attributable to differences in the
volumes of bricks sold; and
(d) changes in capacity, notably incremental changes, are difficult to observe,
particularly at the plant level.
7.96
7.97
We do not believe that the merger will make any material difference to any of these
factors which militate strongly against the identification of focal points for coordination
on either price or capacity.
Secondly on condition one, even if it were possible for the three firms to identify a
focal point for coordination, we do not think that they would have incentives to
coordinate on price or capacity. The evidence on symmetries in paragraphs 7.59 to
7.73 shows in particular that:
(a) while the merger would lead to some increased symmetry in market shares,
there would nonetheless remain a significant degree of asymmetry in market
shares;
(b) after the merger there would continue to be real and significant differences in the
operating costs of the three firms;
87
(c) after the merger there would be significant differences in the gross margin
percentages, and the absolute gross margins, of the three firms both at plant
level and at company level, though to a lesser degree; and
(d) after the merger there would be some excess capacity but little symmetry in
excess capacity.
7.98
7.99
7.100
7.101
Accordingly we find that should the merger proceed there would be insufficient
symmetry between the three firms to give rise to an incentive to coordinate on price
or capacity.
Third on condition one, should there be coordinated behaviour, market conditions are
such that deviation from that behaviour would be difficult to identify.
We note that to observe deviation from coordinated pricing firms must be able either
to observe a deviation from the coordinated price by another firm or to deduce that
there has been a deviation in prices by another firm from a decline in their own sales.
We have referred in paragraph 7.95 to a number of factors that create complex price
setting and sales mechanisms. We do not believe that, should the merger proceed,
the three firms would be able to draw reliable conclusions about deviation from
coordinated prices from their observations of prices in the market.
Nor do we believe that it would be a simple matter for the three firms to deduce
deviation from a coordinated price based on a decline in sales volume. Again, the
complexity of the mechanisms by which prices are set and sales are made would
significantly impair their ability to distinguish a loss of sales due to deviation from a
loss of sales arising for other reasons. In addition, the BDA and DTI data would only
be available some time after the deviation had taken place.
88
7.102
7.103
7.104
7.105
7.106
7.107
7.108
The complexity of the position is exacerbated by market instability. There are
considerable and unpredictable variations in demand over time.
For the same reasons we find that it would be difficult for the three firms to identify
deviation from coordinated behaviour on capacity.
Overall, we do not believe that after the merger the three firms would have the
incentive or the ability to coordinate on either price or capacity. Nor, even if this were
not the case, would they be able to observe deviation from coordinated behaviour.
We find therefore that condition one is not met.
• Condition two
Notwithstanding our finding on condition one, we have for completeness considered
condition two.
In analysing condition two we have considered first, the incentives that firms would
have to deviate, and second, the ability of other firms to retaliate in the event of
deviation.
For the same reasons that we consider that there are no incentives to coordinate, set
out in paragraphs 7.97 and 7.98, we consider that there would be strong incentives
for the three firms to deviate from coordination.
We have therefore to consider whether there is a mechanism by which deviation can
be punished. We have found that there is spare capacity within the three firms, and
that firms can change their prices quickly. There is therefore some scope for
punishment. However, because of the difficulties in detecting deviation identified in
paragraphs 7.101 to 7.103 we do not think that in practice it would be easy for that
89
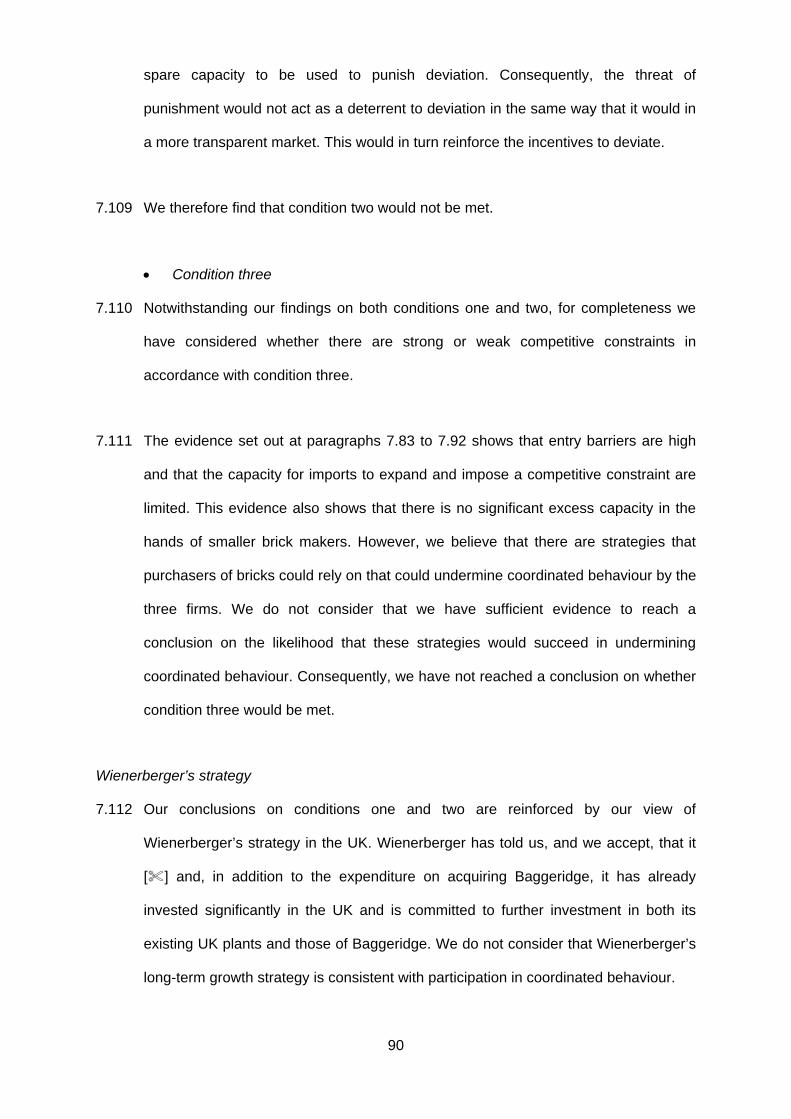
spare capacity to be used to punish deviation. Consequently, the threat of
punishment would not act as a deterrent to deviation in the same way that it would in
a more transparent market. This would in turn reinforce the incentives to deviate.
7.109
7.110
7.111
7.112
We therefore find that condition two would not be met.
• Condition three
Notwithstanding our findings on both conditions one and two, for completeness we
have considered whether there are strong or weak competitive constraints in
accordance with condition three.
The evidence set out at paragraphs 7.83 to 7.92 shows that entry barriers are high
and that the capacity for imports to expand and impose a competitive constraint are
limited. This evidence also shows that there is no significant excess capacity in the
hands of smaller brick makers. However, we believe that there are strategies that
purchasers of bricks could rely on that could undermine coordinated behaviour by the
three firms. We do not consider that we have sufficient evidence to reach a
conclusion on the likelihood that these strategies would succeed in undermining
coordinated behaviour. Consequently, we have not reached a conclusion on whether
condition three would be met.
Wienerberger’s strategy
Our conclusions on conditions one and two are reinforced by our view of
Wienerberger’s strategy in the UK. Wienerberger has told us, and we accept, that it
[ ] and, in addition to the expenditure on acquiring Baggeridge, it has already
invested significantly in the UK and is committed to further investment in both its
existing UK plants and those of Baggeridge. We do not consider that Wienerberger’s
long-term growth strategy is consistent with participation in coordinated behaviour.
90
Provisional conclusions on the SLC test
7.113
7.114
We provisionally conclude that the anticipated acquisition of Baggeridge by
Wienerberger Finance will if carried into effect result in the creation of a relevant
merger situation under section 23 of the Act and that we have jurisdiction to consider
the competitive consequences of the merger.
For the reasons set out in paragraphs and in paragraphs and we
provisionally conclude that we do not expect the merger to give rise to adverse
unilateral effects or to facilitate coordination. We therefore provisionally conclude that
we do not expect the merger to result in an SLC in any market for goods or services
in the UK.
7.8 7.104 7.109
91