Prototype Gross Domestic Product for Puerto Rico, 2012 2018
39
EMBARGOED UNTIL RELEASE AT 11:00 A.M. EDT, MONDAY, SEPTEMBER 28, 2020 BEA 20-46 Technical: Sabrina Montes (BEA) (301) 278-9268 [email protected] Media: Jeannine Aversa (BEA) (301) 278-9003 [email protected] Prototype Gross Domestic Product for Puerto Rico, 2012–2018 Today, the Bureau of Economic Analysis (BEA) released prototype annual estimates of gross domestic product (GDP) for Puerto Rico for 2012 to 2018. This release represents another major step by the Bureau to develop comprehensive economic accounts for Puerto Rico that are consistent with international guidelines and that are directly comparable to data for other states and countries. 1 In conjunction with this release, BEA is requesting feedback to refine the data sources and methods used to prepare these statistics. The prototype estimates showed that the Puerto Rico economy, as measured by inflation-adjusted (or “real”) GDP, expanded from 2012 to 2014, before turning down in 2015 and continuing to decrease through 2018. As shown in Chart 1, exports of goods and services was a key contributor to changes in real GDP over this period. 1 This effort builds on previous work by BEA, published in October 2019, to estimate personal consumption expenditures, private fixed investment, and net exports of goods for Puerto Rico. -20 -15 -10 -5 0 5 10 15 2013 2014 2015 2016 2017 2018 Personal consumption expenditures Private fixed investment Private inventory investment Government spending Exports Chart 1. Puerto Rico: Contributions to Percent Change in Real GDP U.S. Bureau of Economic Analysis Percentage points GDP Imports
Transcript of Prototype Gross Domestic Product for Puerto Rico, 2012 2018

EMBARGOED UNTIL RELEASE AT 11:00 A.M. EDT, MONDAY, SEPTEMBER 28, 2020 BEA 20-46
Technical: Sabrina Montes (BEA) (301) 278-9268 [email protected] Media: Jeannine Aversa (BEA) (301) 278-9003 [email protected]
Prototype Gross Domestic Product for Puerto Rico, 2012–2018
Today, the Bureau of Economic Analysis (BEA) released prototype annual estimates of gross domestic product (GDP) for Puerto Rico for 2012 to 2018. This release represents another major step by the Bureau to develop comprehensive economic accounts for Puerto Rico that are consistent with international guidelines and that are directly comparable to data for other states and countries.1 In conjunction with this release, BEA is requesting feedback to refine the data sources and methods used to prepare these statistics.
The prototype estimates showed that the Puerto Rico economy, as measured by inflation-adjusted (or “real”) GDP, expanded from 2012 to 2014, before turning down in 2015 and continuing to decrease through 2018. As shown in Chart 1, exports of goods and services was a key contributor to changes in real GDP over this period.
1 This effort builds on previous work by BEA, published in October 2019, to estimate personal consumption expenditures, private fixed investment, and net exports of goods for Puerto Rico.
-20
-15
-10
-5
0
5
10
15
2013 2014 2015 2016 2017 2018
Personal consumption expendituresPrivate fixed investmentPrivate inventory investmentGovernment spendingExports
Chart 1. Puerto Rico: Contributions to Percent Change in Real GDP
U.S. Bureau of Economic Analysis
Percentage points
GDP
Imports

Within exports and imports of goods and services, much of the volatility reflected trade in intellectual property (IP) intensive goods, including pharmaceuticals and organic chemicals and medical and scientific equipment and appliances. In Puerto Rico, subsidiaries of large nonresident multinational enterprises operate within the industries engaged in the manufacturing of the goods listed above. To shed light on the impact of their activities on Puerto Rico’s economy, this release includes an analysis of GDP that removes the exports, imports, and inventory investment associated with select IP-intensive industries. This analysis is described in the box on page 9. The statistics released today incorporate the most up-to-date methods and data available to BEA. More information on the methodologies and data sources that underlie the estimates is available in the Summary of Methodologies: Puerto Rico Gross Domestic Product file on BEA’s Web site. Gross domestic product GDP measures the value of goods and services produced within the geographic borders of a region in a given period, regardless of who owns the factors of production. Puerto Rico GDP therefore includes production owned by nonresidents, such as nonresident multinational enterprises, that occurs in Puerto Rico.2 Real GDP expanded from 2012 to 2014 before turning down in 2015 and continuing to decrease through 2018. The growth from 2012 to 2014 was more than accounted for by exports, as shown in Chart 1 above. Exports of goods grew significantly in these years, especially pharmaceuticals and organic chemicals and medical and scientific equipment and appliances. The largest decline in real GDP over the period was in 2017, reflecting the widespread impact of Hurricanes Irma and Maria on exports of goods, private inventory investment, and personal consumption expenditures (also referred to as consumer spending). In 2018, real GDP declined 0.9 percent. Although consumer spending, private inventory investment, and construction activity grew significantly in the year after the hurricanes, these increases were offset by an increase in imports, which is a subtraction in the calculation of GDP, and a decrease in exports. The remainder of this release discusses the components of GDP in further detail. Personal consumption expenditures Personal consumption expenditures (PCE), also referred to as consumer spending, measures the goods and services purchased by households who are resident in Puerto Rico.3 As shown in Chart 2, real consumer spending for Puerto Rico decreased in each year from 2012 to 2017. The average annual growth rate for this period was -1.9 percent, consistent with a steady decline in the resident population over this time period. The largest decreases in real consumer spending occurred in 2014 and 2017. In 2014, as wages dropped and consumer prices continued to increase, residents reduced their spending on both goods and
2 In 1991, BEA switched from gross national product (GNP) to GDP as the primary measure of U.S. production. For an extensive discussion of the differences between GDP and GNP and the motivations for this change, see BEA, “Gross Domestic Product as a Measure of U.S. Production,” Survey of Current Business 71 (August 1991): 8. https://apps.bea.gov/scb/pdf/1991/0891cont.pdf. 3 PCE also includes expenses of nonprofit institutions serving households.
- 2 -
services. The declines within goods were widespread; the largest decreases were for motor vehicles and “other” nondurable goods, which includes items such as medicine and clothing. In 2017, Hurricanes Irma and Maria caused catastrophic damage that restricted residents’ access to many goods and services.4 The decreases in health care, housing and utilities, and “other” services (including education services) were especially large. Despite a continued decrease in population, real consumer spending increased 3.4 percent in 2018, supported by disaster-related insurance payouts and government payments to households (see Table 2.3). The largest contributor to the growth in 2018 was durable goods, including purchases of motor vehicles.
Private fixed investment Private fixed investment (PFI) measures spending by private businesses, nonprofit institutions, and households on fixed assets in the Puerto Rico economy. Spending is grouped into three categories: structures, equipment, and intellectual property products. From 2012 to 2018, real PFI for Puerto Rico increased in all years (see Table 4.2.3). Real spending on structures by the private sector increased significantly in 2018, reflecting the rebuilding of properties after Hurricanes Irma and Maria. As shown in Chart 3, the 2018 increase more than offset the combined decreases in spending from 2012 to 2017. The largest declines for these years occurred in residential construction, reflecting the continued drop in demand for homes, coupled with an even further decline in 2017.
4 For general information about how disasters impact GDP, see “How are the measures of production and income in the national accounts affected by a natural or man-made disaster?”
3,100
3,250
3,400
3,550
3,700
3,850
4,000
4,150
4,300
-4
-3
-2
-1
0
1
2
3
4
2013 2014 2015 2016 2017 2018
Chart 2. Puerto Rico: Real PCE and Population
Real PCE Population
U.S. Bureau of Economic Analysis; U.S. Census Bureau, Population Division
Percent change Number of people (thousands)
- 3 -

Real spending on equipment grew in each year over this period, except in 2015. The highest growth occurred in 2018, with an increase larger than the combined increases in equipment investment from 2012 to 2017. The growth in 2018 largely reflected business purchases to replace damaged or destroyed equipment, including industrial machinery, following the 2017 hurricanes. Real spending on intellectual property products (IPP) increased in each year over this period. The majority of these expenditures were for software and for research and development (R&D) funded by computer services providers.5
Inventory investment Change in private inventories, also referred to as inventory investment, is a measure of the value of the change in the physical volume of inventories that businesses maintain to support their production and distribution activities. In general, inventory investment is one of the most volatile components of GDP, giving it an important role in shorter-run variations in GDP growth. As shown in Chart 1 on page 1, inventory investment significantly affected the real GDP growth rate, particularly in 2017 and 2018. The largest decrease in real inventory investment occurred in 2017 when inventories were negatively affected by Hurricanes Irma and Maria. The main contributor to the drawdown in inventories was the chemical manufacturing industry, which includes pharmaceutical manufacturers. The largest increase occurred in 2018 as the economy began to recover from the 2017 hurricanes.
5 A large portion of Puerto Rico business spending for R&D is on imported services. Because these purchased R&D services were not produced in Puerto Rico, they have minimal overall impact on GDP.
-30
-15
0
15
30
45
60
75
'12–'17 '18 '12–'17 '18 '12–'17 '18 '12–'17 '18
Chart 3. Puerto Rico Real PFI: Cumulative Growth Rates From 2012 to 2017 andAnnual Growth Rates for 2018
Percent
Total PFI Structures Equipment IPP
U.S. Bureau of Economic Analysis
- 4 -

Net exports of goods and services Net exports of goods and services is the difference between Puerto Rico exports of goods and services and Puerto Rico imports of goods and services. Exports measures the portion of Puerto Rico’s total production of goods and services that is provided to the rest of the world, including the rest of the United States.6 Imports measures the portion of total Puerto Rico expenditures that is accounted for by goods and services provided by the rest of the world. Together, the two measures reflect the extent to which Puerto Rico participates in the global marketplace. For Puerto Rico, net exports of goods and services is a critical component of GDP, due to its size relative to total GDP and its volatility. Over the period 2012 to 2018, the ratio of net exports to GDP was 24 percent. As shown in Chart 4, over the period 2012 to 2018, net exports was positive in all years. The majority of Puerto Rico’s trade surplus was in goods. The surplus on pharmaceuticals and organic chemicals ranged from $21.8 billion to $34.1 billion each year.
Real exports of goods and services was a key contributor to the changes in real GDP over this period, as shown in Chart 1 on page 1. The components of real exports are described in more detail below. The trends in real imports, which is a subtraction in the calculation of GDP, are also explained. Exports Real exports of goods grew from 2012 to 2015; the highest growth was in 2014 (see Table 3.3). The increase in 2014 reflected growth of over 40 percent in medical and scientific equipment and appliances. Real exports of goods turned down in 2016 and then decreased 13.5 percent in 2017,
6 For Puerto Rico GDP, the “rest of the world” is defined to include other countries and the rest of the United States, including the 50 states, the District of Columbia, and the other U.S. territories.
-75
-50
-25
0
25
50
75
100
2012 2013 2014 2015 2016 2017 2018
Exports of goods
Exports of services
Imports of goods
Imports of services
Net exports of goodsand services
Chart 4. Puerto Rico: Net Exports of Goods and Services
U.S. Bureau of Economic Analysis
Billions $
- 5 -

reflecting the effects of Hurricanes Irma and Maria on the manufacturing sector. Real exports of goods continued to decline in 2018. The largest contributor to the decline was a 74.3 percent decrease in exports of foods, feeds, and beverages (see Table 3.4). Real exports of services increased in each year over this period, at an average annual growth rate of 3.0 percent. The increase largely reflected growth in “all other” exports of services, which includes computer services such as software licenses and downloads. Spending by nonresidents on travel and tourism increased between 2012 and 2016, before declining in 2017 and 2018. Imports Puerto Rico depends heavily on imported goods and services for production by businesses and consumption by households. From 2012 to 2018, the ratio of imported goods and services to GDP for Puerto Rico was 46 percent. The pattern of change in real imports was driven by goods. The largest decrease was in 2017 and was more than accounted for by a decline in imports of pharmaceuticals and organic chemicals. The decrease reflected the effects of the hurricanes, which disrupted manufacturing activity on the island. The largest increase in real imports was in 2018. Real imports of goods increased 21.9 percent, reflecting growth in pharmaceuticals and organic chemicals and in “all other” imports, which includes equipment and construction materials associated with post-hurricane recovery activity. Real imports of services increased in most years from 2012 to 2018. The increases reflected growth in imports of R&D services and freight costs on imported goods. Government spending Government consumption expenditures and gross investment—or government spending—in Puerto Rico measures final expenditures accounted for by the central government (including the Commonwealth Government of Puerto Rico and its component units), the municipal governments, and the U.S. federal government. Government consumption expenditures consists of spending by government agencies, except government enterprises, to provide goods and services to the public. Gross investment consists of spending by all government agencies, including government enterprises, for structures, equipment, and intellectual property products used in producing those goods and services. Chart 5 shows the year-by-year pattern of growth in real government spending, for total government and for each type of government. Real government spending decreased from 2012 to 2016, reflecting declines in government employment and construction spending by the central government. Over this period, the central government accounted for approximately two-thirds of total government spending (see Table 1.1). In 2017 and 2018, real government spending increased, reflecting spending on hurricane response and recovery activities. Many of these activities were funded by grants and direct federal assistance through the Federal Emergency Management Agency (FEMA). After decreasing each year from 2013 to 2016, real government gross investment increased 23.2 percent in 2017 and 87.2 percent in 2018 (see Table 4.1.3). These increases reflected post-disaster
- 6 -

rebuilding, particularly by the central government.7 Structures investment by the central government increased 39.8 percent in 2017 and 117.7 percent in 2018, largely due to spending to restore the power grid.
Looking ahead The public is invited to submit comments on the prototype statistics by emailing [email protected]. Feedback will be used to help improve the data sources and methodologies used in preparing these statistics. The estimates released today represent an important step to achieving BEA’s long-term goal: to integrate the U.S. territories into the full set of U.S. National Income and Product Accounts. For Puerto Rico, a primary challenge in realizing this goal is the lack of coverage by most of the major surveys used by BEA to produce estimates of national GDP and related economic measures. The present methodology relies on currently available data. BEA appreciates the assistance and information provided by the Puerto Rico government. Moving forward, BEA is continuing to extend and improve the estimates of GDP for Puerto Rico. BEA will finalize methodology and conduct a comprehensive update of GDP for Puerto Rico next year. Estimates of GDP will be revised to reflect methodological improvements and the availability of more complete data over time, in some cases back to 2012. Information from the Census Bureau’s 2017 Economic
7 Expenditures to improve and replace fixed assets are classified by ownership of that asset rather than the source of funding. As a result, grants and direct federal assistance from FEMA to improve or replace fixed assets owned by the central government, such as the power grid, are classified as central government gross investment.
-15
-10
-5
0
5
10
15
20
25
30
'13 '14 '15 '16 '17 '18 '13 '14 '15 '16 '17 '18 '13 '14 '15 '16 '17 '18 '13 '14 '15 '16 '17 '18
Government spending Federal Central Municipal
U.S. Bureau of Economic Analysis
Chart 5. Puerto Rico Real Government Spending: Percent Change From Preceding Year
- 7 -

Census of Island Areas, the most comprehensive industry data available for Puerto Rico, will be incorporated at that time.8 BEA is also researching the development of other related measures of economic activity for Puerto Rico, including gross national product (GNP).9 Because of the large presence of multinational enterprises in Puerto Rico, a measure of GNP would be another valuable tool for policy makers to gauge the economic well-being of the Commonwealth’s residents.
8 The data release of the 2017 Economic Census of Island Areas for Puerto Rico is scheduled for December 2020. 9 Development of Puerto Rico GNP measures requires the estimation of factor income payments and receipts developed using methods and source data consistent with current BEA standards. For U.S. GNP, this estimation largely relies on data collected from BEA’s direct investment surveys. These surveys include Puerto Rico as part of the United States and therefore do not collect data on income flows between Puerto Rico and the rest of the world separately.
- 8 -
Research Focus: Exported IP-intensive Products Are Key Drivers of Puerto Rico GDP
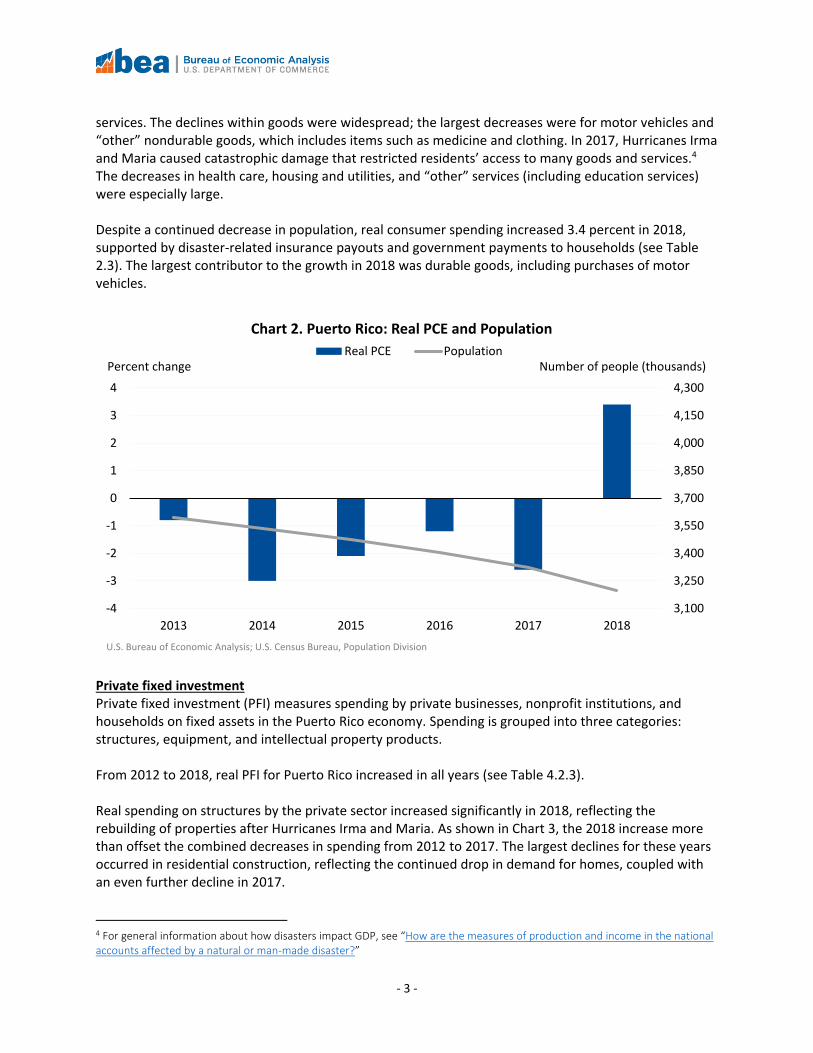
Puerto Rico’s economic activity, as measured by GDP, includes a significant amount of exported products generated by intellectual property intensive industries, particularly by pharmaceutical manufacturers, medical and scientific equipment manufacturers, and computer services providers. To assist data users in assessing the overall impact of these industries—which include several firms with global operations—on the Puerto Rico economy, BEA has conducted an analysis of GDP and its components that removes net exports of goods and services (i.e. exports less imports) and inventory investment that are closely associated with these industries.10 Note that the resulting series are approximations of economic activity excluding the impact of these industries. For example, a weakness of these measures is that they do not take into account all intermediate inputs that are imported by these industries for use in production, such as petroleum and other energy products. As shown in the charts below, BEA’s analysis reveals different trends for the sectors of Puerto Rico’s economy outside of the industries listed above. As shown in Chart A, net exports of goods and services less pharmaceuticals, medical and scientific equipment, and computer services was negative for the entire period, compared with the positive trade balance shown in Chart 4 of this release.
10 For this analysis, BEA excluded from GDP the exports and imports of pharmaceuticals and organic chemicals, exports and imports of medical and scientific equipment and appliances, exports of computer services including software, inventory investment by chemical manufacturers, and inventory investment by miscellaneous goods manufacturers including medical equipment and supplies manufacturers.
-30
-20
-10
0
10
20
30
40
2012 2013 2014 2015 2016 2017 2018
Net exports Net exports exluding pharmaceuticals, medicaland scientific equipment, and computer services
U.S. Bureau of Economic Analysis
Chart A. Puerto Rico Net Exports: Billions of Dollars
- 9 -

Chart B shows GDP less pharmaceuticals, medical and scientific equipment, and computer services, compared with GDP shown in Table 1.1. Chart C shows the growth in real GDP less pharmaceuticals, medical and scientific equipment, and computer services. Although this series is not intended to be a substitute for an estimate of gross national product (GNP), by removing much of the production in Puerto Rico that is associated with nonresident firms, it may exhibit levels and trends that are similar to GNP. In contrast to real GDP shown in Chart 1 of this release, the series below was negative in 2013 and 2014, positive in 2016, and positive in 2018. The growth in 2016 reflected growth in renewable energy construction and spending by consumers and businesses on durable goods, including motor vehicles. The growth in 2018 reflected recovery and rebuilding activities following the 2017 hurricanes.
50
65
80
95
110
125
2012 2013 2014 2015 2016 2017 2018
GDP GDP less pharmaceuticals, medical andscientific equipment, and computer services
U.S. Bureau of Economic Analysis
Chart B. Puerto Rico GDP: Billions of Dollars
-5
-4
-3
-2
-1
0
1
2
2013 2014 2015 2016 2017 2018
U.S. Bureau of Economic Analysis
Chart C. Puerto Rico Real GDP Less Pharmaceuticals, Medical and Scientific Equipment, and Computer Services: Percent Change From Preceding Year
- 10 -

Acknowledgments
Because Puerto Rico is not included in most of the major surveys used by BEA to estimate U.S. national GDP, the support and assistance provided by the government of Puerto Rico has been critical to the successful production of these estimates. BEA appreciates the information provided by numerous organizations and individuals in Puerto Rico, including (in alphabetical order):
• The Economic Development Bank for Puerto Rico, Office of Economic Studies
• The Office of the Commissioner of Insurance of Puerto Rico
• The Puerto Rico Department of Economic Development and Commerce
• The Puerto Rico Department of Labor and Human Resources
• The Puerto Rico Department of the Treasury
• The Puerto Rico Electric Power Authority
• The Puerto Rico Industrial Development Company
• The Puerto Rico Institute of Statistics
• The Puerto Rico Planning Board
- 11 -

Additional Information Resources
• Stay informed about BEA developments by reading the BEA blog, signing up for BEA’s email subscription service, or following BEA on Twitter @BEA_News.
• These estimates can be accessed at BEA’s Economic Statistics for Puerto Rico.
• Access BEA data by registering for BEA’s Data Application Programming Interface (API).
• For more on BEA’s statistics, see our monthly online journal, the Survey of Current Business.
• BEA's news release schedule
Definitions Gross domestic product (GDP) is the value of the goods and services produced by the Puerto Rico economy less the value of the goods and services used up in production. GDP is also equal to the sum of personal consumption expenditures, private fixed investment, change in private inventories, net exports of goods and services, and government consumption expenditures and gross investment. Personal consumption expenditures (PCE), also referred to as “consumer spending,” measures the goods and services purchased by “persons”—that is, by households and by nonprofit institutions serving households (NPISHs)—who are resident in Puerto Rico. Private fixed investment (PFI) measures spending by private businesses, nonprofit institutions, and households on fixed assets in the Puerto Rico economy. Fixed assets consist of structures, equipment, and intellectual property products that are used in the production of goods and services. Change in private inventories (CIPI), or “inventory investment,” is a measure of the value of the change in the physical volume of the inventories—additions less withdrawals—that businesses maintain to support their production and distribution activities.
Net exports of goods and services is the difference between exports of goods and services and imports of goods and services. Exports measures the portion of total Puerto Rico production of goods and services that is provided to the rest of the world. Imports measures the portion of total Puerto Rico expenditures that is accounted for by goods and services provided by the rest of the world. Government consumption expenditures and gross investment, or “government spending,” measures the portion of GDP that is accounted for by the government sector. Government consumption expenditures consists of spending by government to produce and provide services to the public. Gross investment consists of spending by government for fixed assets that directly benefit the public or that assist government agencies in their production activities. Current-dollar estimates are valued in the prices of the period when the transactions occurred—that is, at “market value.” Also referred to as “nominal estimates” or as “current-price estimates.” Real values are inflation-adjusted estimates—that is, estimates that exclude the effects of price changes.
Statistical Conventions Quantities and prices. Quantities, or “real” volume measures, and prices are expressed as index numbers with a specified reference year equal to 100 (currently 2012). Quantity and price indexes are calculated using a Fisher chain-weighted formula that incorporates weights from two adjacent years. “Real” dollar series are calculated by multiplying the quantity index by the current-dollar value in the reference year (2012) and then dividing by 100. Chained-dollar values are not additive because the relative weights for a given period differ from those of the reference year.
- 12 -

EN EMBARGO HASTA SU PUBLICACIÓN A LAS 11:00 A.M. EDT, LUNES, 28 DE SEPTIEMBRE DE 2020
BEA 20-46
Técnico: Sabrina Montes (BEA) (301) 278-9268 [email protected] Mediático: Jeannine Aversa (BEA) (301) 278-9003 [email protected]
Prototipo del producto interior bruto para Puerto Rico, 2012–2018
El Negociado de Análisis Económico (BEA por sus siglas en inglés) publicó hoy el prototipo de sus estimados anuales del Producto Interior Bruto (PIB) para Puerto Rico correspondientes a los años de 2012 a 2018. Esta publicación representa otro paso importante del Negociado en el desarrollo de cuentas económicas completas para Puerto Rico que sean consecuentes con las pautas internacionales y que sean directamente comparables con los datos de otros estados y países1. Junto con este comunicado, el BEA solicita comentarios para refinar las fuentes de datos y los métodos utilizados para preparar estas estadísticas.
Estos estimados prototipos muestran que la economía de Puerto Rico, medida por el PIB ajustado por inflación (o "en términos reales"), se expandió de 2012 a 2014, antes de contraerse en 2015 y continuar disminuyendo hasta 2018. Como muestra el gráfico 1, las exportaciones de bienes y servicios fueron un factor clave para los cambios en el PIB real durante este periodo.
1 Este esfuerzo se fundamenta en trabajos previos del BEA, publicados en octubre de 2019, para estimar los gastos de consumo personal, la inversión privada fija y las exportaciones netas de bienes para Puerto Rico.
-20
-15
-10
-5
0
5
10
15
2013 2014 2015 2016 2017 2018
Gastos de consumo personalInversión privada en capital fijoInversión privada en inventariosGastos de gobiernoExportaciones
U.S. Bureau of Economic Analysis
Puntos porcentuales
PIB
Importaciones
Gráfico 1. Puerto Rico: Contribuciones al cambio porcentual del PIB real
- 13 -

Dentro de las exportaciones e importaciones de bienes y servicios, gran parte de la volatilidad se reflejó en el comercio de bienes intensivos en propiedad intelectual (PI), incluidos en estos los productos farmacéuticos y químico-orgánicos, y los dispositivos médicos y científicos. En Puerto Rico, las subsidiarias de grandes empresas multinacionales no residentes operan en las industrias dedicadas a la fabricación de los tipos de productos anteriormente mencionados. Para ilustrar el impacto de sus actividades en la economía de Puerto Rico, este comunicado incluye un análisis del PIB que separa las exportaciones, las importaciones y la inversión privada en inventarios asociados con industrias seleccionadas que son intensivas en PI. Este análisis se describe en el recuadro de la página 21. Las estadísticas que se publican hoy incorporan la metodología y los datos más actualizados disponibles para el BEA. Información adicional sobre las metodologías y las fuentes de datos que apoyan a estos estimados está disponible en el archivo titulado Summary of Methodologies: Puerto Rico Gross Domestic Product de la página de internet del BEA. Producto interior bruto El PIB mide el valor de los bienes y servicios producidos dentro de las fronteras geográficas de una región para un período determinado, independientemente de quién sea el propietario de los factores de producción. Por lo tanto, el PIB de Puerto Rico incluye la producción perteneciente a propietarios no residentes, como las empresas multinacionales no residentes, que ocurre en Puerto Rico2. El PIB real aumentó de 2012 a 2014, antes de reducirse en 2015 y continuar disminuyendo hasta 2018. El principal contribuyente al crecimiento de 2012 a 2014 fue el renglón de las exportaciones, como se mostró en el gráfico 1. Las exportaciones de bienes crecieron significativamente en esos años, particularmente en productos farmacéuticos y químico-orgánicos, y en equipos y dispositivos médicos y científicos. La mayor disminución del PIB real se registró en 2017, lo que refleja el impacto generalizado de los huracanes Irma y María en las exportaciones de bienes, la inversión privada en inventarios y el gasto de los consumidores (también llamado gastos de consumo). En 2018, el PIB real disminuyó 0.9 por ciento. Si bien el gasto de los consumidores, la inversión privada en inventarios privados y la actividad de la construcción crecieron significativamente en el año posterior a los huracanes, estos aumentos fueron contrarrestados por un aumento en las importaciones, que es un rubro de resta en el cálculo del PIB, y una disminución en las exportaciones. El resto del comunicado presenta los componentes del PIB con mayor detalle. Gastos de consumo personal Los gastos de consumo personal (GCP), también denominados gastos de consumo, miden los bienes y servicios comprados por los hogares residentes en Puerto Rico3. Como muestra el gráfico 2, los gastos reales del consumo personal de Puerto Rico disminuyeron cada año de 2012 a 2017. La tasa de crecimiento anual promedio para este período fue de -1.9 por ciento, consecuente con una disminución constante en la población residente durante este período.
2 En 1991, el BEA pasó del producto nacional bruto (PNB) al PIB como medida principal de la producción estadounidense. Para una discusión amplia de las diferencias entre el PIB y el PNB y las razones para este cambio, véase la siguiente referencia del BEA, “Gross Domestic Product as a Measure of U.S. Production,” Survey of Current Business 71 (August 1991): 8. https://apps.bea.gov/scb/pdf/1991/0891cont.pdf. 3 Los GCP también incluyen los gastos de las instituciones sin fines de lucro que brindan servicios a los hogares.
- 14 -

Las mayores disminuciones en el gasto real de los consumidores se produjeron en 2014 y 2017. En 2014, a medida que los salarios disminuían y los precios al consumidor continuaban aumentando, los residentes redujeron sus gastos tanto en bienes como en servicios. Las caídas en el renglón de los bienes fueron generalizadas. Las mayores disminuciones correspondieron a los vehículos de motor y a “otros” bienes no duraderos, que incluyen artículos tales como medicamentos y ropa. En 2017, los huracanes Irma y María causaron daños catastróficos que restringieron el acceso de los residentes a muchos bienes y servicios4. Las disminuciones en la atención médica, la vivienda y los servicios públicos, y "otros" servicios (incluidos los servicios educativos) fueron particularmente significativos. A pesar de una disminución continua en la población, el gasto real del consumidor aumentó un 3.4 por ciento en 2018, apoyado por los pagos de seguros relacionados con los desastres y los pagos del gobierno a los hogares (véase el cuadro 2.3). El mayor contribuyente al crecimiento en los gastos de consumo en 2018 fueron los bienes duraderos, incluidas las compras de vehículos de motor.
Inversión privada en capital fijo La inversión privada en capital fijo (IPCF) mide el gasto de empresas privadas, instituciones sin fines de lucro y hogares en activos fijos en la economía de Puerto Rico. El gasto se agrupa en tres categorías: estructuras, equipos y productos de propiedad intelectual. Desde 2012 hasta 2018, la IPCF real para Puerto Rico incrementó en todos los años (véase el cuadro 4.2.3). El gasto real en estructuras por parte del sector privado aumentó significativamente en 2018, lo que refleja la reconstrucción de propiedades después de los huracanes Irma y María. Como se muestra en el
4 Para información general sobre el modo en que los desastres impactan al PIB, véase “How are the measures of production and income in the national accounts affected by a natural or man-made disaster?”
3,100
3,250
3,400
3,550
3,700
3,850
4,000
4,150
4,300
-4
-3
-2
-1
0
1
2
3
4
2013 2014 2015 2016 2017 2018
Gráfico 2. Puerto Rico: GCP real y población
GCP Real Población
U.S. Bureau of Economic Analysis; U.S. Census Bureau, Population Division
Cambio porcentual Número de personas (miles)
- 15 -

gráfico 3, el aumento de 2018 compensó con creces las disminuciones combinadas en el gasto de 2012 a 2017. Las mayores disminuciones de estos años se produjeron en la construcción residencial, reflejando la caída continua de la demanda de viviendas, con una disminución aún mayor en 2017. El gasto real en equipo creció cada año durante este período, exceptuando el 2015. El mayor crecimiento se produjo en 2018, con un aumento mayor que los aumentos combinados en la inversión en equipos de 2012 a 2017. El crecimiento en 2018 reflejó en gran medida las compras comerciales para reemplazar equipos dañados o destruidos, incluida maquinaria industrial, después de los huracanes de 2017. La inversión real en productos de propiedad intelectual (PPI) también aumentó cada año durante este período. La mayoría de estos gastos fueron en programas informáticos, y para investigación y desarrollo (I + D) financiada por los proveedores de servicios informáticos5.
Inversión privada en inventarios El cambio en los inventarios privados, también conocido como inversión privada en inventarios, es una medida del valor del cambio en el volumen físico de los inventarios que mantienen las empresas para respaldar sus actividades de producción y distribución. En general, la inversión privada en inventarios es uno de los componentes más volátiles del PIB, lo que le confiere un papel importante en las variaciones a corto plazo del crecimiento del PIB. Como se muestra en el gráfico 1 de la página 13, la inversión privada en inventarios afectó significativamente la tasa de crecimiento del PIB real, particularmente en 2017 y 2018.
5 Gran parte del gasto empresarial de Puerto Rico en I + D se destina a servicios importados. Como estas compras de servicios de I + D no se produjeron en Puerto Rico, su impacto general en el PIB es relativamente pequeño.
-30
-15
0
15
30
45
60
75
'12–'17 '18 '12–'17 '18 '12–'17 '18 '12–'17 '18
Gráfico 3. Puerto Rico IPCF real: Tasas de crecimiento acumulado de 2012 a 2017 y tasas anuales de crecimiento para 2018
Por ciento
IPCF Total Estructuras Equipo PPI
U.S. Bureau of Economic Analysis
- 16 -
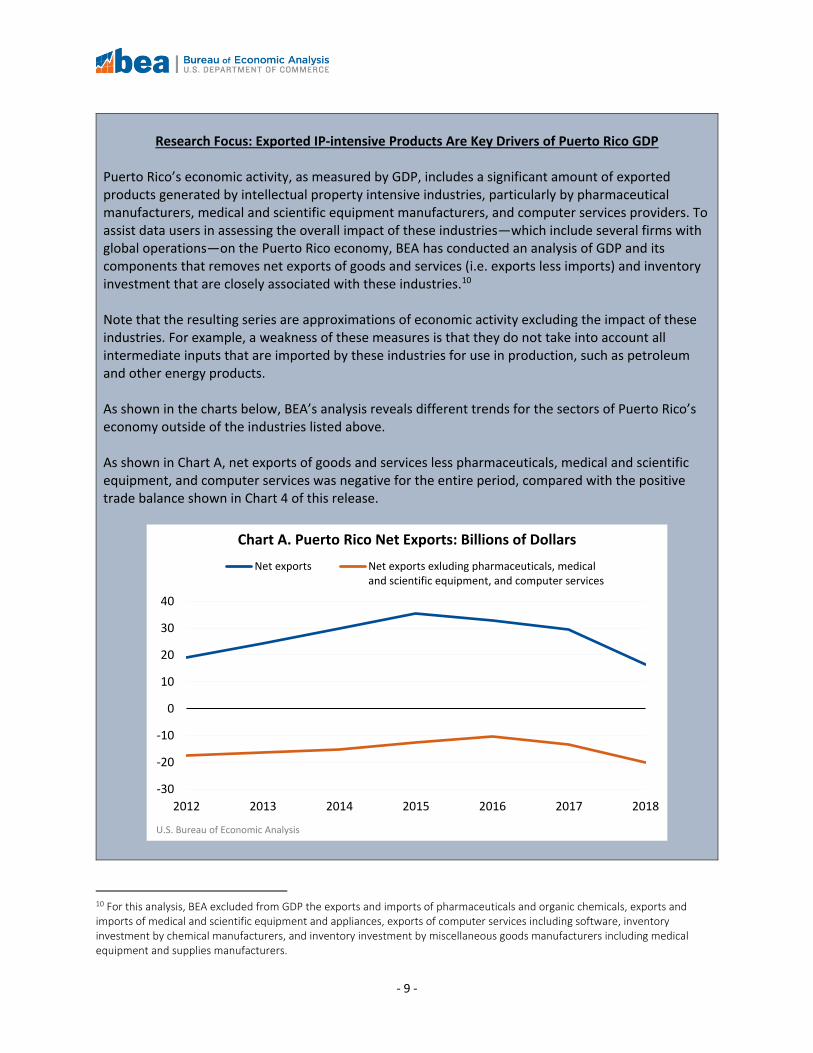
La mayor disminución en la inversión privada real en inventarios ocurrió en 2017 cuando los inventarios privados se afectaron negativamente por los huracanes Irma y María. El principal contribuyente a la reducción de existencias fue la industria de fabricación de productos químicos, que incluye a los fabricantes de productos farmacéuticos. El mayor aumento se produjo en 2018 cuando la economía comenzó a recuperarse de los huracanes de 2017. Exportaciones netas de bienes y servicios Las exportaciones netas de bienes y servicios son la diferencia entre las exportaciones de bienes y servicios de Puerto Rico y las importaciones de bienes y servicios de Puerto Rico. Las exportaciones miden la parte de la producción total de bienes y servicios que Puerto Rico proporciona al resto del mundo, incluyendo el resto de los Estados Unidos6. Las importaciones miden la porción del gasto total de Puerto Rico en bienes y servicios provistos por el resto del mundo. Ambas medidas reflejan hasta qué punto Puerto Rico participa en el mercado global. Para Puerto Rico, las exportaciones netas de bienes y servicios son un componente crítico del PIB, debido a su tamaño en relación con el PIB total y su volatilidad. Durante el período de 2012 a 2018, la proporción de las exportaciones netas al PIB fue 24 por ciento. Como se muestra en el gráfico 4, durante el período 2012 a 2018, las exportaciones netas fueron positivas en todos los años. La mayor parte del superávit comercial correspondió a los bienes. El excedente procedente de productos farmacéuticos y químico-orgánicos fluctuó entre $21,800 millones y $34,100 millones cada año.
6 Para el PIB de Puerto Rico, el "resto del mundo" se define para incluir otros países y el resto de los Estados Unidos, incluidos los 50 estados, el Distrito de Columbia y los demás territorios estadounidenses.
-75
-50
-25
0
25
50
75
100
2012 2013 2014 2015 2016 2017 2018
Exportaciones debienes
Exportaciones deservicios
Importaciones debienes
Importaciones deservicios
Exportaciones netasde bienes y servicios
Gráfico 4. Puerto Rico: Exportaciones netas de bienes y servicios
U.S. Bureau of Economic Analysis
Miles de millones de $
- 17 -

Las exportaciones reales de bienes y servicios fueron un factor clave para los cambios del PIB real durante este período, como se muestra en el gráfico 1 de la página 13. Los componentes de las exportaciones reales se describen con más detalle a continuación. También se explican las tendencias de las importaciones reales, que son una resta en el cálculo del PIB. Exportaciones Las exportaciones reales de bienes crecieron de 2012 a 2015. El mayor incremento se registró en 2014 (véase el cuadro 3.3). El incremento en 2014 reflejó un aumento de más del 40 por ciento en equipos y dispositivos médicos y científicos. Las exportaciones reales de bienes se estancaron en 2016 y luego disminuyeron por 13.5 por ciento en 2017, lo que refleja los efectos de los huracanes Irma y María sobre el sector manufacturero. Las exportaciones reales de bienes continuaron disminuyendo en 2018. El mayor contribuyente a la reducción fue una disminución del 74.3 por ciento en las exportaciones de alimentos, piensos y bebidas (véase el cuadro 3.4). Las exportaciones reales de servicios aumentaron cada año durante este período, a una tasa anual promedio de 3.0 por ciento. El aumento reflejó en gran medida el crecimiento de "todas las demás" exportaciones de servicios, que incluyen servicios informáticos como licencias y descargas de programas informáticos. El gasto de los no residentes en viajes y turismo aumentó entre 2012 y 2016, antes de disminuir en 2017 y 2018. Importaciones Puerto Rico depende en gran medida de los bienes y servicios importados para la producción de las empresas y el consumo de los hogares. De 2012 a 2018, la proporción de bienes y servicios importados en el PIB de Puerto Rico fue del 46 por ciento. El patrón de cambios en las importaciones reales estuvo impulsado por los bienes. La mayor reducción se registró en 2017 debido en gran medida a la caída en las importaciones de productos farmacéuticos y químico-orgánicos. La disminución reflejó los efectos de los huracanes de ese año que interrumpieron la actividad manufacturera en la isla. El mayor aumento en las importaciones reales se registró en 2018. Las importaciones reales de bienes incrementaron un 21.9 por ciento, lo que refleja el crecimiento en productos farmacéuticos y químico-orgánicos y en "todas las demás" importaciones, que incluyen equipos y materiales de construcción relacionados con la actividad de recuperación luego del paso de los huracanes de 2017. Las importaciones reales de servicios aumentaron para la mayoría de los años del período de 2012 a 2018. El incremento reflejó el crecimiento de las importaciones de servicios de I + D por parte de las empresas y los costes de flete de los bienes importados. Gastos de gobierno Los gastos de consumo y la inversión bruta del gobierno —o gasto del gobierno— en Puerto Rico miden los gastos finales contabilizados por el gobierno central (incluyendo el gobierno del Estado Libre Asociado de Puerto Rico, sus corporaciones públicas y sus instrumentalidades), los gobiernos municipales y el gobierno federal. Los gastos de consumo del gobierno consisten en el gasto de las agencias gubernamentales —exceptuando a las corporaciones públicas— para proporcionar bienes y servicios al público. La inversión bruta consiste en el gasto de todas las agencias gubernamentales —
- 18 -

incluyendo a las corporaciones públicas— en estructuras, equipos y productos de propiedad intelectual utilizados en la producción de bienes y servicios. El gráfico 5 muestra el patrón de crecimiento anual del gasto público real, para el total y para cada componente gubernamental. El gasto público real disminuyó de 2012 a 2016, lo que refleja un decrecimiento en el empleo público y en el gasto en construcción por parte del gobierno central. Durante este período, el gobierno central representó aproximadamente dos tercios del gasto público total (véase el cuadro 1.1). En 2017 y 2018, el gasto público real aumentó, reflejando el gasto de respuesta a los huracanes y las actividades de recuperación. Muchas de estas actividades se financiaron con las subvenciones y la asistencia federal directa a través de la Agencia Federal para el Manejo de Emergencias (FEMA, por sus siglas en inglés). Después de disminuir cada año entre 2013 y 2016, la inversión bruta del gobierno real aumentó un 23.2 por ciento en 2017 y un 87.2 por ciento en 2018 (véase el cuadro 4.1.3). Estos aumentos reflejaron la reconstrucción luego del paso de los huracanes de 2017, particularmente por parte del gobierno central7. La inversión en estructuras del gobierno central aumentó 39.8 por ciento en 2017 y 117.7 por ciento en 2018, en gran medida debido al gasto para la restauración de la red eléctrica.
7 Los gastos de mejora y reemplazo de los activos fijos se clasifican según la propiedad de ese activo en lugar de la fuente de financiación. Como resultado, las subvenciones y la asistencia federal directa de FEMA para mejorar o reemplazar los activos fijos propiedad del gobierno central, como la red eléctrica, se clasifican como inversión bruta del gobierno central.
-15
-10
-5
0
5
10
15
20
25
30
'13 '14 '15 '16 '17 '18 '13 '14 '15 '16 '17 '18 '13 '14 '15 '16 '17 '18 '13 '14 '15 '16 '17 '18
Gastos de gobierno Federal Central Municipal
U.S. Bureau of Economic Analysis
Gráfico 5. Gastos reales de gobierno en Puerto Rico:Cambio porcentual respecto al año anterior
- 19 -

Orientaciones futuras Se invita al público a someter comentarios mediante un correo electrónico a [email protected]. Sus sugerencias se utilizarán para ayudar a mejorar las fuentes de datos y la metodología utilizada en la preparación de estas estadísticas. Los estimados publicados hoy representan un paso importante para lograr el objetivo a largo plazo del BEA: integrar a los territorios de EE. UU. en el conjunto completo de Cuentas Nacionales de Ingreso y Producto de EE. UU. Un reto importante para lograr este objetivo, en el caso de Puerto Rico, es la falta de cobertura por parte de la mayoría de las principales encuestas utilizadas por el BEA para producir estimados del PIB nacional y otras medidas económicas relacionadas. La metodología vigente se basa en los datos actualmente disponibles. El BEA agradece el apoyo y la información brindada por el gobierno de Puerto Rico. La metodología actual depende en los datos disponibles al momento. Hasta que se incluya a Puerto Rico en estas encuestas, el BEA seguirá dependiendo en gran medida de la asistencia y de la información provista por el gobierno de Puerto Rico. Hacia el futuro, el BEA continuará ampliando y mejorando los estimados del PIB para Puerto Rico. El año próximo el BEA finalizará la metodología y realizará una actualización integral del PIB para Puerto Rico. Los estimados del PIB se revisarán para incluir las mejoras metodológicas y la disponibilidad de datos más completos a través del tiempo, en algunos casos hasta 2012. La información del Censo Económico de Áreas Insulares de 2017 del Negociado del Censo —los datos industriales más completos disponibles para Puerto Rico— se incorporarán para esa fecha8. El BEA también investiga el desarrollo de otras medidas relacionadas con la actividad económica de Puerto Rico, incluido el producto nacional bruto (PNB)9. Debido a la gran presencia de empresas multinacionales en Puerto Rico, una medida del PNB sería otra herramienta valiosa para que los formuladores de políticas públicas midan el bienestar económico de los residentes del Estado Libre Asociado.
8 La publicación de datos del Censo Económico de 2017 para Puerto Rico está programada para diciembre de 2020. 9 El desarrollo de las medidas del PNB de Puerto Rico requiere del estimado de los pagos y recibos de ingresos de los factores externos usando métodos y fuentes de datos consecuentes con los estándares actuales de Cuentas Nacionales de Ingreso y Producto del BEA. Los estimados del PNB para los Estados Unidos dependen en gran medida de los cuestionarios de inversión extranjera llevados a cabo por BEA. Estos cuestionarios incluyen a Puerto Rico como parte de los Estados Unidos y por ende no recopilan pagos y recibos entre Puerto Rico y el resto de mundo por separado.
- 20 -

Nota investigativa: Las industrias intensivas en propiedad intelectual y exportadoras son las impulsoras clave del PIB de Puerto Rico
La actividad económica de Puerto Rico, medida por el PIB, incluye una cantidad significativa de producción exportada generada por industrias intensivas en propiedad intelectual, particularmente por fabricantes farmacéuticos, productores de equipos médicos y científicos y proveedores de servicios informáticos. Para ayudar a los usuarios en la evaluación del impacto general de estas industrias ‒que incluyen varias empresas con operaciones globales‒ en la economía de Puerto Rico, el BEA analizó el PIB y sus componentes, excluyendo las exportaciones netas de bienes y servicios (i.e. exportaciones menos importaciones) y los cambios en inventarios privados estrechamente relacionados con ellas10.
Nótese que la serie resultante es una aproximación de la actividad económica excluyendo el impacto de estas industrias. Por ejemplo, una debilidad de esta medida es que no toma en cuenta todos los insumos intermedios que son importados por las industrias mencionadas para su uso en la producción, como el petróleo y otros productos energéticos.
Como muestra el siguiente gráfico, el análisis del BEA refleja tendencias diferentes para los sectores de la economía de Puerto Rico que excluyen las industrias enumeradas anteriormente.
Según el gráfico A, las exportaciones netas de bienes excluyendo los productos farmacéuticos, los equipos médicos y científicos y los servicios de computación fueron negativas durante todo el período, contrastando con la balanza comercial positiva que se muestra en el gráfico 4 de este comunicado.
10 Para este análisis el BEA excluyó del PIB las exportaciones e importaciones de productos farmacéuticos y químico-orgánicos, las exportaciones e importaciones de equipos y dispositivos médicos y científicos, las exportaciones de servicios informáticos, incluyendo programas informáticos, la inversión privada en inventarios de los fabricantes de productos químicos y la inversión privada en inventarios de los fabricantes de productos diversos, incluidos los equipos médicos y fabricantes de suministros.
-30
-20
-10
0
10
20
30
40
2012 2013 2014 2015 2016 2017 2018
Exportaciones netas Exportaciones netas menos fármacos, equipomédico y científico, y servicios informáticos
U.S. Bureau of Economic Analysis
Gráfico A. Exportaciones netas de Puerto Rico: Miles de millones de dólares
- 21 -

El gráfico B muestra el PIB excluyendo los productos farmacéuticos, los equipos médicos y científicos, y los servicios informáticos, comparados con el PIB que se presenta en el cuadro 1.1. El gráfico C muestra el crecimiento del PIB real excluyendo los productos farmacéuticos, los equipos médicos y científicos y los servicios informáticos. Si bien esta serie no pretende ser un sustituto del estimado del producto nacional bruto (PNB), al eliminar gran parte de la producción en Puerto Rico que está asociada con las empresas no residentes, puede reflejar niveles y tendencias similares a las del PNB. En contraste con el PIB real que se muestra en el gráfico 1 de esta publicación, la siguiente serie fue negativa entre 2013 y 2015, positiva en 2016, y positiva en 2018. El crecimiento de 2016 reflejó la expansión en la construcción de proyectos de energía renovable, y el aumento en los gastos de bienes duraderos por parte de consumidores y empresas, incluyendo los vehículos de motor. El crecimiento en 2018 reflejó las actividades de recuperación y reconstrucción tras los huracanes de 2017.
50
65
80
95
110
125
2012 2013 2014 2015 2016 2017 2018
PIB PIB menos fármacos, equipo médico ycientífico, y servicios informáticos
U.S. Bureau of Economic Analysis
Gráfico B. PIB de Puerto Rico: Miles de millones de dólares
-5
-4
-3
-2
-1
0
1
2
2013 2014 2015 2016 2017 2018
U.S. Bureau of Economic Analysis
Gráfico C. PIB real de Puerto Rico menos fármacos, equipo médico y científico,
y servicios informáticos: Cambio porcentual respecto al año anterior
- 22 -

Agradecimientos
Debido a que Puerto Rico no está incluido en la mayoría de las principales encuestas utilizadas por BEA para estimar el PIB nacional de los EE. UU., el apoyo brindado por el gobierno de Puerto Rico ha sido fundamental para la producción exitosa de estos estimados. El BEA agradece la información proporcionada por numerosas organizaciones e individuos en Puerto Rico, incluyendo (en orden alfabético):
• Autoridad de Energía Eléctrica de Puerto Rico
• Banco de Desarrollo Económico para Puerto Rico, Oficina de Estudios Económicos
• Compañía de Fomento Industrial de Puerto Rico
• Departamento de Desarrollo Económico y Comercio de Puerto Rico
• Departamento de Hacienda de Puerto Rico
• Departamento del Trabajo y Recursos Humanos de Puerto Rico
• Instituto de Estadísticas de Puerto Rico
• Junta de Planificación de Puerto Rico
• Oficina del Comisionado de Seguros de Puerto Rico
- 23 -
Información adicional Fuentes
• Manténgase informado sobre los desarrollos del BEA leyendo el blog del BEA, registrándose al servicio de suscripción del BEA, o siguiendo al BEA en su cuenta de Twitter @BEA_News.
• Estos estimados pueden accederse en la página del BEA, Estadísticas Económicas para Puerto Rico.
• Acceda a los datos del BEA suscribiéndose a la interfaz de programación de aplicaciones (API por sus siglas en inglés) de datos del BEA.
• Para más estadísticas del BEA, vea nuestra publicación mensual en línea, el Survey of Current Business.
• Para las fechas de publicación, consulte el calendario de publicación del BEA.
Definiciones El producto interior bruto (PIB) es el valor de los bienes y servicios producidos por la economía de Puerto Rico menos el valor de los bienes y servicios utilizados en la producción. El PIB también es igual a la suma de los gastos de consumo personal, la inversión privada en capital fijo, la variación de los inventarios privados, las exportaciones netas de bienes y servicios y los gastos de gobierno —que incluyen consumo e inversión bruta. Los gastos de consumo personal (GCP), también denominado como “gastos de los consumidores”, miden las compras de bienes y servicios realizadas por las “personas” —esto es, por hogares y por instituciones sin fines de lucro que sirven a los hogares (NPISH por sus siglas en inglés)— que residen en Puerto Rico. La inversión privada en capital fijo (IPCF) mide el gasto de los negocios privados, de las instituciones sin fines de lucro, y de las personas, en activos fijos en la economía de Puerto Rico. Los activos fijos consisten en estructuras, equipos, y en productos de propiedad intelectual que se utilizan en la producción de bienes y servicios. Los cambios en los inventarios privados (CIP), o "inversión privada de inventarios" son una medida del valor del cambio en el volumen físico de los inventarios (adiciones menos disminuciones) que mantienen las empresas para respaldar sus actividades de producción y distribución.
Las exportaciones netas de bienes y servicios son la diferencia entre las exportaciones de bienes y servicios y las importaciones de bienes y servicios. Las exportaciones miden la porción de la producción total de bienes y servicios de Puerto Rico que se proporciona al resto del mundo. Las importaciones miden la porción del gasto total de Puerto Rico que se contabiliza por bienes y servicios provistos por el resto del mundo. Los gastos de consumo y la inversión bruta del gobierno, o "gastos de gobierno" (GG), miden la porción del PIB que representa al sector público. Los gastos de consumo del gobierno consisten en el gasto del gobierno para producir y brindar servicios al público. La inversión bruta consiste en el gasto del gobierno en activos fijos que benefician directamente al público o que ayudan a las agencias gubernamentales en sus actividades productivas. Estimados a dólares corrientes son aquellos valorados a los precios vigentes en el momento en que las transacciones ocurrieron—esto es, a “valor de mercado”. También se les conoce como “estimados nominales”, o como “estimados a precios corrientes”. Valores reales son estimados ajustados por inflación—esto es, estimados que excluyen los efectos de las variaciones en los precios.
Convenciones estadísticas Cantidades y precios. Las cantidades, o medidas de volumen “real”, y los precios, se expresan como números-índice con un año de referencia específico igual a 100 (en la actualidad correspondiente a 2012). Los índices de cantidades y precios se calculan empleando la fórmula de la ponderación “encadenada” de Fisher, que incorpora pesos o ponderaciones de dos años adyacentes. Las series en términos reales se calculan multiplicando el índice de cantidades por el valor corriente en el año de referencia (2012), dividiéndolo luego por 100. Los valores de dólares-encadenados no son aditivos porque los precios relativos para un periodo determinado difieren de aquellos del año de referencia.
- 24 -

List of News Release Tables
Table 1.1. Gross Domestic Product Table 1.2. Real Gross Domestic Product Table 1.3. Percent Change From Preceding Year in Real Gross Domestic Product Table 1.4. Contributions to Percent Change in Real Gross Domestic Product Table 2.1. Personal Consumption Expenditures Table 2.2. Real Personal Consumption Expenditures Table 2.3. Percent Change From Preceding Year in Real Personal Consumption Expenditures Table 2.4. Contributions to Percent Change in Real Personal Consumption Expenditures Table 3.1. Exports and Imports of Goods and Services by Type of Product Table 3.2. Real Exports and Imports of Goods and Services by Type of Product Table 3.3. Percent Change From Preceding Year in Real Exports and in Real Imports of Goods and
Services by Type of Product Table 3.4. Contributions to Percent Change in Real Exports and Real Imports of Goods and Services
by Type of Product Table 4.1.1. Gross Domestic Investment Table 4.1.2. Real Gross Domestic Investment Table 4.1.3. Percent Change From Preceding Year in Real Gross Domestic Investment Table 4.2.1. Private Fixed Investment Table 4.2.2. Real Private Fixed Investment Table 4.2.3. Percent Change From Preceding Year in Real Private Fixed Investment Table 4.2.4. Contributions to Percent Change in Real Private Fixed Investment
- 25 -

Puerto Rico
Line 2012 2013 2014 2015 2016 2017 20181 Gross domestic product...................................................... 105,358 109,063 113,197 115,902 114,679 108,103 107,9752 Personal consumption expenditures................................ 57,781 58,102 57,297 56,114 55,558 55,053 57,2233 Goods................................................................................. 24,742 24,764 23,842 23,178 22,989 23,039 24,9074 Durable goods................................................................. 6,779 6,812 6,297 5,978 6,072 5,952 7,1255 Nondurable goods........................................................... 17,963 17,953 17,545 17,200 16,916 17,088 17,7826 Services.............................................................................. 34,993 35,444 35,806 35,515 35,178 34,191 34,3617 Net foreign travel.............................................................. -1,954 -2,106 -2,352 -2,579 -2,609 -2,178 -2,0458 Gross private domestic investment.................................. 10,572 9,863 10,459 9,558 11,520 8,460 16,2119 Fixed investment............................................................... 9,989 10,038 10,220 10,260 10,339 10,787 13,08810 Structures........................................................................ 2,110 1,975 1,944 1,912 1,786 1,689 2,82711 Residential.................................................................... 768 680 650 664 605 478 1,04912 Nonresidential.............................................................. 1,341 1,295 1,295 1,248 1,180 1,211 1,77813 Equipment....................................................................... 4,735 4,744 4,771 4,739 4,811 5,067 5,80814 Intellectual property products........................................ 3,144 3,319 3,505 3,609 3,742 4,031 4,45315 Change in private inventories............................................ 583 -175 238 -702 1,180 -2,326 3,12316 Net exports of goods and services.................................... 19,127 24,446 29,874 35,297 33,053 29,353 16,51517 Exports............................................................................... 70,813 74,348 79,631 83,349 84,976 77,020 76,08118 Goods.............................................................................. 58,696 61,832 66,945 70,826 72,273 64,266 62,64419 Services........................................................................... 12,116 12,516 12,685 12,522 12,703 12,754 13,43720 Imports.............................................................................. 51,686 49,902 49,757 48,052 51,922 47,668 59,56621 Goods.............................................................................. 46,281 44,341 44,060 42,212 45,989 41,523 52,64922 Services........................................................................... 5,405 5,561 5,697 5,840 5,933 6,144 6,91723 Government consumption expenditures
and gross investment....................................................... 17,878 16,652 15,568 14,933 14,548 15,237 18,02724 Federal............................................................................... 2,655 2,339 2,357 2,403 2,486 3,228 4,02725 Central............................................................................... 12,110 11,305 10,325 9,648 9,188 9,311 11,35026 Municipal........................................................................... 3,113 3,007 2,887 2,881 2,873 2,698 2,649
Table 1.1. Gross Domestic Product[Millions of dollars]
Note. Detail may not add to total because of rounding.
- 26 -

Puerto Rico
Line 2012 2013 2014 2015 2016 2017 20181 Gross domestic product...................................................... 105,358 107,431 110,045 109,358 105,662 98,759 97,8612 Personal consumption expenditures................................ 57,781 57,302 55,570 54,418 53,765 52,371 54,1323 Goods................................................................................. 24,742 24,616 23,482 23,021 22,907 22,732 24,2524 Durable goods................................................................. 6,779 6,844 6,413 6,093 6,212 6,165 7,4955 Nondurable goods........................................................... 17,963 17,774 17,066 16,917 16,689 16,562 16,8286 Services.............................................................................. 34,993 34,716 34,292 33,755 33,201 31,639 31,7497 Net foreign travel.............................................................. -1,954 -2,029 -2,207 -2,354 -2,330 -1,975 -1,8088 Gross private domestic investment.................................. 10,572 9,857 10,444 9,545 11,581 8,493 16,0719 Fixed investment............................................................... 9,989 10,030 10,191 10,202 10,363 10,756 12,87210 Structures........................................................................ 2,110 1,963 1,922 1,915 1,812 1,720 2,85411 Residential.................................................................... 768 647 587 586 521 400 83712 Nonresidential.............................................................. 1,341 1,318 1,343 1,336 1,305 1,364 2,02213 Equipment....................................................................... 4,735 4,767 4,835 4,819 4,910 5,188 5,92414 Intellectual property products........................................ 3,144 3,300 3,434 3,467 3,635 3,838 4,12215 Change in private inventories............................................ 583 -173 219 -650 1,119 -2,197 2,96616 Net exports of goods and services.................................... 19,127 23,658 28,537 30,316 26,303 23,522 13,39017 Exports............................................................................... 70,813 73,345 77,555 80,054 79,801 70,796 68,21718 Goods.............................................................................. 58,696 60,676 64,527 66,984 66,451 57,455 54,20419 Services........................................................................... 12,116 12,671 13,012 13,023 13,342 13,582 14,49720 Imports.............................................................................. 51,686 49,630 48,862 49,488 54,232 47,871 57,49421 Goods.............................................................................. 46,281 44,141 43,401 43,978 48,501 42,115 51,31822 Services........................................................................... 5,405 5,488 5,459 5,509 5,757 5,723 6,19523 Government consumption expenditures
and gross investment....................................................... 17,878 16,558 15,351 14,765 14,295 14,780 16,89024 Federal............................................................................... 2,655 2,307 2,274 2,290 2,338 2,962 3,56125 Central............................................................................... 12,110 11,318 10,264 9,665 9,170 9,157 10,77126 Municipal........................................................................... 3,113 2,933 2,809 2,799 2,767 2,611 2,494
[Millions of chained (2012) dollars]Table 1.2. Real Gross Domestic Product
- 27 -

Puerto Rico
Line 2012* 2013 2014 2015 2016 2017 20181 Gross domestic product...................................................... …….. 2.0 2.4 -0.6 -3.4 -6.5 -0.92 Personal consumption expenditures................................ …….. -0.8 -3.0 -2.1 -1.2 -2.6 3.43 Goods................................................................................. …….. -0.5 -4.6 -2.0 -0.5 -0.8 6.74 Durable goods................................................................. …….. 0.9 -6.3 -5.0 2.0 -0.8 21.65 Nondurable goods........................................................... …….. -1.1 -4.0 -0.9 -1.3 -0.8 1.66 Services.............................................................................. …….. -0.8 -1.2 -1.6 -1.6 -4.7 0.37 Net foreign travel.............................................................. …….. …….. …….. …….. …….. …….. ……..8 Gross private domestic investment.................................. …….. -6.8 6.0 -8.6 21.3 -26.7 89.29 Fixed investment............................................................... …….. 0.4 1.6 0.1 1.6 3.8 19.710 Structures........................................................................ …….. -7.0 -2.1 -0.4 -5.4 -5.1 65.911 Residential.................................................................... …….. -15.8 -9.4 -0.1 -11.0 -23.2 109.212 Nonresidential.............................................................. …….. -1.7 1.9 -0.5 -2.3 4.5 48.213 Equipment....................................................................... …….. 0.7 1.4 -0.3 1.9 5.7 14.214 Intellectual property products........................................ …….. 5.0 4.1 1.0 4.9 5.6 7.415 Change in private inventories............................................ …….. …….. …….. …….. …….. …….. ……..16 Net exports of goods and services.................................... …….. …….. …….. …….. …….. …….. ……..17 Exports............................................................................... …….. 3.6 5.7 3.2 -0.3 -11.3 -3.618 Goods.............................................................................. …….. 3.4 6.3 3.8 -0.8 -13.5 -5.719 Services........................................................................... …….. 4.6 2.7 0.1 2.5 1.8 6.720 Imports.............................................................................. …….. -4.0 -1.5 1.3 9.6 -11.7 20.121 Goods.............................................................................. …….. -4.6 -1.7 1.3 10.3 -13.2 21.922 Services........................................................................... …….. 1.5 -0.5 0.9 4.5 -0.6 8.223 Government consumption expenditures
and gross investment....................................................... …….. -7.4 -7.3 -3.8 -3.2 3.4 14.324 Federal............................................................................... …….. -13.1 -1.4 0.7 2.1 26.7 20.225 Central............................................................................... …….. -6.5 -9.3 -5.8 -5.1 -0.1 17.626 Municipal........................................................................... …….. -5.8 -4.2 -0.3 -1.1 -5.7 -4.5
Table 1.3. Percent Change From Preceding Year in Real Gross Domestic Product[Percent]
* Not availableNote. Percent changes are not shown for net series.
- 28 -

Puerto Rico
Line 2012* 2013 2014 2015 2016 2017 2018Percent change:
1 Gross domestic product...................................................... …….. 2.0 2.4 -0.6 -3.4 -6.5 -0.9
Percentage points:2 Personal consumption expenditures................................ …….. -0.46 -1.61 -1.03 -0.57 -1.26 1.713 Goods................................................................................. …….. -0.12 -1.04 -0.41 -0.10 -0.15 1.434 Durable goods................................................................. …….. 0.06 -0.39 -0.27 0.10 -0.04 1.175 Nondurable goods........................................................... …….. -0.18 -0.66 -0.13 -0.20 -0.11 0.266 Services.............................................................................. …….. -0.26 -0.40 -0.49 -0.50 -1.45 0.117 Net foreign travel.............................................................. …….. -0.07 -0.17 -0.14 0.02 0.34 0.178 Gross private domestic investment.................................. …….. -0.67 0.54 -0.78 1.73 -2.68 6.989 Fixed investment............................................................... …….. 0.04 0.15 0.01 0.14 0.34 1.9710 Structures........................................................................ …….. -0.14 -0.04 -0.01 -0.09 -0.08 1.0311 Residential.................................................................... …….. -0.12 -0.06 0.00 -0.06 -0.12 0.4912 Nonresidential.............................................................. …….. -0.02 0.02 -0.01 -0.02 0.05 0.5313 Equipment....................................................................... …….. 0.03 0.06 -0.01 0.08 0.24 0.6614 Intellectual property products........................................ …….. 0.15 0.12 0.03 0.15 0.18 0.2815 Change in private inventories............................................ …….. -0.71 0.39 -0.79 1.59 -3.02 5.0116 Net exports of goods and services.................................... …….. 4.34 4.62 1.71 -4.13 -3.02 -11.6417 Exports............................................................................... …….. 2.40 3.91 2.25 -0.23 -8.42 -2.6218 Goods.............................................................................. …….. 1.88 3.61 2.24 -0.49 -8.61 -3.4119 Services........................................................................... …….. 0.52 0.31 0.01 0.26 0.20 0.7920 Imports.............................................................................. …….. 1.94 0.71 -0.54 -3.90 5.39 -9.0221 Goods.............................................................................. …….. 2.02 0.68 -0.49 -3.68 5.36 -8.5422 Services........................................................................... …….. -0.08 0.03 -0.05 -0.22 0.03 -0.4823 Government consumption expenditures
and gross investment....................................................... …….. -1.25 -1.11 -0.52 -0.41 0.43 2.0424 Federal............................................................................... …….. -0.33 -0.03 0.01 0.04 0.58 0.6125 Central............................................................................... …….. -0.75 -0.96 -0.52 -0.42 -0.01 1.5426 Municipal........................................................................... …….. -0.17 -0.12 -0.01 -0.03 -0.14 -0.11
* Not available
Table 1.4. Contributions to Percent Change in Real Gross Domestic Product[Percentage points]
- 29 -

Puerto Rico
Line 2012 2013 2014 2015 2016 2017 20181 Personal consumption expenditures.................................. 57,781 58,102 57,297 56,114 55,558 55,053 57,2232 Goods............................................................................. 24,742 24,764 23,842 23,178 22,989 23,039 24,9073 Durable goods................................................................. 6,779 6,812 6,297 5,978 6,072 5,952 7,1254 Motor vehicles and parts.............................................. 3,300 3,306 2,913 2,659 2,790 2,741 3,4185 All other durable goods................................................ 3,479 3,506 3,384 3,319 3,282 3,211 3,7066 Nondurable goods........................................................... 17,963 17,953 17,545 17,200 16,916 17,088 17,7827 Food and beverages...................................................... 7,282 7,309 7,280 7,353 7,119 7,351 7,7578 Gasoline and other energy goods................................. 2,600 2,550 2,388 1,809 1,635 1,851 2,1639 All other nondurable goods.......................................... 8,081 8,094 7,877 8,038 8,162 7,886 7,86210 Services........................................................................... 34,993 35,444 35,806 35,515 35,178 34,191 34,36111 Housing and utilities........................................................ 12,483 12,496 12,612 12,051 11,721 11,288 11,16312 Health care...................................................................... 6,432 6,638 6,899 6,793 6,652 6,385 6,49913 Accommodations and food services................................ 3,985 4,109 4,206 4,409 4,349 4,190 4,22514 All other services............................................................. 12,093 12,201 12,089 12,261 12,456 12,329 12,47615 Net foreign travel............................................................ -1,954 -2,106 -2,352 -2,579 -2,609 -2,178 -2,045
Line 2012 2013 2014 2015 2016 2017 20181 Personal consumption expenditures (PCE)......................... 57,781 57,302 55,570 54,418 53,765 52,371 54,1322 Goods............................................................................. 24,742 24,616 23,482 23,021 22,907 22,732 24,2523 Durable goods................................................................. 6,779 6,844 6,413 6,093 6,212 6,165 7,4954 Motor vehicles and parts.............................................. 3,300 3,298 2,905 2,666 2,795 2,758 3,4615 All other durable goods................................................ 3,479 3,546 3,513 3,436 3,423 3,413 4,0346 Nondurable goods........................................................... 17,963 17,774 17,066 16,917 16,689 16,562 16,8287 Food and beverages...................................................... 7,282 7,241 7,115 7,100 6,965 7,156 7,3688 Gasoline and other energy goods................................. 2,600 2,591 2,475 2,519 2,517 2,509 2,6029 All other nondurable goods.......................................... 8,081 7,942 7,479 7,317 7,236 6,953 6,93910 Services........................................................................... 34,993 34,716 34,292 33,755 33,201 31,639 31,74911 Housing and utilities........................................................ 12,483 12,455 12,490 12,465 12,370 11,866 11,91012 Health care...................................................................... 6,432 6,408 6,410 6,087 5,797 5,434 5,46113 Accommodations and food services................................ 3,985 3,936 3,889 3,913 3,808 3,672 3,65614 All other services............................................................. 12,093 11,918 11,509 11,310 11,268 10,721 10,77615 Net foreign travel............................................................ -1,954 -2,029 -2,207 -2,354 -2,330 -1,975 -1,808
Addenda:16 Population
1 …........................................................................ 3,634,488 3,593,077 3,534,874 3,473,166 3,406,495 3,325,001 3,195,15317 Per capita real PCE (chained dollars).................................... 15,898 15,948 15,721 15,668 15,783 15,751 16,942
Table 2.1. Personal Consumption Expenditures[Millions of dollars]
1. Source: Annual Estimates of the Resident Population for Selected Age Groups by Sex for the United States, States, Counties and Puerto Rico Commonwealth and Municipios (U.S. Census Bureau, Population Division).
Table 2.2. Real Personal Consumption Expenditures[Millions of chained (2012) dollars]
Note. Detail may not add to total because of rounding.
- 30 -

Puerto Rico
Line 2012* 2013 2014 2015 2016 2017 20181 Personal consumption expenditures.................................. …….. -0.8 -3.0 -2.1 -1.2 -2.6 3.42 Goods............................................................................. …….. -0.5 -4.6 -2.0 -0.5 -0.8 6.73 Durable goods................................................................. …….. 0.9 -6.3 -5.0 2.0 -0.8 21.64 Motor vehicles and parts.............................................. …….. -0.1 -11.9 -8.2 4.9 -1.3 25.55 All other durable goods................................................ …….. 1.9 -0.9 -2.2 -0.4 -0.3 18.26 Nondurable goods........................................................... …….. -1.1 -4.0 -0.9 -1.3 -0.8 1.67 Food and beverages...................................................... …….. -0.6 -1.7 -0.2 -1.9 2.7 3.08 Gasoline and other energy goods................................. …….. -0.4 -4.5 1.8 -0.1 -0.3 3.79 All other nondurable goods.......................................... …….. -1.7 -5.8 -2.2 -1.1 -3.9 -0.210 Services........................................................................... …….. -0.8 -1.2 -1.6 -1.6 -4.7 0.311 Housing and utilities........................................................ …….. -0.2 0.3 -0.2 -0.8 -4.1 0.412 Health care...................................................................... …….. -0.4 0.0 -5.0 -4.8 -6.3 0.513 Accommodations and food services................................ …….. -1.2 -1.2 0.6 -2.7 -3.6 -0.414 All other services............................................................. …….. -1.5 -3.4 -1.7 -0.4 -4.9 0.515 Net foreign travel............................................................ …….. …….. …….. …….. …….. …….. ……..
* Not availableNote. Percent changes are not shown for net series.
Line 2012* 2013 2014 2015 2016 2017 2018Percent change:
1 Personal consumption expenditures.................................. …….. -0.8 -3.0 -2.1 -1.2 -2.6 3.4
Percentage points:2 Goods............................................................................. …….. -0.22 -1.96 -0.81 -0.21 -0.31 2.813 Durable goods................................................................. …….. 0.11 -0.73 -0.55 0.21 -0.08 2.314 Motor vehicles and parts.............................................. …….. 0.00 -0.67 -0.42 0.23 -0.07 1.265 All other durable goods................................................ …….. 0.11 -0.05 -0.13 -0.02 -0.02 1.056 Nondurable goods........................................................... …….. -0.33 -1.23 -0.27 -0.41 -0.23 0.507 Food and beverages...................................................... …….. -0.07 -0.22 -0.03 -0.25 0.35 0.408 Gasoline and other energy goods................................. …….. -0.02 -0.19 0.06 0.00 -0.01 0.139 All other nondurable goods.......................................... …….. -0.24 -0.82 -0.30 -0.16 -0.57 -0.0310 Services........................................................................... …….. -0.48 -0.75 -0.98 -1.04 -2.98 0.2211 Housing and utilities........................................................ …….. -0.05 0.06 -0.04 -0.16 -0.85 0.0812 Health care...................................................................... …….. -0.04 0.00 -0.62 -0.59 -0.75 0.0613 Accommodations and food services................................ …….. -0.09 -0.09 0.05 -0.21 -0.28 -0.0314 All other services............................................................. …….. -0.31 -0.72 -0.37 -0.08 -1.10 0.1215 Net foreign travel............................................................ …….. -0.13 -0.32 -0.28 0.05 0.71 0.34
* Not available
Table 2.4. Contributions to Percent Change in Real Personal Consumption Expenditures[Percentage points]
Table 2.3. Percent Change From Preceding Year in Real Personal Consumption Expenditures[Percent]
- 31 -

Puerto Rico
Line 2012 2013 2014 2015 2016 2017 20181 Exports of goods and services............................................ 70,813 74,348 79,631 83,349 84,976 77,020 76,0812 Exports of goods............................................................. 58,696 61,832 66,945 70,826 72,273 64,266 62,6443 Foods, feeds, and beverages........................................... 3,708 4,095 4,224 4,565 4,654 4,028 1,0554 Pharmaceuticals and organic chemicals 1 …...................... 43,571 46,045 48,797 52,453 53,921 47,801 46,9615 Consumer goods, except food, automotive,
and pharmaceuticals..................................................... 3,562 3,868 5,935 6,284 5,507 4,918 5,6906 Capital goods, including parts.......................................... 5,172 5,334 5,452 5,411 5,811 5,400 6,4867 All other........................................................................... 2,685 2,489 2,537 2,113 2,379 2,118 2,4518 Exports of services.......................................................... 12,116 12,516 12,685 12,522 12,703 12,754 13,4379 Travel (for all purposes including education,
business, and medical).................................................. 2,950 3,065 3,288 3,501 3,530 3,122 3,03610 All other 2 .......................................................................... 9,167 9,452 9,397 9,022 9,173 9,633 10,40111 Imports of goods and services........................................... 51,686 49,902 49,757 48,052 51,922 47,668 59,56612 Imports of goods............................................................. 46,281 44,341 44,060 42,212 45,989 41,523 52,64913 Foods, feeds, and beverages........................................... 4,457 4,527 4,563 4,636 4,412 4,471 4,57114 Pharmaceuticals and organic chemicals 1 …...................... 18,421 17,248 17,835 18,321 23,887 18,355 25,12015 Petroleum and other energy products............................ 7,339 6,529 6,238 4,066 3,237 3,884 4,46816 All other........................................................................... 16,065 16,037 15,424 15,190 14,453 14,814 18,49117 Imports of services.......................................................... 5,405 5,561 5,697 5,840 5,933 6,144 6,91718 Travel (for all purposes including education,
business, and medical).................................................. 752 715 698 677 711 724 76919 All other........................................................................... 4,652 4,846 4,999 5,163 5,222 5,420 6,147
Addendum:20 Exports of medical and scientific equipment
and appliances 3 …............................................................... 4,742 5,120 7,262 7,737 7,164 6,638 7,804
1. Also includes medicinal and dental products.2. Includes computer services, such as software.
Table 3.1. Exports and Imports of Goods and Services by Type of Product[Millions of dollars]
3. Includes consumer medical appliances embedded in line 5 and lab testing and control instruments and other scientific, medical, and hospital equipment embedded in line 6.Note. Detail may not add to total because of rounding.
- 32 -

Puerto Rico
Line 2012 2013 2014 2015 2016 2017 20181 Exports of goods and services............................................ 70,813 73,345 77,555 80,054 79,801 70,796 68,2172 Exports of goods............................................................. 58,696 60,676 64,527 66,984 66,451 57,455 54,2043 Foods, feeds, and beverages........................................... 3,708 4,095 4,209 4,516 4,554 3,881 9954 Pharmaceuticals and organic chemicals 1 …...................... 43,571 44,852 46,323 48,229 47,548 40,716 38,5765 Consumer goods, except food, automotive,
and pharmaceuticals..................................................... 3,562 3,887 5,978 6,319 5,569 5,006 5,7486 Capital goods, including parts.......................................... 5,172 5,320 5,459 5,443 5,901 5,479 6,4987 All other........................................................................... 2,685 2,523 2,626 2,518 3,053 2,582 2,7568 Exports of services.......................................................... 12,116 12,671 13,012 13,023 13,342 13,582 14,4979 Travel (for all purposes including education,
business, and medical).................................................. 2,950 2,960 3,101 3,211 3,212 2,844 2,73610 All other 2 .......................................................................... 9,167 9,714 9,909 9,794 10,128 10,830 11,93611 Imports of goods and services........................................... 51,686 49,630 48,862 49,488 54,232 47,871 57,49412 Imports of goods............................................................. 46,281 44,141 43,401 43,978 48,501 42,115 51,31813 Foods, feeds, and beverages........................................... 4,457 4,481 4,421 4,472 4,342 4,364 4,36714 Pharmaceuticals and organic chemicals 1 …...................... 18,421 16,764 16,687 16,911 21,387 15,680 20,58615 Petroleum and other energy products............................ 7,339 6,806 6,733 7,012 6,976 6,947 6,83616 All other........................................................................... 16,065 16,098 15,559 15,620 15,137 15,492 19,08717 Imports of services.......................................................... 5,405 5,488 5,459 5,509 5,757 5,723 6,19518 Travel (for all purposes including education,
business, and medical).................................................. 752 704 675 646 665 668 69919 All other........................................................................... 4,652 4,785 4,784 4,862 5,092 5,055 5,495
Addendum:20 Exports of medical and scientific equipment
and appliances 3 …............................................................... 4,742 5,130 7,304 7,758 7,232 6,750 7,878
1. Also includes medicinal and dental products.2. Includes computer services, such as software.
Table 3.2. Real Exports and Imports of Goods and Services by Type of Product[Millions of chained (2012) dollars]
3. Includes consumer medical appliances embedded in line 5 and lab testing and control instruments and other scientific, medical, and hospital equipment embedded in line 6.
- 33 -

Puerto Rico
Line 2012* 2013 2014 2015 2016 2017 20181 Exports of goods and services............................................ …….. 3.6 5.7 3.2 -0.3 -11.3 -3.62 Exports of goods............................................................. …….. 3.4 6.3 3.8 -0.8 -13.5 -5.73 Foods, feeds, and beverages........................................... …….. 10.4 2.8 7.3 0.8 -14.8 -74.34 Pharmaceuticals and organic chemicals 1 …...................... …….. 2.9 3.3 4.1 -1.4 -14.4 -5.35 Consumer goods, except food, automotive,
and pharmaceuticals..................................................... …….. 9.1 53.8 5.7 -11.9 -10.1 14.86 Capital goods, including parts.......................................... …….. 2.9 2.6 -0.3 8.4 -7.1 18.67 All other........................................................................... …….. -6.0 4.1 -4.1 21.2 -15.4 6.78 Exports of services.......................................................... …….. 4.6 2.7 0.1 2.5 1.8 6.79 Travel (for all purposes including education,
business, and medical).................................................. …….. 0.4 4.8 3.5 0.0 -11.4 -3.810 All other 2 .......................................................................... …….. 6.0 2.0 -1.2 3.4 6.9 10.211 Imports of goods and services........................................... …….. -4.0 -1.5 1.3 9.6 -11.7 20.112 Imports of goods............................................................. …….. -4.6 -1.7 1.3 10.3 -13.2 21.913 Foods, feeds, and beverages........................................... …….. 0.5 -1.3 1.2 -2.9 0.5 0.114 Pharmaceuticals and organic chemicals 1 …...................... …….. -9.0 -0.5 1.3 26.5 -26.7 31.315 Petroleum and other energy products............................ …….. -7.3 -1.1 4.1 -0.5 -0.4 -1.616 All other........................................................................... …….. 0.2 -3.3 0.4 -3.1 2.4 23.217 Imports of services.......................................................... …….. 1.5 -0.5 0.9 4.5 -0.6 8.218 Travel (for all purposes including education,
business, and medical).................................................. …….. -6.5 -4.1 -4.3 2.9 0.4 4.719 All other........................................................................... …….. 2.8 0.0 1.6 4.7 -0.7 8.7
Addendum:20 Exports of medical and scientific equipment
and appliances 3 …............................................................... …….. 8.2 42.4 6.2 -6.8 -6.7 16.7
Table 3.3. Percent Change From Preceding Period in Real Exports and in Real Imports of Goods and Services by Type of Product
[Percent]
3. Includes consumer medical appliances embedded in line 5 and lab testing and control instruments and other scientific, medical, and hospital equipment embedded in line 6.
* Not available1. Also includes medicinal and dental products.2. Includes computer services, such as software.
- 34 -

Puerto Rico
Line 2012* 2013 2014 2015 2016 2017 2018Percent change:
1 Exports of goods and services............................................ …….. 3.6 5.7 3.2 -0.3 -11.3 -3.6
Percentage points:2 Exports of goods............................................................. …….. 2.80 5.29 3.21 -0.68 -11.55 -4.743 Foods, feeds, and beverages........................................... …….. 0.54 0.15 0.39 0.05 -0.81 -3.884 Pharmaceuticals and organic chemicals 1 …...................... …….. 1.82 2.04 2.55 -0.90 -9.17 -3.285 Consumer goods, except food, automotive,
and pharmaceuticals..................................................... …….. 0.45 2.78 0.42 -0.88 -0.65 0.946 Capital goods, including parts.......................................... …….. 0.21 0.19 -0.02 0.54 -0.48 1.307 All other........................................................................... …….. -0.22 0.14 -0.12 0.52 -0.44 0.198 Exports of services.......................................................... …….. 0.77 0.45 0.01 0.36 0.26 1.109 Travel (for all purposes including education,
business, and medical).................................................. …….. 0.02 0.20 0.15 0.00 -0.47 -0.1510 All other 2 ....................................................................... …….. 0.76 0.25 -0.13 0.36 0.73 1.25
Percent change:11 Imports of goods and services........................................... …….. -4.0 -1.5 1.3 9.6 -11.7 20.1
Percentage points:12 Imports of goods............................................................. …….. -4.14 -1.49 1.17 9.04 -11.66 19.0413 Foods, feeds, and beverages........................................... …….. 0.05 -0.12 0.11 -0.28 0.04 0.0114 Pharmaceuticals and organic chemicals 1 …...................... …….. -3.24 -0.16 0.50 10.34 -12.32 12.0715 Petroleum and other energy products............................ …….. -1.01 -0.14 0.44 -0.04 -0.03 -0.1416 All other........................................................................... …….. 0.06 -1.07 0.12 -0.98 0.64 7.1117 Imports of services.......................................................... …….. 0.16 -0.06 0.11 0.54 -0.07 1.0618 Travel (for all purposes including education,
business, and medical).................................................. …….. -0.09 -0.06 -0.06 0.04 0.01 0.0719 All other........................................................................... …….. 0.26 0.00 0.17 0.50 -0.07 0.99
Addendum:20 Exports of medical and scientific equipment
and appliances 3 …............................................................... …….. 0.54 2.89 0.57 -0.62 -0.56 1.43
* Not available
3. Includes consumer medical appliances embedded in line 5 and lab testing and control instruments and other scientific, medical, and hospital equipment embedded in line 6.
Table 3.4. Contributions to Percent Change in Real Exports and Real Imports of Goods and Services by Type of Product[Percentage points]
1. Also includes medicinal and dental products.2. Includes computer services, such as software.
- 35 -

Puerto Rico
Line 2012 2013 2014 2015 2016 2017 20181 Gross domestic investment.............................................. 13,727 12,217 12,455 11,226 12,912 10,256 19,7962 Gross private domestic investment................................ 10,572 9,863 10,459 9,558 11,520 8,460 16,2113 Private fixed investment................................................... 9,989 10,038 10,220 10,260 10,339 10,787 13,0884 Structures....................................................................... 2,110 1,975 1,944 1,912 1,786 1,689 2,8275 Equipment and intellectual property products............. 7,879 8,063 8,276 8,348 8,554 9,098 10,2606 Change in private inventories........................................... 583 -175 238 -702 1,180 -2,326 3,1237 Gross government investment 1 ...................................... 3,155 2,354 1,996 1,668 1,392 1,796 3,5858 Federal............................................................................... 475 351 280 211 205 326 6009 Structures....................................................................... 312 211 134 78 85 199 47510 Equipment and intellectual property products............. 163 140 147 133 120 127 12511 Central............................................................................... 2,281 1,665 1,391 1,193 983 1,326 2,80912 Structures....................................................................... 1,914 1,369 1,146 940 725 1,089 2,56013 Equipment and intellectual property products............. 368 295 245 253 258 237 24914 Municipal........................................................................... 399 338 325 264 205 144 17615 Structures....................................................................... 307 259 242 179 131 82 11716 Equipment and intellectual property products............. 92 80 83 85 74 62 59
Addenda:17 Domestic investment in structures........................................ 4,642 3,814 3,466 3,109 2,727 3,059 5,98018 Domestic investment in equipment
and intellectual property products..................................... 8,501 8,578 8,751 8,820 9,005 9,524 10,693
1. Gross government investment consists of general government and government enterprise expenditures for fixed assets; change in inventories is included in government consumption expenditures.
Table 4.1.1. Gross Domestic Investment[Millions of dollars]
Note. Detail may not add to total because of rounding.
- 36 -

Puerto Rico
Line 2012 2013 2014 2015 2016 2017 20181 Gross domestic investment.............................................. 13,727 12,163 12,346 11,115 12,846 10,122 19,1162 Gross private domestic investment................................ 10,572 9,857 10,444 9,545 11,581 8,493 16,0713 Private fixed investment................................................... 9,989 10,030 10,191 10,202 10,363 10,756 12,8724 Structures....................................................................... 2,110 1,963 1,922 1,915 1,812 1,720 2,8545 Equipment and intellectual property products............. 7,879 8,068 8,270 8,288 8,551 9,033 10,0416 Change in private inventories........................................... 583 -173 219 -650 1,119 -2,197 2,9667 Gross government investment 1 ...................................... 3,155 2,310 1,918 1,590 1,318 1,624 3,0408 Federal............................................................................... 475 345 269 203 196 305 5329 Structures....................................................................... 312 206 127 73 79 179 39910 Equipment and intellectual property products............. 163 139 143 132 118 124 11911 Central............................................................................... 2,281 1,633 1,336 1,134 928 1,184 2,34512 Structures....................................................................... 1,914 1,339 1,093 885 676 946 2,05913 Equipment and intellectual property products............. 368 295 243 251 257 236 24614 Municipal........................................................................... 399 333 313 252 195 134 15515 Structures....................................................................... 307 253 231 169 122 74 9716 Equipment and intellectual property products............. 92 80 82 84 74 62 59
Addenda:17 Domestic investment in structures........................................ 4,642 3,759 3,367 3,027 2,668 2,926 5,48918 Domestic investment in equipment
and intellectual property products..................................... 8,501 8,581 8,738 8,756 8,999 9,454 10,464
1. Gross government investment consists of general government and government enterprise expenditures for fixed assets; change in inventories is included in government consumption expenditures.
[Millions of chained (2012) dollars]Table 4.1.2. Real Gross Domestic Investment
- 37 -

Puerto Rico
Line 2012* 2013 2014 2015 2016 2017 20181 Gross domestic investment.............................................. …….. -11.4 1.5 -10.0 15.6 -21.2 88.92 Gross private domestic investment................................ …….. -6.8 6.0 -8.6 21.3 -26.7 89.23 Private fixed investment................................................... …….. 0.4 1.6 0.1 1.6 3.8 19.74 Structures....................................................................... …….. -7.0 -2.1 -0.4 -5.4 -5.1 65.95 Equipment and intellectual property products............. …….. 2.4 2.5 0.2 3.2 5.6 11.26 Change in private inventories........................................... …….. …….. …….. …….. …….. …….. ……..7 Gross government investment 1 ...................................... …….. -26.8 -17.0 -17.1 -17.1 23.2 87.28 Federal............................................................................... …….. -27.4 -21.9 -24.4 -3.8 55.9 74.49 Structures....................................................................... …….. -34.0 -38.4 -42.6 7.9 127.1 123.210 Equipment and intellectual property products............. …….. -14.6 3.0 -7.6 -10.7 4.9 -3.811 Central............................................................................... …….. -28.4 -18.2 -15.1 -18.2 27.5 98.012 Structures....................................................................... …….. -30.0 -18.3 -19.0 -23.6 39.8 117.713 Equipment and intellectual property products............. …….. -19.8 -17.5 3.4 2.3 -8.2 4.314 Municipal........................................................................... …….. -16.7 -5.9 -19.4 -22.9 -30.9 15.615 Structures....................................................................... …….. -17.6 -8.7 -26.9 -27.6 -39.3 30.916 Equipment and intellectual property products............. …….. -13.4 3.2 2.6 -12.7 -15.7 -5.4
Addenda:17 Domestic investment in structures........................................ …….. -19.0 -10.4 -10.1 -11.9 9.7 87.618 Domestic investment in equipment
and intellectual property products..................................... …….. 0.9 1.8 0.2 2.8 5.0 10.7
Note. Percent changes are not shown for net series.
Table 4.1.3. Percent Change From Preceding Year in Real Gross Domestic Investment[Percent]
* Not available1. Gross government investment consists of general government and government enterprise expenditures for fixed assets; change in inventories is included in government consumption expenditures.
- 38 -

Puerto Rico
Line 2012 2013 2014 2015 2016 2017 20181 Private fixed investment.................................................. 9,989 10,038 10,220 10,260 10,339 10,787 13,0882 Structures...................................................................... 2,110 1,975 1,944 1,912 1,786 1,689 2,8273 Residential......................................................................... 768 680 650 664 605 478 1,0494 Nonresidential................................................................... 1,341 1,295 1,295 1,248 1,180 1,211 1,7785 Equipment..................................................................... 4,735 4,744 4,771 4,739 4,811 5,067 5,8086 Intellectual property products....................................... 3,144 3,319 3,505 3,609 3,742 4,031 4,453
Line 2012 2013 2014 2015 2016 2017 20181 Private fixed investment.................................................. 9,989 10,030 10,191 10,202 10,363 10,756 12,8722 Structures...................................................................... 2,110 1,963 1,922 1,915 1,812 1,720 2,8543 Residential......................................................................... 768 647 587 586 521 400 8374 Nonresidential................................................................... 1,341 1,318 1,343 1,336 1,305 1,364 2,0225 Equipment..................................................................... 4,735 4,767 4,835 4,819 4,910 5,188 5,9246 Intellectual property products....................................... 3,144 3,300 3,434 3,467 3,635 3,838 4,122
Line 2012* 2013 2014 2015 2016 2017 20181 Private fixed investment.................................................. …….. 0.4 1.6 0.1 1.6 3.8 19.72 Structures...................................................................... …….. -7.0 -2.1 -0.4 -5.4 -5.1 65.93 Residential......................................................................... …….. -15.8 -9.4 -0.1 -11.0 -23.2 109.24 Nonresidential................................................................... …….. -1.7 1.9 -0.5 -2.3 4.5 48.25 Equipment..................................................................... …….. 0.7 1.4 -0.3 1.9 5.7 14.26 Intellectual property products....................................... …….. 5.0 4.1 1.0 4.9 5.6 7.4
* Not available
Line 2012* 2013 2014 2015 2016 2017 2018Percent change:
1 Private fixed investment.................................................. …….. 0.4 1.6 0.1 1.6 3.8 19.7
Percentage points:2 Structures...................................................................... …….. -1.47 -0.41 -0.07 -1.00 -0.87 10.253 Residential......................................................................... …….. -1.24 -0.65 -0.01 -0.73 -1.38 4.934 Nonresidential................................................................... …….. -0.23 0.24 -0.07 -0.27 0.51 5.325 Equipment..................................................................... …….. 0.32 0.67 -0.15 0.88 2.62 6.646 Intellectual property products....................................... …….. 1.57 1.35 0.33 1.71 2.04 2.79
* Not available
[Percentage points]
Table 4.2.3. Percent Change From Preceding Year in Real Private Fixed Investment[Percent]
Table 4.2.1. Private Fixed Investment[Millions of dollars]
Table 4.2.2. Real Private Fixed Investment[Millions of chained (2012) dollars]
Table 4.2.4. Contributions to Percent Change in Real Private Fixed Investment
Note. Detail may not add to total because of rounding.
- 39 -