Prototropic equilibria in the lowest excited singlet state of 2-hydroxybenzimidazole...
10
Journal of Photochemistry, 29 (1985) 435 - 444 435 PROTOTROPIC EQUILIBRIA IN THE LOWEST EXCITED SINGLET STATE OF 2-HYDROXYBENZIMIDAZOLE (2-(3H)-BENZIMIDAZOLONE) A. K. MISHRA and S. K. DOGRA Department of Chemistry, Indian Institute of Technology, Kanpur, Uttar Pradesh 208016 (India) (Received April 19,1984; in revised form June 14,1984) Fluorescence and absorption spectral studies in various solvents at various pHs showed that 2-hydroxybenzimidazole exists mostly in the keto form, i.e. 2-(3H)-benzimidazolone. Fluorometric titrations indicated that the monocation is less acidic in the first excited state S1 than in the ground state So. Dication-monocation and neutral-anion equilibria are either not estab- lished in S1 or their values are the same as those in So. 1. Introduction Both spectroscopy and pK, studies have shown that 2- and 4-hydroxy- quinoline [l] exist in the 2- and 4quinolone forms (except in n-heptane where the latter is present as 4-hydroxyquinoline) in both the ground state So and the first excited state Si, whereas the monocations and monoanions of these compounds behave like the other normal hydroxy derivatives of quinolines. Further, the methoxy derivativesof these compounds can easily be prepared and their spectral characteristics 123 are similar to those of the hydroxy derivatives, indicating that the enol form is also present in com- parable amounts. 2-Hydroxybenzimidazole (BIOH (I)) and 2-( 3H)benzimidazolone (II) behave in a different fashion. Alkylation or arylation by various procedures [3 - 63 has shown that methylation always occurs at the N position rather than the 0 position. pK, and absorption spectral studies [7, $1 have clearly indicated that this compound is present in the keto rather than the enol form. Some reactions characteristic of the hydroxy group (e.g. chlorination by POC13 to form Bchlorobenzimidazole etc.) have been explained by assuming that the molecule possesses amphoteric character and does not exhibit keto-enol tautomerism. Although a, few absorption spectroscopy studies have been performed [9, lo], there have been no systematic investi- gations of the effects of solvents and pH on the absorption and fluorescence spectra. 0047-2670/85/$3_30 0 Elsevier Sequoia/Printed in The Netherlands
Transcript of Prototropic equilibria in the lowest excited singlet state of 2-hydroxybenzimidazole...
Journal of Photochemistry, 29 (1985) 435 - 444 435
PROTOTROPIC EQUILIBRIA IN THE LOWEST EXCITED SINGLET STATE OF 2-HYDROXYBENZIMIDAZOLE (2-(3H)-BENZIMIDAZOLONE)
A. K. MISHRA and S. K. DOGRA
Department of Chemistry, Indian Institute of Technology, Kanpur, Uttar Pradesh 208016 (India)
(Received April 19,1984; in revised form June 14,1984)
Fluorescence and absorption spectral studies in various solvents at various pHs showed that 2-hydroxybenzimidazole exists mostly in the keto form, i.e. 2-(3H)-benzimidazolone. Fluorometric titrations indicated that the monocation is less acidic in the first excited state S1 than in the ground state So. Dication-monocation and neutral-anion equilibria are either not estab- lished in S1 or their values are the same as those in So.
1. Introduction
Both spectroscopy and pK, studies have shown that 2- and 4-hydroxy- quinoline [l] exist in the 2- and 4quinolone forms (except in n-heptane where the latter is present as 4-hydroxyquinoline) in both the ground state So and the first excited state Si, whereas the monocations and monoanions of these compounds behave like the other normal hydroxy derivatives of quinolines. Further, the methoxy derivatives of these compounds can easily be prepared and their spectral characteristics 123 are similar to those of the hydroxy derivatives, indicating that the enol form is also present in com- parable amounts.
2-Hydroxybenzimidazole (BIOH (I)) and 2-( 3H)benzimidazolone (II) behave in a different fashion. Alkylation or arylation by various procedures [3 - 63 has shown that methylation always occurs at the N position rather than the 0 position. pK, and absorption spectral studies [7, $1 have clearly indicated that this compound is present in the keto rather than the enol form. Some reactions characteristic of the hydroxy group (e.g. chlorination by POC13 to form Bchlorobenzimidazole etc.) have been explained by assuming that the molecule possesses amphoteric character and does not exhibit keto-enol tautomerism. Although a, few absorption spectroscopy studies have been performed [9, lo], there have been no systematic investi- gations of the effects of solvents and pH on the absorption and fluorescence spectra.
0047-2670/85/$3_30 0 Elsevier Sequoia/Printed in The Netherlands
436
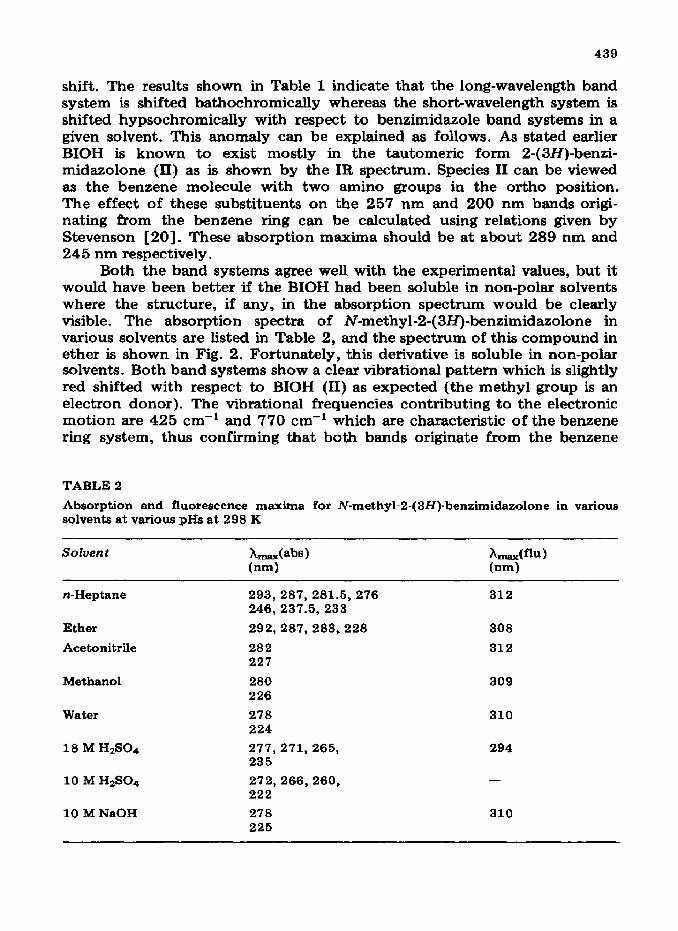
The present study was carried out with the intention of (a) studying the nature of the species present in various solvents at various pHs and (b) calculating the equilibrium constants of the various equilibria in the So and S1 states (Fig. l).-
Fig. 1. Scheme of the ground and excited state equilibria of BIOH at various Ho, pH or H_: I, 2-bydroxybenzimidazole; II, 2-(3N)-benzimidazolone; III, monocation; IV, dicat- ion: V, monoanion at 298 K.
2. Experimental details
BIOH was obtained from the Aldrich Chemical Company and was purified by recrystallization from an ethanol-water mixture. N-methyl- benzimidazolone was prepared by refluxing equimolar amounts of dimethyl sulphate, sodium bicarbonate and 2-(3H)-benzimidazolone in an acetone medium. The purity of the compounds was shown by the existence of similar fluorescence bands on excitation at various wavelengths. BDH spec- trograde methanol and analytical grade H2S04 and NaOH (BDH) were used as received. AnalaR grade acetonitrile (Merck), cyclohexane, ether (BDH) and ethanol were further purified using methods described in the literature [ll]. Triple-distilled water was used to prepare the aqueous solutions. The modified Hammett acidity scale Ho [ 12) for H2S04-HZ0 mixtures and the Yagil basicity scale H_ [13] for NaOH-HZ0 mixtures were used for solutions below pH 1 and above pH 13 respectively. Hammett’s acidity and basicity functions [ 121 represent the number of actual (or free) proton or hydroxyl ions available in the solution for reaction with a weak base or a weak acid respectively.
The absorption spectra were recorded using a Cary 17D spectropho- tometer. The fluorescence measurements were made using a scanning spectrofluorometer fabricated in our laboratory which is described in detail in ref. 14. pHs in the range 1 - 13 were measuied using a Toshniwal model

437
CL-44A pH meter. The bandwidth of the excitation radiation was 8 nm. The solutions for the absorptiometric and fluorometric titrations were prepared just before making the measurements. The concentrations of the solutions were of the order of 10U4 M. In the fluorometric titrations isosbestic wave- lengths were used to excite the various species in equilibrium, and the values for the dication-monocation and neutral-anion equilibria were 272 nm and 277 nm respectively. No clear-cut isosbestic point was observed for the neutral-monocation equilibrium, and thus a wavelength of 286 nm, which represents the closest point between the absorption spectra of the two species, was chosen. Anthracene (QO = 0.31 [15]) in ethanol was used as the standard for measuring the quantum yields, and the & values for BIOH were calculated for an excitation wavelength of 280 nm.
3. Results and discussion
3.1. Effect of solvents on absorption and fluorescence spectra The absorption and fluorescence spectra of BIOH were recorded at
298 K in various solvents (except n-heptane and cyclohexane in which it was insoluble). The spectra obtained in ether are shown in Fig. 2. The h,,, values, extinction coefficients and quantum yields are listed in Table 1. The
285 31s
Wavelength lnml +
Fig, 2. Absorption and fluorescence spectra of 2-(3H)-benzimidazolone ( -) and its N-methyl derivative (- . -) in ether at 298 K (concentration, 1.0 x lo4 M).

438
TABLE 1
Absorption and fluorescence maxima, log emax and @f of Z-hydroxybenzimidazole various solvents at various pHs
in
Solvent
Ether
Acetonitrile
Ethanol
Methanol
Water
10 M HzS09
18 M H$804
10 M NaOH
Amdabs) (nm)
291 285 281 227
281.5 224
281 223
280 223
275 222
273 267 261 220
279 271 266 235
285 237
0.36
log emax bnax(flu) 9r (nm)
3.73 310
3.70
3.89 307.5 3.83
3.89 307.5 3.85
3.90 306.5 3.85
4.01 305 4.02
4.00 4.00 -
4.13
4.02 293.5 4.02 -
3.93
4.07 4.20
0.34
0.31
0.44
data in Table 1 show that, except in ether, the absorption spectrum is broad and the long-wavelength band system is slightly blue shifted with increasing polarity or tendency to form hydrogen bonds. The fluorescence spectrum, which is a broad band under the above conditions, follows the same trend, i.e. hmax(flu) is blue shifted, The quantum yield increases with increasing tendency for hydrogen.bond formation in the solvents.
The benzimidazole molecule has two band systems, one at 265, 271 and 278 nm, and the other at 242 nm [ 16 - 181. These band systems are red shifted in the presence of electron-donating substituents. It is also known that the former band system is localized on the benzene ring and the latter band system is localized on the imidazole ring [19]. Thus the substituents in the carbocyclic ring will affect the former band system, whereas the substituent in the heterocyclic ring will affect the latter band system. The additional hydroxyl group substituted in the heterocyclic ring is an electron donor and thus both band systems should be red shifted with respect to the benzimidazole molecule (as both the band systems are due to x+1* transitions); the short-wavelength system undergoes the greater
439
shift. The results shown in Table 1 indicate that the long-wavelength band system is shifted bathochromically whereas the short-wavelength system is shifted hypsochromically with respect to benzimidazole band systems in a given solvent. This anomaly can be explained as follows. As stated earlier BIOH is known to exist mostly in the tautomeric form 2-(3H)-benzi- midazolone (II) as is shown by the IR spectrum. Species II can be viewed as the benzene molecule with two amino groups in the ortho position. The effect of these substituents on the 257 nm and 200 nm bands origi- nating from the benzene ring can be calculated using relations given by Stevenson [20]. These absorption maxima should be at about 289 nm and 245 nm respectively.
Both the band systems agree well with the experimental values, but it would have been better if the BIOH had been soluble in non-polar solvents where the structure, if any, in the absorption spectrum would be clearly visible. The absorption spectra of N-methyl-2-(3H)benzimidazolone in various solvents are listed in Table 2, and the spectrum of this compound in ether is shown in Fig. 2. Fortunately, this derivative is soluble in non-polar solvents. Both band systems show a clear vibrational pattern which is slightly red shifted with respect to BIOH (II) as expected (the methyl group is an electron donor). The vibrational frequencies contributing to the electronic motion are 425 cm-’ and 770 cm-’ which are characteristic of the benzene ring system, thus confirming that both bands originate from the benzene
TABLE 2
Absorption and fluorescence maxima for N-methyl-2-(3H)-benzimidazolone in various solvents at various pHs at 298 K
Solvent
n-Heptane
Ether
Acetonitrile
Methanol
Water
18 M HzS04
10 M HzS04
10 M NaOH
293, 287, 281.5,276 312 246, 237.5, 233
292, 287,283,228 308
282 312 227
280 309 226
278 310 224
277, 271, 265, 294 235
272,266,260, -
222
278 310 225
440
ring. This also provides an explanation of the blue shift observed in the absorption spectra obtained in the hydrogen-donating solvents relative to the spectra obtained in non-polar solvents because solvents which form hydrogen bonds will prevent the lone pairs of the > N-H groups from taking part in the charge transfer interaction as K + x* is the lowest energy transition. The short-wavelength band system could also be due to the n + a* transition of the carbonyl group which has a similar location to that in urea; however, this band system occurs at about 205 nm with a much lower extinction coefficient, thereby confirming the earlier conclusion.
The fluorescence spectra of BIOH in various solvents confirm the presence of species II in the first excited singlet state and also the assignment of the two bands as explained earlier, thus indicating that the solvent mole- cules act as hydrogen donors. A further slight increase in the Stokes shift (the difference between the absorption and fluorescence maxima) with in- creasing polarity and hydrogen bond formation tendency of the solvents indicates that the molecule is slightly more polar in the S1 state than in the So state. This is further confirmed by the fluorescence spectra of the N- methyl derivative of BIOH in various solvents (Table 2) which are slightly red shifted compared with the BIOH spectra in these solvents.
3.2. Effect of pH The absorption and fluorescence spectra of BIOH were investigated
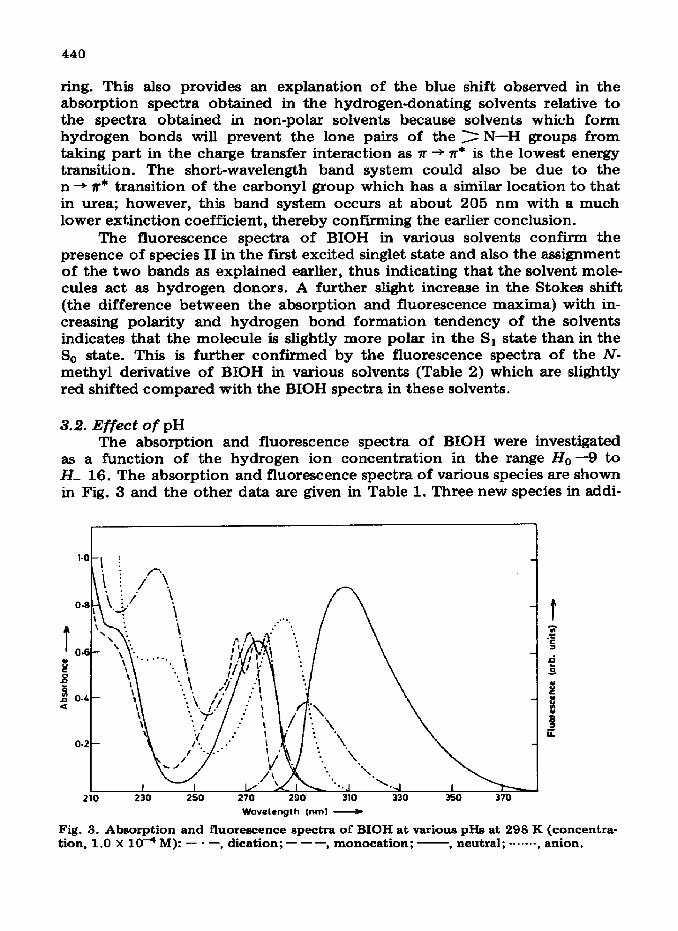
as a function of the hydrogen ion concentration in the range Ho -!3 to EL_ 16. The absorption and fluorescence spectra of various species are shown in Fig. 3 and the other data are given in Table 1. Three new species in addi-
210 230 250 270 290 310 330 370 Wowlength (nml _
Fig. 3. Absorption and fluorescence spectra of 3IOH at various pHs at 298 K (concentra- tion, 1.0 x 10⁴M): - - -, dication; - - -, monocation; -, neutral; -...-.., anion.
441
tion to BIOH are observed in the absorption spectrum whereas only one species contributes to the fluorescence spectrum. On decreasing the pH below 7 a blue-shifted structured absorption band system, which could be due to the formation of the monocation, appears at Z& -2.24. On further increasing the hydrogen ion concentration, the structured band system shifts to a longer wavelength with no change in the bandshapes and could be due to the dication. A broad structureless red-shifted band system which appears at higher pHs (pK, = 11.85) may be due to the monoanion. As stated earlier, only the dication species emits with a broad band maximum at 293 nm which is blue shifted compared with that of the neutral species.
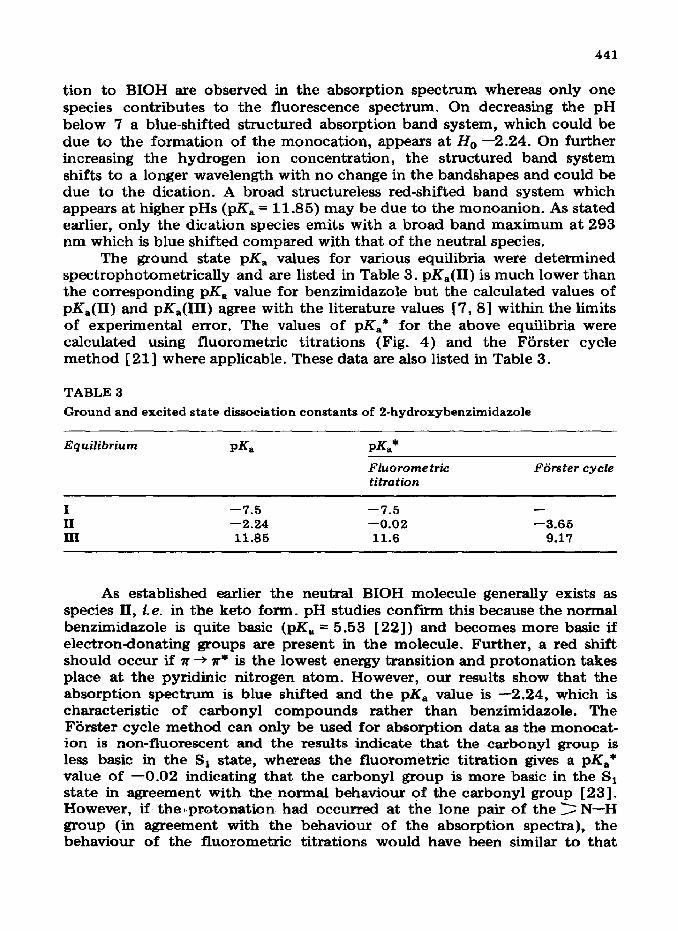
The ground state pK, values for various equilibria were determined spectrophotometrically and are listed in Table 3. p&,(U) is much lower than the corresponding pK, value for benzimidazole but the calculated values of p&(11) and pKa(III) agree with the literature values [7, 81 within the limits of experimental error. The values of pKa * for the above equilibria were calculated using fluorometric titrations (Fig. 4) and the FBrster cycle method [21] where applicable. These data are also listed in Table 3.
TABLE 3
Ground and excited state disociation constants of 2-hydroxybenzimidazole
Equilibrium l-J&I P&*
Fluorome tric titration
FZirster cycle
I -7.5 -7.5 -
II -2.24 -0.02 -3.65 III 11.85 11.6 9.17
As established earlier the neutral BIOH molecule generally exists as species II, i.e. in the keto form. pH studies confirm this because the normal benzimidazole is quite basic (pK, = 5.53 [22]) and becomes more basic if electrondonating groups are present in the molecule. Further, a red shift should occur if R + 7~* is the lowest energy transition and protonation takes place at the pyridinic nitrogen atom. However, our results show that the absorption spectrum is blue shifted and the pK, value is -2.24, which is characteristic of carbonyl compounds rather than benzimidazole. The F&&r cycle method can only be used for absorption data as the monocat- ion is non-fluorescent and the results indicate that the carbonyl group is less basic in the S1 state, whereas the fluorometric titration gives a pK,* value of -0.02 indicating that the carbonyl group is more basic in the S1 state in agreement with the normal behaviour of the carbonyl group [ 231. However, if thei,.protonation. had occurred at the lone pair of the > N-H group (in agreement with the behaviour of the absorption spectra), the behaviour of the fluorometric titrations would have been similar to that
442
Fig. 4. Plot of Z/Z,-, us. pH for BIOH at 298 K.
of the ammonium ion [ 24 - 261, i.e. proton-induced quenching of the neutral molecule followed by the appearance of the ammonium ion indi- cating that it is more acidic in the S1 state. At the other extreme, if we assume that the fluorometric titration follows this behaviour there should be no change in the absorption spectrum on further increasing the hydrogen ion concentration, whereas we do observe a change. In general the fluorometric titrations provide a better description of equilibrium in the singlet excited state if it is established. Thus, as shown in Fig. 1, the first protonation takes place at the carbonyl group.
The second addition of H+ to the BIOH molecule at very high acid concentrations could be due to the protonation of the oxygen atom of the hydroxyl group after rearrangement of the monocation. This equilibrium is shown in Fig. 1. The red shift observed in the absorption spectrum on protonation could be due to the restoration of the aromatic character (benzimidazole molecule) which plays a major role. The long-wavelength absorption and the short-wavelength band system resemble those of the parent benzimidazole molecule. The pK, value, which is calculated to be -7.5, is obtained spectrophotometrically, whereas the fluorometric titration gives the ground state pK, value. The Fiirster cycle method could not be used because (i) the monocation is non-fluorescent and (ii) the configuration of the molecule changes during the second protonation. From the above results it is clear that either the acidity constant of the dication species is
443
the same in the Si and So states or the equilibrium is not established within the lifetime of the S1 state.
The deprotonation of BIOH at higher pHs seems to be taking place from the > N-H group followed by rearrangement as shown in Fig. 1. This can be supported by the following observations: the absorption spectrum of the anion resembles that of the parent molecule (i.e. X,,, at 285 nm and 237 nm) although it is broadened; (ii) the deprotonation constant of the pyrrolic group in imidazole is 14.52 [ 221. It is reduced by the presence of electron-withdrawing groups and increased by the presence of electron- releasing groups. The pK, value of 11.85 is quite consistent with the above reasoning. The argument against deprotonation from the hydroxy group is that similar species are generally fluorescent; extended sigmoidal fluoro- metric titration curves giving both the ground and excited state p&s are observed and the hydroxy groups are more acidic in the S1 state. In the present case the anion is non-fluorescent, and the midpoint of fluorescence quenching is observed at pK, 11.6 which is close to the ground state value. This is characteristic of deprotonation from the pyrrolic nitrogen atom and has been observed in many other similar compounds [ 27 - 301. This be- haviour can be explained using similar arguments to those put forward for dication-monocation equilibria. The Fijrster cycle method could only be applied to the absorption data and as expected indicated that the pyrrolic group becomes more acidic in the S1 state.
The prototropic behaviour of N-methylbenzimidazolone was similar to that of benzimidazolone: (i) as expected the deprotonation constant was greater than 15; (ii) the monocation was non-fluorescent; (iii) the dication- monocation equilibrium shifted to a lower value. This is because of the presence of the electron-donating methyl group which makes the molecule more basic or less acidic.
The complete acid-base equilibria can be represented as shown in Fig. 1 and the following conclusions can be drawn.
(i) The neutral BIOH molecule is present mainly in the keto form (I!). (ii) The first protonation takes place at the carbonyl group (III). (iii) The second protonation takes place at the hydroxyl group (IV)
after rearrangement of III. (iv) The monoanion (IV) is formed from the deprotonation of the
> N-H group followed by rearrangement.
References
1 S. G. Schulman, A. C. Capomacchia and 8. Tussey, Photochem. Photobio?., 14 (1971) I 733, and references cited therein.
2 G. F. Tucker and J. L. Irvine, J. Am. Chem. Sot., 73 (1951) 1923. 3 J. HeIler, Prakt. Chem., 111 (1925) 1. 4 J. Elbs, Prakt. Chem., 83 (1911) 21. 5 L. Monti and M. Venturi, Gez. Chim. ItaL. 76 (1946) 365; Chem. Abstr., 42 (1948)
1261e.

444
6 L. 6. Efros, B. A. Porai-Koshits and S. G. Fardenshtum, J. Gen. Chem. U.S.S.R., 23 (1953) 1691.
7 L. S, Efros and A. V. Eitsov, J. Gen. Chem. U.S.S.R., 27 (1957) 755. 8 D. Brown, J. Chem. SW., (1958) 1974. 9 D. Harrison, J. T. Ralph and A. C. B. Smith, J. Chem. Sot., (1963) 2930.
10 D. Harrison and A. C. B. Smith, J. Chem. Sot., (1959) 3157. 11 J. A, Riddick and W. B. Bunger, Organic Solvents, Wiley-Interscience, New York,
1970, pp. 592,803. 12 M. J. Jorgenson and D. A. Hartter, J. Am. Chem. Sot., 85 (1963) 878. 13 G. Yagil, J. Phys. Chem., 71 (1967) 1034. 14 M. Swaminathan and S. K. Dogra, Indian J. Chem., 22A (1983) 853. 15 G. G. Guilbault, Practical Fluorescence, Dekker, New York, 1971, p. 13. 16 T. K. Alder and A. Albert, J. Chem. Sac., (1960) 1794. 17 S. F. Mason, J, Chem. Sot., (1954) 2071. 18 F. C. Fisher and M. M. Joullie, J. Org. Chem., 23 (1958) 1944. 19 P. N. Preston, Chem. Heterocycl. Compd., 40 (1981) 64. 20 P. E. Stevenson, J, Mol. Spectrosc., 15 (1965) 220. 21 Th. Fijrster, 2. Elektrochem., 64 (1950) 577. 22 C. A. Matuszak and A. J. Matuszak, J. Chem. Educ., 53 (1976) 280. 23 J. F. Ireland and A. A. H. Wyatt, in V. Gold and D. Bethell (eds.), Adwnces in
Physical Organic Chemistry, Academic Press, New York, 1976, p. 159. 24 M. Swaminathan and S. K. Dogra, Can. J. Chem., 61 (1983) 1064. 25 M. Swaminathan and S. K. Dogra, J. Am. Chem. SCM., 105 (1983) 6223. 26 A. K. Mishra and S. K. Dogra, J. Photochem., 23 (1983) 163, and references cited
therein, 27 M. Swaminathan and S. K. Dogra, J. Photochem.. 21 (1983) 245. 28 M. Swaminathan and S. K. Dogra, Zndh J. Chem., 22A (1983) 278. 29 M. Swaminathan and S. K. Dogra, Indian J. Chem., 22A (1983) 407. 30 A. K. Miihra and S. K. Dogra, Spectrochim. Acta, Part A, 39 (1983) 609.