Proteomics Using Thermo Scientific Orbitrap Velos Pro...
57
Proteomics Applications Using Thermo Scientific Orbitrap Velos Pro and Elite Technology Julian Saba, Ph. D. Proteomics Marketing
-
Upload
phamkhuong -
Category
Documents
-
view
218 -
download
2
Transcript of Proteomics Using Thermo Scientific Orbitrap Velos Pro...

Proteomics Applications Using Thermo Scientific
Orbitrap Velos Pro and Elite Technology
Julian Saba, Ph. D.
Proteomics Marketing

2
New Ion Trap Hybrids Line up
Velos Pro
Velos Pro Orbitrap
Orbitrap Elite

3
Orbitrap Elite: What is new?

4
The “rotated quadrupole” with internal beam blocker
To prevent material from building up on the rods, the quadrupole has been rotated 450. This opens up a new line of sight for the neutral beam.
A beam blocker is now able to capture the neutral beam out side the body of the ion optics!

5
Orbitrap Elite: What is new?

6
Original Orbitrap and High Field Orbitrap Real Size Cutaways
Orbitrap Elite
• LTQ Orbitrap Classic/XL/Discovery/Velos(Pro) • (Q)Exactive
30 mm
20 mm
7
Orbitrap Elite: What is new?

8
Orbitrap Elite vs Orbitrap Velos Pro: Resolution and Scan Rate
Res Setting OT Velos Pro
Res Setting OT Elite
Transient [ms] Hz
15 48 7.7
7.5 30 96 6.9
15 60 192 4.0
30 120 384 2.3
60 240 768 1.2
100
Orbitrap Elite scans 4x faster

Intact protein Analysis: Increased Resolution & Scan Speed

10
Intact Protein Analysis Example: Yeast Enolase (48 kDa)
993.0 993.5 994.0 994.5 995.0m/z
0
20
40
60
80
100
0
20
40
60
80
100
Rel
ativ
e A
bund
ance
993.9770R=110221
994.1036R=108475
993.8706R=107582
994.1885R=109018993.6367
R=108853993.0619R=109083 994.4433
R=105946993.4244R=99350 994.7200
R=109283994.9536R=98949
994.0309R=44604
993.9030R=42104
994.1802R=42804
994.4540R=52804
993.5618R=47304
993.7112R=35704
994.6257R=37604
993.1357R=42304 994.8610
R=32404
Orbitrap Elite
Yeast Enolase, 48+ is baseline resolved on Orbitrap Elite
At 48+ charge state, the mass difference between isotopic
peaks is only 0.021 Th!
Resolution 240000 @ m/z 400 ASMS 2011 Poster MP560 Eugen Damoc et al.
LTQ Orbitrap Velos

11
p [ ]
1800 2000 2200 2400 2600 2800 3000 3200 3400 3600 3800 4000m/z
0
10
20
30
40
50
60
70
80
90
100
Rel
ativ
e A
bund
ance
2764.2671
2664.4394
2868.56902577.0048
2923.7365
2981.00482494.9572
3041.4999
2375.89823106.6316
3167.88452304.1492
3238.36892203.6507
3308.20122141.6352
3459.08842083.1451 3541.8014
3713.17371999.2710
3903.46531922.8909
1812.5986
IgG Analysis: LTQ Orbitrap Velos
Orbi Velos @ 7500 R

12
p [ ]
2800 2820 2840 2860 2880 2900 2920 2940 2960 2980m/z
0
10
20
30
40
50
60
70
80
90
100
Rel
ativ
e A
bund
ance
2812.4963
2868.5690
2923.73652818.6130
2981.0048
2874.4566
2929.7660
2863.1899
2824.3500
2975.0731
2880.71032936.0629
2807.08522915.3615
2830.3113
2887.2751
2943.60072835.8760
2857.1025
2950.8097
2969.3184
2898.5573
Glycoforms
LTQ Orbitrap Velos: Raw Spectrum zoom-in

13
gG e5_ 0u_ 5 _ 5e _tube e s 0_ e g ad e t _ t # 60 6 6 08T: FTMS + p ESI sid=45.00 Full ms [1000.00-4000.00]
2000 2100 2200 2300 2400 2500 2600 2700 2800 2900 3000 3100 3200m/z
0
5
10
15
20
25
30
35
40
45
50
55
60
65
70
75
80
85
90
95
100
Rel
ativ
e Ab
unda
nce
2815.46
2764.32
2712.06 2865.55
2667.31
2923.732621.38
2576.95
2981.072533.99
2492.48
2452.32 3043.83
2413.38
3102.662336.652269.39
3171.552021.95 2201.192113.94 3242.36
Orbitrap Elite @15000 R
IgG Analysis: Orbitrap Elite

14
gG e5_ 0u_ 5 _ 5e _tube e s 0_ e g ad e t _ t # 60 6 6 08T: FTMS + p ESI sid=45.00 Full ms [1000.00-4000.00]
2700 2720 2740 2760 2780 2800 2820 2840m/z
0
5
10
15
20
25
30
35
40
45
50
55
60
65
70
75
80
85
90
Rel
ativ
e A
bund
ance
2764.32
2812.502712.06
2818.46
2767.26
2717.81
2809.50 2821.412770.14
2758.432709.18 2720.76
2824.332772.92
2723.442827.19
2776.04 2806.652725.972706.35 2778.93 2830.23
2755.61 2781.592731.80 2833.482783.65 2837.78
2737.41 2791.22 2844.442742.66
2804.11
Orbitrap Elite: Raw Spectrum zoom-in
Glycoforms – Δm = 162 Da

15
OT Elite IgG ReSpect Deconvoluted Spectrum

Top Down Proteomics: Increased Resolution & Scan Speed

17
OT Elite: Top Instrument for High-Throughput Top-Down Proteomics
Triosephosphate isomerase identified in Fraction 4
Elite_Fraction4_Multifrag_HRuscan #415 RT: 34.41 AV: 1 NL: 3.28E6T: FTMS + p NSI sid=15.00 Full ms [580.00-1200.00]
808.6 808.7 808.8 808.9 809.0 809.1 809.2 809.3 809.4m/z
0
5
10
15
20
25
30
35
40
45
50
55
60
65
70
75
80
85
90
95
100
Rel
ativ
e A
bund
ance
808.9511R=76804
z=?
809.0414R=78404
z=?809.0116R=78004
z=? 809.0728R=78504
z=?808.9219R=81804
z=?
808.8901R=77404
z=?
808.8576R=74704
z=?809.1611R=78404
z=?808.6457R=75504
z=?809.1941R=82904
z=?808.7987R=78204
z=?808.6741R=76504
z=?809.2858R=71304
z=?809.4310R=59304
z=?
z=33
26000 26500 27000 27500m/z
26647.1093
27611.3024
Theoretical MW: 26647.9 Da Observed MW: 26647.1 Da (30 ppm)
Intact mass analysis: single spectrum, 8 uscans, 120K resolution, 1e6 target
18
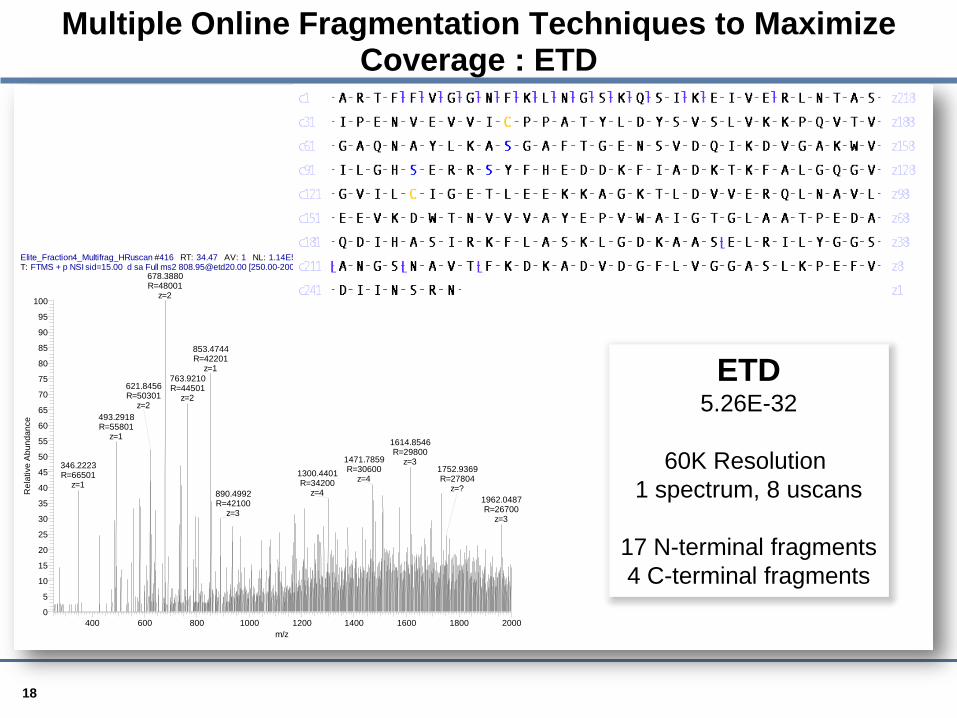
Multiple Online Fragmentation Techniques to Maximize Coverage : ETD
Elite_Fraction4_Multifrag_HRuscan #416 RT: 34.47 AV: 1 NL: 1.14E5T: FTMS + p NSI sid=15.00 d sa Full ms2 [email protected] [250.00-2000.00]
400 600 800 1000 1200 1400 1600 1800 2000m/z
0
5
10
15
20
25
30
35
40
45
50
55
60
65
70
75
80
85
90
95
100
Rel
ativ
e A
bund
ance
678.3880R=48001
z=2
853.4744R=42201
z=1763.9210R=44501
z=2
493.2918R=55801
z=1
621.8456R=50301
z=2
1614.8546R=29800
z=31471.7859R=30600
z=4346.2223R=66501
z=11300.4401R=34200
z=4890.4992R=42100
z=31962.0487R=26700
z=3
1752.9369R=27804
z=?
ETD 5.26E-32
60K Resolution
1 spectrum, 8 uscans
17 N-terminal fragments 4 C-terminal fragments

19
Multiple Online Fragmentation Techniques to Maximize Coverage: CID
Elite_Fraction4_Multifrag_HRuscan #417 RT: 34.54 AV: 1 NL: 2.12E5T: FTMS + p NSI sid=15.00 d Full ms2 [email protected] [345.00-2000.00]
400 600 800 1000 1200 1400 1600 1800 2000m/z
0
5
10
15
20
25
30
35
40
45
50
55
60
65
70
75
80
85
90
95
100
Rel
ativ
e A
bund
ance
642.1894R=48700
z=6
852.9782R=42600
z=4
696.7204R=46800
z=6
939.5015R=40304
z=?1010.8760R=40400
z=9603.3262R=50301
z=1
490.2410R=55601
z=1
819.9543R=41504
z=?
1073.2867R=37800
z=7
1205.5079R=34804
z=?
1478.7678R=34204
z=?
CID 1.02E-16
60K Resolution
1 spectrum, 8 uscans
10 N-terminal fragments 7 C-terminal fragments

20
Elite_Fraction4_Multifrag_HRuscan #418 RT: 34.60 AV: 1 NL: 5.26E5T: FTMS + p NSI sid=15.00 d Full ms2 [email protected] [100.00-2000.00]
200 400 600 800 1000 1200 1400 1600 1800 2000m/z
0
5
10
15
20
25
30
35
40
45
50
55
60
65
70
75
80
85
90
95
100
Rel
ativ
e A
bund
ance
909.4910R=38404
z=?
852.7272R=42200
z=4341.1480R=66201
z=1 490.2405R=55101
z=1
1073.2867R=37900
z=7
603.3255R=50001
z=1
770.4262R=44500
z=5
159.0918R=98201
z=1
961.5106R=38404
z=?
227.1043R=81304
z=?1136.6349R=36600
z=3
1303.6727R=33501
z=11565.9489R=27904
z=?
HCD 3.21E-26
60K Resolution
1 spectrum, 8 uscans
14 N-terminal fragments 14 C-terminal fragments
Multiple Online Fragmentation Techniques to Maximize Coverage : HCD

21
Combined ETD, CID, and HCD Fragments Improves Sequence Coverage
More than sufficient fragmentation to identify the protein and determine isoform on online timescale
Triosephosphate isomerase

22
Work Flow for Top Down Proteomics
High-throughput search using ProSightPC
yeast cell lysate
(200 – 500 μg)
reduced/ denatured
–
+
GELFrEE intact protein fractionation
10kDa
25kDa
Keys to this sample preparation: • Samples are free of contaminants which affect the success of MS experiments • Samples are separated by molecular weight – this permits developing MS acquisition methods specific to the size of the proteins in each fraction •Orbitrap Elite is the first mass spectrometer that makes high-throughput top-down proteomics possible.
Sample clean up (SDS removal)
ASMS 2011, TP560 Shannon Eliuk et al

Quantitative proteomics: Increased Accuracy & Precision

24
• Quantitative cellular proteomics - SILAC
− Improved MS resolution without loss in cycle time for improved detection of co-eluting isobars for more accurate precursor-based quantitation.
Orbitrap Elite : New Standard for Proteomics Performance

25
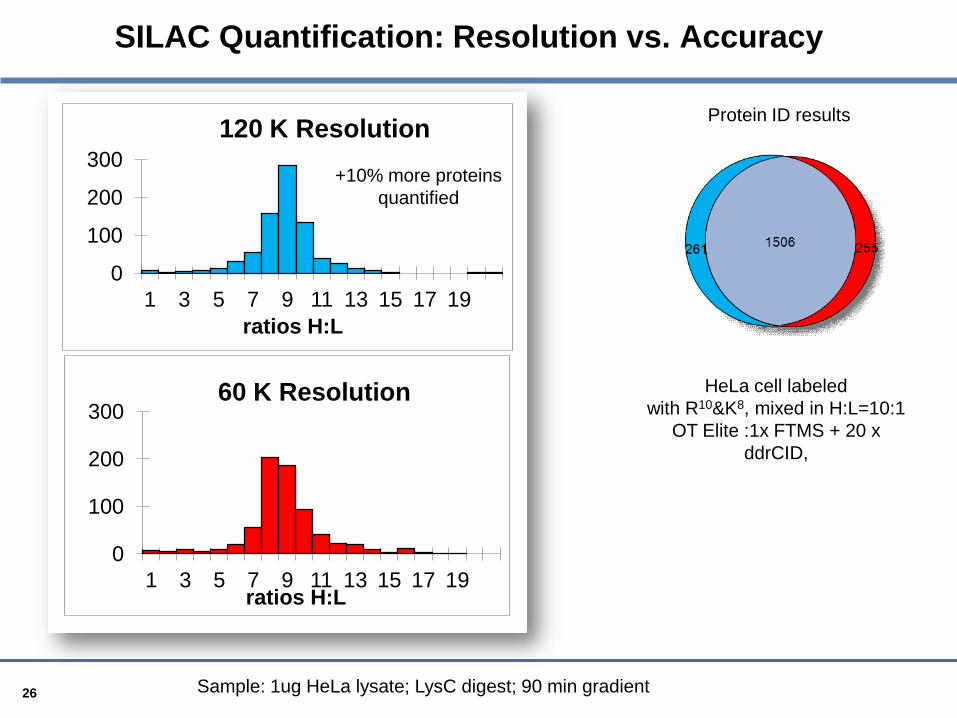
SILAC Quantification: Resolution vs. Accuracy
>100,000 resolution = distinct
30,000 resolution = indistinct
Distinct XICs for high-specificity quantitation ±2 ppm
-6 -4 -2 0 2 4 6 8
1E+3 1E+4 1E+5 1E+6 1E+7 1E+8 1E+9
Log2
(H/L
)
Area Light
Log2(H/L) vs. Area L
Median …
B.
Four orders of magnitude for 1:10 ratio
26
0
100
200
300
1 3 5 7 9 11 13 15 17 19 ratios H:L
120 K Resolution
0
100
200
300
1 3 5 7 9 11 13 15 17 19 ratios H:L
60 K Resolution
+10% more proteins quantified
SILAC Quantification: Resolution vs. Accuracy
HeLa cell labeled with R10&K8, mixed in H:L=10:1
OT Elite :1x FTMS + 20 x ddrCID,
Protein ID results
Sample: 1ug HeLa lysate; LysC digest; 90 min gradient

27
• Quantitative cellular proteomics - isobaric labeling
− Faster HCD scan rate for increased number of identified peptides in isobaric labeling experiments.
Orbitrap Elite : New Standard for Proteomics Performance

28
TMT- Tandem Mass Tags
• A family of amine reactive isobaric MS/MS tags based on an identical chemical structure
*
* 127 Da
126 Da
TMT2 - Two Plex Quantitation TMT6 - Six Plex Quantitation
* * * * *
*
* *
* *
* *
* * *
* * * *
*
*
* *
* *
* * * * *
126 Da 129 Da
127 Da 130 Da
131 Da 128 Da

29
TMT- Tandem Mass Tags- Reporter based quantification

30
Sample Load
Orbitrap Elite LTQ Orbitrap Velos
# proteins # unique peptides
# quantified peptides # proteins # uniqued
peptides # quantified
peptides
20 ng 703 4032 4805 563 3495 3993
80 ng 873 5078 5888 694 4309 5006
500 ng 939 6531 7517 782 4853 5978
+25%
Identification data shown for 1%FDR, mean of 2 runs E.coli digest:
TMT quantification: Speed and Sensitivity of MS2

31
Nine Protein Mix in E.coli Digest
Sample Number of unique peptides
Number of protein groups
Number of quantified peptides
E.Coli 5425*/4068** 923/703 6385/5019
9 proteins 271/254 9/9
551/448
E.coli+9 proteins
5696/4322 932/ 712
6936/5467
*Orbitrap Elite results, **Orbitrap Velos
+30%

32
HCD spectra of TMT labeled E.coli peptide, 40 ng
Ion score 47, Scan time 0.20s
Ion score 50, Scan time 0.33s
OT Elite
OT Velos

Targeted Protein Quantitation Using HR/AM SIM

34
a 100-amu wide SIM significantly improves both S/N and peak area, even with only half of the peptide amount loaded on the column.
Comparison of detection limits between full-scan and a SIM MS
Full MS (300-1200 amu) 20 fmol on column ELASGLSFPVGFK*
SIM MS (590 - 690 amu) 10 fmol on column ELASGLSFPVGFK*
Area 102 851 185 S/N = 37
Area 254 577 118 S/N = 94

35
Targeted Peptide Quantitation Workflow on an Orbitrap Elite/Velos Pro Orbitrap Instrument
Multiple HR/AM SIM scans which have 100 – 200 amu isolation windows are used for quantitation of targeted
peptides.
An additional data independent ms/ms scan
using time scheduled global ms/ms list is used
for simultaneously targeted peptide verification in one
HPLC MS run. √

36
OT Elite Provides More Scan Points Across Peak
Res: 60000
Res: 30000
9 scans across the peak for quantitation
5 scans across the peak for quantitation
Orbitrap Elite
LTQ Orbitrap Velos

37
Comparison of analytical precision Orbitrap Elite vs LTQ Orbitrap Velos
All the targeted peptides had CVs below 15% and 96% of the targeted peptides had CVs below 10%.

38
Dilution Curve for Peptide SSAAPPPPPR
The LOD for the spiked isotopically labeled peptides was 10 attomole and showed four orders of the linear
dynamic range with good analytical precision.

PTM Analysis:
Complementary Fragmentation Techniques

40
Why Are Glycopeptides So Difficult To Analyze By Mass Spectrometry?
• Conventional CAD preferentially cleaves glycosidic bonds or peptide-glycan linkages
• Modifications are often highly heterogeneous • May dilute the peptide signal compared to nonglycosylated peptides
CAD Hex5HexNAc4Neu5Ac2
P
Neu5Ac Hex2HexNAc
HexHexNAc
HexHexNAcNeu5Ac
Hex2HexNAcNeu5Ac
P-HexNAc+2
P-Hex2HexNAc2+2
P-Hex2HexNAc3+2
P-Hex4HexNAc3+2
P-Hex4HexNAc3Neu5Ac+2
P-Hex3HexNAc3Neu5Ac+2
P-Hex3HexNAc3+2
P-Hex4HexNAc3Neu5Ac+3

41
Glycoproteomic Strategies
Pan, S. et al., MCP
Partial information
Complete information

42
CAD: glycan composition identification
ETD: peptide/glycosylation site identification
Glycopeptide identification requires CAD and ETD
Hex5HexNAc4Neu5Ac2
P
Neu5Ac
HexHexNAc
Hex2HexNAc
HexHexNAcNeu5Ac
Hex2HexNAcNeu5Ac
P-Hex5HexNAc4Neu5Ac+4
P-HexNAc+2
P-Hex4HexNAc3Neu5Ac+3
P-Hex4HexNAc5Neu5Ac+3
P-Hex2HexNAc2+2
P-Hex3HexNAc3+2
P-Hex4HexNAc3Neu5Ac+2
Serotransferrin T421-433

43
Countless Possibilities for PTM analysis
Instrument Fragmentation
Method Acquisition
Method
LTQ Family CID/PQD MSn NL MS3, MSA
LTQ ETD Family + ETD
+NL ETD, CID/ETD, DDDT
Orbitrap ETD Family + HCD
+HCD/ETD, NL(product)
ETD
‘Pick and Mix’ method setup
44
Discovery of Glycopeptides
Traditional approaches: • In source decay- Pseudo-MS3 of Oxonium ions Peterman, S. et al., JASMS (2006) 17, 168-179 • Low mass oxonium ions from HCD(PQD) MS/MS Spectra Snovida, S. et al., Carbohydr Res. (2010) 345, 792-801 Kuster, B. et al., JASMS (2011) 22, 931-942 Glycopeptide’s precursors identified in a post-acquisition fashion !

45
Jebanathirajah, J. et al., JASMS (2003) 14, 777–784
Huddleston, M.J. et al., Analytical Chem. (1993) 65, 877-874.
The Utility of Oxonium Ions – Importance of Mass Accuracy

46
Our Approach- On the Fly Identification of Glycopeptides
HCD Accurate Mass Product Dependent ETD (HCD-PD-ETD)

47
Our Approach- On the Fly Identification of Glycopeptides
• Streamlines data analysis • Improves dynamic range and duty cycle

48
• High Mass Accuracy MS2
• HexNAc oxonium ion is m/z 204.0866 • a2 QC ion is m/z 204.0801 • Δm/z = 32 ppm
• High Resolution MS2
• Orbitrap Elite with MS2 R = 15,000 @m/z 400
Hahne, H. & Kuster,B., JASMS (2011) 22, 931-942
The importance of resolving power

49
0 10 20 30 40 50 60 70 80 90 100 110 120 Time (min) 0
10
20
30
40
50
60
70
80
90
100
0
10
20
30
40
50
60
70
80
90
100
Rel
ativ
e A
bund
ance
47.22 425.287
55.74 498.311 34.05
317.277 47.85 672.879 57.23
578.836 32.03 369.214 75.13
736.982 62.83
761.094 26.75 303.261 78.58
811.488 105.65 306.292 85.47
613.885
111.47 338.344
88.68 599.978
1.94 525.379
25.27 444.246
19.96 301.687
105.06 732.104
124.15 408.791
40.11 204.084
34.69 204.083
40.67 204.088
48.51 204.085 89.36
204.088
CNFCNAVVESNGTLTLSHFGK
dHex2Hex7HexNAc6Neu5Ac2
Looking for needle in a haystack – Targeting low-abundance glycopeptides
Unenriched 12 protein mixture digest
QNGTLSK
Hex4HexNAc4Neu5AcNeu5Gc dHexHex4HexNAc4Neu5Gc2
Ovomucoid
bAGP
XIC for m/z 204.087 from HCD spectra
Base Peak Chromatogram

50
Looking for needle in a haystack – Targeting low-abundance glycopeptides
0
200
400
600
800
1000
1200
1400
1600
1800
2000
HCD/ETD HCD-PD-ETD0
50
100
150
200
250
# of
gly
cope
ptid
es
HCD/ETD HCD-PD-ETD0
5
10
15
20
25
HCD/ETD HCD-PD-ETD
Total number of ETD Spectra acquired
Number of Glycopeptides
identified Percentage of ETD spectra identified
160
224
SAX enriched human serum glycopeptides

51
Multiple Types of Fragmentation: 50% More Unique Peptides for HCD-CID Combination
Sample: 200 ng HeLa lysate; tryptic digest; 90 min gradient.

52
Phopshopeptide Analysis – ABRF 2010 sPGR study
Total # of phosphopeptides identified 21 out of 23, 0% FP, no enrichment, Instruments: LTQ Velos ETD and LTQ Velos Orbitrap ETD
3 2 16
15 15 12
ETD
CID
HCD
Phosphosites/peptide 1 2 3 4 # of peptides in study 14 5 3 1
Best result was 22 correctly identified phosphopeptides out of 23 with enrichment using LTQ Orbitrap Velos

53
• Glycoproteomics is the study of the profile of glycosylated proteins, i.e. the glycoproteome, in a biological system
• Glycomics is the study of glycome (repertoire of glycans)
Glycomics vs Glycoproteomics

54
Sets of MSn Spectra acquired on Velos Pro
• Glycan structural isomers differentiated using combination of permethylation, MSn and SimGlycan™ • Results shown in next 3 slides, 3 different structural isomers differentiated
1
2
1
3
2

55
Permethylated Ovalbumin Glycans Identified
Structural isomers
differentiated using MSn
• Available through Premier BioSoft
56
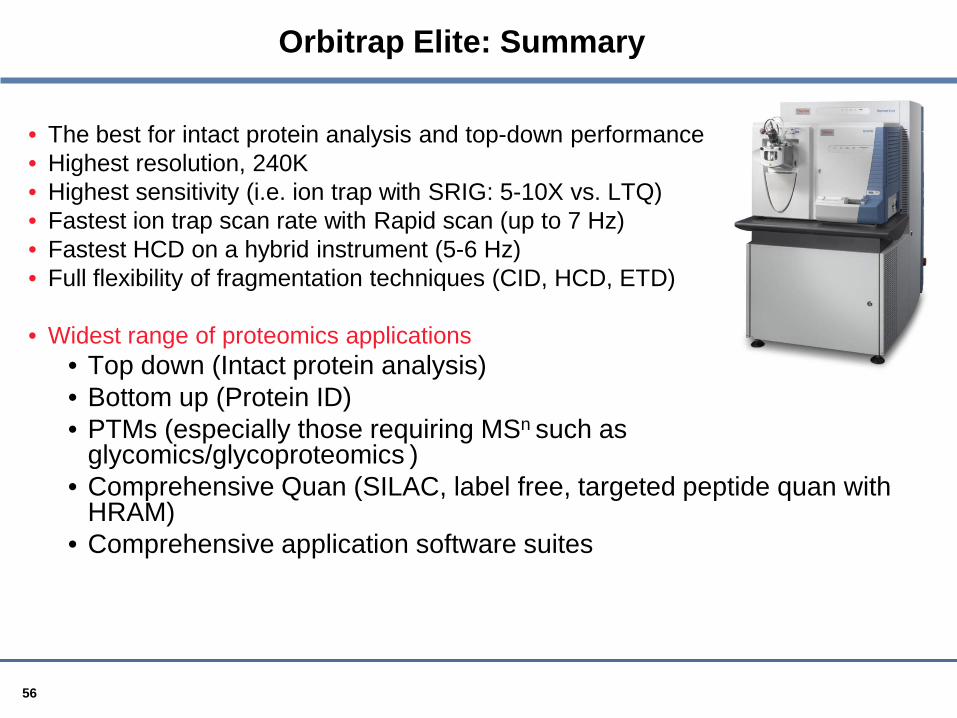
Orbitrap Elite: Summary
• The best for intact protein analysis and top-down performance • Highest resolution, 240K • Highest sensitivity (i.e. ion trap with SRIG: 5-10X vs. LTQ) • Fastest ion trap scan rate with Rapid scan (up to 7 Hz) • Fastest HCD on a hybrid instrument (5-6 Hz) • Full flexibility of fragmentation techniques (CID, HCD, ETD)
• Widest range of proteomics applications
• Top down (Intact protein analysis) • Bottom up (Protein ID) • PTMs (especially those requiring MSn such as
glycomics/glycoproteomics ) • Comprehensive Quan (SILAC, label free, targeted peptide quan with
HRAM) • Comprehensive application software suites

57
Acknowledgments
Thermo Fisher Scientific, San Jose, CA San Jose Proteomics Marketing Team Bremen Orbitrap Elite R&D Team San Jose Velos Pro R&D Team Thermo Fisher Pierce, Rockford, IL