Proteomic screening of cerebrospinal fluid: Candidate ... · PDF fileProteomic screening of...
186
Transcript of Proteomic screening of cerebrospinal fluid: Candidate ... · PDF fileProteomic screening of...


Proteomic screening of cerebrospinal fluid:
Candidate proteomic biomarkers for
sample stability and experimental
autoimmune encephalomyelitis
Therese Rosenling
Paranymphs: Abdou Sar
Berend Hoekman
The work described in this thesis was performed in the research
group Analytical Biochemistry, Faculy of Mathematics and
Natural Sciences, University of Groningen, and within the
graduate school GUIDE. The studies were performed within the
framework of Top Institute Pharma project D4-102.
Sponsors:
The printing of this thesis was financed by TIPharma
Printed by Ipskamp Drukkers B.V., The Netherlands
Cover:
“Midnight-sun at Dundret” Therese Rosenling 2008
RIJKSUNIVERSITEIT GRONINGEN
Proteomic screening of cerebrospinal fluid:
Candidate proteomic biomarkers for
sample stability and experimental
autoimmune encephalomyelitis
Proefschrift
ter verkrijging van het doctoraat in de
Wiskunde en Natuurwetenschappen
aan de Rijksuniversiteit Groningen
op gezag van de
Rector Magnificus, dr. F. Zwarts,
in het openbaar te verdedigen op
maandag 20 december 2010
om 11.00 uur
door
Ann Therese Isabell Rosenling
geboren op 2 oktober 1980
te Malmberget, Zweden

Promotor: Prof. dr. R.P.H. Bischoff
Beoordelingscommissie: Prof. dr. E.M.J. Verpoorte
Prof. dr. S.S. Wijmenga
Prof. dr. J.M. van Dijl
Table of Contents
Scope of the thesis 1
Chapter 1: General Introduction
1. Introduction 5
2. Why use animal models 6
3. Description of the EAE model 8
4. Why proteomic biomarkers 9
5. Body fluids and tissues 11
5.1. Tissues 11
5.2. Blood samples 11
5.3. Cerebrospinal fluid (CSF) 12
5.4. Extracellular fluid (ECF) 13
6. Proteomic biomarker studies in EAE models 14
7. Connections between discriminatory proteins in
EAE and MScl 16
7.1. Inflammation/immunity 19
7.2. Exitotoxicity 20
7.3. Oxitative stress/iron homeostasis 20
7.4. Structure 21
7.5. Other 21
8. Concluding remarks 25
Chapter 2: The effect of pre-analytical factors on
stability of the proteome and selected metabolites in
cerebrospinal fluid (CSF)
1. Introduction 41
2. Material and Methods 42
2.1. Sample set 42
2.2. Design of study 43
2.3. Sample preparation (proteomic analysis) 43
2.4. Chip LC-MS(/MS) proteomic analysis 44
2.5. Data processing of chip LC-MS(/MS) data 46
2.6. MALDI-FT-ICR-MS and Orbitrap LC-MS/MS
proteomic analysis 48
2.7. GC-MS metabolomic analysis 49
2.8. LC-MS analysis of amino acids 50
3. Results and discussion 51
3.1. Effect of delayed time between sample
collection and freezing on the CSF
proteome and metabolome (Delayed Storage) 51
3.2. Effect of freeze/thaw cycles on the CSF
proteome 57
3.3. Effect of storage at 4˚C after digestion on
CSF proteome analysis 59
4. Conclusions 61
Chapter 3: The impact of delayed storage on the
proteome and metabolome of human cerebrospinal
fluid (CSF)
1. Introduction 70
2. Material and Methods 70
2.1. Sample set 70
2.2. ChipLC-QTOF MS proteomic analysis 71
2.3. NanoLC Orbitrap-MS/MS shotgun proteomics
analysis 72
2.4. GC-MS metabolomic analysis 73
2.5. NMR metabolomic analysis 73
2.6. LC-MS/MS amino acid analysis 74
3. Results 74
3.1. Proteomic analysis 75
3.2. Metabolomic analysis 78
4. Discussion 79
Chapter 4: Profiling and identification of Cerebrospinal
Fluid (CSF) proteins in a Rat EAE Model of Multiple
Sclerosis
1. Introduction 89
2. Material and Methods 90
2.1. Induction of acute EAE in the Lewis rat 90
2.2. CSF sampling 92
2.3. Sample preparation 92
2.4. ChipLC-QTOF MS proteomic analysis 93
2.5. ChipLC-QTOF MS data processing 94
2.6. Protein identification (QTOF data) 96
2.7. Nano-LC-ESI-Orbitrap MS/MS 96
2.8. Orbitrap data processing 97
3. Results 98
4. Discussion 106
Chapter 5: The effect of minocycline on the proteome
profile of cerebrospinal fluid from an acute animal
model of multiple sclerosis.
1. Introduction 121
2. Material and Methods 122
2.1. Induction of acute EAE 122
2.2. CSF sampling 123
2.3. Sample preparation 123
2.4. ChipLC-QTOF MS proteomic analysis 123
2.5. ChipLC-QTOF MS data processing 125
3. Results 126
4. Discussion 134
Chapter 6: Summary and future perspectives
Summary and future perspectives 141
Samenvatting 143
Appendices
Appendix 1: Supplementary material Chapter 2 147
Appendix 2: Supplementary material Chapter 4 168
List of publications 173
Acknowledgements 175
1
Scope of the thesis This thesis handles the whole proteome/metabolome screening of cerebrospinal
fluid (CSF). The main focus is the unraveling of the importance of correct sample
handling by the study of stability markers in porcine and human CSF as well as
the exploration of disease markers connected to experimental autoimmune
encephalomyelitis (EAE), modeling the human central nervous system (CNS)
disorder multiple sclerosis (MScl).
Chapter 1 is an introduction to the EAE model. Here the model is
described, and the importance of animal models and biomarker studies is
discussed. The chapter gives an overview of current literature handling proteomic
biomarker studies performed on the EAE model and the translational possibility
to the human disease multiple sclerosis.
In Chapter 2 sample handling procedures are investigated. The proteome
of porcine CSF as well as the metabolome and free-amino acids are screened for
discriminatory differences in abundance after different sample handling
procedures. To mimic a possible clinic situation CSF was left at room temperature
for up to two hours without cellular elements removed. CSF samples were also
exposed to a number of freeze-thaw cycles to mimic the real situation of sample
handling in the laboratory. To imitate the auto-sampler environment, digested
CSF was left at 4 ˚C and analyzed after various time spans to investigate the
quantitative effect on peptides.
Chapter 3 describes a stability study on the proteome, metabolome and
free-amino acids of human CSF left at room temperature for up to two hours after
centrifugation and removal of cellular traces.
Chapter 4 portrays a proteomic biomarker study on CSF from an acute
EAE model in rats. The proteome was screened for disease related markers. The
study was performed on two different platforms with two different data
processing techniques applied on each of the both data sets.
In Chapter 5 a continuation of the study presented in chapter 4 is
described. Here the effect of the tetracycline derivate minocycline is tudied on
previous detected biomarker candidates. The thesis is summed up with
conclusions and future perspectives.

2
Chapter 1
3
General Introduction
The Experimental Autoimmune
Encephalomyelitis model as foundation for
proteomic biomarker studies: From rat to
human.
Therese Rosenling1, Amos Attali2 and Rainer Bischoff1
1Department of Analytical Biochemistry, Centre for Pharmacy University of
Groningen, Groningen, The Netherlands.
2Abbott Healthcare Products B.V., Weesp, the Netherlands
Manuscript in preparation
The EAE model as foundation for proteomic biomarker studies
4
Abstract
Multiple sclerosis (MScl) is defined by central nervous system (CNS)
inflammation, demyelination and axonal damage. Some of the disease
mechanisms are known but the cause of this complex disorder stays an enigma.
Experimental autoimmune encephalomyelitis (EAE) is an animal model
mimicking many aspects of MScl, developed in order to study the pathology in
more detail. This review aims to describe the EAE model and the proteomic
biomarker studies implemented so far. Further connections of discriminatory
proteins discovered in EAE to findings in MScl are described.
Chapter 1
5
1. Introduction
Multiple sclerosis is a CNS disorder characterized by neuroinflammation,
neurodegeneration and myelin degradation. Symptoms of disease range from
sensory changes and fatigue to motor dysfunctions and visual impairments.
Diagnosis is done by clinical examinations aided by cerebrospinal fluid (CSF)
analysis and magnetic resonance imaging (MRI) scans. For a definite MScl
diagnose evidence of relapses separated in time and space is a criterion. The cause
of the disease is yet to be surveyed; what is known is that both environmental
factors as well as genetic susceptibility have an influence. Multiple sclerosis has a
main prevalence of occurrence in northern Europe, northern America and eastern
Australia, leading to some of the theories connected to low sunlight, and high
hygiene. A few other hypotheses include infection by a virus, toxin exposure, sex
hormone relations, dietary habits and air pollution as possible causes (1). Multiple
sclerosis exhibits various disease courses described as relapsing-remitting (RR),
primary-progressive (PP), secondary-progressive (SP) and progressive-relapsing
(PR) as seen in Figure 1. Multiple sclerosis has been studied by means of
proteomics in order to reveal causes of the disease, increased understanding of
pathomechanisms and to discover biomarkers. The discovery of a quick and
simple method for diagnosis would be invaluable and the possibility to follow up
the disease progression and therapeutic response would be precious as well.
Another interesting opportunity of the discovery of proteomic biomarkers is the
development of personalized medicine.
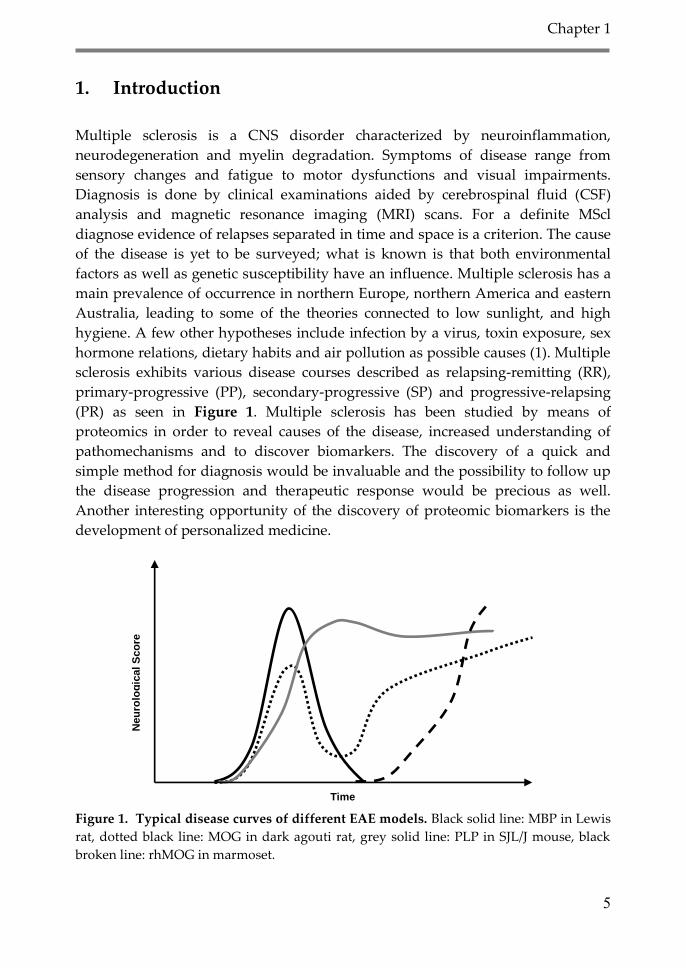
Figure 1. Typical disease curves of different EAE models. Black solid line: MBP in Lewis
rat, dotted black line: MOG in dark agouti rat, grey solid line: PLP in SJL/J mouse, black
broken line: rhMOG in marmoset.
Neu
rolo
gic
al S
co
re
Time
The EAE model as foundation for proteomic biomarker studies
6
The study of human subjects is limited. Since MScl affects the CNS, tissue
samples can be collected post mortem exclusively, making it impossible to follow
the disease course by means of proteomics in a longitudinal manner using tissue
samples. Blood samples are easily collected but the detection of disease-related
proteins might be hampered by the complexity of the blood proteome, the
masking effect by highly abundant proteins and the possible dilution effect,
especially if the sample is collected peripheral to the diseased area. Some of the
CNS-specific proteins might not even be present in the blood stream because of
the blood- brain barrier (BBB). The collection of CSF is a somewhat invasive
method but it is possible to collect samples in a longitudinal way and at any stage
of the disease. The proximity to the diseased tissue also makes this body fluid a
better choice than blood.
From animal models tissue samples can be collected at any time point and
during all stages of the disease, the biological variation is less than in a human
population and knock-outs can be created in order to study specific questions in
more detail. The animal model of MScl, experimental autoimmune
encephalomyelitis (EAE), has become an important tool for the understanding of
the human disease. This review aims to give an overview of proteomic EAE
studies, what questions need to be answered and what is already known. Further
this review will describe discriminatory proteins discovered in EAE and the
connection to observations done in the study of MScl patients.
2. Why use animal models
The use of animal models in research is an ongoing topic of discussion, sometimes
heated but always necessary. Over the past few decades, intensive discussions
between organizations opposing the use of animals and those supporting it have
led to increased attention towards the further implementation of Russell and
Burch’s so-called 3R’s – Replacement, Reduction and Refinement (1959). Indeed
where possible, alternative models are used in which hypotheses are tested in
silico, in vitro or ex vivo. This strategy is not only beneficial for the animals, but
also helps increase knowledge on a specific scientific subject (2). However, when
research areas address increasingly complex systems, such as the immune system
or the central nervous system, the use of animal models becomes increasingly
dictated.
Research using animal models can be separated into two distinct
categories: a) fundamental (or basic) research, in which new light is shed upon yet
unknown biological mechanisms involving complex systems and/or interactions
Chapter 1
7
thereof, and b) applied research, focused on understanding pathological
mechanisms to help us find and develop cures for human and animal diseases.
Much is written on the quality and/or validity of a model (3). Current
knowledge on pathological processes is limited, which imposes a reductionistic
approach by focusing on parts or elements of a disease one attempts to
understand and/or cure. Typical examples of such reductionism are so-called
disease models. In these types of animal models, one or several aspects of a
disease are mimicked and their validity can be categorized as follows: i) face
validity, which is the degree of similarity between an aspect of particular disease
and the parameter measured in the animal model; ii) predictive validity, which is
the degree of extrapolation of the outcome of an experimental procedure to the
human (or target) situation; and iii) construct validity, which is the degree of
similarity between the mechanisms modeled and the mechanism thought or
proven to play a role in the situation studied (i.e. a disease of interest or biological
process investigated) (4). Additionally, with an increase in reported results from
animal models and from clinical trials, comparative meta-analyses such as
performed by Perel et al. (5) will become valuable in determining the strength of
animal models to predict clinical outcome and further improve the validity of
disease models.
These disease models, used for both fundamental and applied research,
have often led to a better understanding of biological processes. As example, it is
worth noticing that the EAE (see also below) has enabled scientists to elucidate the
mechanisms involved in immune responses. This knowledge was then the basis
for the development of two commercialized drugs that alleviate MScl symptoms:
Copaxone ® (Teva Pharmaceuticals); and Tysabri ® (Biogen and Elan) (reviewed
in Steinman and Zamvil, 2005) (6).
In the late preclinical (i.e. non-clinical) stage of drug development,
evaluation of the safety aspects of a potential new drug as well as pharmacological
testing is mandatory. Institutions responsible for approving the commercialization
of new drugs, such as the Food and Drug Administration (FDA - US) and the
European Medicines Agency, require proof of efficacy and safety of a given
pharmaceutical prior to the first human exposure. Indeed, in a very early stage of
application of a novel drug, the FDA states in its Drug Review Process that
organizations applying for approval must show results from laboratory animal
testing prior to discussing their plans for clinical trials (7).
The use of animal models is therefore the price that society decides to pay
to ensure the safety of healthy volunteers and of patients participating in these
clinical trials required to bring a new drug to the medicine cabinets. In this view, it
is of importance that all animal testing is performed with the highest possible
respect and care for the animals involved. To warrant for such a ‘humane’
approach, performing experiments on animals is heavily regulated. Although
The EAE model as foundation for proteomic biomarker studies
8
these regulations differ from country to country, local and international law (8) set
strict regulations to handling and care of laboratory animals as well as strict
definitions and limitations to the use of these animals, allowing only tests that are
essential in answering scientific or medical questions. The local implementation of
these regulations is often taken care of by ethical committees responsible to
evaluate the balance between the suffering and/or discomfort caused to the
animals studied versus the benefits for the target species (humans, but also in the
veterinary field).
It is therefore our responsibility as scientists that our understanding of the
disease models and their extrapolation to the human situation is such that the
chances increase that effects observed in animals reflect efficacy in human.
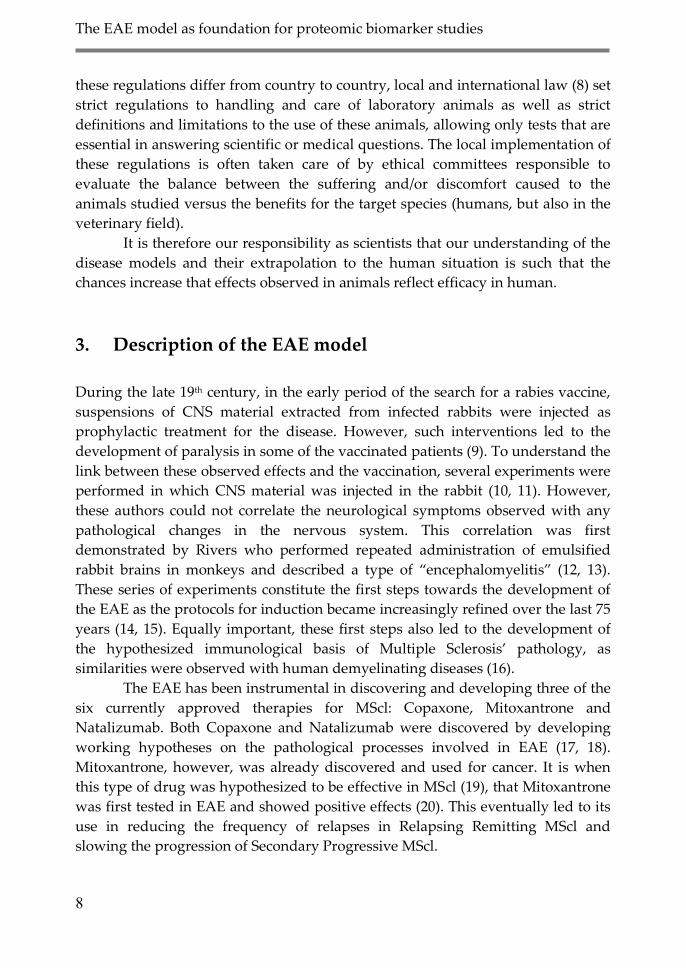
3. Description of the EAE model
During the late 19th century, in the early period of the search for a rabies vaccine,
suspensions of CNS material extracted from infected rabbits were injected as
prophylactic treatment for the disease. However, such interventions led to the
development of paralysis in some of the vaccinated patients (9). To understand the
link between these observed effects and the vaccination, several experiments were
performed in which CNS material was injected in the rabbit (10, 11). However,
these authors could not correlate the neurological symptoms observed with any
pathological changes in the nervous system. This correlation was first
demonstrated by Rivers who performed repeated administration of emulsified
rabbit brains in monkeys and described a type of ‚encephalomyelitis‛ (12, 13).
These series of experiments constitute the first steps towards the development of
the EAE as the protocols for induction became increasingly refined over the last 75
years (14, 15). Equally important, these first steps also led to the development of
the hypothesized immunological basis of Multiple Sclerosis’ pathology, as
similarities were observed with human demyelinating diseases (16).
The EAE has been instrumental in discovering and developing three of the
six currently approved therapies for MScl: Copaxone, Mitoxantrone and
Natalizumab. Both Copaxone and Natalizumab were discovered by developing
working hypotheses on the pathological processes involved in EAE (17, 18).
Mitoxantrone, however, was already discovered and used for cancer. It is when
this type of drug was hypothesized to be effective in MScl (19), that Mitoxantrone
was first tested in EAE and showed positive effects (20). This eventually led to its
use in reducing the frequency of relapses in Relapsing Remitting MScl and
slowing the progression of Secondary Progressive MScl.

Chapter 1
9
The use of the EAE in defining a therapeutic strategy for MScl has also
been heavily contested. Sriram & Steiner (21), elaborated on the differences in
pathology between EAE and MScl and linked this lack of correlation to the high
number of failures in clinical trials. Also, Steinman & Zamvil (2005) although
praising the EAE for its use in understanding neuroimmunological processes and
for being responsible for most of the current therapies for MScl, warn that the EAE
fails to detect potential infectious complications from novel therapies and lacks
predictability on toxicity.
An important aspect in the discussion of the validity of the EAE as model
for MScl is its heterogeneous nature. Currently, there exist several types of EAE
models: the antigen used (all from myelin origin) the species or even the strain in
which it is induced, influence the course of the disease (22) (see Fig 1). Depending
on the protocol, a different aspect of MS can be modeled. Indeed, several models
have been refined to mimic relapsing remitting MScl (23-25), secondary
progressive or primary progressive MScl (26). Next to exhibiting different disease
courses, these models also present different cellular and molecular aspects of
Multiple Sclerosis (14). Hence, there is not one EAE model, but rather a wide
range of variations on the theme, each representing one or more characteristic of
the pathologies observed in the different subtypes of MScl.
In this light, the difficulty arising by the differences in cellular and
molecular aspects of EAE models may not need to be impeding on our
understanding of the disease. On the contrary, by wisely combining studies
performed in different types of EAE models as Steinman and Zamvil advocate (6),
and adding studies from other models, a broader range of underlying MScl
pathological processes might come to light. As Gold et al. concluded ‚owing to the
complexities of human diseases, it is obvious that there is no single EAE model,
but rather a combination of different approaches that will finally help us to
develop new and more effective approaches‛.
It is undeniable that more studies are necessary to assess the degree of
extrapolation of EAE findings to the human situation. Also the application of
advanced technologies, such as Mass Spectrometry and the study of the EAE
metabolite and/or protein profile compared to the human situation will
undoubtedly lead to the discovery of potential new targets.
4. Why proteomic biomarkers
The set of all proteins expressed in a cell, tissue, body fluid or an organism is
called the proteome. The study of the proteins thereof in terms of quality,
quantity, function, structure, localization, modifications, activities and

The EAE model as foundation for proteomic biomarker studies
10
identification is named ‚proteomics‛ (27, 28). Proteomics can also be defined as an
interpretation of genome coded information (29). The definition of a biomarker is
termed: ‚a characteristic that is objectively measured and evaluated as an
indicator of normal biologic processes, pathogenic processes or pharmacologic
responses to a therapeutic intervention‛ (30). In the case of proteomic biomarker
research, the proteins are the entities examined for changes according to different
disease states and drug interventions using material from patients or animal
disease models.
The proteome with the estimated 300 000 proteins (31) is by far more
complex than the genome that consists of maybe less than 30 000 genes (32). There
is truly no one-gene-one protein relationship and mRNA levels are not in direct
relationship with protein levels. The proteins exist in splice variations, conformal
changes and with post translational modifications leading to a large variation in
the proteome. The proteome influenced by metabolism, stress, drug interactions,
circadian rhythm, cell type, stimuli, micro and macro environment is highly
dynamic compared to the more static genome. Proteins play crucial roles in the
body with function as enzymes, transporters, structure creators, receptors, growth
factors and antibodies among many others. The proteome can be analyzed in a
range of different sources as e.g. cells, tissues, blood, cerebrospinal fluid, amniotic
fluid, synovial fluid, tears and urine (27, 30, 31, 33).
Multiple sclerosis, a highly complex disease with symptoms from various
parts of the body, requires several criteria to be fulfilled for a diagnosis to be
made. There is a limited ability to predict different courses of the disease as well as
to monitor treatment response. To make a diagnosis, time consuming neurological
examinations as well as expensive MRI scans are applied. CSF is also examined for
the presence of immunoglobulin gamma (IgG) bands, an increased IgG index and
an overall increased protein amount. Many times the definite diagnosis can be
made only after months or even years of examinations (34). Specific proteomic
biomarkers that in an early stage could be detected by a single analysis of a blood
sample, CSF or other biofluid could increase the certainty of diagnosis, saving
both time and money and enabling the initiation of an early drug treatment with a
better outcome for the patient. More than to serve as diagnostic and classification
markers, the discovery of disease-specific proteins can reveal the pathogenic
functions which in turn could lead to drug development since many
pharmacological drug targets are proteins (30, 31, 33).
There are many challenges to meet in the proteomic research; the great
diversity as well as the large dynamic range of proteins in tissues or bodyfluids
causes problems for the analytical methods applied. Therefore, several different
techniques are used in order to reduce the sample complexity; separations in more
than one dimension, depletions and analysis of selected protein groups as e.g.
phospho-proteins, glycoproteins and membrane proteins are some of the common

Chapter 1
11
techniques. Another challenge met by these complex analyzes include the need of
repeatability and reproducibility. Proteins and peptides are sensitive to different
sample handling techniques, storage conditions as temperature, sample vials and
number of freeze-thaw cycles affects the sample. Also the sampling technique and
how the sample is handled just after the sampling are crucial. CSF samples
contaminated with e.g. red or white blood cells are not useable and discarded
from studies. This calls for robust design and standardization of proteomic
biomarker studies in order to rule out the detection of differences caused by
biological differences, sample handling, adsorptions to the walls of the sample vial
and degradation of naturally present proteases (27, 35, 36). High-throughput
analysis strategies as often applied in biomarker studies call for the use of quick
automated techniques. The production of often huge data files makes the
processing of the data sets even a significant logistics problem. When properly
designed, proteomic biomarker studies could generate important and useful
information.
5. Body fluids and tissues
In the search for proteomic biomarkers in the EAE model there are a few options
of sample sources. Different tissues from the CNS as well as blood, CSF and ECF
can be collected from animals. In biomarker studies based on human subjects, CSF
and blood can be collected. Only in the case of post mortem subjects can tissue
samples also be used. Other body fluids such as urine, saliva (37) and lacrimal
fluid (38) can be collected as well, but are less useful in the case of EAE and MScl.
5.1. Tissues In the EAE model, all kinds of CNS connected tissue can be collected for extraction
of proteins for biomarker studies. The most used tissue is spinal cord (39-46), but
also cerebral micro vessels (47) as well as retina, optic nerve and brain tissue have
been harvested for this purpose (46). Also specific organelles or proteins can be
extracted from tissues for separate analysis as e.g. mitochondria (46), membrane or
cytosol proteins.
5.2. Blood samples An intact blood-brain barrier (BBB) complicates the detection of brain specific
proteins in the blood. Both EAE and MScl show a BBB impairment (48, 49) that
enables the passage of proteins between blood and brain, making it possible to
detect brain-specific proteins in blood samples. Blood, however, contains large
amounts of proteins among which the CNS-related proteins constitute only a
The EAE model as foundation for proteomic biomarker studies
12
minor part of the total content. The distance to the diseased areas makes the
detection of markers specific to CNS disorders difficult, especially when applying
a screening approach of the total proteome. For targeted approaches, blood can be
a more useful compartment (50-52). Biomarkers that are detectable in serum are of
great use, since blood samples are easy to collect at the clinic. Blood is easily
collected from the tails of rats and mice and the samples can be collected in a
longitudinal fashion.
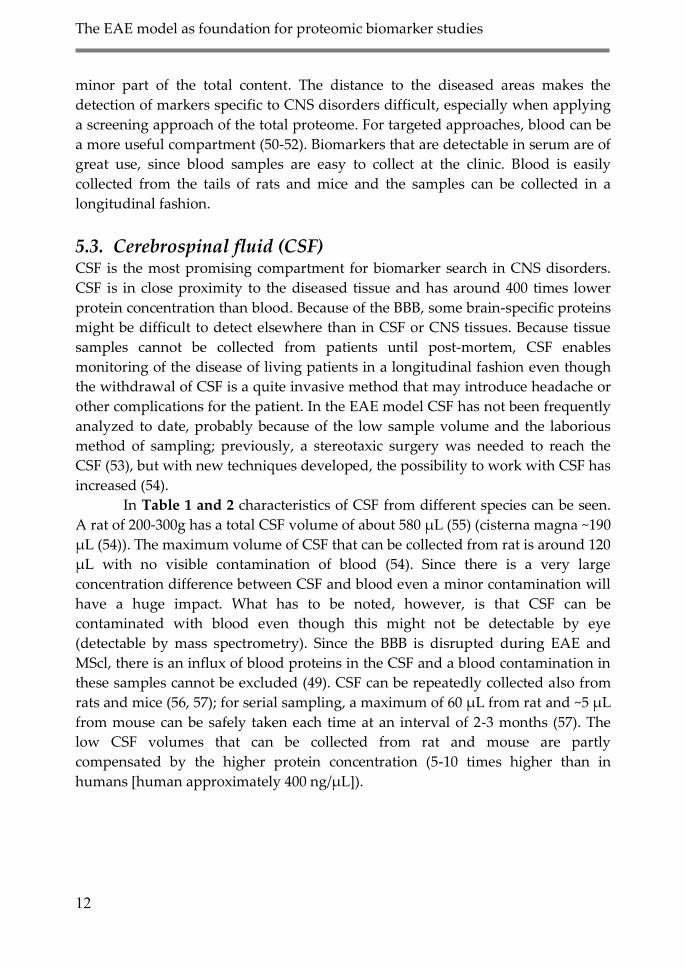
5.3. Cerebrospinal fluid (CSF) CSF is the most promising compartment for biomarker search in CNS disorders.
CSF is in close proximity to the diseased tissue and has around 400 times lower
protein concentration than blood. Because of the BBB, some brain-specific proteins
might be difficult to detect elsewhere than in CSF or CNS tissues. Because tissue
samples cannot be collected from patients until post-mortem, CSF enables
monitoring of the disease of living patients in a longitudinal fashion even though
the withdrawal of CSF is a quite invasive method that may introduce headache or
other complications for the patient. In the EAE model CSF has not been frequently
analyzed to date, probably because of the low sample volume and the laborious
method of sampling; previously, a stereotaxic surgery was needed to reach the
CSF (53), but with new techniques developed, the possibility to work with CSF has
increased (54).
In Table 1 and 2 characteristics of CSF from different species can be seen.
A rat of 200-300g has a total CSF volume of about 580 µL (55) (cisterna magna ~190
µL (54)). The maximum volume of CSF that can be collected from rat is around 120
µL with no visible contamination of blood (54). Since there is a very large
concentration difference between CSF and blood even a minor contamination will
have a huge impact. What has to be noted, however, is that CSF can be
contaminated with blood even though this might not be detectable by eye
(detectable by mass spectrometry). Since the BBB is disrupted during EAE and
MScl, there is an influx of blood proteins in the CSF and a blood contamination in
these samples cannot be excluded (49). CSF can be repeatedly collected also from
rats and mice (56, 57); for serial sampling, a maximum of 60 µL from rat and ~5 μL
from mouse can be safely taken each time at an interval of 2-3 months (57). The
low CSF volumes that can be collected from rat and mouse are partly
compensated by the higher protein concentration (5-10 times higher than in
humans [human approximately 400 ng/µL]).

Chapter 1
13
Table 1. CSF volume in different species (152).
Species mL
Horse 170-300
Human (total) 100-160
Human (ventricular) 16-27
Goat 25-30
Sheep 14-17
Dog (total) 7.8-24
Dog (intracranial) 5.5-9.5
Cat 4.0-4.9
Dogfish 2.0-2.7
Shark 2.0
Rabbit 1.4-2.3
Rat 0.28-0.3
Mouse 0.04
Table 2. Description of CSF production rate (153).
Species µL/min
Frog (R. pipiens) 0.3
Mouse 0.325
Chicken 1.4
Dogfish 2.0-4.0
Rat 2.1-5.4
Nurse shark 3.0
Lemon shark 4.0
Guinea pig 3.5
Rabbit 6-10
Cat 20-22
Monkey 29-41
Dog 31-66
Sheep 118
Goat 164
Human 350-400
5.4. Extracellular fluid (ECF) Just as CSF, extracellular fluid (ECF) from brain tissue can also be collected
repeatedly. The fluid is collected via cerebral microdialysis, with a probe inserted
in the brain of the animal. ECF also has the advantage of being close to the
diseased tissue. The mouse can keep the probe inserted when awake for several
days (58). Both smaller molecules like metabolites and neurotransmitters as well
as larger molecules like peptides and proteins can be sampled via microdialysis
(59). In humans the collection of ECF from brain tissue is implemented during
neurosurgery or to monitor the progress of stroke or trauma (60, 61) but because
of the invasiveness of this technique it is not implemented for biomarker research
in human subjects. Also in animal models this technique has still not been widely
used, since the uptake of proteins is still quite cumbersome (62).
The EAE model as foundation for proteomic biomarker studies
14
6. Proteomic biomarker studies in EAE models
Since the first EAE model was introduced by Koritschoner and Schweinburg in
1925 (10), many studies based on the EAE model have been performed with the
intention of increasing the understanding of the pathological mechanisms of MScl
(14, 63). The rise of the proteomics era in the mid 90-ties (64) initiated several
studies with the goal to discover proteomic biomarkers for diagnosis and
increased knowledge in a range of diseases. Also numerous proteomic biomarker
studies targeting MScl have been implemented; proteomic biomarker studies
based on the EAE model, however, has still been moderate in number but have
seen an increase during recent years. While most EAE studies have been
hypothesis-driven attempts to discover biomarkers (39, 44-46, 50-52, 65), a few
have been non-biased discovery type (40-42, 47). In most of the studies, spinal
cord have been analyzed (39-46) and other tissues related to the CNS (46, 47, 50);
only one study has been based on CSF (52) and three on serum (50-52).
In the study by Ohgoh and colleagues (45), the transition between the
genomics and proteomics era is visible where comparison between messenger
ribonucleic acid (mRNA) and protein levels were done. The study was focused on
the involvement of excitatory amino acid transporters in EAE and revealed that
the EAAC1 (excitatory amino acid transporter 3) was increased in spinal cord
from Lewis rats with EAE compared to control rats. The GLAST and GLT-1
proteins (excitatory amino acid transporter 1 and 2 ,respectively) were, on the
other hand, decreased in the diseased rats compared to the controls. The effects
were suppressed when the rats were treated with the (AMPA) receptor antagonist
(NBQX), thereby revealing that glutamate toxicity might be one of the key factors
in the pathology of EAE.
Gene expression and protein levels were also compared in the study by Alt
et al.(47). Two breeds of mice with EAE (SJL/N and C57Bl/6) were analyzed for the
effect on the blood-brain-barrier (BBB) by changes of proteins in the cerebral
microvascular compartment. Six discriminatory proteins were discovered; four
that increased in the diseased mice compared to control and two that decreased.
However, only one of the proteins (fibroleukin precursor/fibrinogen like protein 2)
showed an overlapping result between the proteomic 2D gel analysis and the
gene-microarray results, showing the non-linear relationship between gene
expression levels and protein amounts.
Morgan et al. (44) also examined the effects on the BBB. Lumbar spinal cord
was analyzed for post translational modification (PTM) differences between EAE
rats and control animals on the tight junction protein, occludin. The protein was
dephosphorylated in the EAE group compared to the control group, where the
protein was found in a phosphorylated form. The de-phosphorylation was also
Chapter 1
15
shown to coincide with the outbreak of inflammation. Further, three other
proteins (albumin, transferrin and ceruloplasmin) were found at higher levels in
the EAE rats compared to control. PTMs were also the scope of the study by
Mikkat et al. in 2010 (43), where PTMs as well as single amino acid polymorphisms
(SAPs) and splice isoforms were analyzed by studying migration differences of
proteins from the spinal cord of one EAE susceptible (SJL/J) and one EAE resistant
(B10.S) mouse strain. The findings included 26 polymorphic proteins with altered
electrophoretic mobility and 14 single amino acid polymorphisms (SAPs).
Further PTM studies have been performed by Kidd and colleagues (51);
where citrullinated proteins were the target. Antibodies reactive against
citrullinated and native myelin basic protein (MBP) were detected in EAE mice,
while they were not detected in the controls. Also Grant et al. (39) have been
examining PTMs in the form of lysine and arginine methylation as well as arginine
citrullination and phosphorylation of proteins. Several modified proteins were
found to be both increased as well as decreased in the EAE rats compared to the
controls.
The whole proteome of the spinal cord of EAE rats was analyzed by
shotgun isobaric tag for relative and absolute quantitation (iTRAQ) analysis by the
group of Jain et al. (40) and Liu et al. (42) The proteome was screened for
discriminatory peptides as well as for altered proteolytic events. In the study by
Liu et al., 41 significantly discriminatory peptides between healthy animals and
EAE rats were identified. Later on, Jain et al. discovered 7 altered proteolytic
products in the same sample set.
Reactive oxygen species (ROS) toxicity was the focus of the study by Qi et
al. in 2006 (46). CNS derived tissue as well as mitochondrial isolates from the same
tissues were screened for nitrated proteins. The study revealed several nitrated
mitochondrial proteins, an increased ROS level in the tissue and ~80% decreased
adenosine triphosphate (ATP) synthesis in the EAE mice compared to control.
Linker et al. (41) screened for stage-specific markers in two different EAE
mice models (C57Bl/6 and CNTF-/-). Among the findings were five differently
regulated proteins discovered in the C57Bl/6 mouse strain and six discriminatory
proteins in the CNTF-/- strain. Glial fibrillary acidic protein (GFAP) were found at
increased levels in later stages of the EAE.
The interest of El Behi et al. (50) was to examine the effect of the
antihistamine pyrilamine and the platelet activating factor (PAFR) receptor
antagonist CV6209 on EAE. Lower levels of IgG’s were found in the treated mice
compared to untreated.
The possible involvement of the RAS system in EAE has been examined by
Stegbauer et al. in 2009 (65). Antigen presenting cells as well as spinal cord tissue
was analyzed in myelin myelin oligodendrocyte glycoprotein (MOG)-EAE mice.
Quantitative polymerase chain reaction (Q-PCR) revealed upregulation of renin,
The EAE model as foundation for proteomic biomarker studies
16
ACE (angiotensin converting enzyme) and AT1R (Ang II 1 receptor). Treatment
with the renin inhibitor, Aliskiren, the ACE inhibitor, Enalapril, and the AT1R
antagonist, Losartan, ameliorated the course of the EAE. Enzyme-linked
immunosorbent assay (ELISA) analysis of chemokine (C-C motif) ligand 2 (CCL2)
and C-X-C motif chemokine 10 (CXCL10) show a decrease of these chemokine
ligands in macrophages after treatment with Losartan.
Villaroya et al. (52) found elevated tumor necrosis factor alpha (TNFα)
activity correlating with clinical scores of MBP-EAE rats in both serum and CSF.
An increased TNFα level was also detected in the spinal cord of EAE compared to
controls. Further findings included an increased concentration of both albumin
and IgG in the EAE rats, as well as an elevated cell count in both serum and CSF.
Several interesting proteins have been found discriminatory between EAE
animals and controls. The question is if they are translatable to the MScl disease in
real patients and further, how specific they are. In the following chapter, the
connections between possible biomarkers found in the EAE model and findings in
MScl patients are investigated.
7. Connections between discriminatory proteins in EAE and
MScl
EAE proteomic biomarker studies have revealed several new proteins with
discriminatory behavior between diseased and healthy animals. Many of these
proteins have also been connected to MScl in studies on tissues or body fluids
from human subjects. In this chapter, proteins that overlap between animal
models and human studies are discussed. In Table 3, proteins with increased
abundance in EAE compared to control are listed, Table 4 describes proteins with
the opposite behavior, namely a decrease in EAE affected animals compared to
controls. Table 5 shows proteins that decrease in EAE after drug treatment, and
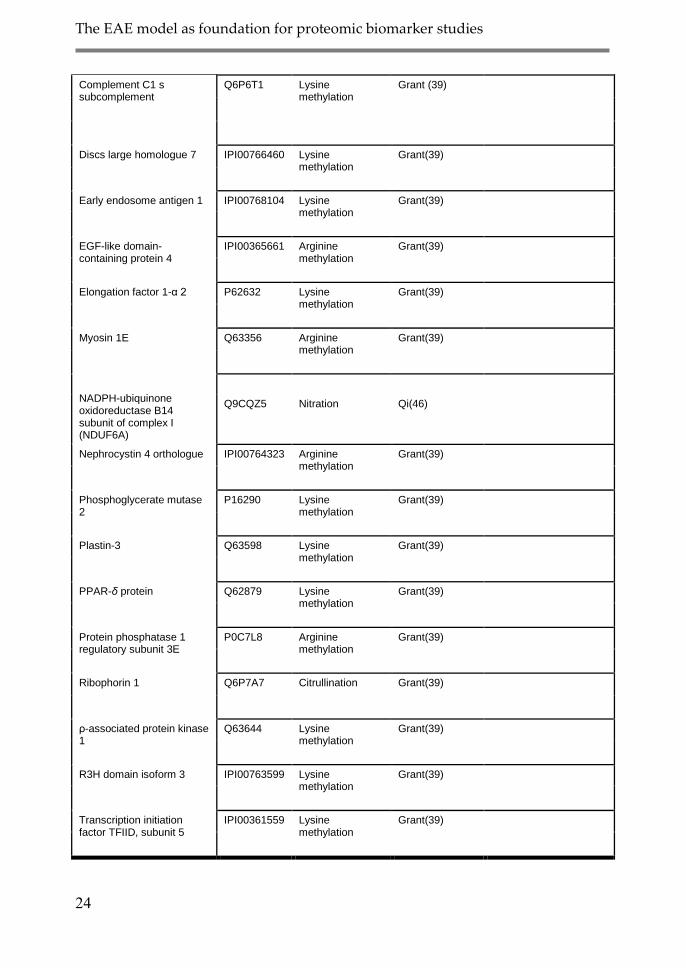
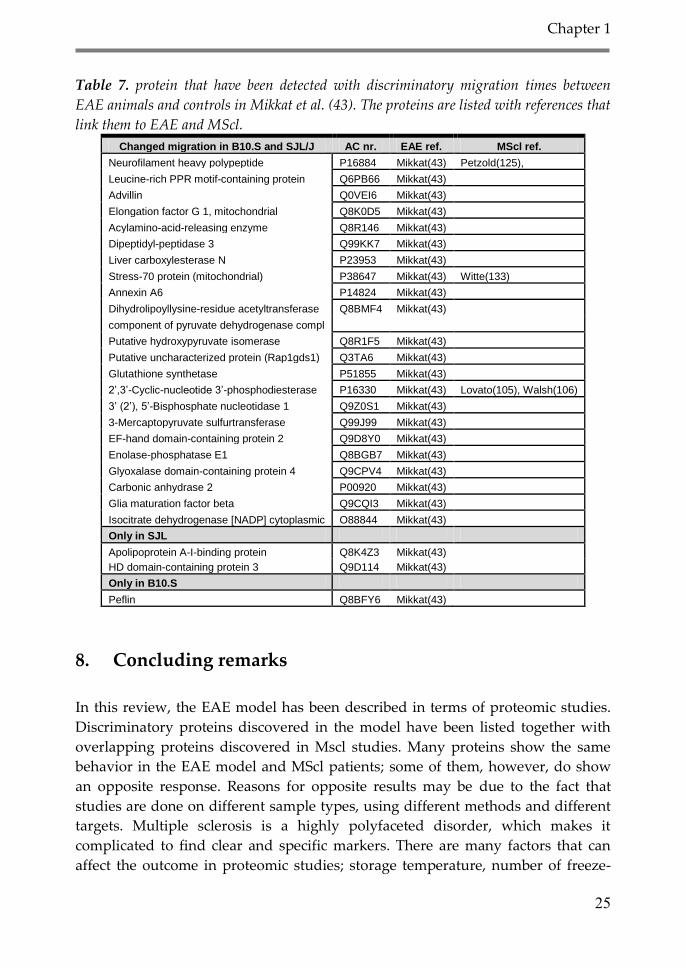
Table 6 contains proteins with PTM differences between EAE and control. Table 7
describes proteins with a changed migration time during gel-electrophoresis in the
study by Mikkat et al. in 2010 (43).
Chapter 1
17
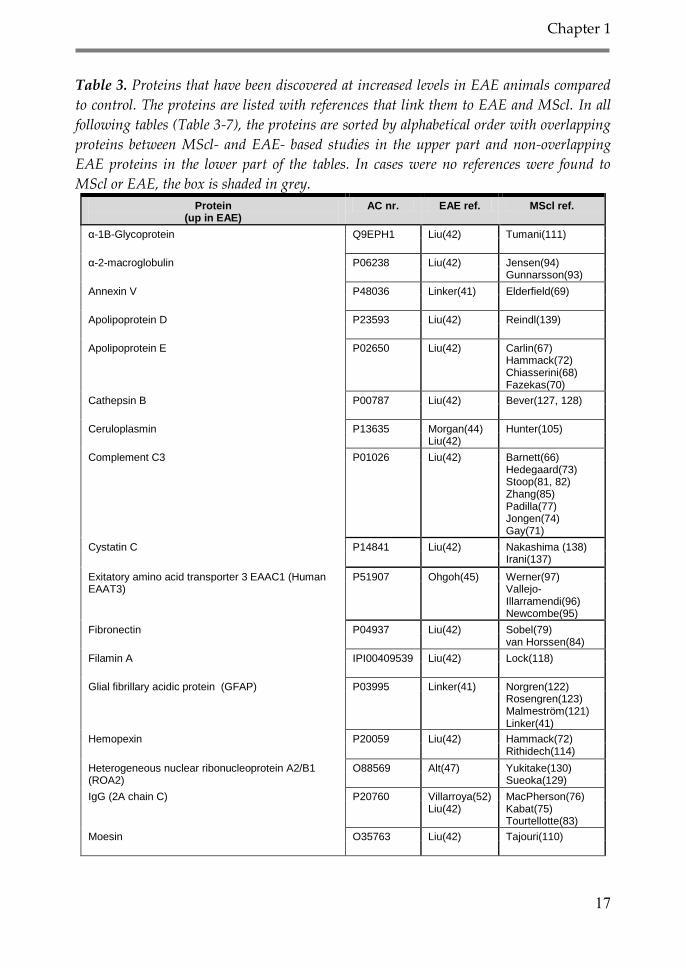
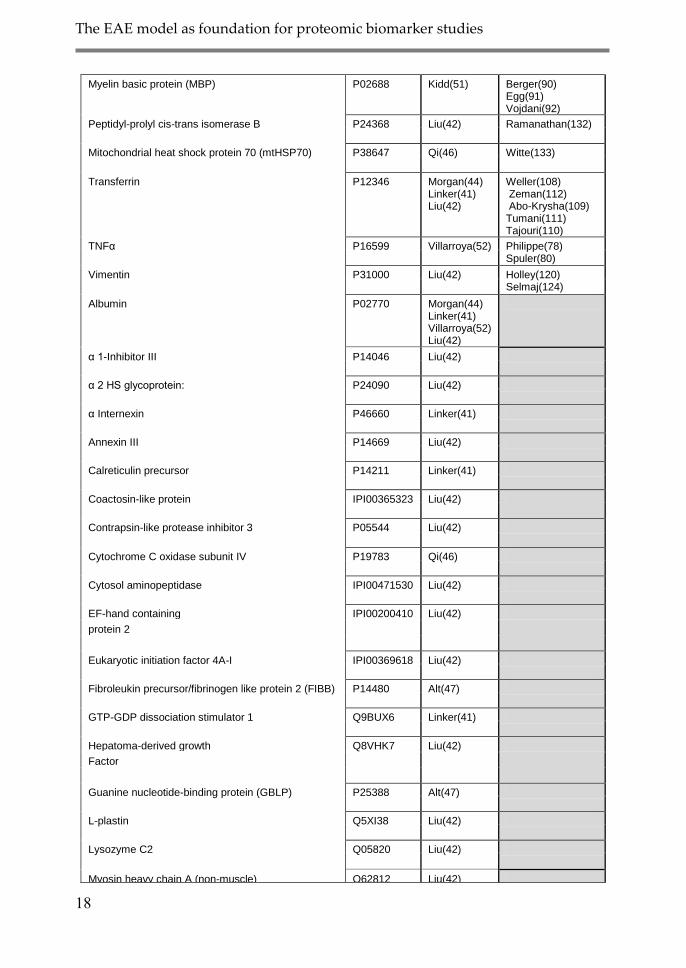
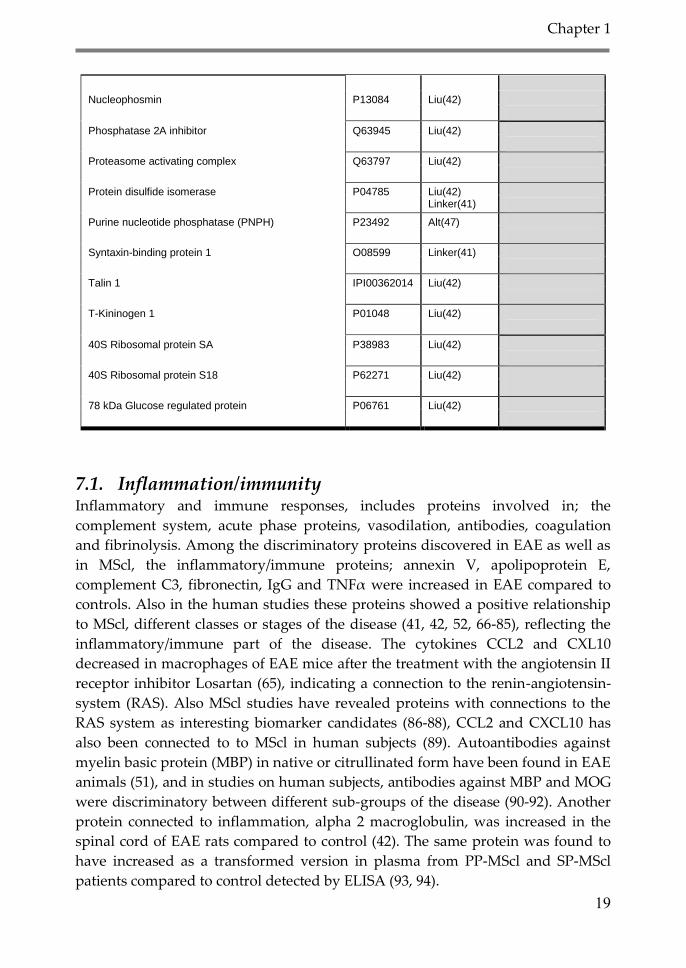
Table 3. Proteins that have been discovered at increased levels in EAE animals compared
to control. The proteins are listed with references that link them to EAE and MScl. In all
following tables (Table 3-7), the proteins are sorted by alphabetical order with overlapping
proteins between MScl- and EAE- based studies in the upper part and non-overlapping
EAE proteins in the lower part of the tables. In cases were no references were found to
MScl or EAE, the box is shaded in grey.
Protein (up in EAE)
AC nr. EAE ref. MScl ref.
α-1B-Glycoprotein Q9EPH1 Liu(42) Tumani(111)
α-2-macroglobulin P06238 Liu(42) Jensen(94) Gunnarsson(93)
Annexin V P48036 Linker(41) Elderfield(69)
Apolipoprotein D P23593 Liu(42) Reindl(139)
Apolipoprotein E P02650 Liu(42) Carlin(67) Hammack(72) Chiasserini(68) Fazekas(70)
Cathepsin B P00787 Liu(42) Bever(127, 128)
Ceruloplasmin P13635 Morgan(44) Liu(42)
Hunter(105)
Complement C3 P01026 Liu(42) Barnett(66) Hedegaard(73) Stoop(81, 82) Zhang(85) Padilla(77) Jongen(74) Gay(71)
Cystatin C P14841 Liu(42) Nakashima (138) Irani(137)
Exitatory amino acid transporter 3 EAAC1 (Human EAAT3)
P51907 Ohgoh(45) Werner(97) Vallejo-Illarramendi(96) Newcombe(95)
Fibronectin P04937 Liu(42) Sobel(79) van Horssen(84)
Filamin A IPI00409539 Liu(42) Lock(118)
Glial fibrillary acidic protein (GFAP) P03995 Linker(41) Norgren(122) Rosengren(123) Malmeström(121) Linker(41)
Hemopexin P20059 Liu(42) Hammack(72) Rithidech(114)
Heterogeneous nuclear ribonucleoprotein A2/B1 (ROA2)
O88569 Alt(47) Yukitake(130) Sueoka(129)
IgG (2A chain C) P20760 Villarroya(52) Liu(42)
MacPherson(76) Kabat(75) Tourtellotte(83)
Moesin O35763 Liu(42) Tajouri(110)
The EAE model as foundation for proteomic biomarker studies
18
Myelin basic protein (MBP) P02688 Kidd(51) Berger(90) Egg(91) Vojdani(92)
Peptidyl-prolyl cis-trans isomerase B P24368 Liu(42) Ramanathan(132)
Mitochondrial heat shock protein 70 (mtHSP70) P38647 Qi(46) Witte(133)
Transferrin P12346 Morgan(44) Linker(41) Liu(42)
Weller(108) Zeman(112) Abo-Krysha(109) Tumani(111) Tajouri(110)
TNFα P16599 Villarroya(52) Philippe(78) Spuler(80)
Vimentin P31000 Liu(42) Holley(120) Selmaj(124)
Albumin P02770 Morgan(44) Linker(41) Villarroya(52) Liu(42)
α 1-Inhibitor III P14046 Liu(42)
α 2 HS glycoprotein: P24090 Liu(42)
α Internexin P46660 Linker(41)
Annexin III P14669 Liu(42)
Calreticulin precursor P14211 Linker(41)
Coactosin-like protein IPI00365323 Liu(42)
Contrapsin-like protease inhibitor 3 P05544 Liu(42)
Cytochrome C oxidase subunit IV P19783 Qi(46)
Cytosol aminopeptidase IPI00471530 Liu(42)
EF-hand containing IPI00200410 Liu(42)
protein 2
Eukaryotic initiation factor 4A-I IPI00369618 Liu(42)
Fibroleukin precursor/fibrinogen like protein 2 (FIBB) P14480 Alt(47)
GTP-GDP dissociation stimulator 1 Q9BUX6 Linker(41)
Hepatoma-derived growth Q8VHK7 Liu(42)
Factor
Guanine nucleotide-binding protein (GBLP) P25388 Alt(47)
L-plastin Q5XI38 Liu(42)
Lysozyme C2 Q05820 Liu(42)
Myosin heavy chain A (non-muscle) Q62812 Liu(42)
Chapter 1
19
Nucleophosmin P13084 Liu(42)
Phosphatase 2A inhibitor Q63945 Liu(42)
Proteasome activating complex Q63797 Liu(42)
Protein disulfide isomerase P04785 Liu(42) Linker(41)
Purine nucleotide phosphatase (PNPH) P23492 Alt(47)
Syntaxin-binding protein 1 O08599 Linker(41)
Talin 1 IPI00362014 Liu(42)
T-Kininogen 1 P01048 Liu(42)
40S Ribosomal protein SA P38983 Liu(42)
40S Ribosomal protein S18 P62271 Liu(42)
78 kDa Glucose regulated protein P06761 Liu(42)
7.1. Inflammation/immunity Inflammatory and immune responses, includes proteins involved in; the
complement system, acute phase proteins, vasodilation, antibodies, coagulation
and fibrinolysis. Among the discriminatory proteins discovered in EAE as well as
in MScl, the inflammatory/immune proteins; annexin V, apolipoprotein E,
complement C3, fibronectin, IgG and TNFα were increased in EAE compared to
controls. Also in the human studies these proteins showed a positive relationship
to MScl, different classes or stages of the disease (41, 42, 52, 66-85), reflecting the
inflammatory/immune part of the disease. The cytokines CCL2 and CXL10
decreased in macrophages of EAE mice after the treatment with the angiotensin II
receptor inhibitor Losartan (65), indicating a connection to the renin-angiotensin-
system (RAS). Also MScl studies have revealed proteins with connections to the
RAS system as interesting biomarker candidates (86-88), CCL2 and CXCL10 has
also been connected to to MScl in human subjects (89). Autoantibodies against
myelin basic protein (MBP) in native or citrullinated form have been found in EAE
animals (51), and in studies on human subjects, antibodies against MBP and MOG
were discriminatory between different sub-groups of the disease (90-92). Another
protein connected to inflammation, alpha 2 macroglobulin, was increased in the
spinal cord of EAE rats compared to control (42). The same protein was found to
have increased as a transformed version in plasma from PP-MScl and SP-MScl
patients compared to control detected by ELISA (93, 94).
The EAE model as foundation for proteomic biomarker studies
20
7.2. Exitotoxicity The excitatory amino acid transporters GLAST (human EAAT1), GLT-1 (human
EAAT2) and EAAC1 (human EAAT3) were analyzed in EAE rats. EAAC1 were
found in elevated amounts in diseased animals compared to controls while
GLAST and GLT-1 were reduced in the same comparison (45). Studies on MScl
patients have also revealed an involvement of glutamate toxicity (95-97). Protein
amount as well as complementary deoxyribonucleic acid (cDNA) levels of EAAT1
and EAAT2 were increased in the optic nerve of MScl patients compared to
controls (96). In another study, protein levels of EAAT2 were decreased in
oligodendrocytes around MScl lesions when compared to control tissues (97).
Glutamate dehydrogenase (GD) was detected at lower levels in a knock-out EAE
mouse compared to control (41). GD was not detectable in active and silent
(chronic) MScl lesions but present in normal and non-MScl white matter (97).
These results show that glutamate toxicity might be a factor involved in the
demyelination and neurodegeneration in EAE as well as MScl. The protin
calcium/calmodulin dependent kinase II (CAMKII), a protein involved among
others in the regulation of glutaminergic synapses (98) was decreased in EAE
compared to control (42). It has been discovered that the Vδ2+ T cells that have
been detected in CSF of RR-MScl patients are dependent on CAMKII for the
transendothelial migration across the BBB to reach the CNS (99).
7.3. Oxidative stress/iron homeostasis Oxidative stress is a pathogenic mechanism that has been connected to the cause
of MScl (100-102). Ceruloplasmin, a copper-binding protein involved in the
protection against oxidative stress (103, 104), was found to be increased in spinal
cord of EAE rats compared to control (42, 44); the same observation was also made
in plasma from MScl patients (105). Transferrin, another protein involved in
protection against oxidative stress (106, 107) was detected at an elevated
abundance in rats and mice with EAE (41, 42, 44). An increased amount of
transferrin was also detected by ELISA in CSF from MScl patients (108). Another
study noted an increased amount of soluble transferrin receptor in serum from
MScl patients (109). Transferrin cDNA levels were also increased in a comparison
of MScl plaque tissue to normal tissue (110). A longitudinal study of patients with
clinically isolated syndromes (CIS) revealed a decrease of transferrin abundance in
the CSF of patients that converted to definite relapsing remitting MScl (RR-MScl)
compared to those that stayed diagnosed as CIS after two years (111). Further
more, the transferrin level was discriminatory between subclasses and stages of
MScl (112). Hemopexin also plays an important role in the protection against
oxidative stress by the heme-binding capacity (113). An increased amount of
Chapter 1
21
transferrin was found in the spinal cord of EAE diseased rats (42); the same has
also been observed for hemopexin in plasma from pediatric MScl (114). A possible
change in PTM’s of hemopexin in healthy and MScl patients was discovered by a
different location on 2D gels (72). The three proteins described in this section are
also acute phase proteins and could be listed together with the inflammatory
proteins (115).
7.4. Structure The intermediate filaments (IF) proteins, glial fibrillary acidic protein (GFAP),
vimentin and the neurofilament proteins, constitute part of the foundation of the
eukaryotic cytoskeleton (116) the filaments are connected via crosslinkers that
build up a complex network that enables cell signaling, and anchors
transmembrane receptors. One of these crosslinkers, filamin A, (117) has been
shown to increase in EAE rats at protein level (42) and chronic lesions from MScl
patients at gene level (118). Another cytoskeleton protein, moesin (119), was also
increased in EAE rats (42) as well as MScl patients on gene level (110, 119). Among
IF proteins, GFAP was shown to increase in spinal cord of late stage EAE as well
as SP-MScl compared to control (41, 119). GFAP in CSF was also increased on a
protein level in MScl patients compared to control (119-123). Vimentin was one of
the increased proteins in EAE rats (42). In MScl patients, corpora amylaceae
stained strongly for vimentin compared to control tissues (124); vimentin has also
been shown in another MScl study to be more expressed in diseased tissue
compared to healthy tissue (120). Neurofilaments have been shown to be
dephosphorylated in EAE (39); phosphorylation of neurofilaments have also
shown to be discriminatory in different CNS tissues from the of MScl patients
(125).
7.5. Other Glyceraldehyde 3-phosphate dehydrogenase (GAPDH) a protein involved in
glycolysis, was increased in EAE; in the same study, a lower production of ATP
was shown in the diseased animals (46). In another study based on MScl patients,
GAPDH reactive antibodies were upregulated in diseased individuals compared
to control (126). The protease cathepsin B increased in EAE rats (42) as well as in
mononuclear cells of peripheral blood and cerebral white matter from MScl
patients compared to control (127, 128). Apolipoprotein D (Apo D), for example
involved in lipid transport increased in EAE rats (42); in MScl; an increased Apo D
CSF/serum index was found. The heterogeneous nuclear ribonucleoproteins A2/B1
(hnRNP, ROA2) were found at increased amounts in EAE compared to control
(47). Antibodies against this protein were found in the CSF of MScl patients (129,
130). Αlpha-1B-glycoprotein, a plasma protein with unknown function, was
The EAE model as foundation for proteomic biomarker studies
22
detected at higher levels in EAE compared to control (42), and at lower levels in
CIS-RR-MScl compared to CIS-CIS (111). Peptidyl-cis-trans-isomerase B, a protein
involved in protein folding (131), increased in EAE at protein levels (42), while in
MScl patients this protein increased at the mRNA level by 22% compared to
controls (132). The mitochondrial stress protein 70 (mtHsp70) was found to be
nitrated in mitochondrial isolates from retina, brain and spinal cord of EAE, while
this was not observed in the control animals (46). In MScl lesions and particularly
in astrocytes and axons, there was an increased immunoreactivity against the
same protein (133). 2’,3’-Cyclic-nucleotide 3’-phosphodiesterase (CNPase), one of
the most abundant proteins in the myelin membrane (134) exhibited a shift in
migration time between EAE susceptible and EAE-resistant healthy mouse strains
(43). The same protein was recognized by IgG in serum and CSF from MScl
patients but not from controls (135, 136). Cystatin C, an inhibitor of cystein
proteases was found to increase in EAE animals compared to control (42). This
protein was also found to be discriminatory between MScl patients and controls
(137), but later studies have revealed that this difference might be caused by
improper storage of the samples (138).
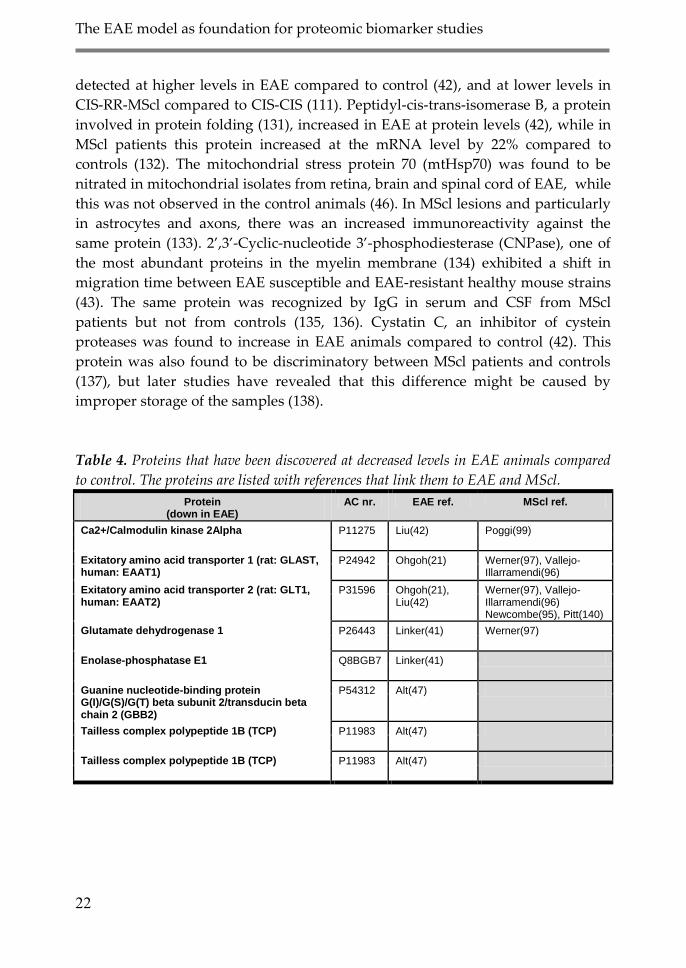
Table 4. Proteins that have been discovered at decreased levels in EAE animals compared
to control. The proteins are listed with references that link them to EAE and MScl.
Protein (down in EAE)
AC nr. EAE ref. MScl ref.
Ca2+/Calmodulin kinase 2Alpha P11275 Liu(42) Poggi(99)
Exitatory amino acid transporter 1 (rat: GLAST, human: EAAT1)
P24942 Ohgoh(21) Werner(97), Vallejo-Illarramendi(96)
Exitatory amino acid transporter 2 (rat: GLT1, human: EAAT2)
P31596 Ohgoh(21), Liu(42)
Werner(97), Vallejo-Illarramendi(96) Newcombe(95), Pitt(140)
Glutamate dehydrogenase 1 P26443 Linker(41) Werner(97)
Enolase-phosphatase E1 Q8BGB7 Linker(41)
Guanine nucleotide-binding protein G(I)/G(S)/G(T) beta subunit 2/transducin beta chain 2 (GBB2)
P54312 Alt(47)
Tailless complex polypeptide 1B (TCP) P11983 Alt(47)
Tailless complex polypeptide 1B (TCP) P11983 Alt(47)
Chapter 1
23
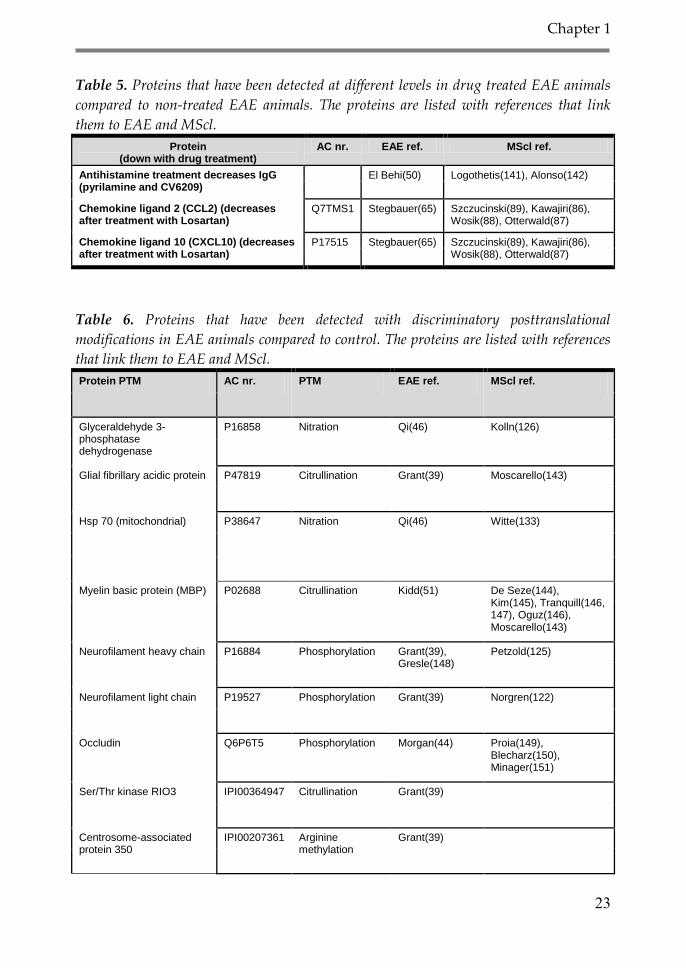
Table 5. Proteins that have been detected at different levels in drug treated EAE animals
compared to non-treated EAE animals. The proteins are listed with references that link
them to EAE and MScl.
Protein (down with drug treatment)
AC nr. EAE ref. MScl ref.
Antihistamine treatment decreases IgG (pyrilamine and CV6209)
El Behi(50) Logothetis(141), Alonso(142)
Chemokine ligand 2 (CCL2) (decreases after treatment with Losartan)
Q7TMS1 Stegbauer(65) Szczucinski(89), Kawajiri(86), Wosik(88), Otterwald(87)
Chemokine ligand 10 (CXCL10) (decreases after treatment with Losartan)
P17515 Stegbauer(65) Szczucinski(89), Kawajiri(86), Wosik(88), Otterwald(87)
Table 6. Proteins that have been detected with discriminatory posttranslational
modifications in EAE animals compared to control. The proteins are listed with references
that link them to EAE and MScl.
Protein PTM AC nr. PTM EAE ref. MScl ref.
Glyceraldehyde 3-phosphatase dehydrogenase
P16858 Nitration Qi(46) Kolln(126)
Glial fibrillary acidic protein P47819 Citrullination Grant(39) Moscarello(143)
Hsp 70 (mitochondrial) P38647 Nitration Qi(46) Witte(133)
Myelin basic protein (MBP) P02688 Citrullination Kidd(51) De Seze(144), Kim(145), Tranquill(146, 147), Oguz(146), Moscarello(143)
Neurofilament heavy chain P16884 Phosphorylation Grant(39), Gresle(148)
Petzold(125)
Neurofilament light chain P19527 Phosphorylation Grant(39) Norgren(122)
Occludin Q6P6T5 Phosphorylation Morgan(44) Proia(149), Blecharz(150), Minager(151)
Ser/Thr kinase RIO3 IPI00364947 Citrullination Grant(39)
Centrosome-associated protein 350
IPI00207361 Arginine methylation
Grant(39)
The EAE model as foundation for proteomic biomarker studies
24
Complement C1 s subcomplement
Q6P6T1 Lysine methylation
Grant (39)
Discs large homologue 7 IPI00766460 Lysine methylation
Grant(39)
Early endosome antigen 1 IPI00768104 Lysine methylation
Grant(39)
EGF-like domain-containing protein 4
IPI00365661 Arginine methylation
Grant(39)
Elongation factor 1-α 2 P62632 Lysine methylation
Grant(39)
Myosin 1E Q63356 Arginine methylation
Grant(39)
NADPH-ubiquinone oxidoreductase B14 subunit of complex I (NDUF6A)
Q9CQZ5
Nitration
Qi(46)
Nephrocystin 4 orthologue IPI00764323 Arginine methylation
Grant(39)
Phosphoglycerate mutase 2
P16290 Lysine methylation
Grant(39)
Plastin-3 Q63598 Lysine methylation
Grant(39)
PPAR-δ protein Q62879 Lysine methylation
Grant(39)
Protein phosphatase 1 regulatory subunit 3E
P0C7L8 Arginine methylation
Grant(39)
Ribophorin 1 Q6P7A7 Citrullination Grant(39)
ρ-associated protein kinase 1
Q63644 Lysine methylation
Grant(39)
R3H domain isoform 3 IPI00763599 Lysine methylation
Grant(39)
Transcription initiation factor TFIID, subunit 5
IPI00361559 Lysine methylation
Grant(39)
Chapter 1
25
Table 7. protein that have been detected with discriminatory migration times between
EAE animals and controls in Mikkat et al. (43). The proteins are listed with references that
link them to EAE and MScl.
Changed migration in B10.S and SJL/J AC nr. EAE ref. MScl ref.
Neurofilament heavy polypeptide P16884 Mikkat(43) Petzold(125),
Leucine-rich PPR motif-containing protein Q6PB66 Mikkat(43)
Advillin Q0VEI6 Mikkat(43)
Elongation factor G 1, mitochondrial Q8K0D5 Mikkat(43)
Acylamino-acid-releasing enzyme Q8R146 Mikkat(43)
Dipeptidyl-peptidase 3 Q99KK7 Mikkat(43)
Liver carboxylesterase N P23953 Mikkat(43)
Stress-70 protein (mitochondrial) P38647 Mikkat(43) Witte(133)
Annexin A6 P14824 Mikkat(43)
Dihydrolipoyllysine-residue acetyltransferase Q8BMF4 Mikkat(43)
component of pyruvate dehydrogenase compl
Putative hydroxypyruvate isomerase Q8R1F5 Mikkat(43)
Putative uncharacterized protein (Rap1gds1) Q3TA6 Mikkat(43)
Glutathione synthetase P51855 Mikkat(43)
2’,3’-Cyclic-nucleotide 3’-phosphodiesterase P16330 Mikkat(43) Lovato(105), Walsh(106)
3’ (2’), 5’-Bisphosphate nucleotidase 1 Q9Z0S1 Mikkat(43)
3-Mercaptopyruvate sulfurtransferase Q99J99 Mikkat(43)
EF-hand domain-containing protein 2 Q9D8Y0 Mikkat(43)
Enolase-phosphatase E1 Q8BGB7 Mikkat(43)
Glyoxalase domain-containing protein 4 Q9CPV4 Mikkat(43)
Carbonic anhydrase 2 P00920 Mikkat(43)
Glia maturation factor beta Q9CQI3 Mikkat(43)
Isocitrate dehydrogenase [NADP] cytoplasmic O88844 Mikkat(43)
Only in SJL
Apolipoprotein A-I-binding protein Q8K4Z3 Mikkat(43)
HD domain-containing protein 3 Q9D114 Mikkat(43)
Only in B10.S
Peflin Q8BFY6 Mikkat(43)
8. Concluding remarks
In this review, the EAE model has been described in terms of proteomic studies.
Discriminatory proteins discovered in the model have been listed together with
overlapping proteins discovered in Mscl studies. Many proteins show the same
behavior in the EAE model and MScl patients; some of them, however, do show
an opposite response. Reasons for opposite results may be due to the fact that
studies are done on different sample types, using different methods and different
targets. Multiple sclerosis is a highly polyfaceted disorder, which makes it
complicated to find clear and specific markers. There are many factors that can
affect the outcome in proteomic studies; storage temperature, number of freeze-

The EAE model as foundation for proteomic biomarker studies
26
thaw cycles and sample vials as well as analysis technique and sample origin.
Samples obtained from animal models are far more homogenous than human
samples, which makes it easier to detect markers in an animal model. However,
this also gives a flaw in the sense of dynamic behavior of the expression of the
marker. In order to get reliable, robust, reproducible results which can be
translated between animal model and human subjects, these factors have to be
kept under strict control. It should be noted that the EAE model is a model with
face validity or mimicry of the real disease; therefore, the animal model will never
be an exact copy of the real situation in patients. Still, by careful, accurate
experimental designs, the combined use of the EAE model and human subjects
offers the possibility to reveal the enigma behind this devastating disease and in
the end give hope to affected people all over the world.
Chapter 1
27
References
1. Compston, A., and Coles, A. (2008) Multiple sclerosis. Lancet 372, 1502-1517
2. Manciocco, A., Chiarotti, F., Vitale, A., Calamandrei, G., Laviola, G., and Alleva, E. (2009) The
application of Russell and Burch 3R principle in rodent models of neurodegenerative disease: the case
of Parkinson's disease. Neurosci. Biobehav. Rev. 33, 18-32
3. Willner, P. (1986) Validation criteria for animal models of human
mental disorders: learned helplessness as a paradigm case. Prog. Neuropsychopharmacol. Biol. Psychiatry
10, 677-690
4. van der Staay, F. J., Arndt, S. S., and Nordquist, R. E. (2009) Evaluation of animal models of
neurobehavioral disorders. Behav. Brain Funct. 5, 11
5. Perel, P., Roberts, I., Sena, E., Wheble, P., Briscoe, C., Sandercock, P., Macleod, M., Mignini, L. E.,
Jayaram, P., and Khan, K. S. (2007) Comparison of treatment effects between animal experiments and
clinical trials: systematic review. BMJ 334, 197
6. Steinman, L., and Zamvil, S. S. (2005) Virtues and pitfalls of EAE for the development of therapies for
multiple sclerosis. Trends Immunol. 26, 565-571
7. http://www.fda.gov/drugd/resourcesforyou/consumers/
8. Council of Europe, European Convention for the Protection of Vertebrate Animals Used for
Experimental and Other Scientific Purposes, European Treaty Series - No 123, Strasbourg, 1986, Text
amended in 2005., In:
9. Balaguer, D. D. G. (1888) Un caso de rabia paralítica. Gaceta Médica Catalana 11, 45-57
10. Koritschoner, R., and Schweinburg, F. (1925) Klinische und experimentelle Beobachtungen über
Lähmungen nach Wutschutzimfung. Ztschr f Immunitätsforsch u Exper Therap 42, 271
11. Hurst, E. W. (1932) The effects of the injection of normal brain emulsion into rabbits, with special
reference to the aetiology of the paralytic accidents of antirabic treatment. J Hyg. 32, 33-44
12. Rivers, T. M., Sprunt, D. H., and Berry, G. P. (1933) Observations on attempts to produce acute
disseminated encephalomyelitis in monkeys. J Exp Med. 58, 39-53
13. Rivers, T. M., and Schwentker, F. F. (1935) Encephalomyelitis accompanied by myelin destruction
experimentally produced in monkeys. 61, 689 - 702. J Exp Med. 61, 689-702
14. Gold, R., Linington, C., and Lassmann, H. (2006) Understanding pathogenesis and therapy of multiple
sclerosis via animal models: 70 years of merits and culprits in experimental autoimmune
encephalomyelitis research. Brain 129, 1953-1971
15. Baxter, A. G. (2007) The origin and application of experimental autoimmune encephalomyelitis. Nat.
Rev. Immunol. 7, 904-912
16. Wolf, A., Kabat, E. A., and Bezer, A. E. (1947) The pathology of acute disseminated encephalomyelitis
produced experimentally in the rhesus monkey and its resemblance to human demyelinating disease.
J. Neuropath. Exp. Neurol. 6, 333-357
The EAE model as foundation for proteomic biomarker studies
28
17. Teitelbaum, D., Meshorer, A., Arnon, R., and Sela, M. (1971) Suppression of experimental allergic
encephalomyelitis by a synthetic polypeptide. Eur J Immunol. 1, 242-248
18. Yednock, T. A., Cannon, C., Fritz, L. C., Sanchez-Madrid, F., Steinmann, L., and Karin, N. (1992)
Prevention of experimental autoimmune encephalomyelitis by antibodies against a4b1 integrin.
Nature. 356, 63-66
19. Ellison G.W, and Myers L.W. (1978) A review of systemic nonspecific immunosuppressive treatment
of multiple sclerosis . Neurology 28, 132-139
20. Ridge S.C, Sloboda A.E, and McReynolds R.A. (1985) Suppression of experimental allergic
encephalomyelitis by Mitoxantrone. Clin Immunol Immunopathol. 35, 35-42
21. Sriram, S., and Steiner, I. (2005) Experimental Allergic Encephalomyelitis: A misleading model of
Multiple Sclerosis. Ann Neurol. 58, 939-945
22. Joy, J. E., and Johnston R.B. (2001) Multiple Sclerosis - Current Status and Strategies for the future.
National Academy Press.
23. Brown, A. M., and McFarlin D.E. (1981) Relapsing experimental allergic encephalomyelitis in the SJL/J
mouse. Lab Invest 45, 278-284
24. Lublin, F. D., Maurer, P. H., Berry, R. G., and Tippett, D. (1981) Delayed, relapsing experimental
allergic encephalomyelitis in mice. J Immunol. 126, 819-922
25. Zamvil, S., Nelson, P., Trotter, J., Mitchell, D., Knobler, R., Fritz, R., and Steinman, L. (1985) T cell
clones specific for myelin basic protein induce chronic relapsing EAE and demyelination. Nature 317,
355-358
26. Tsunoda I, Kuang, L. Q., Theil, D. J., and Fujinami, R. S. (2000) Antibody associated with a novel
model for primary progressive multiple sclerosis: Induction of relapsing-remitting and progressive
forms of EAE in H2(s) mouse strains. Brain Path. 10, 402-418
27. Clarke, W., Zhang, Z., and Chan, D. W. (2003) The application of clinical proteomics to cancer and
other diseases. Clin. Chem. Lab Med 41, 1562-1570
28. Fields, S. (2001) Proteomics. Proteomics in genomeland. Science 291, 1221-1224
29. Aebersold, R., and Mann, M. (2003) Mass spectrometry-based proteomics. Nature 422, 198-207
30. Giovannoni, G. (2006) Multiple sclerosis cerebrospinal fluid biomarkers. Dis. Markers 22, 187-196
31. Pierce, J. D., Fakhari, M., Works, K. V., Pierce, J. T., and Clancy, R. L. (2007) Understanding
proteomics. Nurs. Health Sci. 9, 54-60
32. Claverie, J. M. (2001) Gene number. What if there are only 30,000 human genes? Science 291, 1255-1257
33. Kappos, L., Achtnichts, L., Dahlke, F., Kuhle, J., Naegelin, Y., Sandbrink, R., and Lindberg, R. L. (2005)
Genomics and proteomics: role in the management of multiple sclerosis. J Neurol 252 Suppl 3, iii21-
iii27
34. McDonald, W. I., Compston, A., Edan, G., Goodkin, D., Hartung, H. P., Lublin, F. D., McFarland, H.
F., Paty, D. W., Polman, C. H., Reingold, S. C., Sandberg-Wollheim, M., Sibley, W., Thompson, A., van
den, N. S., Weinshenker, B. Y., and Wolinsky, J. S. (2001) Recommended diagnostic criteria for
Chapter 1
29
multiple sclerosis: guidelines from the International Panel on the diagnosis of multiple sclerosis. Ann.
Neurol 50, 121-127
35. Ramstrom, M., and Bergquist, J. (2004) Miniaturized proteomics and peptidomics using capillary
liquid separation and high resolution mass spectrometry. FEBS Lett. 567, 92-95
36. Rosenling, T., Slim, C. L., Christin, C., Coulier, L., Shi, S., Stoop, M. P., Bosman, J., Suits, F.,
Horvatovich, P. L., Stockhofe-Zurwieden, N., Vreeken, R., Hankemeier, T., van Gool, A. J., Luider, T.
M., and Bischoff, R. (2009) The effect of preanalytical factors on stability of the proteome and selected
metabolites in cerebrospinal fluid (CSF). J Proteome. Res. 8, 5511-5522
37. Minagar, A., Adamashvili, I., Kelley, R. E., Gonzalez-Toledo, E., McLarty, J., and Smith, S. J. (2007)
Saliva soluble HLA as a potential marker of response to interferon-beta 1a in multiple sclerosis: a
preliminary study. J Neuroinflammation. 4, 16
38. Calais, G., Forzy, G., Crinquette, C., Mackowiak, A., de, S. J., Blanc, F., Lebrun, C., Heinzlef, O.,
Clavelou, P., Moreau, T., Hennache, B., Zephir, H., Verier, A., Neuville, V., Confavreux, C.,
Vermersch, P., and Hautecoeur, P. (2010) Tear analysis in clinically isolated syndrome as new
multiple sclerosis criterion. Mult. Scler. 16, 87-92
39. Grant, J. E., Hu, J., Liu, T., Jain, M. R., Elkabes, S., and Li, H. (2007) Post-translational modifications in
the rat lumbar spinal cord in experimental autoimmune encephalomyelitis. J Proteome. Res. 6, 2786-
2791
40. Jain, M. R., Bian, S., Liu, T., Hu, J., Elkabes, S., and Li, H. (2009) Altered proteolytic events in
experimental autoimmune encephalomyelitis discovered by iTRAQ shotgun proteomics analysis of
spinal cord. Proteome. Sci. 7, 25
41. Linker, R. A., Brechlin, P., Jesse, S., Steinacker, P., Lee, D. H., Asif, A. R., Jahn, O., Tumani, H., Gold,
R., and Otto, M. (2009) Proteome profiling in murine models of multiple sclerosis: identification of
stage specific markers and culprits for tissue damage. PLoS. One. 4, e7624
42. Liu, T., Donahue, K. C., Hu, J., Kurnellas, M. P., Grant, J. E., Li, H., and Elkabes, S. (2007) Identification
of differentially expressed proteins in experimental autoimmune encephalomyelitis (EAE) by
proteomic analysis of the spinal cord. J Proteome. Res. 6, 2565-2575
43. Mikkat, S., Lorenz, P., Scharf, C., Yu, X., Glocker, M. O., and Ibrahim, S. M. (2010) MS characterization
of qualitative protein polymorphisms in the spinal cords of inbred mouse strains. Proteomics 10, 1050-
1062
44. Morgan, L., Shah, B., Rivers, L. E., Barden, L., Groom, A. J., Chung, R., Higazi, D., Desmond, H.,
Smith, T., and Staddon, J. M. (2007) Inflammation and dephosphorylation of the tight junction protein
occludin in an experimental model of multiple sclerosis. Neuroscience 147, 664-673
45. Ohgoh, M., Hanada, T., Smith, T., Hashimoto, T., Ueno, M., Yamanishi, Y., Watanabe, M., and
Nishizawa, Y. (2002) Altered expression of glutamate transporters in experimental autoimmune
encephalomyelitis. J Neuroimmunol. 125, 170-178
46. Qi, X., Lewin, A. S., Sun, L., Hauswirth, W. W., and Guy, J. (2006) Mitochondrial protein nitration
primes neurodegeneration in experimental autoimmune encephalomyelitis. J Biol. Chem. 281, 31950-
31962
47. Alt, C., Duvefelt, K., Franzen, B., Yang, Y., and Engelhardt, B. (2005) Gene and protein expression
profiling of the microvascular compartment in experimental autoimmune encephalomyelitis in
C57Bl/6 and SJL mice. Brain Pathol. 15, 1-16
The EAE model as foundation for proteomic biomarker studies
30
48. Minagar, A., and Alexander, J. S. (2003) Blood-brain barrier disruption in multiple sclerosis. Mult.
Scler. 9, 540-549
49. Wolburg-Buchholz, K., Mack, A. F., Steiner, E., Pfeiffer, F., Engelhardt, B., and Wolburg, H. (2009)
Loss of astrocyte polarity marks blood-brain barrier impairment during experimental autoimmune
encephalomyelitis. Acta Neuropathol. 118, 219-233
50. El Behi M., Zephir, H., Lefranc, D., Dutoit, V., Dussart, P., Devos, P., Dessaint, J. P., Vermersch, P., and
Prin, L. (2007) Changes in self-reactive IgG antibody repertoire after treatment of experimental
autoimmune encephalomyelitis with anti-allergic drugs. J Neuroimmunol. 182, 80-88
51. Kidd, B. A., Ho, P. P., Sharpe, O., Zhao, X., Tomooka, B. H., Kanter, J. L., Steinman, L., and Robinson,
W. H. (2008) Epitope spreading to citrullinated antigens in mouse models of autoimmune arthritis
and demyelination. Arthritis Res. Ther. 10, R119
52. Villarroya, H., Violleau, K., Ben Younes-Chennoufi, A., and Baumann, N. (1996) Myelin-induced
experimental allergic encephalomyelitis in Lewis rats: tumor necrosis factor alpha levels in serum and
cerebrospinal fluid immunohistochemical expression in glial cells and macrophages of optic nerve
and spinal cord. J Neuroimmunol. 64, 55-61
53. Consiglio, A. R., and Lucion, A. B. (2000) Technique for collecting cerebrospinal fluid in the cisterna
magna of non-anesthetized rats. Brain Res. Brain Res. Protoc. 5, 109-114
54. Nirogi, R., Kandikere, V., Mudigonda, K., Bhyrapuneni, G., Muddana, N., Saralaya, R., and Benade, V.
(2009) A simple and rapid method to collect the cerebrospinal fluid of rats and its application for the
assessment of drug penetration into the central nervous system. J Neurosci. Methods 178, 116-119
55. Lai, Y. L., Smith, P. M., Lamm, W. J., and Hildebrandt, J. (1983) Sampling and analysis of
cerebrospinal fluid for chronic studies in awake rats. Journal of Applied Physiology 54, 1754-1757
56. van den Berg, M. P., Romeijn, S. G., Verhoef, J. C., and Merkus, F. W. (2002) Serial cerebrospinal fluid
sampling in a rat model to study drug uptake from the nasal cavity. J Neurosci. Methods 116, 99-107
57. Liu, L., and Duff, K. (2008) A technique for serial collection of cerebrospinal fluid from the cisterna
magna in mouse. J Vis. Exp.
58. Boshi, G., Launay, N., Rips, R., and Scherrmann, J.-M. (1995) Brain microdialysis in the mouse. Journal
of Pharmacological and Toxicological Methods 33, 29-33
59. Afinowi, R., Tisdall, M., Keir, G., Smith, M., Kitchen, N., and Petzold, A. (2009) Improving the
recovery of S100B protein in cerebral microdialysis: implications for multimodal monitoring in
neurocritical care. J Neurosci. Methods 181, 95-99
60. Mazzeo, A. T., and Bullock, R. (2005) Effect of bacterial meningitis complicating severe head trauma
upon brain microdialysis and cerebral perfusion. Neurocrit. Care 2, 282-287
61. Tisdall, M. M., and Smith, M. (2006) Cerebral microdialysis: research technique or clinical tool. Br. J
Anaesth. 97, 18-25
62. Maurer, M. H. (2010) Proteomics of brain extracellular fluid (ECF) and cerebrospinal fluid (CSF). Mass
Spectrom. Rev. 29, 17-28
63. Linker, R. A., and Lee, D. H. (2009) Models of autoimmune demyelination in the central nervous
system: on the way to translational medicine. Exp. Transl. Stroke Med 1, 5
Chapter 1
31
64. James, P. (1997) Protein identification in the post-genome era: the rapid rise of proteomics. Q. Rev.
Biophys. 30, 279-331
65. Stegbauer, J., Lee, D. H., Seubert, S., Ellrichmann, G., Manzel, A., Kvakan, H., Muller, D. N., Gaupp,
S., Rump, L. C., Gold, R., and Linker, R. A. (2009) Role of the renin-angiotensin system in autoimmune
inflammation of the central nervous system. Proc. Natl. Acad. Sci. U. S. A 106, 14942-14947
66. Barnett, M. H., Parratt, J. D., Cho, E. S., and Prineas, J. W. (2009) Immunoglobulins and complement in
postmortem multiple sclerosis tissue. Ann. Neurol 65, 32-46
67. Carlin, C., Murray, L., Graham, D., Doyle, D., and Nicoll, J. (2000) Involvement of apolipoprotein E in
multiple sclerosis: absence of remyelination associated with possession of the APOE epsilon2 allele. J
Neuropathol. Exp. Neurol 59, 361-367
68. Chiasserini, D., Di, F. M., Candeliere, A., Susta, F., Orvietani, P. L., Calabresi, P., Binaglia, L., and
Sarchielli, P. (2008) CSF proteome analysis in multiple sclerosis patients by two-dimensional
electrophoresis. Eur. J Neurol 15, 998-1001
69. Elderfield, A. J., Newcombe, J., Bolton, C., and Flower, R. J. (1992) Lipocortins (annexins) 1, 2, 4 and 5
are increased in the central nervous system in multiple sclerosis. J Neuroimmunol. 39, 91-100
70. Fazekas, F., Strasser-Fuchs, S., Kollegger, H., Berger, T., Kristoferitsch, W., Schmidt, H., Enzinger, C.,
Schiefermeier, M., Schwarz, C., Kornek, B., Reindl, M., Huber, K., Grass, R., Wimmer, G., Vass, K.,
Pfeiffer, K. H., Hartung, H. P., and Schmidt, R. (2001) Apolipoprotein E epsilon 4 is associated with
rapid progression of multiple sclerosis. Neurology 57, 853-857
71. Gay, F. W. (2006) Early cellular events in multiple sclerosis. Intimations of an extrinsic myelinolytic
antigen. Clin. Neurol Neurosurg. 108, 234-240
72. Hammack, B. N., Fung, K. Y., Hunsucker, S. W., Duncan, M. W., Burgoon, M. P., Owens, G. P., and
Gilden, D. H. (2004) Proteomic analysis of multiple sclerosis cerebrospinal fluid. Mult. Scler. 10, 245-
260
73. Hedegaard, C. J., Chen, N., Sellebjerg, F., Sorensen, P. S., Leslie, R. G., Bendtzen, K., and Nielsen, C. H.
(2009) Autoantibodies to myelin basic protein (MBP) in healthy individuals and in patients with
multiple sclerosis: a role in regulating cytokine responses to MBP. Immunology 128, e451-e461
74. Jongen, P. J., Nijeholt, G., Lamers, K. J., Doesburg, W. H., Barkhof, F., Lemmens, W. A., Klasen, I. S.,
and Hommes, O. R. (2007) Cerebrospinal fluid IgM index correlates with cranial MRI lesion load in
patients with multiple sclerosis. Eur. Neurol 58, 90-95
75. KABAT, E. A., FREEDMAN, D. A., and . (1950) A study of the crystalline albumin, gamma globulin
and total protein in the cerebrospinal fluid of 100 cases of multiple sclerosis and in other diseases. Am.
J Med Sci. 219, 55-64
76. MacPherson, C. F., and Cosgrove, J. B. (1968) An unusual IgG globulin. Frequency of occurrence in
cerebrospinal fluid in multiple sclerosis. Arch Neurol 19, 503-509
77. Padilla-Docal, B., Dorta-Contreras, A. J., Fundora-Hernandez, H., Noris-Garcia, E., Bu-Coifiu-Fanego,
R., Gonzalez-Hernandez, M., and Rodriguez-Rey, A. (2007) C3c intrathecal synthesis evaluation in
patients with multiple sclerosis. Arq Neuropsiquiatr. 65, 800-802
78. Philippe, J., Debruyne, J., Leroux-Roels, G., Willems, A., and Dereuck, J. (1996) In vitro TNF-alpha, IL-
2 and IFN-gamma production as markers of relapses in multiple sclerosis. Clin. Neurol Neurosurg. 98,
286-290
The EAE model as foundation for proteomic biomarker studies
32
79. Sobel, R. A., and Mitchell, M. E. (1989) Fibronectin in multiple sclerosis lesions. Am. J Pathol. 135, 161-
168
80. Spuler, S., Yousry, T., Scheller, A., Voltz, R., Holler, E., Hartmann, M., Wick, M., and Hohlfeld, R.
(1996) Multiple sclerosis: prospective analysis of TNF-alpha and 55 kDa TNF receptor in CSF and
serum in correlation with clinical and MRI activity. J Neuroimmunol. 66, 57-64
81. Stoop, M. P., Dekker, L. J., Titulaer, M. K., Burgers, P. C., Sillevis Smitt, P. A., Luider, T. M., and
Hintzen, R. Q. (2008) Multiple sclerosis-related proteins identified in cerebrospinal fluid by advanced
mass spectrometry. Proteomics 8, 1576-1585
82. Stoop, M. P., Dekker, L. J., Titulaer, M. K., Lamers, R. J., Burgers, P. C., Sillevis Smitt, P. A., van Gool,
A. J., Luider, T. M., and Hintzen, R. Q. (2009) Quantitative matrix-assisted laser desorption ionization-
fourier transform ion cyclotron resonance (MALDI-FT-ICR) peptide profiling and identification of
multiple-sclerosis-related proteins. J Proteome. Res. 8, 1404-1414
83. Tourtellotte, W. W., and Parker, J. A. (1967) Multiple sclerosis: brain immunoglobulin-G and albumin.
Nature 214, 683-686
84. van Horssen J., Bo, L., Vos, C. M., Virtanen, I., and De Vries, H. E. (2005) Basement membrane
proteins in multiple sclerosis-associated inflammatory cuffs: potential role in influx and transport of
leukocytes. J Neuropathol. Exp. Neurol 64, 722-729
85. Zhang, B., Jiang, Y., Yang, Y., Peng, F., and Hu, X. (2008) Correlation between serum thyroxine and
complements in patients with multiple sclerosis and neuromyelitis optica. Neuro. Endocrinol. Lett. 29,
256-260
86. Kawajiri, M., Mogi, M., Osoegawa, M., Matsuoka, T., Tsukuda, K., Kohara, K., Horiuchi, M., Miki, T.,
and Kira, J. I. (2008) Reduction of angiotensin II in the cerebrospinal fluid of patients with multiple
sclerosis. Mult. Scler. 14, 557-560
87. Ottervald, J., Franzen, B., Nilsson, K., Andersson, L. I., Khademi, M., Eriksson, B., Kjellstrom, S.,
Marko-Varga, G., Vegvari, A., Harris, R. A., Laurell, T., Miliotis, T., Matusevicius, D., Salter, H., Ferm,
M., and Olsson, T. (2010) Multiple sclerosis: Identification and clinical evaluation of novel CSF
biomarkers. J Proteomics
88. Wosik, K., Cayrol, R., Dodelet-Devillers, A., Berthelet, F., Bernard, M., Moumdjian, R., Bouthillier, A.,
Reudelhuber, T. L., and Prat, A. (2007) Angiotensin II controls occludin function and is required for
blood brain barrier maintenance: relevance to multiple sclerosis. J Neurosci. 27, 9032-9042
89. Szczucinski, A., and Losy, J. (2007) Chemokines and chemokine receptors in multiple sclerosis.
Potential targets for new therapies. Acta Neurol Scand. 115, 137-146
90. Berger, T., Rubner, P., Schautzer, F., Egg, R., Ulmer, H., Mayringer, I., Dilitz, E., Deisenhammer, F.,
and Reindl, M. (2003) Antimyelin antibodies as a predictor of clinically definite multiple sclerosis after
a first demyelinating event. N. Engl. J Med 349, 139-145
91. Egg, R., Reindl, M., Deisenhammer, F., Linington, C., and Berger, T. (2001) Anti-MOG and anti-MBP
antibody subclasses in multiple sclerosis. Mult. Scler. 7, 285-289
92. Vojdani, A., Vojdani, E., and Cooper, E. (2003) Antibodies to myelin basic protein, myelin
oligodendrocytes peptides, alpha-beta-crystallin, lymphocyte activation and cytokine production in
patients with multiple sclerosis. J Intern. Med 254, 363-374
Chapter 1
33
93. Gunnarsson, M., Sundstrom, P., Stigbrand, T., and Jensen, P. E. (2003) Native and transformed alpha2-
macroglobulin in plasma from patients with multiple sclerosis. Acta Neurol Scand. 108, 16-21
94. Jensen, P. E., Humle, J. S., Datta, P., and Sorensen, P. S. (2004) Significantly increased fractions of
transformed to total alpha2-macroglobulin concentrations in plasma from patients with multiple
sclerosis. Biochim. Biophys. Acta 1690, 203-207
95. Newcombe, J., Uddin, A., Dove, R., Patel, B., Turski, L., Nishizawa, Y., and Smith, T. (2008) Glutamate
receptor expression in multiple sclerosis lesions. Brain Pathol. 18, 52-61
96. Vallejo-Illarramendi, A., Domercq, M., Perez-Cerda, F., Ravid, R., and Matute, C. (2006) Increased
expression and function of glutamate transporters in multiple sclerosis. Neurobiol. Dis. 21, 154-164
97. Werner, P., Pitt, D., and Raine, C. S. (2001) Multiple sclerosis: altered glutamate homeostasis in lesions
correlates with oligodendrocyte and axonal damage. Ann. Neurol 50, 169-180
98. Lisman, J., Schulman, H., and Cline, H. (2002) The molecular basis of CaMKII function in synaptic and
behavioural memory. Nat. Rev. Neurosci. 3, 175-190
99. Poggi, A., Zocchi, M. R., Carosio, R., Ferrero, E., Angelini, D. F., Galgani, S., Caramia, M. D., Bernardi,
G., Borsellino, G., and Battistini, L. (2002) Transendothelial migratory pathways of V delta 1+TCR
gamma delta+ and V delta 2+TCR gamma delta+ T lymphocytes from healthy donors and multiple
sclerosis patients: involvement of phosphatidylinositol 3 kinase and calcium calmodulin-dependent
kinase II. J Immunol. 168, 6071-6077
100. Gonsette, R. E. (2008) Neurodegeneration in multiple sclerosis: the role of oxidative stress and
excitotoxicity. J Neurol Sci. 274, 48-53
101. LeVine, S. M., Lynch, S. G., Ou, C. N., Wulser, M. J., Tam, E., and Boo, N. (1999) Ferritin, transferrin
and iron concentrations in the cerebrospinal fluid of multiple sclerosis patients. Brain Res. 821, 511-515
102. LeVine, S. M., and Chakrabarty, A. (2004) The role of iron in the pathogenesis of experimental allergic
encephalomyelitis and multiple sclerosis. Ann. N. Y. Acad. Sci. 1012, 252-266
103. Rathore, K. I., Kerr, B. J., Redensek, A., Lopez-Vales, R., Jeong, S. Y., Ponka, P., and David, S. (2008)
Ceruloplasmin protects injured spinal cord from iron-mediated oxidative damage. J Neurosci. 28,
12736-12747
104. Tapryal, N., Mukhopadhyay, C., Das, D., Fox, P. L., and Mukhopadhyay, C. K. (2009) Reactive oxygen
species regulate ceruloplasmin by a novel mRNA decay mechanism involving its 3'-untranslated
region: implications in neurodegenerative diseases. J Biol. Chem. 284, 1873-1883
105. Hunter, M. I., Nlemadim, B. C., and Davidson, D. L. (1985) Lipid peroxidation products and
antioxidant proteins in plasma and cerebrospinal fluid from multiple sclerosis patients. Neurochem.
Res. 10, 1645-1652
106. Lok, C. N., and Loh, T. T. (1998) Regulation of transferrin function and expression: review and update.
Biol. Signals Recept. 7, 157-178
107. Stout, D. L. (1992) The role of transferrin in heme transport. Biochem. Biophys. Res. Commun. 189, 765-
770
108. Weller, M., List, U., Schabet, M., Melms, A., and Dichgans, J. (1999) Elevated CSF lactoferrin in
superficial siderosis of the central nervous system. J Neurol 246, 943-945
The EAE model as foundation for proteomic biomarker studies
34
109. Abo-Krysha, N., and Rashed, L. (2008) The role of iron dysregulation in the pathogenesis of multiple
sclerosis: an Egyptian study. Mult. Scler. 14, 602-608
110. Tajouri, L., Mellick, A. S., Ashton, K. J., Tannenberg, A. E., Nagra, R. M., Tourtellotte, W. W., and
Griffiths, L. R. (2003) Quantitative and qualitative changes in gene expression patterns characterize
the activity of plaques in multiple sclerosis. Brain Res. Mol. Brain Res. 119, 170-183
111. Tumani, H., Lehmensiek, V., Rau, D., Guttmann, I., Tauscher, G., Mogel, H., Palm, C., Hirt, V.,
Suessmuth, S. D., Sapunova-Meier, I., Ludolph, A. C., and Brettschneider, J. (2009) CSF proteome
analysis in clinically isolated syndrome (CIS): candidate markers for conversion to definite multiple
sclerosis. Neurosci. Lett. 452, 214-217
112. Zeman, D., Adam, P., Kalistova, H., Sobek, O., Kelbich, P., Andel, J., and Andel, M. (2000) Transferrin
in patients with multiple sclerosis: a comparison among various subgroups of multiple sclerosis
patients. Acta Neurol Scand. 101, 89-94
113. Tolosano, E., and Altruda, F. (2002) Hemopexin: structure, function, and regulation. DNA Cell Biol. 21,
297-306
114. Rithidech, K. N., Honikel, L., Milazzo, M., Madigan, D., Troxell, R., and Krupp, L. B. (2009) Protein
expression profiles in pediatric multiple sclerosis: potential biomarkers. Mult. Scler. 15, 455-464
115. Gabay, C., and Kushner, I. (1999) Acute-phase proteins and other systemic responses to inflammation.
N. Engl. J Med 340, 448-454
116. Fuchs, E., and Weber, K. (1994) Intermediate filaments: structure, dynamics, function, and disease.
Annu. Rev. Biochem. 63, 345-382
117. van der Flier A., and Sonnenberg, A. (2001) Structural and functional aspects of filamins. Biochim.
Biophys. Acta 1538, 99-117
118. Lock, C., Hermans, G., Pedotti, R., Brendolan, A., Schadt, E., Garren, H., Langer-Gould, A., Strober, S.,
Cannella, B., Allard, J., Klonowski, P., Austin, A., Lad, N., Kaminski, N., Galli, S. J., Oksenberg, J. R.,
Raine, C. S., Heller, R., and Steinman, L. (2002) Gene-microarray analysis of multiple sclerosis lesions
yields new targets validated in autoimmune encephalomyelitis. Nat. Med 8, 500-508
119. Amieva, M. R., and Furthmayr, H. (1995) Subcellular localization of moesin in dynamic filopodia,
retraction fibers, and other structures involved in substrate exploration, attachment, and cell-cell
contacts. Exp. Cell Res. 219, 180-196
120. Holley, J. E., Gveric, D., Newcombe, J., Cuzner, M. L., and Gutowski, N. J. (2003) Astrocyte
characterization in the multiple sclerosis glial scar. Neuropathol. Appl. Neurobiol. 29, 434-444
121. Malmestrom, C., Haghighi, S., Rosengren, L., Andersen, O., and Lycke, J. (2003) Neurofilament light
protein and glial fibrillary acidic protein as biological markers in MS. Neurology 61, 1720-1725
122. Norgren, N., Sundstrom, P., Svenningsson, A., Rosengren, L., Stigbrand, T., and Gunnarsson, M.
(2004) Neurofilament and glial fibrillary acidic protein in multiple sclerosis. Neurology 63, 1586-1590
123. Rosengren, L. E., Lycke, J., and Andersen, O. (1995) Glial fibrillary acidic protein in CSF of multiple
sclerosis patients: relation to neurological deficit. J Neurol Sci. 133, 61-65
124. Selmaj, K., Pawlowska, Z., Walczak, A., Koziolkiewicz, W., Raine, C. S., and Cierniewski, C. S. (2008)
Corpora amylacea from multiple sclerosis brain tissue consists of aggregated neuronal cells. Acta
Biochim. Pol. 55, 43-49
Chapter 1
35
125. Petzold, A., Gveric, D., Groves, M., Schmierer, K., Grant, D., Chapman, M., Keir, G., Cuzner, L., and
Thompson, E. J. (2008) Phosphorylation and compactness of neurofilaments in multiple sclerosis:
indicators of axonal pathology. Exp. Neurol 213, 326-335
126. Kolln, J., Ren, H. M., Da, R. R., Zhang, Y., Spillner, E., Olek, M., Hermanowicz, N., Hilgenberg, L. G.,
Smith, M. A., van den, N. S., and Qin, Y. (2006) Triosephosphate isomerase- and glyceraldehyde-3-
phosphate dehydrogenase-reactive autoantibodies in the cerebrospinal fluid of patients with multiple
sclerosis. J Immunol. 177, 5652-5658
127. Bever, C. T., Jr., Panitch, H. S., and Johnson, K. P. (1994) Increased cathepsin B activity in peripheral
blood mononuclear cells of multiple sclerosis patients. Neurology 44, 745-748
128. Bever, C. T., Jr., and Garver, D. W. (1995) Increased cathepsin B activity in multiple sclerosis brain. J
Neurol Sci. 131, 71-73
129. Sueoka, E., Yukitake, M., Iwanaga, K., Sueoka, N., Aihara, T., and Kuroda, Y. (2004) Autoantibodies
against heterogeneous nuclear ribonucleoprotein B1 in CSF of MS patients. Ann. Neurol 56, 778-786
130. Yukitake, M., Sueoka, E., Sueoka-Aragane, N., Sato, A., Ohashi, H., Yakushiji, Y., Saito, M., Osame,
M., Izumo, S., and Kuroda, Y. (2008) Significantly increased antibody response to heterogeneous
nuclear ribonucleoproteins in cerebrospinal fluid of multiple sclerosis patients but not in patients with
human T-lymphotropic virus type I-associated myelopathy/tropical spastic paraparesis. J Neurovirol.
14, 130-135
131. Schonbrunner, E. R., and Schmid, F. X. (1992) Peptidyl-prolyl cis-trans isomerase improves the
efficiency of protein disulfide isomerase as a catalyst of protein folding. Proc. Natl. Acad. Sci. U. S. A
89, 4510-4513
132. Ramanathan, M., Weinstock-Guttman, B., Nguyen, L. T., Badgett, D., Miller, C., Patrick, K.,
Brownscheidle, C., and Jacobs, L. (2001) In vivo gene expression revealed by cDNA arrays: the pattern
in relapsing-remitting multiple sclerosis patients compared with normal subjects. J Neuroimmunol. 116,
213-219
133. Witte, M. E., Bo, L., Rodenburg, R. J., Belien, J. A., Musters, R., Hazes, T., Wintjes, L. T., Smeitink, J. A.,
Geurts, J. J., De Vries, H. E., van, d., V, and van, H. J. (2009) Enhanced number and activity of
mitochondria in multiple sclerosis lesions. J Pathol. 219, 193-204
134. Myllykoski, M., and Kursula, P. (2010) Expression, purification, and initial characterization of
different domains of recombinant mouse 2',3'-cyclic nucleotide 3'-phosphodiesterase, an enigmatic
enzyme from the myelin sheath. BMC Res. Notes 3, 12
135. Lovato, L., Cianti, R., Gini, B., Marconi, S., Bianchi, L., Armini, A., Anghileri, E., Locatelli, F., Paoletti,
F., Franciotta, D., Bini, L., and Bonetti, B. (2008) Transketolase and 2',3'-cyclic-nucleotide 3'-
phosphodiesterase type I isoforms are specifically recognized by IgG autoantibodies in multiple
sclerosis patients. Mol. Cell Proteomics 7, 2337-2349
136. Walsh, M. J., and Murray, J. M. (1998) Dual implication of 2',3'-cyclic nucleotide 3' phosphodiesterase
as major autoantigen and C3 complement-binding protein in the pathogenesis of multiple sclerosis. J
Clin. Invest 101, 1923-1931
137. Irani, D. N., Anderson, C., Gundry, R., Cotter, R., Moore, S., Kerr, D. A., McArthur, J. C., Sacktor, N.,
Pardo, C. A., Jones, M., Calabresi, P. A., and Nath, A. (2006) Cleavage of cystatin C in the
cerebrospinal fluid of patients with multiple sclerosis. Ann. Neurol 59, 237-247
The EAE model as foundation for proteomic biomarker studies
36
138. Nakashima, I., Fujinoki, M., Fujihara, K., Kawamura, T., Nishimura, T., Nakamura, M., and Itoyama,
Y. (2007) Alteration of cystatin C in the cerebrospinal fluid of multiple sclerosis. Ann. Neurol 62, 197-
200
139. Reindl, M., Knipping, G., Wicher, I., Dilitz, E., Egg, R., Deisenhammer, F., and Berger, T. (2001)
Increased intrathecal production of apolipoprotein D in multiple sclerosis. J Neuroimmunol. 119, 327-
332
140. Pitt, D., Nagelmeier, I. E., Wilson, H. C., and Raine, C. S. (2003) Glutamate uptake by
oligodendrocytes: Implications for excitotoxicity in multiple sclerosis. Neurology 61, 1113-1120
141. Logothetis, L., Mylonas, I. A., Baloyannis, S., Pashalidou, M., Orologas, A., Zafeiropoulos, A., Kosta,
V., and Theoharides, T. C. (2005) A pilot, open label, clinical trial using hydroxyzine in multiple
sclerosis. Int. J Immunopathol. Pharmacol. 18, 771-778
142. Alonso, A., Jick, S. S., and Hernan, M. A. (2006) Allergy, histamine 1 receptor blockers, and the risk of
multiple sclerosis. Neurology 66, 572-575
143. Moscarello, M. A., Mastronardi, F. G., and Wood, D. D. (2007) The role of citrullinated proteins
suggests a novel mechanism in the pathogenesis of multiple sclerosis. Neurochem. Res. 32, 251-256
144. De Seze J., Dubucquoi, S., Lefranc, D., Virecoulon, F., Nuez, I., Dutoit, V., Vermersch, P., and Prin, L.
(2001) IgG reactivity against citrullinated myelin basic protein in multiple sclerosis. J Neuroimmunol.
117, 149-155
145. Kim, J. K., Mastronardi, F. G., Wood, D. D., Lubman, D. M., Zand, R., and Moscarello, M. A. (2003)
Multiple sclerosis: an important role for post-translational modifications of myelin basic protein in
pathogenesis. Mol. Cell Proteomics 2, 453-462
146. Oguz, K. K., Kurne, A., Aksu, A. O., Karabulut, E., Serdaroglu, A., Teber, S., Haspolat, S., Senbil, N.,
Kurul, S., and Anlar, B. (2009) Assessment of citrullinated myelin by 1H-MR spectroscopy in early-
onset multiple sclerosis. AJNR Am. J Neuroradiol. 30, 716-721
147. Tranquill, L. R., Cao, L., Ling, N. C., Kalbacher, H., Martin, R. M., and Whitaker, J. N. (2000) Enhanced
T cell responsiveness to citrulline-containing myelin basic protein in multiple sclerosis patients. Mult.
Scler. 6, 220-225
148. Gresle, M. M., Shaw, G., Jarrott, B., Alexandrou, E. N., Friedhuber, A., Kilpatrick, T. J., and
Butzkueven, H. (2008) Validation of a novel biomarker for acute axonal injury in experimental
autoimmune encephalomyelitis. J Neurosci. Res. 86, 3548-3555
149. Proia, P., Schiera, G., Salemi, G., Ragonese, P., Savettieri, G., and Di, L., I. (2009) Neuronal and BBB
damage induced by sera from patients with secondary progressive multiple sclerosis. Int. J Mol. Med
24, 743-747
150. Blecharz, K. G., Haghikia, A., Stasiolek, M., Kruse, N., Drenckhahn, D., Gold, R., Roewer, N., Chan,
A., and Forster, C. Y. (2010) Glucocorticoid effects on endothelial barrier function in the murine brain
endothelial cell line cEND incubated with sera from patients with multiple sclerosis. Mult. Scler. 16,
293-302
151. Minagar, A., Ostanin, D., Long, A. C., Jennings, M., Kelley, R. E., Sasaki, M., and Alexander, J. S.
(2003) Serum from patients with multiple sclerosis downregulates occludin and VE-cadherin
expression in cultured endothelial cells. Mult. Scler. 9, 235-23.

Chapter 1
37
152. Table 26 from Spinal drug and delivery, page 216, Tony L. Yaksh – 1999, Elsevier sciences B.V. ISBN: 0-
444-82901-6 Chapter 8, Spinal cerebrospinal fluid chemistry and physiology, A.A. Artru, (seattle, WA,
USA), pp 177-238).
153. Table 27 from Spinal drug and delivery, page 216, Tony L. Yaksh – 1999, Elsevier sciences B.V. ISBN: 0-
444-82901-6 Chapter 8, Spinal cerebrospinal fluid chemistry and physiology, A.A. Artru, (seattle, WA,
USA), pp 177-238)

38
Chapter 2
39
The effect of pre-analytical factors on
stability of the proteome and selected
metabolites in cerebrospinal fluid (CSF)
Therese Rosenling1, Christiaan L. Slim1, Christin Christin1, Leon Coulier2, Shanna
Shi5, Marcel P. Stoop3, Jan Bosman1, Frank Suits6, Peter L. Horvatovich1, Norbert
Stockhofe-Zurwieden7, Rob Vreeken4, Thomas Hankemeier4, Alain J. van Gool8,
Theo M. Luider3, Rainer Bischoff1
1Analytical Biochemistry, Department of Pharmacy, University of
Groningen, Groningen, The Netherlands
2TNO, Quality of Life, Zeist, The Netherlands
3 Department of Neurology, Erasmus University Medical Center,
Rotterdam, The Netherlands
4Analytical BioSciences, Leiden/Amsterdam Centre for Drug Research,
Leiden University, Leiden, The Netherlands
5Netherlands Metabolomics Centre, Leiden/Amsterdam Centre for Drug
Research, Leiden University, Leiden, The Netherlands
6IBM TJ Watson Research Centre, Yorktown Heights, NY, USA
7Animal Sciences Group, Wageningen UR, Division Infectious Diseases,
Lelystad, The Netherlands
8Schering-Plough, Oss, The Netherlands
Rosenling et al. J Proteome Res. 2009 Dec;8(12):5511-22.
The effect of pre-analytical factors on the proteome and metabolites of CSF
40
Abstract
In order to standardize the use of cerebrospinal fluid (CSF) for biomarker research,
a set of stability studies have been performed on porcine samples to investigate
the influence of common sample handling procedures on proteins, peptides,
metabolites and free amino acids. This study focuses at the effect on proteins and
peptides, analyzed by applying label-free quantitation using microfluidics nano-
scale liquid chromatography coupled to quadrupole time-of-flight mass
spectrometry (chipLC-MS) as well as matrix assisted laser desorption ionization
Fourier transform ion cyclotron resonance mass spectrometry (MALDI-FT-ICR-
MS) and Orbitrap LC-MS/MS to trypsin-digested CSF samples. The factors
assessed were a 30 or 120 min time delay at room temperature before storage at -
80 °C after the collection of CSF in order to mimic potential delays in the clinic
(delayed storage), storage at 4 °C after trypsin digestion to mimic the time that
samples remain in the cooled auto-sampler of the analyzer, and repeated freeze-
thaw cycles to mimic storage and handling procedures in the laboratory. The
delayed storage factor was also analyzed by gas chromatography mass
spectrometry (GC-MS) and liquid chromatography mass spectrometry (LC-MS)
for changes on metabolites and free amino acids, respectively. Our results show
that repeated freeze/thawing introduced changes in transthyretin peptide levels.
The trypsin digested samples left at 4 °C in the autosampler showed a time-
dependent decrease of peak areas for peptides from prostaglandin D-synthase and
serotransferrin. Delayed storage of CSF lead to changes in prostaglandin D-
synthase derived peptides as well as to increased levels of certain amino acids and
metabolites. The changes of metabolites, amino acids and proteins in the delayed
storage study appear to be related to remaining white blood cells. Our
recommendations are to centrifuge CSF samples immediately after collection to
remove white blood cells, aliquot and then snap freeze the supernatant in liquid
nitrogen for storage at -80 °C. Preferably samples should not be left in the
autosampler for more than 24 hours and freeze/thaw cycles should be avoided if
at all possible.
Chapter 2
41
1. Introduction
In the search of molecular biomarkers for disorders of the central nervous system
(CNS), such as Alzheimer’s Disease (AD) or Multiple Sclerosis (MScl),
cerebrospinal fluid (CSF) is the body fluid of choice because of its proximity to the
diseased tissue and its relative ease of sampling (1-9). In order to obtain reliable
results and reduce the risk of detecting false biomarker candidates it is important
to handle samples properly and to control for the effect of pre-analytical
parameters on proteins or metabolites. Earlier a cleavage product of cystatin C
was reported as a possible biomarker for MScl, but later studies revealed that this
cleavage product was not linked to the disease but rather to the storage conditions
(10-12). This observation emphasizes that keeping control over factors such as
storage conditions, number of freeze/thaw cycles and the collection of CSF itself is
critical.
Studies on urine and plasma or serum have shown that internal (protease
activity, blood contamination and protein concentration) as well as external factors
(storage, handling, and analysis method) crucially affect the proteome profile (13-
17). There are a few reports on the stability of single proteins in CSF connected to
AD18-21 as well as on the effect of storage temperature (4 °C or 23 °C) on the
proteome profile of CSF by analyzing intact proteins and peptides with surface-
enhanced laser desorption/ionization time-of-flight mass spectrometry (SELDI-
TOF-MS) (20, 22).
Two studies on canine CSF report the effect of storage temperature on
protein concentration, glucose level, pH and enzyme activity (23) as well as the
effect of storage temperature, with or without addition of stabilizing agent, on the
cell count (24). Furthermore, guidelines have been published concerning pre-
analytical factors that should be examined (e.g. cytological examination and
glucose concentration measurement) leading to recommendations for proteomic
CSF analysis (25-27).
Many of the studies evaluating the influence of pre-analytical factors on
protein composition in body fluids have been performed by SELDI-TOF-MS (15,
16, 22, 28) a method that suffers from rather poor concentration sensitivity and
that may be prone to mass spectrometric artifacts (29). More sensitive approaches
using enrichment of proteins and peptides on magnetic bead separators or
separation by Liquid Chromatography (LC) followed by Matrix-Assisted Laser
Desorption Ionization Time-Of-Flight Mass Spectrometry (MALDI-TOF-MS) have
also indicated that conditions of sample handling and preparation are critical (14,
30-36).
In a study conducted by Anesi et al. the level of amino acids (Glu, Gly, Asp
and Tau) was analyzed with respect to different storage conditions (-20 °C and -80
The effect of pre-analytical factors on the proteome and metabolites of CSF
42
°C) after a number of pre-treatments (deproteinization, neutralization, no
treatment) (37). This study indicated changes in the amino acid concentrations in
samples that were not treated prior to long term storage. Another study by Levine
et al. reported the effect of storage at room temperature (for 72 hours) on CSF
metabolites (31). In this study the samples had been stored at -70 °C for 30 months
prior to analysis by NMR. NMR analysis revealed changes in metabolite
concentration with both increasing and decreasing concentration levels.
In this paper we describe a study into the effects of pre-analytical factors
on the porcine CSF proteome and metabolome using a variety of techniques
comprising LC-MS, GC-MS and MALDI-FT-ICR-MS.
2. Material and Methods
2.1. Sample set Porcine CSF was collected at the Animal Sciences Group, Wageningen University,
Division of Infectious Diseases, Lelystad, The Netherlands. Five conventional pigs
(ca. 100 kg weight, males) were euthanized and CSF was sampled from the
cerebromedullary cistern of the subarachnoid space in the cervical region directly
after euthanasia. Euthanasia was performed by intravenous injection of T61®
(Embutramid) (pig 3 [P3] and pig 7 [P7]) or pentobarbital (pig 2 [P2], pig 4 [P4]
and pig 5 [P5]) followed by exsanguination. Samples (~10 mL) were taken under
mild suction (using a syringe with a 22 G needle), transferred to a 50 mL Falcon
tube and immediately transported to the laboratory where contamination with red
blood cells (RBC) and white blood cells (WBC) was assessed with an F-800 cell
counter (Sysmex). The CSF samples from P2 contained 40 RBC/µL and 40
WBC/µL, P4 contained 40 RBC/µL and 60 WBC/µL and P5 had 120 RBC/µL and 40
WBC/µL before centrifugation (10 min, 1500 g). RBC or WBC were undetectable
after centrifugation. The CSF from P3 and P7 showed no contamination with RBC
but both contained 100 WBC/µL (samples were not centrifuged).
Aliquots of samples (1.5 mL) were directly snap-frozen in liquid nitrogen
(T0). Further aliquots were left for 30 min (T30) or 2 h at room temperature (T120)
before being frozen in liquid nitrogen and stored at -80 °C. The aliquots were
stored in 2 mL Nalgene Cryo-100-025u sterile tubes (part # N.Alg 5000-0020). For
studying the effect of WBC contamination on stability at room temperature
between CSF collection and freezing, samples T0, T30 and T120 of P3, P7 (not
centrifuged) and P2, P4 and P5 (centrifuged) were compared. For the freeze/thaw
study sample T0 from P3 was used and for evaluating stability of trypsin-digested
CSF at 4 °C T0 from P2 and P4 was used. The total protein concentration of the
samples was measured using the Micro BCA™ Assay (Pierce, Rockford, IL, USA).
For proteomics analysis CSF was depleted of the six most abundant serum
Chapter 2
43
proteins and digested with trypsin (see section 2.3). The mean protein
concentration in the non depleted samples was 870 ng/µL and in the depleted
samples it was 50 ng/μL (Relative Standard Deviation (RSD): < 10% measured in
triplicate).
A quality control (QC) sample was prepared to control for analytical
variability during the chipLC-MS analyses. This sample consisted of pooled,
depleted, trypsin-digested porcine CSF spiked with digested horse heart
cytochrome C (Fluka, part # 30396) (final concentration 100 fmol/μL). Prior to the
study all porcine CSF samples were exposed to two freeze/thaw cycles
(sampling/storage and depletion/storage). After this the samples were exposed to
at most two further freeze/thaw cycles before analysis (aliquoting and storage
between digestion and analysis).
After depletion the CSF was stored, and all reactions were carried out in 1.5 or 2
mL reaction tubes (Greiner Bio-One, part # 616 201/623 201). After digestion the
samples were transferred to plastic inserts (Waters, Milford, MA, USA, part #
WAT094170) inside glass vials with screw caps (Agilent Technologies, Santa Clara,
CA USA, part # 5187-0716 + 5182-0717).
2.2. Design of study In this study three pre-analytical parameters were assessed: 1. Delayed storage
after sample collection; porcine CSF was frozen at three different time points after
sampling (0, 30, 120 min at room temperature without centrifugation or after
centrifugation). The proteome profile was first assessed on the chipLC-MS
platform and subsequently by MALDI-FT-ICR-MS in a separate laboratory.
Furthermore the metabolome profile was assessed using two different analytical
platforms in two separate laboratories (see sections 2.4 – 2.8). 2. Number of
freeze/thaw cycles of depleted CSF; the proteome profile of depleted porcine CSF
exposed to different numbers of freeze/thaw cycles (control, 1×, 2×, 3×, 4×, 5× and
10× cycles) was assessed by chipLC-MS. 3. Storage of depleted/digested CSF at 4
°C; after depletion and digestion CSF was left at 4 °C for up to one month (control,
1 day, 1 week and 1 month) and the effect was assessed by chipLC-MS.
2.3. Sample preparation (proteomic analysis) For proteomic analysis all CSF samples were depleted of 6 highly abundant
proteins; albumin, IgG (immunoglobulin G), IgA (immunoglobulin A),
haptoglobin, transferrin and α-1-Antitrypsin by immuno-affinity chromatography.
Prior to depletion 200 μL of porcine CSF was concentrated 20 times on an
Ultrafree® -0.5 centrifugal filter device (5 kDa cut-off, Millipore, Billerica, MA,
USA) by centrifugation for 20 min at 12000 rpm (11290 g) at 4 °C. After
centrifugation ~10 μL of concentrated CSF (retentate of > 5 kDa) remained on the
The effect of pre-analytical factors on the proteome and metabolites of CSF
44
filter. This retentate was diluted in Buffer A (Agilent, part # 5185-5987) to a final
volume of 135 μL at 4 °C, transferred to a 0.22 μm cellulose acetate spin filter
(Agilent, part # 5185-5990) and centrifuged for 20 min at 13000 rpm (13250 g) (4
°C) to remove particulates. The filtrate was transferred to a sample vial (Agilent,
part # 5182-0716 + blue screw cap 5182-0717) with a 300 µL insert (Waters, part #
WAT094170) and 110 μL were injected on a Multiple Affinity Removal column,
Hu-6 (Human), 4.6 × 50 mm, (Agilent, part # 5185-5984) using an ÄKTA FPLC
system (Amersham Biosciences, Uppsala, Sweden) with detection at 280 nm. The
system was connected to a cooled autosampler (4 °C) and fraction collector. The
following elution scheme was used; 0-10 min, 100% buffer A (0.25 mL/min); 10-
13.5 min 100% buffer B (part # 5185-5988, Agilent) (1 mL/min); 13.5-20 min 100%
buffer A (0.25 mL/min). The flow-through fraction (depleted CSF collected
between 2.8-5.3 min) of a total volume of ~0.6 mL was collected. The depleted
protein fraction (containing the 6 depleted proteins) was also collected between
11.6-13.2 min in a total volume of ~1.6 mL. Both fractions were snap frozen in
liquid nitrogen and stored at -80 °C until further use.
The digestion of CSF for proteomics analysis was done according to the
following procedure; 30 μL CSF and 30 μL 0.1% RapiGest™ (in 50 mM
ammonium bicarbonate) (Waters) were added to the same sample tube (Greiner
Bio-One, Alphen aan den Rijn, The Netherlands, part # 623201). The sample was
reduced by adding 0.6 μL 1,4-dithiotreitol (DTT) (0.5 M) followed by incubation at
60 °C for 30 min After cooling to room temperature the sample was alkylated with
3μL iodoacetamide (IAM) (0.3 M) in the dark for 30 min at room temperature and
0.6 μL sequencing grade modified trypsin (Promega, Madison, WI, USA part #
V5111) (125 ng/µL) was added to give a trypsin to protein ratio of 1:20 (w/w). The
sample was incubated for ~16 h at 37 °C with slight vortexing (450 rpm) in a
thermomixer comfort (Eppendorf). Thereafter 6 μL hydrochloric acid (0.5 M) was
added to stop the digestion followed by incubation for 30 min at 37 °C to
hydrolyze the RapiGest™. The sample was centrifuged at 13000 rpm (13250 g) for
10 min at 4 °C to remove the insoluble part of the hydrolyzed RapiGest™ and any
particulates that might block the LC-chip. 60 μL of the liquid phase was
transferred to six screw cap vials (Agilent) with 300 μL inserts (Waters) in 10 μL
aliquots for chipLC-MS analysis.
2.4. ChipLC-MS(/MS) proteomic analysis A quadrupole-time-of-flight (QTOF) mass spectrometer (Agilent 6510) with a
liquid chromatography-chip electrospray ionization (LC-chip ESI) interface was
coupled to a nano LC system (Agilent 1200) with an 8 μL injection loop. The
instrument was operated under the MassHunter Data Acquisition software
(version B.01.02/B.01.03; Build 1.3.157.0; Agilent Technologies, Santa Clara, USA).
To compare peptide profiles, samples were analyzed by LC-MS and the

Chapter 2
45
discriminatory peptides were identified and assigned to proteins by targeted LC-
MS/MS. For the freeze-thaw and the 4 °C storage studies an LC-chip with a 40 nL
trap column was used (Protein ID chip #2; G4240-62002; Agilent Technologies;
separating column: 150 mm × 75 µm Zorbax 300SB-C18, 5 µm; trap column: 40 nL
Zorbax 300SB-C18, 5 µm). For the delayed storage study an LC-chip with a 160 nL
trap column was used (Protein ID chip #3; G4240-63001 SPQ110: Agilent
Technologies; separating column: 150 mm × 75 µm Zorbax 300SB-C18, 5 µm; trap
column: 160 nL Zorbax 300SB-C18, 5 µm). For LC separations the following
solutions were used; A: ultra-pure water (conductivity 18.2 MΩ, Elga Labwater,
Ede, The Netherlands) with 0.1% formic acid (98-100%, pro analysis, Merck,
Darmstadt Germany); B: acetonitrile (HPLC-S gradient grade, Biosolve,
Valkenswaard, The Netherlands) with 0.1% formic acid. 8 µL depleted, digested
sample (section 2.3.) was injected on the trap column at a flow rate of 3 μL/min
(3% B). After ~3 min the trapped peptides were transferred to the separation
column at a flow rate of 250 nL/min. For the freeze/thaw and the 4 °C storage
studies peptides were eluted from the separation column using the following
program: 80 min linear gradient from 3 to 50% B, 5 min linear gradient from 50 to
70% B, 20 min linear gradient from 70 to 3% B. For the delayed storage study the
gradient program was set up as follows; 80 min linear gradient from 3 to 40% B; 10
min linear gradient from 40 to 50% B; 10 min linear gradient from 50 to 3% B.
The MS settings were the following; mass range: 100-2000 m/z (delayed storage
50-2000 m/z), acquisition rate: 1 spectrum/sec (delayed storage 0.9 spectra/sec),
data storage: profile, fragmentor: 175 V, skimmer: 65 V, OCT 1 RF Vpp: 750 V. The
spray voltage was ~1800 V, drying gas (N2) temp: 325 °C, drying gas flow: 6 L/min.
Mass correction was done during analysis using internal standards (methyl
stearate m/z: 299.294457 and HP-1221 m/z: 1221.990637) continuously evaporating
from a wetted wick inside the spray chamber.
For protein identification, selected peptide ions were fragmented by
collision-induced dissociation. The MS/MS settings used were the following;
fragmentor: 175 V, skimmer: 65 V, OCT 1 RF Vpp: 750 V, precursor ion selection:
medium (4 m/z), mass range: 200-2000 m/z, acquisition rate MS: 4 scans/sec,
acquisition rate MS/MS: 3 scans/sec, collision energy 4 V/100 Da, offset: 2 V.
Collision energies for targeted ions; (4 °C storage) m/z 369.188, z = 2: 16 V, m/z
681.858, z = 2: 27 V, (delayed storage) m/z 638.655, z = 3: 25 V, m/z 921.443, z = 4: 30
V, m/z 957.479, z = 2: 35 V. In the freeze-thaw study fragmentation spectra were
obtained by auto-MS/MS; precursor setting: maximum 3 precursors/cycle,
absolute threshold: 1000, relative threshold: 0.01% of the most intense peak, active
exclusion enabled after 2 selections, release of active exclusion after 0.15 min,
precursors sorted by abundance only. The MS/MS files were stored in centroid
mode with a threshold of; MS: 300/0.01(absolute/relative threshold), MS/MS:
100/0.01.

The effect of pre-analytical factors on the proteome and metabolites of CSF
46
In order to assess the reproducibility of the analytical platform and exclude
method-related changes in peak areas, each sample was analyzed five times in a
randomized order with blank runs and QC samples between every 5th or 10th
sample injection (depending on the total number of samples analyzed in one
batch). Each sample was divided over 6 vials. Only one injection was done from
each vial to avoid changes caused by changing surface to volume ratios Each
sample was left in the autosampler for no more than 24 h at 4 °C. The QC samples
were injected in order to calculate the repeatability of the method over the course
of the analysis in terms of mass accuracy, retention time and peak area. Selected
cytochrome C peptides were smoothed (Gaussian function: width 15 points (1.08 s
between each data point) and integrated for calculation of the relative standard
deviation (RSD) with respect to peak area and retention time. The peak area RSD
was within +/- 20% and the retention time shifts were less than +/- 0.5% (7 sec.) for
the selected peaks. Mass accuracy was calculated as a mean of five measurements
of each selected ion and compared to the theoretical mass of the originating
peptides and was below +/- 7 ppm. Overall these data confirm the performance of
the chipLC-MS system as reported before.39
Prior to starting the analyses the linear range of the chipLC-MS system was
determined in order to define the maximal amount of digested CSF that could be
injected without column overloading (extensive peak broadening) or saturation of
the detector of the mass spectrometer (ion signal does no longer increase with
increasing injected amount) (data not shown). The injection volume was 8 μL
(~200 ng [4 pmol]) for the CSF stability samples and 5 µL for the QC samples (~125
ng [2.5 pmol], 500 fmol cytochrome C) (assuming a mean protein mass of 50 kDa).
Repeatability of the analysis is depicted in Figs. 1, 4 and 5 in the form of box and
whisker plots.
2.5. Data processing of chipLC-MS(/MS) data The raw LC-MS data were pre-processed using the Agilent MassHunter
Qualitative Analysis software (version B.01.02/B.01.03; Build 1.3.157.0;) (Agilent).
The data was analyzed both manually and with two in-house developed data
processing pipelines (40-42). Using the manual method conditions were compared
to each other by overlaying chromatograms (total ion chromatograms, [TIC] and
base peak chromatograms, [BPC]) in the MassHunter software. In regions with
visible differences between the conditions, extracted ion chromatograms (EIC’s)
were compared for peaks that were multiply-charged (trypsin digested proteins
analyzed on this instrument give rise to at least doubly charged ions). Peaks that
appeared to be discriminating were smoothed (Gaussian function: width 15 points
(1.08 s between each data point)) and integrated. Peak areas were compared using
a two-tailed Student’s t-test (Microsoft Office Excel 2007) and box plots were
created in Origin 7.0.

Chapter 2
47
For more extensive data analysis, two different data processing workflows
were used. An in-house data processing method developed in Matlab40 and a
data processing approach developed in C++ (42). For both approaches, raw data
was converted to MzData.XML. in profile mode. These files were further
converted to ASCII format with the following parameter settings; peak intensity: >
300 counts, mass range: 200-1600 m/z (no multiply charged ions were found
outside this range), retention time range: 3-80 min (elution range of the peptides).
The Matlab workflow consists of the following steps; meshing the raw data in the
m/z dimension to 1 amu mass resolution using Gaussian smoothing followed by
peak picking based on MN-rules with M = 3 and N = 8 (43). One dimensional peak
matching was performed using a sliding window along a given m/z trace (1 min
width and 0.1 min interval step) to create an aligned peak matrix containing the
intensities of the matched peaks from the different samples where the row
corresponds to the peak number and the column to the sample number.
In the C++ programmed data processing workflow the data was meshed to
an evenly spaced grid with a Gaussian algorithm of 0.01 amu mass resolution.
From these ‚meshed‛ files, the 10 000 most intense peaks were picked using a
slope-based geometric peak picking algorithm. In order to compare
chromatograms, peaks were time-aligned using warp2D, which uses the
overlapping peak volume of the extracted peaks as a two-dimensional benefit
function to drive the optimization procedure to obtain optimal retention time
correction. Peaks from different LC-MS runs were matched after alignment
resulting in one aligned matrix containing the average height, the average
retention time and the average m/z value for each peak. Columns correspond to
the individual samples (chromatograms) and rows to the matched peaks.
Using the aligned peak matrices from both workflows, a double cross-
validated Nearest Shrunken Centroid (NSC) algorithm (44) was applied to classify
samples according to the evaluated pre-analytical conditions and to detect peaks
that changed due to changing pre-analytical parameters. EIC’s were subsequently
extracted for these peaks from the raw data focusing on those peaks that occurred
at the highest shrinkage and lowest cross validation error. All ions in the list of
selected peaks were assessed with respect to their charge state. Only ions with a
charge of +2 or higher were further analyzed as described above for the manual
method. Class separation based on discriminatory peaks selected by the NSC
algortithm was visualized after Principal Component Analysis (PCA).
For each peak that by univariate statistical analysis (two-tailed Student’s t-
test) proved to be discriminatory between the sample groups, based on its p-value
being below 0.05 (confirmed in a second, independent set of analyses),
fragmentation spectra were manually extracted from the obtained MS/MS data
files, each selected spectrum was converted to the Mz.Data.XML format and
exported to the PhenyxOnline data base search tool (Geneva Bioinformatics,
The effect of pre-analytical factors on the proteome and metabolites of CSF
48
version 2.5/2.6; for details about parameters see Figure S.1 in Supporting
Information). The databases searched were uniprot_sprot (56.5_25_Nov_2008) and
uniprot_sprot_rev (56.5_25_Nov_2008) (the later database is a reverse version of
uniprot_sprot and serves to determine the false positive rate). Taxonomy:
mammalian, scoring model: ESI-QTOF (QTOF), parent charge: +2, +3, +4 (trust the
charge). The search was done in two subsequent rounds. The following search
parameters were common for both rounds: peptide/AC score: ≥ 5, peptide length:
≥ 5, p-value < 0.0001, enzyme: trypsin (KR), missed cleavage: ≤ 1, parent tolerance:
10 ppm. The following search parameters differed between round 1 and round 2
of the search. Round 1: amino acid modifications: Cys_CAM (carboxy
methylation, fixed), Oxidation_M (oxidation of methionine, variable, ≤ 2); Round
2: Cys_CAM (fixed), Oxidation_M (variable, ≤ 2), Oxidation_HW (oxidation of
histidine and tryptophan, variable, ≤ 2), DEAMID (deamidation, variable, ≤ 2),
PHOS (phosphorylation, variable, ≤ 2). The cleavage mode was set to ‘normal’ for
round 1 and to ‘half cleaved’ for round 2. The collision spectrum from each ion
was manually evaluated, only fragments with intensities clearly above the
background noise (50-100 counts) were considered.
2.6. MALDI-FT-ICR-MS and Orbitrap LC-MS/MS proteomic
analysis The samples were depleted and digested as described in section 2.3. A matrix
solution was prepared by dissolving 10 mg 2.5-dihydroxybenzoic acid (DHB) in 1
mL 0.1% TFA/water. All samples were desalted by loading them on C18 material
and washing the samples with 0.1% TFA/water. Subsequently the samples were
eluted in 10 µL 50% acetonitrile / 0.1% TFA in water. From each sample, 0.5 µL of
eluate was added to 0.5 µL of the matrix solution on a MALDI target plate
(600/384 AnchorChipTM with transponder plate, Bruker Daltonics, Germany). All
samples were manually spotted in duplicate. After drying at room temperature
the samples were measured manually on an APEX IV Qe 9.6 Tesla MALDI-FT-ICR
mass spectrometer (Bruker Daltonics, USA) equipped with the first version of the
vacuum Combisource, and a 20 Hz nitrogen laser with an irradiation area of ~200
µm. Multishot accumulation was used as recommended in the literature (45-47).
Ten laser shots were accumulated in the storage hexapole, transferred to the FT-
ICR cell, and scanned for 0.78 seconds. Fifty scans were summed for each mass
spectrum. The acquisition mass range was m/z 800 to 4000. The mass spectra were
subsequently apodized and zerofilled twice. An external mass calibration using
Pepmix standard (Bruker Daltonics, Germany) was applied using a quadratic
equation. All samples were measured until the highest peak in the spectrum had
attained a pre-determined intensity of 107counts. For each spectrum, all peak
intensities were normalized relative to this peak. The mass spectrometer was

Chapter 2
49
operated under Xmass version 7.0.8 and the data analysis was done using the
DataAnalysis version 3.4 (both from Bruker Daltonics).
LC-MS/MS measurements, for identification of the peptide peaks that by
visual inspection showed differential abundance by MALDI-FT-ICR-MS, were
carried out on an Ultimate 3000 nano LC system (Dionex, Germany) online
coupled to a hybrid linear ion trap /Orbitrap mass spectrometer (LTQ Orbitrap
XL; Thermo Fisher Scientific, Bremen, Germany) (Orbitrap LCMS/MS). 5 µL digest
was injected onto a C18 trap column (C18 PepMap, 300 µm ID × 5 mm, 5µm
particle size, 100 Å pore size; Dionex, Amsterdam, The Netherlands) and desalted
for 10 min using a flow rate of 20 µL /min 0.1% TFA. The trap column was then
switched online to the analytical column (PepMap C18, 300 μm ID × 5 mm, 3 μm
particle and 100 Å pore size; Dionex, The Netherlands) and peptides were eluted
with the following binary gradient: 0% - 25% solvent B for 120 min and 25% - 50%
solvent B for further 60 min, where solvent A consists of 2% acetonitrile and 0.1%
formic acid in water and solvent B consists of 80% acetonitrile and 0.08% formic
acid in water. Column flow rate was set to 300 nL/min For MS detection a data
dependent acquisition method was used starting with a high resolution survey
scan from 400 – 1800 m/z. This was detected in the Orbitrap (target value of
automatic gain control (AGC) 106, resolution 30,000 at 400 m/z; lock mass was set
to 445.120025 u (protonated (Si(CH3)2O)6). Based on this survey scan the 5 most
intense ions were consecutively isolated (AGC target set to 104 ions) and
fragmented by collision induced dissociation (CID) applying 35% normalized
collision energy in the linear ion trap. Precursors that had been selected for MS/MS
were excluded for further CID for 3 minutes. Peptides were identified using the
Bioworks 3.2 software package (Thermo Fisher Scientific, Germany) and its’
Sequest feature adhering to the HUPO criteria with XC scores of 1.8, 2.2 and 3.1
for singly, doubly and triply charged ions, respectively, in the uniprot_sprot
(56.5_25_Nov_2008, taxonomy: mammalia) database. The cut-off for mass
differences with the theoretical mass of the identified peptides was set at 2 ppm.
For identification of the peptides the Sequest feature of the Xcalibur software
package was used (Thermo Scientific).
2.7. GC-MS metabolomic analysis A non-targeted GC-MS method including a derivatization step, that has frequently
been applied for metabolomics studies (48), was used to analyze various classes of
(polar) metabolites simultaneously (e.g. amino acids, organic acids, fatty acids,
sugars). In short lyophilized CSF samples (100 μL) were derivatized using a
solution of ethoxyamine hydrochloride in pyridine as the oximation reagent
followed by silylation with N-methyl-N-(trimethylsilyl)trifluoroacetamide
principally as described earlier (48) 1 μL aliquots of the derivatized samples were
injected in splitless mode on an HP5-MS 30 mm × 0.25 mm × 0.25 mm capillary
The effect of pre-analytical factors on the proteome and metabolites of CSF
50
column (Agilent Technologies, Palo Alto, CA) using a temperature gradient from
70 °C to 320 °C at a rate of 5 °C/min. The GC-MS analysis was performed using an
Agilent 6890 gas chromatograph coupled to an Agilent 5973 quadrupole mass
spectrometer. Detection was carried out using MS detection in electron impact
ionization (70 eV) and full scan monitoring mode (m/z 15-800). During the
different steps in the sample work-up, i.e. lyophilization, derivatization and
injection, different (deuterated) internal standards (leucine-d3, glutamic acid-d3,
phenylalanine-d5, glucose-d7, alanine-d4, cholic acid-d4, dicyclohexylphthalate,
Sigma-Aldrich Chemie B.V. (Zwijndrecht, the Netherlands), typical purity of
standards > 97% atom D) were added at a level corresponding to the concentration
of analytes in the QC sample. The samples were derivatized in duplicate,
(excepted for t=0) and each derivatized sample was injected twice in a random
manner.
Data-pre-processing was carried out by automated peak integration
followed by a manual check. This resulted in a target list of 79 peaks (both known
and unknown metabolites) characterized by a combination of retention time and
m/z ratio. All peak areas were subsequently normalized using the internal
standard dicyclohexylphthalate (DCHP). These normalized target lists were used
for further statistical analysis. Identities were assigned based on the presence of
library searching of the identical mass spectra in the TNO database.
Multivariate data-analysis (PCA and PCDA) was performed in the Matlab
environment (version 6.5.1 Release 13, The Mathworks, 2003) using in-house
written routines and the PLS toolbox (version 3.0.2, Eigenvector Research, 2003).
Student’s t-test was applied to all amino acids and known metabolites. Metabolites
that showed a significant difference in both samples (p < 0.05) were considered as
discriminatory and some of them were represented as box plots. The analytical
error was within +/-20% based on replicated injections of the samples.
2.8. LC-MS analysis of amino acids Briefly, 10 µL of internal standard (13C15N-labeled amino acids; Asp_C13N15,
Glu_C13_N15, Asn_C13N15, Gln_C13N15, Gly_C13N15, Thr_C13_N15, Ala_C13_N15,
Arg_C13N15, Tyr_C13N15, Val_C13N15, Met_C13N15, Trp_C13N15, Phe_C13N15,
ILe_C13N15, Leu_C13N15, Lys_C13N15, Pro_C13_N15, Cambridge Isotope Laboratories,
Inc; Andover, MA, USA) with a concentration range of 70 ng/mL – 930 ng/mL for
different amino acids were added to 10 µL of CSF followed by addition of 100 µL
of methanol. The mixture was vortexed for 10 s and centrifuged at 10.000 rpm
(9408 g) for 10 min at 10 °C. The supernatant was dried under N2 and the residue
was dissolved in 80 μL borate buffer (pH 8.5). After 10 s vortexing, 20 μL of AQC
reagent (Waters part #: 186003836) was added and the mixture was vortexed
immediately. The sample was heated 10 min at 55 °C. Each sample (except P3: T0)
was prepared in duplicate. After cooling 1 μL of the reaction mixture was injected
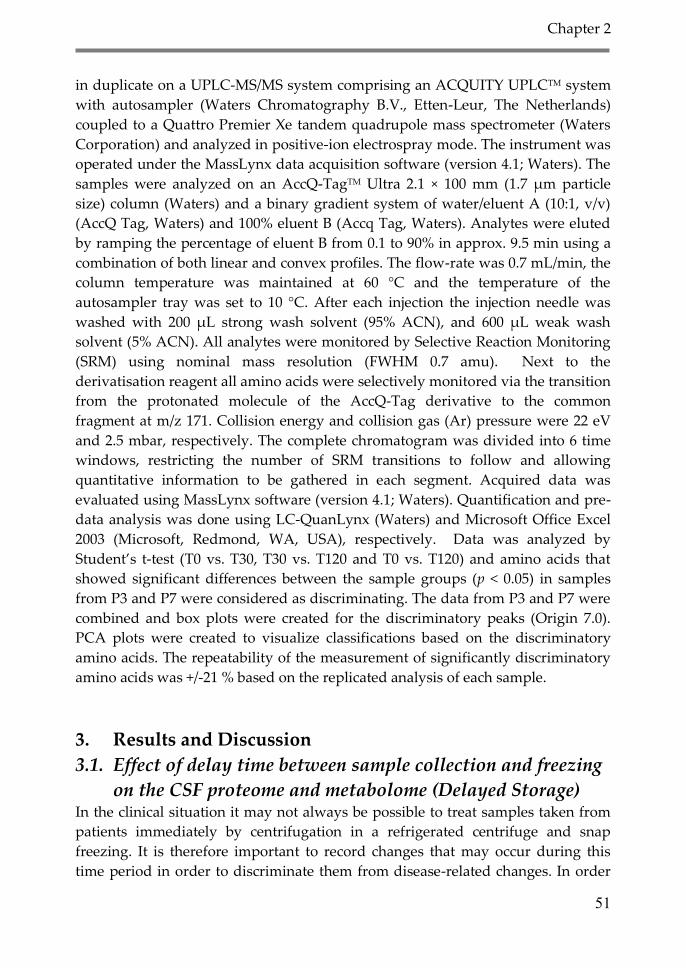
Chapter 2
51
in duplicate on a UPLC-MS/MS system comprising an ACQUITY UPLCTM system
with autosampler (Waters Chromatography B.V., Etten-Leur, The Netherlands)
coupled to a Quattro Premier Xe tandem quadrupole mass spectrometer (Waters
Corporation) and analyzed in positive-ion electrospray mode. The instrument was
operated under the MassLynx data acquisition software (version 4.1; Waters). The
samples were analyzed on an AccQ-TagTM Ultra 2.1 × 100 mm (1.7 μm particle
size) column (Waters) and a binary gradient system of water/eluent A (10:1, v/v)
(AccQ Tag, Waters) and 100% eluent B (Accq Tag, Waters). Analytes were eluted
by ramping the percentage of eluent B from 0.1 to 90% in approx. 9.5 min using a
combination of both linear and convex profiles. The flow-rate was 0.7 mL/min, the
column temperature was maintained at 60 °C and the temperature of the
autosampler tray was set to 10 °C. After each injection the injection needle was
washed with 200 μL strong wash solvent (95% ACN), and 600 μL weak wash
solvent (5% ACN). All analytes were monitored by Selective Reaction Monitoring
(SRM) using nominal mass resolution (FWHM 0.7 amu). Next to the
derivatisation reagent all amino acids were selectively monitored via the transition
from the protonated molecule of the AccQ-Tag derivative to the common
fragment at m/z 171. Collision energy and collision gas (Ar) pressure were 22 eV
and 2.5 mbar, respectively. The complete chromatogram was divided into 6 time
windows, restricting the number of SRM transitions to follow and allowing
quantitative information to be gathered in each segment. Acquired data was
evaluated using MassLynx software (version 4.1; Waters). Quantification and pre-
data analysis was done using LC-QuanLynx (Waters) and Microsoft Office Excel
2003 (Microsoft, Redmond, WA, USA), respectively. Data was analyzed by
Student’s t-test (T0 vs. T30, T30 vs. T120 and T0 vs. T120) and amino acids that
showed significant differences between the sample groups (p < 0.05) in samples
from P3 and P7 were considered as discriminating. The data from P3 and P7 were
combined and box plots were created for the discriminatory peaks (Origin 7.0).
PCA plots were created to visualize classifications based on the discriminatory
amino acids. The repeatability of the measurement of significantly discriminatory
amino acids was +/-21 % based on the replicated analysis of each sample.
3. Results and Discussion
3.1. Effect of delay time between sample collection and freezing
on the CSF proteome and metabolome (Delayed Storage) In the clinical situation it may not always be possible to treat samples taken from
patients immediately by centrifugation in a refrigerated centrifuge and snap
freezing. It is therefore important to record changes that may occur during this
time period in order to discriminate them from disease-related changes. In order
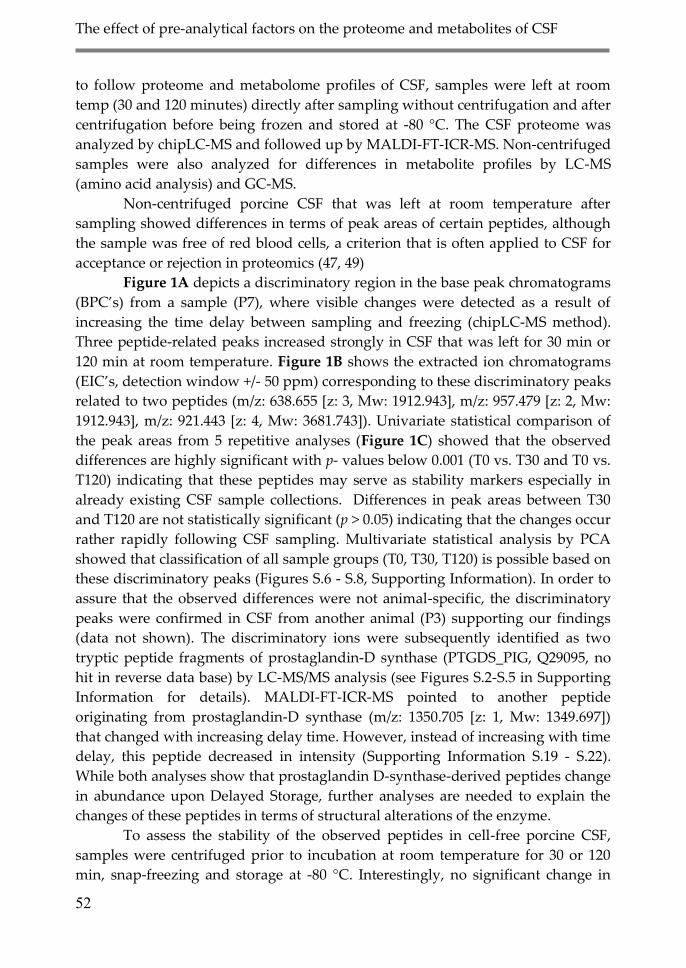
The effect of pre-analytical factors on the proteome and metabolites of CSF
52
to follow proteome and metabolome profiles of CSF, samples were left at room
temp (30 and 120 minutes) directly after sampling without centrifugation and after
centrifugation before being frozen and stored at -80 °C. The CSF proteome was
analyzed by chipLC-MS and followed up by MALDI-FT-ICR-MS. Non-centrifuged
samples were also analyzed for differences in metabolite profiles by LC-MS
(amino acid analysis) and GC-MS.
Non-centrifuged porcine CSF that was left at room temperature after
sampling showed differences in terms of peak areas of certain peptides, although
the sample was free of red blood cells, a criterion that is often applied to CSF for
acceptance or rejection in proteomics (47, 49)
Figure 1A depicts a discriminatory region in the base peak chromatograms
(BPC’s) from a sample (P7), where visible changes were detected as a result of
increasing the time delay between sampling and freezing (chipLC-MS method).
Three peptide-related peaks increased strongly in CSF that was left for 30 min or
120 min at room temperature. Figure 1B shows the extracted ion chromatograms
(EIC’s, detection window +/- 50 ppm) corresponding to these discriminatory peaks
related to two peptides (m/z: 638.655 [z: 3, Mw: 1912.943], m/z: 957.479 [z: 2, Mw:
1912.943], m/z: 921.443 [z: 4, Mw: 3681.743]). Univariate statistical comparison of
the peak areas from 5 repetitive analyses (Figure 1C) showed that the observed
differences are highly significant with p- values below 0.001 (T0 vs. T30 and T0 vs.
T120) indicating that these peptides may serve as stability markers especially in
already existing CSF sample collections. Differences in peak areas between T30
and T120 are not statistically significant (p > 0.05) indicating that the changes occur
rather rapidly following CSF sampling. Multivariate statistical analysis by PCA
showed that classification of all sample groups (T0, T30, T120) is possible based on
these discriminatory peaks (Figures S.6 - S.8, Supporting Information). In order to
assure that the observed differences were not animal-specific, the discriminatory
peaks were confirmed in CSF from another animal (P3) supporting our findings
(data not shown). The discriminatory ions were subsequently identified as two
tryptic peptide fragments of prostaglandin-D synthase (PTGDS_PIG, Q29095, no
hit in reverse data base) by LC-MS/MS analysis (see Figures S.2-S.5 in Supporting
Information for details). MALDI-FT-ICR-MS pointed to another peptide
originating from prostaglandin-D synthase (m/z: 1350.705 [z: 1, Mw: 1349.697])
that changed with increasing delay time. However, instead of increasing with time
delay, this peptide decreased in intensity (Supporting Information S.19 - S.22).
While both analyses show that prostaglandin D-synthase-derived peptides change
in abundance upon Delayed Storage, further analyses are needed to explain the
changes of these peptides in terms of structural alterations of the enzyme.
To assess the stability of the observed peptides in cell-free porcine CSF,
samples were centrifuged prior to incubation at room temperature for 30 or 120
min, snap-freezing and storage at -80 °C. Interestingly, no significant change in
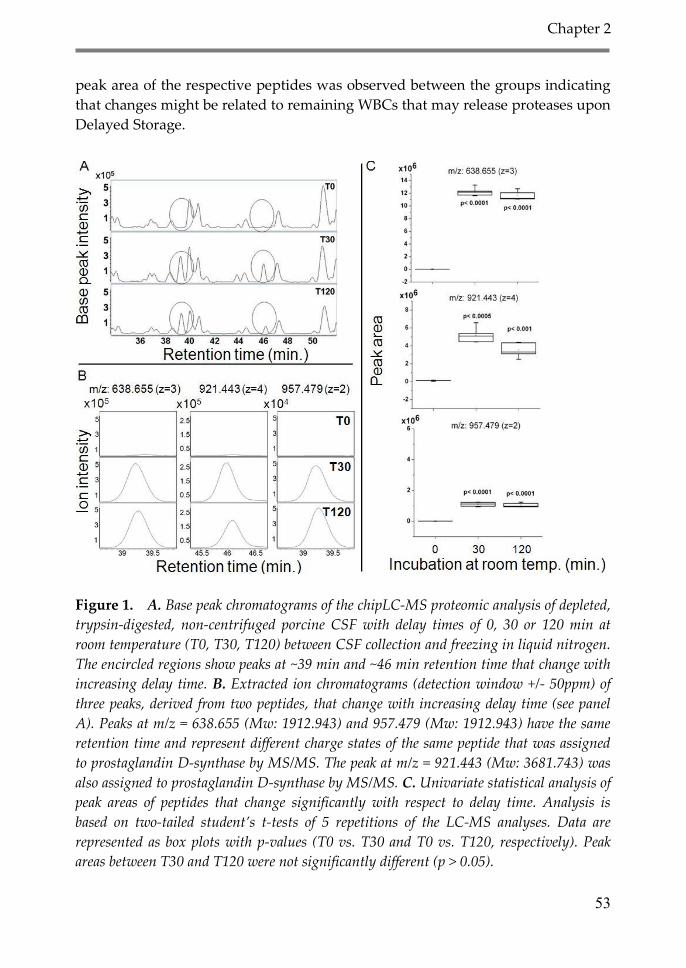
Chapter 2
53
peak area of the respective peptides was observed between the groups indicating
that changes might be related to remaining WBCs that may release proteases upon
Delayed Storage.
Figure 1. A. Base peak chromatograms of the chipLC-MS proteomic analysis of depleted,
trypsin-digested, non-centrifuged porcine CSF with delay times of 0, 30 or 120 min at
room temperature (T0, T30, T120) between CSF collection and freezing in liquid nitrogen.
The encircled regions show peaks at ~39 min and ~46 min retention time that change with
increasing delay time. B. Extracted ion chromatograms (detection window +/- 50ppm) of
three peaks, derived from two peptides, that change with increasing delay time (see panel
A). Peaks at m/z = 638.655 (Mw: 1912.943) and 957.479 (Mw: 1912.943) have the same
retention time and represent different charge states of the same peptide that was assigned
to prostaglandin D-synthase by MS/MS. The peak at m/z = 921.443 (Mw: 3681.743) was
also assigned to prostaglandin D-synthase by MS/MS. C. Univariate statistical analysis of
peak areas of peptides that change significantly with respect to delay time. Analysis is
based on two-tailed student’s t-tests of 5 repetitions of the LC-MS analyses. Data are
represented as box plots with p-values (T0 vs. T30 and T0 vs. T120, respectively). Peak
areas between T30 and T120 were not significantly different (p > 0.05).
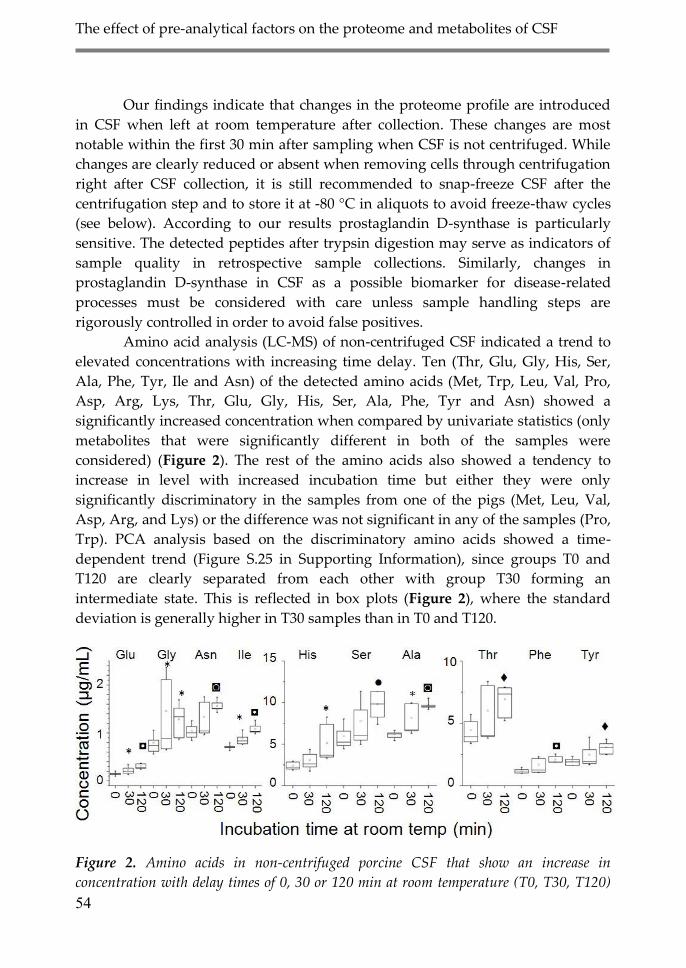
The effect of pre-analytical factors on the proteome and metabolites of CSF
54
Our findings indicate that changes in the proteome profile are introduced
in CSF when left at room temperature after collection. These changes are most
notable within the first 30 min after sampling when CSF is not centrifuged. While
changes are clearly reduced or absent when removing cells through centrifugation
right after CSF collection, it is still recommended to snap-freeze CSF after the
centrifugation step and to store it at -80 °C in aliquots to avoid freeze-thaw cycles
(see below). According to our results prostaglandin D-synthase is particularly
sensitive. The detected peptides after trypsin digestion may serve as indicators of
sample quality in retrospective sample collections. Similarly, changes in
prostaglandin D-synthase in CSF as a possible biomarker for disease-related
processes must be considered with care unless sample handling steps are
rigorously controlled in order to avoid false positives.
Amino acid analysis (LC-MS) of non-centrifuged CSF indicated a trend to
elevated concentrations with increasing time delay. Ten (Thr, Glu, Gly, His, Ser,
Ala, Phe, Tyr, Ile and Asn) of the detected amino acids (Met, Trp, Leu, Val, Pro,
Asp, Arg, Lys, Thr, Glu, Gly, His, Ser, Ala, Phe, Tyr and Asn) showed a
significantly increased concentration when compared by univariate statistics (only
metabolites that were significantly different in both of the samples were
considered) (Figure 2). The rest of the amino acids also showed a tendency to
increase in level with increased incubation time but either they were only
significantly discriminatory in the samples from one of the pigs (Met, Leu, Val,
Asp, Arg, and Lys) or the difference was not significant in any of the samples (Pro,
Trp). PCA analysis based on the discriminatory amino acids showed a time-
dependent trend (Figure S.25 in Supporting Information), since groups T0 and
T120 are clearly separated from each other with group T30 forming an
intermediate state. This is reflected in box plots (Figure 2), where the standard
deviation is generally higher in T30 samples than in T0 and T120.
Figure 2. Amino acids in non-centrifuged porcine CSF that show an increase in
concentration with delay times of 0, 30 or 120 min at room temperature (T0, T30, T120)
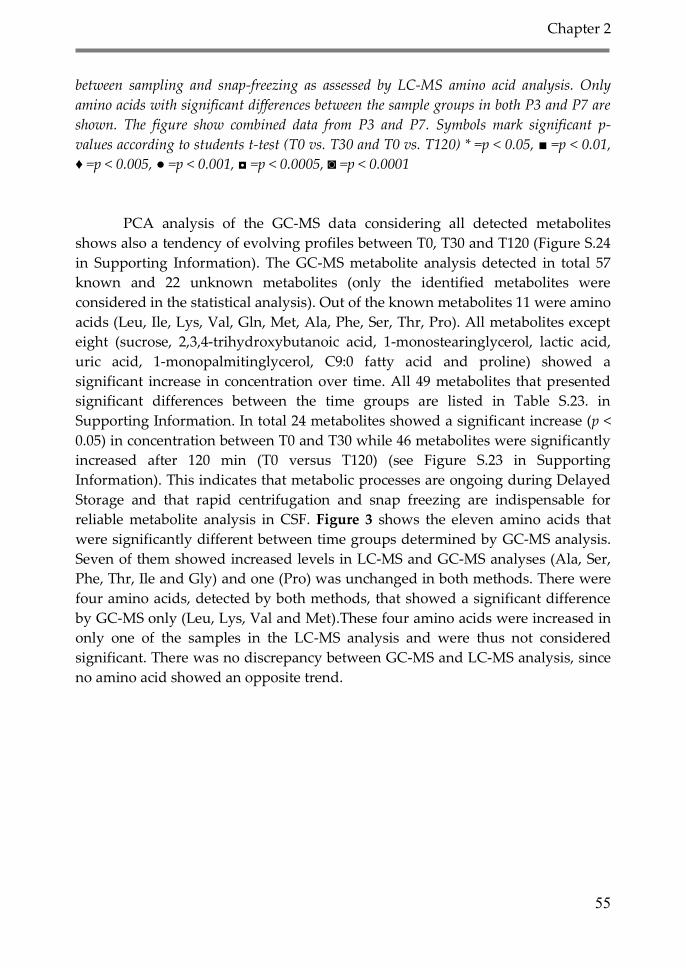
Chapter 2
55
between sampling and snap-freezing as assessed by LC-MS amino acid analysis. Only
amino acids with significant differences between the sample groups in both P3 and P7 are
shown. The figure show combined data from P3 and P7. Symbols mark significant p-
values according to students t-test (T0 vs. T30 and T0 vs. T120) * =p < 0.05, ■ =p < 0.01,
♦ =p < 0.005, ● =p < 0.001, ◘ =p < 0.0005, ◙ =p < 0.0001
PCA analysis of the GC-MS data considering all detected metabolites
shows also a tendency of evolving profiles between T0, T30 and T120 (Figure S.24
in Supporting Information). The GC-MS metabolite analysis detected in total 57
known and 22 unknown metabolites (only the identified metabolites were
considered in the statistical analysis). Out of the known metabolites 11 were amino
acids (Leu, Ile, Lys, Val, Gln, Met, Ala, Phe, Ser, Thr, Pro). All metabolites except
eight (sucrose, 2,3,4-trihydroxybutanoic acid, 1-monostearinglycerol, lactic acid,
uric acid, 1-monopalmitinglycerol, C9:0 fatty acid and proline) showed a
significant increase in concentration over time. All 49 metabolites that presented
significant differences between the time groups are listed in Table S.23. in
Supporting Information. In total 24 metabolites showed a significant increase (p <
0.05) in concentration between T0 and T30 while 46 metabolites were significantly
increased after 120 min (T0 versus T120) (see Figure S.23 in Supporting
Information). This indicates that metabolic processes are ongoing during Delayed
Storage and that rapid centrifugation and snap freezing are indispensable for
reliable metabolite analysis in CSF. Figure 3 shows the eleven amino acids that
were significantly different between time groups determined by GC-MS analysis.
Seven of them showed increased levels in LC-MS and GC-MS analyses (Ala, Ser,
Phe, Thr, Ile and Gly) and one (Pro) was unchanged in both methods. There were
four amino acids, detected by both methods, that showed a significant difference
by GC-MS only (Leu, Lys, Val and Met).These four amino acids were increased in
only one of the samples in the LC-MS analysis and were thus not considered
significant. There was no discrepancy between GC-MS and LC-MS analysis, since
no amino acid showed an opposite trend.
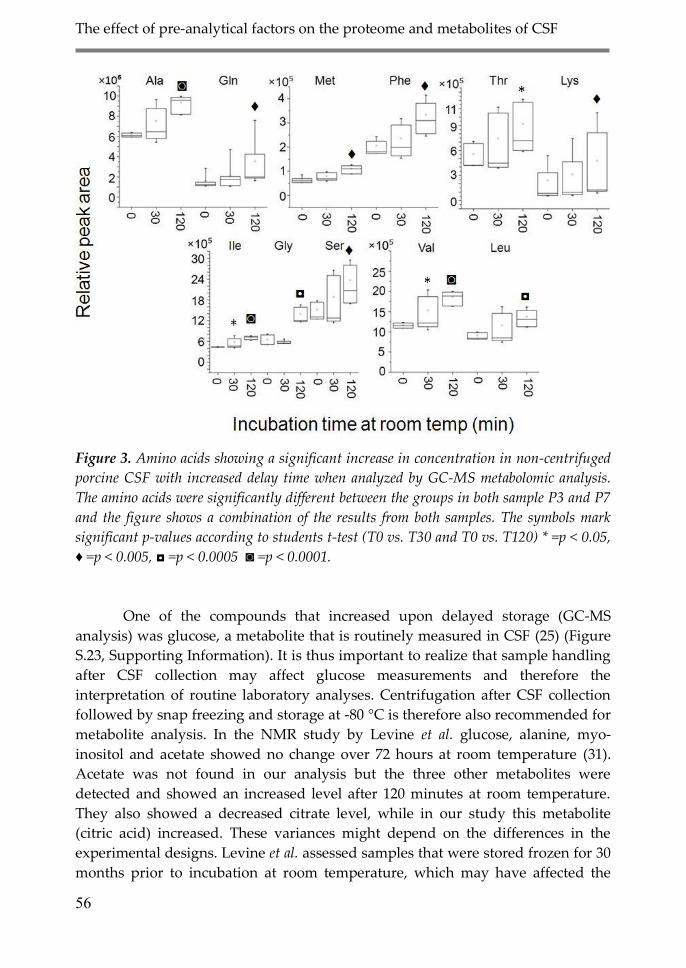
The effect of pre-analytical factors on the proteome and metabolites of CSF
56
Figure 3. Amino acids showing a significant increase in concentration in non-centrifuged
porcine CSF with increased delay time when analyzed by GC-MS metabolomic analysis.
The amino acids were significantly different between the groups in both sample P3 and P7
and the figure shows a combination of the results from both samples. The symbols mark
significant p-values according to students t-test (T0 vs. T30 and T0 vs. T120) * =p < 0.05,
♦ =p < 0.005, ◘ =p < 0.0005 ◙ =p < 0.0001.
One of the compounds that increased upon delayed storage (GC-MS
analysis) was glucose, a metabolite that is routinely measured in CSF (25) (Figure
S.23, Supporting Information). It is thus important to realize that sample handling
after CSF collection may affect glucose measurements and therefore the
interpretation of routine laboratory analyses. Centrifugation after CSF collection
followed by snap freezing and storage at -80 °C is therefore also recommended for
metabolite analysis. In the NMR study by Levine et al. glucose, alanine, myo-
inositol and acetate showed no change over 72 hours at room temperature (31).
Acetate was not found in our analysis but the three other metabolites were
detected and showed an increased level after 120 minutes at room temperature.
They also showed a decreased citrate level, while in our study this metabolite
(citric acid) increased. These variances might depend on the differences in the
experimental designs. Levine et al. assessed samples that were stored frozen for 30
months prior to incubation at room temperature, which may have affected the
Chapter 2
57
outcome. The fact that the incubation time was significantly longer (72 hours
compared to maximally 2 hours in our study) may have also affected the results.
Some metabolites may decrease in concentration because of adsorption to the tube
walls (50) while others might increase due to enzymatic processes. Furthermore
Levine et al. revealed that lactate, creatine, glutamine and creatinine were found to
increase. While lactate and creatine were not detected in our GC-MS analysis, both
glutamine and creatinine showed the same result in our analysis as in the NMR
study.
3.2. Effect of freeze/thaw cycles on the CSF proteome Freeze/thaw cycles are often unavoidable when analyzing biological samples.
Freeze/thawing is known to affect biological samples and notably to induce
conformational changes in proteins that may ultimately lead to aggregation or
degradation (51-53). In order to assess the influence of freeze/thawing on the
proteome profile, depleted non-centrifuged porcine CSF was exposed to 1×, 2×, 3×,
4×, 5× or 10× freeze/thaw cycles and compared to the starting material. A freeze-
thaw cycle was comprised of 30 min thawing on ice and 2 min freezing in liquid
nitrogen. All samples were left on ice throughout the study until the overnight
trypsin digestion (the control sample was thus left on ice throughout the entire
process of freeze/thawing (~ 5.5 h until digestion) and the 5 × freeze/thaw sample
was left on ice ~ 2.5 h). The experiment was performed twice on two separate
dates on CSF from the same animal (P3, T0). Only peaks that showed the same
pattern in both the experiments were considered as discriminatory. The
chromatograms of freeze/thaw-treated samples did not show differences when
inspected visually at the TIC/BPC level. However, detailed statistical analysis after
data processing (see section 2.4) revealed four tryptic peptide peaks out of 41
peaks on the list that changed significantly in peak area when comparing the
starting material with a sample having undergone 10 freeze/thaw cycles. PCA
analysis based on the discriminatory peaks showed a clear discrepancy between
the control group and the 10× freeze/thaw group (Figure S.14 in Supporting
Information). Figure 4A depicts the EIC’s (detection window +/- 50 ppm) of the
four peptide peaks, that were identified by LC-MS/MS as tryptic fragments of
transthyretin (TTY_PIG, P50390, no hit in reverse data base) (m/z: 428.234 [z: 2,
Mw: 854.453], m/z: 464.267 [z: 2, Mw: 926.519], m/z: 555.265 [z: 3, Mw: 1662.7732],
m/z: 681.838 [z: 2, Mw: 1361.661]) indicating that transthyretin is particularly
sensitive to freeze/thawing (Supporting Information, Figures S.9 - S.13). Univariate
statistical analysis of the peak areas (Figure 4B) resulted in highly significant
differences. Analysis of these peptides for an increasing number of freeze/thaw
cycles showed that 3 of the 4 peptides were already increased after a single
freeze/thaw cycle while one peptide (m/z: 428.234) increased only significantly
after 10 freeze/thaw cycles (Figure 4C). These results emphasize that the number
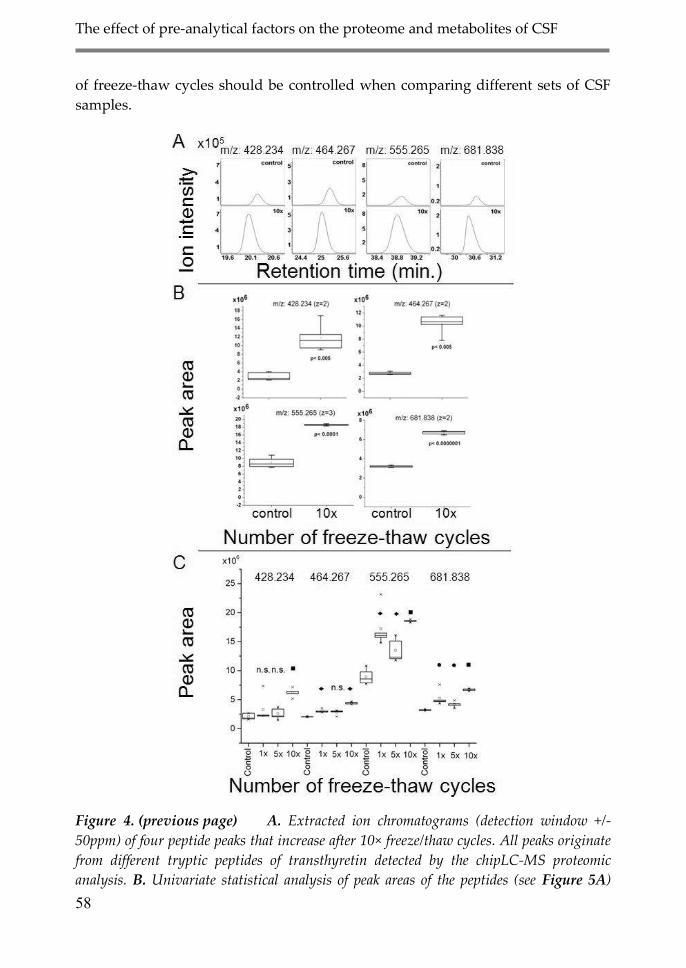
The effect of pre-analytical factors on the proteome and metabolites of CSF
58
of freeze-thaw cycles should be controlled when comparing different sets of CSF
samples.
Figure 4. (previous page) A. Extracted ion chromatograms (detection window +/-
50ppm) of four peptide peaks that increase after 10× freeze/thaw cycles. All peaks originate
from different tryptic peptides of transthyretin detected by the chipLC-MS proteomic
analysis. B. Univariate statistical analysis of peak areas of the peptides (see Figure 5A)
Chapter 2
59
based on two-tailed students t-tests of 5 repetitions of the chipLC-MS runs. The same
experiment was performed twice on CSF from the same pig confirming the results. Data
are represented as box plots with p-values (control vs. 10× freeze/thaw cycles). C.
Univariate statistical analysis of peak areas of the peptides that change significantly with
respect to the number of freeze/thaw cycles (see Figure 5A). Analysis is based on two-
tailed students t-tests of 5 repetitions of the chipLC-MS runs of depleted, trypsin-digested,
porcine CSF. The same experiment was performed twice confirming the results. Data are
represented as box plots with p-values (control vs. 1× freeze/thaw cycle, control vs. 5×
freeze/thaw cycles, control vs. 10× freeze/thaw cycles, respectively). ●: p< 0.05, ♦ p< 0.005,
■: p< 0.0001, n.s: non significant with respect to the control CSF sample.
Transthyretin is a homo-tetrameric protein present in plasma and CSF that
is known to be potentially unstable and prone to fibril formation leading to
amyloidosis causing plaque formation in Alzheimer’s disease (54). Mutants of
transthyretin are presently being screened with respect to the risk of developing
Familial Amyloidotic Polyneuropathy (55). This propensity for aggregation might
explain the sensitivity of transthyretin to repeated freeze/thawing. The strong
increase in tryptic peptides after freeze/thaw cycles indicates that cleavage sites
become more accessible possibly due to a change in conformation. This finding
underlines that transthyretin must be considered with caution as biomarker
candidate due to its structural instability and that the number of freeze/thaw
cycles should be carefully controlled, since changes in transthyretin levels may
simply be due to freeze-thawing rather than to biological processes related to the
disease of interest.
3.3. Effect of storage at 4 °C after digestion on CSF proteome
analysis Earlier results from our group have shown that peptide concentrations may
change during storage in the autosampler of the LC-MS system at 4 °C. We
therefore investigated whether this is also the case for depleted, trypsin-digested
CSF, since different samples might stay for various time periods in the
autosampler prior to injection, which may lead to differences in peptide profiles.
While randomization of the order of injection can alleviate this problem to some
extent, it will lead to an increased variability of the results making observation of
minor changes in peptide concentrations related to disease difficult. For the
discovery of peptide peaks that are susceptible to this effect, we compared freshly
prepared (depleted, trypsin-digested) porcine CSF (P4) with the same samples
stored for 1 month at 4 °C. PCA analysis based on the discriminatory peaks
showed a distinct difference between the control group and the 1 month sample
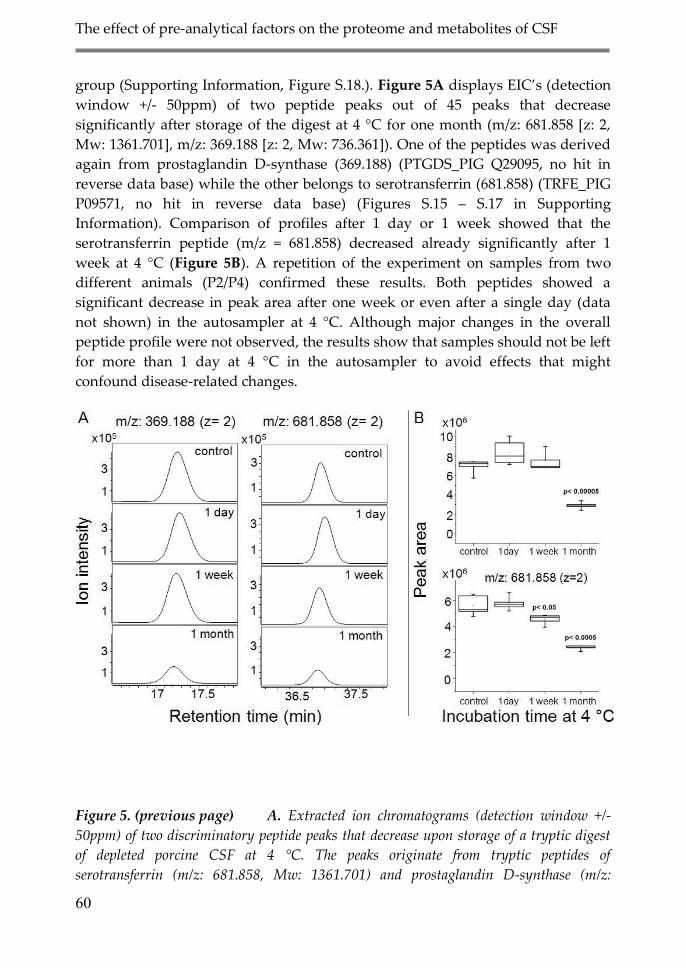
The effect of pre-analytical factors on the proteome and metabolites of CSF
60
group (Supporting Information, Figure S.18.). Figure 5A displays EIC’s (detection
window +/- 50ppm) of two peptide peaks out of 45 peaks that decrease
significantly after storage of the digest at 4 °C for one month (m/z: 681.858 [z: 2,
Mw: 1361.701], m/z: 369.188 [z: 2, Mw: 736.361]). One of the peptides was derived
again from prostaglandin D-synthase (369.188) (PTGDS_PIG Q29095, no hit in
reverse data base) while the other belongs to serotransferrin (681.858) (TRFE_PIG
P09571, no hit in reverse data base) (Figures S.15 – S.17 in Supporting
Information). Comparison of profiles after 1 day or 1 week showed that the
serotransferrin peptide (m/z = 681.858) decreased already significantly after 1
week at 4 °C (Figure 5B). A repetition of the experiment on samples from two
different animals (P2/P4) confirmed these results. Both peptides showed a
significant decrease in peak area after one week or even after a single day (data
not shown) in the autosampler at 4 °C. Although major changes in the overall
peptide profile were not observed, the results show that samples should not be left
for more than 1 day at 4 °C in the autosampler to avoid effects that might
confound disease-related changes.
Figure 5. (previous page) A. Extracted ion chromatograms (detection window +/-
50ppm) of two discriminatory peptide peaks that decrease upon storage of a tryptic digest
of depleted porcine CSF at 4 °C. The peaks originate from tryptic peptides of
serotransferrin (m/z: 681.858, Mw: 1361.701) and prostaglandin D-synthase (m/z:
Chapter 2
61
369.188, Mw: 736.361)) detected by the chipLC-MS proteomic analysis B. Univariate
statistical analysis of peak areas of peptides that change significantly upon storage of a
tryptic digest of depleted porcine CSF at 4 °C (see Figure 5A). Analysis is based on two-
tailed students t-tests of 5 repetitions of the chipLC-MS runs of depleted, trypsin-digested,
porcine CSF. Data are represented as box plots with p-values for cases that were
significantly different (control vs. 1 month and control vs. 1 week).
4. Conclusions
In this study we have evaluated a number of pre-analytical factors related to
sample handling of CSF to assess their effect on the protein, peptide and
metabolite profiles using different analytical platforms. The time delay between
CSF collection, centrifugation and snap-freezing proved to affect notably
prostaglandin D-synthase as revealed by a significant increase of two peptides.
Metabolite analysis showed that the level of a number of metabolites, including
free amino acids, increased during delayed storage. These changes indicate that
remaining enzymatic activity in CSF after collection may lead to altered metabolite
and protein levels, emphasizing that CSF should be centrifuged and snap frozen
as soon as possible after collection for proteomics or metabolomics studies. The
prostaglandin D-synthase-derived peptides and the identified metabolites may be
used to assess consistent sample handling notably when considering analysis of
existing CSF sample collections retrospectively.
The addition of stabilizing agents or specific pretreatments (protease
inhibitors, deproteinization) was not assessed in this study. The addition of
stabilizing agents alters the samples by introducing additional compounds, which
lead to new peaks in the mass spectra and chromatogram. It was our intention to
handle CSF in a way to avoid difficulties with subsequent analyses. In this study,
we wanted to assess how CSF is affected during a possible delay of sample
handling in the clinic.
CSF samples should ideally be centrifuged immediately after collection
followed by storage at -80 °C in order to remove all cellular elements and to avoid
protease activation and other kinds of degradation of macromolecules. Unless
sample handling in the clinic is carefully controlled, we recommend studies
targeting certain proteins (e.g. prostaglandin D-synthase, transthyretin) or
metabolites to be cautious with interpretations. We have indications that even
minor contamination of CSF with white blood cells accelerates the observed
changes and that it is not sufficient to assess that CSF is free of erythrocytes. Chow
et al. (56) and Steele et al. (57) pointed out that the major part of the WBC’s lysed
when CSF samples were exposed to room temperature for 22 hours and that this
The effect of pre-analytical factors on the proteome and metabolites of CSF
62
process continues at 4 °C even if the rate is slower. This indicates that leaving cell-
containing CSF samples on ice is not recommended.
We have also shown that widely used sample handling routines such as
freeze/thawing or keeping digested CSF in an autosampler at 4 °C prior to LC-MS
analysis can induce changes in proteome-derived peptide profiles. In order to
avoid the introduction of unnecessary freeze/thaw cycles, samples should be
aliquoted after centrifugation in volumes that avoid freeze-thawing. CSF samples
that have been exposed to repeated freeze/thaw cycles are not ideal for the
assessment of transthyretin, since peptides of this protein showed an increased
level with increasing numbers of freeze/thaw cycles. Samples remaining for
extensive time periods (> 24 hours) in a cooled autosampler are not reliable when
it comes to the quantitative analysis of for example, serotransferrin and
prostaglandin D-synthase.
Several factors affect the stability of proteins, peptides and metabolites in
CSF. We focused on the effect of delay time between CSF sampling and freezing,
the number of freeze/thaw cycles and the stability of trypsin-digested CSF in the
autosampler. Other factors that might be interesting to assess are the material of
the sample tubes, long term storage at different temperatures and the effect of
adding stabilizing agents.
Acknowledgment
The authors would like to thank Bas Muilwijk for the GC-MS analysis and Adrie
Dane for the targeted amino acid LC-MS data analysis support. This study was
financially supported by and performed within the framework of the Top Institute
Pharma project D4-102. The work was further supported by the BioRange 2.2.3
project from the Netherlands Proteomics and Bioinformatics Centers (Christin).
Supporting Information
Data base search criteria and results, MS/MS spectra, amino acid sequences of
identified proteins and sequence coverage, PCA plots, lists of discriminatory
metabolites in GC-MS analysis.
Chapter 2
63
References
1. Belogurov, A. A., Jr.; Kurkova, I. N.; Friboulet, A.; Thomas, D.; Misikov, V. K.; Zakharova, M. Y.;
Suchkov, S. V.; Kotov, S. V.; Alehin, A. I.; Avalle, B.; Souslova, E. A.; Morse, H. C., III; Gabibov, A. G.;
Ponomarenko, N. A. Recognition and Degradation of Myelin Basic Protein Peptides by Serum
Autoantibodies: Novel Biomarker for Multiple Sclerosis. J. Immunol. 2008, 180 (2), 1258-1267.
2. Dekker, L. J.; Burgers, P. C.; Kros, J. M.; Smitt, P. A.; Luider, T. M. Peptide Profiling of Cerebrospinal
Fluid by Mass Spectrometry. Expert. Rev. Proteomics. 2006, 3 (3), 297-309.
3. Lutz, N. W.; Viola, A.; Malikova, I.; Confort-Gouny, S.; Ranjeva, J. P.; Pelletier, J.; Cozzone, P. J. A
Branched-Chain Organic Acid Linked to Multiple Sclerosis: First Identification by NMR Spectroscopy
of CSF. Biochem. Biophys. Res. Commun. 2007, 354 (1), 160-164.
4. Myint, K. T.; Aoshima, K.; Tanaka, S.; Nakamura, T.; Oda, Y. Quantitative Profiling of Polar Cationic
Metabolites in Human Cerebrospinal Fluid by Reversed-Phase Nanoliquid Chromatography/Mass
Spectrometry. Anal. Chem. 2009, 81 (3), 1121-1129.
5. Noben, J. P.; Dumont, D.; Kwasnikowska, N.; Verhaert, P.; Somers, V.; Hupperts, R.; Stinissen, P.;
Robben, J. Lumbar Cerebrospinal Fluid Proteome in Multiple Sclerosis: Characterization by
Ultrafiltration, Liquid Chromatography, and Mass Spectrometry. J. Proteome. Res. 2006, 5 (7), 1647-
1657.
6. Rejdak, K.; Petzold, A.; Stelmasiak, Z.; Giovannoni, G. Cerebrospinal Fluid Brain Specific Proteins in
Relation to Nitric Oxide Metabolites During Relapse of Multiple Sclerosis. Mult. Scler. 2008, 14 (1), 59-
66.
7. Stoop, M. P.; Dekker, L. J.; Titulaer, M. K.; Burgers, P. C.; Sillevis Smitt, P. A.; Luider, T. M.; Hintzen,
R. Q. Multiple Sclerosis-Related Proteins Identified in Cerebrospinal Fluid by Advanced Mass
Spectrometry. Proteomics. 2008, 8 (8), 1576-1585.
8. Walter, A.; Korth, U.; Hilgert, M.; Hartmann, J.; Weichel, O.; Hilgert, M.; Fassbender, K.; Schmitt, A.;
Klein, J. Glycerophosphocholine Is Elevated in Cerebrospinal Fluid of Alzheimer Patients. Neurobiol.
Aging 2004, 25 (10), 1299-1303.
9. Zhang, J.; Goodlett, D. R.; Montine, T. J. Proteomic Biomarker Discovery in Cerebrospinal Fluid for
Neurodegenerative Diseases. J. Alzheimers. Dis. 2005, 8 (4), 377-386.
10. Del Boccio, P.; Pieragostino, D.; Lugaresi, A.; Di, I. M.; Pavone, B.; Travaglini, D.; D'Aguanno, S.;
Bernardini, S.; Sacchetta, P.; Federici, G.; Di, I. C.; Gambi, D.; Urbani, A. Cleavage of Cystatin C Is Not
Associated With Multiple Sclerosis. Ann. Neurol. 2007, 62 (2), 201-204.
11. Hansson, S. F.; Simonsen, A. H.; Zetterberg, H.; Andersen, O.; Haghighi, S.; Fagerberg, I.; Andreasson,
U.; Westman-Brinkmalm, A.; Wallin, A.; Ruetschi, U.; Blennow, K. Cystatin C in Cerebrospinal Fluid
and Multiple Sclerosis. Ann. Neurol. 2007, 62 (2), 193-196.
12. Irani, D. N.; Anderson, C.; Gundry, R.; Cotter, R.; Moore, S.; Kerr, D. A.; McArthur, J. C.; Sacktor, N.;
Pardo, C. A.; Jones, M.; Calabresi, P. A.; Nath, A. Cleavage of Cystatin C in the Cerebrospinal Fluid of
Patients With Multiple Sclerosis. Ann. Neurol. 2006, 59 (2), 237-247.
13. Chaigneau, C.; Cabioch, T.; Beaumont, K.; Betsou, F. Serum Biobank Certification and the
Establishment of Quality Controls for Biological Fluids: Examples of Serum Biomarker Stability After
Temperature Variation. Clin. Chem. Lab Med. 2007, 45 (10), 1390-1395.

The effect of pre-analytical factors on the proteome and metabolites of CSF
64
14. Hsieh, S. Y.; Chen, R. K.; Pan, Y. H.; Lee, H. L. Systematical Evaluation of the Effects of Sample
Collection Procedures on Low-Molecular-Weight Serum/Plasma Proteome Profiling. Proteomics. 2006,
6 (10), 3189-3198.
15. Papale, M.; Pedicillo, M. C.; Thatcher, B. J.; Di, P. S.; Lo, M. L.; Bufo, P.; Rocchetti, M. T.; Centra, M.;
Ranieri, E.; Gesualdo, L. Urine Profiling by SELDI-TOF/MS: Monitoring of the Critical Steps in Sample
Collection, Handling and Analysis. J. Chromatogr. B Analyt. Technol. Biomed. Life Sci. 2007, 856 (1-2),
205-213.
16. Schaub, S.; Wilkins, J.; Weiler, T.; Sangster, K.; Rush, D.; Nickerson, P. Urine Protein Profiling With
Surface-Enhanced Laser-Desorption/Ionization Time-of-Flight Mass Spectrometry. Kidney Int. 2004, 65
(1), 323-332.
17. West-Nielsen, M.; Hogdall, E. V.; Marchiori, E.; Hogdall, C. K.; Schou, C.; Heegaard, N. H. Sample
Handling for Mass Spectrometric Proteomic Investigations of Human Sera. Anal. Chem. 2005, 77 (16),
5114-5123.
18. Kaiser, E.; Schonknecht, P.; Thomann, P. A.; Hunt, A.; Schroder, J. Influence of Delayed CSF Storage
on Concentrations of Phospho-Tau Protein (181), Total Tau Protein and Beta-Amyloid (1-42). Neurosci.
Lett. 2007, 417 (2), 193-195.
19. Schoonenboom, N. S.; Mulder, C.; Vanderstichele, H.; Van Elk, E. J.; Kok, A.; Van Kamp, G. J.;
Scheltens, P.; Blankenstein, M. A. Effects of Processing and Storage Conditions on Amyloid Beta (1-42)
and Tau Concentrations in Cerebrospinal Fluid: Implications for Use in Clinical Practice. Clin. Chem.
2005, 51 (1), 189-195.
20. Bibl, M.; Esselmann, H.; Otto, M.; Lewczuk, P.; Cepek, L.; Ruther, E.; Kornhuber, J.; Wiltfang, J.
Cerebrospinal Fluid Amyloid Beta Peptide Patterns in Alzheimer's Disease Patients and
Nondemented Controls Depend on Sample Pretreatment: Indication of Carrier-Mediated Epitope
Masking of Amyloid Beta Peptides. Electrophoresis 2004, 25 (17), 2912-2918.
21. Ramont, L.; Thoannes, H.; Volondat, A.; Chastang, F.; Millet, M. C.; Maquart, F. X. Effects of
Hemolysis and Storage Condition on Neuron-Specific Enolase (NSE) in Cerebrospinal Fluid and
Serum: Implications in Clinical Practice. Clin. Chem. Lab Med 2005, 43 (11), 1215-1217.
22. Ranganathan, S.; Polshyna, A.; Nicholl, G.; Lyons-Weiler, J.; Browser, R. Assessment of protein
stability in cerebrospinal fluid using surface-enhanced laser desorption/ionization time-of-flight mass
spectrometry protein profiling. Clin. Proteomics 2006, 2 (1-2), 91-101.
23. Rosato, P. M.; Gama, F. G. V.; Santana, A. E. Physical-chemical analysis of the cerebrospinal fluid of
healthy dogs submitted to different storage periods and temperatures. Cienc Rural 2006, 36 (6), 1806-
1810.
24. Fry, M. M.; Vernau, W.; Kass, P. H.; Vernau, K. M. Effects of time, initial composition and stabilizing
agents on the results of canine cerebrospinal fluid analysis. Vet. Clin. Path 2006, 35 (1), 72-77.
25. Deisenhammer, F.; Bartos, A.; Egg, R.; Gilhus, N. E.; Giovannoni, G.; Rauer, S.; Sellebjerg, F.
Guidelines on Routine Cerebrospinal Fluid Analysis. Report From an EFNS Task Force. Eur. J. Neurol.
2006, 13 (9), 913-922.
26. Hale, J. E.; Gelfanova, V.; You, J. S.; Knierman, M. D.; Dean, R. A. Proteomics of Cerebrospinal Fluid:
Methods for Sample Processing. Methods Mol. Biol. 2008, 425 (2), 53-66.
27. Jerrard, D. A.; Hanna, J. R.; Schindelheim, G. L. Cerebrospinal fluid. J Emerg Med 2001, 21 (2), 171-178.
Chapter 2
65
28. Timms, J. F.; rslan-Low, E.; Gentry-Maharaj, A.; Luo, Z.; T'Jampens, D.; Podust, V. N.; Ford, J.; Fung,
E. T.; Gammerman, A.; Jacobs, I.; Menon, U. Preanalytic Influence of Sample Handling on SELDI-TOF
Serum Protein Profiles. Clin. Chem. 2007, 53 (4), 645-656.
29. Ekblad, L.; Baldetorp, B.; Ferno, M.; Olsson, H.; Bratt, C. In-Source Decay Causes Artifacts in SELDI-
TOF MS Spectra. J. Proteome. Res. 2007, 6 (4), 1609-1614.
30. Aristoteli, L. P.; Molloy, M. P.; Baker, M. S. Evaluation of Endogenous Plasma Peptide Extraction
Methods for Mass Spectrometric Biomarker Discovery. J. Proteome. Res. 2007, 6 (2), 571-581.
31. Levine, J.; Panchalingam, K.; McClure, R. J.; Gershon, S.; Pettegrew, J. W. Stability of CSF Metabolites
Measured by Proton NMR. J. Neural Transm. 2000, 107 (7), 843-848.
32. Pan, S.; Wang, Y.; Quinn, J. F.; Peskind, E. R.; Waichunas, D.; Wimberger, J. T.; Jin, J.; Li, J. G.; Zhu, D.;
Pan, C.; Zhang, J. Identification of Glycoproteins in Human Cerebrospinal Fluid With a
Complementary Proteomic Approach. J. Proteome. Res. 2006, 5 (10), 2769-2779.
33. Strawn, J. R.; Ekhator, N. N.; Geracioti, T. D., Jr. In-Use Stability of Monoamine Metabolites in Human
Cerebrospinal Fluid. J. Chromatogr. B Biomed. Sci. Appl. 2001, 760 (2), 301-306.
34. Tammen, H.; Schulte, I.; Hess, R.; Menzel, C.; Kellmann, M.; Mohring, T.; Schulz-Knappe, P.
Peptidomic Analysis of Human Blood Specimens: Comparison Between Plasma Specimens and
Serum by Differential Peptide Display. Proteomics 2005, 5 (13), 3414-3422.
35. Villanueva, J.; Philip, J.; Entenberg, D.; Chaparro, C. A.; Tanwar, M. K.; Holland, E. C.; Tempst, P.
Serum Peptide Profiling by Magnetic Particle-Assisted, Automated Sample Processing and MALDI-
TOF Mass Spectrometry. Anal. Chem. 2004, 76 (6), 1560-1570.
36. Villanueva, J.; Philip, J.; Chaparro, C. A.; Li, Y.; Toledo-Crow, R.; DeNoyer, L.; Fleisher, M.; Robbins,
R. J.; Tempst, P. Correcting Common Errors in Identifying Cancer-Specific Serum Peptide Signatures.
J. Proteome. Res. 2005, 4 (4), 1060-1072.
37. Anesi, A.; Rondanelli, M.; d'Eril, G. M. Stability of Neuroactive Amino Acids in Cerebrospinal Fluid
Under Various Conditions of Processing and Storage. Clin. Chem. 1998, 44 (11), 2359-2360.
38. van Midwoud, P. M.; Rieux, L.; Bischoff, R.; Verpoorte, E.; Niederlander, H. A. Improvement of
Recovery and Repeatability in Liquid Chromatography-Mass Spectrometry Analysis of Peptides. J.
Proteome. Res. 2007, 6 (2), 781-791.
39. Horvatovich, P.; Govorukhina, N. I.; Reijmers, T. H.; van der Zee, A. G.; Suits, F.; Bischoff, R. Chip-
LC-MS for Label-Free Profiling of Human Serum. Electrophoresis 2007, 28 (23), 4493-4505.
40. Christin, C.; Smilde, A. K.; Hoefsloot, H. C.; Suits, F.; Bischoff, R.; Horvatovich, P. L. Optimized Time
Alignment Algorithm for LC-MS Data: Correlation Optimized Warping Using Component Detection
Algorithm-Selected Mass Chromatograms. Anal. Chem. 2008, 80 (18), 7012-7021.
41. Kemperman, R. F.; Horvatovich, P. L.; Hoekman, B.; Reijmers, T. H.; Muskiet, F. A.; Bischoff, R.
Comparative Urine Analysis by Liquid Chromatography-Mass Spectrometry and Multivariate
Statistics: Method Development, Evaluation, and Application to Proteinuria. J Proteome. Res. 2007, 6
(1), 194-206.
42. Suits, F.; Lepre, J.; Du, P.; Bischoff, R.; Horvatovich, P. Two-Dimensional Method for Time Aligning
Liquid Chromatography-Mass Spectrometry Data. Anal. Chem. 2008, 80 (9), 3095-3104.

The effect of pre-analytical factors on the proteome and metabolites of CSF
66
43. Radulovic, D.; Jelveh, S.; Ryu, S.; Hamilton, T. G.; Foss, E.; Mao, Y.; Emili, A. Informatics Platform for
Global Proteomic Profiling and Biomarker Discovery Using Liquid Chromatography-Tandem Mass
Spectrometry. Mol. Cell Proteomics 2004, 3 (10), 984-997.
44. Tibshirani, R.; Hastie, T.; Narasimhan, B.; Chu, G. Diagnosis of Multiple Cancer Types by Shrunken
Centroids of Gene Expression. Proc. Natl. Acad. Sci. U. S. A 2002, 99 (10), 6567-6572.
45. Mize, T. H.; Amster, I. J. Broad-Band Ion Accumulation With an Internal Source MALDI-FTICR-MS.
Anal. Chem. 2000, 72 (24), 5886-5891.
46. Moyer, S. C.; Budnik, B. A.; Pittman, J. L.; Costello, C. E.; O'Connor, P. B. Attomole Peptide Analysis
by High-Pressure Matrix-Assisted Laser Desorption/Ionization Fourier Transform Mass Spectrometry.
Anal. Chem. 2003, 75 (23), 6449-6454.
47. O'Connor, P. B.; Costello, C. E. Application of Multishot Acquisition in Fourier Transform Mass
Spectrometry. Anal. Chem. 2000, 72 (20), 5125-5130.
48. Koek, M. M.; Muilwijk, B.; van der Werf, M. J.; Hankemeier, T. Microbial Metabolomics With Gas
Chromatography/Mass Spectrometry. Anal. Chem. 2006, 78 (4), 1272-1281.
49. You, J. S.; Gelfanova, V.; Knierman, M. D.; Witzmann, F. A.; Wang, M.; Hale, J. E. The Impact of Blood
Contamination on the Proteome of Cerebrospinal Fluid. Proteomics 2005, 5 (1), 290-296.
50. Kraut, A.; Marcellin, M.; Adrait, A.; Kuhn, L.; Louwagie, M.; Kieffer-Jaquinod, S.; Lebert, D.;
Masselon, C. D.; Dupuis, A.; Bruley, C.; Jaquinod, M.; Garin, J.; Gallagher-Gambarelli, M. Peptide
Storage: Are You Getting the Best Return on Your Investment? Defining Optimal Storage Conditions
for Proteomics Samples. J Proteome. Res. 2009, 8 (7), 3778-3785.
51. Bhatnagar, B. S.; Bogner, R. H.; Pikal, M. J. Protein Stability During Freezing: Separation of Stresses
and Mechanisms of Protein Stabilization. Pharm. Dev. Technol. 2007, 12 (5), 505-523.
52. Dong, A.; Prestrelski, S. J.; Allison, S. D.; Carpenter, J. F. Infrared Spectroscopic Studies of
Lyophilization- and Temperature-Induced Protein Aggregation. J. Pharm. Sci. 1995, 84 (4), 415-424.
53. Klibanov, A. M.; Schefiliti, J. A. On the Relationship Between Conformation and Stability in Solid
Pharmaceutical Protein Formulations. Biotechnol. Lett. 2004, 26 (14), 1103-1106.
54. Sekijima, Y.; Kelly, J. W.; Ikeda, S. Pathogenesis of and Therapeutic Strategies to Ameliorate the
Transthyretin Amyloidoses. Curr. Pharm. Des 2008, 14 (30), 3219-3230.
55. Bergen, H. R., III; Zeldenrust, S. R.; Naylor, S. An on-Line Assay for Clinical Detection of
Amyloidogenic Transthyretin Variants Directly From Serum. Amyloid. 2003, 10 (3), 190-197.
56. Chow, G.; James, W.; Schmidley, M. D. Lysis of erythrocytes and leukocytes in traumatic lumbar
punctures. Arch Neurol 1984, 41 (10), 1084-1085.
57. Steele, R. W.; Marmer, D. J.; O'Brien, M. D.; Tyson, S. T.; Steele, C. R. Leukocyte Survival in
Cerebrospinal Fluid. J Clin. Microbiol. 1986, 23 (5), 965-966.

67
Chapter 3

68
The impact of delayed storage on the
proteome and metabolome of human
cerebrospinal fluid (CSF)
Therese Rosenling1, Marcel P. Stoop2, Agnieszka Smolinska3, Bas Muilwijk4,
Leon Coulier4, Shanna Shi5, Adrie Dane5, Christin Christin1, Frank Suits6,
Peter L. Horvatovich1, Sybren Wijmenga3, Lutgarde Buydens3, Rob
Vreeken7, Thomas Hankemeier7, Alain J. van Gool8, Theo M. Luider2, Rainer
Bischoff1
1Analytical Biochemistry, Department of Pharmacy, University of
Groningen, Groningen, The Netherlands
2Department of Neurology, Erasmus University Medical Center,
Rotterdam, The Netherlands
3Biophysical Chemistry, Radboud University Nijmegen, Nijmegen, The
Netherlands
4TNO, Quality of Life, Zeist, The Netherlands
5Netherlands Metabolomics Centre, Leiden/Amsterdam Centre for Drug
Research, Leiden University, Leiden, The Netherlands
6IBM TJ Watson Research Centre, Yorktown Heights, NY, USA
7Analytical BioSciences, Leiden/Amsterdam Centre for Drug Research,
Leiden University, Leiden, The Netherlands
8MSD, Oss, The Netherlands
Manuscript in preparation
Chapter 3
69
Abstract
Cerebrospinal fluid (CSF) is in close contact with the diseased areas in
neurological disorders and is therefore an important source of material in the
search for molecular biomarkers. CSF is withdrawn from patients in a clinical
setting where sample handling might not always be adequate in view of
proteomic and metabolomic studies. We therefore initiated a combined
proteomics and metabolomics study of the impact of time delay between sampling
and freezing of CSF samples.
We left CSF for 0, 30 and 120 min at room temperature after sample
collection and subsequent centrifugation/removal of cell pellet. We analyzed the
CSF samples at five separate laboratories using five different analytical platforms:
Proteome analysis with nanoLC Orbitrap-MS/MS and chipLC QTOF-MS after
tryptic digestion; metabolome analysis with NMR and GC-MS; and amino acid
analysis with LC-MS.
Our results show that changes in the metabolome and proteome of human
CSF left at room temperature after centrifugation are minor compared to the
biological variation between the samples. The delayed storage at room
temperature resulted in few but statistically significant changes in the proteome
and metabolome. We detected two non-identified peptides as well as one
metabolite; 2,3,4-trihydrobutanoic acid, that changed significantly.
With the applied analysis strategies the proteome/metabolome profile of
centrifuged, human CSF with all cells removed proved to be rather stable even
when stored at room temperature for up to two hours. This gives the laboratory
personnel at the collection site time to aliquot samples before freezing and storage
at -80 °C.
The effect of delayed storage on the proteome of human CSF
70
1. Introduction
The conditions during the journey of a biological sample from the clinical
collection site to the analytical research laboratory may not always be adequate for
subsequent proteomics and metabolomics analyses, especially in cases where the
sample collection was not originally performed with these large-scale analyses in
mind. In order to detect reliable molecular biomarker candidates it is imperative to
handle biological fluids according to standardized procedures and to evaluate the
effect of pre-analytical parameters on the final result to avoid artifacts (1, 2).
Earlier studies on urine, plasma and cerebrospinal fluid (CSF) have shown that
sample handling can affect the stability of proteins as well as metabolites (3-11).
Sample handling according to standardized procedures is also important when
trying to compare results between different laboratories (12-14). In the search for
molecular biomarkers related to disorders of the central nervous system, CSF is
the most promising bio-fluid, because of the proximity to the affected tissue (13,
15-20).
This study complements our previous stability study where we showed
that a number of proteins and metabolites changed over a time period of two
hours at room temperature in porcine CSF samples that contained low levels of
remaining white blood cells (21). In this study we have analyzed a set of human
CSF samples in order to assess protein and metabolite stability at room
temperature after a low-speed centrifugation step to remove cells. To cover a wide
range of proteins and metabolites, the results from a number of analytical
platforms comprising LC-MS, GC-MS and NMR have been combined. To our
knowledge this is the first stability study on CSF of this scale that has been
reported.
2. Material and Methods
2.1. Sample set Six human CSF samples were obtained from the Department of Neurology at the
Erasmus University Medical Center (Rotterdam, The Netherlands). The CSF
samples were collected as part of routine clinical examinations of the patients with
various symptoms (Table 1). All samples were withdrawn via lumbar puncture
between the 3rd and 4th lumbar vertebrae using a Spinocan needle (0.90 × 88 mm).
The Medical Ethical Committee of the Erasmus University Medical Center in
Rotterdam, The Netherlands, approved the study protocol and all patients gave
their consent. Samples were centrifuged (10 min at 956 g) immediately after
collection (maximum time between sample collection and centrifugation was
approximately 5 minutes) to remove cells. Aliquots were directly snap-frozen in
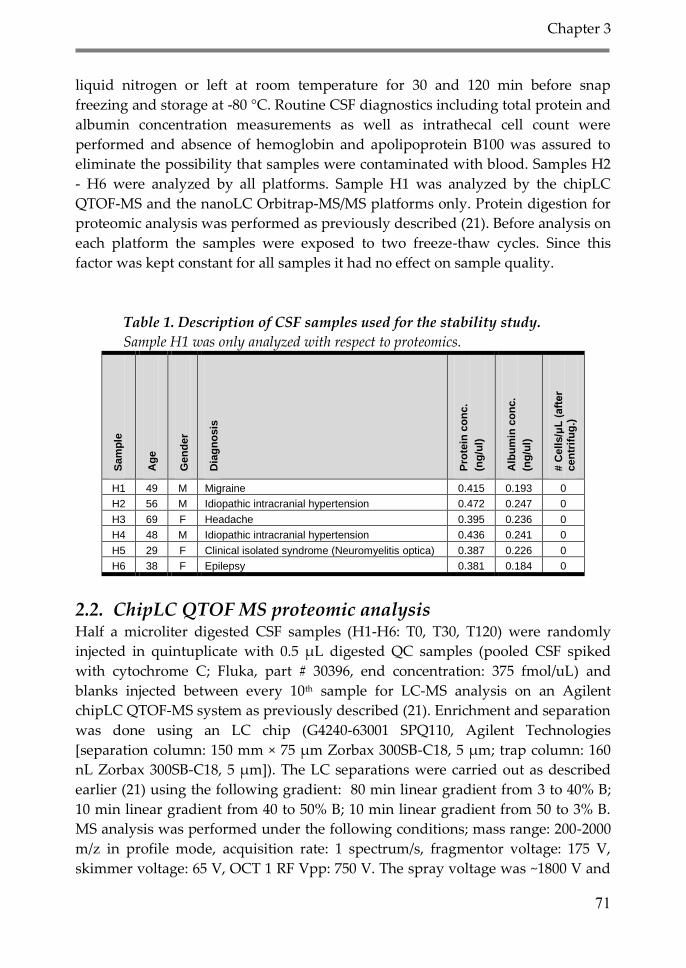
Chapter 3
71
liquid nitrogen or left at room temperature for 30 and 120 min before snap
freezing and storage at -80 °C. Routine CSF diagnostics including total protein and
albumin concentration measurements as well as intrathecal cell count were
performed and absence of hemoglobin and apolipoprotein B100 was assured to
eliminate the possibility that samples were contaminated with blood. Samples H2
- H6 were analyzed by all platforms. Sample H1 was analyzed by the chipLC
QTOF-MS and the nanoLC Orbitrap-MS/MS platforms only. Protein digestion for
proteomic analysis was performed as previously described (21). Before analysis on
each platform the samples were exposed to two freeze-thaw cycles. Since this
factor was kept constant for all samples it had no effect on sample quality.
Table 1. Description of CSF samples used for the stability study.
Sample H1 was only analyzed with respect to proteomics.
Sam
ple
Ag
e
Gen
de
r
Dia
gn
os
is
Pro
tein
co
nc.
(ng
/ul)
Alb
um
in c
on
c.
(ng
/ul)
# C
ell
s/μ
L (
aft
er
cen
trif
ug
.)
H1 49 M Migraine 0.415 0.193 0
H2 56 M Idiopathic intracranial hypertension 0.472 0.247 0
H3 69 F Headache 0.395 0.236 0
H4 48 M Idiopathic intracranial hypertension 0.436 0.241 0
H5 29 F Clinical isolated syndrome (Neuromyelitis optica) 0.387 0.226 0
H6 38 F Epilepsy 0.381 0.184 0
2.2. ChipLC QTOF MS proteomic analysis Half a microliter digested CSF samples (H1-H6: T0, T30, T120) were randomly
injected in quintuplicate with 0.5 µL digested QC samples (pooled CSF spiked
with cytochrome C; Fluka, part # 30396, end concentration: 375 fmol/uL) and
blanks injected between every 10th sample for LC-MS analysis on an Agilent
chipLC QTOF-MS system as previously described (21). Enrichment and separation
was done using an LC chip (G4240-63001 SPQ110, Agilent Technologies
[separation column: 150 mm × 75 µm Zorbax 300SB-C18, 5 µm; trap column: 160
nL Zorbax 300SB-C18, 5 µm]). The LC separations were carried out as described
earlier (21) using the following gradient: 80 min linear gradient from 3 to 40% B;
10 min linear gradient from 40 to 50% B; 10 min linear gradient from 50 to 3% B.
MS analysis was performed under the following conditions; mass range: 200-2000
m/z in profile mode, acquisition rate: 1 spectrum/s, fragmentor voltage: 175 V,
skimmer voltage: 65 V, OCT 1 RF Vpp: 750 V. The spray voltage was ~1800 V and
The effect of delayed storage on the proteome of human CSF
72
the drying gas (N2) was 6 L/min at a temperature of 325 ºC. Mass correction was
done for each spectrum using internal standards (methyl stearate m/z: 299.294457
and HP-1221 m/z: 1221.990637) evaporating from a wetted wick inside the spray
chamber. Reproducibility was monitored on selected cytochrome C peaks in the
QC samples; Mass difference between theoretical and the measured values was
within +/- 4 ppm. The selected peaks showed a peak area RSD of less than +/- 20%
and a retention time (RT) RSD of less than 2%.
Data was processed using a pipeline developed in C++ (22) as previously
described (21). MzData.XML data were converted to ASCII format over a mass
range of 200 to 1600 m/z (outside this range no multiply charged ions were
detected), a retention time range of 3 to 80 min (peptide elution range) and with an
intensity threshold of 300 counts. A double cross validated Nearest Shrunken
Centroid (NSC) (23) algorithm was applied to the complete peak matrix; the NSC
comparison gives for a certain shrinkage value a cross validation error between 0
and 1, where 1 imply that both classes are assigned to the wrong class, 0.5 is a
random class assignation and 0 means that both classes are correctly assigned.
NSC selected features were compared by univariate statistical analysis in terms of
Student’s t-test with Bonferroni correction for multiple comparisons and ANOVA
(Microsoft Excel 2007 and SPSS 16.0). The features were considered significantly
different with a p-value below 0.05 (T0 vs. T120 and T0 vs. T30). Each
discriminatory feature was analyzed by targeted tandem MS for identification.
Principal component analysis (PCA) (24) was applied to the complete peak matrix
(10 000 peaks) as well as on the NSC-selected features (MatLab, R2009a). For
visualization box and whisker plots were created in Origin 7.0.
2.3. NanoLC Orbitrap-MS/MS shotgun proteomics analysis Digested CSF samples (H1-H6: T0, T30, T120) were injected one time each in
random order and analyzed by MS/MS (shotgun approach) on an Ultimate 3000
nano LC system (Dionex, Germany) online coupled to a hybrid linear ion
trap/Orbitrap mass spectrometer (LTQ Orbitrap XL; Thermo Fisher Scientific,
Bremen, Germany) as previously described (21).
Data files were analyzed and pre-processed using the Progenesis LC-MS
software package (Nonlinear Dynamics, United Kingdom); retention times were
aligned and the intensities of the ions were normalized. To assess inter-patient
variability all identified peaks were analyzed by PCA. All identified peaks were
also analyzed by NSC (23) for classification. Peptides were analyzed for
differential abundance between the sample-groups by performing ANOVA, p-
values below 0.01 were considered significant.
All MS/MS spectra were searched against the UniProt/SwissProt database
(version 57.6, August 20, 2009, taxonomy: Homo sapiens 20070 sequences) using
the Mascot (version 2.2.06). Search parameters were; parent ion tolerance: 2 ppm,

Chapter 3
73
amino acid modifications: carbamidomethylation of cysteine (fixed) and oxidation
of methionine (variable). The results were further on linked to the original data
(Progenesis).
2.4. GC-MS metabolomic analysis CSF samples (H2-H6: T0, T30, T120) were treated with an oximation reagent
followed by silylation prior to GC-MS analysis (21, 25). Each sample was injected
twice in random order and analyzed on an Agilent 6890 gas chromatograph
coupled to an Agilent 5973 quadrupole mass spectrometer as described earlier
(21).
Peaks were characterized by retention time and m/z ratio and identified by
comparison with a spectral data base (TNO) (21). All detected metabolites were
analyzed by PCA. A two tailed Student’s t-test with Bonferroni correction for
multiple comparisons as well as ANOVA and Kruskal-Wallis test (Microsoft Excel
2007 and SPSS 16.0) was applied to all known metabolites (T0 vs. T30 and T0 vs.
T120); metabolites with a p-value below 0.05 were considered significantly
affected by storage time.
2.5. NMR metabolomic analysis Samples (H2-H6: T0, T30, T120) were randomized prior to sample preparation and
analysis. Fifty microliters of CSF were diluted in 200 µL of D2O (99.99 % D).
Twenty-five µL of 8.8 mM TSP-d4 (3-(Trimethylsilyl)propionic acid-d4 sodium salt,
99 % D) stock solution in D2O were added to 250 µL CSF to a final concentration of
0.8 mM TSP as internal standard and as chemical shift reference (δ0.00). The TSP-
d4 stock solution was prepared from dry TSP-d4. The pH was adjusted (7.0 – 7.1)
by adding phosphate buffer (9.7 µL of a 1 M stock solution) to a final
concentration of 35 mM (26). Finally the sample (284.7 µL) was transferred to a
SHIGEMI microcell NMR tube for measurements, (each sample was analyzed
once).
1D 1H NMR spectra were acquired on an 800 MHz Inova (Varian) system
equipped with a 5 mm triple-resonance, Z-gradient HCN cold-probe. Suppression
of water was achieved using WATERGATE (delay: 85 s) (27). For each spectrum
256 scans of 18 000 data points were accumulated with a spectral width of 9000
Hz. The acquisition time for each scan was 2 s. An 8 s relaxation delay was
employed between scans. Prior to spectral analysis, all acquired Free Induction
Decays (FIDs) were zero-filled to 32 000 data points, multiplied with a 0.3 Hz line
broadening function, Fourier transformed and manually phased. Calibration of
the chemical shift scale was done on the external reference standard TSP-d4 by
using ACD/SpecManager software (Advanced Chemistry Development Inc.,
The effect of delayed storage on the proteome of human CSF
74
Toronto, Canada). Spectra were transformed to MatLab, version 7.6 (R2008b)
(Mathworks, Natick, MA) for further analysis.
NMR spectral data was preprocessed by baseline correction using the
Asymmetric Least Squares method (28) and alignment with the Correlation
Optimized Warping (COW) method (29). Each spectrum was divided (along the
chemical shift axis) in equally sized bins (0.04 ppm) and each data point was
averaged over each bin. The areas of the bins were summed to provide an integral
so that the intensities of the peaks in such defined spectral regions were extracted.
Each NMR spectrum was reduced to 210 variables, calculated by integrating
regions of equal width (0.04 ppm) corresponding to the regions of δ0.7-9. To
remove effects of variation in water resonance suppression, spectral regions
between δ4.4-5.4 were removed. All spectra thus reduced were normalized to unit
area.
The data was further processed by vast scaling, in order to determine
group-specific scaling factors (30, 31). To visualize possible systematic variation,
grouping, trends and outliers, PCA was applied to the entire data set.
2.6. LC-MS/MS amino acid analysis Fifteen CSF samples (H2-H6: T0, T30, T120) were prepared in triplicate as
previously described (21). One microliter of each reaction mixture was injected in
duplicate on an ACQUITY UPLCTM system (Waters Chromatography B.V., Etten-
Leur, The Netherlands) coupled to a Quattro Premier Xe tandem quadrupole mass
spectrometer (Waters Corporation) operated under the MassLynx data acquisition
software (version 4.1; Waters). Quantification and pre-analysis of the data was
done using LC-QuanLynx (Waters) and Microsoft Excel 2003, respectively. The
complete data set was examined by PCA. The data was further statistically
analyzed by two-tailed Student’s t-test with Bonferroni correction and ANOVA
(Microsoft Excel 2007, SPSS 16.0) (T0 vs. T30 and T0 vs. T120), amino acids with p-
values below 0.05 were considered discriminatory.
3. Results
Centrifuged human CSF samples were left at room temperature for 30 and 120
min before being snap-frozen in liquid nitrogen and stored at -80 °C. Metabolome
and proteome profiles were compared to control samples that were frozen
immediately after centrifugation and subsequent removal of the cell pellet.
Proteome profiles were obtained by chipLC QTOF-MS and nanoLC Orbitrap-
MS/MS shotgun analysis after tryptic digestion. The metabolome was analyzed by
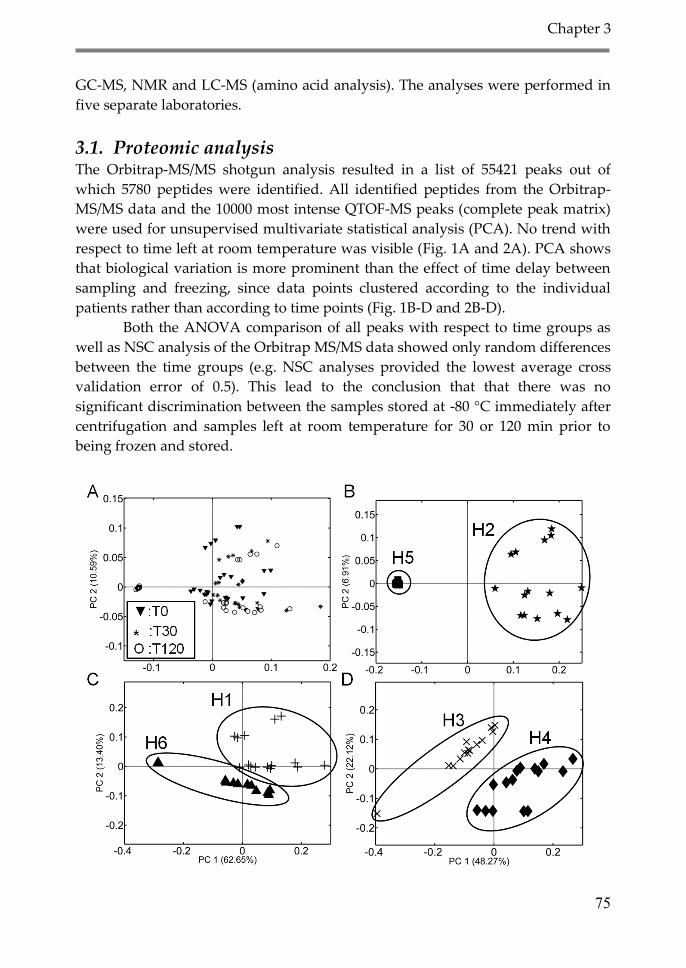
Chapter 3
75
GC-MS, NMR and LC-MS (amino acid analysis). The analyses were performed in
five separate laboratories.
3.1. Proteomic analysis The Orbitrap-MS/MS shotgun analysis resulted in a list of 55421 peaks out of
which 5780 peptides were identified. All identified peptides from the Orbitrap-
MS/MS data and the 10000 most intense QTOF-MS peaks (complete peak matrix)
were used for unsupervised multivariate statistical analysis (PCA). No trend with
respect to time left at room temperature was visible (Fig. 1A and 2A). PCA shows
that biological variation is more prominent than the effect of time delay between
sampling and freezing, since data points clustered according to the individual
patients rather than according to time points (Fig. 1B-D and 2B-D).
Both the ANOVA comparison of all peaks with respect to time groups as
well as NSC analysis of the Orbitrap MS/MS data showed only random differences
between the time groups (e.g. NSC analyses provided the lowest average cross
validation error of 0.5). This lead to the conclusion that that there was no
significant discrimination between the samples stored at -80 °C immediately after
centrifugation and samples left at room temperature for 30 or 120 min prior to
being frozen and stored.
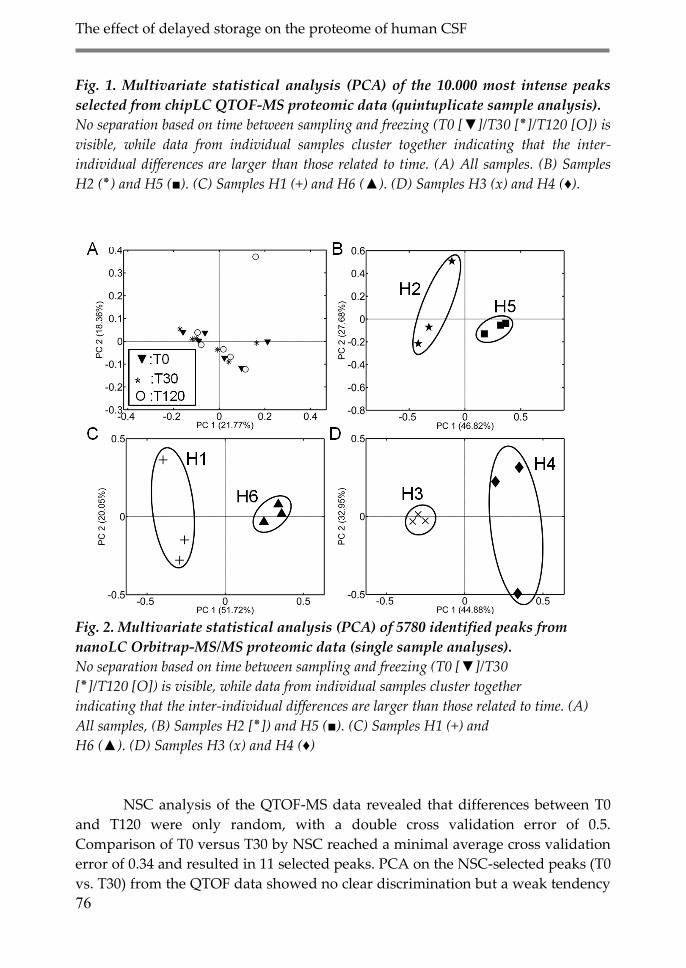
The effect of delayed storage on the proteome of human CSF
76
Fig. 1. Multivariate statistical analysis (PCA) of the 10.000 most intense peaks
selected from chipLC QTOF-MS proteomic data (quintuplicate sample analysis).
No separation based on time between sampling and freezing (T0 [▼]/T30 [٭]/T120 [O]) is
visible, while data from individual samples cluster together indicating that the inter-
individual differences are larger than those related to time. (A) All samples. (B) Samples
H2 (٭) and H5 (■). (C) Samples H1 (+) and H6 (▲). (D) Samples H3 (x) and H4 (♦).
Fig. 2. Multivariate statistical analysis (PCA) of 5780 identified peaks from
nanoLC Orbitrap-MS/MS proteomic data (single sample analyses).
No separation based on time between sampling and freezing (T0 [▼]/T30
T120 [O]) is visible, while data from individual samples cluster together/[٭]
indicating that the inter-individual differences are larger than those related to time. (A)
All samples, (B) Samples H2 [٭]) and H5 (■). (C) Samples H1 (+) and
H6 (▲). (D) Samples H3 (x) and H4 (♦)
NSC analysis of the QTOF-MS data revealed that differences between T0
and T120 were only random, with a double cross validation error of 0.5.
Comparison of T0 versus T30 by NSC reached a minimal average cross validation
error of 0.34 and resulted in 11 selected peaks. PCA on the NSC-selected peaks (T0
vs. T30) from the QTOF data showed no clear discrimination but a weak tendency
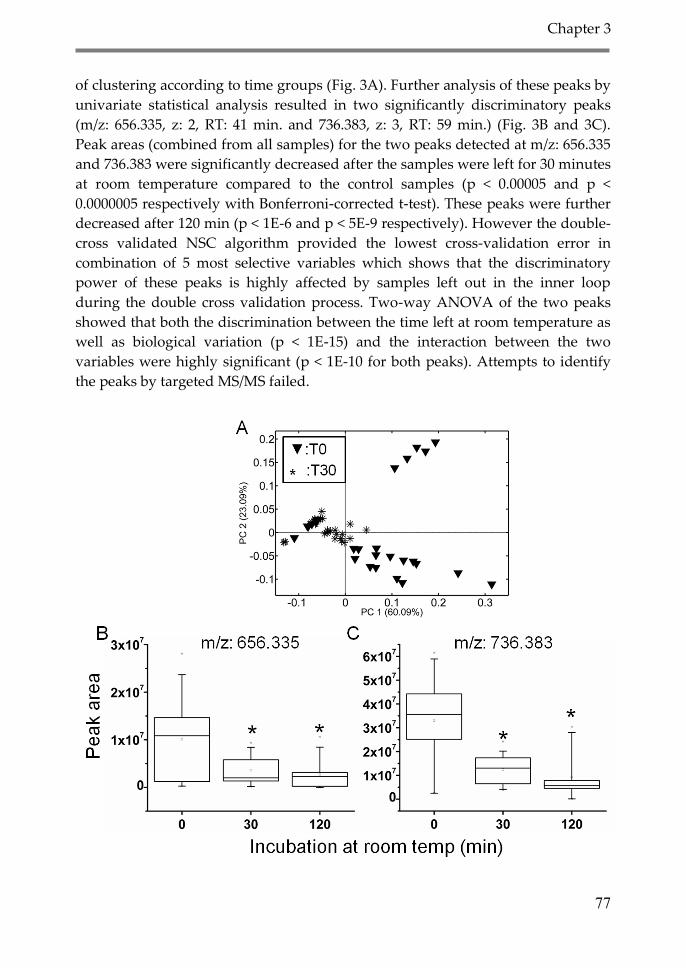
Chapter 3
77
of clustering according to time groups (Fig. 3A). Further analysis of these peaks by
univariate statistical analysis resulted in two significantly discriminatory peaks
(m/z: 656.335, z: 2, RT: 41 min. and 736.383, z: 3, RT: 59 min.) (Fig. 3B and 3C).
Peak areas (combined from all samples) for the two peaks detected at m/z: 656.335
and 736.383 were significantly decreased after the samples were left for 30 minutes
at room temperature compared to the control samples (p < 0.00005 and p <
0.0000005 respectively with Bonferroni-corrected t-test). These peaks were further
decreased after 120 min (p < 1E-6 and p < 5E-9 respectively). However the double-
cross validated NSC algorithm provided the lowest cross-validation error in
combination of 5 most selective variables which shows that the discriminatory
power of these peaks is highly affected by samples left out in the inner loop
during the double cross validation process. Two-way ANOVA of the two peaks
showed that both the discrimination between the time left at room temperature as
well as biological variation (p < 1E-15) and the interaction between the two
variables were highly significant (p < 1E-10 for both peaks). Attempts to identify
the peaks by targeted MS/MS failed.

The effect of delayed storage on the proteome of human CSF
78
Fig. 3. (A) Multivariate statistical analysis by PCA based on 11 NSC-selected
peaks derived from chipLC QTOF-MS proteomics data (T0 [▼] vs. T30 [٭]). (B and
C) Univariate statistical analysis of two peaks that decreased significantly with
respect to delay time between CSF sampling and freezing at room temperature.
Data are represented as box and whisker plots with significant p-values marked (p < 5E-5)
(T0 vs. T30 and T0 vs. T120). (A) PCA of 11 NSC selected peaks for T0 vs. T30. (B) Peak
detected at m/z: 656.335 that decreased significantly after 30 and 120 min at room
temperature. (C) Peak at m/z 736.383 that decreased significantly after 30 and 120 min at
room temperature. The statistical analysis was based on two-tailed Students t-tests with
Bonferroni correction of the combined data from five repetitive analyses of six human CSF
samples (H1-H6).
Fig. 4. Statistical analysis of metabolomics data derived from human CSF (H2-
H6). (A,B,C), Multivariate statistical analysis by PCA based on all detected
metabolites. (D,) Univariate statistical analysis (Kruskal-Wallis non-parametric
ANOVA) of combined data from duplicate analyses of five human CSF samples
(H2-H6) by GC-MS. The analysis is visualized by box and whisker plots with
significant p-value (T0 vs. T120) marked (p < 5E-3).
(A) GC-MS (90 metabolites, duplicate sample analysis). (B) NMR (51 metabolites, single
analysis) and (C) LC-MS targeting the 19 natural amino acids (sextuplicate analysis).
Lower panels; (D) 2,3,4-trihydroxybutanoic acid was significantly increased (Kruskal-
Wallis) after storage at room temperature for 120 min (p < 5E-3).
Chapter 3
79
3.2. Metabolomic analysis GC-MS analysis quantified 88 metabolites, of which 67 were assigned to known
compounds based on spectral libraries. This analysis was complemented by
targeted LC-MS of 19 natural amino acids. NMR analysis identified and quantified
51 metabolites. Thirteen of the metabolites were detected by all three methods, 24
were detected by GC-MS and NMR, 14 by GC-MS and LC-MS and 16 by NMR
and LC-MS. In total 93 unique identified metabolites were quantified. PCA of the
data from the different analytical platforms showed that clustering occurs
primarily according to the individual patients rather than to the time points when
all data are considered (Fig. 4A-C). Statistical analysis revealed that the
concentration of 2,3,4-trihydrobutanoic acid (erythronic acid, threonic acid),
detected by GC-MS (Fig. 4D) increased in all samples with increased time left at
room temperature. In sample H2 the increase of this metabolite was extremely
high after 120 minutes. Non-parametric ANOVA (Kruskal-Wallis) showed that the
discrimination between T0 and T120 was clearly significant (p < 5E-3), Bonferroni
corrected Student’s t-test as well as one-way ANOVA also resulted in highly
significant group separation when the samples providing outlier value was left
out (p < 5E-5 for both t-test and ANOVA).
4. Discussion
We have previously shown that the stability of proteins and metabolites in porcine
CSF samples was affected when residual white blood cells were not completely
removed (21). Here we present a detailed study, performed on different analysis
platforms, into the stability of the proteome and metabolome of cell-free, human
CSF when leaving samples at room temperature for up to 2 h to mimic the clinical
situation.
Unsupervised multivariate statistical analysis (PCA) of the data showed
that patient-to-patient variation is most prominent overriding variation due to
delay time as the data points cluster in groups of individual samples rather than in
time-related groups. After variable selection based on the pre-classification of
samples according to delay time, we found that only two peptides and one
metabolite changed significantly over time. Our results demonstrate that the
measured proteome and metabolome of human CSF samples, using the applied
techniques, is quite stable when left at room temperature as long as all cells have
been removed first.
Another study on the stability of the proteome in CSF at room temperature
pointed in the same direction with the detection of only two polypeptides that
changed after storage (32). These samples were, however contaminated with blood
The effect of delayed storage on the proteome of human CSF
80
since both polypeptides were derived from hemoglobin. Another study showed
that blood contamination decreases the stability of the CSF proteome (11)
corroborating our earlier results (21). One explanation to the decreased level of the
two non-identified peaks in the proteome analysis is the possible adsorption to the
vial surface via e.g. hydrophobic or van der Waals interactions (21, 33, 34).
Metabolomics revealed increased levels of 2,3,4-trihydroxybutanoic acid after
storage at room temperature. This increase may be caused by oxidative
degradation of ascorbic acid (35-37) because here the ascorbic acid levels were
slightly decreased with increased time at room temperature. This decrease,
however, was too small to be a significant factor. Interestingly, 2,3,4-
trihydroxybutanoic acid decreased in CSF containing white blood cells (21), which
might be due to further metabolism of the acid by enzymes released from white
blood cells. The concentration of 2,3,4-trihydroxybutanoic acid was too low for
NMR detection.
The stability of metabolites and proteins measured with the most common
analytical profiling methods is an important factor to take into consideration when
handling biofluids and designing biomarker studies. A previous study from our
team shows that the biological variation of some proteins and peptides have large
variability (sometimes exceeding 100%), which requires high discriminating
power for compounds considered as biomarker candidates (38).
In conclusion, we report a study of combined analysis methods into the
stability of CSF using five different analytical platforms. The results agree that
there are minor or no significant changes in the metabolome and proteome of cell-
free CSF that was left for different time spans at room temperature as compared to
control samples that were frozen immediately after centrifugation. Earlier studies
showed that blood or white blood cell contamination reduces CSF stability
considerably, emphasizing the importance of the initial centrifugation step.
From our study we draw the conclusion that with the analysis techniques
used in this study biological variation between individuals is far more
pronounced than variation introduced by delay time at room temperature. This
gives laboratory personnel sufficient time to aliquot CSF samples before being
frozen and stored for use in similar studies. Aliquoting samples in small volumes
reduce the number of freeze-thaw cycles at later time points, which we have
shown to be beneficial (21). We can, however, only draw conclusions about the
analytes detected with our analysis techniques, and it remains possible that other
techniques may find other metabolites and peptides that are more affected by this
treatment.

Chapter 3
81
Acknowledgements
The authors would like to thank Rogier Hintzen from the Department of
Neurology, Erasmus University Medical Center, Rotterdam, The Netherlands for
providing the CSF samples. The study was performed within the framework of
the Top Institute Pharma project number D4-102. The work was also supported by
the project BioRange 2.2.3 from the Netherlands Proteomics and The Netherlands
Bioinformatics Center.
The effect of delayed storage on the proteome of human CSF
82
References
1. Hansson SF, Simonsen AH, Zetterberg H, Andersen O, Haghighi S, Fagerberg I et al.
Cystatin C in cerebrospinal fluid and multiple sclerosis. Ann Neurol 2007;62:193-6.
2. Irani DN, Anderson C, Gundry R, Cotter R, Moore S, Kerr DA et al. Cleavage of
cystatin C in the cerebrospinal fluid of patients with multiple sclerosis. Ann Neurol
2006;59:237-47.
3. Anesi A, Rondanelli M, d'Eril GM. Stability of neuroactive amino acids in
cerebrospinal fluid under various conditions of processing and storage. Clin Chem
1998;44:2359-60.
4. Kaiser E, Schonknecht P, Thomann PA, Hunt A, Schroder J. Influence of delayed
CSF storage on concentrations of phospho-tau protein (181), total tau protein and
beta-amyloid (1-42). Neurosci Lett 2007;417:193-5.
5. Kraut A, Marcellin M, Adrait A, Kuhn L, Louwagie M, Kieffer-Jaquinod S et al.
Peptide storage: are you getting the best return on your investment? Defining
optimal storage conditions for proteomics samples. J Proteome Res 2009;8:3778-85.
6. Levine J, Panchalingam K, McClure RJ, Gershon S, Pettegrew JW. Stability of CSF
metabolites measured by proton NMR. J Neural Transm 2000;107:843-8.
7. Schaub S, Wilkins J, Weiler T, Sangster K, Rush D, Nickerson P. Urine protein
profiling with surface-enhanced laser-desorption/ionization time-of-flight mass
spectrometry. Kidney Int 2004;65:323-32.
8. Teahan O, Gamble S, Holmes E, Waxman J, Nicholson JK, Bevan C, Keun HC.
Impact of analytical bias in metabonomic studies of human blood serum and
plasma. Anal Chem 2006;78:4307-18.
9. West-Nielsen M, Hogdall EV, Marchiori E, Hogdall CK, Schou C, Heegaard NH.
Sample handling for mass spectrometric proteomic investigations of human sera.
Anal Chem 2005;77:5114-23.
10. Wuolikainen A, Hedenstrom M, Moritz T, Marklund SL, Antti H, Andersen PM.
Optimization of procedures for collecting and storing of CSF for studying the
metabolome in ALS. Amyotroph Lateral Scler 2009;10:229-36.
11. You JS, Gelfanova V, Knierman MD, Witzmann FA, Wang M, Hale JE. The impact of
blood contamination on the proteome of cerebrospinal fluid. Proteomics 2005;5:290-
6.
Chapter 3
83
12. Diamandis EP. Mass spectrometry as a diagnostic and a cancer biomarker discovery
tool: opportunities and potential limitations. Mol Cell Proteomics 2004;3:367-78.
13. Giovannoni G. Multiple sclerosis cerebrospinal fluid biomarkers. Dis Markers
2006;22:187-96.
14. Villanueva J, Philip J, Chaparro CA, Li Y, Toledo-Crow R, DeNoyer L et al.
Correcting common errors in identifying cancer-specific serum peptide signatures. J
Proteome Res 2005;4:1060-72.
15. Dekker LJ, Burgers PC, Kros JM, Smitt PA, Luider TM. Peptide profiling of
cerebrospinal fluid by mass spectrometry. Expert Rev Proteomics 2006;3:297-309.
16. Lutz NW, Viola A, Malikova I, Confort-Gouny S, Ranjeva JP, Pelletier J, Cozzone PJ.
A branched-chain organic acid linked to multiple sclerosis: first identification by
NMR spectroscopy of CSF. Biochem Biophys Res Commun 2007;354:160-4.
17. Myint KT, Aoshima K, Tanaka S, Nakamura T, Oda Y. Quantitative profiling of
polar cationic metabolites in human cerebrospinal fluid by reversed-phase
nanoliquid chromatography/mass spectrometry. Anal Chem 2009;81:1121-9.
18. Noben JP, Dumont D, Kwasnikowska N, Verhaert P, Somers V, Hupperts R et al.
Lumbar cerebrospinal fluid proteome in multiple sclerosis: characterization by
ultrafiltration, liquid chromatography, and mass spectrometry. J Proteome Res
2006;5:1647-57.
19. Stoop MP, Dekker LJ, Titulaer MK, Lamers RJ, Burgers PC, Sillevis Smitt PA et al.
Quantitative matrix-assisted laser desorption ionization-fourier transform ion
cyclotron resonance (MALDI-FT-ICR) peptide profiling and identification of
multiple-sclerosis-related proteins. J Proteome Res 2009;8:1404-14.
20. Zhang J, Goodlett DR, Montine TJ. Proteomic biomarker discovery in cerebrospinal
fluid for neurodegenerative diseases. J Alzheimers Dis 2005;8:377-86.
21. Rosenling T, Slim CL, Christin C, Coulier L, Shi S, Stoop MP et al. The effect of
preanalytical factors on stability of the proteome and selected metabolites in
cerebrospinal fluid (CSF). J Proteome Res 2009;8:5511-22.
22. Suits F, Lepre J, Du P, Bischoff R, Horvatovich P. Two-dimensional method for time
aligning liquid chromatography-mass spectrometry data. Anal Chem 2008;80:3095-
104.
23. Tibshirani R, Hastie T, Narasimhan B, Chu G. Diagnosis of multiple cancer types by
shrunken centroids of gene expression. Proc Natl Acad Sci U S A 2002;99:6567-72.

The effect of delayed storage on the proteome of human CSF
84
24. Wold S, Esbensen K, Geladi P. Principal Component Analysis. Chemometr Intell Lab
1987;2:37-52.
25. Koek MM, Muilwijk B, van der Werf MJ, Hankemeier T. Microbial metabolomics
with gas chromatography/mass spectrometry. Anal Chem 2006;78:1272-81.
26. Cunniffe JG, Whitby-Strevens S, Wilcox MH. Effect of pH changes in cerebrospinal
fluid specimens on bacterial survival and antigen test results. J Clin Pathol
1996;49:249-53.
27. Piotto M, Saudek V, Sklenar V. Gradient-tailored excitation for single-quantum
NMR spectroscopy of aqueous solutions. J Biomol NMR 1992;2:661-5.
28. Eilers PH. A perfect smoother. Anal Chem 2003;75:3631-6.
29. Tomasi G, van den Berg F, Andersson C. Correlation optimized warping and
dynamic time warping as preprocessing methods for chromatographic data. J
Chemometr 2004;18:231-41.
30. Keun HC, Ebbels TMD, Antti H, Bollard ME, Beckonert O, Holmes E et al. Improved
analysis of multivariate data by variable stability scaling: application to NMR-based
metabolic profiling. Anal Chim Acta 2003;490:265-76.
31. van den Berg RA, Hoefsloot HC, Westerhuis JA, Smilde AK, van der Werf MJ.
Centering, scaling, and transformations: improving the biological information
content of metabolomics data. BMC Genomics 2006;7:142-56.
32. Berven FS, Kroksveen AC, Berle M, Rajalahti T, Flikka K, Arneberg R et al. Pre-
analytical influence on the low molecular weight cerebrospinal fluid proteome.
Proteom Clin Appl 2007;1:699-711.
33. van Midwoud PM, Rieux L, Bischoff R, Verpoorte E, Niederlander HA.
Improvement of recovery and repeatability in liquid chromatography-mass
spectrometry analysis of peptides. J Proteome Res 2007;6:781-91.
34. Burke CJ, Steadman BL, Volkin DB, Tsai P-K, Bruner MW, Middaugh CR. The
adsorption of proteins to pharmaceutical container surfaces. Int J Pharm 1992;86:89-
93.
35. Deutsch JC. Ascorbic acid oxidation by hydrogen peroxide. Anal Biochem
1998;255:1-7.
36. Mystkowski EM, Lasocka D. Factors preventing oxidation of ascorbic acid in blood
serum. Biochem J 1939;33:1460-4.
37. Kuellmer V. Vitamins: Ascorbic acid. In: Francis FJ, ed. Wiley encyclopedia of food
science and technology. West Sussex: Wiley Interscience; 1999:2449-67pp.

Chapter 3
85
38. Stoop MP, Coulier L, Rosenling T, Shi S, Smolinska AM, Buydens L et al.
Quantitative proteomics and metabolomics analysis of normal human cerebrospinal
fluid samples. Mol Cell Proteomics, 2010 [Epub ahead of print].

86
Chapter 4
87
Profiling and identification of
Cerebrospinal Fluid (CSF) proteins in a Rat
EAE Model of Multiple Sclerosis
Therese Rosenling1, Marcel Stoop2, Amos Attali3, Hans van Aken3, Ernst
Suidgeest3, Christin Christin1, Christoph Stingl2, Frank Suits4, Peter
Horvatovich1, Rogier Hintzen2, Tinka Tuinstra3, Rainer Bischoff1, Theo
Luider2
1Department of Analytical Biochemistry, Centre for Pharmacy,
University of Groningen, Groningen, The Netherlands
2 Department of Neurology, Erasmus University Medical Center,
Rotterdam, The Netherlands
3 Abbott Healthcare Products B.V., Weesp, the Netherlands 4IBM TJ Watson Research Centre, Yorktown Heights, NY, USA
Manuscript in preparation
Proteome profiling in a rat EAE model
88
Abstract
The experimental autoimmune encephalomyelitis (EAE) model resembles certain
aspects of multiple sclerosis (MScl), with common features such as motor
dysfunction, axonal degradation and infiltration of T-cells during the affected
period. In MScl the main cause of the disease yet to be discovered and there is still
no specific molecular biomarker in use for early diagnosis and patient
classification. We here chose to study the EAE rat model to discover novel MScl
related proteomic biomarker candidates using a screening approach with the goal
to translate them into the human situation.
EAE was induced in male Lewis rats by injection of myelin basic protein
(MBP) together with complete Freund’s adjuvant (CFA). An inflammatory control
group was injected with CFA alone and a non-treated group served as healthy
control. CSF was collected from the cisterna magna at day 10 (disease onset) and 14
(peak of symptoms) after treatment and analyzed by bottom-up proteomics. The
analysis was based on Orbitrap LC-MS and QTOF LC-MS platforms in two
independent laboratories. The obtained data were processed in a crossover design
by a combination of two different approaches including our in-house developed
data processing pipeline, the Progenesis pipeline and the nearest shrunken
centroid classifier (NSC) as well as principal component analysis (PCA). By
combining results, we discovered 41 proteins significantly increasing in EAE
animals compared to the control groups, 28 of these have not been discovered as
discriminatory in the EAE model before. Among the discriminatory proteins are
Vitamin D binding protein, lysozyme C1, fetuin B, T-kininogen, serum
paraoxonase/arylesterase 1, glutathione peroxidase 3 and afamin. To our
knowledge, this is the first study of its kind focusing on a screening approach of
rat CSF from the EAE model.
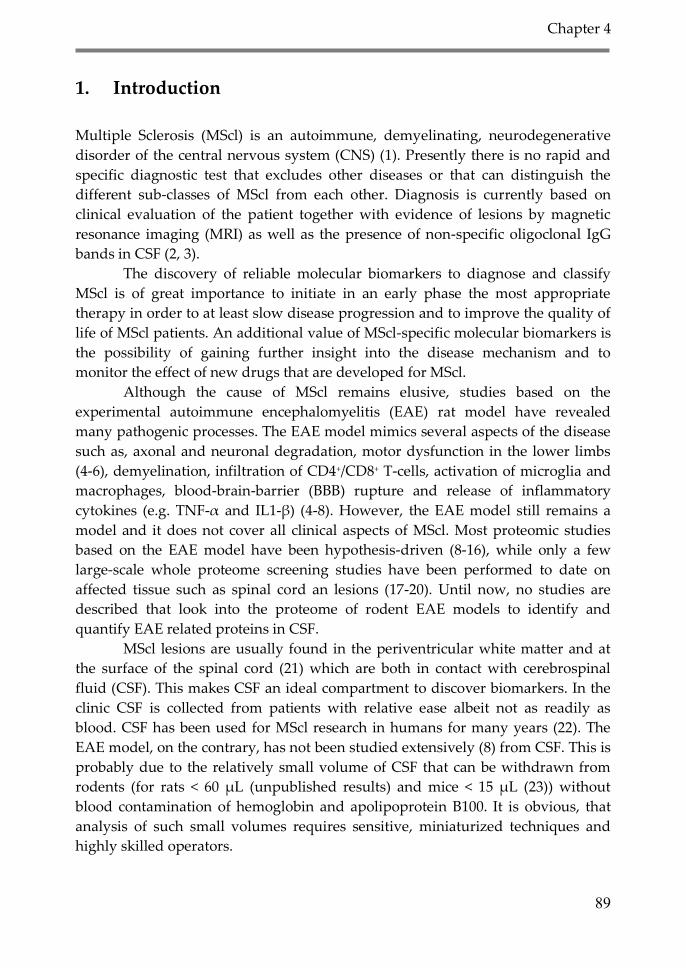
Chapter 4
89
1. Introduction
Multiple Sclerosis (MScl) is an autoimmune, demyelinating, neurodegenerative
disorder of the central nervous system (CNS) (1). Presently there is no rapid and
specific diagnostic test that excludes other diseases or that can distinguish the
different sub-classes of MScl from each other. Diagnosis is currently based on
clinical evaluation of the patient together with evidence of lesions by magnetic
resonance imaging (MRI) as well as the presence of non-specific oligoclonal IgG
bands in CSF (2, 3).
The discovery of reliable molecular biomarkers to diagnose and classify
MScl is of great importance to initiate in an early phase the most appropriate
therapy in order to at least slow disease progression and to improve the quality of
life of MScl patients. An additional value of MScl-specific molecular biomarkers is
the possibility of gaining further insight into the disease mechanism and to
monitor the effect of new drugs that are developed for MScl.
Although the cause of MScl remains elusive, studies based on the
experimental autoimmune encephalomyelitis (EAE) rat model have revealed
many pathogenic processes. The EAE model mimics several aspects of the disease
such as, axonal and neuronal degradation, motor dysfunction in the lower limbs
(4-6), demyelination, infiltration of CD4+/CD8+ T-cells, activation of microglia and
macrophages, blood-brain-barrier (BBB) rupture and release of inflammatory
cytokines (e.g. TNF-α and IL1-β) (4-8). However, the EAE model still remains a
model and it does not cover all clinical aspects of MScl. Most proteomic studies
based on the EAE model have been hypothesis-driven (8-16), while only a few
large-scale whole proteome screening studies have been performed to date on
affected tissue such as spinal cord an lesions (17-20). Until now, no studies are
described that look into the proteome of rodent EAE models to identify and
quantify EAE related proteins in CSF.
MScl lesions are usually found in the periventricular white matter and at
the surface of the spinal cord (21) which are both in contact with cerebrospinal
fluid (CSF). This makes CSF an ideal compartment to discover biomarkers. In the
clinic CSF is collected from patients with relative ease albeit not as readily as
blood. CSF has been used for MScl research in humans for many years (22). The
EAE model, on the contrary, has not been studied extensively (8) from CSF. This is
probably due to the relatively small volume of CSF that can be withdrawn from
rodents (for rats < 60 µL (unpublished results) and mice < 15 µL (23)) without
blood contamination of hemoglobin and apolipoprotein B100. It is obvious, that
analysis of such small volumes requires sensitive, miniaturized techniques and
highly skilled operators.
Proteome profiling in a rat EAE model
90
Here we report a comprehensive whole proteome analysis of CSF from
MBP-EAE Lewis rats using two LC-MS/MS platforms in two independent
laboratories. Samples were taken at the onset of disease symptoms (day 10) and at
the apex of symptoms (day 14) to detect early-indicator, disease-specific proteins
and link them to hallmarks of MScl disease and pathogenesis.
2. Material and Methods
2.1. Induction of acute EAE in the Lewis rat At the start of the study (day 0) EAE was induced in 30 male Lewis rats (Harlan
Laboratories B.V.) with a starting weight of 175 – 200 g, by injection of 100 μL
saline-based emulsion containing 20 μg guinea pig myelin basic protein (MBP),
500 μg Mycobacterium tuberculosis type 37HRa (Difco) and 50 μL Complete
Freunds’ Adjuvant (CFA) (EAE groups; E and F). Also at day 0, 30 additional male
Lewis rats received the same saline-based emulsion as above but without added
MBP (inflammatory control groups; C and D). The emulsion was injected
subcutaneously in the left hind paw under isoflurane anesthesia. Another 30 rats
were kept as untreated controls undergoing anesthesia only (healthy control
groups; A and B). The animal groups and samples included in the experimental
design of the present study are summarized in Table 1.
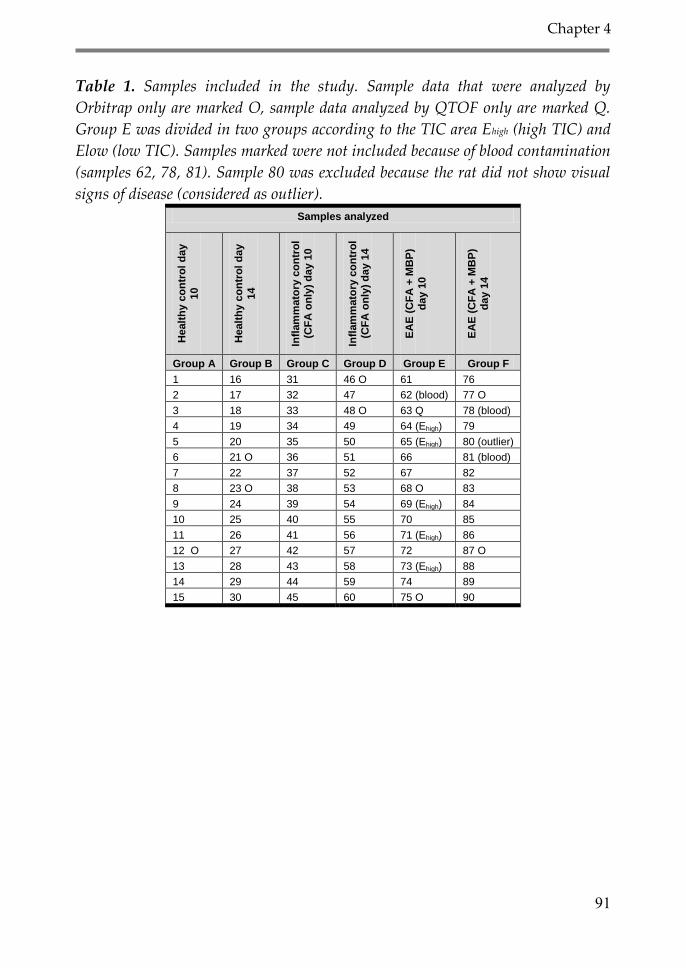
Chapter 4
91
Table 1. Samples included in the study. Sample data that were analyzed by
Orbitrap only are marked O, sample data analyzed by QTOF only are marked Q.
Group E was divided in two groups according to the TIC area Ehigh (high TIC) and
Elow (low TIC). Samples marked were not included because of blood contamination
(samples 62, 78, 81). Sample 80 was excluded because the rat did not show visual
signs of disease (considered as outlier).
Samples analyzed
Healt
hy
co
ntr
ol
da
y
10
Healt
hy
co
ntr
ol
da
y
14
Infl
am
mato
ry c
on
tro
l (C
FA
on
ly)
da
y 1
0
Infl
am
mato
ry c
on
tro
l (C
FA
on
ly)
da
y 1
4
EA
E (
CF
A +
MB
P)
da
y 1
0
EA
E (
CF
A +
MB
P)
da
y 1
4
Group A Group B Group C Group D Group E Group F
1 16 31 46 O 61 76
2 17 32 47 62 (blood) 77 O
3 18 33 48 O 63 Q 78 (blood)
4 19 34 49 64 (Ehigh) 79
5 20 35 50 65 (Ehigh) 80 (outlier)
6 21 O 36 51 66 81 (blood)
7 22 37 52 67 82
8 23 O 38 53 68 O 83
9 24 39 54 69 (Ehigh) 84
10 25 40 55 70 85
11 26 41 56 71 (Ehigh) 86
12 O 27 42 57 72 87 O
13 28 43 58 73 (Ehigh) 88
14 29 44 59 74 89
15 30 45 60 75 O 90
Proteome profiling in a rat EAE model
92
The animals were randomized for treatment and individually marked.
Three animals were kept in each cage (type III cages) where food and water were
available ad libitum. Disease symptoms and weights of all animals were recorded
daily. The following scores for motor dysfunction were used; 0: no pathological
signs, 1: paralysis of the tip of the tail, 2: no curling reflex/no strength at tail basis,
3: slightly impaired walking, 4: unstable walk, 5: half hind limb paralysis, 6:
complete hind limb paralysis, 7: midriff paralysis, 8: half fore limb paralysis, 9:
moribund, 10: death due to EAE.
From each of the 3 groups (EAE, inflammatory control, non-treated
control) 15 animals were sacrificed at day 10 (disease onset) (groups A, C and E)
and another 15 rats were sacrificed at day 14 (disease peak) (groups B, D and F).
CSF was also collected and pooled from 10 healthy animals to be used as quality
control (QC) sample during LC-MS analysis, for protein concentration
measurements, and for the set-up of protocols and analysis methods. All animal
experiments described in this study were approved by the local Ethical Committee
for Animal Experiments.
2.2. CSF Sampling At day 10 and 14, the animals were euthanized using CO2/O2, the head of the rats
were fixed using a holder to reveal the Arachnoid membrane and a skin incision
was made followed by a horizontal incision in the musculus trapezius pars
descendens. A maximum volume of 60 µL CSF was obtained by direct insertion of
an insulin syringe needle (Myjector, 29 G × 1/2" - 0.33 × 12 mm, 0.3 mL = 30 units)
via the arachnoid membrane into the cisterna magna. Within 20 minutes after
collection, each sample was centrifuged at a force of 2000 g for 10 minutes at 4 °C.
After centrifugation, the supernatant was aliquoted in five tubes of ~10 µL each
and stored (up to 6 months) at -80 °C until further analysis. Samples that
according to visual control as well as to the detection of hemoglobin-derived
peptides (analysis by Orbitrap LC-MS/MS) were considered to be contaminated
with blood and were subsequently excluded from the study. The samples
analyzed by the two platforms are listed in Table 1.
2.3. Sample preparation Protein digestion was performed as follows: 10 µL CSF and 10 µL 0.1%
RapiGest™ (Waters) dissolved in 50 mM ammonium bicarbonate were added to a
sample tube. The sample was reduced by adding 0.5 μL 1,4-dithiotreitol (DTT) (0.5
M) followed by incubation at 60 °C for 30 min. After cooling to room temperature
the sample was alkylated with 1 μL iodoacetamide (IAM) (0.3 M) in the dark for
30 min at room temperature. To the sample 1 μL sequencing grade modified

Chapter 4
93
trypsin (Promega, Madison, WI, USA, part # V5111) (1 µg/µL) (enzyme to protein
ratio; 1:10-50) was added and the sample was incubated for ~16 h at 37 °C under
slight agitation (450 rpm). Thereafter, 3 μL hydrochloric acid (0.5 M) was added
followed by incubation for 30 min at 37 °C. The sample was centrifuged at 13250 g
for 10 min at 4 °C to remove precipitated, hydrolyzed RapiGest™. The samples
were transferred to sample vials and analyzed in random order. Each of the
samples was exposed to three freeze-thaw cycles prior to LC-MS analysis.
2.4. ChipLC-QTOF MS proteomic analysis The sample order was randomized with quality controls (cytochrome C spiked
into the pooled CSF sample after digestion at 200 fmol/µL) and blanks injected
after every tenth sample. The sample injection volumes were normalized
according to the TIC area; a first injection of 0.5 μL of samples from all group
revealed a TIC area that was 5 times higher in group E and F compared to group
A-D. To normalize the TIC area a five times lower volume was injected of group E
and F (0.2 μL) compared to group A-D (1 μL). Peptides were separated on a
reverse phase LC-chip (Protein ID chip #3; G4240-63001 SPQ110: Agilent
Technologies; separating column: 150 mm × 75 µm Zorbax 300SB-C18, 5 µm; trap
column: 160 nL Zorbax 300SB-C18, 5 µm) coupled to a nano LC system (Agilent
1200) with a 40 μL injection loop. Ions were generated by electrospray ionization
(ESI) and transmitted to a quadrupole-time-of-flight (QTOF) mass spectrometer
(Agilent 6510). Instrumentation was operated under the MassHunter Data
Acquisition software (version B.01.03; Build 1.3.157.0; Agilent Technologies, Santa
Clara, USA).
For LC separation the following eluents were used; A: ultra-pure water
(conductivity 18.2 MΩ, Elga Labwater, Ede, The Netherlands) with 0.1% formic
acid (98-100%, pro analysis, Merck, Darmstadt, Germany); B: acetonitrile (HPLC-S
gradient grade, Biosolve, Valkenswaard, The Netherlands) with 0.1% formic acid.
The samples were injected on the trap column at a flow rate of 3 μL/min (3% B).
After 10 min the sample was transferred to the separation column at a flow rate of
250 nL/min and the peptides were eluted using the following gradient: 100 min
linear gradient from 3 to 50% B; 5 min linear gradient from 50 to 70% B; 4 min
linear gradient from 70 to 3%.
The MS analysis was done in the 2 GHz extended dynamic range mode
under the following conditions; mass range: 275-2000 m/z, acquisition rate: 1
spectrum/sec, data storage: profile and centroid mode, fragmentor: 175 V,
skimmer: 65 V, OCT 1 RF Vpp: 750 V, spray voltage: ~1900 V, drying gas temp: 325
ºC, drying gas flow (N2): 6 L/min. Mass correction was done during analysis using
internal standards; m/z: 371.31559 (originating from a ubiquitous background ion
(Dioctyl adipate, DOA, plasticizer) and m/z: 1221.990637 (HP-1221 calibration
Proteome profiling in a rat EAE model
94
standard, continuously evaporating from a wetted wick inside the spray
chamber).
Repeatability of the LC-MS analyses was assessed in terms of mass
accuracy, retention time and peak area based on four selected peptide peaks
originating from a cytochrome C digest spiked into the QC sample. The peaks
were smoothed (Gaussian function width; 15 points, [15 sec]) and integrated to
calculate the relative standard deviation (RSD) of the peak area (< +/- 30%) and the
retention time (< +/- 0.3% or 5 sec). Mass accuracy calculated as the mean of five
measurements from each selected cytochrome C peak, was within +/- 5 ppm of the
expected value.
For protein identification, samples were analyzed by auto MS/MS in the 4
GHz mode using the following settings; fragmentor: 175 V, skimmer: 65 V, OCT 1
RF Vpp: 750 V, precursor ion selection: medium (4 m/z), mass range: 200-2000 m/z,
acquisition rate for both MS and MS/MS: spectrum/sec, isolation width: ~ 4 amu,
ramped collision energy 3.7 V/100 Da, offset: 2.5 V, precursor setting: maximum 3
precursors/cycle, absolute threshold: 1000, relative threshold: 0.01% of the most
intense peak, active exclusion enabled after 2 selections, release of active exclusion
after 0.5 min, precursors sorted by abundance only. The MS/MS files were stored
in centroid mode. The LC separation was identical except for a slightly modified
enrichment and gradient elution program. After injection, peptides were enriched
for 15 min on the trap column before being transferred to the separation column.
Elution was done using the following gradient: 97 min linear gradient from 3 to
60% B; 15 min linear gradient from 60 to 3% B.
2.5. ChipLC-QTOF MS data processing Raw data were visually examined and exported to MzData.XML files in centroid
mode using the Agilent MassHunter Qualitative Analysis software (Agilent
version B.01.03; Build 1.3.157.0). Files were converted to ASCII format. In order to
limit file size, thresholds were used for the conversion (conversion of data was
limited to the time and mass range corresponding to eluting peptides and data
were converted with intensity filtering to reduce background noise) according to
following parameter settings; peak intensity: > 400 counts, mass range: 275-1600
m/z, retention time range: 22-95 min. The ASCII files were pre-processed using an
in-house data processing workflow developed in C++ (24, 25) producing a
common peak matrix of 5336 peaks (based on selection of 10 000 most intensive
peaks from each data file, this number is selected based on the quality of the data
and the noise threshold). The raw peak matrix was analyzed by principal
component analysis (PCA) to visualize the overall variability prior to feature
selection and analysis with double cross validated Nearest Shrunken Centroid
(NSC) algorithm (26) (MatLab R2009a, Mathworks, Natick, MA, USA).
Chapter 4
95
The NSC classifier was applied on the generated peak matrix in order to
find the most discriminatory peptide peaks in the comparisons; A vs. E, C vs. E, B
vs. F and D vs. F. Double cross-validation was implemented by counting
classification error rate in function of the shrinkage in the inner loop and to
measure the classification performance in the outer loop. When the lowest
classification error rate was recorded for broad continuous range of shrinkage, the
optimal shrinkage value was selected manually in order to generate the peak list.
The NSC-selected features were subsequently visualized by PCA.
NSC-selected peaks were subsequently visualized using extracted ion
chromatograms (EICs) with the MassHunter software. EICs for selected m/z
values were smoothed and integrated, and the generated peak areas were
exported in Excel format. Peak areas from both the peak matrix as well as the
chromatograms were compared between groups using one way ANOVA with
Bonferroni correction (SPSS Inc., Chicago, Il, USA). Peak area differences with a p-
value below 0.01 were considered significant.
For processing of the same raw data with a different workflow, the data
files were converted to MzXML format using the open source msconvert parser in
the proteowizard pipeline (27). The generated files were pre-processed in terms of
feature extraction, retention time alignment and matching the same peaks across
multiple chromatograms using the Progenesis LC-MS software package (version
2.5, Nonlinear Dynamics, Newcastle-upon-Tyne, United Kingdom) generating a
raw peak matrix. The resulting peak matrix was exported in Excel format
(Microsoft Office Excel 2007, Microsoft Corporation, Redmond, WA, USA) and the
10 000 most intensive peaks were selected for further analysis. The NSC classifier
was applied and the same procedure as described above was applied on the data
set.
Discriminatory features were searched for matching m/z, RT and charge
states (Δ RT: max ± 1 min, Δ m/z: max ± 10 ppm) in an Excel file containing all
identified ions from the auto MS/MS analysis (see following section). After having
assigned a discriminatory peptide peak to a given protein, all other identified
peptides from that protein were examined to evaluate whether they followed the
same pattern. Only proteins where at least 80 % of all identified peptides had a p-
value below 0.01 when compared by ANOVA with Bonferroni correction (A vs. E,
C vs. E, B vs. F and D vs. F) were considered discriminatory. The peak areas for all
discriminatory peptides belonging to the same protein were summed within the
sample groups and an average was calculated. A protein with a difference of at
least a factor of two for proteins that increased in the diseased groups (E and F)
was considered as significantly discriminatory. For decreasing proteins a factor of
ten times was considered as significant (since group E and F was injected at five
times lower volume compared to group A-D, a protein decreasing ten times are
Proteome profiling in a rat EAE model
96
decreasing only two times at native relative comparison [raw samples without any
normalization]).
2.6. Protein identification (QTOF data) For protein identification one sample from group F and one sample from group A
were analyzed by data-dependent MS/MS, the generated data files were converted
to the .mgf format and exported to the Phenyx data base search tool (version 2.6,
Geneva Bioinformatics, Geneva, Switzerland,). MS/MS spectra were searched
against the uniprot_sprot and uniprot_sprot_rev databases (version: 20090608,
Taxonomy: Rattus norvegicus). The search parameters were set as follows: scoring
model: ESI-QTOF (QTOF), parent charge: +2, +3, +4, peptide/AC score: ≥ 5, peptide
length: ≥ 4, p-value < 0.001, enzyme: trypsin, missed cleavage: 2, parent tolerance:
10 ppm, amino acid modifications: carbamidomethylation of cysteine (fixed, all),
oxidation of methionine (variable, <4), cleavage mode: normal, false positive rate
upon searching the reverse database < 2%. Only proteins that were identified with
at least two separate peptides were considered as true positives.
2.7. Nano-LC-ESI-Orbitrap MS/MS Digested rat CSF samples were analyzed by LC-MS/MS using an Ultimate 3000
nano LC system (Dionex, Germering, Germany) online coupled to a hybrid linear
ion trap / Orbitrap mass spectrometer (LTQ Orbitrap XL; Thermo Fisher Scientific,
Bremen, Germany). Five microliter digest were loaded onto a C18 trap column
(C18 PepMap, 300µm ID x 5mm, 5µm particle size, 100 Å pore size; Dionex, The
Netherlands) and desalted for 10 minutes using a flow rate of 20 µL /min. The trap
column was switched online to the analytical column (PepMap C18, 75 μm ID x
150 mm, 3 μm particle and 100 Å pore size; Dionex, The Netherlands) and
peptides were eluted with the following binary gradient: 0% - 25% solvent B for
120 min and 25% - 50% solvent B for further 60 minutes, where solvent A
consisted of 2% acetonitrile and 0.1% formic acid in ultra pure water and solvent B
consisted of 80% acetonitrile and 0.08% formic acid in water. The column flow rate
was set to 300 nL/min. For MS detection a data dependent acquisition method was
used: a high resolution survey scan from 400 – 1800 m/z was performed in the
Orbitrap (automatic gain control (AGC) 106, resolution 30,000 at 400 m/z; lock
mass set to 445.120025 m/z [protonated (Si(CH3)2O)6])(28). Based on this survey
scan the 5 most intense ions were consecutively isolated (AGC target set to 104
ions) and fragmented by collision-activated dissociation (CAD) applying 35%
normalized collision energy in the linear ion trap. Once a precursor had been
selected, it was excluded for 3 minutes.

Chapter 4
97
2.8. Orbitrap data processing The raw data was preprocessed using the Progenesis LC-MS software package
(version 2.5) (no normalization was applied). Peptides were identified and
assigned to proteins by exporting features, for which MS/MS spectra were
recorded, using in the Bioworks software package (version 3.2; Thermo Fisher
Scientific, Germany, peak picking by Extract_msn, default settings). The resulting
.mgf file was submitted to Mascot (version 2, Matrix Science, London, United
Kingdom) for identification to interrogate the UniProt-database (version 57.0,
rattus taxonomy: 7114 sequences). Only ions with charge states between +2 and +7
were considered and only proteins with at least two unique peptides (with a
Mascot sore > 25) assigned to them were accepted as true identifications.
Modifications: carbamidomethylation of cysteine (+57.021 m/z) was set as fixed
and oxidation of methionine (+15.996 m/z) as variable modification allowing a
maximum of 2 missed cleavages. Mass tolerance for precursor ions was set to 10
ppm and for fragment ions at 0.5 Da. The cut-off for mass differences between the
measured and the theoretical mass of the identified peptides was set at 2 ppm. The
Mascot search results were imported back into the Progenesis software to link the
identified peptides to the detected abundances of these peptides. Subsequently the
data were exported in Excel format.
The peak matrix containing only the identified features was analyzed by
one-way ANOVA with Bonferroni post hoc test (A vs. E, C vs. E, B vs. F and D vs.
F) (SPSS). All identified proteins with 80 % of the identified peptides having a p-
value below 0.01 in the statistical test were kept for further analysis. The sum of all
peptides originating from the same protein was calculated for each sample and the
average of this sum was calculated for each group of animals and compared
between diseased groups and controls (A vs. E, C vs. E, B vs. F and D vs. F). If the
average sum in the diseased groups was increased at least 10 times or decreased
more than 2 times, the protein was considered as significantly discriminatory
(since the overall protein abundance was increased by five times in the diseased
groups, we considered that proteins had to increase a factor of two more than this
overall increase to be significantly discriminatory).
For further analysis of the Orbitrap data using a second data processing
procedure a normalization (29) was applied in the Progenesis software (to
compensate for the large TIC differences and detect differences between groups
that were not caused by an overall increase in protein abundance). The resulting
peak matrix was further processed in Microsoft Office Excel 2007. All non-
identified peaks were filtered out and the peak matrix was imported into MatLab
(version R2009a) for NSC and PCA analysis. The NSC analysis was done pair wise
(A vs. E, C vs. E, B vs. F and D vs. F) for selection of discriminatory peaks between
the diseased and control groups. PCA was applied to the NSC-selected features as
well as to the complete peak matrix to visualize group separations. The NSC-
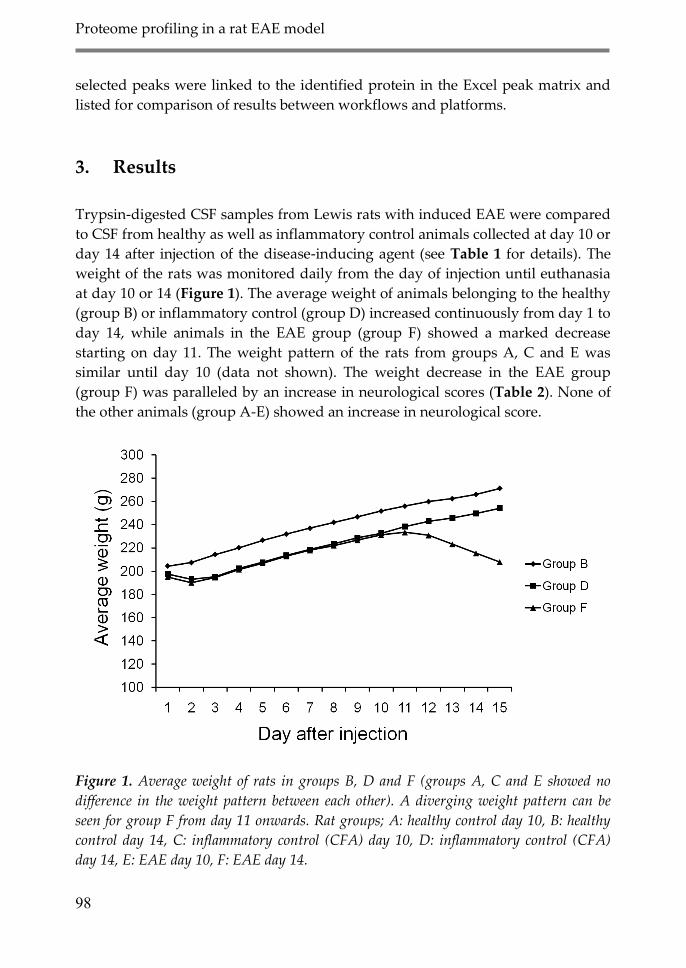
Proteome profiling in a rat EAE model
98
selected peaks were linked to the identified protein in the Excel peak matrix and
listed for comparison of results between workflows and platforms.
3. Results
Trypsin-digested CSF samples from Lewis rats with induced EAE were compared
to CSF from healthy as well as inflammatory control animals collected at day 10 or
day 14 after injection of the disease-inducing agent (see Table 1 for details). The
weight of the rats was monitored daily from the day of injection until euthanasia
at day 10 or 14 (Figure 1). The average weight of animals belonging to the healthy
(group B) or inflammatory control (group D) increased continuously from day 1 to
day 14, while animals in the EAE group (group F) showed a marked decrease
starting on day 11. The weight pattern of the rats from groups A, C and E was
similar until day 10 (data not shown). The weight decrease in the EAE group
(group F) was paralleled by an increase in neurological scores (Table 2). None of
the other animals (group A-E) showed an increase in neurological score.
Figure 1. Average weight of rats in groups B, D and F (groups A, C and E showed no
difference in the weight pattern between each other). A diverging weight pattern can be
seen for group F from day 11 onwards. Rat groups; A: healthy control day 10, B: healthy
control day 14, C: inflammatory control (CFA) day 10, D: inflammatory control (CFA)
day 14, E: EAE day 10, F: EAE day 14.

Chapter 4
99
Table 2. Neurological scores of the samples included in the analysis from animals in group
F monitored at each day (Only group F showed increased neurological scores).
Explanation; 0: no pathological signs, 1: paralysis of the tip of the tail, 2: no curling
reflex/no strength at tail basis, 3: slightly impaired walking, 4: unstable walk, 5: half hind
limb paralysis, 6: complete hind limb paralysis, 7: midriff paralysis, 8: half for-limb
paralysis, 9: moribund, 10: death due to EAE.
Sam
ple
nr.
Sco
re d
ay 9
Sco
re d
ay 1
0
Sco
re d
ay 1
1
Sco
re d
ay 1
2
Sco
re d
ay 1
3
Sco
re d
ay 1
4
76 0 0 2 4 5 4
77 0 0 0 1 3 4
79 0 0 0 1 3 4
80 0 0 0 0 0 0
82 0 0 0 3 4 5
84 0 0 2 4 4 4
85 0 0 0 1 3 4
86 0 0 0 3 6 6
87 0 0 1 3 4 3
88 0 0 1 4 4 4
89 0 0 2 4 5 5
90 0 0 1 3 6 6
Visual inspection of the LC-MS data revealed that the total protein
concentration (measured as the total ion chromatogram or the UV-trace) was
significantly higher (~5 times) for all animals in group F and for about half of the
animals in group E. Differences were highly significant as shown by box and
whisker plots of the area under curve of the total ion chromatograms (TIC) based
on the chipLC-QTOF analyses (Figure 2A). In order to not overload the trap and
separating columns on the microfluidics device and to make optimal use of the
dynamic range of the LC-MS system, samples from groups E and F were injected a
second time at a 5 times lower volume (0.2 µL) compared to group A-D (1 µL)
giving comparable areas for the TIC (Figure 2B). Interestingly, variation was very
high in group E (EAE animals at the general onset of disease, day 10). This is most
probably due to variable inception of disease depending on the individual animal.
Variability at day 14, when disease symptoms have reached their maximum, was
again rather small (Figure 2 A, 2B).
In the LC-Orbitrap system all samples were injected at the same volume (5
µL), with no problems of overloading, because a trap column with larger volume
capacity was used for acquisition with Orbitrap MS. In order to, in the PCA and
NSC analyses, rule out detections of differences caused by an overall increase of

Proteome profiling in a rat EAE model
100
protein abundance in the group E and F analyzed by the Orbitrap, the data was
normalized at data level (29). For peak area comparisons the raw data without
normalization was used. Combining the QTOF and Orbitrap methods we
identified 233 proteins with at least 2 unique peptides each.
Figure 2. A. Area under the curve of the Total Ion Chromatograms (TICs) from analysis of
0.5 µL trypsin-digested cerebrospinal fluid (CSF) from groups A-F. Univariate statistical
analysis (Student’s t-test) revealed significant differences between the sample groups (A
vs. E: p < 0.05; C vs. E: p < 0.05; B vs. F: p < 0.0001; D vs. F: p < 0.0001). B. TIC areas
after taking the difference in TIC area into account by injecting 1 µL of trypsin-digested
CSF for groups A-D and 0.2 µL for groups E and F (Univariate statistical analysis
revealed no significant difference when the groups were compared with each other).
Since protein concentration (measured as Total Ion Chromatogram, TIC) in
group E was highly variable, we compared this group as a whole but also divided
it into a ‚high‛ TIC group (Ehigh) (squares) and a ‚low‛ TIC group (Elow) (stars)
(Table 1). Figure 3A visualizes the PCA of the normalized Orbitrap data showing
that groups E and F deviate from the control groups A-D even though the total ion
chromatograms were normalized. Figure 3B show the corresponding PCA of raw
QTOF data (normalized through injection of different volumes at sample level)
confirming that groups E and F differ significantly from the control groups in their
digested protein profile. In both the Orbitrap and the QTOF analysis group Ehigh is
more separated from group A-D than Elow.
In order to select individual peptide peaks that show statistically
significant differences in abundance between the different groups of animals, we
applied the NSC classifier to the QTOF-MS and the Orbitrap-MS peak matrices
using a double cross validation scheme (30, 31). For all the comparisons the NSC
recorded the lowest classifications error rates for wide continuous ranges of
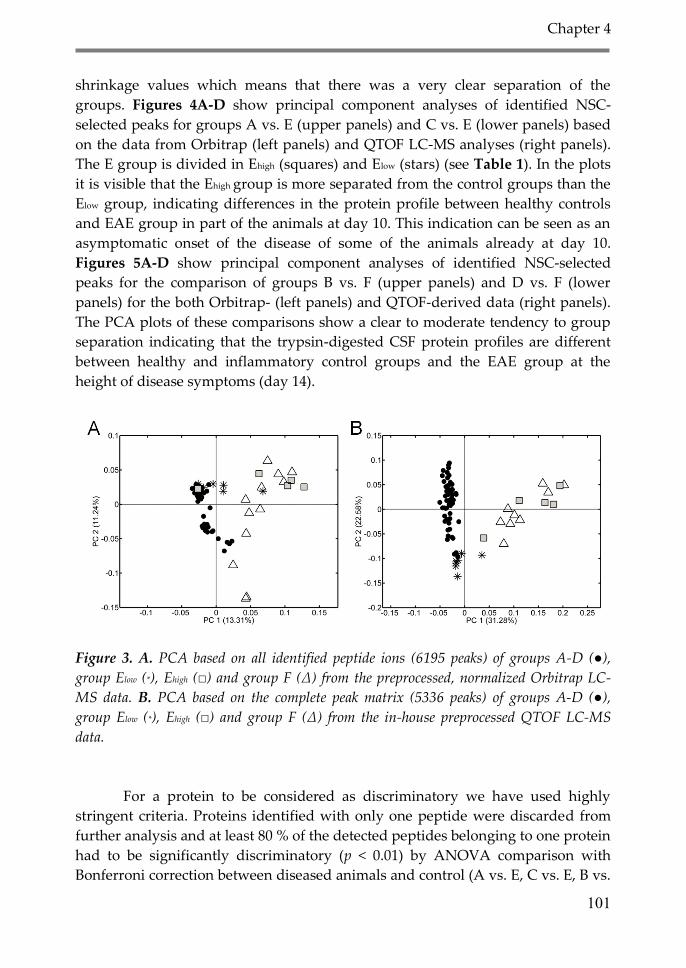
Chapter 4
101
shrinkage values which means that there was a very clear separation of the
groups. Figures 4A-D show principal component analyses of identified NSC-
selected peaks for groups A vs. E (upper panels) and C vs. E (lower panels) based
on the data from Orbitrap (left panels) and QTOF LC-MS analyses (right panels).
The E group is divided in Ehigh (squares) and Elow (stars) (see Table 1). In the plots
it is visible that the Ehigh group is more separated from the control groups than the
Elow group, indicating differences in the protein profile between healthy controls
and EAE group in part of the animals at day 10. This indication can be seen as an
asymptomatic onset of the disease of some of the animals already at day 10.
Figures 5A-D show principal component analyses of identified NSC-selected
peaks for the comparison of groups B vs. F (upper panels) and D vs. F (lower
panels) for the both Orbitrap- (left panels) and QTOF-derived data (right panels).
The PCA plots of these comparisons show a clear to moderate tendency to group
separation indicating that the trypsin-digested CSF protein profiles are different
between healthy and inflammatory control groups and the EAE group at the
height of disease symptoms (day 14).
Figure 3. A. PCA based on all identified peptide ions (6195 peaks) of groups A-D (●),
group Elow (*), Ehigh (□) and group F (∆) from the preprocessed, normalized Orbitrap LC-
MS data. B. PCA based on the complete peak matrix (5336 peaks) of groups A-D (●),
group Elow (*), Ehigh (□) and group F (∆) from the in-house preprocessed QTOF LC-MS
data.
For a protein to be considered as discriminatory we have used highly
stringent criteria. Proteins identified with only one peptide were discarded from
further analysis and at least 80 % of the detected peptides belonging to one protein
had to be significantly discriminatory (p < 0.01) by ANOVA comparison with
Bonferroni correction between diseased animals and control (A vs. E, C vs. E, B vs.

Proteome profiling in a rat EAE model
102
F and D vs. F). Because of the large differences in total amount of protein in the
EAE diseased animals (groups E and F) compared to the control groups, only
proteins that exceeded the increase of total protein amount (five times) by at least
twofold. To determine the fold increase the average of the sum of all peptides
from a protein in one group was compared it to the identical protein in another
group. For proteins that decreased in the diseased groups compared to control a
factor of two was considered as discriminatory. The protein level in samples from
group E and F was already present at a factor of five lower than in the raw, native
samples for QTOF data (because of the normalized injection). This means that in
the QTOF data a two fold increase and a tenfold decrease was considered as
discriminatory. In the Orbitrap data that was not normalized at either sample or
data level but instead compared at a native relative level the increase had to be a
factor of ten in group E and F compared to control, while the decrease had to be
twofold to be considered as significant.
Figure 4. PCA of NSC-selected peaks from the Orbitrap (A and C) and QTOF data (B and
D). A. A (▼) vs. E: Elow (*) Ehigh (□) Orbitrap data: PCA based on 3 identified NSC-selected
peaks at shrinkage 8. B. A vs. E QTOF data: PCA based on 70 identified NSC-selected
Chapter 4
103
peaks at shrinkage 4. C. C (▼) vs. E: Elow (*) Ehigh (□) Orbitrap data: PCA based on 1950
identified NSC-selected peaks at shrinkage 1. D. C vs. E QTOF data: PCA based on 17
identified NSC-selected peaks at shrinkage 7.
Figure 5. PCA of NSC-selected peaks from the Orbitrap (A and C) and QTOF data (B and
D). A. B (▼) vs. F(*) Orbitrap data: PCA based on 96 identified NSC-selected peaks at
shrinkage 4. B. B vs. F QTOF data: PCA based on 23 identified NSC-selected peaks at
shrinkage 7. C. D (▼) vs. F (*) Orbitrap data: PCA based on 583 identified NSC-selected
peaks at shrinkage 2. D. D vs. F QTOF data: PCA based on 31 identified NSC-selected
peaks at shrinkage 7.
Figure 6 A-D shows box and whisker plots of the average sum of the peak
areas of all detected peptides from four different proteins. The serum protein
paraoxonase/arylesterase 1 (P55159) (average of 4 peptides) is clearly increased in
the Ehigh group (84 times increased at native comparison level [no normalization]
in Orbitrap data) and decreases relative to group Ehigh to an 8 fold increase in
group F relative to healthy and inflammatory control groups (see Figure 6A and
Table 3). This indicates that animals react differently to induction of EAE in time
Proteome profiling in a rat EAE model
104
and that the onset of disease, as detected by proteomics, is not synchronized
exactly on Day 10. It is noteworthy that none of the animals in group E had
neurological symptoms (the neurological score was zero). The fact that this protein
was increasing strongly at the onset of the disease while decreasing to a lower
level at the climax of the disease course, indicates that this protein is elevated as a
result of an acute early disease process or the start of disruption of the blood brain
barrier. Lysozyme C1 (P00697) (average of 4 peptides) was dramatically increased
in group F (11 times increased in the QTOF data [normalized at sample level])
while it remained almost at the level of the control groups in group E (see Figure
6B, Table 3). This protein showed the same behavior in the Orbitrap data as well
but did not fulfill our criteria to be considered as significantly discriminatory.
Lysozyme C1 here show a very disease specific pattern with a clear increase only
at the apex of the disease, this indicates that this protein might be involved in
processes that are more related to CSF membrane disrupture. Complement C3
(P01026) (figure based on QTOF data, normalized at sample level, average of 11
peptides) showed yet another pattern in that it was increased in group Ehigh as well
as the F group (3 times increased in both groups compared to control in QTOF
analysis, see Figure 6C, Table 3). This protein was 14 times increased in the F vs. B
comparison and 26 times increased in the Ehigh vs. A comparison in the Orbitrap
analysis (non-normalized). The pattern of an increased level already at the onset of
the disease and with a maintained high level at the apex makes it an early onset
candidate marker as well as a marker for one of the pathological processes in the
developing disease. Vitamin D binding protein (P04276) (figure based on QTOF
data, normalized at sample level, average of 8 peptides) also increased
significantly already in the Ehigh group (3 times increased in QTOF analysis and 21
times increased in Orbitrap analysis), in group F the increase was also significant
but lower (2 times increased in QTOF analysis and 7 times increased in Orbitrap
analysis) compared to control (Figure 6D, Table 3). Also this protein has a
stronger effect in the early stage of the disease making it a potential early
candidate marker.
There were a few proteins, apolipoprotein E (P02650), angiotensinogen
(P01015) and prostaglandin D synthase (PTGDS, P22057), of which the
concentration did not follow the TIC. We assume that these proteins in this case
are genuine CSF-derived proteins, which are not affected by a change in
permeability of the blood-brain barrier (BBB). Figure 7 shows the sum of the peak
areas of 4 peptides originating from PTGDS detected in the QTOF analysis. In
Figure 7A the raw data from the QTOF analysis (TIC normalized at sample level,
five times less injected of group E and F compared to group A-D) showing a
significantly decreasing pattern of this protein in the diseased animals compared
to control (p < 0.01) the decrease of the diseased groups compared to the control
groups were however less than 4 times. Figure 7B is based on a QTOF analysis

Chapter 4
105
were all samples were injected at the same volume (native relative comparison),
here the protein is stable in all groups, indicating clearly that differences between
groups are non-significant (p > 0.05).
Figure 6. Boxplots of the average sum of all peptides from 4 discriminatory proteins. In the
figures group E is divided in two groups (Ehigh and Elow) based on their TIC area; Ehigh: high
TIC, Elow: low TIC. All values originates from raw data from the analysis (no
normalization at data level). A. Serum paraoxonase/arylestarase 1 (average of 4 peptides),
this protein was detected by the Orbitrap analysis only. B. Lysozyme C1 (average of 4
peptides) the protein was only significantly discriminatory in the QTOF analysis but
showed the same behavior in the Orbitrap analysis. C. Complement C3 (average of 10
peptides), significantly discriminatory in both Orbitrap and QTOF analysis. D. Vitamin
D binding protein (average of 8 peptides) also this protein was significantly discriminatory
in both QTOF and Orbitrap analysis.
In Table 3 all discriminatory proteins that increased more than 2 times (10
times in non-normalized data) in the diseased groups Ehigh and/or F compared to
groups A and B respectively from both analysis platforms are listed with the

Proteome profiling in a rat EAE model
106
relative change in abundance between groups F and B and Ehigh and A,
respectively. No protein showed a significantly decrease in abundance in the
disease groups (E and F). The upper part of the table shows 14 proteins that were
found to be discriminatory in both data sets, the middle part shows 23 proteins
that were only detected by the Orbitrap, and the lower part shows 4 proteins that
were discriminatory only in the QTOF data set, although these four proteins were
also detected in the Orbitrap analysis. While Orbitrap data showed the same
tendency as the QTOF data, the results did not fulfill our stringent criteria and the
proteins were therefore not considered as significantly different (see Table S.1.,
supplementary material for the identification information for each peptide and
protein detected by the QTOF method given in Table 3). In summary, based on
our data we can discriminate 41 proteins that increase in EAE compared to healthy
and inflammatory control groups, of which 28 are not described as discriminatory
in EAE before.
Figure 7. Boxplots of the average sum of 4 peptides originating from prostaglandin D
synthase detected in the QTOF analysis. Group E is divided in two groups (Ehigh and Elow)
based on their TIC area; Ehigh: high TIC, Elow: low TIC. A. Raw values from the QTOF LC-
MS analysis (normalization of TIC’s at injection level; samples from group E and F
injected at 5 times lower volume than group A-D). B. raw values from QTOF LC-MS
analysis where all samples were injected at the same volume (0.5 µL each).
4. Discussion
In human subjects, the large biological variation complicates the detection of
biomarkers, especially when using a screening approach of the whole proteome.
Working with an animal model makes it possible to collect both tissue samples
and CSF; a better control of the disease course in the animal model enables
Chapter 4
107
collection of samples at a specific stage of the disease, which makes it possible to
get a strong response also when screening complex samples. Candidate markers
detected in the EAE model can then be evaluated in human subjects in a targeted
fashion.
Here we have described an interlaboratory proteomic biomarker study
based on CSF from an acute EAE model mimicking certain aspects of MScl. The
goal was to find proteins connected to the disease. We have analyzed CSF samples
using two different mass spectrometry based proteomics platforms at two
independent laboratories. We have also applied two separate data processing
workflows on both of the data sets.
Our study shows that induction of EAE in rats leads to a significant on
average five times increase in the total protein concentration in cerebrospinal fluid
(CSF). Despite this general change in protein concentration, we identified 41
proteins that increased at least by a further factor of 2 clearly discriminating EAE
animals from control animals. The fact that we have also found proteins that do
not change in concentration between the groups of animals demonstrates that the
observed increase in protein concentration is not simply due to a decreased
volume of CSF or a generic overall response of all proteins in groups E and F, but
that the identified proteins increase in response is due to the induction of EAE in a
disease controlled active regulated way.
There was a longitudinal component in our study, as the animals in groups E and
F were both injected with MBP + CFA but in group E, CSF was collected on day
10, at the onset of EAE while CSF from group F was collected at the climax of
disease symptoms on day 14. Figure 1 and Table 2 show that the animals in group
F started to lose weight and showed elevated neurological scores from day 11
onwards, some of the animals in group F started off with a higher neurological
score at day 11 while some of the animals still had no score at this day. The
separation of the animals in group E might be a sign of which animals will
develop scores earlier (Ehigh) than other animals (Elow), all rats in group E were
asymptomatic at the day of sacrifice (day 10) despite the fact that the Ehigh group
had clearly elevated levels of proteins related to the animals in group F at the apex
of disease (see Figure 6). This indicates that protein patterns may be used as early
indicators of disease onset prior to the appearance of clinical symptoms. The time
difference in response to induction of EAE in an inbred strain of rats held under
the same conditions must be taken into account when evaluating the effect of
pharmacological interventions with newly developed drug candidates at an early
stage of onset of the disease.
This study was interlaboratory in the means of the same sample set being
analyzed at two separate university sites using different analysis platforms. We
also combined two different data processing pipelines on the two data sets each in
order to cover as much of the variation as possible. The results from the different
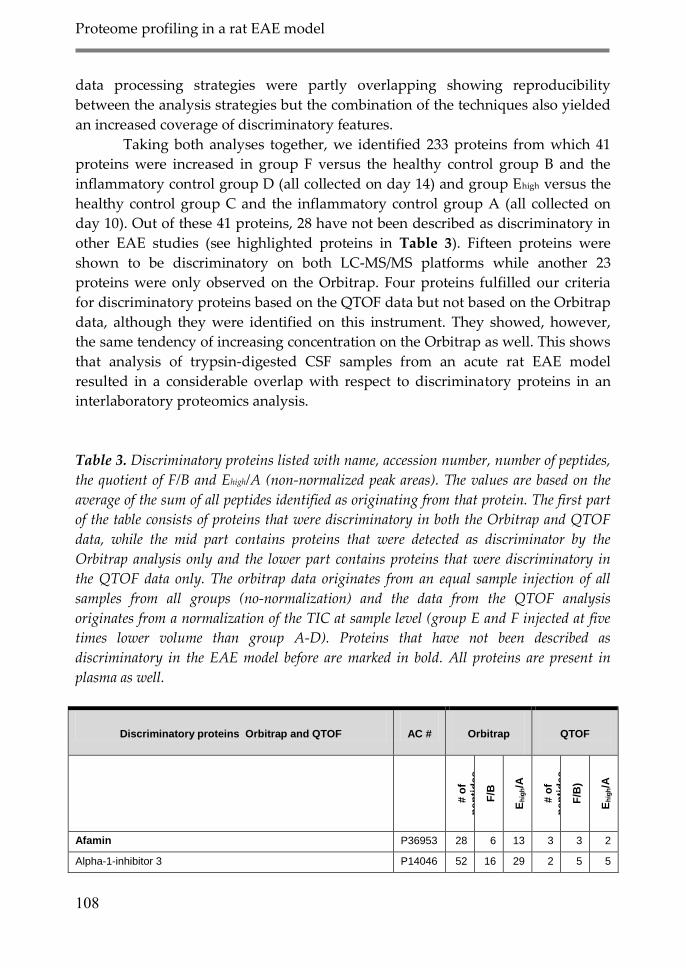
Proteome profiling in a rat EAE model
108
data processing strategies were partly overlapping showing reproducibility
between the analysis strategies but the combination of the techniques also yielded
an increased coverage of discriminatory features.
Taking both analyses together, we identified 233 proteins from which 41
proteins were increased in group F versus the healthy control group B and the
inflammatory control group D (all collected on day 14) and group Ehigh versus the
healthy control group C and the inflammatory control group A (all collected on
day 10). Out of these 41 proteins, 28 have not been described as discriminatory in
other EAE studies (see highlighted proteins in Table 3). Fifteen proteins were
shown to be discriminatory on both LC-MS/MS platforms while another 23
proteins were only observed on the Orbitrap. Four proteins fulfilled our criteria
for discriminatory proteins based on the QTOF data but not based on the Orbitrap
data, although they were identified on this instrument. They showed, however,
the same tendency of increasing concentration on the Orbitrap as well. This shows
that analysis of trypsin-digested CSF samples from an acute rat EAE model
resulted in a considerable overlap with respect to discriminatory proteins in an
interlaboratory proteomics analysis.
Table 3. Discriminatory proteins listed with name, accession number, number of peptides,
the quotient of F/B and Ehigh/A (non-normalized peak areas). The values are based on the
average of the sum of all peptides identified as originating from that protein. The first part
of the table consists of proteins that were discriminatory in both the Orbitrap and QTOF
data, while the mid part contains proteins that were detected as discriminator by the
Orbitrap analysis only and the lower part contains proteins that were discriminatory in
the QTOF data only. The orbitrap data originates from an equal sample injection of all
samples from all groups (no-normalization) and the data from the QTOF analysis
originates from a normalization of the TIC at sample level (group E and F injected at five
times lower volume than group A-D). Proteins that have not been described as
discriminatory in the EAE model before are marked in bold. All proteins are present in
plasma as well.
Discriminatory proteins Orbitrap and QTOF
AC #
Orbitrap
QTOF
# o
f
pe
pti
de
s
F/B
Eh
igh/A
# o
f p
ep
tid
es
F/B
)
Eh
igh/A
Afamin P36953 28 6 13 3 3 2
Alpha-1-inhibitor 3 P14046 52 16 29 2 5 5
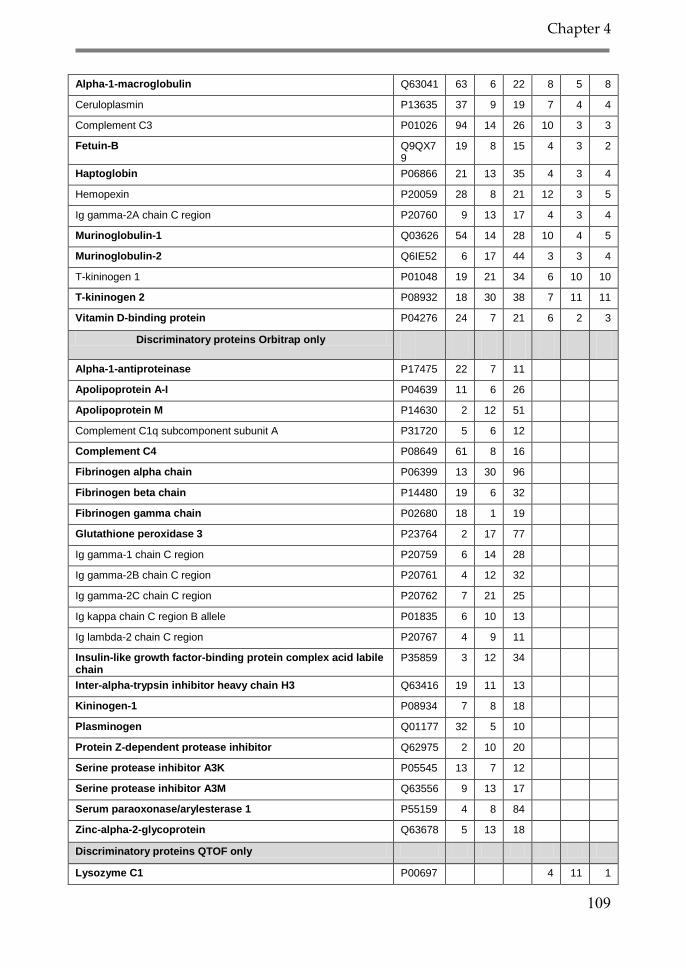
Chapter 4
109
Alpha-1-macroglobulin Q63041 63 6 22 8 5 8
Ceruloplasmin P13635 37 9 19 7 4 4
Complement C3 P01026 94 14 26 10 3 3
Fetuin-B Q9QX79
19 8 15 4 3 2
Haptoglobin P06866 21 13 35 4 3 4
Hemopexin P20059 28 8 21 12 3 5
Ig gamma-2A chain C region P20760 9 13 17 4 3 4
Murinoglobulin-1 Q03626 54 14 28 10 4 5
Murinoglobulin-2 Q6IE52 6 17 44 3 3 4
T-kininogen 1 P01048 19 21 34 6 10 10
T-kininogen 2 P08932 18 30 38 7 11 11
Vitamin D-binding protein P04276 24 7 21 6 2 3
Discriminatory proteins Orbitrap only
Alpha-1-antiproteinase P17475 22 7 11
Apolipoprotein A-I P04639 11 6 26
Apolipoprotein M P14630 2 12 51
Complement C1q subcomponent subunit A P31720 5 6 12
Complement C4 P08649 61 8 16
Fibrinogen alpha chain P06399 13 30 96
Fibrinogen beta chain P14480 19 6 32
Fibrinogen gamma chain P02680 18 1 19
Glutathione peroxidase 3 P23764 2 17 77
Ig gamma-1 chain C region P20759 6 14 28
Ig gamma-2B chain C region P20761 4 12 32
Ig gamma-2C chain C region P20762 7 21 25
Ig kappa chain C region B allele P01835 6 10 13
Ig lambda-2 chain C region P20767 4 9 11
Insulin-like growth factor-binding protein complex acid labile chain
P35859 3 12 34
Inter-alpha-trypsin inhibitor heavy chain H3 Q63416 19 11 13
Kininogen-1 P08934 7 8 18
Plasminogen Q01177 32 5 10
Protein Z-dependent protease inhibitor Q62975 2 10 20
Serine protease inhibitor A3K P05545 13 7 12
Serine protease inhibitor A3M Q63556 9 13 17
Serum paraoxonase/arylesterase 1 P55159 4 8 84
Zinc-alpha-2-glycoprotein Q63678 5 13 18
Discriminatory proteins QTOF only
Lysozyme C1 P00697 4 11 1
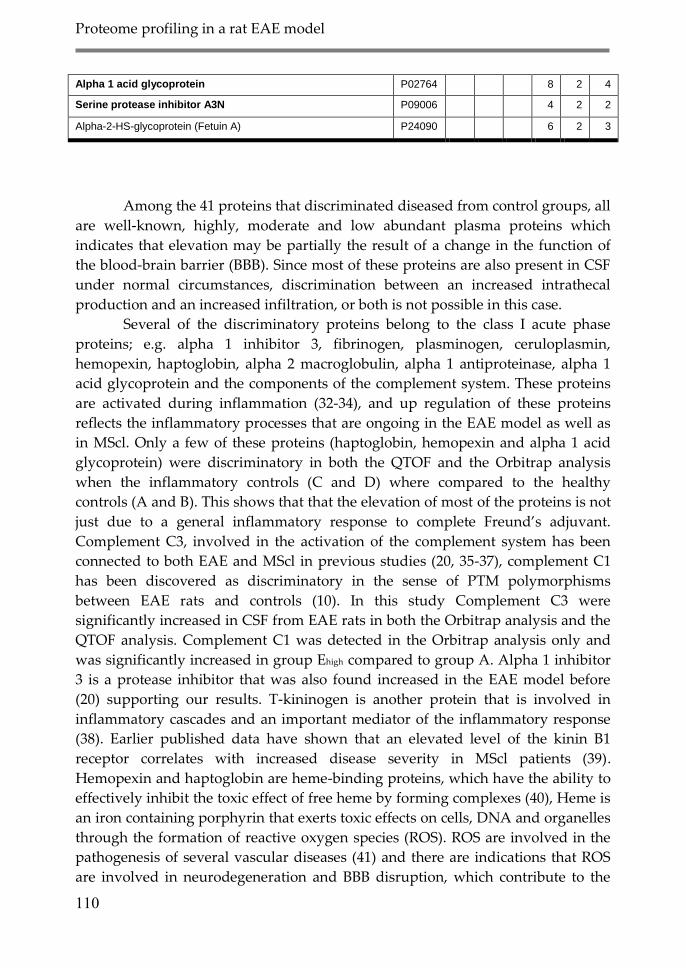
Proteome profiling in a rat EAE model
110
Alpha 1 acid glycoprotein P02764 8 2 4
Serine protease inhibitor A3N P09006 4 2 2
Alpha-2-HS-glycoprotein (Fetuin A) P24090 6 2 3
Among the 41 proteins that discriminated diseased from control groups, all
are well-known, highly, moderate and low abundant plasma proteins which
indicates that elevation may be partially the result of a change in the function of
the blood-brain barrier (BBB). Since most of these proteins are also present in CSF
under normal circumstances, discrimination between an increased intrathecal
production and an increased infiltration, or both is not possible in this case.
Several of the discriminatory proteins belong to the class I acute phase
proteins; e.g. alpha 1 inhibitor 3, fibrinogen, plasminogen, ceruloplasmin,
hemopexin, haptoglobin, alpha 2 macroglobulin, alpha 1 antiproteinase, alpha 1
acid glycoprotein and the components of the complement system. These proteins
are activated during inflammation (32-34), and up regulation of these proteins
reflects the inflammatory processes that are ongoing in the EAE model as well as
in MScl. Only a few of these proteins (haptoglobin, hemopexin and alpha 1 acid
glycoprotein) were discriminatory in both the QTOF and the Orbitrap analysis
when the inflammatory controls (C and D) where compared to the healthy
controls (A and B). This shows that that the elevation of most of the proteins is not
just due to a general inflammatory response to complete Freund’s adjuvant.
Complement C3, involved in the activation of the complement system has been
connected to both EAE and MScl in previous studies (20, 35-37), complement C1
has been discovered as discriminatory in the sense of PTM polymorphisms
between EAE rats and controls (10). In this study Complement C3 were
significantly increased in CSF from EAE rats in both the Orbitrap analysis and the
QTOF analysis. Complement C1 was detected in the Orbitrap analysis only and
was significantly increased in group Ehigh compared to group A. Alpha 1 inhibitor
3 is a protease inhibitor that was also found increased in the EAE model before
(20) supporting our results. T-kininogen is another protein that is involved in
inflammatory cascades and an important mediator of the inflammatory response
(38). Earlier published data have shown that an elevated level of the kinin B1
receptor correlates with increased disease severity in MScl patients (39).
Hemopexin and haptoglobin are heme-binding proteins, which have the ability to
effectively inhibit the toxic effect of free heme by forming complexes (40), Heme is
an iron containing porphyrin that exerts toxic effects on cells, DNA and organelles
through the formation of reactive oxygen species (ROS). ROS are involved in the
pathogenesis of several vascular diseases (41) and there are indications that ROS
are involved in neurodegeneration and BBB disruption, which contribute to the

Chapter 4
111
formation and persistence of lesions in MScl (40, 42, 43). Oxidative stress has also
been connected to neurodegeneration and apoptosis in the EAE model. We found
both hemopexin and haptoglobin at elevated levels in CSF of EAE compared to
control. Hemopexin was also detected at elevated levels in spinal cord of EAE rats
(20) and have been connected to MScl in earlier studies (44, 45). This connection
between heme toxicity and MScl/EAE indicates that the increased levels of heme-
binding proteins in our study could be related to the pathogenesis of EAE and
ultimately MScl. Ceruloplamin is another protein involved in iron metabolism,
this protein was also elevated in EAE compared to control in this study and the
same behavior was observed in two earlier EAE studies (13, 20), also in MScl this
protein has been found at elevated levels (46).
It is interesting to note that lysozyme C1 is strongly increased at the full-
scale EAE (group F) (see Figure 6B). The primary role of lysozymes is to offer
protection against bacterial infections through specific cleavage of the bacterial
peptidoglycan cell wall (47). Previous studies revealed increased lysozyme levels
in patients with MScl and other neurological disorders (48, 49) as well as in
rheumatoid arthritis, another autoimmune disease (50). In EAE lysozyme C2 has
been found at increased levels in the spinal cord of EAE rats compared to control
(20). An increase in lysozyme C1 may be due to the presence of mycobacteria in
complete Freund’s adjuvant but it is again noteworthy that the increase in CSF is
not observed in the inflammatory control groups.
CSF of MScl patients is normally screened for an increase in
immunoglobulin G (IgG) as well as for the presence of IgG bands upon isoelectric
focusing (2). In agreement with this, we found that a number of immunoglobulins
were elevated in CSF of EAE rats relative to inflammatory controls (see Table 3)
IgG’s have also been detected at elevated levels in EAE compared to control in two
previous studies (8, 20). A recent study into sequencing the complementarity
determining regions (CDRs) of immunoglobulins opens new possibilities to study
the antibody repertoire in more detail with ramifications for MScl and other
autoimmune diseases (51, 52).
Another interesting protein that was found at elevated level is vitamin D
binding protein. This protein has not been described as discriminatory in other
EAE studies but elevated levels of this protein have previously been shown in CSF
from patients with secondary progressive MScl compared to controls and patients
with relapsing-remitting MScl (53) as well as in blood samples from pediatric MScl
patients (45). Vitamin D is involved in the calcium homeostasis (54) and deficiency
of this vitamin is one of the theories that is advanced in conjunction with the
development of MScl (55); there are evidences that connect a reduced vitamin D
level to MScl (56, 57). Another protein involved in the calcium homeostasis is the
alpha 2 HS glycoprotein (also known as fetuin A) (58). This protein was found
Proteome profiling in a rat EAE model
112
elevated in EAE both in this study and a previous one (20) and has been found
both at elevated and reduced levels connected to MScl (53, 59).
A recent study from our laboratories shows that some proteins in CSF
show a very high biological variability, for example, haptoglobin, indicating that
they are not well suited as disease-related biomarkers. The vitamin D binding
protein on the contrary show low biological variation between healthy human
subjects and therefore serves as a better biomarker candidate (60).
This interlaboratory study of CSF from an animal model of certain aspects
of MScl, the rat EAE model, resulted in identification of a set of 41 proteins that
discriminate EAE rats from control groups. To our knowledge, this is the first
study of its kind focusing on rat CSF from the EAE model.
Part of the proteins detected in this study has been connected to EAE in
previous studies supporting our data. However, our study revealed 28 additional
proteins to be discriminatory between EAE and control (Table 3, highlighted). The
fact that many of the proteins have also been connected to MScl before shows that
it is possible to translate findings from the animal model to the human situation
and that our findings may have a clinical interest in form of early disease
biomarkers. In summary, we show a range of proteins that merit further study in
the context of MScl (early diagnosis, prognosis, response to therapy). We are
currently pursuing work focusing on analyzing these proteins in CSF in response
to drug treatment in the EAE rat model.
Acknowledgements
This study was performed within the framework of Top Institute Pharma project
D4-102. The work was also supported by the project BioRange 2.2.3 from the
Netherlands Proteomics, The Netherlands Bioinformatics Center and Dutch
Multiple Sclerosis Foundation. We thank Balaji Srinivasan (University of
Groningen) for preparation of the CSF samples.
Chapter 4
113
Reference List
1. Compston, A., and Coles, A. (2008) Multiple sclerosis. Lancet 372, 1502-1517
2. McDonald, W. I., Compston, A., Edan, G., Goodkin, D., Hartung, H. P., Lublin, F. D., McFarland, H.
F., Paty, D. W., Polman, C. H., Reingold, S. C., Sandberg-Wollheim, M., Sibley, W., Thompson, A., van
den, N. S., Weinshenker, B. Y., and Wolinsky, J. S. (2001) Recommended diagnostic criteria for
multiple sclerosis: guidelines from the International Panel on the diagnosis of multiple sclerosis. Ann.
Neurol 50, 121-127
3. Polman, C. H., Reingold, S. C., Edan, G., Filippi, M., Hartung, H. P., Kappos, L., Lublin, F. D., Metz, L.
M., McFarland, H. F., O'Connor, P. W., Sandberg-Wollheim, M., Thompson, A. J., Weinshenker, B. G.,
and Wolinsky, J. S. (2005) Diagnostic criteria for multiple sclerosis: 2005 revisions to the "McDonald
Criteria". Ann. Neurol 58, 840-846
4. Herz, J., Zipp, F., and Siffrin, V. (2009) Neurodegeneration in autoimmune CNS inflammation. Exp.
Neurol
5. Soulika, A. M., Lee, E., McCauley, E., Miers, L., Bannerman, P., and Pleasure, D. (2009) Initiation and
progression of axonopathy in experimental autoimmune encephalomyelitis. J Neurosci. 29, 14965-
14979
6. Vogt, J., Paul, F., Aktas, O., Muller-Wielsch, K., Dorr, J., Dorr, S., Bharathi, B. S., Glumm, R., Schmitz,
C., Steinbusch, H., Raine, C. S., Tsokos, M., Nitsch, R., and Zipp, F. (2009) Lower motor neuron loss in
multiple sclerosis and experimental autoimmune encephalomyelitis. Ann. Neurol 66, 310-322
7. Trapp, B. D., Peterson, J., Ransohoff, R. M., Rudick, R., Mork, S., and Bo, L. (1998) Axonal transection
in the lesions of multiple sclerosis. N. Engl. J Med 338, 278-285
8. Villarroya, H., Violleau, K., Ben Younes-Chennoufi, A., and Baumann, N. (1996) Myelin-induced
experimental allergic encephalomyelitis in Lewis rats: tumor necrosis factor alpha levels in serum and
cerebrospinal fluid immunohistochemical expression in glial cells and macrophages of optic nerve
and spinal cord. J Neuroimmunol. 64, 55-61
9. El Behi M., Zephir, H., Lefranc, D., Dutoit, V., Dussart, P., Devos, P., Dessaint, J. P., Vermersch, P., and
Prin, L. (2007) Changes in self-reactive IgG antibody repertoire after treatment of experimental
autoimmune encephalomyelitis with anti-allergic drugs. J Neuroimmunol. 182, 80-88
10. Grant, J. E., Hu, J., Liu, T., Jain, M. R., Elkabes, S., and Li, H. (2007) Post-translational modifications in
the rat lumbar spinal cord in experimental autoimmune encephalomyelitis. J Proteome. Res. 6, 2786-
2791
11. Kidd, B. A., Ho, P. P., Sharpe, O., Zhao, X., Tomooka, B. H., Kanter, J. L., Steinman, L., and Robinson,
W. H. (2008) Epitope spreading to citrullinated antigens in mouse models of autoimmune arthritis
and demyelination. Arthritis Res. Ther. 10, R119
12. Mikkat, S., Lorenz, P., Scharf, C., Yu, X., Glocker, M. O., and Ibrahim, S. M. (2010) MS characterization
of qualitative protein polymorphisms in the spinal cords of inbred mouse strains. Proteomics 10, 1050-
1062
13. Morgan, L., Shah, B., Rivers, L. E., Barden, L., Groom, A. J., Chung, R., Higazi, D., Desmond, H.,
Smith, T., and Staddon, J. M. (2007) Inflammation and dephosphorylation of the tight junction protein
occludin in an experimental model of multiple sclerosis. Neuroscience 147, 664-673
Proteome profiling in a rat EAE model
114
14. Ohgoh, M., Hanada, T., Smith, T., Hashimoto, T., Ueno, M., Yamanishi, Y., Watanabe, M., and
Nishizawa, Y. (2002) Altered expression of glutamate transporters in experimental autoimmune
encephalomyelitis. J Neuroimmunol. 125, 170-178
15. Qi, X., Lewin, A. S., Sun, L., Hauswirth, W. W., and Guy, J. (2006) Mitochondrial protein nitration
primes neurodegeneration in experimental autoimmune encephalomyelitis. J Biol. Chem. 281, 31950-
31962
16. Stegbauer, J., Lee, D. H., Seubert, S., Ellrichmann, G., Manzel, A., Kvakan, H., Muller, D. N., Gaupp,
S., Rump, L. C., Gold, R., and Linker, R. A. (2009) Role of the renin-angiotensin system in autoimmune
inflammation of the central nervous system. Proc. Natl. Acad. Sci. U. S. A 106, 14942-14947
17. Alt, C., Duvefelt, K., Franzen, B., Yang, Y., and Engelhardt, B. (2005) Gene and protein expression
profiling of the microvascular compartment in experimental autoimmune encephalomyelitis in
C57Bl/6 and SJL mice. Brain Pathol. 15, 1-16
18. Jain, M. R., Bian, S., Liu, T., Hu, J., Elkabes, S., and Li, H. (2009) Altered proteolytic events in
experimental autoimmune encephalomyelitis discovered by iTRAQ shotgun proteomics analysis of
spinal cord. Proteome. Sci. 7, 25
19. Linker, R. A., Brechlin, P., Jesse, S., Steinacker, P., Lee, D. H., Asif, A. R., Jahn, O., Tumani, H., Gold,
R., and Otto, M. (2009) Proteome profiling in murine models of multiple sclerosis: identification of
stage specific markers and culprits for tissue damage. PLoS. One. 4, e7624
20. Liu, T., Donahue, K. C., Hu, J., Kurnellas, M. P., Grant, J. E., Li, H., and Elkabes, S. (2007) Identification
of differentially expressed proteins in experimental autoimmune encephalomyelitis (EAE) by
proteomic analysis of the spinal cord. J Proteome. Res. 6, 2565-2575
21. Tumani, H., Hartung, H. P., Hemmer, B., Teunissen, C., Deisenhammer, F., Giovannoni, G., and Zettl,
U. K. (2009) Cerebrospinal fluid biomarkers in multiple sclerosis. Neurobiol. Dis. 35, 117-127
22. Giovannoni, G. (2006) Multiple sclerosis cerebrospinal fluid biomarkers. Dis. Markers 22, 187-196
23. Liu, L., and Duff, K. (2010) A Technique for Serial Collection of Cerebrospinal Fluid from the Cisterna
Magna in Mouse, In: Journal of Visualized Experiments
24. Rosenling, T., Slim, C. L., Christin, C., Coulier, L., Shi, S., Stoop, M. P., Bosman, J., Suits, F.,
Horvatovich, P. L., Stockhofe-Zurwieden, N., Vreeken, R., Hankemeier, T., van Gool, A. J., Luider, T.
M., and Bischoff, R. (2009) The effect of preanalytical factors on stability of the proteome and selected
metabolites in cerebrospinal fluid (CSF). J Proteome. Res. 8, 5511-5522
25. Suits, F., Lepre, J., Du, P., Bischoff, R., and Horvatovich, P. (2008) Two-dimensional method for time
aligning liquid chromatography-mass spectrometry data. Anal. Chem. 80, 3095-3104
26. Tibshirani, R., Hastie, T., Narasimhan, B., and Chu, G. (2002) Diagnosis of multiple cancer types by
shrunken centroids of gene expression. Proc. Natl. Acad. Sci. U. S. A 99, 6567-6572
27. Kessner, D., Chambers, M., Burke, R., Agus, D., and Mallick, P. (2008) ProteoWizard: open source
software for rapid proteomics tools development. Bioinformatics. 24, 2534-2536
28. Olsen, J. V., de Godoy, L. M., Li, G., Macek, B., Mortensen, P., Pesch, R., Makarov, A., Lange, O.,
Horning, S., and Mann, M. (2005) Parts per million mass accuracy on an Orbitrap mass spectrometer
via lock mass injection into a C-trap. Mol. Cell Proteomics 4, 2010-2021
29. (2010) In:
Chapter 4
115
30. Smit, S., van Breemen, M. J., Hoefsloot, H. C., Smilde, A. K., Aerts, J. M., and de Koster, C. G. (2007)
Assessing the statistical validity of proteomics based biomarkers. Anal. Chim. Acta 592, 210-217
31. Smit, S., Hoefsloot, H. C., and Smilde, A. K. (2008) Statistical data processing in clinical proteomics. J
Chromatogr. B Analyt. Technol. Biomed. Life Sci. 866, 77-88
32. Tolosano, E., and Altruda, F. (2002) Hemopexin: structure, function, and regulation. DNA Cell Biol. 21,
297-306
33. Poli, V. (1998) The role of C/EBP isoforms in the control of inflammatory and native immunity
functions. J Biol. Chem. 273, 29279-29282
34. Bjork, P., Gudmundsson, T., and Ohlsson, K. (1994) Acute phase protein response and
polymorphonuclear leukocyte cathepsin g release after slow interleukin-1 stimulation in the rat.
Mediators. Inflamm. 3, 425-431
35. Barnett, M. H., Parratt, J. D., Cho, E. S., and Prineas, J. W. (2009) Immunoglobulins and complement in
postmortem multiple sclerosis tissue. Ann. Neurol 65, 32-46
36. Hedegaard, C. J., Chen, N., Sellebjerg, F., Sorensen, P. S., Leslie, R. G., Bendtzen, K., and Nielsen, C. H.
(2009) Autoantibodies to myelin basic protein (MBP) in healthy individuals and in patients with
multiple sclerosis: a role in regulating cytokine responses to MBP. Immunology 128, e451-e461
37. Stoop, M. P., Dekker, L. J., Titulaer, M. K., Burgers, P. C., Sillevis Smitt, P. A., Luider, T. M., and
Hintzen, R. Q. (2008) Multiple sclerosis-related proteins identified in cerebrospinal fluid by advanced
mass spectrometry. Proteomics 8, 1576-1585
38. McLean, P. G., Perretti, M., and Ahluwalia, A. (2000) Kinin B(1) receptors and the cardiovascular
system: regulation of expression and function. Cardiovasc. Res. 48, 194-210
39. Prat, A., Biernacki, K., Saroli, T., Orav, J. E., Guttmann, C. R., Weiner, H. L., Khoury, S. J., and Antel, J.
P. (2005) Kinin B1 receptor expression on multiple sclerosis mononuclear cells: correlation with
magnetic resonance imaging T2-weighted lesion volume and clinical disability. Arch Neurol 62, 795-
800
40. Schreibelt, G., Kooij, G., Reijerkerk, A., van, D. R., Gringhuis, S. I., van der, P. S., Weksler, B. B.,
Romero, I. A., Couraud, P. O., Piontek, J., Blasig, I. E., Dijkstra, C. D., Ronken, E., and de Vries, H. E.
(2007) Reactive oxygen species alter brain endothelial tight junction dynamics via RhoA, PI3 kinase,
and PKB signaling. FASEB J 21, 3666-3676
41. Kumar, S., and Bandyopadhyay, U. (2005) Free heme toxicity and its detoxification systems in human.
Toxicol. Lett. 157, 175-188
42. Gonsette, R. E. (2008) Oxidative stress and excitotoxicity: a therapeutic issue in multiple sclerosis?
Mult. Scler. 14, 22-34
43. Gonsette, R. E. (2008) Neurodegeneration in multiple sclerosis: the role of oxidative stress and
excitotoxicity. J Neurol Sci. 274, 48-53
44. Hammack, B. N., Fung, K. Y., Hunsucker, S. W., Duncan, M. W., Burgoon, M. P., Owens, G. P., and
Gilden, D. H. (2004) Proteomic analysis of multiple sclerosis cerebrospinal fluid. Mult. Scler. 10, 245-
260
45. Rithidech, K. N., Honikel, L., Milazzo, M., Madigan, D., Troxell, R., and Krupp, L. B. (2009) Protein
expression profiles in pediatric multiple sclerosis: potential biomarkers. Mult. Scler. 15, 455-464
Proteome profiling in a rat EAE model
116
46. Hunter, M. I., Nlemadim, B. C., and Davidson, D. L. (1985) Lipid peroxidation products and
antioxidant proteins in plasma and cerebrospinal fluid from multiple sclerosis patients. Neurochem.
Res. 10, 1645-1652
47. Van Herreweghe, J. M., Vanderkelen, L., Callewaert, L., Aertsen, A., Compernolle, G., Declerck, P. J.,
and Michiels, C. W. (2010) Lysozyme inhibitor conferring bacterial tolerance to invertebrate type
lysozyme. Cell Mol. Life Sci.
48. Firth, G., Rees, J., and McKeran, R. O. (1985) The value of the measurement of cerebrospinal fluid
levels of lysozyme in the diagnosis of neurological disease. J Neurol Neurosurg. Psychiatry 48, 709-712
49. Hansen, N. E., Karle, H., Jensen, A., and Bock, E. (1977) Lysozyme activity in cerebrospinal fluid.
Studies in inflammatory and non-inflammatory CNS disorders. Acta Neurol Scand. 55, 418-424
50. Torsteinsdottir, I., Hakansson, L., Hallgren, R., Gudbjornsson, B., Arvidson, N. G., and Venge, P.
(1999) Serum lysozyme: a potential marker of monocyte/macrophage activity in rheumatoid arthritis.
Rheumatology. (Oxford) 38, 1249-1254
51. Obermeier, B., Mentele, R., Malotka, J., Kellermann, J., Kumpfel, T., Wekerle, H., Lottspeich, F.,
Hohlfeld, R., and Dornmair, K. (2008) Matching of oligoclonal immunoglobulin transcriptomes and
proteomes of cerebrospinal fluid in multiple sclerosis. Nat. Med 14, 688-693
52. de Costa D., Broodman, I., Vanduijn, M. M., Stingl, C., Dekker, L. J., Burgers, P. C., Hoogsteden, H. C.,
Sillevis Smitt, P. A., van Klaveren, R. J., and Luider, T. M. (2010) Sequencing and quantifying IgG
fragments and antigen-binding regions by mass spectrometry. J Proteome. Res. 9, 2937-2945
53. Ottervald, J., Franzen, B., Nilsson, K., Andersson, L. I., Khademi, M., Eriksson, B., Kjellstrom, S.,
Marko-Varga, G., Vegvari, A., Harris, R. A., Laurell, T., Miliotis, T., Matusevicius, D., Salter, H., Ferm,
M., and Olsson, T. (2010) Multiple sclerosis: Identification and clinical evaluation of novel CSF
biomarkers. J Proteomics
54. Huotari, A., and Herzig, K. H. (2008) Vitamin D and living in northern latitudes--an endemic risk area
for vitamin D deficiency. Int. J Circumpolar. Health 67, 164-178
55. Ascherio, A., Munger, K. L., and Simon, K. C. (2010) Vitamin D and multiple sclerosis. Lancet Neurol 9,
599-612
56. Correale, J., Ysrraelit, M. C., and Gaitan, M. I. (2009) Immunomodulatory effects of Vitamin D in
multiple sclerosis. Brain 132, 1146-1160
57. Smolders, J., Menheere, P., Kessels, A., Damoiseaux, J., and Hupperts, R. (2008) Association of vitamin
D metabolite levels with relapse rate and disability in multiple sclerosis. Mult. Scler. 14, 1220-1224
58. Schafer, C., Heiss, A., Schwarz, A., Westenfeld, R., Ketteler, M., Floege, J., Muller-Esterl, W., Schinke,
T., and Jahnen-Dechent, W. (2003) The serum protein alpha 2-Heremans-Schmid glycoprotein/fetuin-
A is a systemically acting inhibitor of ectopic calcification. J Clin. Invest 112, 357-366
59. Tumani, H., Lehmensiek, V., Rau, D., Guttmann, I., Tauscher, G., Mogel, H., Palm, C., Hirt, V.,
Suessmuth, S. D., Sapunova-Meier, I., Ludolph, A. C., and Brettschneider, J. (2009) CSF proteome
analysis in clinically isolated syndrome (CIS): candidate markers for conversion to definite multiple
sclerosis. Neurosci. Lett. 452, 214-217
60. Stoop, M. P., Coulier, L., Rosenling, T., Shi, S., Smolinska, A. M., Buydens, L., Ampt, K., Stingl, C.,
Dane, A., Muilwijk, B., Luitwieler, R. L., Sillevis Smitt, P. A., Hintzen, R. Q., Bischoff, R., Wijmenga, S.

Chapter 4
117
S., Hankemeier, T., van Gool, A. J., and Luider, T. M. (2010) Quantitative proteomics and
metabolomics analysis of normal human cerebrospinal fluid samples. Mol. Cell Proteomics

118
Chapter 5
119
The effect of minocycline on the proteome
profile of cerebrospinal fluid from an acute
animal model of multiple sclerosis.
Therese Rosenling1, Amos Attali2, Tinka Tuinstra2, Theo Luider3, Rainer
Bischoff1
1Department of Analytical Biochemistry, Centre for Pharmacy,
University of Groningen, Groningen, The Netherlands
2 Abbott Healthcare Products B.V., Weesp, the Netherlands
3 Department of Neurology, Erasmus University Medical Center,
Rotterdam, The Netherlands
Manuscript in preparation
The effect of minocycline on the proteome of a rat EAE model
120
Abstract
The experimental autoimmune encephalomyelitis (EAE) is an induced disorder of
the central nervous system (CNS) in animals used to model the human CNS
disorder multiple sclerosis (MScl). Minocycline, a tetracycline antibiotic, has
exhibited a modulatory effect of disease symptoms as well as an inhibitory effect
of MMP activity and production in EAE mice. In MScl patients, minoclycline was
shown to reduce the numbers of lesions detected by MRI.
In an earlier study performed by this group, an acute EAE rat model was
used for the screening of disease related proteomic biomarkers in cerebrospinal
fluid (CSF). By the combination of two different bottom-up mass spectrometry
based proteomic platforms (Orbitrap LC-MS and chipLC-QTOF MS) in two
independent laboratories a set of 41 discriminatory proteins were discovered to be
highly discriminatory between the EAE animals compared to healthy and
inflammatory control groups. Among these proteins 18 were detected as
discriminatory on the chipLC-QTOF MS system. In the present study described
here the intention was to elucidate the effect of minocycline treatment on the level
of the earlier discovered discriminatory proteins.
EAE was induced in 60 rats by intraperitoneal injection of myelin basic
protein (MBP) together with complete Freund’s adjuvant (CFA); half of the
animals were treated with minocycline and the other half was treated with
vehicle. CSF was collected from 30 of the rats at day 10 after induction and from
the other 30 rats CSF was collected at day 14 after induction. As control 60 rats
were kept that were injected with CFA only and treated in the same way as the
rats with induced EAE (half of them treated with minocycline, CSF collected at
day 10 and day 14). The pattern of increasing protein levels in EAE compared to
control was significantly decreased in animals treated with minocycline for 8 of
the studied proteins (alpha 1 inhibitor 3, alpha 2 HS glycoprotein (Fetuin A),
complement C3, haptoglobin, IgG 2A chain C, lysozyme C1, murinoglobulin 1,
serine protease inhibitor A3N and T-kininogen 1). Further, an effect of
minocycline on the protein level in control animals was recorded.
Chapter 5
121
1. Introduction
Multiple sclerosis (MScl), a disorder of the central nervous system (CNS), is
characterized by inflammation, demyleination and neurodegeneration that
commonly lead to e.g. motor dysfunctions, visual and sensory impairments
usually with a relapsing-remitting pattern that accumulates over time (1).
Experimental autoimmune encephalomyelitis (EAE) induced in rodents is an
animal model induced for the study of disease processes related to MScl. Different
pathological patterns are seen in MScl and the disease is classified according to the
disease development in; relapsing-remitting (RR), primary progressive (PP) and
secondary progressive (SP) forms (1). The EAE model demonstrates either a
chronic, relapsing-remitting or an acute disease progression depending on what
animal strain and inducing agent is used to evoke the disease in the model (2-6).
Minocycline is an antibiotic that belongs to the tetracycline derivates. The
molecule has lipophilic characteristics and therefore easily cross the blood-brain
barrier and can thus be used to target the central nervous system. Minocycline has
shown protection against neuroinflammation and cell death in animal models of
central nervous system trauma and various neurological disorders (7). In a mouse
EAE model a delay or reduction of disease progression, a reduced production of
MMP-9 and transmigration of T-lymphocytes was observed (8). Another study on
the EAE model revealed that the combination of glatiramer acetate and
minocycline resulted in a reduction of inflammation, axonal loss and
demyelination. In the same study a decreased level of IF-γ and an increased level
of IL-5 were recorded (9). Also in human subjects the treatment with glatiramer
acetate in combination with minocycline was proven to give a lower risk of relapse
and that minocycline alone reduce number of lesions (10, 11). There are evidences
that the neuroprotective effects of minocycline may be exerted by an effect on
proinflammatory cytokines like TNF-α and IL-β. Minocycline has also shown
effect on other inflammatory mediators as chemokines, reactive oxygen species
(ROS) and nitric oxide (NO) (7).
We have in a previous study screened CSF from an acute EAE model in rat
in order to discriminate proteomic biomarkers that can be connected to the
disease. By the combination of two different mass spectrometry based proteomics
methods (Orbitrap LC-MS and chipLC QTOF MS) we detected 41 proteins that
were highly significantly increasing in CSF of EAE rats compared to control
groups, 18 of the discriminatory proteins were detected by the QTOF platform. In
the present study we have induced acute EAE in rats that were treated with
minocycline or vehicle. The aim was to study the effect of minocycline on the
previously detected proteome biomarker candidates in terms of quantitative
differences between rats treated or not treated with minocycle applying the same
chipLC-QTOF MS platform as earlier.
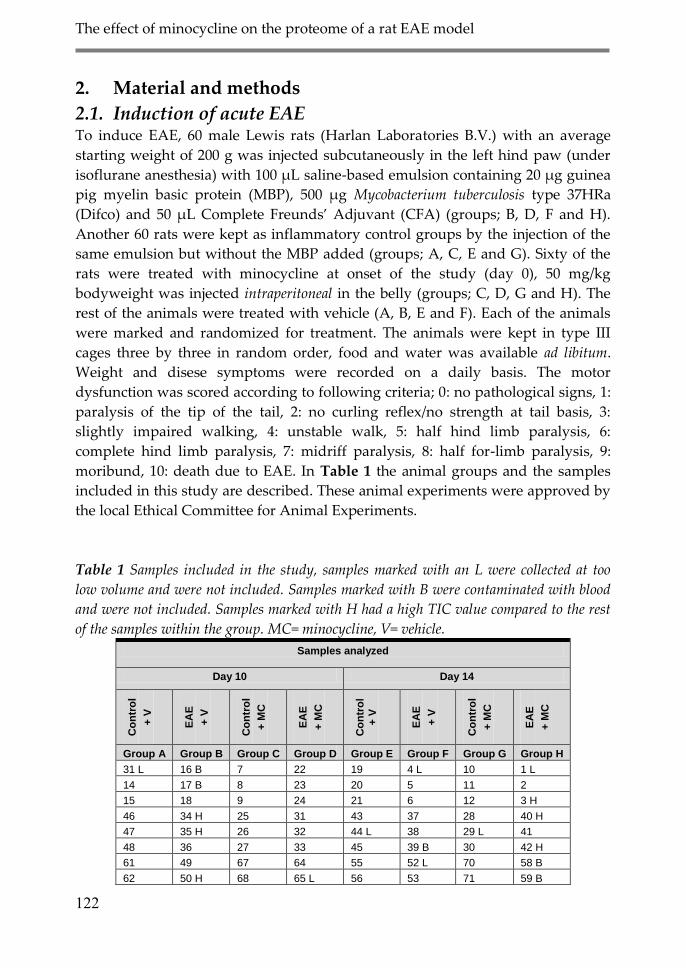
The effect of minocycline on the proteome of a rat EAE model
122
2. Material and methods
2.1. Induction of acute EAE To induce EAE, 60 male Lewis rats (Harlan Laboratories B.V.) with an average
starting weight of 200 g was injected subcutaneously in the left hind paw (under
isoflurane anesthesia) with 100 μL saline-based emulsion containing 20 μg guinea
pig myelin basic protein (MBP), 500 μg Mycobacterium tuberculosis type 37HRa
(Difco) and 50 μL Complete Freunds’ Adjuvant (CFA) (groups; B, D, F and H).
Another 60 rats were kept as inflammatory control groups by the injection of the
same emulsion but without the MBP added (groups; A, C, E and G). Sixty of the
rats were treated with minocycline at onset of the study (day 0), 50 mg/kg
bodyweight was injected intraperitoneal in the belly (groups; C, D, G and H). The
rest of the animals were treated with vehicle (A, B, E and F). Each of the animals
were marked and randomized for treatment. The animals were kept in type III
cages three by three in random order, food and water was available ad libitum.
Weight and disese symptoms were recorded on a daily basis. The motor
dysfunction was scored according to following criteria; 0: no pathological signs, 1:
paralysis of the tip of the tail, 2: no curling reflex/no strength at tail basis, 3:
slightly impaired walking, 4: unstable walk, 5: half hind limb paralysis, 6:
complete hind limb paralysis, 7: midriff paralysis, 8: half for-limb paralysis, 9:
moribund, 10: death due to EAE. In Table 1 the animal groups and the samples
included in this study are described. These animal experiments were approved by
the local Ethical Committee for Animal Experiments.
Table 1 Samples included in the study, samples marked with an L were collected at too
low volume and were not included. Samples marked with B were contaminated with blood
and were not included. Samples marked with H had a high TIC value compared to the rest
of the samples within the group. MC= minocycline, V= vehicle.
Samples analyzed
Day 10 Day 14
Co
ntr
ol
+ V
EA
E
+ V
Co
ntr
ol
+ M
C
EA
E
+ M
C
Co
ntr
ol
+ V
EA
E
+ V
Co
ntr
ol
+ M
C
EA
E
+ M
C
Group A Group B Group C Group D Group E Group F Group G Group H
31 L 16 B 7 22 19 4 L 10 1 L
14 17 B 8 23 20 5 11 2
15 18 9 24 21 6 12 3 H
46 34 H 25 31 43 37 28 40 H
47 35 H 26 32 44 L 38 29 L 41
48 36 27 33 45 39 B 30 42 H
61 49 67 64 55 52 L 70 58 B
62 50 H 68 65 L 56 53 71 59 B
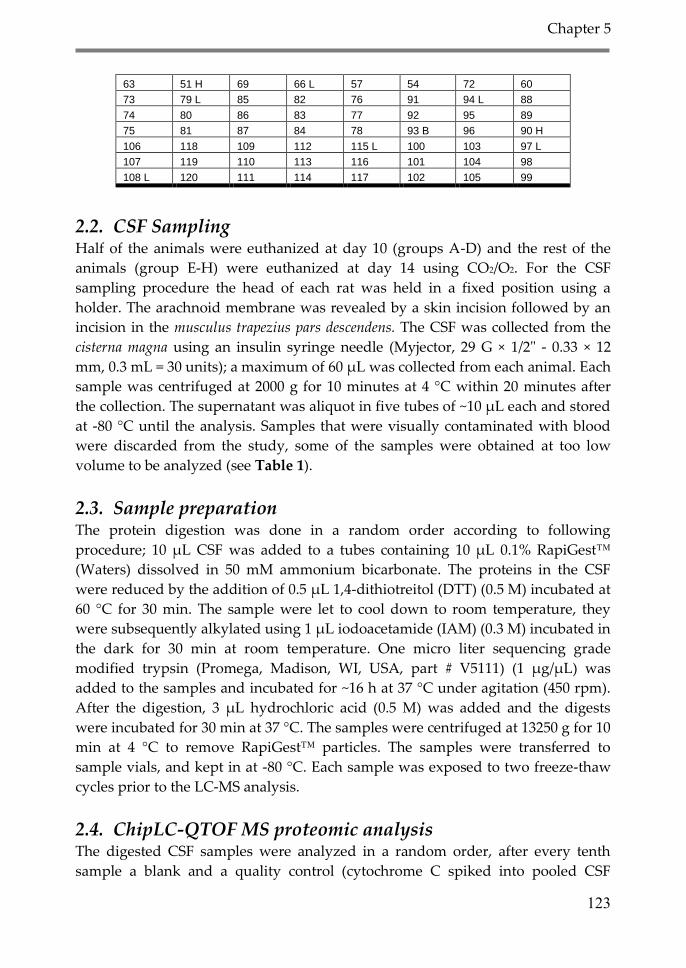
Chapter 5
123
63 51 H 69 66 L 57 54 72 60
73 79 L 85 82 76 91 94 L 88
74 80 86 83 77 92 95 89
75 81 87 84 78 93 B 96 90 H
106 118 109 112 115 L 100 103 97 L
107 119 110 113 116 101 104 98
108 L 120 111 114 117 102 105 99
2.2. CSF Sampling Half of the animals were euthanized at day 10 (groups A-D) and the rest of the
animals (group E-H) were euthanized at day 14 using CO2/O2. For the CSF
sampling procedure the head of each rat was held in a fixed position using a
holder. The arachnoid membrane was revealed by a skin incision followed by an
incision in the musculus trapezius pars descendens. The CSF was collected from the
cisterna magna using an insulin syringe needle (Myjector, 29 G × 1/2" - 0.33 × 12
mm, 0.3 mL = 30 units); a maximum of 60 µL was collected from each animal. Each
sample was centrifuged at 2000 g for 10 minutes at 4 °C within 20 minutes after
the collection. The supernatant was aliquot in five tubes of ~10 µL each and stored
at -80 °C until the analysis. Samples that were visually contaminated with blood
were discarded from the study, some of the samples were obtained at too low
volume to be analyzed (see Table 1).
2.3. Sample preparation The protein digestion was done in a random order according to following
procedure; 10 μL CSF was added to a tubes containing 10 μL 0.1% RapiGest™
(Waters) dissolved in 50 mM ammonium bicarbonate. The proteins in the CSF
were reduced by the addition of 0.5 μL 1,4-dithiotreitol (DTT) (0.5 M) incubated at
60 °C for 30 min. The sample were let to cool down to room temperature, they
were subsequently alkylated using 1 μL iodoacetamide (IAM) (0.3 M) incubated in
the dark for 30 min at room temperature. One micro liter sequencing grade
modified trypsin (Promega, Madison, WI, USA, part # V5111) (1 µg/µL) was
added to the samples and incubated for ~16 h at 37 °C under agitation (450 rpm).
After the digestion, 3 μL hydrochloric acid (0.5 M) was added and the digests
were incubated for 30 min at 37 °C. The samples were centrifuged at 13250 g for 10
min at 4 °C to remove RapiGest™ particles. The samples were transferred to
sample vials, and kept in at -80 °C. Each sample was exposed to two freeze-thaw
cycles prior to the LC-MS analysis.
2.4. ChipLC-QTOF MS proteomic analysis The digested CSF samples were analyzed in a random order, after every tenth
sample a blank and a quality control (cytochrome C spiked into pooled CSF
The effect of minocycline on the proteome of a rat EAE model
124
sample after digestion at 200 fmol/µL) was injected to check the technical quality
of the analysis. Samples from group A, C, D, E and G were injected at a volume of
1 μL and samples from group B, F and H were injected at a volume of 0.2 μL. This
was done to normalize the total ion chromatograms (TIC) of the samples
(approximately five times higher in group B, F and H compared to the rest of the
groups, determined by a pre-analysis of samples from all groups at the same
volume) and thereby avoid overloading the trap column.
The peptide separation was done on a reverse phase LC-chip (Protein ID
chip #3; G4240-63001 SPQ110: Agilent Technologies; separating column: 150 mm ×
75 µm Zorbax 300SB-C18, 5 µm; trap column: 160 nL Zorbax 300SB-C18, 5 µm)
coupled to a nano LC system (Agilent 1200) with a 40 μL injection loop. An
electrospray ionization (ESI) source was used to generate ions. For the detection of
the ions a quadrupole-time-of-flight (QTOF) mass spectrometer (Agilent 6510) was
used. The MassHunter Data Acquisition software was used for the operation
(version B.02.00; Agilent Technologies, Santa Clara, USA). The LC separation was
done by using following eluents; A: ultra-pure water (conductivity 18.2 MΩ,
Sartorius Stedim, Nieuwegein, The Netherlands) with 0.1% formic acid (98-100%,
pro analysis, Merck, Darmstadt, Germany); B: acetonitrile (HPLC-S gradient
grade, Biosolve, Valkenswaard, The Netherlands) with 0.1% formic acid.
The samples were de-salted and enriched on the trap column for 10
minutes at a flow rate of 3 μL/min (3% B). The samples were then transferred to
the separation column at a flow rate of 250 nL/min. For the elution of the peptides,
following gradient was used: 100 min linear gradient from 3 to 50% B; 5 min linear
gradient from 50 to 70% B; 4 min linear gradient from 70 to 3%.
MS analysis was done in the 2 GHz extended dynamic range mode under
the following conditions; mass range: 275-2000 m/z, acquisition rate: 1
spectrum/sec, data storage: profile and centroid mode, fragmentor: 175 V,
skimmer: 65 V, OCT 1 RF Vpp: 750 V, spray voltage: ~1900 V, drying gas temp: 325
ºC, drying gas flow (N2): 6 L/min. Mass correction was done during analysis using
internal standards; m/z: 371.31559 (originating from a ubiquitous background ion
(Dioctyl adipate, DOA, plasticizer) and m/z: 1221.990637 (HP-1221 calibration
standard, evaporating from a wetted wick inside the spray chamber).
To assess the repeatability of the LC-MS analysis the relative standard
deviation (RSD) was calculated for the mass accuracy, retention time and peak
area based on selected cytochrome C peaks in the QC samples. The peaks were
first smoothed (Gaussian function width; 15 points, [15 sec]) and subsequently
integrated; the peak area RSD was within +/- 25%, the retention time deviation
was less than +/- 0.3% (or 5 sec) and the mass accuracy (calculated as the mean of
five measurements from each selected cytochrome C peak), was within +/- 9 ppm
of the theoretical value value.

Chapter 5
125
2.5. QTOF-MS data processing Acquired raw data was processed by the use of Agilent MassHunter Qualitative
Analysis software (Agilent version B.02.00). The files were exported to
MzData.XML format in centroid mode, the files were subsequently converted to
ASCII format and pre-processed using an in-house data processing workflow
developed in C++ (12, 13) producing a common peak matrix of 3883 peaks (based
on selection of 20 000 most intensive peaks from each data file). To visualize the
variability of the data, the raw peak matrix was analyzed by principal component
analysis (PCA) (MatLab R2009a, Mathworks, Natick, MA, USA).
The peak matrix was searched for features matching the mass to charge
ratio (m/z), retention time (RT) and charge state of previously discovered
discriminatory peptides between EAE and control animals. A feature was
considered a match with a Δ m/z value of ± 10 ppm and a RT shift within ± 1 min,
the charge state had to be the same. In Table 2 the proteins from which peptides
were studied are listed. Peak areas were compared in a pair-wise manner between
groups of animals using one-way ANOVA with Bonferroni post hoc test (SPSS
Inc., Chicago, Il, USA). Peak area differences with a p-value below 0.05 were
considered significant, only proteins with the major part of the peptides (at least
60 %) having a p-value below 0.05 in the ANOVA analysis were considered as
discriminatory. At least 2 peptides from each protein had to be detected. Each
discriminatory peptide was visualized by histograms of the average value for that
peptide within each group (Microsoft Excel, Microsoft Corporation, Redmond,
WA, USA).
Table 2. Discriminatory proteins (EAE vs. control) discovered by chipLC QTOF MS in
previous study. Peptides from these proteins were investigate in present study.
Discriminatory proteins discovered in previous study AC #
Afamin P36953
Alpha-1-inhibitor 3 P14046
Alpha-1-macroglobulin Q63041
Alpha-2-HS-glycoprotein (Fetuin A) P24090
Ceruloplasmin P13635
Complement C3 P01026
Fetuin-B Q9QX79
Haptoglobin P06866
Hemopexin P20059
Ig gamma-2A chain C region P20760
Murinoglobulin-1 Q03626
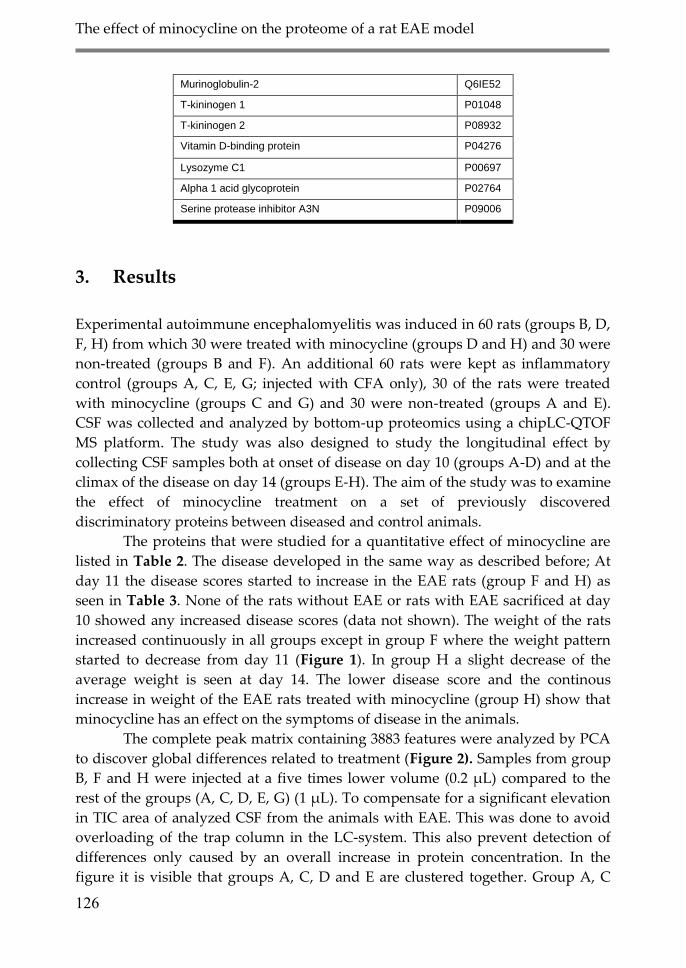
The effect of minocycline on the proteome of a rat EAE model
126
Murinoglobulin-2 Q6IE52
T-kininogen 1 P01048
T-kininogen 2 P08932
Vitamin D-binding protein P04276
Lysozyme C1 P00697
Alpha 1 acid glycoprotein P02764
Serine protease inhibitor A3N P09006
3. Results
Experimental autoimmune encephalomyelitis was induced in 60 rats (groups B, D,
F, H) from which 30 were treated with minocycline (groups D and H) and 30 were
non-treated (groups B and F). An additional 60 rats were kept as inflammatory
control (groups A, C, E, G; injected with CFA only), 30 of the rats were treated
with minocycline (groups C and G) and 30 were non-treated (groups A and E).
CSF was collected and analyzed by bottom-up proteomics using a chipLC-QTOF
MS platform. The study was also designed to study the longitudinal effect by
collecting CSF samples both at onset of disease on day 10 (groups A-D) and at the
climax of the disease on day 14 (groups E-H). The aim of the study was to examine
the effect of minocycline treatment on a set of previously discovered
discriminatory proteins between diseased and control animals.
The proteins that were studied for a quantitative effect of minocycline are
listed in Table 2. The disease developed in the same way as described before; At
day 11 the disease scores started to increase in the EAE rats (group F and H) as
seen in Table 3. None of the rats without EAE or rats with EAE sacrificed at day
10 showed any increased disease scores (data not shown). The weight of the rats
increased continuously in all groups except in group F where the weight pattern
started to decrease from day 11 (Figure 1). In group H a slight decrease of the
average weight is seen at day 14. The lower disease score and the continous
increase in weight of the EAE rats treated with minocycline (group H) show that
minocycline has an effect on the symptoms of disease in the animals.
The complete peak matrix containing 3883 features were analyzed by PCA
to discover global differences related to treatment (Figure 2). Samples from group
B, F and H were injected at a five times lower volume (0.2 µL) compared to the
rest of the groups (A, C, D, E, G) (1 µL). To compensate for a significant elevation
in TIC area of analyzed CSF from the animals with EAE. This was done to avoid
overloading of the trap column in the LC-system. This also prevent detection of
differences only caused by an overall increase in protein concentration. In the
figure it is visible that groups A, C, D and E are clustered together. Group A, C
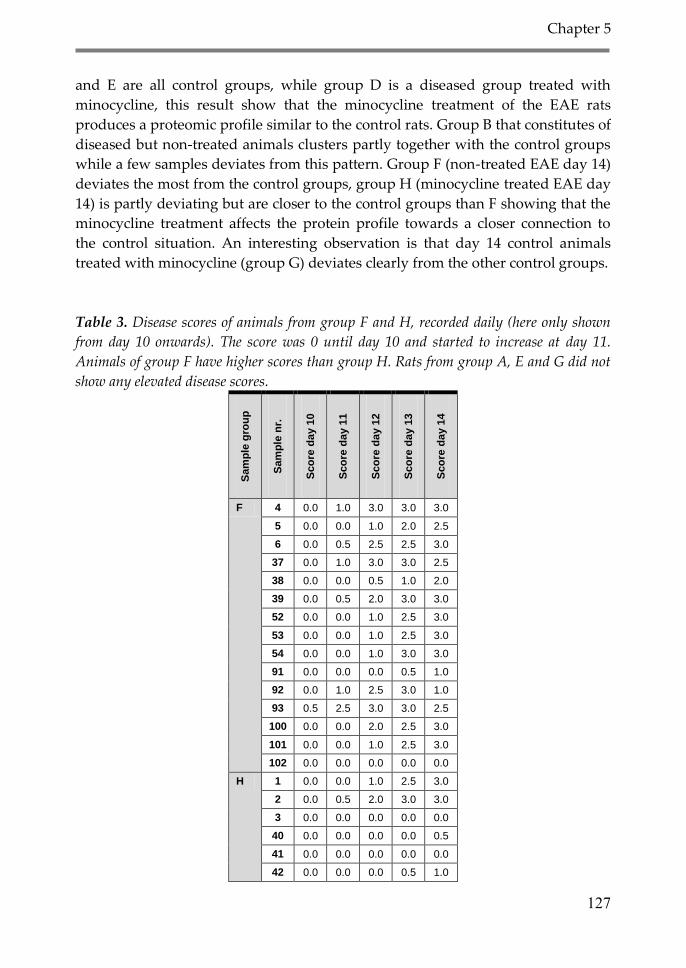
Chapter 5
127
and E are all control groups, while group D is a diseased group treated with
minocycline, this result show that the minocycline treatment of the EAE rats
produces a proteomic profile similar to the control rats. Group B that constitutes of
diseased but non-treated animals clusters partly together with the control groups
while a few samples deviates from this pattern. Group F (non-treated EAE day 14)
deviates the most from the control groups, group H (minocycline treated EAE day
14) is partly deviating but are closer to the control groups than F showing that the
minocycline treatment affects the protein profile towards a closer connection to
the control situation. An interesting observation is that day 14 control animals
treated with minocycline (group G) deviates clearly from the other control groups.
Table 3. Disease scores of animals from group F and H, recorded daily (here only shown
from day 10 onwards). The score was 0 until day 10 and started to increase at day 11.
Animals of group F have higher scores than group H. Rats from group A, E and G did not
show any elevated disease scores.
Sam
ple
gro
up
Sam
ple
nr.
Sco
re d
ay 1
0
Sco
re d
ay 1
1
Sco
re d
ay 1
2
Sco
re d
ay 1
3
Sco
re d
ay 1
4
F 4 0.0 1.0 3.0 3.0 3.0
5 0.0 0.0 1.0 2.0 2.5
6 0.0 0.5 2.5 2.5 3.0
37 0.0 1.0 3.0 3.0 2.5
38 0.0 0.0 0.5 1.0 2.0
39 0.0 0.5 2.0 3.0 3.0
52 0.0 0.0 1.0 2.5 3.0
53 0.0 0.0 1.0 2.5 3.0
54 0.0 0.0 1.0 3.0 3.0
91 0.0 0.0 0.0 0.5 1.0
92 0.0 1.0 2.5 3.0 1.0
93 0.5 2.5 3.0 3.0 2.5
100 0.0 0.0 2.0 2.5 3.0
101 0.0 0.0 1.0 2.5 3.0
102 0.0 0.0 0.0 0.0 0.0
H 1 0.0 0.0 1.0 2.5 3.0
2 0.0 0.5 2.0 3.0 3.0
3 0.0 0.0 0.0 0.0 0.0
40 0.0 0.0 0.0 0.0 0.5
41 0.0 0.0 0.0 0.0 0.0
42 0.0 0.0 0.0 0.5 1.0
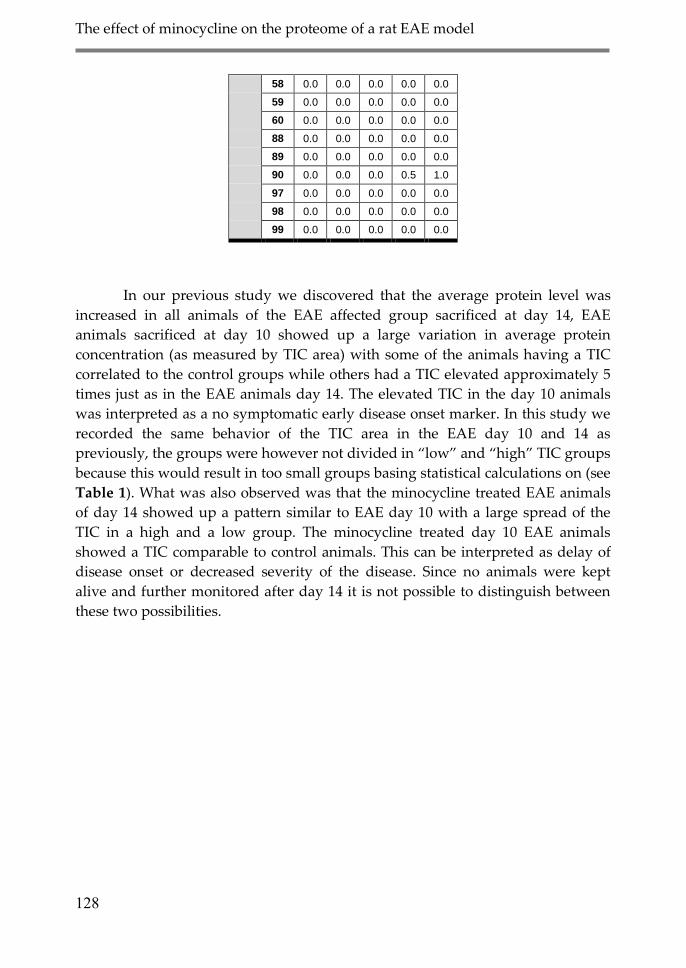
The effect of minocycline on the proteome of a rat EAE model
128
58 0.0 0.0 0.0 0.0 0.0
59 0.0 0.0 0.0 0.0 0.0
60 0.0 0.0 0.0 0.0 0.0
88 0.0 0.0 0.0 0.0 0.0
89 0.0 0.0 0.0 0.0 0.0
90 0.0 0.0 0.0 0.5 1.0
97 0.0 0.0 0.0 0.0 0.0
98 0.0 0.0 0.0 0.0 0.0
99 0.0 0.0 0.0 0.0 0.0
In our previous study we discovered that the average protein level was
increased in all animals of the EAE affected group sacrificed at day 14, EAE
animals sacrificed at day 10 showed up a large variation in average protein
concentration (as measured by TIC area) with some of the animals having a TIC
correlated to the control groups while others had a TIC elevated approximately 5
times just as in the EAE animals day 14. The elevated TIC in the day 10 animals
was interpreted as a no symptomatic early disease onset marker. In this study we
recorded the same behavior of the TIC area in the EAE day 10 and 14 as
previously, the groups were however not divided in ‚low‛ and ‚high‛ TIC groups
because this would result in too small groups basing statistical calculations on (see
Table 1). What was also observed was that the minocycline treated EAE animals
of day 14 showed up a pattern similar to EAE day 10 with a large spread of the
TIC in a high and a low group. The minocycline treated day 10 EAE animals
showed a TIC comparable to control animals. This can be interpreted as delay of
disease onset or decreased severity of the disease. Since no animals were kept
alive and further monitored after day 14 it is not possible to distinguish between
these two possibilities.
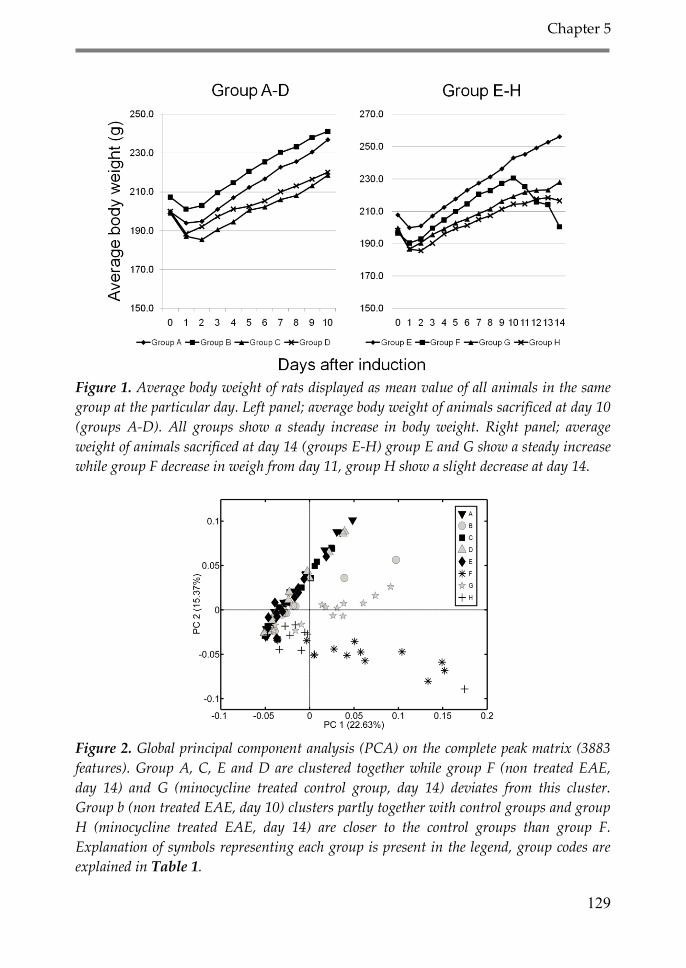
Chapter 5
129
Figure 1. Average body weight of rats displayed as mean value of all animals in the same
group at the particular day. Left panel; average body weight of animals sacrificed at day 10
(groups A-D). All groups show a steady increase in body weight. Right panel; average
weight of animals sacrificed at day 14 (groups E-H) group E and G show a steady increase
while group F decrease in weigh from day 11, group H show a slight decrease at day 14.
Figure 2. Global principal component analysis (PCA) on the complete peak matrix (3883
features). Group A, C, E and D are clustered together while group F (non treated EAE,
day 14) and G (minocycline treated control group, day 14) deviates from this cluster.
Group b (non treated EAE, day 10) clusters partly together with control groups and group
H (minocycline treated EAE, day 14) are closer to the control groups than group F.
Explanation of symbols representing each group is present in the legend, group codes are
explained in Table 1.
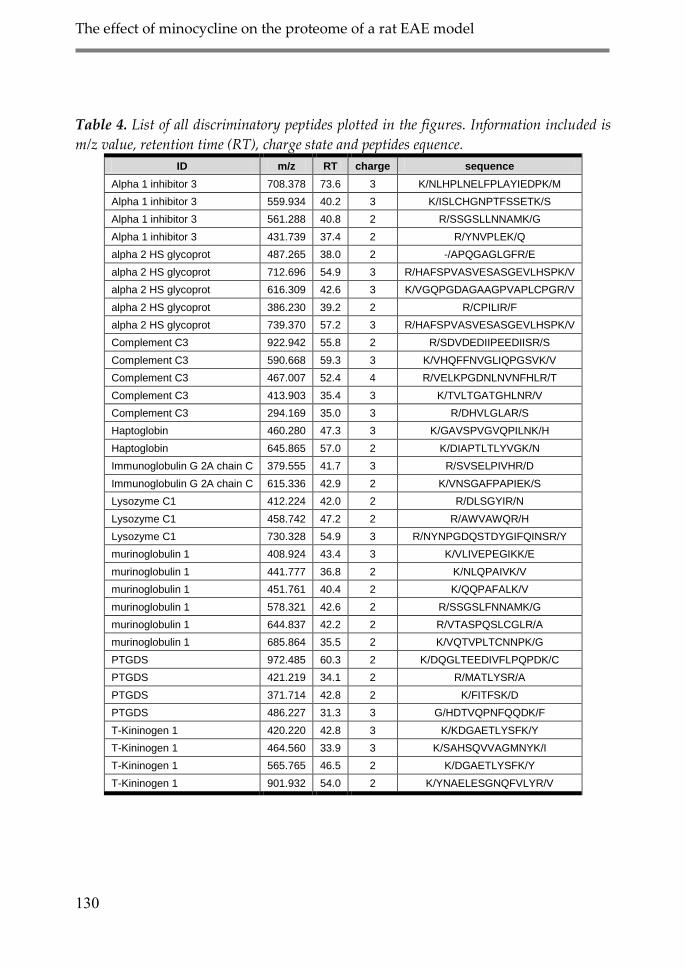
The effect of minocycline on the proteome of a rat EAE model
130
Table 4. List of all discriminatory peptides plotted in the figures. Information included is
m/z value, retention time (RT), charge state and peptides equence.
ID m/z RT charge sequence
Alpha 1 inhibitor 3 708.378 73.6 3 K/NLHPLNELFPLAYIEDPK/M
Alpha 1 inhibitor 3 559.934 40.2 3 K/ISLCHGNPTFSSETK/S
Alpha 1 inhibitor 3 561.288 40.8 2 R/SSGSLLNNAMK/G
Alpha 1 inhibitor 3 431.739 37.4 2 R/YNVPLEK/Q
alpha 2 HS glycoprot 487.265 38.0 2 -/APQGAGLGFR/E
alpha 2 HS glycoprot 712.696 54.9 3 R/HAFSPVASVESASGEVLHSPK/V
alpha 2 HS glycoprot 616.309 42.6 3 K/VGQPGDAGAAGPVAPLCPGR/V
alpha 2 HS glycoprot 386.230 39.2 2 R/CPILIR/F
alpha 2 HS glycoprot 739.370 57.2 3 R/HAFSPVASVESASGEVLHSPK/V
Complement C3 922.942 55.8 2 R/SDVDEDIIPEEDIISR/S
Complement C3 590.668 59.3 3 K/VHQFFNVGLIQPGSVK/V
Complement C3 467.007 52.4 4 R/VELKPGDNLNVNFHLR/T
Complement C3 413.903 35.4 3 K/TVLTGATGHLNR/V
Complement C3 294.169 35.0 3 R/DHVLGLAR/S
Haptoglobin 460.280 47.3 3 K/GAVSPVGVQPILNK/H
Haptoglobin 645.865 57.0 2 K/DIAPTLTLYVGK/N
Immunoglobulin G 2A chain C 379.555 41.7 3 R/SVSELPIVHR/D
Immunoglobulin G 2A chain C 615.336 42.9 2 K/VNSGAFPAPIEK/S
Lysozyme C1 412.224 42.0 2 R/DLSGYIR/N
Lysozyme C1 458.742 47.2 2 R/AWVAWQR/H
Lysozyme C1 730.328 54.9 3 R/NYNPGDQSTDYGIFQINSR/Y
murinoglobulin 1 408.924 43.4 3 K/VLIVEPEGIKK/E
murinoglobulin 1 441.777 36.8 2 K/NLQPAIVK/V
murinoglobulin 1 451.761 40.4 2 K/QQPAFALK/V
murinoglobulin 1 578.321 42.6 2 R/SSGSLFNNAMK/G
murinoglobulin 1 644.837 42.2 2 R/VTASPQSLCGLR/A
murinoglobulin 1 685.864 35.5 2 K/VQTVPLTCNNPK/G
PTGDS 972.485 60.3 2 K/DQGLTEEDIVFLPQPDK/C
PTGDS 421.219 34.1 2 R/MATLYSR/A
PTGDS 371.714 42.8 2 K/FITFSK/D
PTGDS 486.227 31.3 3 G/HDTVQPNFQQDK/F
T-Kininogen 1 420.220 42.8 3 K/KDGAETLYSFK/Y
T-Kininogen 1 464.560 33.9 3 K/SAHSQVVAGMNYK/I
T-Kininogen 1 565.765 46.5 2 K/DGAETLYSFK/Y
T-Kininogen 1 901.932 54.0 2 K/YNAELESGNQFVLYR/V
Chapter 5
131
When studying the quantitative effect of minocycline on the previously
detected 18 discriminatory proteins, 8 of them showed a significant effect of the
minocycline treatment (alpha 1 inhibitor 3 [P14046], alpha 2 HS glycoprotein
[P24090], complement C3 [P01026], haptoglobin [P06866], IgG 2A chain C
[P20760], lysozyme C1 [P00697], murinoglobulin 1 [Q03626] and T-kininogen
1[P01048]). The major part of the peptides from these proteins had a p-value below
0.05 for EAE vs. control (F vs. E) and EAE vs. EAE with minocycline (F vs. H)
when analyzed by one-way ANOVA with Bonferroni post-hoc test. In Figure 3
and 4 the average peak area of the significantly (p < 0.05) discriminatory peptides
in each animal group from the eight proteins can be seen. The general picture is
that the peptide levels are homogenous among group A-E while a clear elevation
is seen in group F. In group G and H the level is decreased compared to group F
either at the same level as group A-E or moderate to strongly elevated compared
to these groups. As can be seen in the global PCA where there is a separation of
group G from the other control groups, some of the peptides are elevated in group
G compared to the control groups. The minocycline seems to have an effect on
control animals at day 14 while this cannot be seen in the animals collected at day
10. In group B (non treated EAE day 10) a slight elevation can be observed in some
of the proteins. In the figures the peptides of the proteins are marked with their
m/z without the decimals included. In Table 4 all discriminatory peptides are
listed with m/z, RT, charge state and peptide sequence.
In Figure 5 the average of 4 prostaglandin D synthase (PTGDS, P22057)
derived peptides are plotted. This protein was not discriminatory in our previous
study and also here it showed a somewhat stable level between EAE and control
animals (p > 0.05), what can be noted is that in our previous study the EAE treated
animals showed a lower peak area of these peptides compared to controls but here
only the day 10 samples show this behavior. Also in this protein the minocycline
show an effect on the control animals at day 14.
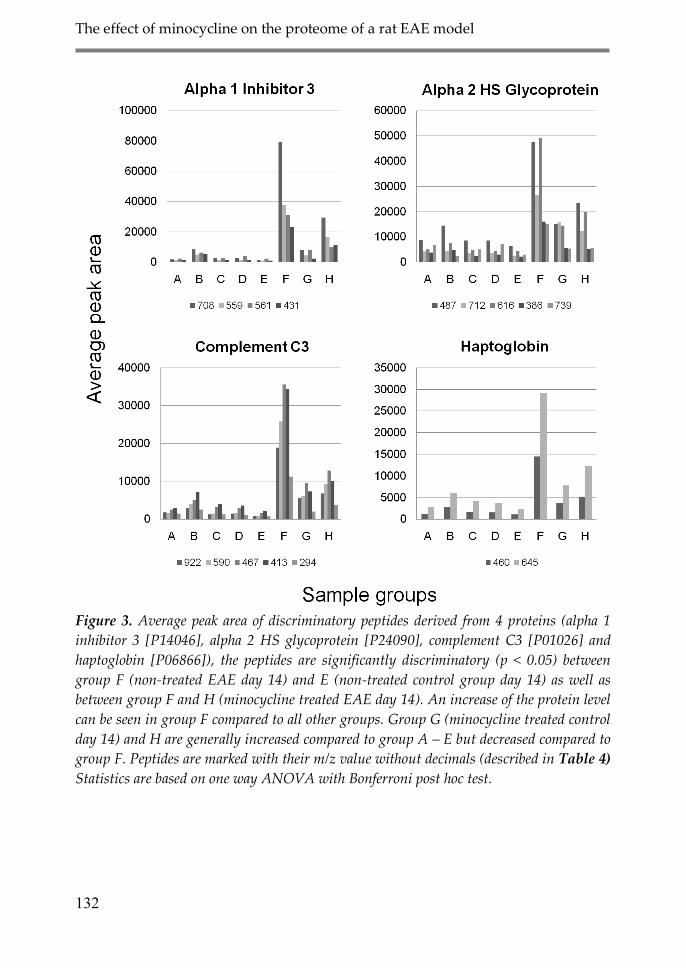
The effect of minocycline on the proteome of a rat EAE model
132
Figure 3. Average peak area of discriminatory peptides derived from 4 proteins (alpha 1
inhibitor 3 [P14046], alpha 2 HS glycoprotein [P24090], complement C3 [P01026] and
haptoglobin [P06866]), the peptides are significantly discriminatory (p < 0.05) between
group F (non-treated EAE day 14) and E (non-treated control group day 14) as well as
between group F and H (minocycline treated EAE day 14). An increase of the protein level
can be seen in group F compared to all other groups. Group G (minocycline treated control
day 14) and H are generally increased compared to group A – E but decreased compared to
group F. Peptides are marked with their m/z value without decimals (described in Table 4)
Statistics are based on one way ANOVA with Bonferroni post hoc test.
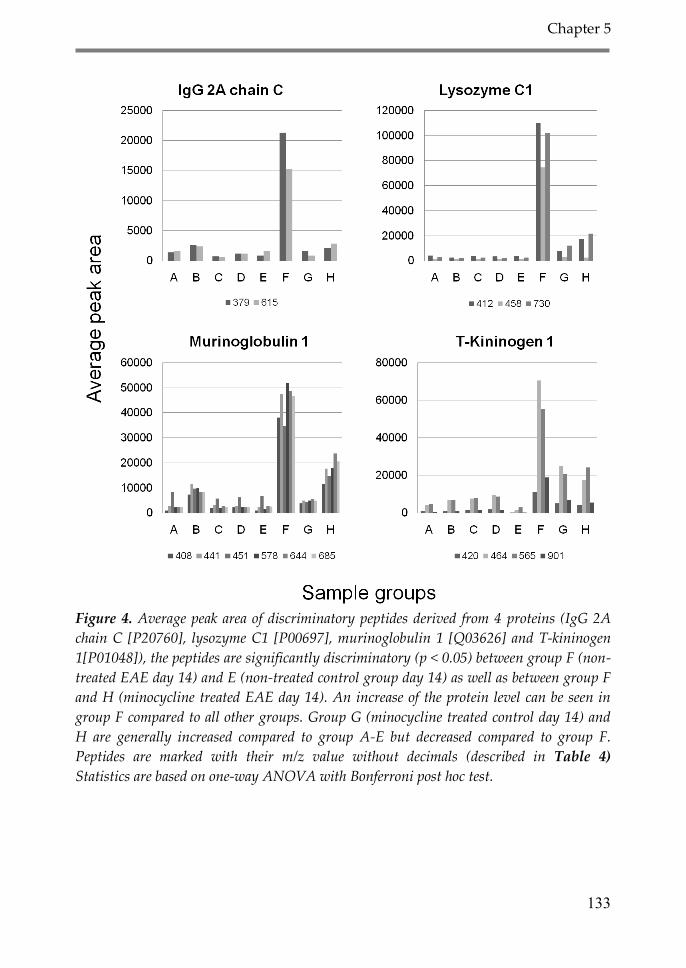
Chapter 5
133
Figure 4. Average peak area of discriminatory peptides derived from 4 proteins (IgG 2A
chain C [P20760], lysozyme C1 [P00697], murinoglobulin 1 [Q03626] and T-kininogen
1[P01048]), the peptides are significantly discriminatory (p < 0.05) between group F (non-
treated EAE day 14) and E (non-treated control group day 14) as well as between group F
and H (minocycline treated EAE day 14). An increase of the protein level can be seen in
group F compared to all other groups. Group G (minocycline treated control day 14) and
H are generally increased compared to group A-E but decreased compared to group F.
Peptides are marked with their m/z value without decimals (described in Table 4)
Statistics are based on one-way ANOVA with Bonferroni post hoc test.
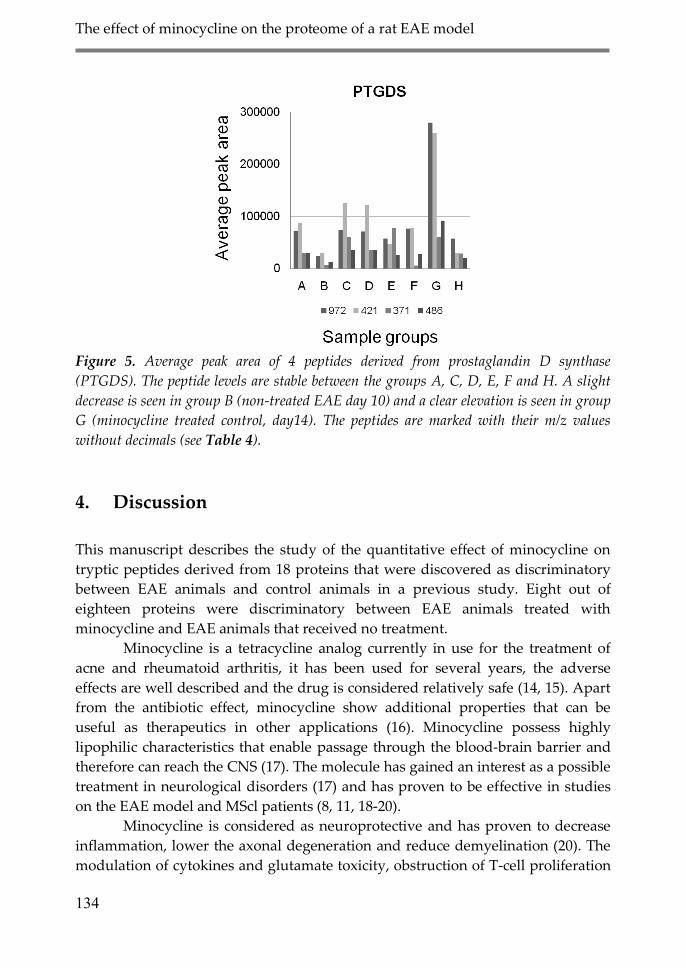
The effect of minocycline on the proteome of a rat EAE model
134
Figure 5. Average peak area of 4 peptides derived from prostaglandin D synthase
(PTGDS). The peptide levels are stable between the groups A, C, D, E, F and H. A slight
decrease is seen in group B (non-treated EAE day 10) and a clear elevation is seen in group
G (minocycline treated control, day14). The peptides are marked with their m/z values
without decimals (see Table 4).
4. Discussion
This manuscript describes the study of the quantitative effect of minocycline on
tryptic peptides derived from 18 proteins that were discovered as discriminatory
between EAE animals and control animals in a previous study. Eight out of
eighteen proteins were discriminatory between EAE animals treated with
minocycline and EAE animals that received no treatment.
Minocycline is a tetracycline analog currently in use for the treatment of
acne and rheumatoid arthritis, it has been used for several years, the adverse
effects are well described and the drug is considered relatively safe (14, 15). Apart
from the antibiotic effect, minocycline show additional properties that can be
useful as therapeutics in other applications (16). Minocycline possess highly
lipophilic characteristics that enable passage through the blood-brain barrier and
therefore can reach the CNS (17). The molecule has gained an interest as a possible
treatment in neurological disorders (17) and has proven to be effective in studies
on the EAE model and MScl patients (8, 11, 18-20).
Minocycline is considered as neuroprotective and has proven to decrease
inflammation, lower the axonal degeneration and reduce demyelination (20). The
modulation of cytokines and glutamate toxicity, obstruction of T-cell proliferation
Chapter 5
135
and migration as well as an inhibitory effect of the activation of microglia are
proposed mechanisms behind this protection (8, 21-24). In this study many of the
proteins that were affected by minocycline are connected to inflammation, the
regulation of pro-inflammatory cytokines could be a reason for the decreased level
of these proteins in the minocycline treated animals.
Minocycline has also shown effect on matrix metalloproteinase (MMP)
activity and production (8). MMP’s have previously shown an ability to degrade
membranes surrounding blood vessels and thereby causing blood-brain barrier
(BBB) disruption (25). Other studies have shown a connection between BBB
disruption and MMP’s (26-28). Matrix metalloproteinases have also been
connected to the pathogensis of MScl in several studies (29-31).
In our previous study most of the proteins that increased in the EAE
animals compared to control are known to be present in blood. The increased
levels of these proteins may have been caused by a disruption of the BBB. The
proteins show the same behavior in the present study with a significant increase in
the EAE animals sacrificed at day 14 (group F). The decreased protein level in the
minocycline treated EAE animals (group H) may have been caused by the
protection of the BBB via the suppression of MMP’s.
One interesting and puzzling observation made in this study was the
increased level of some of the proteins in the control animals treated with
minocycline (group G, sacrificed at day 14) compared to the untreated control
animals (group E). The minocycline treated control animals sacrificed at day 10
did not show this increased protein levels. The rats in group G showed no
increased neurological scores nor a decreased weight pattern but the increased
protein levels might be a sign of a non-symptomatic adverse late effect. It is well
known that minocycline treatment can lead to negative side-effects (15). What has
to be noted is that the control animals in this study were also treated with CFA
(without MBP), they were thus not completely healthy. The minocycline effect on
these animals sacrificed at day 14 may have been caused by the fact that these
animals are not healthy. This has to be investigated further in healthy control
animals to determine if this effect is only observed in CFA treated animals or if the
same will be recorded in completely healthy animals as well.
In summary our results show that EAE pathogenesis is attenuated both at
a level of clinical symptoms as well as at the proteomic level in the CSF of acute
EAE rats. The symptoms are delayed or decreased. Further there seems to be a
non-symptomatic side-effect of minocycline on control animals sampled at a later
stage. Our results correlates with earlier studies showing anti-inflammatory as
well as BBB defensive functions behind the protective effect of minocycline on the
EAE model.

The effect of minocycline on the proteome of a rat EAE model
136
Acknowledgements
This study was performed within the framework of Top Institute Pharma project
D4-102.
Chapter 5
137
Reference List
1. Compston, A., and Coles, A. (2008) Multiple sclerosis. Lancet 372, 1502-1517
2. Aharoni, R., Eilam, R., Stock, A., Vainshtein, A., Shezen, E., Gal, H., Friedman, N., and Arnon, R.
(2010) Glatiramer acetate reduces Th-17 inflammation and induces regulatory T-cells in the CNS of
mice with relapsing-remitting or chronic EAE. J Neuroimmunol.
3. Floris, S., Blezer, E. L., Schreibelt, G., Dopp, E., van der Pol, S. M., Schadee-Eestermans, I. L., Nicolay,
K., Dijkstra, C. D., and de Vries, H. E. (2004) Blood-brain barrier permeability and monocyte
infiltration in experimental allergic encephalomyelitis: a quantitative MRI study. Brain 127, 616-627
4. Gold, R., Linington, C., and Lassmann, H. (2006) Understanding pathogenesis and therapy of multiple
sclerosis via animal models: 70 years of merits and culprits in experimental autoimmune
encephalomyelitis research. Brain 129, 1953-1971
5. Rasmussen, S., Wang, Y., Kivisakk, P., Bronson, R. T., Meyer, M., Imitola, J., and Khoury, S. J. (2007)
Persistent activation of microglia is associated with neuronal dysfunction of callosal projecting
pathways and multiple sclerosis-like lesions in relapsing--remitting experimental autoimmune
encephalomyelitis. Brain 130, 2816-2829
6. Soulika, A. M., Lee, E., McCauley, E., Miers, L., Bannerman, P., and Pleasure, D. (2009) Initiation and
progression of axonopathy in experimental autoimmune encephalomyelitis. J Neurosci. 29, 14965-
14979
7. Stirling, D. P., Koochesfahani, K. M., Steeves, J. D., and Tetzlaff, W. (2005) Minocycline as a
neuroprotective agent. Neuroscientist. 11, 308-322
8. Brundula, V., Rewcastle, N. B., Metz, L. M., Bernard, C. C., and Yong, V. W. (2002) Targeting
leukocyte MMPs and transmigration: minocycline as a potential therapy for multiple sclerosis. Brain
125, 1297-1308
9. Giuliani, F., Metz, L. M., Wilson, T., Fan, Y., Bar-Or, A., and Yong, V. W. (2005) Additive effect of the
combination of glatiramer acetate and minocycline in a model of MS. J Neuroimmunol. 158, 213-221
10. Metz, L. M., Zhang, Y., Yeung, M., Patry, D. G., Bell, R. B., Stoian, C. A., Yong, V. W., Patten, S. B.,
Duquette, P., Antel, J. P., and Mitchell, J. R. (2004) Minocycline reduces gadolinium-enhancing
magnetic resonance imaging lesions in multiple sclerosis. Ann. Neurol 55, 756
11. Metz, L. M., Li, D., Traboulsee, A., Myles, M. L., Duquette, P., Godin, J., Constantin, M., and Yong, V.
W. (2009) Glatiramer acetate in combination with minocycline in patients with relapsing--remitting
multiple sclerosis: results of a Canadian, multicenter, double-blind, placebo-controlled trial. Mult.
Scler. 15, 1183-1194
12. Rosenling, T., Slim, C. L., Christin, C., Coulier, L., Shi, S., Stoop, M. P., Bosman, J., Suits, F.,
Horvatovich, P. L., Stockhofe-Zurwieden, N., Vreeken, R., Hankemeier, T., van Gool, A. J., Luider, T.
M., and Bischoff, R. (2009) The effect of preanalytical factors on stability of the proteome and selected
metabolites in cerebrospinal fluid (CSF). J Proteome. Res. 8, 5511-5522
13. Suits, F., Lepre, J., Du, P., Bischoff, R., and Horvatovich, P. (2008) Two-dimensional method for time
aligning liquid chromatography-mass spectrometry data. Anal. Chem. 80, 3095-3104
14. Alarcon, G. S. (2000) Tetracyclines for the treatment of rheumatoid arthritis. Expert. Opin. Investig.
Drugs 9, 1491-1498
The effect of minocycline on the proteome of a rat EAE model
138
15. Feldman, S., Careccia, R. E., Barham, K. L., and Hancox, J. (2004) Diagnosis and treatment of acne. Am.
Fam. Physician 69, 2123-2130
16. Nelson, M. L. (1998) Chemical and biological dynamics of tetracyclines. Adv. Dent. Res. 12, 5-11
17. Kim, H. S., and Suh, Y. H. (2009) Minocycline and neurodegenerative diseases. Behav. Brain Res. 196,
168-179
18. Metz, L. M., Zhang, Y., Yeung, M., Patry, D. G., Bell, R. B., Stoian, C. A., Yong, V. W., Patten, S. B.,
Duquette, P., Antel, J. P., and Mitchell, J. R. (2004) Minocycline reduces gadolinium-enhancing
magnetic resonance imaging lesions in multiple sclerosis. Ann. Neurol 55, 756
19. Zabad, R. K., Metz, L. M., Todoruk, T. R., Zhang, Y., Mitchell, J. R., Yeung, M., Patry, D. G., Bell, R. B.,
and Yong, V. W. (2007) The clinical response to minocycline in multiple sclerosis is accompanied by
beneficial immune changes: a pilot study. Mult. Scler. 13, 517-526
20. Luccarini, I., Ballerini, C., Biagioli, T., Biamonte, F., Bellucci, A., Rosi, M. C., Grossi, C., Massacesi, L.,
and Casamenti, F. (2008) Combined treatment with atorvastatin and minocycline suppresses severity
of EAE. Exp. Neurol 211, 214-226
21. Kloppenburg, M., Verweij, C. L., Miltenburg, A. M., Verhoeven, A. J., Daha, M. R., Dijkmans, B. A.,
and Breedveld, F. C. (1995) The influence of tetracyclines on T cell activation. Clin. Exp. Immunol. 102,
635-641
22. Lee, S. M., Yune, T. Y., Kim, S. J., Park, D. W., Lee, Y. K., Kim, Y. C., Oh, Y. J., Markelonis, G. J., and
Oh, T. H. (2003) Minocycline reduces cell death and improves functional recovery after traumatic
spinal cord injury in the rat. J Neurotrauma 20, 1017-1027
23. Yrjanheikki, J., Keinanen, R., Pellikka, M., Hokfelt, T., and Koistinaho, J. (1998) Tetracyclines inhibit
microglial activation and are neuroprotective in global brain ischemia. Proc. Natl. Acad. Sci. U. S. A 95,
15769-15774
24. Yrjanheikki, J., Tikka, T., Keinanen, R., Goldsteins, G., Chan, P. H., and Koistinaho, J. (1999) A
tetracycline derivative, minocycline, reduces inflammation and protects against focal cerebral
ischemia with a wide therapeutic window. Proc. Natl. Acad. Sci. U. S. A 96, 13496-13500
25. Rosenberg, G. A., Kornfeld, M., Estrada, E., Kelley, R. O., Liotta, L. A., and Stetler-Stevenson, W. G.
(1992) TIMP-2 reduces proteolytic opening of blood-brain barrier by type IV collagenase. Brain Res.
576, 203-207
26. Barr, T. L., Latour, L. L., Lee, K. Y., Schaewe, T. J., Luby, M., Chang, G. S., El-Zammar, Z., Alam, S.,
Hallenbeck, J. M., Kidwell, C. S., and Warach, S. (2010) Blood-brain barrier disruption in humans is
independently associated with increased matrix metalloproteinase-9. Stroke 41, e123-e128
27. Lee, M. A., Palace, J., Stabler, G., Ford, J., Gearing, A., and Miller, K. (1999) Serum gelatinase B, TIMP-
1 and TIMP-2 levels in multiple sclerosis. A longitudinal clinical and MRI study. Brain 122 ( Pt 2), 191-
197
28. Waubant, E., Goodkin, D. E., Gee, L., Bacchetti, P., Sloan, R., Stewart, T., Andersson, P. B., Stabler, G.,
and Miller, K. (1999) Serum MMP-9 and TIMP-1 levels are related to MRI activity in relapsing
multiple sclerosis. Neurology 53, 1397-1401
29. Fainardi, E., Castellazzi, M., Bellini, T., Manfrinato, M. C., Baldi, E., Casetta, I., Paolino, E., Granieri, E.,
and Dallocchio, F. (2006) Cerebrospinal fluid and serum levels and intrathecal production of active

Chapter 5
139
matrix metalloproteinase-9 (MMP-9) as markers of disease activity in patients with multiple sclerosis.
Mult. Scler. 12, 294-301
30. La, R. A., Cittadella, R., De Marco, E. V., Valentino, P., Andreoli, V., Trecroci, F., Latorre, V.,
Gambardella, A., and Quattrone, A. (2010) Single nucleotide polymorphism in the MMP-9 gene is
associated with susceptibility to develop multiple sclerosis in an Italian case-control study. J
Neuroimmunol.
31. Sastre-Garriga, J., Comabella, M., Brieva, L., Rovira, A., Tintore, M., and Montalban, X. (2004)
Decreased MMP-9 production in primary progressive multiple sclerosis patients. Mult. Scler. 10, 376-
380

140
Chapter 6
Chapter 6
141
Summary and future perspectives In the search for diagnostic markers, therapeutic response indicators and to
unravel pathological mechanisms, numerous proteomic biomarker studies have
been initiated. But despite extensive research there are few proteomic biomarkers
that have made it to the stage where they are implicated in the clinic. Proteomic
biomarker studies suffer from poor reproducibility which in part is caused by the
lack of standardization of analysis methods and sample handling. The sensitive
nature of biomolecules and the complexity of biological samples cause challenges
for the researcher. Sample collection procedure, time span between sample
collection and storage, contamination, additives, storage time, storage
temperature, number of freeze-thaw cycles, digestion protocol, analysis strategy
and data processing method are some of the procedures that affects the quality of
the results.
This thesis focus on the screening of cerebrospinal fluid (CSF), in search for
molecular biomarkers related to sample stability. CSF is the most suitable
compartment to analyze when searching for biomarkers related to central nervous
system (CNS) disorders. In this thesis CSF from an rat model of multiple sclerosis
(MScl), the acute experimental autoimmune encephalomyelitis (EAE), was
analyzed in order to search for biomarkers related to the disease.
Chapter 2 deals with the study on the effect of different sample handling
procedures on proteins, metabolites and free amino acids in porcine CSF. Three
sample handling procedures were investigated; samples were left at room
temperature directly after sampling, up to two hours. The room temperature
introduced quantitative changes of prostaglandin D synthase derived peptides,
and a number of metabolites and free amino acids. The second condition analyzed
was the effect of freeze-thaw cycles on the proteome profile; this treatment
introduced changes in the amount of transthyretin derived peptides. The third
condition investigated was the storage of digested CSF samples at 4 °C. After
storage at this temperature reduced amounts of prostaglandin D-synthase and
serotransferrin derived peptides were detected.
In Chapter 3 the study of human CSF samples left at room temperature
after centrifugation are presented. The CSF samples were analyzed by the means
of proteomics, metabolomics and free amino acids. The results were homogenous
across the platforms, showing that biological variation was the main variable in
the data sets. The only discriminatory features beween samples left at room
temperature compared to controls were two non identified ions and 2,3,4-
trihydrobutanoic acid.
Summary and future perspectives
142
Chapter 4 and 5 describes proteomic biomarker studies applied on CSF
from an acute EAE model in rat. In chapter 1 the model is described and previous
proteomic biomarker studies on the EAE model are reviewed. In chapter 4 CSF
from the EAE model was screened for discriminatory biomarkers connected to the
disease by the combination of two different mass spectrometry based proteomic
platforms. A number of proteins were discovered at increased levels in EAE rats
compared to controls. The combination of different analysis as well as data
processing strategies resulted in increased coverage but also showed overlapping
results. The combination of different techniques at different levels is an interesting
aspect that needs more attention.
Chapter 5 presents an extension of the EAE study described in chapter 4.
Described here, is the investigation of the effect of minocycline on the previously
detected discriminatory proteins. In this study only the QTOF platform was
applied. The results show that 8 out of the 18 discriminatory proteins detected in
chapter 4 were significantly changed by the minocycline treatment. These proteins
show a reproducible behavior between the first and the second study as being
increased in EAE rats compared to control animals. An additional discovery was
that minocycline also affected the peptide level of control animals.
Conclusively, different sample handling procedures introduce quantitative
changes of different biomolecules; this ought to be taken into account when
designing biomarker studies. Key to reproducible results are the standardization
of sample handling and sample analysis procedures, which can be done on several
levels. It would be interesting to further investigate the effect of long time storage
at different temperatures as well as freeze-thaw cycles with the addition of
stabilizing agents. A full comparison of different proteomic platforms and data
processing pipelines would also be interesting, to further address the
reproducibility question.
In the EAE studies we have discovered candidate markers that are related
to the disease. An interesting question is if these results are translatable to human
subjects and if the same pattern would be detected in blood samples as well. The
collection of CSF is relatively easily done but is still of a quite invasive nature and
the detection of biomarkers in blood would be more optimal. The fact that
minocycline treatment of EAE rats affected a number of proteins show that this
drug has a possible effect on inflammation and/or blood-brain barrier function but
the increased protein level in control animals could be a sign of an adverse effect
that calls for attention. Finally, I have through the work on this thesis come to the
understanding that the discovery of specific, useful and fully reproducible
molecular biomarkers is an art and requires full attention on the small details,
nothing can be neglected, everything influences the end results.
Chapter 6
143
Samenvatting In de zoektocht naar diagnostische markers, therapeutische reactie-indicatoren,
om pathologische mechanismen te ontrafelen, zijn talrijke studies naar proteomic
biomarker gestart. Desondanks uitgebreid onderzoek zijn er weinig proteomic
biomarkers die het stadium bereikt hebben dat zij in een kliniek kunnen worden
gebruikt.
Studies naar proteomic biomarkers lijden aan slechte
reproduceerbaarheid. Dit wordt voor een deel veroorzaakt door een gebrek aan
normalisatie van analysemethodes en monsterbehandeling. De gevoelige aard van
biomoleculen en de ingewikkeldheid van biologische monsters zijn een uitdaging
voor de onderzoeker. De procedure van de monsterinzameling, de tijdspanne
tussen monsterinzameling en opslag, verontreiniging, additieven, opslagtijd,
opslagtemperatuur, het aantal freeze-thaw cycli, digest-protocol, analysestrategie
en gegevens, zijn een deel van de procedures die de kwaliteit van de resultaten
beïnvloedt.
Deze dissertatie is gefocust op het onderzoek van hersenvloeistof (CSF), in
het zoeken naar biomarkers voor monster-stabiliteit. CSF is de meest geschikte
vloeistof om te analyseren in het zoeken naar biomarkers voor ziektes in het
centrale zenuwstelsel (CNS). In deze these werd CSF van een ratten-model van
multiple sclerose (MScl), de experimentele auto-immune encefalomyelitis (EAE),
geanalyseerd om ziekte gerelateerde biomarkers te vinden.
Hoofdstuk 2 behandelt de studie over het effect van verschillende
monsterbehandelingsprocedures op proteïnen, metabolites en vrije aminozuren in
varkens CSF. Drie monsterbehandelingsprocedures werden onderzocht; monsters
werden na afname op kamertemperatuur gelaten, tot maximaal twee uur. De op
kamertemperatuur geïntroduceerde kwantitatieve veranderingen bevatten
peptiden van prostaglandine D-synthase, een aantal metabolites en vrije
aminozuren. De tweede analysevoorwaarde was het effect van freeze-thaw cycli
op het proteomeprofiel; dit geintroduceerde veranderingen in de hoeveelheid van
transthyretin afgeleide peptiden. De derde onderzochte voorwaarde bedroeg de
Samenvatting
144
opslag van digested CSF monsters op 4 °C. Dit resulteerde in een vermindert
niveau van prostaglandine D-synthase en serotransferrin afgeleide peptiden.
In Hoofdstuk 3 zijn de effecten van kamertemperatuur op menselijke CSF
monsters geanalyseerd. De CSF monsters werden geanalyseerd door proteomics,
metabolomics en vrije aminozuren analyse. De resultaten waren homogeen over
de platforms en lieten zien dat de biologische variatie de voornaamste variabele in
de data was. De enige discriminerende eigenschappen tussen de monsters op
kamertemperatuur en de controles, waren twee niet-geïdentificeerde ionen en
trihydrobutanoic zuur 2.3.4.
Hoofdstuk 4 en 5 beschrijft proteomic biomarkerstudies die op CSF van
een acuut EAE ratten model worden toegepast. In hoofdstuk 1 wordt het model
beschreven en de vorige proteomic biomarkerstudies van het model EAE worden
opnieuw in ogenschouw genomen. In hoofdstuk 4 wordt CSF van het EAE model
onderzocht op discriminerende ziekte-biomarkers, door de combinatie van twee
verschillende gebaseerde proteomic platforms van massaspectrometrie. Een antaal
proteïnen werden ontdekt op verhoogde niveaus bij EAE ratten in vergelijking
met de controles. De combinatie van verschillende analyse- en
dataverwerkingsstrategieën resulteerden in een verhoogde dekking maar toonden
ook overlappende resultaten. De combinatie van technieken op verschillende
niveaus is een interessant aspect dat meer aandacht vergt.
Hoofdstuk 5 bevat een uitbreiding van de EAE studie, die in hoofdstuk 4
wordt beschreven. Hierin wordt het onderzoek van het effect van minocycline op
de eerder ontdekte discriminerende proteïnen beschreven. In deze studie werd
slechts het QTOF platform toegepast. De resultaten tonen aan dat 8 van 18 van de
discriminerende proteïnen gevonden in hoofdstuk 4 door de minocycline
behandeling werden veranderd. Deze proteïnen vertonen een reproduceerbaar
gedrag tussen de eerste en de tweede studie; ze zijn gestegen bij EAE ratten in
vergelijking met controledieren. Een extra ontdekking was dat minocycline ook
het peptide niveau van controledieren beïnvloedde.
Concluderend; verschillende steekproef-behandelingsprocedures
introduceren kwantitatieve veranderingen van verschillende biomoleculen; dit
zou in acht genomen moeten worden bij het ontwerpen van biomarker studies. De
Chapter 6
145
sleutel tot reproduceerbare resultaten is de normalisatie van monsterbehandeling
en analyseprocedures, die op verscheidene niveaus kan worden gedaan. Het zou
interessant zijn om verder onderzoek te doen naar het effect van stabiliserende
agents op langtermijn-opslag bij verschillende temperaturen evenals freeze-thaw
cycli. Een volledige vergelijking van verschillende proteomic platforms en
gegevens zijn ook interessant zijn om de reproduceerbaarheid verder te
verbeteren.
In de EAE studies hebben wij kandidaatmarkers ontdekt die met MScl
verwant zijn. Een interessante vraag is of deze resultaten ook waargenomen
kunnen worden bij patiënten, daarnaast rijst de vraag of hetzelfde patroon
eveneens in bloedmonsters zal worden ontdekt. Het vergaren van CSF wordt vrij
gemakkelijk gedaan maar is nogal ingrijpend van aard en de opsporing van
biomarkers in bloed zou beter zijn. Het feit dat minocycline een aantal proteïnen
van EAE ratten beïnvloedt, toont aan dat deze stof een mogelijk effect heeft op
ontsteking van de blood-brain barrièrefunctie. Maar het verhoogde eiwitniveau in
controledieren is een teken van een ongunstig effect dat aandacht vereist. Tot slot
ben ik door het werk aangaande deze dissertatie tot besef gekomen dat het
ontdekken van specifieke, nuttige en volledig reproduceerbare moleculaire
biomarkers een kunst is en volledige aandacht vereist op de kleine details, niets
kan worden veronachtzaamd, alles beïnvloedt het eindresultaat.

Samenvatting
146
Appendices
Supplementary material Chapter 2 Supplementary material Chapter 4
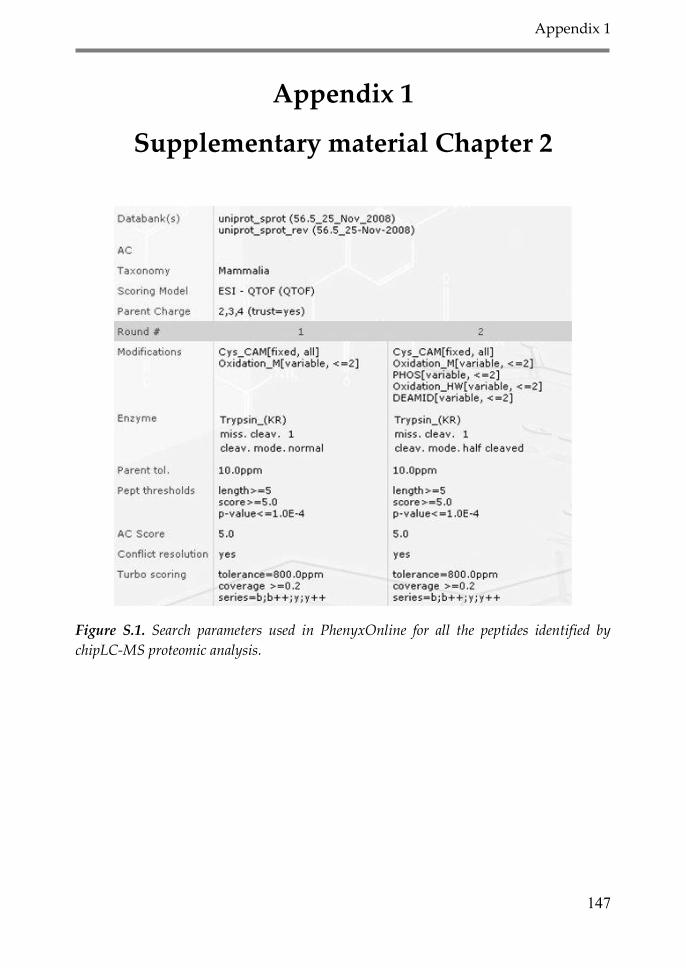
Appendix 1
147
Appendix 1
Supplementary material Chapter 2
Figure S.1. Search parameters used in PhenyxOnline for all the peptides identified by
chipLC-MS proteomic analysis.
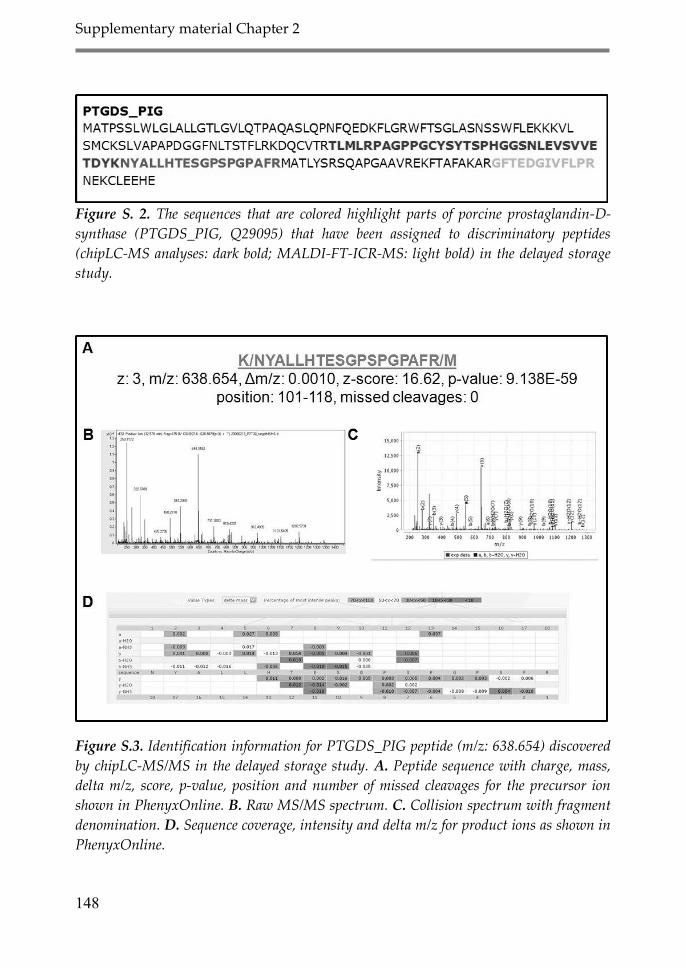
Supplementary material Chapter 2
148
Figure S. 2. The sequences that are colored highlight parts of porcine prostaglandin-D-
synthase (PTGDS_PIG, Q29095) that have been assigned to discriminatory peptides
(chipLC-MS analyses: dark bold; MALDI-FT-ICR-MS: light bold) in the delayed storage
study.
Figure S.3. Identification information for PTGDS_PIG peptide (m/z: 638.654) discovered
by chipLC-MS/MS in the delayed storage study. A. Peptide sequence with charge, mass,
delta m/z, score, p-value, position and number of missed cleavages for the precursor ion
shown in PhenyxOnline. B. Raw MS/MS spectrum. C. Collision spectrum with fragment
denomination. D. Sequence coverage, intensity and delta m/z for product ions as shown in
PhenyxOnline.
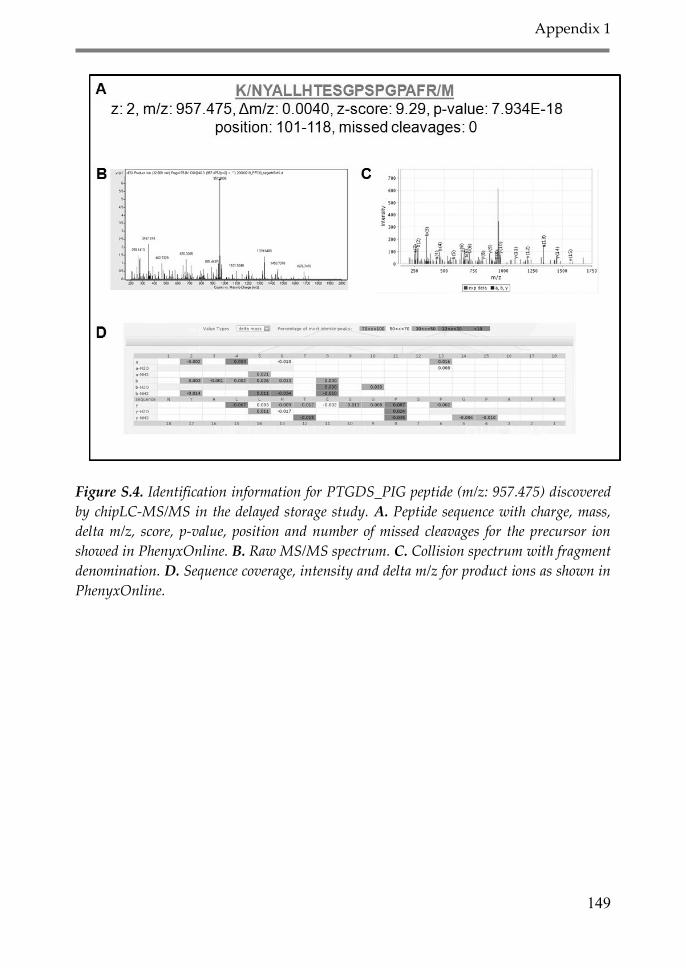
Appendix 1
149
Figure S.4. Identification information for PTGDS_PIG peptide (m/z: 957.475) discovered
by chipLC-MS/MS in the delayed storage study. A. Peptide sequence with charge, mass,
delta m/z, score, p-value, position and number of missed cleavages for the precursor ion
showed in PhenyxOnline. B. Raw MS/MS spectrum. C. Collision spectrum with fragment
denomination. D. Sequence coverage, intensity and delta m/z for product ions as shown in
PhenyxOnline.

Supplementary material Chapter 2
150
Figure S.5. Identification information for PTGDS_PIG peptide (m/z: 921.443) discovered
by chipLC-MS/MS in the delayed storage study. A. Peptide sequence with charge, mass,
delta m/z, score, p-value, position and number of missed cleavages for the precursor ion
showed in PhenyxOnline. B. Raw MS/MS spectrum. C. Collision spectrum with fragment
denomination. D. Sequence coverage, intensity and delta m/z for product ions as shown in
PhenyxOnline.

Appendix 1
151
S.6. PCA plot of 6 discriminatory peaks (T0 vs. T30) selected by the NSC algorithm (C++
workflow) in the delayed storage study (proteomic analysis by chipLC-MS). The groups
are clearly separated from each other showing that the profiles are highly discriminatory.
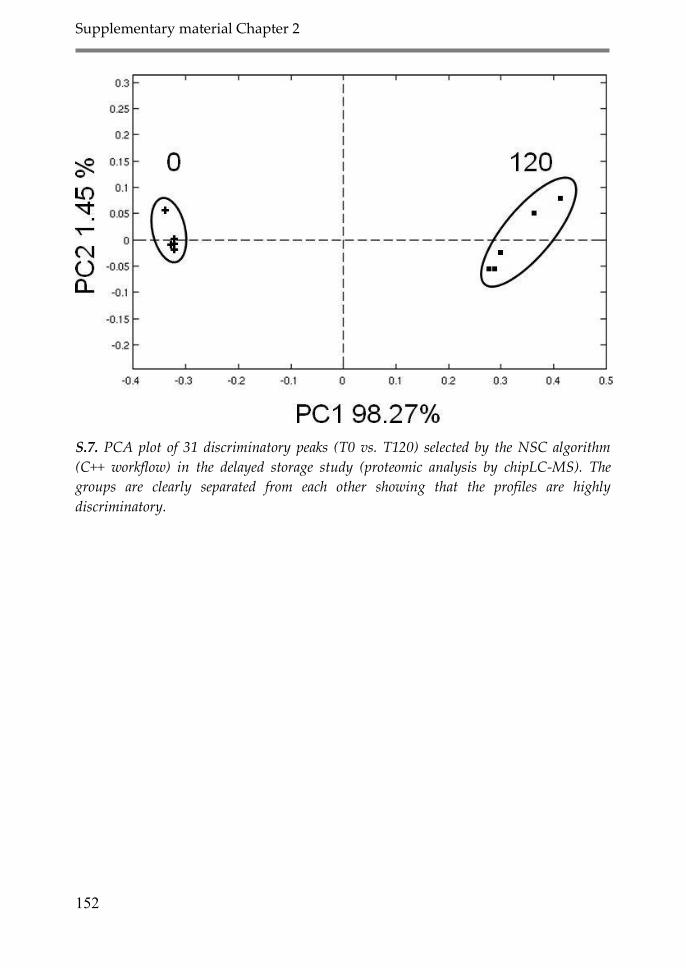
Supplementary material Chapter 2
152
S.7. PCA plot of 31 discriminatory peaks (T0 vs. T120) selected by the NSC algorithm
(C++ workflow) in the delayed storage study (proteomic analysis by chipLC-MS). The
groups are clearly separated from each other showing that the profiles are highly
discriminatory.

Appendix 1
153
S.8. PCA plot of 172 discriminatory peaks (T30 vs. T120) selected by the NSC algorithm
(C++ workflow) in the delayed storage study (proteomic analysis by chipLC-MS). The
groups are clearly separated from each other showing that the profiles are highly
discriminatory.
Figure S.9. The sequences that are colored highlight parts of porcine transthyretin
(TTY_PIG, P50390) that have been assigned to discriminatory peptides (chipLC-MS
analyses: bold, grey) in the freeze/thaw study.
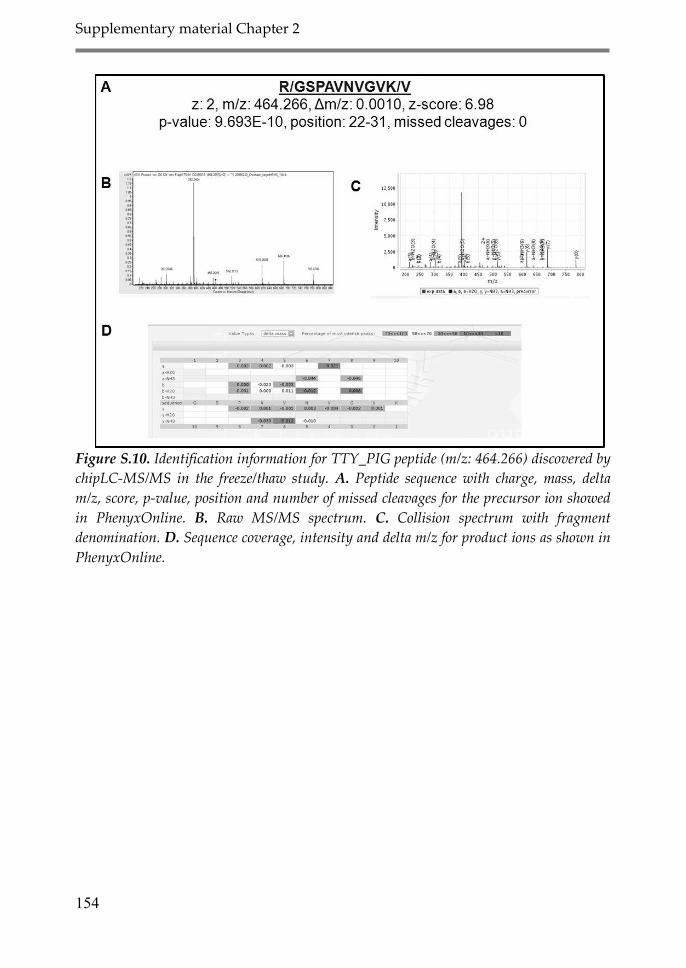
Supplementary material Chapter 2
154
Figure S.10. Identification information for TTY_PIG peptide (m/z: 464.266) discovered by
chipLC-MS/MS in the freeze/thaw study. A. Peptide sequence with charge, mass, delta
m/z, score, p-value, position and number of missed cleavages for the precursor ion showed
in PhenyxOnline. B. Raw MS/MS spectrum. C. Collision spectrum with fragment
denomination. D. Sequence coverage, intensity and delta m/z for product ions as shown in
PhenyxOnline.
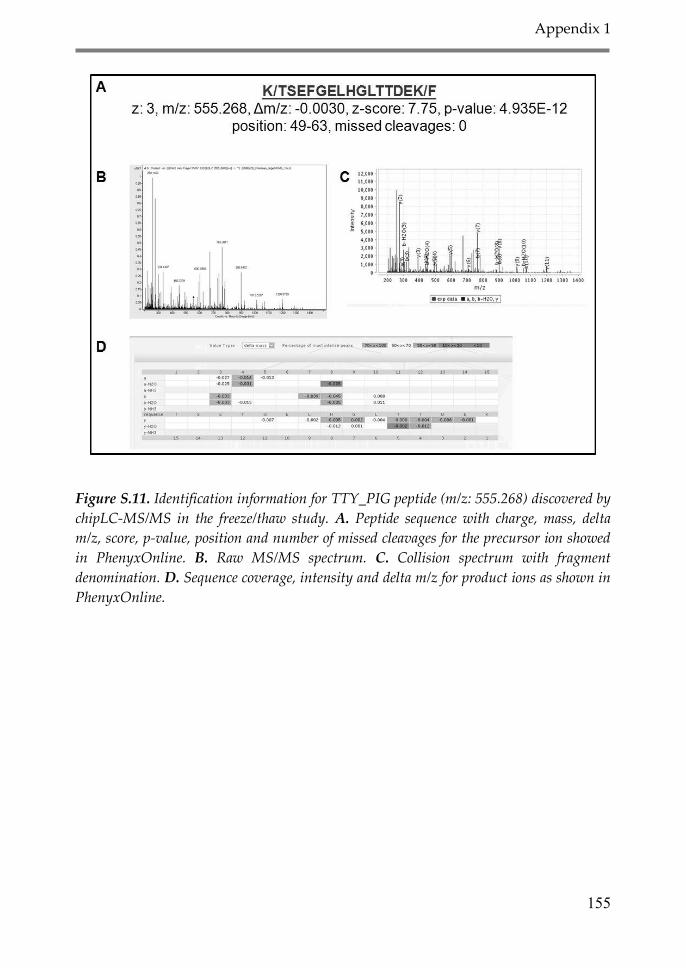
Appendix 1
155
Figure S.11. Identification information for TTY_PIG peptide (m/z: 555.268) discovered by
chipLC-MS/MS in the freeze/thaw study. A. Peptide sequence with charge, mass, delta
m/z, score, p-value, position and number of missed cleavages for the precursor ion showed
in PhenyxOnline. B. Raw MS/MS spectrum. C. Collision spectrum with fragment
denomination. D. Sequence coverage, intensity and delta m/z for product ions as shown in
PhenyxOnline.
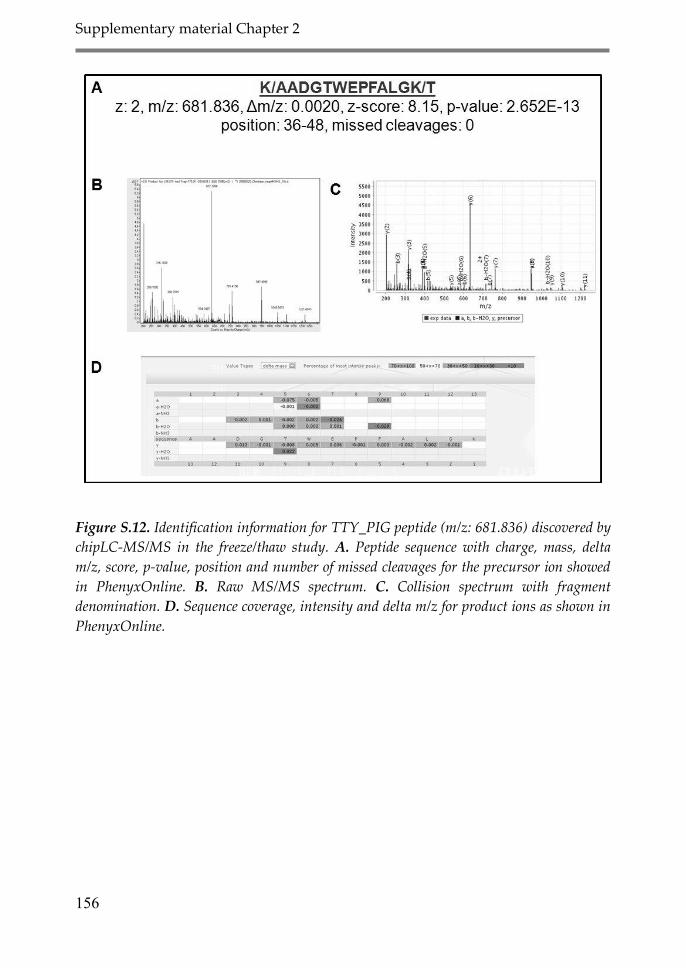
Supplementary material Chapter 2
156
Figure S.12. Identification information for TTY_PIG peptide (m/z: 681.836) discovered by
chipLC-MS/MS in the freeze/thaw study. A. Peptide sequence with charge, mass, delta
m/z, score, p-value, position and number of missed cleavages for the precursor ion showed
in PhenyxOnline. B. Raw MS/MS spectrum. C. Collision spectrum with fragment
denomination. D. Sequence coverage, intensity and delta m/z for product ions as shown in
PhenyxOnline.
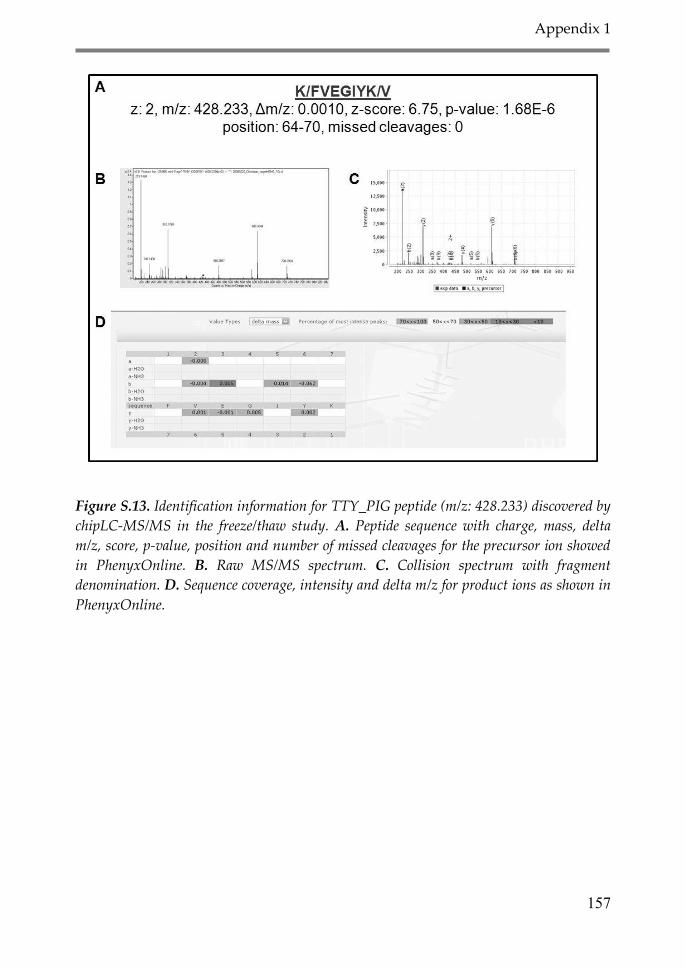
Appendix 1
157
Figure S.13. Identification information for TTY_PIG peptide (m/z: 428.233) discovered by
chipLC-MS/MS in the freeze/thaw study. A. Peptide sequence with charge, mass, delta
m/z, score, p-value, position and number of missed cleavages for the precursor ion showed
in PhenyxOnline. B. Raw MS/MS spectrum. C. Collision spectrum with fragment
denomination. D. Sequence coverage, intensity and delta m/z for product ions as shown in
PhenyxOnline.

Supplementary material Chapter 2
158
S.14. PCA plot of 41 discriminatory peaks (control vs. 10x) selected by the NSC algorithm
(C++ workflow) in the freeze/thaw study (proteomic analysis by chipLC-MS). The groups
are clearly separated from each other showing that class separation based on these peaks is
possible.
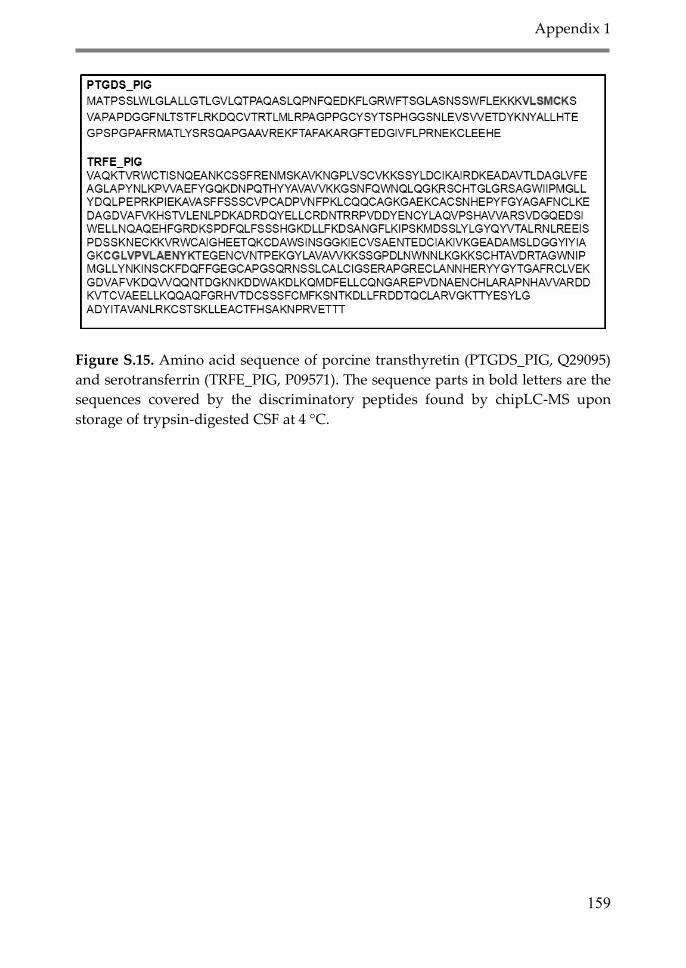
Appendix 1
159
Figure S.15. Amino acid sequence of porcine transthyretin (PTGDS_PIG, Q29095)
and serotransferrin (TRFE_PIG, P09571). The sequence parts in bold letters are the
sequences covered by the discriminatory peptides found by chipLC-MS upon
storage of trypsin-digested CSF at 4 °C.
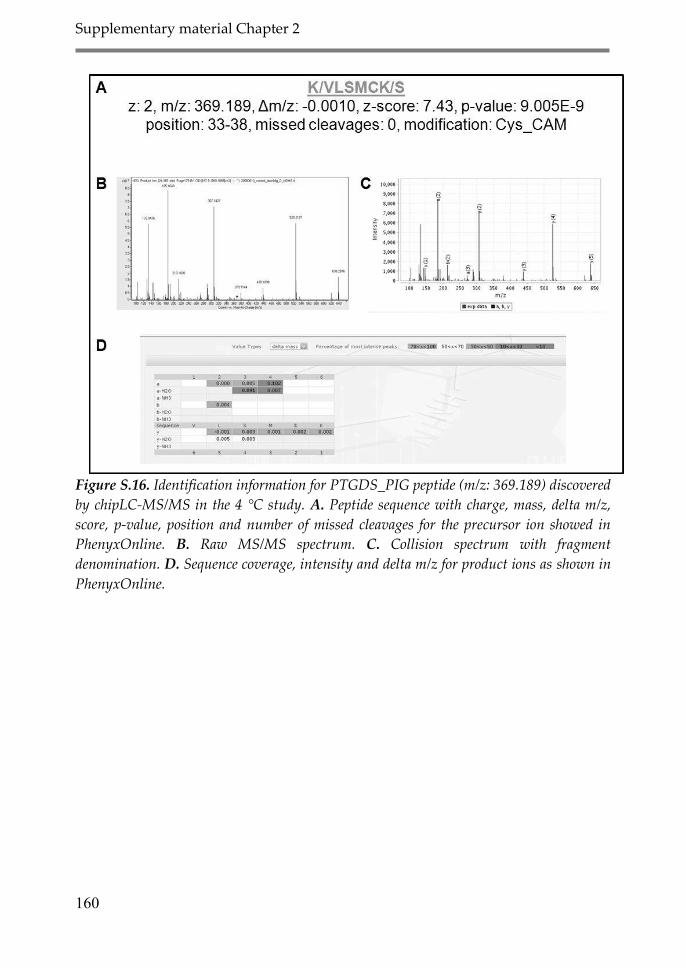
Supplementary material Chapter 2
160
Figure S.16. Identification information for PTGDS_PIG peptide (m/z: 369.189) discovered
by chipLC-MS/MS in the 4 °C study. A. Peptide sequence with charge, mass, delta m/z,
score, p-value, position and number of missed cleavages for the precursor ion showed in
PhenyxOnline. B. Raw MS/MS spectrum. C. Collision spectrum with fragment
denomination. D. Sequence coverage, intensity and delta m/z for product ions as shown in
PhenyxOnline.
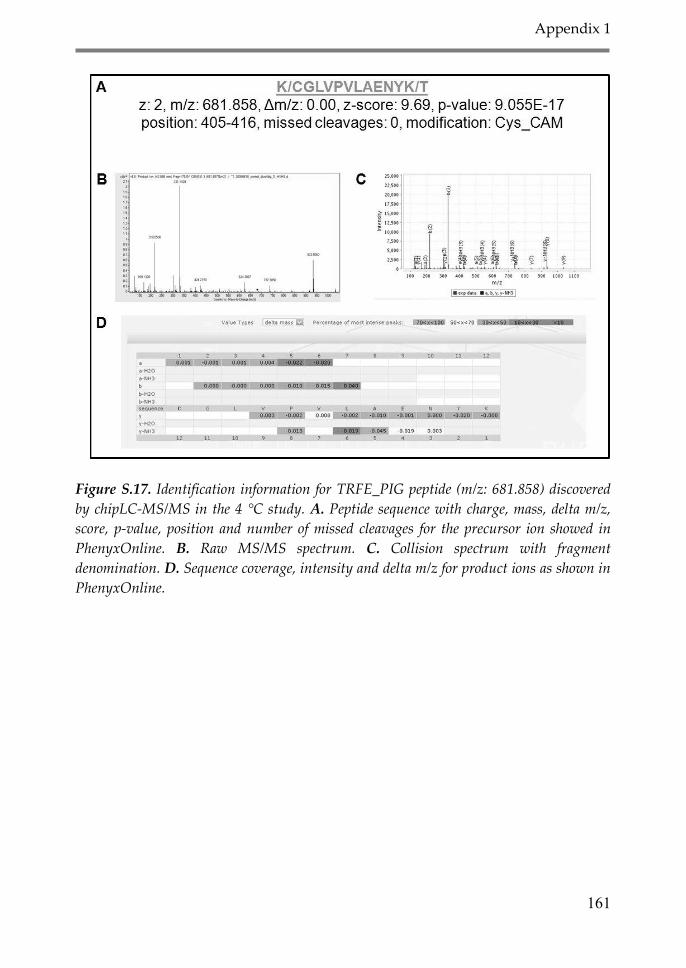
Appendix 1
161
Figure S.17. Identification information for TRFE_PIG peptide (m/z: 681.858) discovered
by chipLC-MS/MS in the 4 °C study. A. Peptide sequence with charge, mass, delta m/z,
score, p-value, position and number of missed cleavages for the precursor ion showed in
PhenyxOnline. B. Raw MS/MS spectrum. C. Collision spectrum with fragment
denomination. D. Sequence coverage, intensity and delta m/z for product ions as shown in
PhenyxOnline.
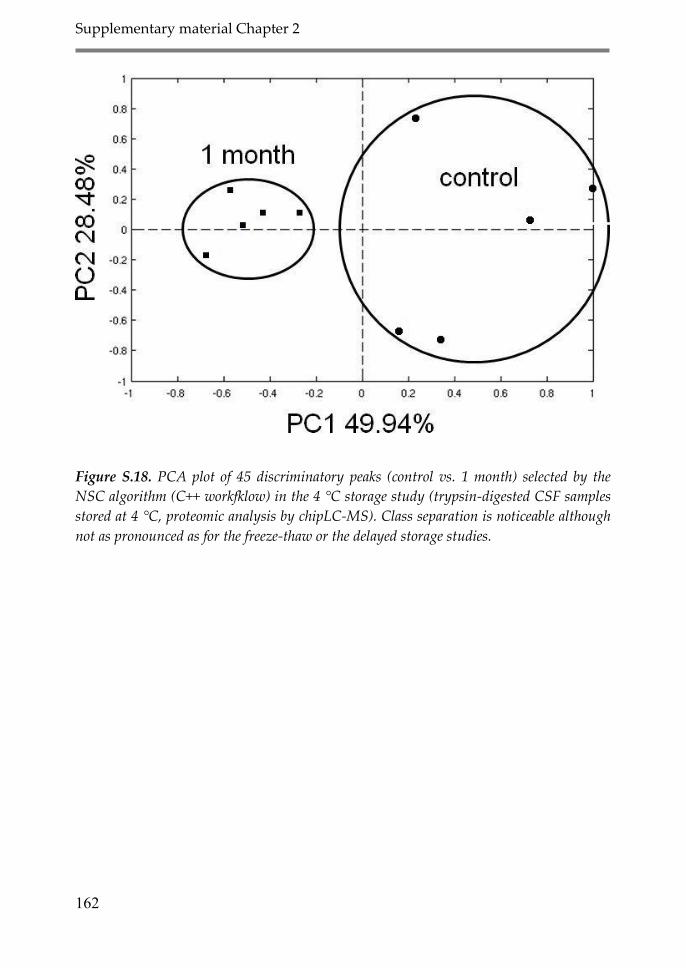
Supplementary material Chapter 2
162
Figure S.18. PCA plot of 45 discriminatory peaks (control vs. 1 month) selected by the
NSC algorithm (C++ workfklow) in the 4 °C storage study (trypsin-digested CSF samples
stored at 4 °C, proteomic analysis by chipLC-MS). Class separation is noticeable although
not as pronounced as for the freeze-thaw or the delayed storage studies.
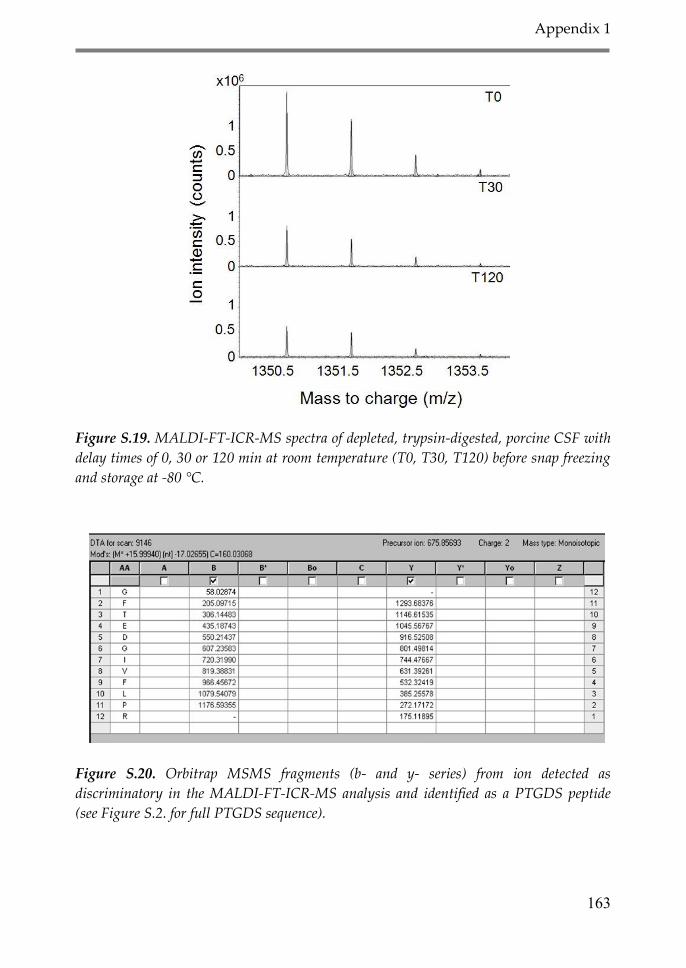
Appendix 1
163
Figure S.19. MALDI-FT-ICR-MS spectra of depleted, trypsin-digested, porcine CSF with
delay times of 0, 30 or 120 min at room temperature (T0, T30, T120) before snap freezing
and storage at -80 °C.
Figure S.20. Orbitrap MSMS fragments (b- and y- series) from ion detected as
discriminatory in the MALDI-FT-ICR-MS analysis and identified as a PTGDS peptide
(see Figure S.2. for full PTGDS sequence).
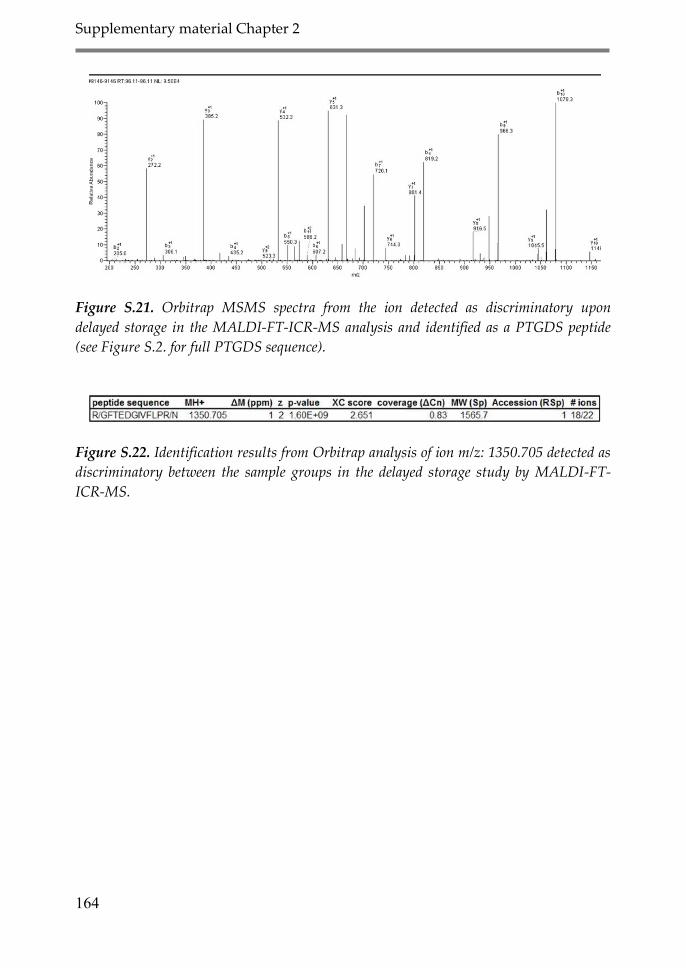
Supplementary material Chapter 2
164
Figure S.21. Orbitrap MSMS spectra from the ion detected as discriminatory upon
delayed storage in the MALDI-FT-ICR-MS analysis and identified as a PTGDS peptide
(see Figure S.2. for full PTGDS sequence).
Figure S.22. Identification results from Orbitrap analysis of ion m/z: 1350.705 detected as
discriminatory between the sample groups in the delayed storage study by MALDI-FT-
ICR-MS.
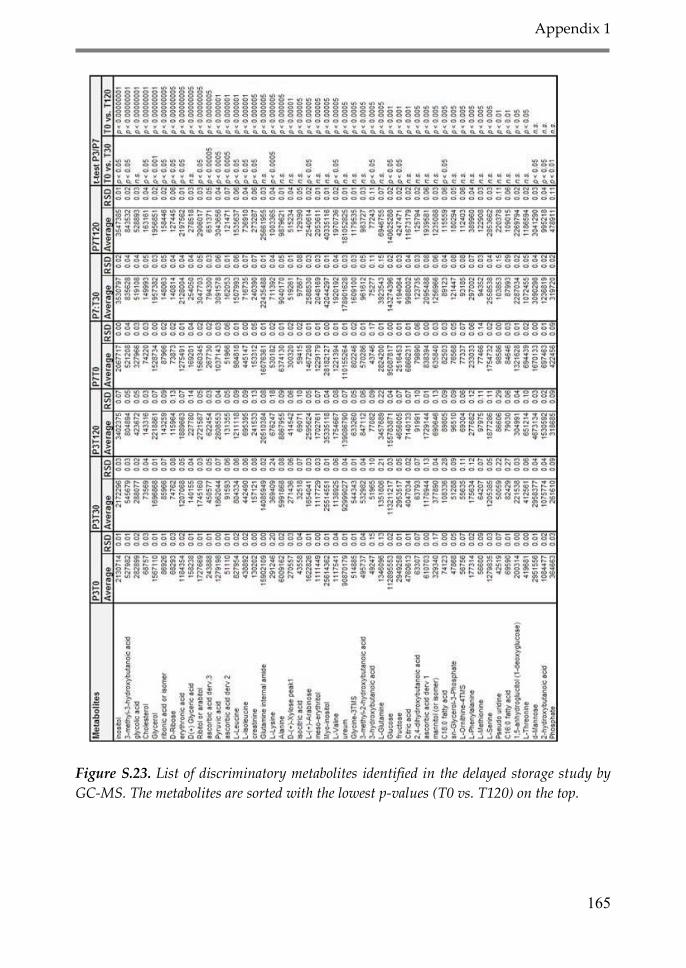
Appendix 1
165
Figure S.23. List of discriminatory metabolites identified in the delayed storage study by
GC-MS. The metabolites are sorted with the lowest p-values (T0 vs. T120) on the top.
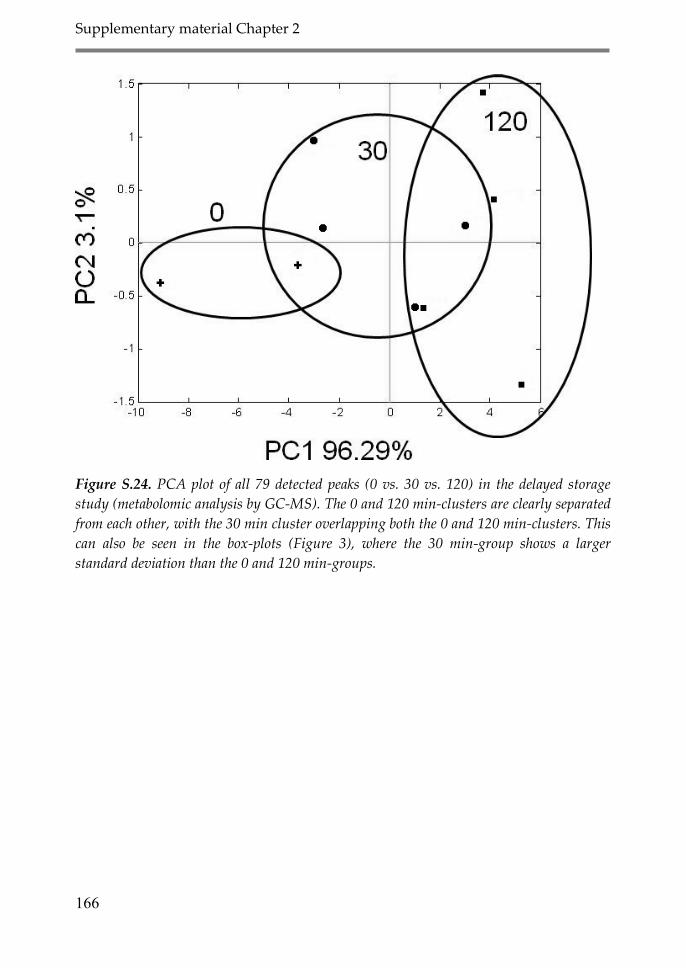
Supplementary material Chapter 2
166
Figure S.24. PCA plot of all 79 detected peaks (0 vs. 30 vs. 120) in the delayed storage
study (metabolomic analysis by GC-MS). The 0 and 120 min-clusters are clearly separated
from each other, with the 30 min cluster overlapping both the 0 and 120 min-clusters. This
can also be seen in the box-plots (Figure 3), where the 30 min-group shows a larger
standard deviation than the 0 and 120 min-groups.
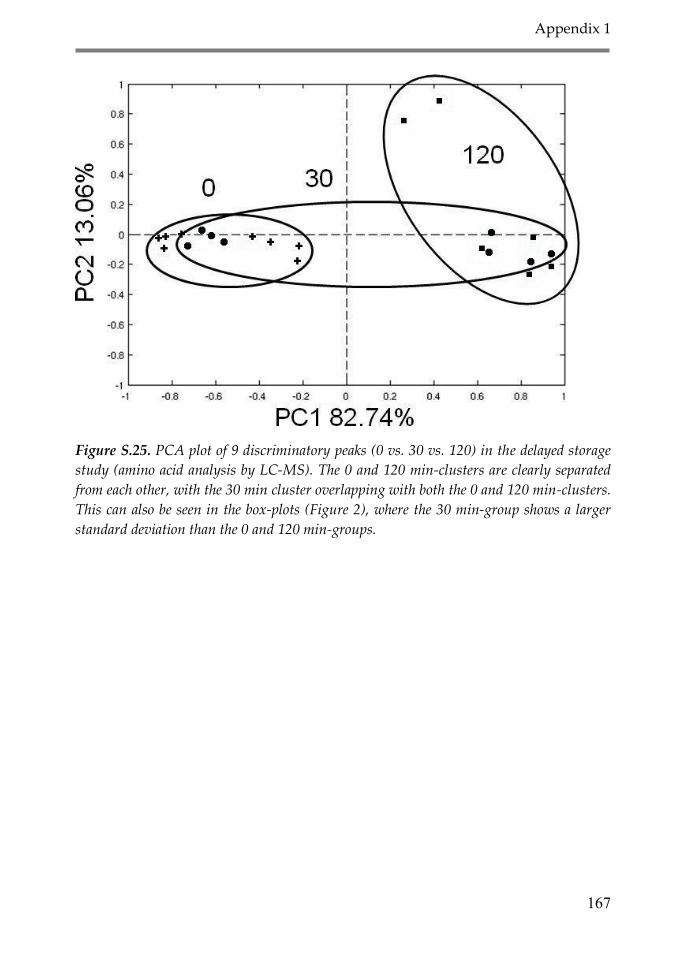
Appendix 1
167
Figure S.25. PCA plot of 9 discriminatory peaks (0 vs. 30 vs. 120) in the delayed storage
study (amino acid analysis by LC-MS). The 0 and 120 min-clusters are clearly separated
from each other, with the 30 min cluster overlapping with both the 0 and 120 min-clusters.
This can also be seen in the box-plots (Figure 2), where the 30 min-group shows a larger
standard deviation than the 0 and 120 min-groups.

Supplementary material chapter 4 Appendix 2
168
Appendix 2
Supplementary material Chapter 4
Table S.1. Identification information for the discriminatory proteins detected by the QTOF method
AC
nr.
ID
# p
ep
tid
es
Seq
ue
nce
co
vera
ge
(%)
Pep
tid
e
seq
ue
nce
m/z
Ch
arg
e
RT
(m
in)
Ph
en
yx
sco
re
P36953 Afamin 3 6 IANDAIQDMLCDMK 819,372 2 62,6 11,90
AAPQLPMEELVSLSK 806,936 2 66,3 10,69
FLVNLVK 416,769 2 53,9 6,13
P14046 Alpha 1 inhibitor 3 8 9 NLHPLNELFPLAYIEDPK 708,377 3 73,9 11,59
LTAQPAPSPEDLALSMGTIK 1020,534 2 61,6 14,29
GDPIPNEQVLIK 661,872 2 48,6 8,74
YNVPLEK 431,736 2 36,8 6,56
ALMAYAFALAGNQEK 533,275 3 62,1 10,87
ISLCHGNPTFSSETK 559,934 3 39,9 9,47
QQNSYGGFSSTQDTVVALDALSK 806,057 3 59,4 16,34
LVDIKGDPIPNEQVLIK 631,033 3 55,3 10,84
P02764 Alpha 1 acid glycoprotein 2 8 IFAHLIVLK 351,900 3 55,4 9,19
GLSFYAK 393,216 2 40,9 6,12
Q63041 Alpha 1 macroglobulin 8 7 GVVSFPIR 437,757 2 50,0 6,60
LSPQSIYNLLPQK 500,953 3 62,3 12,45
DTVVKPVIVEPEGIEK 584,667 3 48,4 12,95
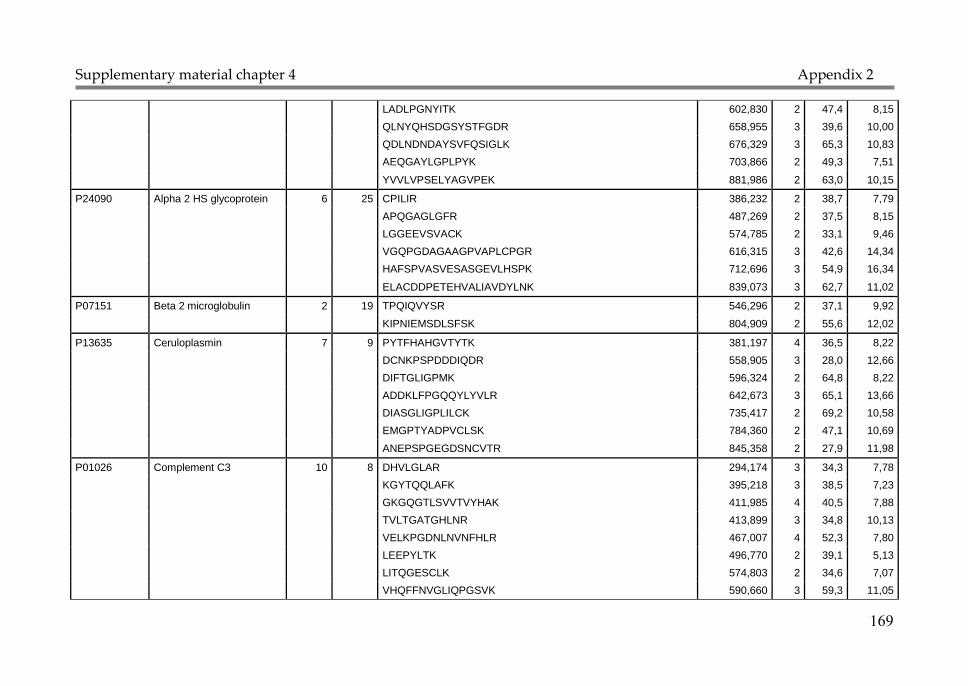
Supplementary material chapter 4 Appendix 2
169
LADLPGNYITK 602,830 2 47,4 8,15
QLNYQHSDGSYSTFGDR 658,955 3 39,6 10,00
QDLNDNDAYSVFQSIGLK 676,329 3 65,3 10,83
AEQGAYLGPLPYK 703,866 2 49,3 7,51
YVVLVPSELYAGVPEK 881,986 2 63,0 10,15
P24090 Alpha 2 HS glycoprotein 6 25 CPILIR 386,232 2 38,7 7,79
APQGAGLGFR 487,269 2 37,5 8,15
LGGEEVSVACK 574,785 2 33,1 9,46
VGQPGDAGAAGPVAPLCPGR 616,315 3 42,6 14,34
HAFSPVASVESASGEVLHSPK 712,696 3 54,9 16,34
ELACDDPETEHVALIAVDYLNK 839,073 3 62,7 11,02
P07151 Beta 2 microglobulin 2 19 TPQIQVYSR 546,296 2 37,1 9,92
KIPNIEMSDLSFSK 804,909 2 55,6 12,02
P13635 Ceruloplasmin 7 9 PYTFHAHGVTYTK 381,197 4 36,5 8,22
DCNKPSPDDDIQDR 558,905 3 28,0 12,66
DIFTGLIGPMK 596,324 2 64,8 8,22
ADDKLFPGQQYLYVLR 642,673 3 65,1 13,66
DIASGLIGPLILCK 735,417 2 69,2 10,58
EMGPTYADPVCLSK 784,360 2 47,1 10,69
ANEPSPGEGDSNCVTR 845,358 2 27,9 11,98
P01026 Complement C3 10 8 DHVLGLAR 294,174 3 34,3 7,78
KGYTQQLAFK 395,218 3 38,5 7,23
GKGQGTLSVVTVYHAK 411,985 4 40,5 7,88
TVLTGATGHLNR 413,899 3 34,8 10,13
VELKPGDNLNVNFHLR 467,007 4 52,3 7,80
LEEPYLTK 496,770 2 39,1 5,13
LITQGESCLK 574,803 2 34,6 7,07
VHQFFNVGLIQPGSVK 590,660 3 59,3 11,05

Supplementary material chapter 4 Appendix 2
170
SGIPIVTSPYQIHFTK 596,661 3 58,6 9,40
SDVDEDIIPEEDIISR 922,941 2 55,8 11,68
Q9QX79 Fetuin B 4 20 LVVLPFPGK 485,309 2 57,6 6,85
DGYMLTLNR 541,770 2 47,5 8,72
KIHSMCPDCPHPVDLSAPSVLEAATESLAK 652,925 5 64,7 9,42
IHSMCPDCPHPVDLSAPSVLEAATESLAK 783,874 4 66,5 12,67
P06866 Haptoglobin 4 14 GAVSPVGVQPILNK 460,267 3 48,3 8,16
GSFPWQAK 460,737 2 46,5 5,68
ATDLKDWVQETMAK 545,940 3 58,4 11,15
DIAPTLTLYVGK 645,873 2 56,9 8,88
P20059 Hemopexin 12 35 GPDSVFLIK 488,279 2 52,0 6,05
WKNPVTSVDAAFR 497,597 3 53,8 11,39
GATYAFSGSHYWR 501,567 3 47,9 10,84
VDGALCLEK 502,759 2 37,6 6,82
YYCFQGNK 540,237 2 34,3 7,82
CNADPGLSALLSDHR 542,596 3 51,9 13,73
WFWDFATR 564,767 2 69,9 8,76
RLWWLDLK 565,329 2 65,4 6,95
SGAQATWAELSWPHEK 599,956 3 55,5 11,29
GECQSEGVLFFQGNRK 619,295 3 49,0 8,55
ELGSPPGISLDTIDAAFSCPGSSK 802,723 3 66,9 17,79
LFQEEFPGIPYPPDAAVECHR 824,726 3 62,6 14,39
P20760 IgG 2A chain C 4 14 SVSELPIVHR 379,553 3 41,2 6,42
TKDVLTITLTPK 443,939 3 50,4 9,85
DVLTITLTPK 550,831 2 54,0 8,94
VNSGAFPAPIEK 615,330 2 42,4 9,64
P00697 Lysozyme C1 4 38 DLSGYIR 412,221 2 41,0 6,19
AWVAWQR 458,744 2 48,0 6,08

Supplementary material chapter 4 Appendix 2
171
NYNPGDQSTDYGIFQINSR 730,336 3 54,0 15,97
NACGIPCSALLQDDITQAIQCAK 849,741 3 66,0 12,50
Q03626 Murinoglobulin 1 10 8 VLIVEPEGIKK 408,925 3 43,2 7,18
NLQPAIVK 441,774 2 36,3 6,37
QQPAFALK 451,760 2 39,8 6,24
SSGSLFNNAMK 578,281 2 43,0 10,31
DMGLTAFTNLK 605,811 2 58,0 9,82
YMVLVPSQLYTETPEK 633,326 3 60,4 11,63
VTASPQSLCGLR 644,837 2 41,9 10,38
VQTVPLTCNNPK 685,858 2 35,0 10,97
QSGVKEEHSFTVMEFVLPR 555,784 4 62,4 9,15
QLSFSLSAEPIQGPYK 882,960 2 58,8 12,13
Q6IE52 Murinoglobulin 2 3 3 MLIYTILPDGEVIADSVK 659,693 3 67,2 12,44
HAEAHHTAYAVYSLSK 446,974 4 36,2 10,46
GEAFTLK 383,211 2 37,8 5,14
P09006 Serine protease inh. A3N 4 13 GFGHLLQR 309,845 3 40,7 8,53
MQQVEASLQPETLR 543,947 3 45,7 9,53
AVLDVAETGTEAAAATGVK 591,979 3 50,0 15,76
DSLRPSMIDELYLPK 592,983 3 60,5 12,54
P01048 T-Kininogen 1 6 17 KDGAETLYSFK 420,217 3 42,0 8,34
SAHSQVVAGMNYK 464,563 3 33,0 11,58
LLNSCEYK 513,751 2 31,0 5,82
DGAETLYSFK 565,773 2 46,0 8,40
FSVATQICNITPGKGPK 606,658 3 49,0 11,51
YNAELESGNQFVLYR 901,941 2 54,0 11,86
P08932 T-kininogen 2 7 29 SAHSQVVAGMNYK 464,564 3 33,3 11,58
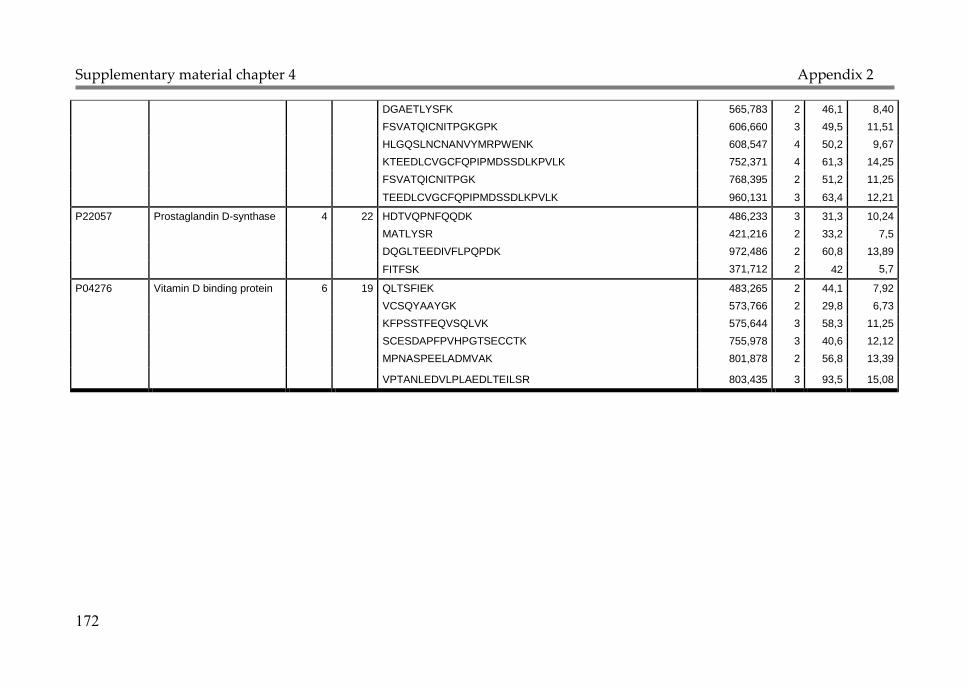
Supplementary material chapter 4 Appendix 2
172
DGAETLYSFK 565,783 2 46,1 8,40
FSVATQICNITPGKGPK 606,660 3 49,5 11,51
HLGQSLNCNANVYMRPWENK 608,547 4 50,2 9,67
KTEEDLCVGCFQPIPMDSSDLKPVLK 752,371 4 61,3 14,25
FSVATQICNITPGK 768,395 2 51,2 11,25
TEEDLCVGCFQPIPMDSSDLKPVLK 960,131 3 63,4 12,21
P22057 Prostaglandin D-synthase 4 22 HDTVQPNFQQDK 486,233 3 31,3 10,24
MATLYSR 421,216 2 33,2 7,5
DQGLTEEDIVFLPQPDK 972,486 2 60,8 13,89
FITFSK 371,712 2 42 5,7
P04276 Vitamin D binding protein 6 19 QLTSFIEK 483,265 2 44,1 7,92
VCSQYAAYGK 573,766 2 29,8 6,73
KFPSSTFEQVSQLVK 575,644 3 58,3 11,25
SCESDAPFPVHPGTSECCTK 755,978 3 40,6 12,12
MPNASPEELADMVAK 801,878 2 56,8 13,39
VPTANLEDVLPLAEDLTEILSR 803,435 3 93,5 15,08
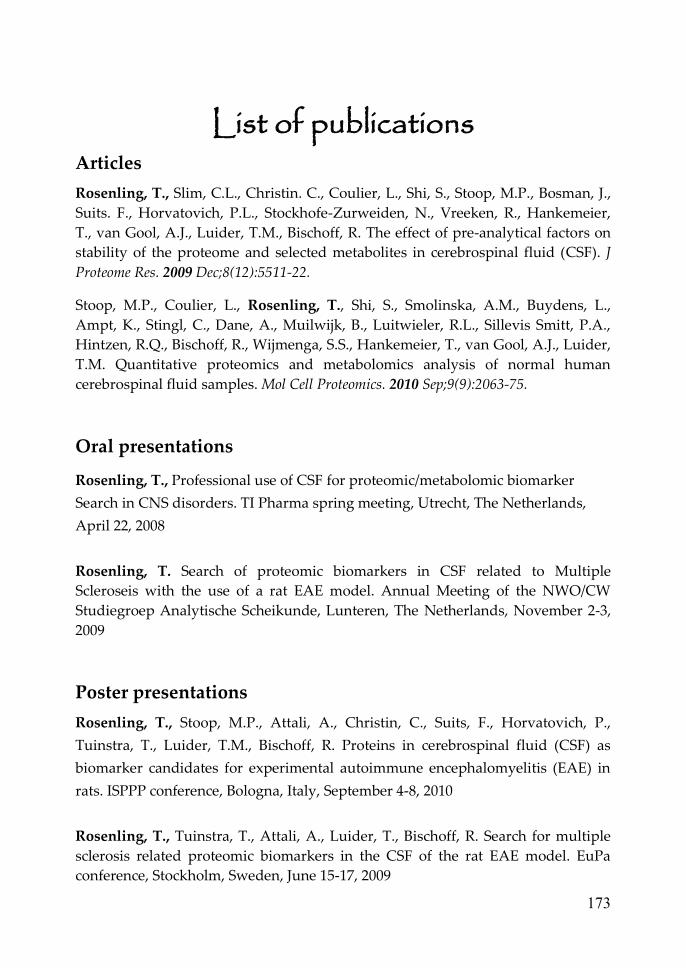
Appendix 2
173
List of publications Articles
Rosenling, T., Slim, C.L., Christin. C., Coulier, L., Shi, S., Stoop, M.P., Bosman, J.,
Suits. F., Horvatovich, P.L., Stockhofe-Zurweiden, N., Vreeken, R., Hankemeier,
T., van Gool, A.J., Luider, T.M., Bischoff, R. The effect of pre-analytical factors on
stability of the proteome and selected metabolites in cerebrospinal fluid (CSF). J
Proteome Res. 2009 Dec;8(12):5511-22.
Stoop, M.P., Coulier, L., Rosenling, T., Shi, S., Smolinska, A.M., Buydens, L.,
Ampt, K., Stingl, C., Dane, A., Muilwijk, B., Luitwieler, R.L., Sillevis Smitt, P.A.,
Hintzen, R.Q., Bischoff, R., Wijmenga, S.S., Hankemeier, T., van Gool, A.J., Luider,
T.M. Quantitative proteomics and metabolomics analysis of normal human
cerebrospinal fluid samples. Mol Cell Proteomics. 2010 Sep;9(9):2063-75.
Oral presentations
Rosenling, T., Professional use of CSF for proteomic/metabolomic biomarker
Search in CNS disorders. TI Pharma spring meeting, Utrecht, The Netherlands,
April 22, 2008
Rosenling, T. Search of proteomic biomarkers in CSF related to Multiple
Scleroseis with the use of a rat EAE model. Annual Meeting of the NWO/CW
Studiegroep Analytische Scheikunde, Lunteren, The Netherlands, November 2-3,
2009
Poster presentations
Rosenling, T., Stoop, M.P., Attali, A., Christin, C., Suits, F., Horvatovich, P.,
Tuinstra, T., Luider, T.M., Bischoff, R. Proteins in cerebrospinal fluid (CSF) as
biomarker candidates for experimental autoimmune encephalomyelitis (EAE) in
rats. ISPPP conference, Bologna, Italy, September 4-8, 2010
Rosenling, T., Tuinstra, T., Attali, A., Luider, T., Bischoff, R. Search for multiple
sclerosis related proteomic biomarkers in the CSF of the rat EAE model. EuPa
conference, Stockholm, Sweden, June 15-17, 2009
Appendix 2
174
Rosenling, T., Slim, C., Bosman, J., Christin, C., Gool, A. van, Horvatovich, P.,
Bischoff, R. Protein stability in cerebrospinal fluid (CSF): Analysis of the proteome
profile by chip-LC-MS. Keystone Symposia: Multiple Sclerosis, Santa Fe, New
Mexico, USA, January 22-25, 2009
Rosenling, T., Slim, C., Bosman, J., Christin, C., Gool, A. van,
Horvatovich, P., Bischoff, R. Protein stability in cerebrospinal fluid (CSF): Analysis
of the proteome profile by chip-LC-MS. Keystone Symposia: Multiple Sclerosis,
Santa Fe, New Mexico, USA, January 22-25, 2009
Awards
Poster prize winner at the TI Pharma spring meeting 2010, Utrecht, The
Netherlands. (Travel grant of € 2500 to visit the FIP Pharmaceutical Sciences
World Conference in New Orleans, LA, USA)

Appendix 2
175
Acknowledgements Looking back to the last four years, I have lots of great memories, moments of joy
but also moments of hard work. These memories were created together with the
people around me. I have not made the journey alone, I did it togetherwith my
friends, family and colleagues. I would herewith like to express my
acknowledgements to those.
To start with, I would like to thank Prof. dr. Rainer Bischoff, my promotor and
supervisor, for guiding me into becoming a researcher. You always stayed
positive, enthousiastic and full of ideas, and in this way, inspiring me. Thank you
also, for showing me appreciation for my work.
Thanks also to Prof. dr. Sabeth Verpoorte for being a good support foremost
during my first years. Especially I would like to thank you for accepting me as a
student in your group in 2006 and in this way opening the way to my new life in
Groningen. I also would like to thank you for being part of the reading committee.
Next, I would like to thank Prof. dr. Peter Bergsten, you were the driving force
behind getting me to Groningen in the first place. I am very greatful for the fact
that you took me under your wings in the beginning of 2006. You inspired me a
lot with your open and positive attitude.
Thanks to Prof. dr. Sybren Wijmenga and Prof. dr. Jan Maarten van Dijl, who were
also part of the reading committee, for taking the time to evaluating my thesis.
Thanks to the people in the TIPharma consortium. Dr. Alain van Gool, thank you
for being a great project leader, encouraging me and giving me appreciation, Dr.
Theo Luider, you were also a good project leader, keeping a positive attitude. Also
thanks to all the other colleagues in the TIP consortium; Dr. Robert-Jan Lamers,
Shanna Shi, Agnieszka Smolinska, Dr. Marek Noga, Dr. Macel Stoop, Dr. Amos
Attali, Dr, Lionel Blanchet, Dr. Leon Coulier, Dr. Tinka Tuinstra, Prof. dr. Thomas
Hankemeier, Prof. dr. Sybren Wijmenga and Prof. dr. Lutgarde Buydens, you
were all great collaborators and we had many good discussions together.
Thanks to all colleagues at the Analytical Biochemistry group. I have spent many
hours together with you and I have enjoyed your company. I feel very blessed to
have had such great people around me at my work, I always felt at home in the
group, everyone have been so helpful and friendly, and there was no competition

Appendix 2
176
between us. Laurette and Lorenza, my office mates and friends, thanks for all fun
and the support, keep up the spirit, soon it’s your time! Thanks Christin and Peter
for your help with the dataprocessing and for being great friends. Nicolas,
Krisztina, Jos, Jan and Natalia, thanks for the help with work in the lab. Eslam,
Julien, Ishtiaq, and Vikram thank you for the nice lunches, and friendship. Thank
you Andries, Hjalmar, Margot and Annie for help with mass spectrometry-related
issues. Thank you to my super-students; Christiaan and Balaji, I really enjoyed to
be your supervisor. I am also happy to have learned to know the new members of
the group; Karin, Hanna and Sara, you are great as well. Jolanda, thank you for all
help with everything between heaven and earth. Also thanks to Theo and Ramses,
my office-mates during my first year.
I would like to thank all members of the Pharmaceutical Analysis group; Byeong-
Ui, L-J, Paul, Patty, Harm, Laurent, Corry, Maurits and Heiko, you also helped to
spread the good feeling at work and I enjoyed chatting with you in the corridor or
at the borrels, Maria; you are a happiness injection that spread good feelings,
thanks for being a good friend.
Thanks to my paranymphs. Abdou, my homie, you became my best friend from
day one, and you still are. Berend, thanks for your help with all the computer
issues and for being my friend. Thanks both of you for joining me as paranymphs,
by my side at the defence.
Thank you also Arnold, Alice, Wiktor, Yuli and Valentina, you meant a lot to me
during my time in Groningen, you are great.
Jimmy, tack för att du flyttade med mig till Holland och tack för tiden vi hade
tillsammans. Tack också till mina vänner i Sverige, för allt kul vi haft tillsammans
på somrar och jullov; Björn, Jonas, Jenny & Joel, Jenkan och Ebbe.
Bedankt naar de Voortman familie voor alle steun en interesse dat jullie heb gehad
voor mijn werk, dank jullie wel voor nemen me in als een deel van jullie familie. Ik
voel me t’huis bij jullie. Bedankt ook Theo, Meine en Patrick voor leuke tijden in
de achterhoek.
Tack till alla släktingar som visat intresse för mitt liv i Holland och mina
komlicerade experiment, för att nämna några, Anne-Maj, Gunna och Åke, Karl-
Erik och Ulla, Maggan och Tony, Maja, Gun-Britt och Jan, tack.

Appendix 2
177
Kära mor och far, under min tid i Groningen, har vi varit långt från varandra men
ni finns alltid i mitt hjärta och jag tänker på er. Jag är glad att jag har en så fin
familj. Tack för att jag har fått en uppväxt som gjort mig till en stark och
självständig människa, och tack för att ni har gett mig friheten att tänka själv och
välja min egen väg, jag har aldrig känt mig tvingad in i något. Tack för att ni gjort
långa resor hit för att hälsa på mig. Och tack för att ni alltid funnits där för mig i
goda som svåra tider. Man kan alltid räkna med er. Tobias, Beatrice och Robert, ni
är de bästa syskonen man kan ha, tack för fina stunder tillsammans, tack för era
besök och tack för att ni finns till. Tack till hela familjen för all kärlek och omtanke.
Woutis, my dear, I am very greatful that you came my way and I am very happy
to share my life with you. You have been a great support in good and bad times,
you give me so much love and appreciation, I know it was not always easy to
handle all the stress my work brought, especially the last years. I will make it up
to you. I really appreciate all you have done for me. Together with you I can look
into the future. I hope we will stay together for the rest of out lives. Jag älskar dig!
Concludingly I would like to thank everyone that crossed my road in one or
another way during the last four years, no one is forgotten you made a difference
and you are all appreciated.