Protein Structure, Stability, and Folding
24
Hydrogen Exchange 69 69 From: Methods in Molecular Biology, vol. 168: Protein Structure, Stability, and Folding Edited by: K. P. Murphy © Humana Press Inc., Totowa, NJ 4 Measuring the Conformational Stability of a Protein by Hydrogen Exchange Beatrice M. P. Huyghues-Despointes, C. Nick Pace, S. Walter Englander, and J. Martin Scholtz 1. Introduction Measuring the conformational stability of a protein is one key to solving the protein folding problem. It is also of practical impor- tance for answering questions such as these: 1. How stable is a protein under physiological conditions? 2. How does the stability depend on temperature, pH, and salt concentration? 3. Can the stability be increased by osmolytes? 4. Can the stability be increased by ligands that bind the native state? 5. Does an amino-acid substitution increase or decrease the stability? Thus, reliable techniques for measuring the conformational stabil- ity of proteins are essential. In this chapter, we briefly review the traditional methods that have been used to measure the conforma- tional stability of a protein, and describe in more detail how the conformational stability can be measured using hydrogen-exchange rates as monitored by nuclear magnetic resonance (NMR).
Transcript of Protein Structure, Stability, and Folding
Hydrogen Exchange 69
69
From: Methods in Molecular Biology, vol. 168: Protein Structure, Stability, and FoldingEdited by: K. P. Murphy © Humana Press Inc., Totowa, NJ
4
Measuring the Conformational Stabilityof a Protein by Hydrogen Exchange
Beatrice M. P. Huyghues-Despointes, C. Nick Pace,S. Walter Englander, and J. Martin Scholtz
1. Introduction
Measuring the conformational stability of a protein is one key tosolving the protein folding problem. It is also of practical impor-tance for answering questions such as these:
1. How stable is a protein under physiological conditions?2. How does the stability depend on temperature, pH, and salt
concentration?3. Can the stability be increased by osmolytes?4. Can the stability be increased by ligands that bind the native state?5. Does an amino-acid substitution increase or decrease the stability?
Thus, reliable techniques for measuring the conformational stabil-ity of proteins are essential. In this chapter, we briefly review thetraditional methods that have been used to measure the conforma-tional stability of a protein, and describe in more detail how theconformational stability can be measured using hydrogen-exchangerates as monitored by nuclear magnetic resonance (NMR).

70 Huyghues-Despointes et al.
2. Determining Protein Conformational Stability
The conformational stability is defined as the free-energy changeof the unfolding reaction, F U, under ambient conditions (gener-ally around room temperature and neutral pH): GU = GU – GF. Itcan be evaluated using the relationship GU = –RT ln KU, where KU
is the equilibrium constant of the unfolding reaction. Measuring theconformational stability and changes in stability of proteins that dif-fer slightly in structure helps to define the forces that determine theconformations of proteins and optimize their stabilities. The stabil-ity of the folded conformation is a delicate balance between com-pensating forces: favorable hydrophobic, van der Waals, andhydrogen-bonding interactions and unfavorable conformationalentropy. The result is that the folded protein is only marginally stable,generally 5–15 kcal/mol under native conditions (1).
A protein exists predominantly in the folded conformation underambient conditions, but rarely, as dictated by the Boltzmann rela-tionship, Pf/F = e- GU/RT, this conformation will unfold to partiallyunfolded or completely unfolded higher energy conformations (seeFig. 1). As a result, it is difficult to detect the unfolded conforma-tions and to directly measure KU under native conditions. In thetraditional methods, the conformational stability is extrapolatedfrom stabilities obtained under denatured conditions, while in thehydrogen-exchange experiments, conformational stability is deter-mined directly under native conditions.
2.1. Traditional Methods: Solvent and ThermalDenaturation
The most common way to estimate the conformational stabilityof a protein is to tilt the equilibrium to conditions where the foldedand unfolded states are almost equally populated, measure the sta-bility, and extrapolate to obtain the stability under native conditions.Traditional methods of measuring GU are solvent (urea orguanidinium chloride [GdmCl] or thermal denaturation (see Fig. 2) (2).Solvent denaturation curves are generally analyzed using the linearextrapolation method (LEM):

Hydrogen Exchange 71
G = GU(H2O) – m[denaturant] (1)
where m is a measure of the dependence of G on denaturant, andGU(H2O) is an estimate of the conformational stability that
assumes that the linear dependence of G on denaturant observedin the transition region continues to 0 M denaturant. Thermal dena-turation experiments yield the melting temperature, Tm, the enthalpychange at Tm, Hm, and the heat-capacity change, Cp, which canthen be used to calculate GU at any temperature T, GU(T), withthe Gibbs-Helmholtz equation:
GU(T) = Hm(1– T/Tm) + Cp[T – Tm – T ln (T/Tm)] (2)
The equilibrium between the folded and unfolded states can bemonitored by calorimetry (3), or by using spectroscopic techniquessuch as UV absorbance spectroscopy, fluorescence, and circulardichroism that monitor the changes in conformational states of aprotein (4).
Fig. 1. An energy manifold of states at 25°C for a protein havingGU = 10 kcal/mol, including the folded (F) and unfolded (U), and par-
tially unfolded states (Pi).

72 Huyghues-Despointes et al.
There are several problems with these techniques. Traditionalmethods are usually unable to detect unfolded forms under ambientconditions because their concentrations are far too low. These meth-ods for determining the conformational stability also depend onsome basic limiting assumptions. First, they require that the foldingtransition of a protein be fully reversible, with a known and finitenumber of observable states. Above, we show the simplest example—a two-state mechanism—but the models can be expanded for analysisof multimeric protein systems or proteins that fold by mechanismswith intermediate states (5).
Fig. 2. (A) The inset shows a typical urea unfolding curve for a smallmonomeric protein. The data in the transition region can be extrapolatedto determine GU(H2O) using the LEM (Eq. 1).

Hydrogen Exchange 73
Second, both methods require a long extrapolation from unfold-ing to ambient conditions. The LEM assumes that the dependenceon denaturant can be extended linearly to the absence of denaturant.This may not always occur, especially for GdmCl, a salt that canalter the stability of a protein at low denaturant concentrationsthrough an ionic strength effect (see ref. 6 and references therein).For thermal denaturation, the extrapolation from higher tempera-tures to ambient temperatures requires an accurate value of Cp. Atbest, Cp can be measured to approx ± 10% with calorimetry.
Fig. 2. (continued) (B) The inset shows a typical thermal unfolding curvefor a small mononmeric protein. The data in the transition region of a thermalunfolding curve can be extrapolated to obtain GU at a desired referencetemperature such as 25°C using the Gibbs-Helmholtz relationship (Eq. 2).

74 Huyghues-Despointes et al.
Finally, the unfolded states in denaturant or at high temperaturesmay not be thermodynamically equivalent to the unfolded statesunder ambient conditions.
2.2. The New Method: Hydrogen Exchange
When a protein is placed in D2O, amide hydrogens in the proteinbegin to exchange with deuterium. The rate of exchange of an amidedepends on its environment in the protein. An unprotected amideexchanges readily with the solvent. In contrast, an amide that isshielded from solvent by burial and/or hydrogen bonding canexchange only a small fraction of time when it unfolds to a higherenergy conformation that is exposed to solvent. The exchange of abackbone amide proton can occur by local fluctuations, such as thebreaking of only a few hydrogen bonds, or by a larger globalunfolding event. The result is that exchange rates of amide protonsin a protein vary widely, providing a clear view of the higher energyunfolded states under native conditions (see Fig. 1) (7).
We describe here a NMR technique that identifies amides thatexchange from the globally unfolded protein. Hydrogen-exchangemeasurements under fully native conditions can provide a directestimate of the conformational stability of a protein without havingto drive the protein through its macroscopic unfolding transition.This technique, which can measure the conformational stability of aprotein, may not be possible by traditional methods because foldingis irreversible or does not approach a two-or three-state foldingmechanism.
3. The Hydrogen-Exchange Process
3.1. The Rate Constants Governing Exchange
The exchange process can be described using a general two-stepmodel:
(N – H···O = C)cl (N – H)op N – D (3)kop
kcl
krc

Hydrogen Exchange 75
where kop and kcl are the rate constants for structural opening andclosing, respectively, and (N – H)op is the open form that exchangeswith solvent at the intrinsic rate constant krc, where rc stands forrandom coil (8,9). The second step is written as an irreversible reac-tion because of exchange with a vast excess of solvent D2O. Themeasurable rate constant kex = kopkrc/(kop + kcl + krc). If the proteinis present mainly in the open form (kop >> kcl), kex = krc. If the pro-tein is present mainly in the closed form (kop << kcl), then twomechanisms could potentially occur, depending on conditions,either as two distinct processes or in combination (10,11).
The EX1 exchange conditions (monomolecular exchange) existwhen kcl << krc, so that kex = kop. The EX2 exchange conditions (bimo-lecular exchange) exist when kcl >> krc, so that kex = Kopkrc, where Kop
is the equilibrium constant for structural opening (kop/kcl). Thus, underEX2 conditions, the free energy of structural opening is given by:
GHX = – RT ln (kex/krc). (4)
One expects a subset of the GHX values to generally represent thecomplete unfolding reaction; thus, it has been proposed that theaverage of the three largest GHX values calculated using Eq. 4provides a reasonable estimate of the conformational stability of aprotein (12).
3.2. The krc Values from Model Peptides
Exchange from the open form depends on krc. The krc value canbe approximated by the chemical exchange rates of amide groups innonstructured peptides. The rate constants in short (1–5 amino acidslong) peptides and in poly-DL-alanine (PDLA) have been measured(9,13,14). The results show that exchange-rate constants of back-bone amide protons are dependent on pH, temperature, identity ofneighboring side-chain residues in the sequence, solvent isotopeeffects, and small ionic strength effects. The exchange-rate con-stants for alanine-based reference peptides at low ionic strengthsand 20°C are shown in Table 1.

76 Huyghues-Despointes et al.
The NH to ND chemical exchange process can be acid (kH), base(kOH), or water catalyzed (kW), yet the latter generally makes only anegligible contribution:
Krc = kA 10–pD + kB 10[pD–pKD] + kW (5)
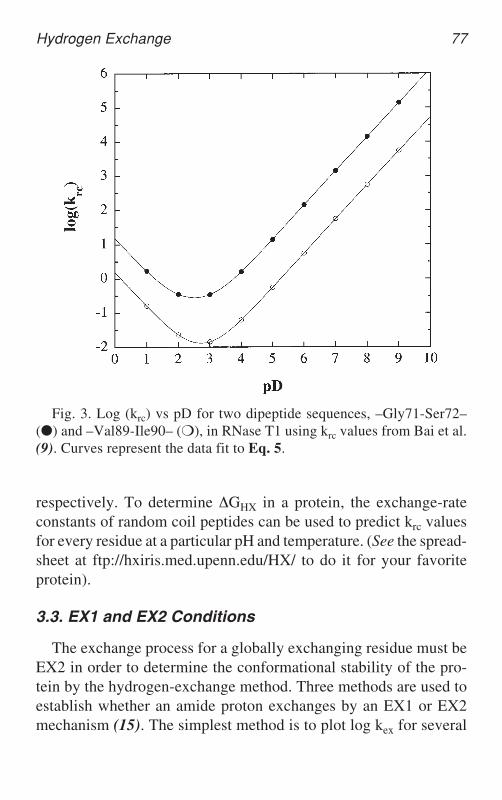
where pD is the corrected reading in D2O (see below) and pKD isthe molar ionization constant of D2O. The rate of exchange of abackbone amide reaches a minimum near pH ~ 3 and increases sub-stantially at both pH extremes, by a factor of 10 per pD unit (Eq. 5).The chemical exchange rate of amide proton of residue i in asequence is affected by its own side chain and the side chain ofresidue i–1. For example, we show in Fig. 3 for two dipeptidesequences in RNase T1 that krc can vary by 20-fold. Fig. 3 alsoillustrates the dependence of krc on pH.
The intrinsic rate of exchange can also change with temperature. Therate constant for the acid-catalyzed exchange can be modified by:
kA(T) = kA(293 K) e(–Ea[1/T – 1/293]/R) (6)
where the activation energy, Ea(kH) = 14 kcal/mol. Analogousexpressions can be made for the base- and water-catalyzed exchangein Eq. 5, where Ea(kOH) = 17 kcal/mol, and Ea(kW) = 19 kcal/mol,
Table 1H to D Exchange Rate Constantsfor Alanine-Based Models at 293 Ka
log kA log kB log kWModel (M–1 min–1) (M–1 min–1) (min–1)
N-Ac-A-A-A-N MAb 2.04 10.36 –1.5PDLAc 1.62 10.05 –1.5
aThese values are specific for NH to ND exchange under normal low saltconditions, using pD = pH* + 0.4 and pKa = 15.05 for the D2O at 20°C. Thesedata are from Table 3 in Bai et al. (9).
bL-alanine tripeptide blocked by N-acetyl at N-terminus and N -methylamideat C-terminus.
cpoly-DL-alanine.
Hydrogen Exchange 77
respectively. To determine GHX in a protein, the exchange-rateconstants of random coil peptides can be used to predict krc valuesfor every residue at a particular pH and temperature. (See the spread-sheet at ftp://hxiris.med.upenn.edu/HX/ to do it for your favoriteprotein).
3.3. EX1 and EX2 Conditions
The exchange process for a globally exchanging residue must beEX2 in order to determine the conformational stability of the pro-tein by the hydrogen-exchange method. Three methods are used toestablish whether an amide proton exchanges by an EX1 or EX2mechanism (15). The simplest method is to plot log kex for several
Fig. 3. Log (krc) vs pD for two dipeptide sequences, –Gly71-Ser72–(●) and –Val89-Ile90– (❍), in RNase T1 using krc values from Bai et al.(9). Curves represent the data fit to Eq. 5.
78 Huyghues-Despointes et al.
amide protons at two different pH values above pH 4.0 and in a pHregion where the stability of the protein changes as little as possible.For the EX2 process, the hydrogen-exchange rates for each NHgroup should change by 10-fold, with a one-unit change in pH,showing the expected pH dependence on krc (see Fig. 3). In the EX1process, kex depends only on kop, which is likely to be less depen-dent on pH. As a result, we would observe little to no rate variationwith pH in the EX1 regime.
Another test of EX2 vs EX1 kinetics uses the nuclear Overhausereffect (NOE) (15–18). We can measure a decrease in the NOEintensity between two adjoining residues as hydrogen-exchangeprogresses. In the EX1 limit, two amide protons will exchange atthe same rate, so that the decay rate of the NOE will be equal to theexchange rate of a single amide proton. Conversely, in the EX2limit, two amide protons will exchange independently and oftenwith different chemical exchange rates. Therefore, the decay rate ofthe NOE will be the sum of the exchange rates of the two adjoiningamide protons. This method is often arduous, and errors in mea-surement can be significant (15).
A third method is simply to compare the GHX values for neigh-boring amide groups with their corresponding krc values. In an EX2process, the same GHX values are likely to have widely differentkrc values. The opposite holds true for the EX1 process.
3.4. GHX for Measurable Amide Protons
The hydrogen-exchange technique provides a glimpse into thedistribution of unfolded conformations at native conditions.Exchange of an amide proton with solvent deuterium occurs onlythrough exchange-competent, higher-energy forms. The amidegroups that are most protected from exchange have the largest sta-bilities and may be limited to exchange only from the fully unfoldedstate (“global”). Residues with intermediate and low stabilities (orprotection) exchange by either fluctuations in the native state(“local”) or by partial unfolding (“subglobal”). Here, we describean NMR technique that identifies only the global-exchanging resi-

Hydrogen Exchange 79
dues. Monitoring hydrogen exchange in response to externalperturbants, such as temperature, solvent denaturants (19–25) orpressure (26), can help to decipher the exchange processes of localand subglobal amide groups.
Hydrogen-exchange studies with mutant proteins have also beenperformed where the change in stability upon mutation, GHX, canbe obtained by:
GHX = ( GHX)WT – ( GHX)mutant = –RT ln(kex)WT/(kex)mutant (7)
The krc values for all residues cancel in Eq. 7, except for the muta-tion site and the residue C-terminal to the site of the mutation. Theresidues that exchange by global unfolding will have GHX valuessimilar to the values determined by the traditional methods. Unfor-tunately, there can also be nonglobal residues that have GHX val-ues equal to or even greater than GU (27). Additional experimentsthat monitor the effect of an external perturbant on the hydrogen-exchange stabilities are required to decipher the stability patterns ofnonglobal residues. As a result, hydrogen-exchange studies withmutant proteins cannot in themselves determine the residues thatunfold globally.
4. The NMR Experiment
4.1. Establishing Experimental Conditions
The hydrogen-exchange experiment by NMR entails monitoringthe decay of individual proton resonances over time as theyexchange with solvent deuterium. We assume that standard sequen-tial NMR assignment techniques have been used to identify amideresonances that persist upon the addition of deuterium. Normally,the overcrowding of proton resonances in a protein limits the use-fulness of 1D proton spectra. Instead, popular two-dimensionalexperiments have been used, such as proton-detected magnitude-mode Correlation Spectroscopy (COSY), and more recently,inverse-detected 15N Heteronuclear Single Quantum Coherrence(HSQC). For hydrogen exchange, the HSQC experiment provides
80 Huyghues-Despointes et al.
better resolution when observing the exchange of many exchange-able backbone amide groups in larger proteins (15–25 kDa), and inmost cases, HSQC spectra can be acquired in less time. The limita-tions to the heteronuclear approach are that the protein must be uni-formly labeled with 15N—usually by overproduction in bacteria,grown in minimal media where yields are generally reduced.15N-labeled precursors are expensive (although prices are steadilydecreasing), and some degree of technical expertise of the NMRhardware and software is required.
A positive attribute of measuring the conformational stability byhydrogen exchange is that only the exchange rates of the most stableNH groups must be determined. This simplifies assignments and inmost cases, simple 1D-proton spectra may be taken to collect thedata. The most stable amide resonances are usually the ones thatpersist over the longest time. Most other resonances disappear fromthe spectra by the time the most stable amide protons begin toexchange. However, caution must be exercised, because the moststable residue may not always be the slowest exchanging residue.As shown in Fig. 3 and Eq. 4, krc varies with sequence and canaffect the exchange time and the stability value of a residue. To besafe, the exchange of at least the 10 slowest exchanging amide pro-tons should be monitored.
It is important to establish the best pH and temperature condi-tions to monitor the decay of the most stable NH groups. The ran-dom coil rate of each residue and the stability of the protein playimportant roles in determining the best experimental conditions. Forexample, RNase T1 has a bell-shaped stability vs pH profile with astability maximum of ~13 kcal/mol near pH 5.0 and 25°C in D2O(28). If we monitor exchange at these conditions, the most stableresidues would not exchange for over 100 years! As a result, experi-mental conditions must be chosen to allow the data to be collectedin a reasonable amount of time. If we raise the pH or increase thetemperature for RNase T1, the exchange is considerably faster (pD7.7, 25°C—3–6 months, and 40°C—days). Another method toreduce the time of exchange at a desired experimental condition is

Hydrogen Exchange 81
to perform measurements at two or more concentrations of denatur-ant where the protein is still fully folded (the pretransition region ofFig. 2A), and extrapolate to the GHX in the absence of denaturantusing Eq. 1. With both these techniques, it is important to testwhether the exchange process is still in the EX2 regime. Conversely,if a protein is marginally stable, the temperature or the pH can bedecreased in order to observe the decay of the most stable amideprotons. Stabilities in a range of 4–10 kcal/mol can be measuredusing the hydrogen-exchange technique described here. A goodstarting point is to perform one-dimensional hydrogen-exchangeexperiments at several different conditions. If exchange is too slowor too fast, adjust the conditions until the most stable residues ex-change in a reasonable amount of time and by the EX2 process.
4.2. Sample Preparation
NMR samples are prepared by dissolving the protein in an H2Obuffered solution. A 0.5–2 mM solution of protein (0.5–1.0 mL) isrequired. The one-dimensional experiment needs less protein thanthe two-dimensional experiment. The pH of this solution should beequal to the desired pD of the deuterated NMR sample. The pD of asolution in D2O is the pH meter reading (pH*) plus 0.4 (pD = pH* +0.4) (29). Measuring the pH* of a deuterated solution is performedas follows:
1. Use appropriate standard pH buffers in H2O to calibrate your pHmeter, considering the effect of temperature on the buffers.
2. Allow the electrode to soak in D2O until the meter reading is steady(5–10 min).
3. Read the pH meter value of your sample (pH*) and make the appro-priate correction for pD.
It is important to ensure that the protein sample is fully dissolvedand at equilibrium before exchanging the H2O for D2O. If any par-ticulate remains, centrifuge the sample and place the solution in afresh Eppendorf tube. Buffers that are silent in the NMR experiment

82 Huyghues-Despointes et al.
should be used—such as phosphate that lacks protons or one such asacetate, which can be purchased inexpensively in a deuterated form.The sample can be exchanged into D2O by using a spin-column (Isolab,Inc.). The spin-column approach can be performed as follows:
1. Swell 1 g of G-25 resin in 10 mL of D2O for a minimum of 3 h.2. Remove fines by stirring and replacing with an equal vol of fresh
liquid (2–3 times), pour deuterated buffer onto the resin for the lastvolume exchange, and equilibrate for 10 min.
3. Pour the resin into the spin column (~3 mL) and wash the resin sev-eral times with 0.5–1.0 mL volumes of deuterated buffer, by spin-ning the column in a swinging bucket benchtop centrifuge at ~1000gfor 1-min intervals. Be sure to balance the rotor by using a dummycolumn with resin in it.
4. Exchange the protein solution in H2O with D2O by loading thesample in H2O onto the column and spinning the column for a 1-mininterval. The number of spins and the vol of sample added can beadjusted so that a final vol of recovered sample is ~ 0.7 mL andprotein yield is 80–90%. (After the experiment, if the protein is valu-able, one can rescue the rest of the protein left on the column byrinsing with several volumes of buffer.)
5. Immediately after exchange, transfer the solution to a NMR tube,and quickly adjust the pH* of your solution with NaOD or DCl if ithas changed. The pH* in the NMR tube can be measured using along, thin electrode from Ingold.
6. Place the sample in the NMR spectrometer with the probe tempera-ture set at the appropriate temperature, and acquire a data set.
7. Measure the pH* of the sample after the conclusion of the NMRdata set.
4.3. NMR Data and Analysis
NMR spectra must be collected over time. The NMR sampleshould be equilibrated in a water bath at the appropriate tempera-ture if the NMR data are not acquired in a single time period. Thespectra are processed by standard processing programs. The peakintensities for each residue can be measured either by peak heights (one-dimensional experiments) or by volume integration (two-dimensional

Hydrogen Exchange 83
crosspeaks). These measurements can fit to a single exponentialfunction, A = A0[e(–kext)] + C, where C is the baseline noise of aparticular spectra caused by residual water in the sample. With par-tial or completely overlapping peaks, the exchange data may be fitto a sum of exponentials, especially if rates for amide protons differby more than approximately threefold. The exchange rate should bemeasured only after the peak is approx 50% exchanged. The errorsin stability are the largest for residues whose hydrogen exchange ratesare either very fast or very slow. For a typical exchange experiment,two fold variations in the rate only affect GHX by 0.4 kcal/mol.
5. Comparison of GHX and GU
The measured hydrogen-exchange stabilities of the most stableresidues are generally higher than the conformational stabilitiesmeasured by urea and thermal denaturation, as shown for a varietyof proteins in Table 2. There are two main reasons for the discrep-ancies: solvent isotope effects and proline isomerization effects.
5.1. Solvent Isotope Effect
To compare denaturation and hydrogen-exchange experiments,the traditional techniques must be performed in D2O. At this time,we cannot predict whether a protein will be more or less stable inD2O than in H2O, since many factors affect the solvent isotope effectof a protein (30). We have ample evidence from data by Makhatadzeet al. (31), the review by Oas and Toone (30), and Huyghues-Despointes et al. (12) that GU values can differ by ± 0–2 kcal/molin H2O compared to D2O, and the difference may be dependent on pH.
5.2. Proline Isomerization Effect
Denatured states at native-state conditions in the hydrogen-exchange experiments differ from denatured states under equilib-rium unfolding conditions in traditional experiments. Most peptidebonds in a folded protein are in a trans conformation. Only 0.03%

84 Huyghues-Despointes et al.
Table 2Comparison of Conformational Stabilities Measuredby Hydrogen Exchange and Traditional Methodsa
No. of GHX GHX*Proline Residues (kcal/ (kcal/ GU(D2O)
Protein cis trans mol) mol) (kcal/mol)
RNase T1 2 2 10.7 8.2 7.9 (UDC)8.0 (TDC)
A21Gb 7.2 7.1 (UDC)G23Ab 7.1 7.0 (UDC)A21G+G23Ab 6.3 6.0 (UDC)
RNase A 2 2Mayo and Baldwin (10.2) 7.8 7.7 (DSC)Wang et al. 10.3 8.0 8.1 (DSC)Neira et al. 9.4 7.0 7.0 (DSC)
barnase 0 3 8.3 8.1 8.3 (DSC)CI2 0 5 7.6 7.1 7.0 (GDC)434 cro 0 2 4.0 3.9 3.7 (UDC)apocytochrome b562 0 4 5.5 5.3 5.0 (DSC)
3.3 (GDC)cytochrome c (equine) 0 4
Bai et al. (9.3) 9.0 9.1 (DSC)Foord and Leatherbarrow 6.4 6.1 6.1 (DSC)
cytochrome c (yeast) 0 4 6.8 6.5 6.4 (TDC)HEWL 0 2 12.4 12.2 11.7 (DSC)NTL9 0 1 4.8 4.7 4.7 (TDC+UDC)OMTKY3 1 2 8.2 7.2 7.2 (DSC)PPL 0 0 (6.9) 6.9 6.7 (TDC)
4.9 (GDC)HPr (Escherichia coli) 0 2 5.8 5.7 4.7 (UDC)src SH3 domain 0 2 6.2 6.1 4.7 (TDC)
4.7 (GDC)Barstar 0 2 6.2 6.0 5.0 (GDC)RNase H* (Escherichia coli) 1 4 (10.9) 9.3 9.9 (GDC)RNase H (T. thermophilus) 1 11 (15.8) 13.8 13.3 (GDC)CTXIIIc 5 6.6 6.3 6.0 (GDC)RNase Ad 2 2 11.8 9.6 9.2 (DSC)RNase Sae 1 5 8.9 7.3 7.5 (GDC)T4 lysozyme f 3 (17.7) 17.5 16.0 (GDC)SNaseg 2 4
Unligated 6.4 4.4 6.1 (UDC)Ligated (Ca2+ and pdTp) 8.2 6.2 7.4 (UDC)
SNaseh (Unligated) 2 4 ~ 6.4 ~ 4.5 4.0 (GDC)E75A ~ 4.4 ~ 2.5 2.0 (GDC)
(Continued)

Hydrogen Exchange 85
of the nonproline bonds and 5.2% of the proline bonds are in a cisconformation in folded proteins (32). Conversely, an unfolded pro-tein at equilibrium has nonproline bonds exclusively in the transconformation and 6–38% of the proline bonds in the cis conforma-tion, depending on the identity of the residue preceding proline. Thelatter values are based on data by Reimer et al. (33) on capped pen-tapeptides with 20 different amino acids at the Xaa-Pro position(see Table 3).
Transiently unfolded states under native conditions in the hydrogen-exchange experiments have the proline bonds in the same confor-mation as in the folded protein because the rate of refolding andhydrogen exchange is often much faster than the rate of proline
Table 2 (continued)
No. of GHX GHX*Proline Residues (kcal/ (kcal/ GU(D2O)
Protein cis trans mol) mol) (kcal/mol)
M26G ~ 4.4 ~ 2.5 2.3 (GDC)D77A ~ 4.1 ~ 2.2 3.1 (GDC)V23A ~ 3.4 ~ 1.5 2.2 (GDC)
aUnless otherwise indicated below, the specific conditions for each protein aregiven in the footnote to Table 1 in Huyghues-Despointes et al. (12). GHX is theaverage GHX value of the three most stable residues. GHX values in parentheseswere estimated by extrapolation of hydrogen exchange stabilities at higher denatur-ant concentrations (15). GHX* = GHX – Gpro. GU(D2O) is measured by theLEM (Eq. 1) using urea (UDC) or GdmCl (GDC) denaturation curves, or by theGibbs-Helmholtz equation (Eq. 2) using thermal denaturation curves (TDC) or dif-ferential scanning calorimetry (DSC).
bpD = 7.4 and 25°C (27).cCardiotoxin analog III. pD = 3.6 and 25°C (39).dpD = 6.4 and 25°C (40).epD = 5.9 and 30°C (D. Laurents, J.M. Pérez-Cañadillas, J. Santoro, M. Rico, D.
Schell, C. N. Pace, and M. Bruix, personal communication).fpD = 6.0 and 25°C (41).gpD = 5.9 and 37°C (42 and references therein). Lys-Pro117 is 91% cis and His-
Pro47 is 9% cis in the folded unligated protein. Lys-Pro117 is greater than 98% cisin the folded ligated protein.
hpD = 5.6 and 25°C (43).

86 Huyghues-Despointes et al.
isomerization (12). The protein typically spends less than 1 s in thetransiently populated unfolded state before all the amide protonsare exchanged. This is shown for the folding equilibrium of a pro-tein with a proline residue in the sequence:
Table 3Proline Isomerization Based on Ac-Ala-Xaa-Pro-Ala-Lys-NH2
a
Xaa % cisb KProUc RT ln (1+KPro
U)d RT ln (1 + 1/KProU)e
Pro 6.0 15.67 1.67 0.037Lys 6.8 13.71 1.59 0.042Arg 7.2 12.89 1.56 0.044Asp 7.3 12.70 1.55 0.045Ala 7.7 12.00 1.52 0.047Cys 8.7 10.49 1.45 0.054Glu 9.0 10.11 1.43 0.056Thr 9.4 9.64 1.40 0.058His(0)f 9.5 9.53 1.39 0.059Met 10.0 9.00 1.36 0.062Ser 10.3 8.71 1.35 0.064Val 10.4 8.62 1.34 0.065Gln 11.5 7.70 1.28 0.072Asn 11.6 7.62 1.28 0.073Leu 12.0 7.33 1.26 0.076Ile 12.0 7.33 1.26 0.076Gly 13.7 6.30 1.18 0.087His(+)g 16.5 5.06 1.07 0.107Phe 23.0 3.35 0.87 0.155Tyr 24.0 3.20 0.85 0.163Trp 37.7 1.65 0.58 0.280
aReplicated from Table 2 in Huyghues-Despointes et al. (12).bThe percentage of cis conformer measured at 23°C in 20 mM sodium phos-
phate at pH 6.0 (33). This value is relatively independent of temperature (38).cKPro is the equilibrium constant for cis trans isomerization of the indi-
cated Xaa-Pro residue.dCorrection in kcal/mol at 25°C (Eq. 10) for cis Xaa-Pro residues.eCorrection in kcal/mol at 25°C (Eq. 11) for trans Xaa-Pro residues.fMeasured at pH 8.0.gMeasured at pH 3.5.

Hydrogen Exchange 87
Fcis — Ucis — Utrans (8)
where Fcis and Ucis are the native and unfolded states with a Proresidue exclusively in the cis conformation. KU
pro is the equilibriumconstant for cis/trans proline isomerization in the unfolded state,and KHX is the equilibrium constant for folding exclusively in thecis conformation. The denatured states will have a higher freeenergy in the hydrogen-exchange experiments than under the tradi-tional unfolding experiments where the proline bonds reach cis/transequilibrium. GHX measures G for the first step in the equilib-rium, but GU measures G for both steps (15,34). The total differ-ence is the stability from proline isomerization in the folded andunfolded states:
Gpro = GHX – GU = RT ln (1 + KUpro)/(1 + KF
pro) (9)
The full expression (Eq. 9) must be used for proteins such as Sta-phylococcal nuclease (SNase) where two proline residues flipbetween cis and trans conformers in the folded state (see Table 2).
For most proteins, where the proline conformation is fixed in thenative conformation, the stability from proline isomerization causedby a cis proline in the native state can be reduced to:
GUpro = RT ln(1 + KU
pro) (10)
or using Eq. 8, a trans proline in the native state can be:
GUpro = RT ln(1 + 1/KU
pro) (11)
The GUpro values for a cis proline in the native state are more
than 1 kcal/mol, while GUpro for a trans proline are much smaller
(< 0.3 kcal/mol). Table 3 shows the GUpro values for cis and trans
proline conformers at 25°C. The total effect of proline isomeriza-tion is determined by summing GU
pro contributions for all cis andtrans proline residues in a protein. The conformation of a Xaa-Probond is detected by measuring the angle in the best NMR orX-ray crystal structure of a protein.
KHX KUpro

88 Huyghues-Despointes et al.
Until recently, it was commonly assumed that the proline bondwas approx 20% cis in the unfolded state at equilibrium for all Xaa-Pro residues in a protein. As a result, the stabilities of the most stableresidues were not always considered to exchange by global unfold-ing (see refs. 35–37), because these stabilities did not agree andwere often higher than the values from traditional methods.
6. Conclusion
If the corrections for the proline isomerization of the Xaa-Probond using values of Reimer et al. (33) are applied and if the tradi-tional experiments are performed in D2O, we find an excellentagreement between the corrected GHX and GU for most proteins(Table 1). This comparison leads to several important conclusions:
1. The most stable amide hydrogens generally exchange by globalunfolding.
2. The unfolded states that exist under native conditions are thermody-namically equivalent to those that exist after solvent or thermalunfolding.
3. Chemical exchange rates from short peptides can model well krc, theexchange-rate constant of the open conformation.
4. The equilibrium constants for proline isomerization in capped pen-tapeptides can be used to correct for the higher free energy of theunfolded states in the hydrogen-exchange experiments.
7. A Note on Nomenclature
In the literature, the nomenclature for describing the hydrogen-exchange process varies widely. Examples include defining thechemical exchange-rate constants as krc, kch, or kint, the hydrogen-exchange stabilities as GHX, GHD, or Gex, the conformationalstability as GU, GW, or G(H2O), the hydrogen-exchange pro-cess as HX, HD, or hydrogen exchange, and the pH meter readingof the experiment in D2O as pH*, pHread, or pD. In this chapter, allthese terms are defined as the following: the random coil rate as krc,the hydrogen exchange stabilities as GHX, the conformational sta-

Hydrogen Exchange 89
bility in 0 M denaturant as GU(D2O) in deuterated solvent andGU(H2O) in protonated solvent, the exchange process as hydro-
gen-exchange or HX, and the pH meter reading as pH*. In the future,for the purpose of clarity, it would be advisable to universally adoptthe same nomenclature, and we suggest that the nomenclaturedefined here would serve this purpose.
Acknowledgment
Work in the authors’ laboratories is supported by the NationalInstitutes of Health (J. M. Scholtz, C. N. Pace, and S. W. Englander)and the Robert E. Welch Foundation (J. M. Scholtz and C. N. Pace).
References
1. Pace, C. N., Shirley, B. A., McNutt, M., and Gajiwala, K. (1996)Forces contributing to the conformational stability of proteins.FASEB J. 76, 75–83.
2. Pace, C. N. (1975) The stability of globular proteins. CRC Crit. Rev.Biochem. 3, 1–43.
3. Freire, E. (1995) Thermal denaturation methods in the study of pro-tein folding. Methods Enzymol. 259, 144–168.
4. Pace, C. N. and Scholtz, J. M. (1997) Measuring the conformationalstability of a protein, in Protein Structure. A Practical Approach,(Creighton, T. E., ed.), Oxford University Press Inc., New York, NY,pp. 299–321.
5. Jaenicke, R. (1987) Folding and association of proteins. Prog.Biophys. Mol. Biol. 49, 117–237.
6. Makhatadze, G. I. (1999) Thermodynamics of protein inter-actions with urea and guanidinium hydrochloride. J. Phys. Chem. 103,4781–4785.
7. Chamberlain, A. K. and Marqusee, S. (1997) Touring the landscapes:partially folded proteins examined by hydrogen exchange. Structure5, 859–863.
8. Hvidt, A. and Neilson, S. O. (1966) Hydrogen exchange in proteins.Adv. Protein Chem. 21, 287–386.
9. Bai, Y., Milne, J. S., Mayre, L., and Englander, S. W. (1993) Primarystructure effects on peptide group hydrogen exchange. Proteins 17,75–86.

90 Huyghues-Despointes et al.
10. Loh, S. N., Rohl, C. A., Kiefhaber, T., and Baldwin, R. L. (1996) Ageneral two-process model describes the hydrogen exchange behav-ior of RNase A in unfolding conditions. Proc. Natl. Acad. Sci. USA93, 1982–1987.
11. Qian, H. and Chan, S. I. (1999) Hydrogen exchange kinetics of pro-teins in denaturants: a generalized two-process model. J. Mol. Biol.286, 607–616.
12. Huyghes-Despointe, B. M. P., Scholtz, J. M., and Pace, C. N. (1999)Protein conformational stabilities can be determined from hydrogen-exchange rates. Nat. Struct. Biol. 6, 910–912.
13. Connelly, G. P., Bai, Y., Jeng, M.-F.. amd Englander, S. W. (1993)Isotope effect in peptide group hydrogen exchange. Proteins 17,87–92.
14. Molday, R. S., Englander, S. W., and Kallen, R. G. (1972) Primarystructure effects on peptide group hydrogen exchange. Biochemistry11, 150–158.
15. Bai, Y., Milne, J. S. Mayne, L., and Englander, S. W. (1994) Proteinstability parameters measured by hydrogen exchange. Proteins 20, 4–14.
16. Roder, H., Wagner, G., and Wüthrich, K. (1985) Amide proton exchangein proteins by EX1 kinetics: studies of the basic pancreatic trypsin inhibi-tor at variable pD and temperature. Biochemistry 24, 7396–7407.
17. Tüchsen, E. and Woodward, C. (1987) Biochemistry 26, 8073–8078.18. Swint-Kruse, L. and Robertson, A. D. (1996) Temperature and pH
dependences of hydrogen exchange and global stability for ovomu-coid third domain. Biochemistry 35, 171–180.
19. Mayo, S. L. and Baldwin, R. L. (1993) Guanidinium chloride induc-tion of partial unfolding in amide proton exchange in RNase A.Science 262, 873–876.
20. Bai, Y., Sosnick, T. R., Mayne, L., and Englander, S. W. (1995)Protein folding intermediates: native state hydrogen exchange.Science 269, 192–197.
21. Chamberlain, A. K., Handel, T. M., and Marqusee, S. (1996) Detec-tion of rare partially folded molecules in equilibrium with the nativeconformation of RNase H. Nat. Struct. Biol. 3, 782–787.
22. Grantcharova, V. P. and Baker, D. (1997) Folding dynamics of thesrc SH3 domain. Biochemistry 36, 15,685–15,692.
23. Yi, Q., Scalley, M. L., Simons, K. T., Gladwin, S. T., and Baker, D.(1997) Characterization of the free energy spectrum ofpeptostreptococcal protein L. Fold. Des. 2, 271–279.

Hydrogen Exchange 91
24. Bhuyan, A. K. and Udgaonkar, J. B. (1998) Two structuralsubdomains of barstar detected by rapid mixing NMR measurementof amide hydrogen exchange. Proteins 30, 295–308.
25. Fuentes, E. J. and Wand, A. J. (1998) Dynamics and stability ofapocytochrome b562 examined by hydrogen exchange. Biochemistry37, 3687–3698.
26. Fuentes, E. J. and Wand, A. J. (1998) Local stability and dynamics ofapocytochrome B562 examined by the dependence of hydrogenexchange on hydrostatic Pressure. Biochemistry 37, 9877–9883.
27. Huyghes-Despointe, B. M. P., Langhoest, U., Steyaert, J., Pace,C. N., and Scholtz, J. M. (1999) Hydrogen-exchange stabilities ofRNase T1 and variants with buried and solvent-exposed Ala Glymutations in the helix. Biochemistry
28. Pace, C. N., Laurents, D. V., and Thomson, J. A. (1990) pH depen-dence of the urea and guanidine hydrochloride denaturation of ribo-nuclease A and ribonuclease T1. Biochemistry 29, 2564–2572.
29. Glasoe, P. F. and Long, F. A. (1960) Use of glass electrodes to mea-sure acidities in deuterium oxide. J. Phys. Chem. 64, 188–193.
30. Oas, T. G. and Toone, E. J. (1997) Thermodynamic solvent isotopeeffects and molecular hydrophobicity, in Adv. Biophys. Chem. (Bush,C., ed.), JAI Press, Inc., Greenwich, CT pp. 1–52.
31. Makhatadze, G. I., Clore, G. M., and Gronenborn, A. M. (1995)Solvent isotope effect of protein stability. Nat. Struct. Biol. 2,852–855.
32. Jabs, A., Weiss, M. S., and Hilgenfeld, R. (1999) Non-proline cispeptide bonds in proteins. J. Mol. Biol. 286, 291–304.
33. Reimer, U., Scherer, G., Drewello, M., Kruber, S., Schutkowski, M., andFischer, G. (1998) Side-chain effects of peptidyl-prolyl cis/trans isomer-ization. J. Mol. Biol. 279, 449–460.
34. Sharp, K. A. and Englander, S. W. (1994) How much is a stabilizingbond worth? Trends Biochem. Sci. 19, 526–529.
35. Kragelund, B. B., Knudsen, J., and Poulsen, F. M. (1995) Local per-turbations by ligand binding of hydrogen deuterium exchange kinet-ics in a four-helix bundle protein, acyl coenzyme A binding protein(ACBP). J. Mol. Biol. 250, 695–706.
36. Li, R. and Woodward, C. (1999) Hydrogen exchange and proteinfolding. Protein Sci. 8, 1571–1591.
37. Neira, J. L., Sevilla, P., Menéndez, M., Bruix, M., and Rico, M.(1999) Hydrogen exchange in ribonuclease A and ribonuclease S:
92 Huyghues-Despointes et al.
evidence for residual structure in the unfolded state under native con-ditions. J. Mol. Biol. 285, 627–643.
38. Sivaraman, T., Kumar, T. K. S., and Yu, C. (1999) Investigation ofthe structural stability of cardiotoxin analogue III from the taiwancobra by hydrogen-deuterium exchange kinetics. Biochemistry 38,9899–9905.
39. Chakshusmathi, G., Ratnaparkhi, G. S., Madhu, P. K., and Vara-darajan, R. (1999) Native-state hydrogen-exchange studies of a frag-ment complex can provide structural information about the isolatedfragments. Proc. Natl. Acad. Sci. USA 96, 7899–7904.
40. Llinás, M., et al. (1999) The energetics of T4 lysozyme reveal a hier-archy of conformations. Nat. Struct. Biol. 6, 1072–1076.
41. Loh, S. N., Prehoda, K. E., Wang, J., and Markley, J. L. (1993)Hydrogen exchange in unligated and ligated staphylococcal nuclease.Biochemistry 32, 11,022–11,028.
42. Wrabl, J. and Shortle, D. (1999) A model of the changes in denaturedstate structure underlying m value effects in staphylococcal nuclease.Nat. Struct. Biol. 6, 876–883.
43. Brandts, J. F., Halvorson, H. R., and Brennan, M. (1975) Consider-ation of the possibility that the slow step in protein denaturation reac-tions is due to cis-trans isomerization of proline residues.Biochemistry 14, 4953–4963.