Protein Research Foundation • Oil & Protein Seeds ... Research Foundation • Oil & Protein Seeds...
44
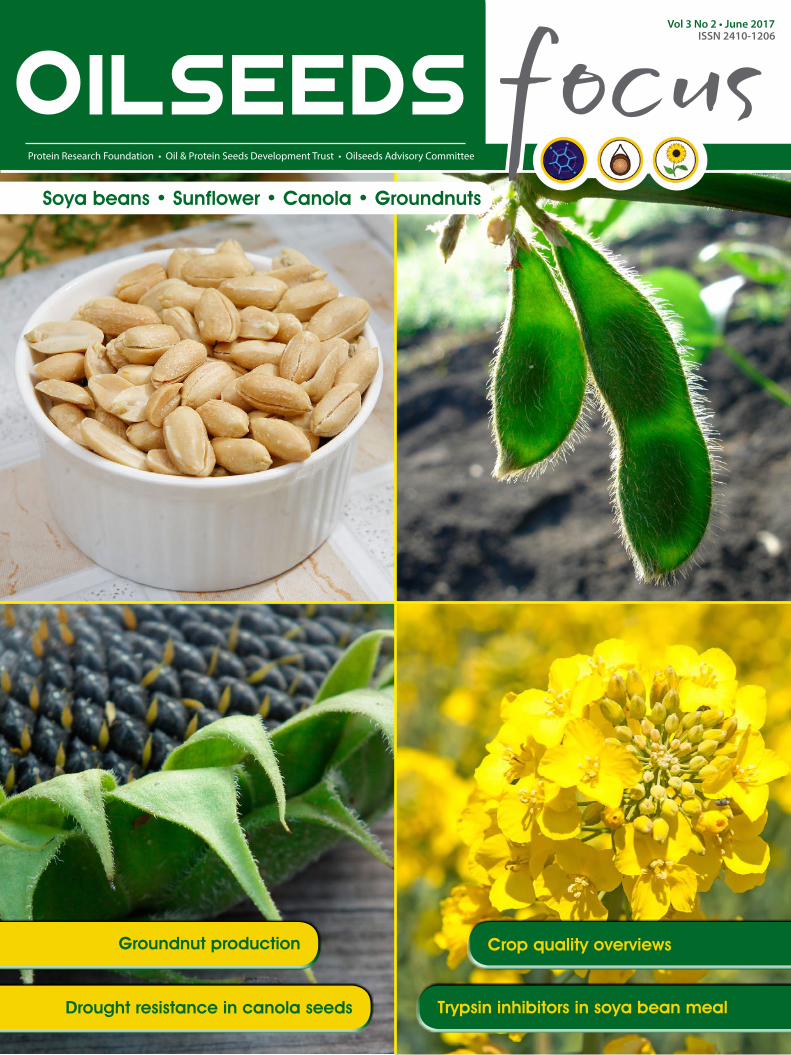
Protein Research Foundation • Oil & Protein Seeds Development Trust • Oilseeds Advisory Committee Soya beans • Sunflower • Canola • Groundnuts Groundnut production Crop quality overviews Trypsin inhibitors in soya bean meal Drought resistance in canola seeds Vol 3 No 2 • June 2017 ISSN 2410-1206
Transcript of Protein Research Foundation • Oil & Protein Seeds ... Research Foundation • Oil & Protein Seeds...
Protein Research Foundation bull Oil amp Protein Seeds Development Trust bull Oilseeds Advisory Committee
Soya beans bull Sunflower bull Canola bull Groundnuts
Groundnut production Crop quality overviews
Trypsin inhibitors in soya bean mealDrought resistance in canola seeds
Vol 3 No 2 bull June 2017ISSN 2410-1206
1June 2017
Preface
By Jannie de Villiers CEO of Grain SA
facing the South African oilseeds producer
The greatest single risk for the grain and oilseeds farmers of South Africa has been identified as political uncertainty This is despite
the most severe drought since 1903 By analysing the risk it has become clear that it is not our confidence in the Constitution of the Republic of South Africa 1996 (Act 108 of 1996) that concerns farmers it is the fact that government keeps challenging the Constitution as if it is civil societyrsquos responsibility to prove them wrong
The funds and time lost in the court process can surely be used much more sensibly One should continue posing the question Who benefits from the repetition of mistakes and the subsequent uncertainty
Politicians are skilled at playing on the emotions of farmers Our ability to turn a deaf ear remain calm and stick to the verdicts of the courts is the skill needed to take agriculture forward An attitude of lsquoit is my turn to eatrsquo does not create wealth in our nation and will increase poverty We need to work the land not the government However this is not our only challenge
Macro levelThe impact of slow economic growth and the downgrade of our investment status is certainly not the medicine needed by our high levels of unemployment It will speed up the ever-growing urbanisation trend and put more pressure on the consumers of our products Urbanisation is forecast to be at 70 in 2030 More people will rely on commercial farmers for lsquopap en vleisrsquo Urbanisation is a friend of commercial farmers but funds are required to drive the demand for our products
Our inputs are mainly based on international prices and a favourable exchange rate is therefore crucial Grain
prices also correlate with those of crude oil and it remains essential to monitor the trends in this regard
Developments in the sectorMy observation of the past twenty years of a deregulated market is that farmers have adapted exceptionally well to the free market and especially new technologies Economy of scale and the use of technology are the only way to sustainability Many multinational input suppliers are astonished by South African farmersrsquo ability to implement new technology
What I have noticed this current season is that our grain and oilseed farmersrsquo marketing skills in selling their products (as well as those of service providers) have not progressed to the same extent Too many producers do not hedge their positions at planting waiting until harvest and then trying to sell while complaining about low prices We cannot simply blame the Johannesburg Stock Exchange (JSE) or other market participants for our current situation A farmer has the responsibility to market his own crop
Organised agriculture is developing a new model for research in future Our research institutions and training facilities do not support our competitiveness
anymore We need to find new ways to resolve these issues as this will determine our competitiveness
Another lsquoland reformrsquo threat especially in Mpumalanga is mining If South Africa loses approximately 400 000ha of maize production we will end up with a maize shortage This will push maize prices to import parity and will make a basic foodstuff such as maize meal and feed to the poultry dairy and meat sectors very uncompetitive
Farm levelThe challenges at farm level are increasing by the day Non-compliance with new legislation and regulations could bring farming operations to a halt Labour matters have forever changed our way of farming The relationship with his labourers as well as with compliance agencies such as the South African Revenue Service (SARS) will become a critical requirement for the skill set of a farmer
Water availability usage and management will also be of critical importance in the future as no assistance can be expected from our government Farmers should therefore keep abreast of developments in technology and improve the scale of their operations in a diverse way in order to become sustainable Having a succession plan in place forms part of operating sustainably Remaining connected to the younger generation is also of vital importance
South Africa is undergoing a major transition where the population is no longer divided between races but between right and wrong actions We know that in the end good always seems to conquer evil Let us keep the faith in these days of turbulence It is advisable to focus on your own sustainability and profitability and not to get too distracted by the political landscape
The impact of slow economic growth
and the downgrade of our investment
status is certainly not the medicine needed by our high levels of
unemployment
2 Oilseeds f ocus
Published by Plaas Publishing (Pty) Ltd217 Clifton Ave Lyttelton Centurion RSAPrivate Bag X2010 Lyttelton 0140 RSATel +27 12 664 4793 wwwveeplaascoza
Chief editor Lynette Louw+27 84 580 5120 lynetteveeplaascoza
Sub-editor Chris Jooste+27 12 664 4793 chrisveeplaascoza
Design amp layout Karien van Wyk+27 12 664 4793 karienveeplaascoza
AdvertisingMonique van der Walt +27 71 893 3731 moniqueveeplaascoza
Karin Changuion-Duffy+27 82 376 6396 bull karinveeplaascoza
Susan Steyn+27 82 657 1262 bull susanveeplaascoza
Esmarie Moodie +27 76 330 0745 bull esmarieveeplaascoza
Accounts Marneacute Anderson+27 72 639 1805 accountsveeplaascoza
Subscriptions Rochelle Mabebe+27 74 153 8380 rochelleveeplaascoza Printed and bound by United Litho +27 11 402 0571
Oilseeds Focus Plaas Publishing and its staff and contributors do not necessarily subscribe to the views expressed in this publication
copy Copyright No portion of this magazine may be reproduced in any form without the written consent of the publishers
Published on behalf ofProtein Research Foundation
PO Box 1564 Rivonia 2128Tel 011 803 2579 bull Fax 011 803 2287 086 634 8067
Enquiries gkeunproteinresearchnet
Dr Erhard Briedenhann
Send us your contributions and suggestions to make Oilseeds Focus an enjoyable and valuable publication for the oilseeds industry Contact Dr
Briedenhann at erhardbnetactivecoza for more information
June 2017
Political turmoil continues to plague the country and agriculture will not escape Free trade working toward resource maximisation and adding growth to national income and wealth largely remain in place The question is will its relevance fade
We need to mentally gear ourselves for rising populism The call for land redistribution without compensation from certain role-players does create some anxiety Land tenure is the cornerstone of our democracy Certainty that the interest of the country and all its people will come first is critical for the prosperity of all South Africans
Policy consistency is key Policy consistency is key to the prosperity of the agricultural industry while the building of capacity in the state to support and stimulate agriculture is important to growth particularly for new incumbents The reduction in available funds for state functions is likely to incapacitate this initiative even if there were good intentions
The slow economic growth will in the long term continue to have a negative effect on buying power while the weaker rand will increase the input costs for a variety of essential agricultural production items including fertiliser and fuel
The positive outlook for crop volumes in the country bodes well for the agricultural industry South Africa the largest producer of maize on the continent is set to produce the largest maize crop in 36 years (1454 million tons) and achieve the highest yield per hectare in its history Predictions are for a maize crop that will be 87 larger than last year when the crippling drought significantly restricted production
Largest crop in SA historyThe expected soya bean crop of 123 million tons will be the largest in the history of South Africa and 66 larger than last year This is a milestone in the history of soya bean production in this country and a result of the favourable soya bean prices advantages of crop rotation and major efforts by various parties regarding the technology of production
The sunflower crop of 853 470 tons is 19 larger than last year and one of the highest quantities produced over the last ten years but still a way behind the 11 million tons of 1999
Growth in canola production in the winter rainfall area has also been encouraging with a crop of 105 460 tons Although below the 121 000 tons achieved in 2014 it is an indication of how canola production is expanding year after year
will affect agriculture
3June 2017
To subscribeOilseeds Focus is a magazine aimed at addressing issues that are relevant to the canola soya bean sunflower and peanut industries To subscribe please contact Rochelle Mabebe at +27 74 153 8380 or email rochelleveeplaascoza Subscriptions are free
36
10
6
18
1 Preface
2 Editorrsquos note
4 News
AGRONOMY
6 Seed treatments to control charcoal rot
10 SA groundnuts The future looks bright
13 An exceptional soya bean yield
SEEDS
18 Development in crop genetics
20 Drought resistance of canola seedlings
CHEMICALS AND FERTILISER
22 Is biological control better
24 Clethodim damage in canola
MARKETS
26 Sustainability in the spotlight
27 Stocks supported by Chinese demand
32 The SA peanut butter market
QUALITY
34 Sunflower crop quality overview
36 Effect of TIA on broiler performance
38 Soya bean crop quality overview
4 June 2017
China sets another soya bean import recordSoya bean shipments to China the worldrsquos largest buyer of the oilseed set another monthly record in April at 802 million tons according to data from the General Administration of Customs Bean imports in April rose by 13 from a year ago supported by strong demand from the soya meal industry For three consecutive months in a row leading to April China set a new monthly record buying 2754 million tons of soya beans in the first four months of 2017 ndash Agra-Net
Canada to plant record canola cropIn April Agra-Net reported that the Canadian oilseed acreage is set to boom according to the latest acreage estimates available at that time by Statistics Canada The agency pegged canola acreage at a record 22387 million acres a jump of 202 million acres over last year in its Principal Field Crops Acreage Summary for 201718 ndash Agra-Net
Bunge acquires Argentine edible oil companyBunge Southern Cone an agribusiness and food company has agreed to acquire all assets belonging to Aceitera Martinez SA ndash a family-run business that produces and packages edible oils including soya bean and sunflower oils
Assets involved in the deal include a production plant in San Jeroacutenimo Sud that has three packaging lines and a processing capacity of approximately 20 000 tons per month and which is located in close proximity to Bungersquos existing refining centre
The deal will support Bungersquos ability to meet the growing demand for value-added products while also expanding its portfolio and generating a more appropriate asset allocation
This acquisition is the latest after a busy period for Bunge In March the company acquired Westfaumllische Lebensmittelwerke Lindemann GmbH amp Co KG ndash a German supplier of oils and fats and completed the acquisition of Cargillrsquos soya bean and rapeseed crush and refining plants and its beans discharging operation in the Netherlands and France respectively
Bunge also launched a joint venture with Bahri Dry Bulk Co a subsidiary of the Bahri Group the national shipping arm of the Kingdom of Saudi Arabia in February of this year to establish an ocean freight supplier for dry bulk shipments in and out of the Middle East ndash Oilseedandgraincom
Largest volume of soya dispatchedBrazilrsquos soya bean harvest is over and in April 2017 Informa Economics increased its estimate for the countryrsquos 201617 soya bean production by two million tons from the previous one to a record 113 million tons From a trade perspective in April 2017 Brazil exported 104 million tons of soya bean the biggest volume ever dispatched in a single calendar month ndash Wandile Sihlobo Agbiz
US accuses Argentina of biofuel lsquodumpingrsquoSoya bean oil futures increased by 3 after Washington accused Argentina and Indonesia of dumping in their $15bn biodiesel exports to the United States (US) Soya bean oil futures for July touched 3347 cents a pound in Chicago before easing back to 3313 cents in late morning deals a gain of 19 on the day
The headway followed the release by the US International Trade Commission (ITC) that it had ldquomade affirmative determinationsrdquo in its probe into dumping by Argentina and Indonesia on biodiesel adding that further details of its findings would be revealed later
ldquoThere is a reasonable indication that the US industry is
materially injured by way of biodiesel imports from Argentina and Indonesia that are allegedly subsidised and sold in the US at less than fair valuerdquo said the commission which will now investigate potential tariffs
The finding was welcomed by US biofuel producers including Archer Daniels Midland the ag trading giant which stated it was ldquopleased to see that the ITC has taken the first step toward imposing countervailing and antidumping duties on biodiesel imported from Argentina and Indonesia
ldquoThe facts clearly show that Argentina and Indonesia are engaging in unfair trade practices and we are confident that duties will be imposed when the final decision is maderdquo ndash Oilseedandgraincom
5June 2017
intro
Meet the New Voices in cereal researchCereal Science and Technology SA (CST-SA) recently hosted the second New Voice Symposium at the Willows Country Lodge in Pretoria The initiative is aimed at giving postdoctorate PhD and masterrsquos students the opportunity to present their research in front of an audience to build their confidence
Students presented research ranging across various spectrums of the cereal industry The presentations included research on primary production disease control the testing of mycotoxins in storage facilities and processing methods that could improve the industry among others
Students that took part came from across South Africa and included representatives from Stellenbosch University the University of the Free State (UFS) and the University of Pretoria Travelling far to attend the New Voice Symposium was worth their while because it gave them an opportunity to present their research in front of a new audience
The audience included fellow students and experts in the field that helped create
The role of satellites in crop estimatesAt a recent stakeholder involvement workshop held at the Grain Building in Pretoria role-players provided feedback on the validation process using the satellite Sentinel 2 for agricultural purposes (Sen2Agri) in South Africa The workshop elaborated on the application of the Sentinel 2 satellite an euro8 billion investment of the European Union and the European Space Agency and its application to crop estimates as well as the field validation process of the Agricultural Research Council (ARC) and its partners
The workshop was attended by stakeholders in the industry which included representatives from the ARC the Department of Agriculture Forestry and Fisheries and its Crop Estimates
a real symposium feel by posing questions to students which needed to be answered on the spot Some of the professionals in the industry who were present included Mariana Purnell of Agbiz Dr Angie van Biljon of the UFS and Wiana Louw of the Southern African Grain Laboratory (SAGL) who also serves on the executive committee of the CST-SA
Follow NewVoiceProgram on farmbizmag to read live tweets done at the function ndash Ursula Human Oilseeds Focus
The group of experts and students present at the New Voice Symposium
Committee Grain SA Agbiz the SAGL the Animal Feed Manufacturersrsquo Association and the Bureau for Food and Agricultural Policy to name but a few
Sen2Agri is a global system that makes data collected by the satellite open and free for everyone to use The data can be used to determine crop estimates and crop growth progress It was made freely available to anyone in an effort to promote international cooperation to make crop production projections more transparent
The data which consists mostly of images can be downloaded online at wwwscihubcopernicuseu The satellites work in pairs to capture high-resolution images on a regular basis For South Africa new information is made
available every twelve days Some of the data it collects includes weather trends such as the effects of El Nintildeo on crop production It can also monitor crop growth by measuring leaf area index
The system for South Africa validated by field surveys by end of June will in particular be applied to the oilseeds wheat maize and barley industries In future data from Sen2Agri could contribute to more accurate crop estimates long-term production planning food policymaking improved logistical planning and more accurate market planning for imports and exports ndash Ursula Human Oilseeds Focus
Stakeholders and speakers present at the Sen2Afgri workshop
June 2017
By Sebastian Reznikov Gabriel R Vellicce Victoria Gonzaacutelez Vicente de Lisi Atilio P Castagnaro and L Daniel Ploper
Soya bean plants are susceptible to root and stem base rot caused by soil pathogens at all growth stages One of these diseases is charcoal rot caused by the polyphagous fungus Macrophomina phaseolina (Mp)
This pathogen infects a wide host range of nearly 500 species in more than 100 families around the world including other important crops such
as cotton chickpea maize and common beans Morphologically physiologically genetically and pathogenically the fungus varies widely enabling it to adapt to different environmental conditions and hence become widely distributed geographically
Soya bean seedlings affected by Mp develop reddish brown lesions on the hypocotyl which becomes ash-grey and then turns black The presence of small black sclerotia in the cortical tissue confers the charcoal appearance that gives the disease its name In addition to these symptoms and signs mature plants develop chlorotic lesions on their leaves
which then die but remain attached to the stem and finally the plants die prematurely A combination of water stress and high temperatures favours disease development
Alternative controlBiological agents can provide an alternative to control certain plant diseases especially when other methods such as chemicals are difficult to use Sclerotium rolfsii Rhizoctonia solani and Pythium spp were successfully controlled by using antagonistic microorganisms such as Trichoderma spp Penicillium spp Aspergillus spp and some bacteria
A talc-based formulation of Trichoderma viride produced on a commercial scale was widely used by farmers to treat seeds of sesame groundnut sunflower chickpea and mung bean for the biocontrol of root rot disease caused by Mp
Treating the seeds with Trichoderma spp and Gliocladium virens and storing them was more advantageous than storing the formulation and treating the seeds just before planting Trichoderma harzianum inhibited the in vitro linear growth and microsclerotia production of Mp
To control fungal pathogens chemical products are available for application of soil seeds andor foliage Fungicide seed treatments are intended to control diseases that cause seed rot and damping-off before and after emergence Thiram fludioxonil and captanpentachloronitrobenzenethiabendazole that were used to control Sclerotinia sclerotiorum in field trials managed to reduce sclerotia formation in infected soya bean seed by 98 Moreover treatment of soya bean seeds with thiram reduced the incidence of Phomopsis sojae and increased seed germination
No chemicals availableCurrently no chemicals are available to control charcoal rot in soya bean Seed treatments may be helpful if soya bean seeds are infected with Mp but there is no information on specific active ingredients effective against this pathogen Among fungicides tested against Mp in infected cotton seeds carbendazim quintozene and benomyl enhanced plant emergence (PE) and disease control Moncerenreg pencycuron carboxin 200 tolclofos-methyl and Maximum AP also increased the percentage of surviving seedlings
to control charcoal rot in soya bean
6
Microsclerotia of the charcoal rot fungus on the lower portion of a
soya bean stem (Photograph wwwcropprotectionnetworkorg)
A soya bean field being destroyed by charcoal rot (Photograph wwwcropprotectionnetworkorg)
By Sebastian Reznikov Gabriel R Vellicce Victoria Gonzaacutelez Vicente de Lisi Atilio P Castagnaro and L Daniel Ploper
7June 2017
from Mp-infected seedsThe efficacy of seed
treatments with two biological products (Trichoderma viride or Bacillus subtilis) or one chemical treatment with thiophanate-methylpyraclostrobin with regard to PE disease severity Mp colony-forming units (CFUs) crop yield and 1 000-seed weight in two soya bean cultivars maturity group (MG) VIII were evaluated in the field to control Mp on two soya bean cultivars NA8000 RG and Munasqa RR in Tucumaacuten north-western Argentina
Biological and chemical seed treatments have been shown to be effective to control Mp on various crops For cotton several fungicides were tested as seed treatments to determine their efficacy in controlling Mp infection Monceren 250 FS and tolclofos-methyl were the best-performing fungicides in controlling Mp on cotton in the greenhouse A reduction in the percentage of dead sesame plants
affected by Mp was found when seeds were treated with biological antagonists such as Trichoderma sp and Aspergillus sp
Lower disease severityIn NA8000 RG and Munasqa RR treatments had a similar performance trend the highest crop yield values were obtained with the pyraclostrobinthiophanate-methyl mixture followed by those obtained with T viride and B subtilis
Similar yield increases were also observed an increment of 100kg was obtained when applying chemical seed
treatments (propineb and dicarboximide) in sesame to control Mp as compared with yield values obtained with the untreated control Mp did infect Munasqa RR and NA8000 RG but severity levels and CFUg were higher in NA8000 RG in both seasons The chemical and biological treatments resulted in lower disease severity and CFUg values than in the inoculated control
These results go along with lower disease incidence in eggplants treated with different Trichoderma sp strains Results from this study of chemical and biological seed treatments of soya bean to control charcoal rot will be useful to develop more efficient management strategies for this important disease
References and the full article are available from the authors Contact the
Estacioacuten Experimental Agroindustrial Obispo Colombres (EEAOC) at email
dteeaocorgar for more information
Charcoal rot can attack crops at any growth stage (Photograph wwwlsuagcentercom)
8 June 2017
9June 2017
Advertorial
stem rot in canola
By Jannie Bruwer area sales manager Bayer
Although numerous diseases could play a role in the economic viability of canola it is vital to address the management practices of Sclerotinia control
Sclerotinia stem rot is caused by the fungus Sclerotinia sclerotiorum The fungus survives as sclerotia either in the soil or in stubble on the soil surface
The occurrence of sclerotia is more prominent under the following conditionsbull Rain of 25ndash50mm 10 to 14 days prior to the beginning
of flowering ndash thus wet conditions for at least 10 days on the soil surface in mid- to late winter Temperatures of 11ndash15degC trigger the germination of sclerotia and result in spore release
bull Extended wet periods during flowering trigger petal infection
bull Extended wet periods during petal drop and the lodging of petals on stems lead to subsequent stem infection Stem lesion development occurs in humidwet conditions and temperatures between 20 and 25degC
Moisture is keyMoisture is the key factor in Sclerotinia infection Good soil moisture starting two weeks in advance and continuing throughout flowering will greatly increase the risk of infection Conversely low rainfall and low humidity during these stages will significantly reduce the disease risk and fungicide applications rarely prove to be beneficial under these conditions Moisture can refer to rain relative humidity in the 80s or morning dew
After rain it takes approximately 10 to 12 days for apothecia (tiny golf tee-shaped mushrooms) to release ascospores into the air Wind spreads these spores onto nearby plants Ascospores cannot infect plants directly but they need dead tissue such as fallen petals on leaves and stems covering the spores to create an ideal microclimate to continue their disease cycle
Decaying petals provide ascospores with the energy to produce hyphae that release oxalic acid (C₂H₂O₄) and other infection agents which the fungus needs to invade healthy plant tissue and infect the plant Once inside the plant the fungus grows up and down the stem eventually cutting off moisture and nutrient flow and killing the plant The life cycle of Sclerotinia can be seen in Figure 1
Figure 1 Sclerotinia stem rot in canola (Source Department of Agriculture and Food Western Australia)
Timing of spraying will be determined by climatic conditions The optimum time to spray is between 20 to 30 flowering but in certain years when the climatic conditions in early flowering are not favourable for the disease to develop a later spray (not later than 50 flowering) may be more ideal
Should conditions remain unfavourable for disease development (hot and dry) after 50 flowering a fungicide application will be unwarranted After 50 flowering most of the flowers are on side branches Therefore little risk of petals landing on the main stem to cause economic damage exists
A 10 change in flower percentage only takes three to four days Thus the timing of a spray is critical in controlling the disease
Spray during floweringIt is essential that any fungicide application coincides with the peak flowering period Fungicides prevent spores from growing on petals after petals have fallen onto leaves and stems and started to decay It is easier to spray petals at the top of the canopy during peak flowering than after they have fallen which is why living flowers are the target
Spraying before 20 flowering is too early because no petals have dropped and no pods have formed At 30 flowering petal drop has just begun Most of the petals drop during 30 flowering Therefore spraying between 20 and 30 flowering ensures that many flowers have opened and the spray will cover petals before they drop
Fungicides reduce the severity of infection but will not completely eliminate Sclerotinia especially if conditions are favourable throughout flowering
For more information contact Jannie Bruwer on 082 806 8715 or email janniebruwerbayercom
9June 2017
June 2017
During the 201516 production year the groundnut industry in South Africa reached its lowest production figures since records were kept from
1936 Exporters and producers had to pull out all the stops to save the industry and to generate a return to become one of the worldrsquos best producers once again
Alfonso Visser owner of the Golden Peanut and Tree Nuts plant in Hartswater and one of the major groundnut producers in the country says the main reason why the groundnut industry faced challenges was the El Nintildeo climate phenomenon
While it may seem as though producers lost interest in cultivating groundnuts they didnrsquot really stop producing It was rather a matter of late rainfall that forced producers to skip planting over the past three years During this period the first rains came only between 20 and 28 December and by that time it was too late for groundnut plantings In certain parts producers elected to plant maize instead
Visser also says that producers who had the opportunity to plant groundnuts in those three years recorded their best profits ever This year the harvest looks promising and the climate has played its part Groundnut production is set to show better profits than most other crops this year
In the 201516 production year South African producers could only manage to plant 22 600ha and only 17 680 tons of groundnuts were harvested This season South Africa received its first rains from mid-November to mid-December and many producers managed to plant the commodity again Approximately 55 000ha were planted in the Free State Limpopo Northern Cape and the North West Apart from rainfall at the right time there is also a promising export market in Europe and Japan which are all good signs for a profitable year
Keen interest in planting Adri Botha chairperson of the Groundnut Forum of South Africa (SAGF) says groundnut production in the country similar to many other crops experienced hard times due to the drought but when the opportunity presented itself farmers showed keen interest in planting again
Information from the South African Grain Information Service (SAGIS) indicates that an average of 48 720ha were planted over the past ten years and the average harvest during this time was 66 139 tons The average over the last five years has declined however During this time an average of 45 015ha was planted and the average harvest was 52 568 tons In the past two years groundnut production has declined even more
As noted before only 22 600ha were
planted during the 201516 production year and a mere 18 850 tons were harvested The effect of this decrease in volumes is that South Africa failed to produce sufficient quantities of groundnuts for local consumption with international buyers not receiving the regular volumes they are used to
Botha believes that with a stable and adequate supply this market will be regained easily enough because South African exporters are renowned for quality and reliability under normal circumstances Visser is also very optimistic regarding the export market He says South Africa did not lose the international market The supply did decrease which negatively affected the export market because international buyers turned to other more reliable sources Despite this South Africa still exports to Japan and Europe with a focus on the higher-income sector of these countries
Figure 1 South African groundnut production figures 200607ndash201617
10
By Koos du Pisanie
The 2017 harvest looks promising and the climate has played its part in setting the table for better production and higher profits
11June 2017
New possibilities for businessThere are new possibilities available for groundnut producers but these will entail hard work especially in respect of the export market Botha says that due to a changing and declining supply South Africa has lost some of its standing in recent years as a reliable export source for the international groundnut market in Europe and Japan However the markets are still there to be regained and expanded if the broader industry commits to the commodity and consistent supply of high-quality products
Last year was one of the worst production years in South Africa but exporters still managed to provide 36 or 2 317 tons of the harvest to Japan 32 to Mozambique 12 to the Netherlands and 11 to Belgium
ldquoSouth African groundnuts are of a good quality and well known in the international market Up until 1994 the country was known for its excellent quality and buyers didnrsquot hesitate to use South African groundnuts directly in their production lines without the need for more sorting or processing Unfortunately in the move from a single-channel
marketing structure via the Oilseeds Board as well as the challenges brought on by labour issues and adjustments needed on the technological side primary producers started considering other commodities In this process South Africa lost the ability to retain its spot in the market along with many international buyers reluctantly forced to source products from alternative origins
ldquoAt the same time Argentina rose as a worthy opponent in the global supply arena making matters even more difficult for exporters Still the international demand on the back of global population growth along with the marketability of groundnuts as an excellent source of nutrients and healthy oils leaves the door wide open to usrdquo Botha says
Challenges for the futureVisser says groundnut production levels in South Africa have been so low in the past two to three years that even the national market experienced a shortage He believes that one of the challenges for the groundnut industry is achieving an increase in local consumption
In the past peanut butter formed a
major portion of the menus relating to food projects for schools prisons and non-profit organisations assisting the homeless for instance because it is affordable and high in protein Lately however it has become too expensive for this purpose Due to a decline in quality this market has also shrunk Therefore the first challenge will be to increase local consumption again
ldquoThe second challenge is identifying cultivars which will produce higher yields Farming has become expensive and producers have to find ways to cut down on input costs while still delivering higher returns In the groundnut industry we need access to cultivars that will deliver higher yields This way we can cut on unit costs and deliver a more affordable product to the marketrdquo Visser says
Exceptionally high yieldsBotha adds that in addition to hope for continued local cultivar development international cultivar owners are sought and invited to submit seed to be included in the local Elite Cultivar Trials funded and managed via the Oilseeds Advisory Committee (OAC) She says groundnut production has always been more profitable than any other competing crop but is also more intensive and the necessary attention should be given to best practices in an effort to ensure that available cultivars reach their full potential It is no secret that certain farmers will deliver exceptionally high yields with the existing available material
Another of the challenges in the industry ndash for which excellent work has already been done ndash is introducing groundnut production as a high-income crop to emerging farmers The focus and goal is to help these farmers become regular producers of quality products through courses and mentorship ultimately giving them access to the larger and more formal market environment
For any information on the groundnut industry in South Africa contact Alfonso Visser on 082 948 2222
or 053 474 1345 or Adri Botha on 082 376 5940
In addition to continued local cultivar development the industry is also seeking international cultivar owners to submit seed to be included in the local Elite Cultivar Trials funded and managed via the Oilseeds Advisory Committee
12 June 2017
13June 2017
Exceptional yields are possible with soya beans provided that you correctly attend to every facet of the cultivation process This year a soya bean yield of
up to 8tha filled the combine harvester to the brim on the farm Leeubank of Gerrit Roos near Wonderfontein in Mpumalanga
Last year he was crowned champion soya bean producer (under irrigation) in the Weigh to Wintrade National Yield Competition when a block of two hectares he entered yielded an average of 5236tha This year the harvester measured just over 8tha in certain parts of his irrigated fields Roos says careful attention to small things in every aspect of the entire cultivation process makes the difference because he manages everything in a precision farming system
Every year Roos plants strip trials containing the soya bean cultivars of different seed enterprises This allows them to determine which cultivars best suit the conditions on his farm Roos plants approximately 1 000ha maize and 450ha soya beans He also manages a livestock branch
Maize and soya beans are planted in a crop rotation system which means the fields are planted with soya beans every three years When he joined the
By Andries Gouws
An
soya bean yield
enterprise Roos planted soya bean trials and although maize sets
the tone as the primary crop the soya beans have stood their ground especially considering their hidden benefits
Since their first soya bean planting in 199293 they have doubled the average yield on dryland from 18 to 36tha They also plant soya beans under centre pivot irrigation and 20ha with underground drip irrigation These fields deliver an average yield of 4 and 425tha respectively
Strip-till systemOrtman implements are used to strip-till the land During last yearrsquos planting season a large section of the fields was too damp for these implements and a broad-tilling implement (Fieldspan) was used after which the soil was compacted with a roller The advantage of this process is that germination takes place evenly and the soil is much more even thus reducing wear and tear on the blades of the combine harvesterrsquos soya bean table and saves a lot of money
In the strip-till system only the soil in which the seed will be planted is
tilled to a depth of 280mm Every year the strips are moved slightly to eventually utilise the entire land area The fields consist mainly of Avalon soils and care is taken to keep the soil pH level between 6 and 65
Since 2000 they have been using a precision farming system with a diamond pattern (100m times 100m) where soil samples are taken and analysed annually If the analyses indicate a shortage of lime or other nutrients corrections are made continuously Every third year lime is applied across the board and fertilisers are applied throughout according to changing needs
Roos says he has found that soya beans react most favourably to lsquooldrsquo fertilisation For this reason a mixture of 012 fertiliser at 200kgha is broadcast just after the maize which is followed by soya beans that have been harvested This leads to a reaction between the
Spray applications are combined to prevent unnecessary cultivation
Gerrit Roos with his award as winner of the irrigation section of the Weigh to Wintrade National Yield Competition
14 June 2017
15June 2017
crop residues fertiliser and organisms in the soil which in turn stimulates the earthworm numbers in the soil
Roos plants cultivars that exhibit resistance to Roundupreg herbicide Upon planting herbicide is applied to the soil to postpone the first Roundupreg application for as long as possible Proven cultivars are planted as are the best performers in every yearrsquos strip trials The cultivars that grow upright are planted at approximately 300 000 plants per hectare and the shrub-type cultivars at 260 000 to 280 000 plants per hectare in rows 90cm apart The seeds are planted at a depth of between 4 and 5cm to ensure that there is sufficient moisture for even germination
Fungal disease controlAround 40 days after planting the first Roundupreg application is done Supplementary nutrients and fungicides are mixed into the herbicide to respectively lessen the shock and prevent counter fungal diseases from becoming an even greater problem At approximately 60 days after planting a copper spray is applied in support of the effort to control fungal diseases
At the first flowering stage a mixture of mono-ammonium phosphate (MAP) and diammonium phosphate (DAP) specialist fertiliser products for soya beans are applied at 4 to 5kgha with a fungicide and some brown sugar (as agglutinant) Later the cultivars with a long growth period receive another fungicide application As soon as flowering time is over they administer a last application of Roundupreg to ensure that all weeds are eliminated
Fungal diseases are becoming a major problem and especially Sclerotinia can harm the yield Roos says his experience is that soya beans that are planted earlier are not as severely plagued by these diseases Producers traditionally plant soya beans after having planted maize When using underground drip irrigation fungal diseases are not such a big problem
Drip irrigationThey installed the underground drip irrigation around a decade ago The dripper lines are installed approximately 350mm below the ground 200mm apart and the drippers in the lines 20mm apart Every dripper has the capacity to apply two litres of water per hour
The advantages of this irrigation system entailbull That it uses 50 to 75 less water than
a centre pivotbull Irrigation can be done with precisionbull It keeps fungal diseases at baybull At least one less fungicide
application is necessarybull Fertiliser can be placed at the root
zone
The system also has its challenges among others that the depth of cultivations over the pipes should be very accurate The system must be installed in square or rectangular blocks
and the dripper lines can be 180 to 200m in length at most to maintain the pressure for even application Continuous maintenance is necessary and the system must be cleaned regularly to prevent the drippers from clogging
Mice can also present a huge challenge They would typically dig the pipes open and bite holes into them For this reason they have erected owl cages near the fields and planted poles with bails on the contours where owls can rest while they are hunting Only environmentally friendly methods are used to control the mice
The system is initially more expensive to install than a centre pivot but in the long run (after about six years) it becomes the cheaper of the two
Although soya beans can hold their own as a crop in a farming enterprise its use as a rotation crop has numerous advantages The nitrogen (N) deposits that soya beans leave behind in the soil can lead to maize yields of at least 2tha higher than where soya beans were not planted the previous year
Soya crop residues are also manna for sheep The animals ingest the residues and pick up the kernels behind the harvester The additional protein
during mating ensures a higher lambing percentage and in certain years there are between 10 and 15 more twins
All soya beans are processed on farm into soya oil soya oilcake containing 46 protein and 6 energy and full-fat soya oilcake with 37 protein and approximately 20 energy Initially the oil was pressed to use as fuel on the farm but due to the huge increase in plant oil prices it is no longer a viable option The oilcake is used in the cattle and sheep feedlots on the farm Roos says they add value to everything that leaves the farm
For more information contact Gerrit Roos on 083 635 3873 or email
glroosgmailcom
The soya seeds are planted fairly deep to ensure good germination This is a soya bean field on Leeubank near Wonderfontein in Mpumalanga
This year the combine harvester indicated a yield of just over 8tha on certain parts of the soya bean fields
16 June 2017
17June 2017
Promosie-artikel
Phb 65A70Phb 65A70 is rsquon nuwe sonneblomkultivar met hoeuml opbrengspotensiaal Dit is rsquon medium tot lang groeiseisoenkultivar en is geskik vir droeumllandverbouing in die westelike produksiegebiede Die kultivar se dae tot 50 blom is 65
Dit presteer op alle grondtipes in 091m-rye en het rsquon plantdatum van Oktober tot Desember Die beste plantpopulasie is 35 000 tot 40 000 plante per hektaar
Belangrike agronomiese eienskappe (uitstekend = 9 swak = 1)Sekelnek 6Opbrengspotensiaal 7Planthoogte 175Saadvulling 7Eenvormigheid 6Proteiumlenkonsentrasie 176Oliekonsentrasie 428Staanvermoeuml 8Kruistipe 3W
Siekteverdraagsaamheid (verdraagsaam 9 ndash 7 matig 6 ndash 4 vatbaar 3 ndash 1)Bruinroes 7Witroes 6Wortel- en stamsiekte 7
Kies Phb 65A70 vir goeiebull Opbrengste en aanpasbaarheidbull Groeiperiode en eenvormigheidbull Goeie siektebestandheidbull Weerstand teen omvalbull Bestand teen voeumllskadebull Pas in enige kultivarpakket
P65LL02P65LL02 is rsquon sonneblomkultivar wat groot opbrengsverbetering toon van konsepgenetika Dit is rsquon medium tot lang groeiseisoen-kultivar en is geskik vir droeumllandverbouing in die westelike produksiegebiede Die kultivar se dae tot 50 blom is 68
Dit presteer op alle grondtipes in 091 tot 15m-rye en het rsquon plantdatum van Oktober tot Desember Die beste plantpopulasie is 35 000 tot 40 000 plante per hektaar
Belangrike agronomiese eienskappe (uitstekend = 9 swak = 1)Sekelnek 6Opbrengspotensiaal 8Planthoogte 175Saadvulling 7Eenvormigheid 7Staanvermoeuml 8Kruistipe 3W
Siekteverdraagsaamheid (verdraagsaam 9 ndash 7 matig 6 ndash 4 vatbaar 3 ndash 1)Bruinroes 7Witroes 7Wortel- en stamsiekte 7
Kies P65LL02 vir goeiebull Opbrengste en aanpasbaarheidbull Groeiperiode en eenvormigheidbull Goeie siektebestandheidbull Weerstand teen omvalbull Bestand teen voeumllskadebull Pas in enige kultivarpakket
Twee medium tot lang groeiseisoen-sonneblomkultivars is vir droeumllandverbouing in die westelike produksiegebiede beskikbaar
Vir meer inligting kontak Philip Fourie landboukundige van DuPont Pioneer by 082 909 3262 of philipfouriepioneercom
18 June 2017
By Andrew Bennett Asia Africa technology lead Monsanto
Technologies in agriculture and in particular in maize production continue to advance in leaps and bounds It is interesting to examine
how many disease- insect- and herbicide-tolerant transgenic traits are registered globally across all agricultural crops According to the Centre for Environmental Risk Assessment (CERA) database some 206 traits are available in these categories (wwwcera-gmcorg)
Nine virus-resistant traits are available across carnations papaya plum squash common beans and potatoes There are 77 insect-resistant traits in maize cotton tomato potato soya beans and rice There are 120 herbicide-resistant traits spread across cotton maize carnations canola soya bean creeping bent grass tobacco common bean flax sugar beet lucerne rice chicory and wheat
Insect resistance and herbicide tolerance clearly dominate and crops of focus are essentially maize (with 48 insect-resistant traits and 52 herbicide-tolerant traits) soya bean (with three insect-
resistant traits and 17 herbicide-tolerant traits) and cotton (with 20 insect-resistant traits and 20 herbicide-tolerant traits)
Some 92 million hectares of soya beans (83 of all soya beans) 24 million hectares of cotton (75 of all cotton) and 54 million hectares of maize (29 of all maize) are planted with traited varieties and hybrids globally
DroughtGardtradeDroughtGardtrade is one of the new traits that holds much promise especially in maize production regions in South Africa where rainfall is often low uncertain or erratic The trait in DroughtGardtrade is the worldrsquos first drought-tolerant biotechnology trait for maize and is designed to help maize plants better tolerate drought stress and minimise the risk of failure in drought conditions and was commercialised in the United States (US) in 2013
Yield gain in hybrids with DroughtGardtrade occurs because it slows down the growth of maize hybrids experiencing moisture stresses such that existing soil moisture is saved for the
critical period of flowering resulting in less kernel abortion thus protecting the expected yield
Nutritional quality traitsThis is a more complicated segment to quantify but traits such as low lignin (to enhance digestibility in livestock) in lucerne non-browning apples pro-vitamin A and iron-enriched bananas vitamins A- B9- and C-enriched maize high-content omega 3 fatty acid-enriched canola beta carotene-enriched rice and low-saturatedhigh-oleic fatty acid-enriched soya beans are but a few that are receiving attention currently (Agnegraves E Ricroch amp Marie-Ceacutecile Heacutenard-Damave 2016)
CRISPR ndash a new gene-editing toolClustered regularly interspaced short palindromic repeats (CRISPR) is a naturally occurring ancient defence mechanism found in a wide range of bacteria which evolved to protect them against viral infections As far as back the 1980s scientists observed a strange pattern in certain bacterial genomes One deoxyribonucleic acid (DNA) sequence would be repeated continuously with unique sequences in between the repeats
Scientists realised the unique sequences in between the repeats matched the DNA of viruses ndash specifically viruses that prey on bacteria CRISPR form part of the bacteriarsquos immune system keeping parts of the viral DNA of dangerous viruses so it can recognise and defend against such viruses the next time they attack A second part of the defence mechanism is a set of enzymes called CRISPR-associated (Cas) proteins which can precisely snip DNA and remove the DNA of invading viruses
Using this precise gene-editing technology CRISPR could one day
Disease insect and herbicide tolerance
Canola is one of the GM crops that boasts herbicide-resistant traits
19June 2017
hold the cure to a number of genetic diseases although human genetic manipulation is still far from becoming routine Furthermore CRISPR could become a major force in ecology and conservation especially when paired with other molecular biology tools It could for example be used to introduce genes that slowly kill off mosquitos spreading malaria or genes that slow down the growth of invasive species such as weeds
Since its 2013 demonstration as a genome-editing tool in Arabidopsis and tobacco mdash two widely used laboratory plants ndash CRISPR has been tested on crops including wheat rice soya beans potatoes sorghum oranges and tomatoes It is expected to be used widely in agricultural research applications including boosting crop resistance to pests and reducing the toll of livestock diseases
Precision agriculture and big dataPrecision farming is not a new concept and could be defined as ldquousing every acre within its capability and treating it
according to its needsrdquo according to Hugh Hammond Bennett widely considered to be the father of soil and water conservation who was born in 1881 and died in 1961
Precision agriculture could also be defined as ldquoa management system that is information- and technology-based is site specific and uses one or more of the following sources of data soils crops nutrients pests moisture or yield for optimum profitability sustainability and protection of the environmentrdquo
Nonetheless with the increasing availability of data and tools to generate and interpret data rapidly and cost-effectively it has become possible to do more in-depth analyses of increasingly smaller parts of a farmerrsquos field The
digitisation of this data has made precision farming possible
With todayrsquos equipment
that can collect information digitally
farmers have at their disposal huge quantities
of data The ability to use data from multiple sources to
build a lsquodigitalrsquo picture of a production field enables todayrsquos growers to make quality decisions regarding hybrid choices planting densities fertilisation requirements etc
Furthermore they are able to do this for smaller and increasingly more precise areas in their fields This leads to optimisation of productivity in each one of a growerrsquos fields which ultimately leads to a high level of sustainability and productivity Development in maize genetics and production systems also plays an important role in providing greater food security
Some 92 million hectares of soya beans (83 of all soya beans) are planted with traited varieties and
hybrids globally
20 June 2017
By P Lombard Prof A Agenbag and J McDermott
of canola seedlings
Drought resistance in crops is a crucial aspect of crop farming in the Western Cape This article focuses on canolarsquos reaction to drought and certain observations made in this regard in 2016
Water consumption during the growth stages of canola (plant to harvest) shows a linear increase and reaches a peak during flowering after which it decreases rapidly until physiological ripeness occurs (Canola Council of Canada 2008)
Canola is most sensitive to moisture stress during the flowering stage and the early to mid-pod filling stage (Wan et al 2009) However it is also sensitive to drought during germination Sufficient soil moisture during germination is necessary for rapid and even germination ndash hence a higher germination and establishment percentage It also results in the establishment of stronger seedlings
However it has long been known that canola plants can handle water shortages well during drought conditions if these shortages occur after emergence but only in the early stages of development This statement could hardly be better proven than during 2016 in the Swartland and parts of the Overberg
Extreme droughtAt Langgewens a total of 378mm rain fell during the last ten days of April Similar rainfall occurred in large parts of the Swartland and Overberg and was utilised to establish canola During the next 39 days however it was extremely dry across the entire area and the rainfall figures at Langgewens for example was only 66mm
Canola seedlings across the entire area were subjected to severe moisture stress during 2016 shortly after emergence Since the remainder of the 2016 rainy season was normal and temperatures were fairly low in September (Figures 1 2 3 and 4) the canola miraculously recovered due to its drought resistance and the highest canola yields per hectare recorded in history were attained in the Western Cape despite the initial dry period
Figure 1 Monthly and annual rainfall at Langgewens for 2016 and long term
Figure 2 Monthly temperatures at Langgewens for 2016 and long term
Figure 3 Monthly minimum and maximum temperatures at Tygerhoek for 2016 and long term
Figure 4 Monthly temperatures at Tygerhoek for 2016 and long term
In the Swartland no cultivar trials could previously yield more than 29tha Two cultivar trials and a fungus treatment trial yielded an average of 3tha and more (Langgewens 37tha) in 2016 The drought resistance of canola is further illustrated by Photographs 1 and 2Total 2016
Total 2016
Long term monthly
Long term monthly
Monthly 2016
Monthly 2016
Long term total
Long term total
Tota
l Ma
rch
- S
ep
t (m
m)
Tota
l Ma
rch
- S
ep
t (m
m)
Jan Feb Mar Apr May Jun Jul Aug SepMax 2016 Min 2016 Longt Max Longt Min
Jan Feb Mar Apr May Jun Jul Aug
Max 2016 Min 2016
Longt Max Longt Min
Jan Feb Mar Apr May Jun Jul Aug Sep
Jan Feb Mar Apr May Jun Jul Aug Sep
21June 2017
Photograph 1 A canola field in the Eendekuil area during the drought and after good follow-up rains in 2016
June
August
June
July
August
Photograph 2 A canola field in the Swartland during the drought and after good follow-up rains in 2016 (Photographs supplied by J McDermott E Burger and Philip van Schalkwyk)
Photographs 1 and 2 illustrate the drought stress the plants were subjected to after germination in 2016 Although the plants were initially subjected to drought stress the physiological development did not cease This is a crucial aspect which caused clethodim damage in 2016 because applications were only possible around 46 days after the follow-up rain fell
Sclerotinia effect on yieldPictures in Photograph 1 were taken on the farm De Brug in the Swartland The cultivar was 44Y89 and the seed yield of the field was 198tha Sclerotinia was a problem on this field and possibly reduced the yield potential
The pictures in Photograph 2 were taken in the Eendekuil area on a field where minimum tillage was applied The field was planted with the cultivar Hyola 555 and the average yield on this farm (Baviaanskloof ) was 185tha The cultivar trial on the same field was planted on 10 May and established well (Photograph 3) The average yield of the cultivar trial was 203tha and the yield of Hyola 555 was 2tha
Photograph 3 Eendekuil cultivar trial in 2016
The canola plants in the Eendekuil trial took an average of 96 days until the flowering stage (50 of the plants with one flower) It took approximately 14 days longer than usual but is attributed to the above-average temperatures in May June and July 2016 All trials flowered later in 2016 which is characteristic of a hot growth season The result of a longer growth season is that the crop forms more biomass which increases yield potential if sufficient moisture and low temperatures are available late in the season such as in 2016
ConclusionCanola can recover from a dry period shortly after establishment It is however vital that canola is not planted in soil without sufficient moisture as 20mm is regarded as effective rainfall (Arnon 1992) The result of insufficient soil moisture is weak establishment and uneven germination which are both detrimental to the harvesting process and yield
The recommended planting date for canola in the Western Cape is from the beginning of April in the eastern parts of the Southern Cape until the end of April in the Swartland provided that sufficient soil moisture is available
2 June
12 August
1 November
For more information contact the Directorate Plant Sciences Western Cape Department of Agriculture on 021 808 5321 or email pietlelsenburgcom Sponsored by the Protein Research Foundation Visit the
website wwwproteinresearchnet for newsletters and pamphlets
22 June 2017
By Prof Charlie Reinhardt
Biological control (biocontrol for short) when applied in the broadest sense involves the use of animals insects fungi or other microbes
to feed upon parasitise or otherwise interfere with a targeted pest species Classical biocontrol targets a non-native pest (eg alien invasive weeds) for control by one or more species of biocontrol agents (eg insects pathogens) from the pestrsquos native range
Classical biocontrol remains the most popular and successful approach for controlling alien invasive weed species the world over Fundamental to the success of biocontrol as a practice is the 100 host specificity required of biocontrol agents ndash an attribute that is supposed to protect against harmful effects on non-target species and ecosystems
More readily acceptedFollowing several decades of intensive use of synthetic chemicals (herbicides insecticides fungicides bactericides) for crop protection and other purposes Harris (1991) points to public demand for a shift from chemical to biological control However several dilemmas are associated
with a change in emphasis from chemical to biocontrol ndash obstacles in the way of greater adoption of biocontrol range from scientific legal political to practical issues
Therefore biocontrol is essentially subjected to the same scrutiny as synthetic chemicals except for the fact that the public in particular consumers of farm products in developed countries tends to more readily accept the employment of biocontrol practices for food production than they do chemical control practices
Regulatory authorities responsible for the registration of agrochemical products for pesticides in particular are often perceived by the agrochemical industry to be guided more by public perception (politics) than by the real risks (exposure toxicity) associated with the use of agrochemicals Literature abounds with comparisons of the pros and cons of biocontrol compared to chemical control When the authors are proponents of biocontrol their approach is often to promote biocontrol as an adversarial or alternative measure in relation to the use of synthetic chemicals
Undoubtedly some supporters of the use of pesticides make the same
mistake but fortunately the proponents of integrated pest management (IPM) in which all control practices are considered on an equal footing still hold sway
In order to avoid the quagmire of divergent and conflicting opinions the present discussion will focus solely on salient facts as they apply in practice with reference to examples of weed biocontrol in South Africa
Apparent benefitsThe benefits of successful control of an alien invasive weed in for instance the Kruger National Park through the release of this speciesrsquo natural enemies should be manifestly apparent Safeguards against non-target harmful effects are vested in the standard procedures that candidate biocontrol agents imported from their natural habitats undergo exhaustive screening for efficacy and 100 host specificity under quarantine conditions
The rationale for achieving success with biocontrol in natural environments is that non-target plant species which dominate the plant community ie indigenous vegetation will take the invader(s) place Similar logic applies to the control of aquatic alien invasive weeds (eg water lettuce water hyacinth Kariba weed) except that in this case the taking over by indigenous aquatic plants does not apply due to the dearth of free-floating aquatic plants in South Africa
In contrast in crop production systems the crop or desirable species is usually a single one that occurs at fixed density whereas the weed spectrum on
23June 2017
a particular area can be diverse in terms of weed types and levels of infestation In such a setting selective biocontrol of one or even two weed species will hardly make a difference since individuals of other species already present will simply take their place
Economies of scaleHowever in cases where a particularly noxious (herbicide-resistant poisonous extremely competitive etc) weed occurs in crop production it might be practical to employ biocontrol The basic problem with this kind of biocontrol is that economies of scale will dictate whether the product will have a large enough and sustainable market in order to warrant research and development (RampD) and registration costs
One bioherbicide product that was discontinued in South Africa for the reason that the market was deemed too small is Hakattackreg which was a formulation containing spores of the fungus Colletotrichum gloeosporioides used for controlling the alien invader tree of Australian origin silky or needle hakea (Hakea sericea) (Morris 1982 1983) The same fungus is registered in the United States (US) under the tradename LockDownreg (Delta Farm Press 2009) for the control of a rare legume weed species Aeschynomene virginica (common names curly indigo northern jointvetch) which is particularly hard to control in rice with
synthetic herbicides Other fungus-based bioherbicide products registered in the US (year 2000) were the products Smolderreg and DeVinereg for the control of the parasitic weed dodder (Cuscuta sp)
I am unaware of any bioherbicide product currently registered in South Africa for weed control In this country there are several success stories on the biocontrol of alien invader weeds occurring in natural (eg conservation areas) or seminatural (eg game farms) habitats
According to Moran et al (2011) certain target weeds that have been successfully controlled biologically include the following species several cactus species (eg the prickly pear Opuntia ficus-indica) St Johnrsquos wort (Hypericum perforatum) sesbania (Sesbania punicea) the aquatic weeds
Strategies for management of herbicide-resistant weeds are well documented and frequently communicated on the South African Herbicide Resistance
Initiative (SAHRI) website wwwupaczasahri Prof Reinhardt is project leader at SAHRI which is based in the Department of Plant Production and Soil Science
University of Pretoria (UP) dean of Villa Academy extraordinary professor of weed science UP and extraordinary professor at the Department of Agronomy
Stellenbosch University (SU) References are available from the author on 083 442 3427 or email drcharliereinhardtgmailcom
water fern (Azolla filiculoides) kariba weed (Salvinia molesta) and water lettuce (Pistia stratiotes)
Continuing researchIt should be borne in mind that eradication of these weeds has not been achieved nor was it the aim Consequently they can occasionally be problematic in certain locations Research by the Agricultural Research Council ndash Plant Protection Research Institute on these and many other targets for classical biocontrol is underway and continuous
Cover crop or so-called lsquosmother croprsquo practices provide a type of non-classical biocontrol of weeds By means of this practice certain attributes of the crop are employed for weed suppression and cover cropping is a key component of conservation agriculture
Live crops and residual (dead) plant material are used to withhold light from weed seeds thereby preventing or reducing germination Biochemical compounds called allelochemicals which are released from live and dead crop plants in the phenomenon of allelopathy inhibit the germination growth and development of weeds
Although it is generally accepted that the use of synthetic herbicides will remain the mainstay of weed control programmes long into the future it is imperative that we consider the alternative weed management options available An integrated approach to weed management is crucial for sustainable crop production In all instances all the available weed control options deserve consideration in designing a weed management strategy that offers the best chance of contributing to maximise farmer profits and the achievement of optimal yields of safe and sufficient food
Certain target weeds that have been successfully controlled biologically include the prickly pear St Johnrsquos wort and water lettuce
Classical biocontrol remains the
most popular and successful approach for controlling alien
invasive weed species the world over
24 June 2017
By P Lombard J Strauss and C Cummings Directorate of Plant Sciences Western Cape Department of Agriculture
(Source Canola Focus March 2017)
damage in canola
Evidence shows that canola is an ideal crop for crop rotation systems in the Western Cape Not only does it offer the benefit of good returns but it also provides
the opportunity to control weeds with chemical agents from different groups There are several herbicide options that can contribute to ryegrass control Clethodim (cyclohexanedione) is also widely used under various brands for grass control in canola and especially on conventional cultivars
Moisture strainDuring the past 2016 season clethodim damage occurred in various fields varying from mild to severe It was not only limited to certain farms and occurred across the Swartland and Southern Cape The reason for the damage is mostly attributed to the dry month of May 2016
It is important to understand canolarsquos development since its seedlings do not cease development during periods of drought Image 1 shows seedlings that underwent severe moisture strain five weeks after sowing The plants had already formed five leaves The problem is that herbicides do not function properly under such conditions As a result producers sprayed only clethodim for grass control after the rain in June
Seedlings subjected to drought stress five weeks after planting with severe clethodim damage visible on the insert
Visible symptomsStudies in Australia found that a late spray application and a double dose of clethodim during bud formation resulted in a yield loss of up to 55 (Zerner and Wheeler 2013) The damage was between 0 and 15 at the recommended dosage Up until the eight-leaf stage no damage occurred when using the recommended dose although damage did occur at the higher dosage However there were differences among cultivars with some exhibiting no yield loss ndash a good reason to maintain the recommended dosage
The symptoms are best visible when the plants flower From a distance the field appears to be less yellow in the areas where the damage occurred (Image 2) The flowers are deformed and in severe cases it appeared as if the flower buds had melted (Image 3)
Severely deformed flowers
Plants were less yellow where damage occurred
Poor pod formation occurred with severe damage With less severe damage (plants in the middle of Image 4) the pods were deformed Image 4 depicts plants exhibiting conditions from zero to severe damage They were derived from the same field as the plants in Image 1 Although the field did not exhibit any signs of damage damage occurred where the sprayer turned and a consequently higher dosage was applied
Plants with slight clethodim damage flowered over a longer period (Later on plants continued flowering to compensate) For most seasons the climate in the Western Cape is not favourable for pod development late in the growing season
Recommendations madeThe recommended sowing date of canola in the Western Cape province is from the beginning of April in the eastern parts of the Southern Cape to the end of April in the Swartland ndash provided that there is sufficient soil moisture End of April and May is also a time when dry periods can occur and when weed control cannot be applied effectively
Plants with no slight and severe clethodim damage from left to right
25June 2017
It is crucial that clethodim is sprayed onto canola after the two-leaf stage but before flower bud formation (Note that at this stage no flower buds are visible) Effective pre-emergence weed control is essential since the risk of clethodim spraying can become too high if late application becomes necessary Any late application can be defined as the stage where the canola plant has already developed too far This stage differs among cultivars
Do not under any circumstances consider spraying clethodim and a fungicide together in a tank mixture The result will be severe burn When considering an early fungus spray (for instance for blackleg or white leafspot) first spray the fungicide and follow up seven to ten days later with the herbicide It is important to adhere to the recommendations and dosage provided on the label at all times
For more information contact Piet Lombard at pietlelsenburgcom
26 June 2017Oilseeds f ocus
By Izak Hofmeyr
puts sustainability in the spotlight
The theme of the 57th congress of the Fertiliser Association of Southern Africa (Fertasa) in Durban was sustainability with speakers focusing on
sustainability of the fertiliser industry water soil climate and agriculture
Over the last few decades high fertiliser prices have led to the establishment of many more fertiliser plants which started putting pressure on prices as they came into production Therefore although there is a steady and constant growth in demand for fertilisers internationally the supply remains larger than demand something which constantly keeps pressure on
prices noted Adriaan de Lange Fertasa chairmain in his chairmanrsquos report
Balancing prioritiesRegarding the sustainability of the fertiliser industry in Africa Paul Makepeace from the African Fertiliser and Agribusiness Partnership based in Kenya pointed out that the need for distribution and supply of plant-available nutrients from areas of high concentration to those in need of food production and consumption will continue as populations grow urbanisation continues incomes grow and the understanding of science grows ldquoFertilisers as we know themrdquo he said ldquoare likely to be around for a long time to comerdquo
The main demand on water resources in South Africa will be from a growing population and demand for food coupled with the multiplier effect of climate change on the increased scarcity of water There will therefore be a pressing need to balance priorities Agriculture remains crucial in terms of its ability to provide food and income to the rural poor This was the opinion of Dr Sylvester Mpandeli research manager of the Water Research Commission with regard to the sustainability of water usage
Prof Isaiah Wakindiki of the University of Venda painted a bleak picture of what
awaits humankind if the soil runs out ndash and it is fast in the process ldquoWe have about 60 years of topsoil left Soil loss is up to 40 times the rate of formationrdquo he warned
Prof Roland Schulze of the Centre for Water Resources Research at the University of KwaZulu-Natal suggested that we should recognise that climate change and the associated issues are real and that coping strategies would have to be implemented urgently
In the closing session Prof Herman van Schalkwyk CEO of Suidwes Landbou discussed the sustainability of agriculture For countries to reach long-term sustainability he pointed out they would have to become competitive
Awards receivedFertasa awarded several members in various categories Jane McPherson manager of the Grain SA Farmer Development Programme received the Training and Mentor Award in Small-scale Farming for 2017 while Schalk Grobbelaar fertiliser consultant of Louis Trichardt was nominated for the Silver Medal Extension Award
The Gold Medal was awarded posthumously to Prof Willem Foumllscher previously of the University of Pretoria His two grandsons Willem Foumllscher and Henk van Wyk received the award on his behalf Outgoing Fertasa CEO Adam Mostert was awarded honorary membership
Adam Mostert right receiving honorary membership of Fertasa from Adriaan de Lange
Adriaan de Lange chairman of Fertasa with Jane McPherson of Grain SA
Arrie Janse van Vuuren Willem Foumllscher Henk van Wyk and Adriaan de Lange
27June 2017
MARKETS
By Dr Dirk Strydom
supported by Chinese demand
The global oilseeds supply is expected to reach a record level of 5464 million tons for the seven main oilseeds This high supply means that the production surplus will be at 111 million tons The world supply of soya beans is ample and global production is estimated to
reach a new high of 3454 million tons 336 million tons higher than last yearrsquos production levels It is expected that production in the northern hemisphere will reach 161 million tons and the southern hemisphere 184 million tons
Global soya marketsThe estimated soya bean crops in the United States (US) and Brazil have reached levels of 1172 million tons and 1115 million tons respectively Global traders expect that the Argentine crop will likely be below potential at around 55 million tons mainly due to detrimental weather conditions during the season
The global trade in soya beans is increasing with China being the main destination More than 80 of the anticipated growth in world soya bean imports is destined for that country In the last decade growth in terms of imports to China has created additional demand and supported prices The largest contributor to this increase in demand within the Asian nation is the substitution of dried distillerrsquos grain with solubles (DDGS) with soya meal
Global soya bean crushing is estimated to reach levels of approximately 2824 million tons which is roughly 109 million tons higher than the previous yearrsquos figures In the medium term the rest of the worldrsquos focus will mainly be on US soya bean with unfavourable weather conditions in certain states possibly slowing down the planting progress
Table 1 World supply of the seven main oilseeds (Source Oil world)
Global supply and demand (million tons)
Forecast 201617 201516 201415
Opening stocks 931 972 775
Production 5464 5019 5217
Total supplies 6395 5991 5992
Disappearance 5289 506 502
Ending stocks 1106 931 972
Stocksusage () 209 184 194
Table 2 World soya bean supply and demand (Source Oil world)
Global supply and demand (million tons)
Forecast 201617 201516 201415
Opening stocks 8023 8398 6276
Production 3454 31175 320
N hemisphere 16138 14509 14689
S hemisphere 18402 16666 17311
Total supply 42563 39573 38276
Crush (SeptAug) 2824 27154 25733
Other use 4609 4396 4145
Ending stocks 9714 8023 8398
Stocksusage () 296 254 281
EURussia and UkraineCanadaUSChinaIndiaArgentinaBrazilParaguay
Sunflower figuresThe world sunflower seed production forecast is estimated at a record of 483 million tons This is 53 million tons higher than the previous high in the 201516 season International traders expected the global crushing of sunflower seed to decline to 188 million tons for the period from April to September
The crushing of sunflower seed in Black Sea countries is projected to slow down somewhat over the next six months but it is likely to be offset by more crushing in other regions such as Argentina the European Union (EU) and on the local front The world sunflower seed balance is expected to be significantly less in the second half of this season than at the same time last year as a result of the consumption from Ukraine and Russia
28 June 2017
World production is however still expected to exceed demand during this season Assuming normal weather conditions this year a large crop may be seen in Black Sea countries as sunflower seed is one of the most viable crops for producers in the Ukraine and Russia with its low production cost and adaptability to harsh weather conditions
Table 3 World sunflower seed supply and demand (Source Oil world)
Global supply and demand (million tons)
Forecast 201617 201516 201415
Opening stocks 327 307 294
Production 4828 4285 4133
Total supplies 5155 4592 4427
Ending stocks 357 327 307
Stocksusage () 74 77 75
Canola pricesCanola prices have appreciated due to weather and crop concerns in the EU and Canada which account for approximately 63 of the world supply In Canada the canola futures appreciated more sharply than prices in the EU Snowfall and wet fields are currently delaying the spring plantings of canola which could make it challenging to complete this yearrsquos large plant intentions
In Canada the leading canola producer it is expected that production will be at 194 million tons which is higher than the previous year However with higher export and crushing figures the ending stock is 700 000 tons lower than the previous season
Groundnut cropThe Argentine groundnut crop is likely to reach record levels of one million tons (shelled) this season provided that major losses due to excessive rainfall or frost can be avoided during completion of the harvesting in the short term The Argentine crop for the year is expected to increase by 20 to 25 compared to the previous production season
Table 4 Canola supply and demand (Source Oil world)
Canadian supply and demand (million tons)
Forecast 201617 201516 201415
Opening stocks 202 254 059
Production 194 1838 1641
Imports 008 01 008
Exports 1065 103 914
Crushing 916 832 736
Other use 039 038 026
Ending stocks 13 202 254
Global prices of the majority of oilseeds decreased by small margins on a year-on-year (yy) basis However groundnut prices increased by 42 which was mainly due to production constraints International traders are of the view that global groundnut prices are likely to come under some pressure in the near future if the expected crop size is confirmed If expected production realises in the northern hemisphere and vegetable oil production recovers it can be expected that oilseed prices will be under pressure
Table 5 Main oilseed products (US$ton and Rton) (Sources Grain SA and Oil world)
Product Apr 2017 Apr 2016 change
Soya beans (US CIF Rotterdam) 388 396 -2
Soya beans (Brazil) 388 396 -2
Sunflower seed (EU) 400 427 -6
Groundnuts (US 4050) 1 650 1 163 42
Palm oil (Malaysia) 681 707 -4
Soya bean oil (US) 737 758 -3
Sunflower oil (Arg) 720 771 -7
Soya meal (Arg) 352 355 -1
Fishmeal (Peru) 1 250 1 408 -11
Randdollar 1344 146 -8
Sunflower seed 4 610 6 455 -29
Derived sunflower 5 233 6 126 -15
Soya beans 4 945 5 734 -14
Derived soya beans 5 749 6 317 -9
Soil canola 5 543 6 030 -8
The world supply of soya beans is ample and global production is estimated to reach a new high of 3454 million tons
Local productionThe local production of soya beans is also favourable with the National Crop Estimates Committee (NCEC) expecting a production of 1 233 130 million tons of soya beans (742 000 ndash 2016) 853 470 tons of sunflower seed (755 000 ndash 2016) and 86 600 tons of groundnuts (17 680 ndash 2016)
In the NCECrsquos first intentions-to-plant report for winter grains the canola plantings for the season are expected to be 3221 more than last yearrsquos The estimated area for the season is 90 000ha while last yearrsquos area planted was 68 075ha The prices on the local market followed normal seasonal trends with prices under pressure at harvesting time due to larger supplies within the market
The soya bean crop fared better than most expectations which led to increased pressure on prices This means that prices move below derived prices increasing the crushing margins of processors (Figures 1 and 2) Soya beans should therefore remain under pressure in the short term and will most probably recover in the second half of the year closer to derived prices
29June 2017
MARKETS
Figure 1 Safex soya bean prices and the derived soya bean price (Source Grain SA)
Figure 2 Crushing margins of soya beans (Source Grain SA)
Soya bean prices are sensitive to the exchange rate in times of a balanced supply and demand However in terms of a macroeconomic environment the exchange rate is extremely volatile and sensitive to political instability From Figure 3 it is clear that soya bean prices follow the exchange rate with the exception of times when supply and demand are not in balance In the previous season this was due to limited available supply and in 2017 it is as a result of large supplies
Over the next six months it will be crucial to monitor the exchange rate and use the high volatile movements to the advantage of buyers and sellers depending on the direction of such movement
Figure 3 Soya bean price and rand-dollar exchange rate (Source Grain SA)
30 June 2017
31June 2017
South Africarsquos soya bean production has been a great success story over the past decade with a ramp-up in production reaching one million
tons Over the same period the countryrsquos soya bean crushing capacity has also seen a significant increase
For this reason soya bean crushers and commodity traders have expressed significant interest in the ability to trade the entire crush complex This crush complex includes local soya beans and relies on the Chicago Mercantile Exchange (CME) meal and oil as a proxy for global prices
Key componentThe complex a key component in the soya bean market is what is known as the lsquocrushrsquo spread Soya beans are processed into two products namely soya bean meal (SBM) and soya bean oil The crush spread is the difference between the combined value of the products and the value of the soya beans
It is a measurement of the profit margin for soya bean processors The soya bean processor will be interested in the crush spread as part of its hedging strategy and the speculator will look at the crush spread for trading opportunities
Although we have the individual contracts listed the challenge today is the initial margin efficiency to wrap all three
as a single product in the desired ratios For instance when crushing 100 tons of beans this will result in 74 tons of meal and 17 tons of oil with 9 tons as wastage
Separate contractTherefore a crush spread can be calculated as the price of SBM (Rt) multiplied by 74 plus the price of soya bean oil (Rt) multiplied by 17
Figure 1 Soya bean crush margin
The Johannesburg Stock Exchange (JSE) soya bean crush complex is an easily accessible hedging tool for the crusher while traders are also able to participate in the movements of this crush complex This product is not unique to the JSE as globally the CME Group offers it not only for their local soya beans but also links it with the Dalian Commodity Exchange in China
less the price of soya beans (Rt) The current clearing solution does not allow for this and therefore it necessitated the introduction of a separate contract that will trade the complex wrapped up as a single product
Figure 1 represents a time series of the crush margin supporting the urgency for a price risk management tool such as a futures contract
Advertorial
For more information visit the JSE website wwwjsecoza
32 June 2017
By Dr Charl van der Merwe Tiger Brands
The
Between 20 000 and 25 000 tons of peanuts were used annually for the manufacturing of peanut butter between 2006 and 2013 in South Africa This volume includes splits and 80100s
The peanut butter segment is an important one in the groundnut market of the country The prospects for this market segment are promising
Socio-economic factorsThe demand for a product is influenced by the financial status of the consumer and the socio-economic factors in the country The percentage of citizens who passed matric increased by 27 between 2010 and 2014 (Figure 1) The number of people with a monthly income of between R5 000 and R20 000 increased from 44 to 63 (Figure 2) between 2001 and 2015
Figure 1 Education levels
Figure 2 Household income (Source BFAP)
The increase in household income and the decrease in unemployment from 41 in 2001 to 24 in 2015 equate to an increase in the number of people in the middle to upper classes as indicated in Figure 3
Figure 3 LSM class mobility
The upper middle and upper classes have steadily grown between 2005 and 2010 according to the information presented in Figure 3 This is significant because according to the information in Table 1 peanut butter forms part of the diet of the middle and upper classes
market in South Africa
33June 2017
MARKETS
Table 1 Food choices (Source BFAP)
Population Poorest 30 Lower middle class Upper middle class Wealthiest 20
Animal protein foods (continued)
EggsCanned pilchardsPolonyFreshfrozen
chilled fishPork
Beef sausagePolony
Canned pilchardsPolonyMutton and lamb
Mutton and lambCanned pilchardsPolonyFreshfrozen
chilled fish
EggsPorkFreshfrozen
chilled fishPolonyViennasCanned pilchards
Fats oils
Edible oils (eg cooking oils)MargarinePeanut butter
Edible oils (eg cooking oils)Margarine
Edible oils (eg cooking oils)Margarine
Edible oils (eg cooking oils)MargarinePeanut butter
Edible oils (eg cooking oils)MargarinePeanut butterButter
Peanut butter is included in the diets of the upper middle and upper classes An increase in the number of people in the middle class can equate to an increase in peanut butter consumption Local peanut butter consumption over a twelve-year period is indicated in Figure 4
Figure 4 Peanut butter consumption (Source SAGIS)
Health and marketsMore than 25 000 tons of groundnuts were used for the manufacturing of peanut butter in 2013 It is projected that more than 30 000 tons of groundnuts will be used for peanut butter in 2017
Groundnut consumption is supported by the socio-economic factors as discussed above and by a focus on a healthy diet According to Menrsquos Health magazine groundnuts are a good source of protein The vitamin E helps to protect cells and the magnesium (Mg) in groundnuts assists with metabolic activity
Peanut butter consumption is also influenced by wheat consumption Local wheat consumption is indicated in Figure 5 The information indicates a steady growth in wheat consumption due to the growing middle class in South Africa
Figure 5 Wheat consumption
Groundnut consumption is also influenced by the price of groundnuts and normal levels of supply and demand will influence the price Price movements since 2000 are indicated in Figure 6
Figure 6 Groundnut prices
International groundnut prices increased during 2016 as a result of the rain during harvesting in Argentina and the higher demand from China The possibility exists that prices will decrease if the demand and supply situation returns to normal levels Lower prices can support the demand for groundnuts and peanut butter
ConclusionGrowth in the middle and upper classes in South Africa and higher household incomes over the past few years have boosted the peanut butter market in the country The peanut market has grown by approximately 14 since 2010 Socio-economic factors and the international prices will influence growth in the peanut market in the future
The percentage of local groundnuts used for peanut butter manufacturing increased from 41 between 2011 and 2013 to 51 between 2014 and 2016 compared to 60 in the United States (US)
34 June 2017
By Jolanda Nortjeacute manager of the Southern African Grain Laboratory
201516 production season
The deep root system of a sunflower enables the plant to perform better than other crops during dry seasons making sunflower seed production
very suitable amid South African climatic conditions As a result sunflower seed production exceeded soya bean production this season for the first time since the 201011 season
The final commercial sunflower crop figure of the 201516 season is 755 000 tons This figure represents an increase of almost 14 (92 000 tons) compared to the 201415 season The major sunflower-producing provinces Free State and North West contributed 92 of the total crop (Figure 1)
Figure 1 Provincial contribution to the production of the 201516 sunflower crop
The area utilised for sunflower production increased by almost 25 from 576 000ha in the previous season to 718 500ha this season Due to the drought conditions production only increased by 14 as the yield decreased from 115 to 105tha
Annual improvementsGlobal sunflower seed production for the 201516 season stands at
42 465 million tons with the Ukraine and Russia contributing 51 to this total The forecast for the 201617 season is 47 397 million tons according to figures published in the 2016 US Sunflower Crop Quality Report compiled by the United States (US) National Sunflower Association (NSA)
According to the Bureau for Food and Agricultural Policyrsquos BFAP Baseline Agricultural Outlook 2016ndash2025 the sunflower area is expected to decline in 2017 to around 2015 levels assuming normal rainfall patterns before stabilising at approximately 560 000ha by 2025 An average production increase of 14 per annum is expected to result
in a production of 820 000 tons by 2025 driven by average annual improvements in yield of close to 3 in the same year
During the 2016 harvesting season a representative sample of each delivery of sunflower at the various silos was taken according to the prescribed grading regulations A total of 176 composite
sunflower samples representing the different production regions were analysed for quality and the results published in the fourth annual South African Sunflower Crop Quality Report 201516 Season
Of the 176 samples analysed for the purpose of this survey 78 (138) were graded as Grade FH1 and 38 of the samples were downgraded to class other
sunflower seed (COSF) The percentage of FH1 samples showed a decrease compared to the 86 and 82 of the 201415 and 201314 seasons respectively This decreasing trend could not be attributed to any single grading deviation
Collective deviationsThe majority of samples were downgraded as a result of the percentage of either the screenings foreign matter or the collective deviations or a combination of these exceeding the maximum permissible deviations of 4 and 6 respectively The presence of poisonous seeds (Datura sp) exceeding the maximum permissible number one per 1 000g was also a contributing factor
Gauteng represented by two samples reported the highest weighted average percentage screenings of 360 followed by the North West (N = 80) and Free State (N = 80) with 280 and 201 respectively Limpopo (seven samples) reported the lowest average percentage screenings of 109 The weighted national average was 234 compared to the 205 of the previous season The maximum permissible deviation according to the grading regulations is 4
Sclerotia of Sclerotinia sclerotiorum was observed on 18 of the samples (10) compared to the nine and eleven of the previous two seasons respectively Fourteen of these samples originated in the North West and three in the Free State The highest percentage (180) was present on a sample from Mpumalanga This is however still well below the maximum allowable level of 4 Weighted average levels ranged from 0 for Gauteng and Limpopo 003 in the Free State and 004 in North West
35June 2017
to 026 in Mpumalanga The national average of 004 was equal to the previous season
Foreign matterThe highest weighted percentage foreign matter (177) was reported for the seven samples from Mpumalanga The Free State and North West averaged 161 and 123 respectively The lowest average percentage was found in Limpopo namely 101 The national average of 141 was the highest of the last three seasons
Test weight providing a measure of the bulk density of grain and oilseeds does not form part of the grading regulations for sunflower seed in South Africa An approximation of the test weight of these crop samples was done by determining the g1ℓ filling weight of each sample using the Kern 222 apparatus
The test weight was then extrapolated by means of formulas obtained from the lsquoTest Weight Conversion Chart for Sunflower Seed Oilrsquo of the Canadian Grain Commission (CGC) The weighted average this season was 425kghℓ Individual values ranged from 350 to 481kghℓ Last seasonrsquos values ranged from 34 to 505kghℓ and averaged 442kghℓ (Figure 2)
Figure 2 Comparison of the test weight per province over four seasons
Nutritional componentThe nutritional component analyses of crude protein crude fat crude fibre and ash are reported as a percentage (g100g) on an as-received or as-is basis The weighted average crude protein content this season was 1793 almost one percent higher than the previous season and the highest average value since the start of this survey in 201213 The North West had the highest weighted average crude protein content of 1824 and Mpumalanga the lowest with 1714 The Free Statersquos crude protein content averaged 1777 (Figure 3)
Figure 3 Average crude protein content per season
The weighted average crude fat percentage of 382 was the lowest of the last four seasons and 15 lower than the previous season Gauteng had the highest weighted average crude fat content of 403 The lowest average fat content was observed in the Free State (380) North West and Mpumalanga averaged 382 and 388 respectively (Figure 4)
Figure 4 Average crude fat content per season
The weighted average percentage crude fibre increased slightly from 20 in the previous season to 203 this season Average values varied between 192 in Gauteng to 209 in Mpumalanga The weighted average ash content is slightly higher with 259 than last seasonrsquos 255 The provincial averages ranged from 249 in Mpumalanga to 269 in Limpopo
The results of this survey are available on the Southern African Grain Laboratory NPC (SAGL) website wwwsaglcoza Hard copy reports are distributed to directly affected groups and interested parties The report is also available for
download in PDF format With gratitude to the Oil and Protein Seeds Development Trust (OPDT) for financial support of these annual surveys and to the members of Agbiz Grain for providing the crop samples
June 2017
and its effect on broiler performance
Growth depression effects on poultry due to antinutritional factors present in soya beans have been well documented for over 50
years Trypsin inhibitors are the primary antinutritional factor in soya bean meal (SBM) which is a globulin-type protein Trypsin inhibitors inhibit the conversion of zymogens to active proteases of trypsin and chymotrypsin In addition to their detrimental effects on proteolytic action trypsin inhibitors dramatically affect the size of the pancreases and amount of trypsinogen produced
The requirement to heat treat soya beans has been understood for nearly a century The pH rise was adopted as the common method of determining adequate heat A change in pH above 02 pH units is considered underheated Animal feed manufacturers in Brazil use 03 pH units as the upper limit of SBM processing
It has been established that a pH unit change of zero is not an adequate measure of overprocessing but that if it is between zero and 005 the SBM
has been adequately processed This is a level considered ideal and should be strived toward It must be noted that heat treatment of SBM only destroys those antinutritive factors that are heat-labile
High correlation expectedAs recently as 2001 standardised tests were established for trypsin inhibitor analyses The correlation between trypsin inhibitors and urease activity is expected to be high Urease activity is still the methodology of choice for measuring the acceptable estimation of the trypsin inhibitor content in SBM
It is unclear what the optimum residual concentration of trypsin inhibitors should be Work published as far back as 1991 shows a linear response between bird performance body weight gain (BWG) and feed conversion and levels of trypsin inhibitor activity (TIA) (mgg) in soya bean in the ration There still seems to be considerable uncertainty regarding these levels As recently as 2014 Pacheco et al showed optimal bird performances at TIA of 67mgg rather than the lowest value of 36 which was also fed as a treatment
Response of performance to TIA did not appear linear in this trial Ruiz (2012) observed that if feed contained high levels of SBM with a TIA of more than 35mgg or urease activity above 006 pH units rapid feed passage outbreaks could occur (observation not a trial) detrimentally affecting bird performance
Genetic potentialTIA tests are expensive and time-consuming with a repeatability standard deviation of 027 (Sueiro 2015) Considering the correlation found by Belalcazar and Otalora (2012) as quoted by Riaz (2012) (00738x ndash 01224 with an R2 = 09748) it has been proposed that the urease index should continue to be used in conjunction with TIA ndash a more rapid test for underprocessing but a figure as low as zero is not an indication of overprocessing
The genetic potential of the modern-day broiler has resulted in broilers being slaughtered at an earlier age each year also resulting in a continuous improvement in gain-to-feed ratio Diets have become more nutrient-dense since high-density diets not only achieve maximum performance but have become synonymous with optimal performance
Globally soya bean processing has improved with the consequential improvement in SBM quality The measurement of SBM quality is extremely complex and starts with proximate analysis higher protein levels obviously still being the major economic value driver of SBM The ratio of amino acids to protein also differs depending on the source of SBM ndash the main influence on this being the composition of the soya bean used in processing
Digestibility of nutrients is critical
36
By Dr Erhard Briedenhann
37June 2017
and affected by many criteria other than heat-sensitive antinutritive factors such as levels of lectins mannans raffinose and stachyose Lower fibre levels have therefore been required
The nutrient profile differs among the various sources of SBM Higher protein not only increases the quantity of essential amino acids but there is solid evidence that amino acid digestibility improves as the protein content of the SBM increases
Conclusion SBM quality is determined by many other factors other than TIA level The global industry still considers urease index as the appropriate measurement for underprocessing Levels have been driven down to below 01 urease index to ensure sufficient processing SBM with a higher TIA may have significantly higher digestible amino acid levels irrespective of TIA value
Testing methodsThe international standard method for the determination of soya products is ISO 14902 when compared to the American Association of Cereal Chemists (AACC) standard AACC 22-4001 as modified by Hamerstrand in 1981 and expressed as mg of inhibited trypsin per gram of sample TIA values according to ISO 14902 result in significantly lower values than the previously mentioned method These methods are not directly comparable (Sueiro et al 2015) The particle size of samples during analysis was found critical
Conclusion The testing method needs to be clearly stated and understood when TIA levels vs performance is quoted Particle size is of critical importance
OverprocessingTIA unfortunately does not measure overprocessing of SBM and is something which is of definite concern There is compelling evidence that overprocessed SBM would lead to reduced broiler performance (Wiltafsky 2013) The lower the TIA the higher is the risk of overprocessing and reduced amino acid availability
Conclusion TIA is not a measure of overprocessing but has become a key criterion with regard to SBM quality Lower TIA is a higher risk of overprocessing
Broiler performance and TIAIn studies conducted on SBM of various origins it has been found that United States (US) SBM with a TIUmg of 252 (urease 008) versus that of Argentina with a TIUmg of 198 (urease 0007) exhibited a better crude protein (CP) digestibility and an 88 lysine (Lys) and 88 methionine (Met) digestibility versus Argentina at 86 digestibility
The lower potassium hydroxide (KOH) level of 78 for Argentine SBM tended to overprocessing which could have resulted in lower amino acid digestibility (Ravindran 2014) US SBM consistently resulted in better broiler performance due to its protein quality despite higher TIA levels
Gous (2016) replaced Argentine (Molinos) SBM with a TIA of 128 with South African SBM with a TIA of 304 Although not statistically significant the South African SBM had a numerically better feed conversion of 005 and superior BWG of 45g at slaughter for Ross broilers
This could be ascribed to the higher protein content and quality of our local SBM and clearly corroborates what has been experienced commercially that high-quality South African SBM not only performs as well as Argentine-imported meal in broiler rations but can demand a premium due to its higher digestible nutrient content
Conclusion There is no trial work in the literature which demonstrates that a difference of one TIA mgg will have any significant effect on broiler performance at low levels of TIA Such trial work still needs to be done Contrary to this significant difference in broiler performance it has been found between SBMs with the same TIA levels
Particle sizeIn the US Pacheco (2014) concluded that when using expeller SBM there was not a linear response in bird performance to TIA A curvilinear response for both feed conversion and BWG was experienced The particle size of the SBM had a greater effect on bird performance than the TIA
Conclusion Particle size of SBM could have as significant an effect on broiler performance as TIA Broiler performance response to TIA is not necessarily linear
EnzymesThere is compelling evidence that the use of various enzymes ndash mainly protease pectinase and phytase ndash could positively influence the negative effects of antinutritive factors in SBM further complicating the correlation between TIA and bird performance (Stefanello 2012) (Aureli 2013) and (Faruk 2013)
Conclusion Enzyme inclusion and their combinations could have a significant effect on TIA level which will affect broiler performance
UniformityUniformity of SBM is considered globally and by the local feed industry to be an important criterion At the beginning of soya bean volume crushing in South Africa it presented a challenge due to the restricted continuity of processing This aspect has been improved considerably so much so that major end users of certain locally produced material are starting to report subtle differences between Argentine- and South African-produced SBM uniformity
Conclusion High-quality South African SBM if produced in large consistent volumes can obtain the uniformity experienced by Argentine suppliers
TIA in full-fat and expeller SBMIt can be confirmed that laboratories testing TIA are very comfortable to analyse for TIA in soya bean full-fat soya expeller SBM and solvent-extracted SBM TIA tends to be higher in full-fat and expeller SBM but they can confirm this is not due to the TIA test but the fact that trypsin inhibitor content of these raw materials is generally higher than solvent-extracted SBM due to the fact that they have not been heat-treated to the extent that solvent-extracted SBMs are Despite this they can still deliver good broiler performance to the same extent that moderately higher TIA SBMs can
Conclusion TIA analysis can be performed equally well on soya beans full-fat soya expeller oilcake and solvent-extracted meal TIA limits are applicable to all soya bean protein sources
38 June 2017
By Jolanda Nortjeacute manager of the Southern African Grain Laboratory
The extreme drought conditions experienced this past season has led to an approximately 27 (184 500ha) decline in the
local soya bean production area Yield was also negatively impacted with the average national yield decreasing from 156tha in 201415 to 147tha The result was an almost 31 (328 000 tons) decline in the commercial soya bean crop compared to the previous season
Sunflower production surpassed soya bean production for the first time since the 201011 season The major soya bean producing provinces contributing 75 of the total crop were Mpumalanga and the Free State Numbers reflected in Figure 1 were obtained from the National Crop Estimates Committee (NCEC)
Figure 1 Tonnage and area utilised for soya bean production since the 200506 season
201516 season
According to the Bureau for Food and Agricultural Policyrsquos BFAP Baseline Agricultural Outlook 2016ndash2025 a high demand for soya beans arising from expanded crushing capacity is expected to cause a sharp increase in area utilised for soya bean production in 2017
Assuming normal rainfall patterns production is expected to recover to more than 900 000 tons this year
Global productionAn estimated 31281 million tons of soya beans were produced during the 201516 season according to the World Agricultural Supply and Demand Estimates (WASDE) report (WASDE-563) The United States
contributed 34 Brazil 31 and Argentina 18 to this total Global soya bean production during the 201617 season is projected to be 34079 million tons Soya beans account for more than half of the worldrsquos oilseed production
During the 2016 harvesting season
a representative sample of each delivery of soya beans at the various silos was taken according to the prescribed grading regulations A total of 143 composite soya bean samples representing the different production regions were analysed for quality and the results published in the
fifth annual South African Soya Bean Crop Quality Report 201516 Season
Quality results summaryOf the 143 samples analysed for the purpose of this survey 89 (127) were graded as Grade SB1 and 16 of the samples were downgraded to class other soya beans (COSB) During the previous two seasons 87 (201415) and 88 (201314) of the samples were graded SB1
The majority of the samples were downgraded as a result of either the presence of poisonous seeds exceeding the maximum permissible number of either one per 1 000g or seven per 1 000g or as a result of the percentage other grain andor foreign matter exceeding the maximum permissible deviations of 05 and 5 respectively
According to the South African soya bean grading regulations the determination of the percentage wet pods in a consignment must be performed based on a working sample of at least 10kg of soya beans from a representative sample of the consignment Due to practical considerations the samples received at the Southern African Grain Laboratory (SAGL) NPC from the grain storage companies are typically plusmn5kg
Pods were found in twelve of the 143
39June 2017
samples graded All of these pods were green upon receival at the SAGL but not wet according to the definition The percentage of these pods in the samples ranged from 005 to 050 based on a working sample size of at least 200g
The national average percentage of foreign matter has increased over the last five seasons reaching its highest level this season increasing from 034 in 201112 to 082 during the last season and to 085 now The samples from North West had the highest weighted average percentage namely 162 The percentage in the rest of the samples ranged from 026 in the Northern Cape to 091 in Mpumalanga
Presence of sclerotiaThe number of samples containing sclerotia increased from 20 in the previous season to 36 this season The highest percentages of sclerotia observed (076 and 064) were on samples from Mpumalanga followed by a sample from North West with 060 These percentages are however still well below the maximum permissible level of 4 The national weighted average percentage this season was 004 compared to the 001 of the previous season
North West (eight samples) reported the highest weighted average percentage soya beans and parts of soya beans above the 18mm slotted sieve which pass through the 475mm round-hole sieve namely 156 and the sample from the Northern Cape the lowest at 040 Mpumalanga with the highest number of samples (91) reported an average of 090 The Free State averaged 103 (23 samples) The national weighted average percentage decreased from 181 the previous season to 092 this season
The lowest weighted average percentage of defective soya beans on the 475mm sieve were observed on the samples from Mpumalanga namely 146 The Northern Cape reported the highest percentage of 494 followed by North West and KwaZulu-Natal with
399 and 334 respectively The national weighted average increased slightly from 195 last season to 202 this season
The national weighted average percentage soiled soya beans of 206 is the highest since this survey started in the 201112 season when the average was 160 The average was 077 last season Average weighted percentages per province ranged from 128 in the Northern Cape to 446 in Limpopo
Soiled soya beansAlthough the number of samples containing soiled soya beans as well as the average percentage soiled soya beans per sample increased significantly none of the percentages were above the maximum permissible deviation of 10 according to the grading regulations Last season one sample
Figure 2 Average crude protein content per province over five seasons
from Mpumalanga exceeded this limit
Test weight providing a measure of the bulk density of grain and oilseeds does not form part of the grading regulations for soya beans in South Africa An approximation of the test weight of these crop
samples was done by determining the g1ℓ filling weight of each sample using the Kern 222 apparatus
The test weight was then extrapolated by means of formulas obtained from the lsquoTest Weight Conversion Chart for Soya Beanrsquo of the Canadian Grain Commission (CGC) The weighted average this season was 709kghℓ Individual values ranged from 649 to 73kghℓ Last seasonrsquos values ranged from 633 to 782kghℓ and also averaged 709kghℓ
Soya beans are the main oilseed crop produced in South Africa driven mainly by the demand for protein feed in the animal feed industry The nutritional component analyses namely crude protein crude fat crude fibre and ash are reported on a dry basis (DB) (moisture-free basis)
The weighted average crude protein content this season was 4022 slightly higher than the 3989 and 3984 of the previous two seasons The sample from the Northern Cape had the highest weighted average crude protein content of 4156 while Gauteng reported the lowest average that of 3886 (Figure 2)
An estimated 95 of the area planted to soya beans in South Africa consists of genetically
modified crops
Soya beans are the main oilseed crop produced in South Africa driven mainly by the demand for protein feed in the animal feed industry
40 June 2017
Crude fat percentageThe weighted average crude fat percentage of 194 compared very well with the 193 in 201415 The samples from KwaZulu-Natal had the highest weighted average crude fat content of 206 The lowest average fat content was observed in Mpumalanga with 191 (Figure 3)
Figure 3 Average crude fat content per province over five seasons
The weighted average percentage crude fibre varied from 62 in Limpopo to 76 in the Northern Cape The national
GM-crops These soya beans have tolerance
to herbicides (chemical
products used to destroy weeds but
not the crop plants) Worldwide GM soya
beans occupy 80 of the area planted to this crop
Fifteen (10) of the crop samples were screened by means of the EnviroLogix QuickComb Kit for bulk soya beans to quantitatively determine the presence of the CP4 EPSPS trait (Roundup Readyreg) All the samples tested positive
The results of this survey are available on the SAGL website wwwsaglcoza Hard copy reports are distributed to directly affected groups and interested parties The report is also available for download in PDF format With gratitude to the Oil and Protein Seeds Development Trust (OPDT) for financial support of these annual surveys and to the members of Agbiz Grain for providing the crop samples
weighted average of 73 was higher this season than in the previous one when the average was 64 A small variation of only 005 is observed with regard to the national weighted average ash content
over the five seasons that this survey has been conducted This season the average ash content was 461 Samples from the Northern Cape and Limpopo tend to show higher ash contents over seasons
The majority of soya beans producedgrown in
South Africa are genetically modified (GM) An estimated 95 of the area planted to soya beans in South Africa consists of
- OFC - Oilseed June 2017
- IFC - Oilseed June 2017
- p1-5 Intro pages -Oilseed June 2017
- p6-17 Agronomy - Oilseed June 2017
- p18-21 Seeds - Oilseed June 2017
- p22-25 Chemicals amp fertiliser - Oilseed June 2017
- p26 General - Oilseed June 2017
- p27-33 Markets -Oilseed June 2017
- p34 - 40 Quality - Oilseed June 2017
- IBC - Oilseed Dec 2016
- OBC - Oilseed June 2017
-
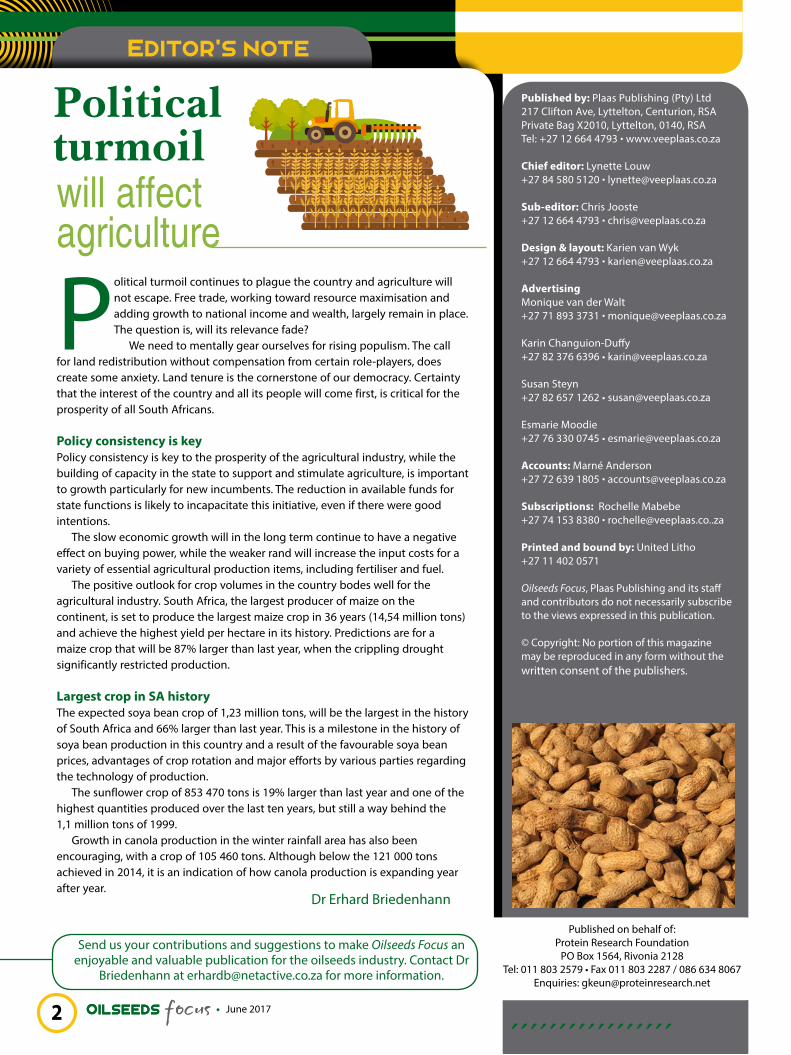
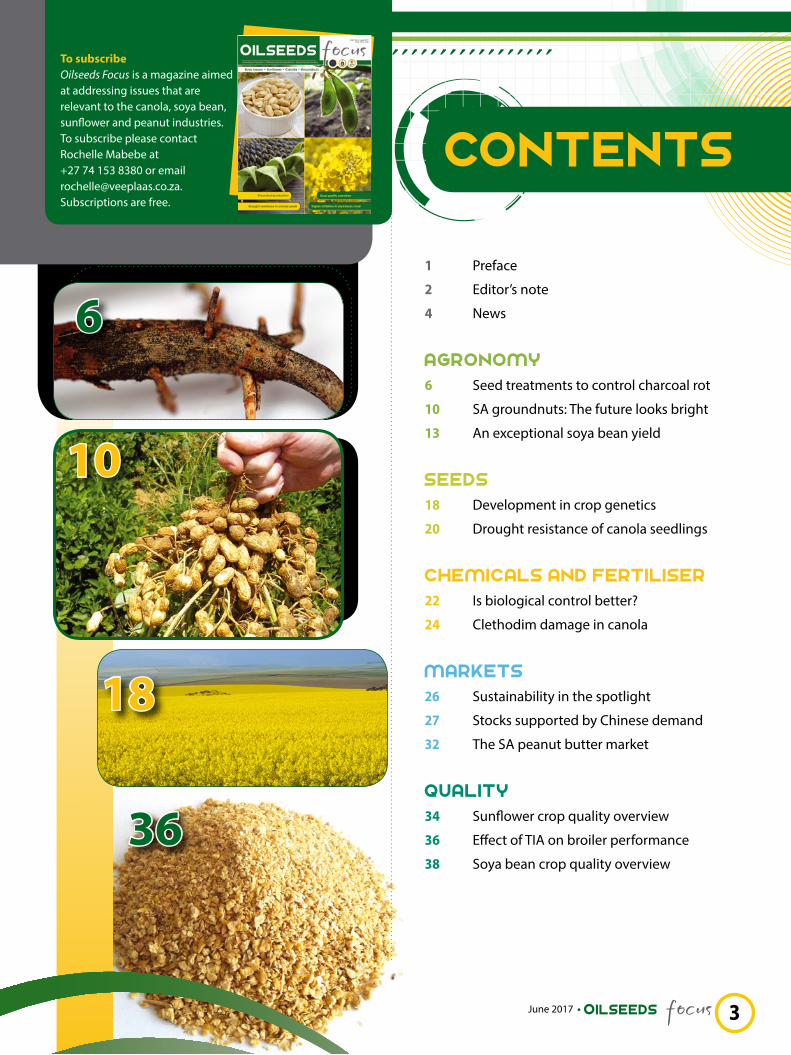
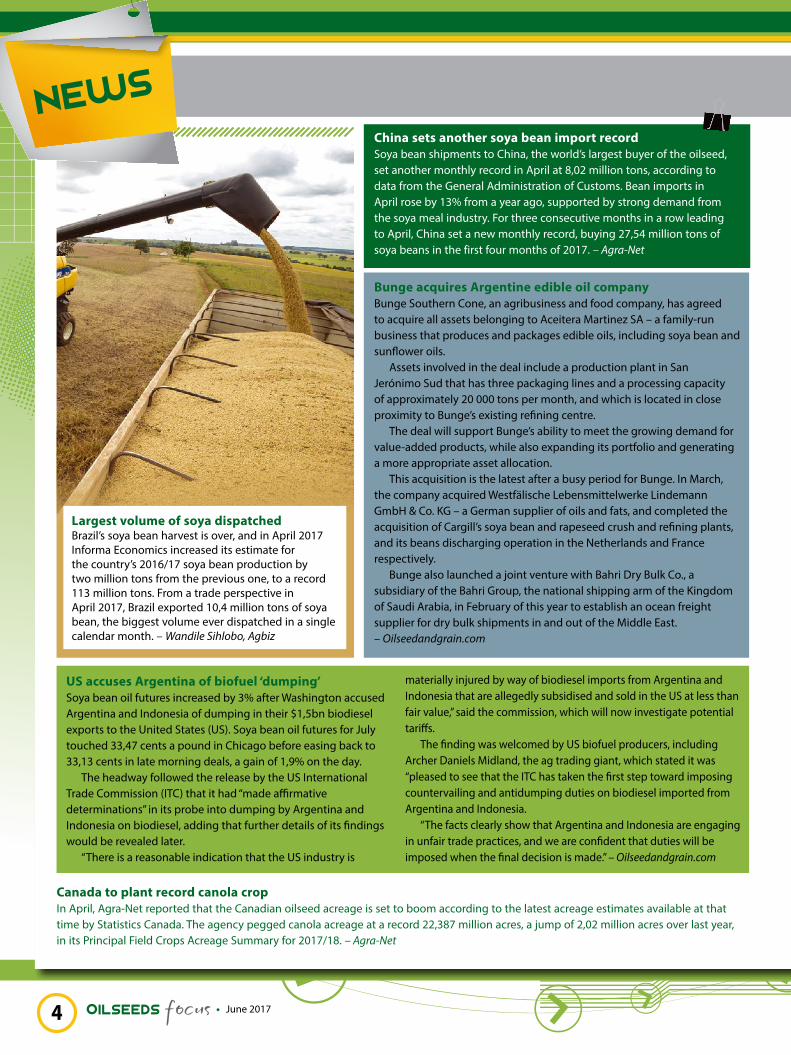
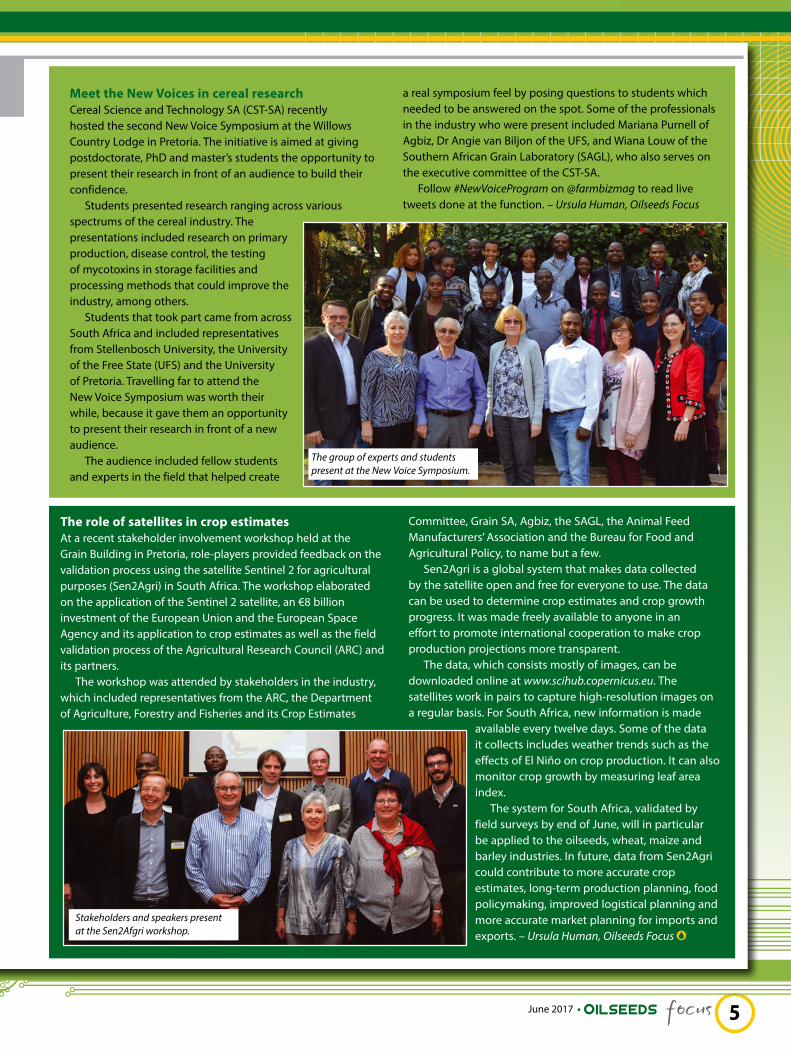
June 2017
By Sebastian Reznikov Gabriel R Vellicce Victoria Gonzaacutelez Vicente de Lisi Atilio P Castagnaro and L Daniel Ploper
Soya bean plants are susceptible to root and stem base rot caused by soil pathogens at all growth stages One of these diseases is charcoal rot caused by the polyphagous fungus Macrophomina phaseolina (Mp)
This pathogen infects a wide host range of nearly 500 species in more than 100 families around the world including other important crops such
as cotton chickpea maize and common beans Morphologically physiologically genetically and pathogenically the fungus varies widely enabling it to adapt to different environmental conditions and hence become widely distributed geographically
Soya bean seedlings affected by Mp develop reddish brown lesions on the hypocotyl which becomes ash-grey and then turns black The presence of small black sclerotia in the cortical tissue confers the charcoal appearance that gives the disease its name In addition to these symptoms and signs mature plants develop chlorotic lesions on their leaves
which then die but remain attached to the stem and finally the plants die prematurely A combination of water stress and high temperatures favours disease development
Alternative controlBiological agents can provide an alternative to control certain plant diseases especially when other methods such as chemicals are difficult to use Sclerotium rolfsii Rhizoctonia solani and Pythium spp were successfully controlled by using antagonistic microorganisms such as Trichoderma spp Penicillium spp Aspergillus spp and some bacteria
A talc-based formulation of Trichoderma viride produced on a commercial scale was widely used by farmers to treat seeds of sesame groundnut sunflower chickpea and mung bean for the biocontrol of root rot disease caused by Mp
Treating the seeds with Trichoderma spp and Gliocladium virens and storing them was more advantageous than storing the formulation and treating the seeds just before planting Trichoderma harzianum inhibited the in vitro linear growth and microsclerotia production of Mp
To control fungal pathogens chemical products are available for application of soil seeds andor foliage Fungicide seed treatments are intended to control diseases that cause seed rot and damping-off before and after emergence Thiram fludioxonil and captanpentachloronitrobenzenethiabendazole that were used to control Sclerotinia sclerotiorum in field trials managed to reduce sclerotia formation in infected soya bean seed by 98 Moreover treatment of soya bean seeds with thiram reduced the incidence of Phomopsis sojae and increased seed germination
No chemicals availableCurrently no chemicals are available to control charcoal rot in soya bean Seed treatments may be helpful if soya bean seeds are infected with Mp but there is no information on specific active ingredients effective against this pathogen Among fungicides tested against Mp in infected cotton seeds carbendazim quintozene and benomyl enhanced plant emergence (PE) and disease control Moncerenreg pencycuron carboxin 200 tolclofos-methyl and Maximum AP also increased the percentage of surviving seedlings
to control charcoal rot in soya bean
6
Microsclerotia of the charcoal rot fungus on the lower portion of a
soya bean stem (Photograph wwwcropprotectionnetworkorg)
A soya bean field being destroyed by charcoal rot (Photograph wwwcropprotectionnetworkorg)
By Sebastian Reznikov Gabriel R Vellicce Victoria Gonzaacutelez Vicente de Lisi Atilio P Castagnaro and L Daniel Ploper
7June 2017
from Mp-infected seedsThe efficacy of seed
treatments with two biological products (Trichoderma viride or Bacillus subtilis) or one chemical treatment with thiophanate-methylpyraclostrobin with regard to PE disease severity Mp colony-forming units (CFUs) crop yield and 1 000-seed weight in two soya bean cultivars maturity group (MG) VIII were evaluated in the field to control Mp on two soya bean cultivars NA8000 RG and Munasqa RR in Tucumaacuten north-western Argentina
Biological and chemical seed treatments have been shown to be effective to control Mp on various crops For cotton several fungicides were tested as seed treatments to determine their efficacy in controlling Mp infection Monceren 250 FS and tolclofos-methyl were the best-performing fungicides in controlling Mp on cotton in the greenhouse A reduction in the percentage of dead sesame plants
affected by Mp was found when seeds were treated with biological antagonists such as Trichoderma sp and Aspergillus sp
Lower disease severityIn NA8000 RG and Munasqa RR treatments had a similar performance trend the highest crop yield values were obtained with the pyraclostrobinthiophanate-methyl mixture followed by those obtained with T viride and B subtilis
Similar yield increases were also observed an increment of 100kg was obtained when applying chemical seed
treatments (propineb and dicarboximide) in sesame to control Mp as compared with yield values obtained with the untreated control Mp did infect Munasqa RR and NA8000 RG but severity levels and CFUg were higher in NA8000 RG in both seasons The chemical and biological treatments resulted in lower disease severity and CFUg values than in the inoculated control
These results go along with lower disease incidence in eggplants treated with different Trichoderma sp strains Results from this study of chemical and biological seed treatments of soya bean to control charcoal rot will be useful to develop more efficient management strategies for this important disease
References and the full article are available from the authors Contact the
Estacioacuten Experimental Agroindustrial Obispo Colombres (EEAOC) at email
dteeaocorgar for more information
Charcoal rot can attack crops at any growth stage (Photograph wwwlsuagcentercom)
8 June 2017
9June 2017
Advertorial
stem rot in canola
By Jannie Bruwer area sales manager Bayer
Although numerous diseases could play a role in the economic viability of canola it is vital to address the management practices of Sclerotinia control
Sclerotinia stem rot is caused by the fungus Sclerotinia sclerotiorum The fungus survives as sclerotia either in the soil or in stubble on the soil surface
The occurrence of sclerotia is more prominent under the following conditionsbull Rain of 25ndash50mm 10 to 14 days prior to the beginning
of flowering ndash thus wet conditions for at least 10 days on the soil surface in mid- to late winter Temperatures of 11ndash15degC trigger the germination of sclerotia and result in spore release
bull Extended wet periods during flowering trigger petal infection
bull Extended wet periods during petal drop and the lodging of petals on stems lead to subsequent stem infection Stem lesion development occurs in humidwet conditions and temperatures between 20 and 25degC
Moisture is keyMoisture is the key factor in Sclerotinia infection Good soil moisture starting two weeks in advance and continuing throughout flowering will greatly increase the risk of infection Conversely low rainfall and low humidity during these stages will significantly reduce the disease risk and fungicide applications rarely prove to be beneficial under these conditions Moisture can refer to rain relative humidity in the 80s or morning dew
After rain it takes approximately 10 to 12 days for apothecia (tiny golf tee-shaped mushrooms) to release ascospores into the air Wind spreads these spores onto nearby plants Ascospores cannot infect plants directly but they need dead tissue such as fallen petals on leaves and stems covering the spores to create an ideal microclimate to continue their disease cycle
Decaying petals provide ascospores with the energy to produce hyphae that release oxalic acid (C₂H₂O₄) and other infection agents which the fungus needs to invade healthy plant tissue and infect the plant Once inside the plant the fungus grows up and down the stem eventually cutting off moisture and nutrient flow and killing the plant The life cycle of Sclerotinia can be seen in Figure 1
Figure 1 Sclerotinia stem rot in canola (Source Department of Agriculture and Food Western Australia)
Timing of spraying will be determined by climatic conditions The optimum time to spray is between 20 to 30 flowering but in certain years when the climatic conditions in early flowering are not favourable for the disease to develop a later spray (not later than 50 flowering) may be more ideal
Should conditions remain unfavourable for disease development (hot and dry) after 50 flowering a fungicide application will be unwarranted After 50 flowering most of the flowers are on side branches Therefore little risk of petals landing on the main stem to cause economic damage exists
A 10 change in flower percentage only takes three to four days Thus the timing of a spray is critical in controlling the disease
Spray during floweringIt is essential that any fungicide application coincides with the peak flowering period Fungicides prevent spores from growing on petals after petals have fallen onto leaves and stems and started to decay It is easier to spray petals at the top of the canopy during peak flowering than after they have fallen which is why living flowers are the target
Spraying before 20 flowering is too early because no petals have dropped and no pods have formed At 30 flowering petal drop has just begun Most of the petals drop during 30 flowering Therefore spraying between 20 and 30 flowering ensures that many flowers have opened and the spray will cover petals before they drop
Fungicides reduce the severity of infection but will not completely eliminate Sclerotinia especially if conditions are favourable throughout flowering
For more information contact Jannie Bruwer on 082 806 8715 or email janniebruwerbayercom
9June 2017
June 2017
During the 201516 production year the groundnut industry in South Africa reached its lowest production figures since records were kept from
1936 Exporters and producers had to pull out all the stops to save the industry and to generate a return to become one of the worldrsquos best producers once again
Alfonso Visser owner of the Golden Peanut and Tree Nuts plant in Hartswater and one of the major groundnut producers in the country says the main reason why the groundnut industry faced challenges was the El Nintildeo climate phenomenon
While it may seem as though producers lost interest in cultivating groundnuts they didnrsquot really stop producing It was rather a matter of late rainfall that forced producers to skip planting over the past three years During this period the first rains came only between 20 and 28 December and by that time it was too late for groundnut plantings In certain parts producers elected to plant maize instead
Visser also says that producers who had the opportunity to plant groundnuts in those three years recorded their best profits ever This year the harvest looks promising and the climate has played its part Groundnut production is set to show better profits than most other crops this year
In the 201516 production year South African producers could only manage to plant 22 600ha and only 17 680 tons of groundnuts were harvested This season South Africa received its first rains from mid-November to mid-December and many producers managed to plant the commodity again Approximately 55 000ha were planted in the Free State Limpopo Northern Cape and the North West Apart from rainfall at the right time there is also a promising export market in Europe and Japan which are all good signs for a profitable year
Keen interest in planting Adri Botha chairperson of the Groundnut Forum of South Africa (SAGF) says groundnut production in the country similar to many other crops experienced hard times due to the drought but when the opportunity presented itself farmers showed keen interest in planting again
Information from the South African Grain Information Service (SAGIS) indicates that an average of 48 720ha were planted over the past ten years and the average harvest during this time was 66 139 tons The average over the last five years has declined however During this time an average of 45 015ha was planted and the average harvest was 52 568 tons In the past two years groundnut production has declined even more
As noted before only 22 600ha were
planted during the 201516 production year and a mere 18 850 tons were harvested The effect of this decrease in volumes is that South Africa failed to produce sufficient quantities of groundnuts for local consumption with international buyers not receiving the regular volumes they are used to
Botha believes that with a stable and adequate supply this market will be regained easily enough because South African exporters are renowned for quality and reliability under normal circumstances Visser is also very optimistic regarding the export market He says South Africa did not lose the international market The supply did decrease which negatively affected the export market because international buyers turned to other more reliable sources Despite this South Africa still exports to Japan and Europe with a focus on the higher-income sector of these countries
Figure 1 South African groundnut production figures 200607ndash201617
10
By Koos du Pisanie
The 2017 harvest looks promising and the climate has played its part in setting the table for better production and higher profits
11June 2017
New possibilities for businessThere are new possibilities available for groundnut producers but these will entail hard work especially in respect of the export market Botha says that due to a changing and declining supply South Africa has lost some of its standing in recent years as a reliable export source for the international groundnut market in Europe and Japan However the markets are still there to be regained and expanded if the broader industry commits to the commodity and consistent supply of high-quality products
Last year was one of the worst production years in South Africa but exporters still managed to provide 36 or 2 317 tons of the harvest to Japan 32 to Mozambique 12 to the Netherlands and 11 to Belgium
ldquoSouth African groundnuts are of a good quality and well known in the international market Up until 1994 the country was known for its excellent quality and buyers didnrsquot hesitate to use South African groundnuts directly in their production lines without the need for more sorting or processing Unfortunately in the move from a single-channel
marketing structure via the Oilseeds Board as well as the challenges brought on by labour issues and adjustments needed on the technological side primary producers started considering other commodities In this process South Africa lost the ability to retain its spot in the market along with many international buyers reluctantly forced to source products from alternative origins
ldquoAt the same time Argentina rose as a worthy opponent in the global supply arena making matters even more difficult for exporters Still the international demand on the back of global population growth along with the marketability of groundnuts as an excellent source of nutrients and healthy oils leaves the door wide open to usrdquo Botha says
Challenges for the futureVisser says groundnut production levels in South Africa have been so low in the past two to three years that even the national market experienced a shortage He believes that one of the challenges for the groundnut industry is achieving an increase in local consumption
In the past peanut butter formed a
major portion of the menus relating to food projects for schools prisons and non-profit organisations assisting the homeless for instance because it is affordable and high in protein Lately however it has become too expensive for this purpose Due to a decline in quality this market has also shrunk Therefore the first challenge will be to increase local consumption again
ldquoThe second challenge is identifying cultivars which will produce higher yields Farming has become expensive and producers have to find ways to cut down on input costs while still delivering higher returns In the groundnut industry we need access to cultivars that will deliver higher yields This way we can cut on unit costs and deliver a more affordable product to the marketrdquo Visser says
Exceptionally high yieldsBotha adds that in addition to hope for continued local cultivar development international cultivar owners are sought and invited to submit seed to be included in the local Elite Cultivar Trials funded and managed via the Oilseeds Advisory Committee (OAC) She says groundnut production has always been more profitable than any other competing crop but is also more intensive and the necessary attention should be given to best practices in an effort to ensure that available cultivars reach their full potential It is no secret that certain farmers will deliver exceptionally high yields with the existing available material
Another of the challenges in the industry ndash for which excellent work has already been done ndash is introducing groundnut production as a high-income crop to emerging farmers The focus and goal is to help these farmers become regular producers of quality products through courses and mentorship ultimately giving them access to the larger and more formal market environment
For any information on the groundnut industry in South Africa contact Alfonso Visser on 082 948 2222
or 053 474 1345 or Adri Botha on 082 376 5940
In addition to continued local cultivar development the industry is also seeking international cultivar owners to submit seed to be included in the local Elite Cultivar Trials funded and managed via the Oilseeds Advisory Committee
12 June 2017
13June 2017
Exceptional yields are possible with soya beans provided that you correctly attend to every facet of the cultivation process This year a soya bean yield of
up to 8tha filled the combine harvester to the brim on the farm Leeubank of Gerrit Roos near Wonderfontein in Mpumalanga
Last year he was crowned champion soya bean producer (under irrigation) in the Weigh to Wintrade National Yield Competition when a block of two hectares he entered yielded an average of 5236tha This year the harvester measured just over 8tha in certain parts of his irrigated fields Roos says careful attention to small things in every aspect of the entire cultivation process makes the difference because he manages everything in a precision farming system
Every year Roos plants strip trials containing the soya bean cultivars of different seed enterprises This allows them to determine which cultivars best suit the conditions on his farm Roos plants approximately 1 000ha maize and 450ha soya beans He also manages a livestock branch
Maize and soya beans are planted in a crop rotation system which means the fields are planted with soya beans every three years When he joined the
By Andries Gouws
An
soya bean yield
enterprise Roos planted soya bean trials and although maize sets
the tone as the primary crop the soya beans have stood their ground especially considering their hidden benefits
Since their first soya bean planting in 199293 they have doubled the average yield on dryland from 18 to 36tha They also plant soya beans under centre pivot irrigation and 20ha with underground drip irrigation These fields deliver an average yield of 4 and 425tha respectively
Strip-till systemOrtman implements are used to strip-till the land During last yearrsquos planting season a large section of the fields was too damp for these implements and a broad-tilling implement (Fieldspan) was used after which the soil was compacted with a roller The advantage of this process is that germination takes place evenly and the soil is much more even thus reducing wear and tear on the blades of the combine harvesterrsquos soya bean table and saves a lot of money
In the strip-till system only the soil in which the seed will be planted is
tilled to a depth of 280mm Every year the strips are moved slightly to eventually utilise the entire land area The fields consist mainly of Avalon soils and care is taken to keep the soil pH level between 6 and 65
Since 2000 they have been using a precision farming system with a diamond pattern (100m times 100m) where soil samples are taken and analysed annually If the analyses indicate a shortage of lime or other nutrients corrections are made continuously Every third year lime is applied across the board and fertilisers are applied throughout according to changing needs
Roos says he has found that soya beans react most favourably to lsquooldrsquo fertilisation For this reason a mixture of 012 fertiliser at 200kgha is broadcast just after the maize which is followed by soya beans that have been harvested This leads to a reaction between the
Spray applications are combined to prevent unnecessary cultivation
Gerrit Roos with his award as winner of the irrigation section of the Weigh to Wintrade National Yield Competition
14 June 2017
15June 2017
crop residues fertiliser and organisms in the soil which in turn stimulates the earthworm numbers in the soil
Roos plants cultivars that exhibit resistance to Roundupreg herbicide Upon planting herbicide is applied to the soil to postpone the first Roundupreg application for as long as possible Proven cultivars are planted as are the best performers in every yearrsquos strip trials The cultivars that grow upright are planted at approximately 300 000 plants per hectare and the shrub-type cultivars at 260 000 to 280 000 plants per hectare in rows 90cm apart The seeds are planted at a depth of between 4 and 5cm to ensure that there is sufficient moisture for even germination
Fungal disease controlAround 40 days after planting the first Roundupreg application is done Supplementary nutrients and fungicides are mixed into the herbicide to respectively lessen the shock and prevent counter fungal diseases from becoming an even greater problem At approximately 60 days after planting a copper spray is applied in support of the effort to control fungal diseases
At the first flowering stage a mixture of mono-ammonium phosphate (MAP) and diammonium phosphate (DAP) specialist fertiliser products for soya beans are applied at 4 to 5kgha with a fungicide and some brown sugar (as agglutinant) Later the cultivars with a long growth period receive another fungicide application As soon as flowering time is over they administer a last application of Roundupreg to ensure that all weeds are eliminated
Fungal diseases are becoming a major problem and especially Sclerotinia can harm the yield Roos says his experience is that soya beans that are planted earlier are not as severely plagued by these diseases Producers traditionally plant soya beans after having planted maize When using underground drip irrigation fungal diseases are not such a big problem
Drip irrigationThey installed the underground drip irrigation around a decade ago The dripper lines are installed approximately 350mm below the ground 200mm apart and the drippers in the lines 20mm apart Every dripper has the capacity to apply two litres of water per hour
The advantages of this irrigation system entailbull That it uses 50 to 75 less water than
a centre pivotbull Irrigation can be done with precisionbull It keeps fungal diseases at baybull At least one less fungicide
application is necessarybull Fertiliser can be placed at the root
zone
The system also has its challenges among others that the depth of cultivations over the pipes should be very accurate The system must be installed in square or rectangular blocks
and the dripper lines can be 180 to 200m in length at most to maintain the pressure for even application Continuous maintenance is necessary and the system must be cleaned regularly to prevent the drippers from clogging
Mice can also present a huge challenge They would typically dig the pipes open and bite holes into them For this reason they have erected owl cages near the fields and planted poles with bails on the contours where owls can rest while they are hunting Only environmentally friendly methods are used to control the mice
The system is initially more expensive to install than a centre pivot but in the long run (after about six years) it becomes the cheaper of the two
Although soya beans can hold their own as a crop in a farming enterprise its use as a rotation crop has numerous advantages The nitrogen (N) deposits that soya beans leave behind in the soil can lead to maize yields of at least 2tha higher than where soya beans were not planted the previous year
Soya crop residues are also manna for sheep The animals ingest the residues and pick up the kernels behind the harvester The additional protein
during mating ensures a higher lambing percentage and in certain years there are between 10 and 15 more twins
All soya beans are processed on farm into soya oil soya oilcake containing 46 protein and 6 energy and full-fat soya oilcake with 37 protein and approximately 20 energy Initially the oil was pressed to use as fuel on the farm but due to the huge increase in plant oil prices it is no longer a viable option The oilcake is used in the cattle and sheep feedlots on the farm Roos says they add value to everything that leaves the farm
For more information contact Gerrit Roos on 083 635 3873 or email
glroosgmailcom
The soya seeds are planted fairly deep to ensure good germination This is a soya bean field on Leeubank near Wonderfontein in Mpumalanga
This year the combine harvester indicated a yield of just over 8tha on certain parts of the soya bean fields
16 June 2017
17June 2017
Promosie-artikel
Phb 65A70Phb 65A70 is rsquon nuwe sonneblomkultivar met hoeuml opbrengspotensiaal Dit is rsquon medium tot lang groeiseisoenkultivar en is geskik vir droeumllandverbouing in die westelike produksiegebiede Die kultivar se dae tot 50 blom is 65
Dit presteer op alle grondtipes in 091m-rye en het rsquon plantdatum van Oktober tot Desember Die beste plantpopulasie is 35 000 tot 40 000 plante per hektaar
Belangrike agronomiese eienskappe (uitstekend = 9 swak = 1)Sekelnek 6Opbrengspotensiaal 7Planthoogte 175Saadvulling 7Eenvormigheid 6Proteiumlenkonsentrasie 176Oliekonsentrasie 428Staanvermoeuml 8Kruistipe 3W
Siekteverdraagsaamheid (verdraagsaam 9 ndash 7 matig 6 ndash 4 vatbaar 3 ndash 1)Bruinroes 7Witroes 6Wortel- en stamsiekte 7
Kies Phb 65A70 vir goeiebull Opbrengste en aanpasbaarheidbull Groeiperiode en eenvormigheidbull Goeie siektebestandheidbull Weerstand teen omvalbull Bestand teen voeumllskadebull Pas in enige kultivarpakket
P65LL02P65LL02 is rsquon sonneblomkultivar wat groot opbrengsverbetering toon van konsepgenetika Dit is rsquon medium tot lang groeiseisoen-kultivar en is geskik vir droeumllandverbouing in die westelike produksiegebiede Die kultivar se dae tot 50 blom is 68
Dit presteer op alle grondtipes in 091 tot 15m-rye en het rsquon plantdatum van Oktober tot Desember Die beste plantpopulasie is 35 000 tot 40 000 plante per hektaar
Belangrike agronomiese eienskappe (uitstekend = 9 swak = 1)Sekelnek 6Opbrengspotensiaal 8Planthoogte 175Saadvulling 7Eenvormigheid 7Staanvermoeuml 8Kruistipe 3W
Siekteverdraagsaamheid (verdraagsaam 9 ndash 7 matig 6 ndash 4 vatbaar 3 ndash 1)Bruinroes 7Witroes 7Wortel- en stamsiekte 7
Kies P65LL02 vir goeiebull Opbrengste en aanpasbaarheidbull Groeiperiode en eenvormigheidbull Goeie siektebestandheidbull Weerstand teen omvalbull Bestand teen voeumllskadebull Pas in enige kultivarpakket
Twee medium tot lang groeiseisoen-sonneblomkultivars is vir droeumllandverbouing in die westelike produksiegebiede beskikbaar
Vir meer inligting kontak Philip Fourie landboukundige van DuPont Pioneer by 082 909 3262 of philipfouriepioneercom
18 June 2017
By Andrew Bennett Asia Africa technology lead Monsanto
Technologies in agriculture and in particular in maize production continue to advance in leaps and bounds It is interesting to examine
how many disease- insect- and herbicide-tolerant transgenic traits are registered globally across all agricultural crops According to the Centre for Environmental Risk Assessment (CERA) database some 206 traits are available in these categories (wwwcera-gmcorg)
Nine virus-resistant traits are available across carnations papaya plum squash common beans and potatoes There are 77 insect-resistant traits in maize cotton tomato potato soya beans and rice There are 120 herbicide-resistant traits spread across cotton maize carnations canola soya bean creeping bent grass tobacco common bean flax sugar beet lucerne rice chicory and wheat
Insect resistance and herbicide tolerance clearly dominate and crops of focus are essentially maize (with 48 insect-resistant traits and 52 herbicide-tolerant traits) soya bean (with three insect-
resistant traits and 17 herbicide-tolerant traits) and cotton (with 20 insect-resistant traits and 20 herbicide-tolerant traits)
Some 92 million hectares of soya beans (83 of all soya beans) 24 million hectares of cotton (75 of all cotton) and 54 million hectares of maize (29 of all maize) are planted with traited varieties and hybrids globally
DroughtGardtradeDroughtGardtrade is one of the new traits that holds much promise especially in maize production regions in South Africa where rainfall is often low uncertain or erratic The trait in DroughtGardtrade is the worldrsquos first drought-tolerant biotechnology trait for maize and is designed to help maize plants better tolerate drought stress and minimise the risk of failure in drought conditions and was commercialised in the United States (US) in 2013
Yield gain in hybrids with DroughtGardtrade occurs because it slows down the growth of maize hybrids experiencing moisture stresses such that existing soil moisture is saved for the
critical period of flowering resulting in less kernel abortion thus protecting the expected yield
Nutritional quality traitsThis is a more complicated segment to quantify but traits such as low lignin (to enhance digestibility in livestock) in lucerne non-browning apples pro-vitamin A and iron-enriched bananas vitamins A- B9- and C-enriched maize high-content omega 3 fatty acid-enriched canola beta carotene-enriched rice and low-saturatedhigh-oleic fatty acid-enriched soya beans are but a few that are receiving attention currently (Agnegraves E Ricroch amp Marie-Ceacutecile Heacutenard-Damave 2016)
CRISPR ndash a new gene-editing toolClustered regularly interspaced short palindromic repeats (CRISPR) is a naturally occurring ancient defence mechanism found in a wide range of bacteria which evolved to protect them against viral infections As far as back the 1980s scientists observed a strange pattern in certain bacterial genomes One deoxyribonucleic acid (DNA) sequence would be repeated continuously with unique sequences in between the repeats
Scientists realised the unique sequences in between the repeats matched the DNA of viruses ndash specifically viruses that prey on bacteria CRISPR form part of the bacteriarsquos immune system keeping parts of the viral DNA of dangerous viruses so it can recognise and defend against such viruses the next time they attack A second part of the defence mechanism is a set of enzymes called CRISPR-associated (Cas) proteins which can precisely snip DNA and remove the DNA of invading viruses
Using this precise gene-editing technology CRISPR could one day
Disease insect and herbicide tolerance
Canola is one of the GM crops that boasts herbicide-resistant traits
19June 2017
hold the cure to a number of genetic diseases although human genetic manipulation is still far from becoming routine Furthermore CRISPR could become a major force in ecology and conservation especially when paired with other molecular biology tools It could for example be used to introduce genes that slowly kill off mosquitos spreading malaria or genes that slow down the growth of invasive species such as weeds
Since its 2013 demonstration as a genome-editing tool in Arabidopsis and tobacco mdash two widely used laboratory plants ndash CRISPR has been tested on crops including wheat rice soya beans potatoes sorghum oranges and tomatoes It is expected to be used widely in agricultural research applications including boosting crop resistance to pests and reducing the toll of livestock diseases
Precision agriculture and big dataPrecision farming is not a new concept and could be defined as ldquousing every acre within its capability and treating it
according to its needsrdquo according to Hugh Hammond Bennett widely considered to be the father of soil and water conservation who was born in 1881 and died in 1961
Precision agriculture could also be defined as ldquoa management system that is information- and technology-based is site specific and uses one or more of the following sources of data soils crops nutrients pests moisture or yield for optimum profitability sustainability and protection of the environmentrdquo
Nonetheless with the increasing availability of data and tools to generate and interpret data rapidly and cost-effectively it has become possible to do more in-depth analyses of increasingly smaller parts of a farmerrsquos field The
digitisation of this data has made precision farming possible
With todayrsquos equipment
that can collect information digitally
farmers have at their disposal huge quantities
of data The ability to use data from multiple sources to
build a lsquodigitalrsquo picture of a production field enables todayrsquos growers to make quality decisions regarding hybrid choices planting densities fertilisation requirements etc
Furthermore they are able to do this for smaller and increasingly more precise areas in their fields This leads to optimisation of productivity in each one of a growerrsquos fields which ultimately leads to a high level of sustainability and productivity Development in maize genetics and production systems also plays an important role in providing greater food security
Some 92 million hectares of soya beans (83 of all soya beans) are planted with traited varieties and
hybrids globally
20 June 2017
By P Lombard Prof A Agenbag and J McDermott
of canola seedlings
Drought resistance in crops is a crucial aspect of crop farming in the Western Cape This article focuses on canolarsquos reaction to drought and certain observations made in this regard in 2016
Water consumption during the growth stages of canola (plant to harvest) shows a linear increase and reaches a peak during flowering after which it decreases rapidly until physiological ripeness occurs (Canola Council of Canada 2008)
Canola is most sensitive to moisture stress during the flowering stage and the early to mid-pod filling stage (Wan et al 2009) However it is also sensitive to drought during germination Sufficient soil moisture during germination is necessary for rapid and even germination ndash hence a higher germination and establishment percentage It also results in the establishment of stronger seedlings
However it has long been known that canola plants can handle water shortages well during drought conditions if these shortages occur after emergence but only in the early stages of development This statement could hardly be better proven than during 2016 in the Swartland and parts of the Overberg
Extreme droughtAt Langgewens a total of 378mm rain fell during the last ten days of April Similar rainfall occurred in large parts of the Swartland and Overberg and was utilised to establish canola During the next 39 days however it was extremely dry across the entire area and the rainfall figures at Langgewens for example was only 66mm
Canola seedlings across the entire area were subjected to severe moisture stress during 2016 shortly after emergence Since the remainder of the 2016 rainy season was normal and temperatures were fairly low in September (Figures 1 2 3 and 4) the canola miraculously recovered due to its drought resistance and the highest canola yields per hectare recorded in history were attained in the Western Cape despite the initial dry period
Figure 1 Monthly and annual rainfall at Langgewens for 2016 and long term
Figure 2 Monthly temperatures at Langgewens for 2016 and long term
Figure 3 Monthly minimum and maximum temperatures at Tygerhoek for 2016 and long term
Figure 4 Monthly temperatures at Tygerhoek for 2016 and long term
In the Swartland no cultivar trials could previously yield more than 29tha Two cultivar trials and a fungus treatment trial yielded an average of 3tha and more (Langgewens 37tha) in 2016 The drought resistance of canola is further illustrated by Photographs 1 and 2Total 2016
Total 2016
Long term monthly
Long term monthly
Monthly 2016
Monthly 2016
Long term total
Long term total
Tota
l Ma
rch
- S
ep
t (m
m)
Tota
l Ma
rch
- S
ep
t (m
m)
Jan Feb Mar Apr May Jun Jul Aug SepMax 2016 Min 2016 Longt Max Longt Min
Jan Feb Mar Apr May Jun Jul Aug
Max 2016 Min 2016
Longt Max Longt Min
Jan Feb Mar Apr May Jun Jul Aug Sep
Jan Feb Mar Apr May Jun Jul Aug Sep
21June 2017
Photograph 1 A canola field in the Eendekuil area during the drought and after good follow-up rains in 2016
June
August
June
July
August
Photograph 2 A canola field in the Swartland during the drought and after good follow-up rains in 2016 (Photographs supplied by J McDermott E Burger and Philip van Schalkwyk)
Photographs 1 and 2 illustrate the drought stress the plants were subjected to after germination in 2016 Although the plants were initially subjected to drought stress the physiological development did not cease This is a crucial aspect which caused clethodim damage in 2016 because applications were only possible around 46 days after the follow-up rain fell
Sclerotinia effect on yieldPictures in Photograph 1 were taken on the farm De Brug in the Swartland The cultivar was 44Y89 and the seed yield of the field was 198tha Sclerotinia was a problem on this field and possibly reduced the yield potential
The pictures in Photograph 2 were taken in the Eendekuil area on a field where minimum tillage was applied The field was planted with the cultivar Hyola 555 and the average yield on this farm (Baviaanskloof ) was 185tha The cultivar trial on the same field was planted on 10 May and established well (Photograph 3) The average yield of the cultivar trial was 203tha and the yield of Hyola 555 was 2tha
Photograph 3 Eendekuil cultivar trial in 2016
The canola plants in the Eendekuil trial took an average of 96 days until the flowering stage (50 of the plants with one flower) It took approximately 14 days longer than usual but is attributed to the above-average temperatures in May June and July 2016 All trials flowered later in 2016 which is characteristic of a hot growth season The result of a longer growth season is that the crop forms more biomass which increases yield potential if sufficient moisture and low temperatures are available late in the season such as in 2016
ConclusionCanola can recover from a dry period shortly after establishment It is however vital that canola is not planted in soil without sufficient moisture as 20mm is regarded as effective rainfall (Arnon 1992) The result of insufficient soil moisture is weak establishment and uneven germination which are both detrimental to the harvesting process and yield
The recommended planting date for canola in the Western Cape is from the beginning of April in the eastern parts of the Southern Cape until the end of April in the Swartland provided that sufficient soil moisture is available
2 June
12 August
1 November
For more information contact the Directorate Plant Sciences Western Cape Department of Agriculture on 021 808 5321 or email pietlelsenburgcom Sponsored by the Protein Research Foundation Visit the
website wwwproteinresearchnet for newsletters and pamphlets
22 June 2017
By Prof Charlie Reinhardt
Biological control (biocontrol for short) when applied in the broadest sense involves the use of animals insects fungi or other microbes
to feed upon parasitise or otherwise interfere with a targeted pest species Classical biocontrol targets a non-native pest (eg alien invasive weeds) for control by one or more species of biocontrol agents (eg insects pathogens) from the pestrsquos native range
Classical biocontrol remains the most popular and successful approach for controlling alien invasive weed species the world over Fundamental to the success of biocontrol as a practice is the 100 host specificity required of biocontrol agents ndash an attribute that is supposed to protect against harmful effects on non-target species and ecosystems
More readily acceptedFollowing several decades of intensive use of synthetic chemicals (herbicides insecticides fungicides bactericides) for crop protection and other purposes Harris (1991) points to public demand for a shift from chemical to biological control However several dilemmas are associated
with a change in emphasis from chemical to biocontrol ndash obstacles in the way of greater adoption of biocontrol range from scientific legal political to practical issues
Therefore biocontrol is essentially subjected to the same scrutiny as synthetic chemicals except for the fact that the public in particular consumers of farm products in developed countries tends to more readily accept the employment of biocontrol practices for food production than they do chemical control practices
Regulatory authorities responsible for the registration of agrochemical products for pesticides in particular are often perceived by the agrochemical industry to be guided more by public perception (politics) than by the real risks (exposure toxicity) associated with the use of agrochemicals Literature abounds with comparisons of the pros and cons of biocontrol compared to chemical control When the authors are proponents of biocontrol their approach is often to promote biocontrol as an adversarial or alternative measure in relation to the use of synthetic chemicals
Undoubtedly some supporters of the use of pesticides make the same
mistake but fortunately the proponents of integrated pest management (IPM) in which all control practices are considered on an equal footing still hold sway
In order to avoid the quagmire of divergent and conflicting opinions the present discussion will focus solely on salient facts as they apply in practice with reference to examples of weed biocontrol in South Africa
Apparent benefitsThe benefits of successful control of an alien invasive weed in for instance the Kruger National Park through the release of this speciesrsquo natural enemies should be manifestly apparent Safeguards against non-target harmful effects are vested in the standard procedures that candidate biocontrol agents imported from their natural habitats undergo exhaustive screening for efficacy and 100 host specificity under quarantine conditions
The rationale for achieving success with biocontrol in natural environments is that non-target plant species which dominate the plant community ie indigenous vegetation will take the invader(s) place Similar logic applies to the control of aquatic alien invasive weeds (eg water lettuce water hyacinth Kariba weed) except that in this case the taking over by indigenous aquatic plants does not apply due to the dearth of free-floating aquatic plants in South Africa
In contrast in crop production systems the crop or desirable species is usually a single one that occurs at fixed density whereas the weed spectrum on
23June 2017
a particular area can be diverse in terms of weed types and levels of infestation In such a setting selective biocontrol of one or even two weed species will hardly make a difference since individuals of other species already present will simply take their place
Economies of scaleHowever in cases where a particularly noxious (herbicide-resistant poisonous extremely competitive etc) weed occurs in crop production it might be practical to employ biocontrol The basic problem with this kind of biocontrol is that economies of scale will dictate whether the product will have a large enough and sustainable market in order to warrant research and development (RampD) and registration costs
One bioherbicide product that was discontinued in South Africa for the reason that the market was deemed too small is Hakattackreg which was a formulation containing spores of the fungus Colletotrichum gloeosporioides used for controlling the alien invader tree of Australian origin silky or needle hakea (Hakea sericea) (Morris 1982 1983) The same fungus is registered in the United States (US) under the tradename LockDownreg (Delta Farm Press 2009) for the control of a rare legume weed species Aeschynomene virginica (common names curly indigo northern jointvetch) which is particularly hard to control in rice with
synthetic herbicides Other fungus-based bioherbicide products registered in the US (year 2000) were the products Smolderreg and DeVinereg for the control of the parasitic weed dodder (Cuscuta sp)
I am unaware of any bioherbicide product currently registered in South Africa for weed control In this country there are several success stories on the biocontrol of alien invader weeds occurring in natural (eg conservation areas) or seminatural (eg game farms) habitats
According to Moran et al (2011) certain target weeds that have been successfully controlled biologically include the following species several cactus species (eg the prickly pear Opuntia ficus-indica) St Johnrsquos wort (Hypericum perforatum) sesbania (Sesbania punicea) the aquatic weeds
Strategies for management of herbicide-resistant weeds are well documented and frequently communicated on the South African Herbicide Resistance
Initiative (SAHRI) website wwwupaczasahri Prof Reinhardt is project leader at SAHRI which is based in the Department of Plant Production and Soil Science
University of Pretoria (UP) dean of Villa Academy extraordinary professor of weed science UP and extraordinary professor at the Department of Agronomy
Stellenbosch University (SU) References are available from the author on 083 442 3427 or email drcharliereinhardtgmailcom
water fern (Azolla filiculoides) kariba weed (Salvinia molesta) and water lettuce (Pistia stratiotes)
Continuing researchIt should be borne in mind that eradication of these weeds has not been achieved nor was it the aim Consequently they can occasionally be problematic in certain locations Research by the Agricultural Research Council ndash Plant Protection Research Institute on these and many other targets for classical biocontrol is underway and continuous
Cover crop or so-called lsquosmother croprsquo practices provide a type of non-classical biocontrol of weeds By means of this practice certain attributes of the crop are employed for weed suppression and cover cropping is a key component of conservation agriculture
Live crops and residual (dead) plant material are used to withhold light from weed seeds thereby preventing or reducing germination Biochemical compounds called allelochemicals which are released from live and dead crop plants in the phenomenon of allelopathy inhibit the germination growth and development of weeds
Although it is generally accepted that the use of synthetic herbicides will remain the mainstay of weed control programmes long into the future it is imperative that we consider the alternative weed management options available An integrated approach to weed management is crucial for sustainable crop production In all instances all the available weed control options deserve consideration in designing a weed management strategy that offers the best chance of contributing to maximise farmer profits and the achievement of optimal yields of safe and sufficient food
Certain target weeds that have been successfully controlled biologically include the prickly pear St Johnrsquos wort and water lettuce
Classical biocontrol remains the
most popular and successful approach for controlling alien
invasive weed species the world over
24 June 2017
By P Lombard J Strauss and C Cummings Directorate of Plant Sciences Western Cape Department of Agriculture
(Source Canola Focus March 2017)
damage in canola
Evidence shows that canola is an ideal crop for crop rotation systems in the Western Cape Not only does it offer the benefit of good returns but it also provides
the opportunity to control weeds with chemical agents from different groups There are several herbicide options that can contribute to ryegrass control Clethodim (cyclohexanedione) is also widely used under various brands for grass control in canola and especially on conventional cultivars
Moisture strainDuring the past 2016 season clethodim damage occurred in various fields varying from mild to severe It was not only limited to certain farms and occurred across the Swartland and Southern Cape The reason for the damage is mostly attributed to the dry month of May 2016
It is important to understand canolarsquos development since its seedlings do not cease development during periods of drought Image 1 shows seedlings that underwent severe moisture strain five weeks after sowing The plants had already formed five leaves The problem is that herbicides do not function properly under such conditions As a result producers sprayed only clethodim for grass control after the rain in June
Seedlings subjected to drought stress five weeks after planting with severe clethodim damage visible on the insert
Visible symptomsStudies in Australia found that a late spray application and a double dose of clethodim during bud formation resulted in a yield loss of up to 55 (Zerner and Wheeler 2013) The damage was between 0 and 15 at the recommended dosage Up until the eight-leaf stage no damage occurred when using the recommended dose although damage did occur at the higher dosage However there were differences among cultivars with some exhibiting no yield loss ndash a good reason to maintain the recommended dosage
The symptoms are best visible when the plants flower From a distance the field appears to be less yellow in the areas where the damage occurred (Image 2) The flowers are deformed and in severe cases it appeared as if the flower buds had melted (Image 3)
Severely deformed flowers
Plants were less yellow where damage occurred
Poor pod formation occurred with severe damage With less severe damage (plants in the middle of Image 4) the pods were deformed Image 4 depicts plants exhibiting conditions from zero to severe damage They were derived from the same field as the plants in Image 1 Although the field did not exhibit any signs of damage damage occurred where the sprayer turned and a consequently higher dosage was applied
Plants with slight clethodim damage flowered over a longer period (Later on plants continued flowering to compensate) For most seasons the climate in the Western Cape is not favourable for pod development late in the growing season
Recommendations madeThe recommended sowing date of canola in the Western Cape province is from the beginning of April in the eastern parts of the Southern Cape to the end of April in the Swartland ndash provided that there is sufficient soil moisture End of April and May is also a time when dry periods can occur and when weed control cannot be applied effectively
Plants with no slight and severe clethodim damage from left to right
25June 2017
It is crucial that clethodim is sprayed onto canola after the two-leaf stage but before flower bud formation (Note that at this stage no flower buds are visible) Effective pre-emergence weed control is essential since the risk of clethodim spraying can become too high if late application becomes necessary Any late application can be defined as the stage where the canola plant has already developed too far This stage differs among cultivars
Do not under any circumstances consider spraying clethodim and a fungicide together in a tank mixture The result will be severe burn When considering an early fungus spray (for instance for blackleg or white leafspot) first spray the fungicide and follow up seven to ten days later with the herbicide It is important to adhere to the recommendations and dosage provided on the label at all times
For more information contact Piet Lombard at pietlelsenburgcom
26 June 2017Oilseeds f ocus
By Izak Hofmeyr
puts sustainability in the spotlight
The theme of the 57th congress of the Fertiliser Association of Southern Africa (Fertasa) in Durban was sustainability with speakers focusing on
sustainability of the fertiliser industry water soil climate and agriculture
Over the last few decades high fertiliser prices have led to the establishment of many more fertiliser plants which started putting pressure on prices as they came into production Therefore although there is a steady and constant growth in demand for fertilisers internationally the supply remains larger than demand something which constantly keeps pressure on
prices noted Adriaan de Lange Fertasa chairmain in his chairmanrsquos report
Balancing prioritiesRegarding the sustainability of the fertiliser industry in Africa Paul Makepeace from the African Fertiliser and Agribusiness Partnership based in Kenya pointed out that the need for distribution and supply of plant-available nutrients from areas of high concentration to those in need of food production and consumption will continue as populations grow urbanisation continues incomes grow and the understanding of science grows ldquoFertilisers as we know themrdquo he said ldquoare likely to be around for a long time to comerdquo
The main demand on water resources in South Africa will be from a growing population and demand for food coupled with the multiplier effect of climate change on the increased scarcity of water There will therefore be a pressing need to balance priorities Agriculture remains crucial in terms of its ability to provide food and income to the rural poor This was the opinion of Dr Sylvester Mpandeli research manager of the Water Research Commission with regard to the sustainability of water usage
Prof Isaiah Wakindiki of the University of Venda painted a bleak picture of what
awaits humankind if the soil runs out ndash and it is fast in the process ldquoWe have about 60 years of topsoil left Soil loss is up to 40 times the rate of formationrdquo he warned
Prof Roland Schulze of the Centre for Water Resources Research at the University of KwaZulu-Natal suggested that we should recognise that climate change and the associated issues are real and that coping strategies would have to be implemented urgently
In the closing session Prof Herman van Schalkwyk CEO of Suidwes Landbou discussed the sustainability of agriculture For countries to reach long-term sustainability he pointed out they would have to become competitive
Awards receivedFertasa awarded several members in various categories Jane McPherson manager of the Grain SA Farmer Development Programme received the Training and Mentor Award in Small-scale Farming for 2017 while Schalk Grobbelaar fertiliser consultant of Louis Trichardt was nominated for the Silver Medal Extension Award
The Gold Medal was awarded posthumously to Prof Willem Foumllscher previously of the University of Pretoria His two grandsons Willem Foumllscher and Henk van Wyk received the award on his behalf Outgoing Fertasa CEO Adam Mostert was awarded honorary membership
Adam Mostert right receiving honorary membership of Fertasa from Adriaan de Lange
Adriaan de Lange chairman of Fertasa with Jane McPherson of Grain SA
Arrie Janse van Vuuren Willem Foumllscher Henk van Wyk and Adriaan de Lange
27June 2017
MARKETS
By Dr Dirk Strydom
supported by Chinese demand
The global oilseeds supply is expected to reach a record level of 5464 million tons for the seven main oilseeds This high supply means that the production surplus will be at 111 million tons The world supply of soya beans is ample and global production is estimated to
reach a new high of 3454 million tons 336 million tons higher than last yearrsquos production levels It is expected that production in the northern hemisphere will reach 161 million tons and the southern hemisphere 184 million tons
Global soya marketsThe estimated soya bean crops in the United States (US) and Brazil have reached levels of 1172 million tons and 1115 million tons respectively Global traders expect that the Argentine crop will likely be below potential at around 55 million tons mainly due to detrimental weather conditions during the season
The global trade in soya beans is increasing with China being the main destination More than 80 of the anticipated growth in world soya bean imports is destined for that country In the last decade growth in terms of imports to China has created additional demand and supported prices The largest contributor to this increase in demand within the Asian nation is the substitution of dried distillerrsquos grain with solubles (DDGS) with soya meal
Global soya bean crushing is estimated to reach levels of approximately 2824 million tons which is roughly 109 million tons higher than the previous yearrsquos figures In the medium term the rest of the worldrsquos focus will mainly be on US soya bean with unfavourable weather conditions in certain states possibly slowing down the planting progress
Table 1 World supply of the seven main oilseeds (Source Oil world)
Global supply and demand (million tons)
Forecast 201617 201516 201415
Opening stocks 931 972 775
Production 5464 5019 5217
Total supplies 6395 5991 5992
Disappearance 5289 506 502
Ending stocks 1106 931 972
Stocksusage () 209 184 194
Table 2 World soya bean supply and demand (Source Oil world)
Global supply and demand (million tons)
Forecast 201617 201516 201415
Opening stocks 8023 8398 6276
Production 3454 31175 320
N hemisphere 16138 14509 14689
S hemisphere 18402 16666 17311
Total supply 42563 39573 38276
Crush (SeptAug) 2824 27154 25733
Other use 4609 4396 4145
Ending stocks 9714 8023 8398
Stocksusage () 296 254 281
EURussia and UkraineCanadaUSChinaIndiaArgentinaBrazilParaguay
Sunflower figuresThe world sunflower seed production forecast is estimated at a record of 483 million tons This is 53 million tons higher than the previous high in the 201516 season International traders expected the global crushing of sunflower seed to decline to 188 million tons for the period from April to September
The crushing of sunflower seed in Black Sea countries is projected to slow down somewhat over the next six months but it is likely to be offset by more crushing in other regions such as Argentina the European Union (EU) and on the local front The world sunflower seed balance is expected to be significantly less in the second half of this season than at the same time last year as a result of the consumption from Ukraine and Russia
28 June 2017
World production is however still expected to exceed demand during this season Assuming normal weather conditions this year a large crop may be seen in Black Sea countries as sunflower seed is one of the most viable crops for producers in the Ukraine and Russia with its low production cost and adaptability to harsh weather conditions
Table 3 World sunflower seed supply and demand (Source Oil world)
Global supply and demand (million tons)
Forecast 201617 201516 201415
Opening stocks 327 307 294
Production 4828 4285 4133
Total supplies 5155 4592 4427
Ending stocks 357 327 307
Stocksusage () 74 77 75
Canola pricesCanola prices have appreciated due to weather and crop concerns in the EU and Canada which account for approximately 63 of the world supply In Canada the canola futures appreciated more sharply than prices in the EU Snowfall and wet fields are currently delaying the spring plantings of canola which could make it challenging to complete this yearrsquos large plant intentions
In Canada the leading canola producer it is expected that production will be at 194 million tons which is higher than the previous year However with higher export and crushing figures the ending stock is 700 000 tons lower than the previous season
Groundnut cropThe Argentine groundnut crop is likely to reach record levels of one million tons (shelled) this season provided that major losses due to excessive rainfall or frost can be avoided during completion of the harvesting in the short term The Argentine crop for the year is expected to increase by 20 to 25 compared to the previous production season
Table 4 Canola supply and demand (Source Oil world)
Canadian supply and demand (million tons)
Forecast 201617 201516 201415
Opening stocks 202 254 059
Production 194 1838 1641
Imports 008 01 008
Exports 1065 103 914
Crushing 916 832 736
Other use 039 038 026
Ending stocks 13 202 254
Global prices of the majority of oilseeds decreased by small margins on a year-on-year (yy) basis However groundnut prices increased by 42 which was mainly due to production constraints International traders are of the view that global groundnut prices are likely to come under some pressure in the near future if the expected crop size is confirmed If expected production realises in the northern hemisphere and vegetable oil production recovers it can be expected that oilseed prices will be under pressure
Table 5 Main oilseed products (US$ton and Rton) (Sources Grain SA and Oil world)
Product Apr 2017 Apr 2016 change
Soya beans (US CIF Rotterdam) 388 396 -2
Soya beans (Brazil) 388 396 -2
Sunflower seed (EU) 400 427 -6
Groundnuts (US 4050) 1 650 1 163 42
Palm oil (Malaysia) 681 707 -4
Soya bean oil (US) 737 758 -3
Sunflower oil (Arg) 720 771 -7
Soya meal (Arg) 352 355 -1
Fishmeal (Peru) 1 250 1 408 -11
Randdollar 1344 146 -8
Sunflower seed 4 610 6 455 -29
Derived sunflower 5 233 6 126 -15
Soya beans 4 945 5 734 -14
Derived soya beans 5 749 6 317 -9
Soil canola 5 543 6 030 -8
The world supply of soya beans is ample and global production is estimated to reach a new high of 3454 million tons
Local productionThe local production of soya beans is also favourable with the National Crop Estimates Committee (NCEC) expecting a production of 1 233 130 million tons of soya beans (742 000 ndash 2016) 853 470 tons of sunflower seed (755 000 ndash 2016) and 86 600 tons of groundnuts (17 680 ndash 2016)
In the NCECrsquos first intentions-to-plant report for winter grains the canola plantings for the season are expected to be 3221 more than last yearrsquos The estimated area for the season is 90 000ha while last yearrsquos area planted was 68 075ha The prices on the local market followed normal seasonal trends with prices under pressure at harvesting time due to larger supplies within the market
The soya bean crop fared better than most expectations which led to increased pressure on prices This means that prices move below derived prices increasing the crushing margins of processors (Figures 1 and 2) Soya beans should therefore remain under pressure in the short term and will most probably recover in the second half of the year closer to derived prices
29June 2017
MARKETS
Figure 1 Safex soya bean prices and the derived soya bean price (Source Grain SA)
Figure 2 Crushing margins of soya beans (Source Grain SA)
Soya bean prices are sensitive to the exchange rate in times of a balanced supply and demand However in terms of a macroeconomic environment the exchange rate is extremely volatile and sensitive to political instability From Figure 3 it is clear that soya bean prices follow the exchange rate with the exception of times when supply and demand are not in balance In the previous season this was due to limited available supply and in 2017 it is as a result of large supplies
Over the next six months it will be crucial to monitor the exchange rate and use the high volatile movements to the advantage of buyers and sellers depending on the direction of such movement
Figure 3 Soya bean price and rand-dollar exchange rate (Source Grain SA)
30 June 2017
31June 2017
South Africarsquos soya bean production has been a great success story over the past decade with a ramp-up in production reaching one million
tons Over the same period the countryrsquos soya bean crushing capacity has also seen a significant increase
For this reason soya bean crushers and commodity traders have expressed significant interest in the ability to trade the entire crush complex This crush complex includes local soya beans and relies on the Chicago Mercantile Exchange (CME) meal and oil as a proxy for global prices
Key componentThe complex a key component in the soya bean market is what is known as the lsquocrushrsquo spread Soya beans are processed into two products namely soya bean meal (SBM) and soya bean oil The crush spread is the difference between the combined value of the products and the value of the soya beans
It is a measurement of the profit margin for soya bean processors The soya bean processor will be interested in the crush spread as part of its hedging strategy and the speculator will look at the crush spread for trading opportunities
Although we have the individual contracts listed the challenge today is the initial margin efficiency to wrap all three
as a single product in the desired ratios For instance when crushing 100 tons of beans this will result in 74 tons of meal and 17 tons of oil with 9 tons as wastage
Separate contractTherefore a crush spread can be calculated as the price of SBM (Rt) multiplied by 74 plus the price of soya bean oil (Rt) multiplied by 17
Figure 1 Soya bean crush margin
The Johannesburg Stock Exchange (JSE) soya bean crush complex is an easily accessible hedging tool for the crusher while traders are also able to participate in the movements of this crush complex This product is not unique to the JSE as globally the CME Group offers it not only for their local soya beans but also links it with the Dalian Commodity Exchange in China
less the price of soya beans (Rt) The current clearing solution does not allow for this and therefore it necessitated the introduction of a separate contract that will trade the complex wrapped up as a single product
Figure 1 represents a time series of the crush margin supporting the urgency for a price risk management tool such as a futures contract
Advertorial
For more information visit the JSE website wwwjsecoza
32 June 2017
By Dr Charl van der Merwe Tiger Brands
The
Between 20 000 and 25 000 tons of peanuts were used annually for the manufacturing of peanut butter between 2006 and 2013 in South Africa This volume includes splits and 80100s
The peanut butter segment is an important one in the groundnut market of the country The prospects for this market segment are promising
Socio-economic factorsThe demand for a product is influenced by the financial status of the consumer and the socio-economic factors in the country The percentage of citizens who passed matric increased by 27 between 2010 and 2014 (Figure 1) The number of people with a monthly income of between R5 000 and R20 000 increased from 44 to 63 (Figure 2) between 2001 and 2015
Figure 1 Education levels
Figure 2 Household income (Source BFAP)
The increase in household income and the decrease in unemployment from 41 in 2001 to 24 in 2015 equate to an increase in the number of people in the middle to upper classes as indicated in Figure 3
Figure 3 LSM class mobility
The upper middle and upper classes have steadily grown between 2005 and 2010 according to the information presented in Figure 3 This is significant because according to the information in Table 1 peanut butter forms part of the diet of the middle and upper classes
market in South Africa
33June 2017
MARKETS
Table 1 Food choices (Source BFAP)
Population Poorest 30 Lower middle class Upper middle class Wealthiest 20
Animal protein foods (continued)
EggsCanned pilchardsPolonyFreshfrozen
chilled fishPork
Beef sausagePolony
Canned pilchardsPolonyMutton and lamb
Mutton and lambCanned pilchardsPolonyFreshfrozen
chilled fish
EggsPorkFreshfrozen
chilled fishPolonyViennasCanned pilchards
Fats oils
Edible oils (eg cooking oils)MargarinePeanut butter
Edible oils (eg cooking oils)Margarine
Edible oils (eg cooking oils)Margarine
Edible oils (eg cooking oils)MargarinePeanut butter
Edible oils (eg cooking oils)MargarinePeanut butterButter
Peanut butter is included in the diets of the upper middle and upper classes An increase in the number of people in the middle class can equate to an increase in peanut butter consumption Local peanut butter consumption over a twelve-year period is indicated in Figure 4
Figure 4 Peanut butter consumption (Source SAGIS)
Health and marketsMore than 25 000 tons of groundnuts were used for the manufacturing of peanut butter in 2013 It is projected that more than 30 000 tons of groundnuts will be used for peanut butter in 2017
Groundnut consumption is supported by the socio-economic factors as discussed above and by a focus on a healthy diet According to Menrsquos Health magazine groundnuts are a good source of protein The vitamin E helps to protect cells and the magnesium (Mg) in groundnuts assists with metabolic activity
Peanut butter consumption is also influenced by wheat consumption Local wheat consumption is indicated in Figure 5 The information indicates a steady growth in wheat consumption due to the growing middle class in South Africa
Figure 5 Wheat consumption
Groundnut consumption is also influenced by the price of groundnuts and normal levels of supply and demand will influence the price Price movements since 2000 are indicated in Figure 6
Figure 6 Groundnut prices
International groundnut prices increased during 2016 as a result of the rain during harvesting in Argentina and the higher demand from China The possibility exists that prices will decrease if the demand and supply situation returns to normal levels Lower prices can support the demand for groundnuts and peanut butter
ConclusionGrowth in the middle and upper classes in South Africa and higher household incomes over the past few years have boosted the peanut butter market in the country The peanut market has grown by approximately 14 since 2010 Socio-economic factors and the international prices will influence growth in the peanut market in the future
The percentage of local groundnuts used for peanut butter manufacturing increased from 41 between 2011 and 2013 to 51 between 2014 and 2016 compared to 60 in the United States (US)
34 June 2017
By Jolanda Nortjeacute manager of the Southern African Grain Laboratory
201516 production season
The deep root system of a sunflower enables the plant to perform better than other crops during dry seasons making sunflower seed production
very suitable amid South African climatic conditions As a result sunflower seed production exceeded soya bean production this season for the first time since the 201011 season
The final commercial sunflower crop figure of the 201516 season is 755 000 tons This figure represents an increase of almost 14 (92 000 tons) compared to the 201415 season The major sunflower-producing provinces Free State and North West contributed 92 of the total crop (Figure 1)
Figure 1 Provincial contribution to the production of the 201516 sunflower crop
The area utilised for sunflower production increased by almost 25 from 576 000ha in the previous season to 718 500ha this season Due to the drought conditions production only increased by 14 as the yield decreased from 115 to 105tha
Annual improvementsGlobal sunflower seed production for the 201516 season stands at
42 465 million tons with the Ukraine and Russia contributing 51 to this total The forecast for the 201617 season is 47 397 million tons according to figures published in the 2016 US Sunflower Crop Quality Report compiled by the United States (US) National Sunflower Association (NSA)
According to the Bureau for Food and Agricultural Policyrsquos BFAP Baseline Agricultural Outlook 2016ndash2025 the sunflower area is expected to decline in 2017 to around 2015 levels assuming normal rainfall patterns before stabilising at approximately 560 000ha by 2025 An average production increase of 14 per annum is expected to result
in a production of 820 000 tons by 2025 driven by average annual improvements in yield of close to 3 in the same year
During the 2016 harvesting season a representative sample of each delivery of sunflower at the various silos was taken according to the prescribed grading regulations A total of 176 composite
sunflower samples representing the different production regions were analysed for quality and the results published in the fourth annual South African Sunflower Crop Quality Report 201516 Season
Of the 176 samples analysed for the purpose of this survey 78 (138) were graded as Grade FH1 and 38 of the samples were downgraded to class other
sunflower seed (COSF) The percentage of FH1 samples showed a decrease compared to the 86 and 82 of the 201415 and 201314 seasons respectively This decreasing trend could not be attributed to any single grading deviation
Collective deviationsThe majority of samples were downgraded as a result of the percentage of either the screenings foreign matter or the collective deviations or a combination of these exceeding the maximum permissible deviations of 4 and 6 respectively The presence of poisonous seeds (Datura sp) exceeding the maximum permissible number one per 1 000g was also a contributing factor
Gauteng represented by two samples reported the highest weighted average percentage screenings of 360 followed by the North West (N = 80) and Free State (N = 80) with 280 and 201 respectively Limpopo (seven samples) reported the lowest average percentage screenings of 109 The weighted national average was 234 compared to the 205 of the previous season The maximum permissible deviation according to the grading regulations is 4
Sclerotia of Sclerotinia sclerotiorum was observed on 18 of the samples (10) compared to the nine and eleven of the previous two seasons respectively Fourteen of these samples originated in the North West and three in the Free State The highest percentage (180) was present on a sample from Mpumalanga This is however still well below the maximum allowable level of 4 Weighted average levels ranged from 0 for Gauteng and Limpopo 003 in the Free State and 004 in North West
35June 2017
to 026 in Mpumalanga The national average of 004 was equal to the previous season
Foreign matterThe highest weighted percentage foreign matter (177) was reported for the seven samples from Mpumalanga The Free State and North West averaged 161 and 123 respectively The lowest average percentage was found in Limpopo namely 101 The national average of 141 was the highest of the last three seasons
Test weight providing a measure of the bulk density of grain and oilseeds does not form part of the grading regulations for sunflower seed in South Africa An approximation of the test weight of these crop samples was done by determining the g1ℓ filling weight of each sample using the Kern 222 apparatus
The test weight was then extrapolated by means of formulas obtained from the lsquoTest Weight Conversion Chart for Sunflower Seed Oilrsquo of the Canadian Grain Commission (CGC) The weighted average this season was 425kghℓ Individual values ranged from 350 to 481kghℓ Last seasonrsquos values ranged from 34 to 505kghℓ and averaged 442kghℓ (Figure 2)
Figure 2 Comparison of the test weight per province over four seasons
Nutritional componentThe nutritional component analyses of crude protein crude fat crude fibre and ash are reported as a percentage (g100g) on an as-received or as-is basis The weighted average crude protein content this season was 1793 almost one percent higher than the previous season and the highest average value since the start of this survey in 201213 The North West had the highest weighted average crude protein content of 1824 and Mpumalanga the lowest with 1714 The Free Statersquos crude protein content averaged 1777 (Figure 3)
Figure 3 Average crude protein content per season
The weighted average crude fat percentage of 382 was the lowest of the last four seasons and 15 lower than the previous season Gauteng had the highest weighted average crude fat content of 403 The lowest average fat content was observed in the Free State (380) North West and Mpumalanga averaged 382 and 388 respectively (Figure 4)
Figure 4 Average crude fat content per season
The weighted average percentage crude fibre increased slightly from 20 in the previous season to 203 this season Average values varied between 192 in Gauteng to 209 in Mpumalanga The weighted average ash content is slightly higher with 259 than last seasonrsquos 255 The provincial averages ranged from 249 in Mpumalanga to 269 in Limpopo
The results of this survey are available on the Southern African Grain Laboratory NPC (SAGL) website wwwsaglcoza Hard copy reports are distributed to directly affected groups and interested parties The report is also available for
download in PDF format With gratitude to the Oil and Protein Seeds Development Trust (OPDT) for financial support of these annual surveys and to the members of Agbiz Grain for providing the crop samples
June 2017
and its effect on broiler performance
Growth depression effects on poultry due to antinutritional factors present in soya beans have been well documented for over 50
years Trypsin inhibitors are the primary antinutritional factor in soya bean meal (SBM) which is a globulin-type protein Trypsin inhibitors inhibit the conversion of zymogens to active proteases of trypsin and chymotrypsin In addition to their detrimental effects on proteolytic action trypsin inhibitors dramatically affect the size of the pancreases and amount of trypsinogen produced
The requirement to heat treat soya beans has been understood for nearly a century The pH rise was adopted as the common method of determining adequate heat A change in pH above 02 pH units is considered underheated Animal feed manufacturers in Brazil use 03 pH units as the upper limit of SBM processing
It has been established that a pH unit change of zero is not an adequate measure of overprocessing but that if it is between zero and 005 the SBM
has been adequately processed This is a level considered ideal and should be strived toward It must be noted that heat treatment of SBM only destroys those antinutritive factors that are heat-labile
High correlation expectedAs recently as 2001 standardised tests were established for trypsin inhibitor analyses The correlation between trypsin inhibitors and urease activity is expected to be high Urease activity is still the methodology of choice for measuring the acceptable estimation of the trypsin inhibitor content in SBM
It is unclear what the optimum residual concentration of trypsin inhibitors should be Work published as far back as 1991 shows a linear response between bird performance body weight gain (BWG) and feed conversion and levels of trypsin inhibitor activity (TIA) (mgg) in soya bean in the ration There still seems to be considerable uncertainty regarding these levels As recently as 2014 Pacheco et al showed optimal bird performances at TIA of 67mgg rather than the lowest value of 36 which was also fed as a treatment
Response of performance to TIA did not appear linear in this trial Ruiz (2012) observed that if feed contained high levels of SBM with a TIA of more than 35mgg or urease activity above 006 pH units rapid feed passage outbreaks could occur (observation not a trial) detrimentally affecting bird performance
Genetic potentialTIA tests are expensive and time-consuming with a repeatability standard deviation of 027 (Sueiro 2015) Considering the correlation found by Belalcazar and Otalora (2012) as quoted by Riaz (2012) (00738x ndash 01224 with an R2 = 09748) it has been proposed that the urease index should continue to be used in conjunction with TIA ndash a more rapid test for underprocessing but a figure as low as zero is not an indication of overprocessing
The genetic potential of the modern-day broiler has resulted in broilers being slaughtered at an earlier age each year also resulting in a continuous improvement in gain-to-feed ratio Diets have become more nutrient-dense since high-density diets not only achieve maximum performance but have become synonymous with optimal performance
Globally soya bean processing has improved with the consequential improvement in SBM quality The measurement of SBM quality is extremely complex and starts with proximate analysis higher protein levels obviously still being the major economic value driver of SBM The ratio of amino acids to protein also differs depending on the source of SBM ndash the main influence on this being the composition of the soya bean used in processing
Digestibility of nutrients is critical
36
By Dr Erhard Briedenhann
37June 2017
and affected by many criteria other than heat-sensitive antinutritive factors such as levels of lectins mannans raffinose and stachyose Lower fibre levels have therefore been required
The nutrient profile differs among the various sources of SBM Higher protein not only increases the quantity of essential amino acids but there is solid evidence that amino acid digestibility improves as the protein content of the SBM increases
Conclusion SBM quality is determined by many other factors other than TIA level The global industry still considers urease index as the appropriate measurement for underprocessing Levels have been driven down to below 01 urease index to ensure sufficient processing SBM with a higher TIA may have significantly higher digestible amino acid levels irrespective of TIA value
Testing methodsThe international standard method for the determination of soya products is ISO 14902 when compared to the American Association of Cereal Chemists (AACC) standard AACC 22-4001 as modified by Hamerstrand in 1981 and expressed as mg of inhibited trypsin per gram of sample TIA values according to ISO 14902 result in significantly lower values than the previously mentioned method These methods are not directly comparable (Sueiro et al 2015) The particle size of samples during analysis was found critical
Conclusion The testing method needs to be clearly stated and understood when TIA levels vs performance is quoted Particle size is of critical importance
OverprocessingTIA unfortunately does not measure overprocessing of SBM and is something which is of definite concern There is compelling evidence that overprocessed SBM would lead to reduced broiler performance (Wiltafsky 2013) The lower the TIA the higher is the risk of overprocessing and reduced amino acid availability
Conclusion TIA is not a measure of overprocessing but has become a key criterion with regard to SBM quality Lower TIA is a higher risk of overprocessing
Broiler performance and TIAIn studies conducted on SBM of various origins it has been found that United States (US) SBM with a TIUmg of 252 (urease 008) versus that of Argentina with a TIUmg of 198 (urease 0007) exhibited a better crude protein (CP) digestibility and an 88 lysine (Lys) and 88 methionine (Met) digestibility versus Argentina at 86 digestibility
The lower potassium hydroxide (KOH) level of 78 for Argentine SBM tended to overprocessing which could have resulted in lower amino acid digestibility (Ravindran 2014) US SBM consistently resulted in better broiler performance due to its protein quality despite higher TIA levels
Gous (2016) replaced Argentine (Molinos) SBM with a TIA of 128 with South African SBM with a TIA of 304 Although not statistically significant the South African SBM had a numerically better feed conversion of 005 and superior BWG of 45g at slaughter for Ross broilers
This could be ascribed to the higher protein content and quality of our local SBM and clearly corroborates what has been experienced commercially that high-quality South African SBM not only performs as well as Argentine-imported meal in broiler rations but can demand a premium due to its higher digestible nutrient content
Conclusion There is no trial work in the literature which demonstrates that a difference of one TIA mgg will have any significant effect on broiler performance at low levels of TIA Such trial work still needs to be done Contrary to this significant difference in broiler performance it has been found between SBMs with the same TIA levels
Particle sizeIn the US Pacheco (2014) concluded that when using expeller SBM there was not a linear response in bird performance to TIA A curvilinear response for both feed conversion and BWG was experienced The particle size of the SBM had a greater effect on bird performance than the TIA
Conclusion Particle size of SBM could have as significant an effect on broiler performance as TIA Broiler performance response to TIA is not necessarily linear
EnzymesThere is compelling evidence that the use of various enzymes ndash mainly protease pectinase and phytase ndash could positively influence the negative effects of antinutritive factors in SBM further complicating the correlation between TIA and bird performance (Stefanello 2012) (Aureli 2013) and (Faruk 2013)
Conclusion Enzyme inclusion and their combinations could have a significant effect on TIA level which will affect broiler performance
UniformityUniformity of SBM is considered globally and by the local feed industry to be an important criterion At the beginning of soya bean volume crushing in South Africa it presented a challenge due to the restricted continuity of processing This aspect has been improved considerably so much so that major end users of certain locally produced material are starting to report subtle differences between Argentine- and South African-produced SBM uniformity
Conclusion High-quality South African SBM if produced in large consistent volumes can obtain the uniformity experienced by Argentine suppliers
TIA in full-fat and expeller SBMIt can be confirmed that laboratories testing TIA are very comfortable to analyse for TIA in soya bean full-fat soya expeller SBM and solvent-extracted SBM TIA tends to be higher in full-fat and expeller SBM but they can confirm this is not due to the TIA test but the fact that trypsin inhibitor content of these raw materials is generally higher than solvent-extracted SBM due to the fact that they have not been heat-treated to the extent that solvent-extracted SBMs are Despite this they can still deliver good broiler performance to the same extent that moderately higher TIA SBMs can
Conclusion TIA analysis can be performed equally well on soya beans full-fat soya expeller oilcake and solvent-extracted meal TIA limits are applicable to all soya bean protein sources
38 June 2017
By Jolanda Nortjeacute manager of the Southern African Grain Laboratory
The extreme drought conditions experienced this past season has led to an approximately 27 (184 500ha) decline in the
local soya bean production area Yield was also negatively impacted with the average national yield decreasing from 156tha in 201415 to 147tha The result was an almost 31 (328 000 tons) decline in the commercial soya bean crop compared to the previous season
Sunflower production surpassed soya bean production for the first time since the 201011 season The major soya bean producing provinces contributing 75 of the total crop were Mpumalanga and the Free State Numbers reflected in Figure 1 were obtained from the National Crop Estimates Committee (NCEC)
Figure 1 Tonnage and area utilised for soya bean production since the 200506 season
201516 season
According to the Bureau for Food and Agricultural Policyrsquos BFAP Baseline Agricultural Outlook 2016ndash2025 a high demand for soya beans arising from expanded crushing capacity is expected to cause a sharp increase in area utilised for soya bean production in 2017
Assuming normal rainfall patterns production is expected to recover to more than 900 000 tons this year
Global productionAn estimated 31281 million tons of soya beans were produced during the 201516 season according to the World Agricultural Supply and Demand Estimates (WASDE) report (WASDE-563) The United States
contributed 34 Brazil 31 and Argentina 18 to this total Global soya bean production during the 201617 season is projected to be 34079 million tons Soya beans account for more than half of the worldrsquos oilseed production
During the 2016 harvesting season
a representative sample of each delivery of soya beans at the various silos was taken according to the prescribed grading regulations A total of 143 composite soya bean samples representing the different production regions were analysed for quality and the results published in the
fifth annual South African Soya Bean Crop Quality Report 201516 Season
Quality results summaryOf the 143 samples analysed for the purpose of this survey 89 (127) were graded as Grade SB1 and 16 of the samples were downgraded to class other soya beans (COSB) During the previous two seasons 87 (201415) and 88 (201314) of the samples were graded SB1
The majority of the samples were downgraded as a result of either the presence of poisonous seeds exceeding the maximum permissible number of either one per 1 000g or seven per 1 000g or as a result of the percentage other grain andor foreign matter exceeding the maximum permissible deviations of 05 and 5 respectively
According to the South African soya bean grading regulations the determination of the percentage wet pods in a consignment must be performed based on a working sample of at least 10kg of soya beans from a representative sample of the consignment Due to practical considerations the samples received at the Southern African Grain Laboratory (SAGL) NPC from the grain storage companies are typically plusmn5kg
Pods were found in twelve of the 143
39June 2017
samples graded All of these pods were green upon receival at the SAGL but not wet according to the definition The percentage of these pods in the samples ranged from 005 to 050 based on a working sample size of at least 200g
The national average percentage of foreign matter has increased over the last five seasons reaching its highest level this season increasing from 034 in 201112 to 082 during the last season and to 085 now The samples from North West had the highest weighted average percentage namely 162 The percentage in the rest of the samples ranged from 026 in the Northern Cape to 091 in Mpumalanga
Presence of sclerotiaThe number of samples containing sclerotia increased from 20 in the previous season to 36 this season The highest percentages of sclerotia observed (076 and 064) were on samples from Mpumalanga followed by a sample from North West with 060 These percentages are however still well below the maximum permissible level of 4 The national weighted average percentage this season was 004 compared to the 001 of the previous season
North West (eight samples) reported the highest weighted average percentage soya beans and parts of soya beans above the 18mm slotted sieve which pass through the 475mm round-hole sieve namely 156 and the sample from the Northern Cape the lowest at 040 Mpumalanga with the highest number of samples (91) reported an average of 090 The Free State averaged 103 (23 samples) The national weighted average percentage decreased from 181 the previous season to 092 this season
The lowest weighted average percentage of defective soya beans on the 475mm sieve were observed on the samples from Mpumalanga namely 146 The Northern Cape reported the highest percentage of 494 followed by North West and KwaZulu-Natal with
399 and 334 respectively The national weighted average increased slightly from 195 last season to 202 this season
The national weighted average percentage soiled soya beans of 206 is the highest since this survey started in the 201112 season when the average was 160 The average was 077 last season Average weighted percentages per province ranged from 128 in the Northern Cape to 446 in Limpopo
Soiled soya beansAlthough the number of samples containing soiled soya beans as well as the average percentage soiled soya beans per sample increased significantly none of the percentages were above the maximum permissible deviation of 10 according to the grading regulations Last season one sample
Figure 2 Average crude protein content per province over five seasons
from Mpumalanga exceeded this limit
Test weight providing a measure of the bulk density of grain and oilseeds does not form part of the grading regulations for soya beans in South Africa An approximation of the test weight of these crop
samples was done by determining the g1ℓ filling weight of each sample using the Kern 222 apparatus
The test weight was then extrapolated by means of formulas obtained from the lsquoTest Weight Conversion Chart for Soya Beanrsquo of the Canadian Grain Commission (CGC) The weighted average this season was 709kghℓ Individual values ranged from 649 to 73kghℓ Last seasonrsquos values ranged from 633 to 782kghℓ and also averaged 709kghℓ
Soya beans are the main oilseed crop produced in South Africa driven mainly by the demand for protein feed in the animal feed industry The nutritional component analyses namely crude protein crude fat crude fibre and ash are reported on a dry basis (DB) (moisture-free basis)
The weighted average crude protein content this season was 4022 slightly higher than the 3989 and 3984 of the previous two seasons The sample from the Northern Cape had the highest weighted average crude protein content of 4156 while Gauteng reported the lowest average that of 3886 (Figure 2)
An estimated 95 of the area planted to soya beans in South Africa consists of genetically
modified crops
Soya beans are the main oilseed crop produced in South Africa driven mainly by the demand for protein feed in the animal feed industry
40 June 2017
Crude fat percentageThe weighted average crude fat percentage of 194 compared very well with the 193 in 201415 The samples from KwaZulu-Natal had the highest weighted average crude fat content of 206 The lowest average fat content was observed in Mpumalanga with 191 (Figure 3)
Figure 3 Average crude fat content per province over five seasons
The weighted average percentage crude fibre varied from 62 in Limpopo to 76 in the Northern Cape The national
GM-crops These soya beans have tolerance
to herbicides (chemical
products used to destroy weeds but
not the crop plants) Worldwide GM soya
beans occupy 80 of the area planted to this crop
Fifteen (10) of the crop samples were screened by means of the EnviroLogix QuickComb Kit for bulk soya beans to quantitatively determine the presence of the CP4 EPSPS trait (Roundup Readyreg) All the samples tested positive
The results of this survey are available on the SAGL website wwwsaglcoza Hard copy reports are distributed to directly affected groups and interested parties The report is also available for download in PDF format With gratitude to the Oil and Protein Seeds Development Trust (OPDT) for financial support of these annual surveys and to the members of Agbiz Grain for providing the crop samples
weighted average of 73 was higher this season than in the previous one when the average was 64 A small variation of only 005 is observed with regard to the national weighted average ash content
over the five seasons that this survey has been conducted This season the average ash content was 461 Samples from the Northern Cape and Limpopo tend to show higher ash contents over seasons
The majority of soya beans producedgrown in
South Africa are genetically modified (GM) An estimated 95 of the area planted to soya beans in South Africa consists of
- OFC - Oilseed June 2017
- IFC - Oilseed June 2017
- p1-5 Intro pages -Oilseed June 2017
- p6-17 Agronomy - Oilseed June 2017
- p18-21 Seeds - Oilseed June 2017
- p22-25 Chemicals amp fertiliser - Oilseed June 2017
- p26 General - Oilseed June 2017
- p27-33 Markets -Oilseed June 2017
- p34 - 40 Quality - Oilseed June 2017
- IBC - Oilseed Dec 2016
- OBC - Oilseed June 2017
-
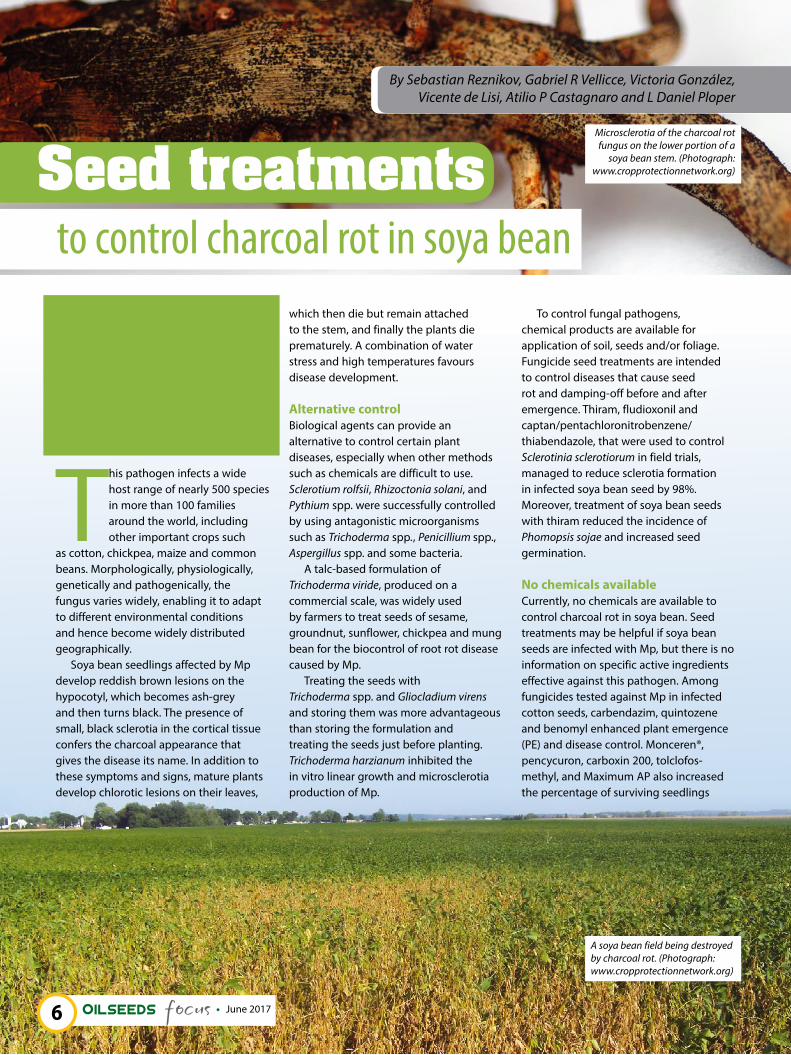
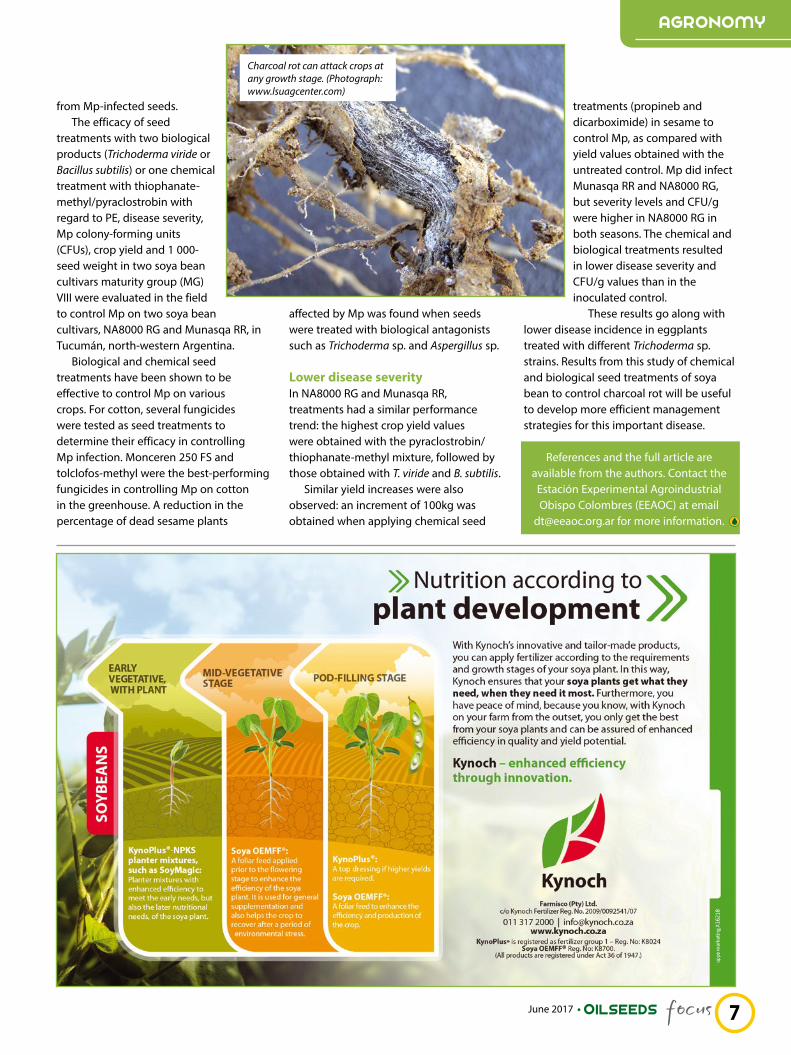
9June 2017
Advertorial
stem rot in canola
By Jannie Bruwer area sales manager Bayer
Although numerous diseases could play a role in the economic viability of canola it is vital to address the management practices of Sclerotinia control
Sclerotinia stem rot is caused by the fungus Sclerotinia sclerotiorum The fungus survives as sclerotia either in the soil or in stubble on the soil surface
The occurrence of sclerotia is more prominent under the following conditionsbull Rain of 25ndash50mm 10 to 14 days prior to the beginning
of flowering ndash thus wet conditions for at least 10 days on the soil surface in mid- to late winter Temperatures of 11ndash15degC trigger the germination of sclerotia and result in spore release
bull Extended wet periods during flowering trigger petal infection
bull Extended wet periods during petal drop and the lodging of petals on stems lead to subsequent stem infection Stem lesion development occurs in humidwet conditions and temperatures between 20 and 25degC
Moisture is keyMoisture is the key factor in Sclerotinia infection Good soil moisture starting two weeks in advance and continuing throughout flowering will greatly increase the risk of infection Conversely low rainfall and low humidity during these stages will significantly reduce the disease risk and fungicide applications rarely prove to be beneficial under these conditions Moisture can refer to rain relative humidity in the 80s or morning dew
After rain it takes approximately 10 to 12 days for apothecia (tiny golf tee-shaped mushrooms) to release ascospores into the air Wind spreads these spores onto nearby plants Ascospores cannot infect plants directly but they need dead tissue such as fallen petals on leaves and stems covering the spores to create an ideal microclimate to continue their disease cycle
Decaying petals provide ascospores with the energy to produce hyphae that release oxalic acid (C₂H₂O₄) and other infection agents which the fungus needs to invade healthy plant tissue and infect the plant Once inside the plant the fungus grows up and down the stem eventually cutting off moisture and nutrient flow and killing the plant The life cycle of Sclerotinia can be seen in Figure 1
Figure 1 Sclerotinia stem rot in canola (Source Department of Agriculture and Food Western Australia)
Timing of spraying will be determined by climatic conditions The optimum time to spray is between 20 to 30 flowering but in certain years when the climatic conditions in early flowering are not favourable for the disease to develop a later spray (not later than 50 flowering) may be more ideal
Should conditions remain unfavourable for disease development (hot and dry) after 50 flowering a fungicide application will be unwarranted After 50 flowering most of the flowers are on side branches Therefore little risk of petals landing on the main stem to cause economic damage exists
A 10 change in flower percentage only takes three to four days Thus the timing of a spray is critical in controlling the disease
Spray during floweringIt is essential that any fungicide application coincides with the peak flowering period Fungicides prevent spores from growing on petals after petals have fallen onto leaves and stems and started to decay It is easier to spray petals at the top of the canopy during peak flowering than after they have fallen which is why living flowers are the target
Spraying before 20 flowering is too early because no petals have dropped and no pods have formed At 30 flowering petal drop has just begun Most of the petals drop during 30 flowering Therefore spraying between 20 and 30 flowering ensures that many flowers have opened and the spray will cover petals before they drop
Fungicides reduce the severity of infection but will not completely eliminate Sclerotinia especially if conditions are favourable throughout flowering
For more information contact Jannie Bruwer on 082 806 8715 or email janniebruwerbayercom
9June 2017
June 2017
During the 201516 production year the groundnut industry in South Africa reached its lowest production figures since records were kept from
1936 Exporters and producers had to pull out all the stops to save the industry and to generate a return to become one of the worldrsquos best producers once again
Alfonso Visser owner of the Golden Peanut and Tree Nuts plant in Hartswater and one of the major groundnut producers in the country says the main reason why the groundnut industry faced challenges was the El Nintildeo climate phenomenon
While it may seem as though producers lost interest in cultivating groundnuts they didnrsquot really stop producing It was rather a matter of late rainfall that forced producers to skip planting over the past three years During this period the first rains came only between 20 and 28 December and by that time it was too late for groundnut plantings In certain parts producers elected to plant maize instead
Visser also says that producers who had the opportunity to plant groundnuts in those three years recorded their best profits ever This year the harvest looks promising and the climate has played its part Groundnut production is set to show better profits than most other crops this year
In the 201516 production year South African producers could only manage to plant 22 600ha and only 17 680 tons of groundnuts were harvested This season South Africa received its first rains from mid-November to mid-December and many producers managed to plant the commodity again Approximately 55 000ha were planted in the Free State Limpopo Northern Cape and the North West Apart from rainfall at the right time there is also a promising export market in Europe and Japan which are all good signs for a profitable year
Keen interest in planting Adri Botha chairperson of the Groundnut Forum of South Africa (SAGF) says groundnut production in the country similar to many other crops experienced hard times due to the drought but when the opportunity presented itself farmers showed keen interest in planting again
Information from the South African Grain Information Service (SAGIS) indicates that an average of 48 720ha were planted over the past ten years and the average harvest during this time was 66 139 tons The average over the last five years has declined however During this time an average of 45 015ha was planted and the average harvest was 52 568 tons In the past two years groundnut production has declined even more
As noted before only 22 600ha were
planted during the 201516 production year and a mere 18 850 tons were harvested The effect of this decrease in volumes is that South Africa failed to produce sufficient quantities of groundnuts for local consumption with international buyers not receiving the regular volumes they are used to
Botha believes that with a stable and adequate supply this market will be regained easily enough because South African exporters are renowned for quality and reliability under normal circumstances Visser is also very optimistic regarding the export market He says South Africa did not lose the international market The supply did decrease which negatively affected the export market because international buyers turned to other more reliable sources Despite this South Africa still exports to Japan and Europe with a focus on the higher-income sector of these countries
Figure 1 South African groundnut production figures 200607ndash201617
10
By Koos du Pisanie
The 2017 harvest looks promising and the climate has played its part in setting the table for better production and higher profits
11June 2017
New possibilities for businessThere are new possibilities available for groundnut producers but these will entail hard work especially in respect of the export market Botha says that due to a changing and declining supply South Africa has lost some of its standing in recent years as a reliable export source for the international groundnut market in Europe and Japan However the markets are still there to be regained and expanded if the broader industry commits to the commodity and consistent supply of high-quality products
Last year was one of the worst production years in South Africa but exporters still managed to provide 36 or 2 317 tons of the harvest to Japan 32 to Mozambique 12 to the Netherlands and 11 to Belgium
ldquoSouth African groundnuts are of a good quality and well known in the international market Up until 1994 the country was known for its excellent quality and buyers didnrsquot hesitate to use South African groundnuts directly in their production lines without the need for more sorting or processing Unfortunately in the move from a single-channel
marketing structure via the Oilseeds Board as well as the challenges brought on by labour issues and adjustments needed on the technological side primary producers started considering other commodities In this process South Africa lost the ability to retain its spot in the market along with many international buyers reluctantly forced to source products from alternative origins
ldquoAt the same time Argentina rose as a worthy opponent in the global supply arena making matters even more difficult for exporters Still the international demand on the back of global population growth along with the marketability of groundnuts as an excellent source of nutrients and healthy oils leaves the door wide open to usrdquo Botha says
Challenges for the futureVisser says groundnut production levels in South Africa have been so low in the past two to three years that even the national market experienced a shortage He believes that one of the challenges for the groundnut industry is achieving an increase in local consumption
In the past peanut butter formed a
major portion of the menus relating to food projects for schools prisons and non-profit organisations assisting the homeless for instance because it is affordable and high in protein Lately however it has become too expensive for this purpose Due to a decline in quality this market has also shrunk Therefore the first challenge will be to increase local consumption again
ldquoThe second challenge is identifying cultivars which will produce higher yields Farming has become expensive and producers have to find ways to cut down on input costs while still delivering higher returns In the groundnut industry we need access to cultivars that will deliver higher yields This way we can cut on unit costs and deliver a more affordable product to the marketrdquo Visser says
Exceptionally high yieldsBotha adds that in addition to hope for continued local cultivar development international cultivar owners are sought and invited to submit seed to be included in the local Elite Cultivar Trials funded and managed via the Oilseeds Advisory Committee (OAC) She says groundnut production has always been more profitable than any other competing crop but is also more intensive and the necessary attention should be given to best practices in an effort to ensure that available cultivars reach their full potential It is no secret that certain farmers will deliver exceptionally high yields with the existing available material
Another of the challenges in the industry ndash for which excellent work has already been done ndash is introducing groundnut production as a high-income crop to emerging farmers The focus and goal is to help these farmers become regular producers of quality products through courses and mentorship ultimately giving them access to the larger and more formal market environment
For any information on the groundnut industry in South Africa contact Alfonso Visser on 082 948 2222
or 053 474 1345 or Adri Botha on 082 376 5940
In addition to continued local cultivar development the industry is also seeking international cultivar owners to submit seed to be included in the local Elite Cultivar Trials funded and managed via the Oilseeds Advisory Committee
12 June 2017
13June 2017
Exceptional yields are possible with soya beans provided that you correctly attend to every facet of the cultivation process This year a soya bean yield of
up to 8tha filled the combine harvester to the brim on the farm Leeubank of Gerrit Roos near Wonderfontein in Mpumalanga
Last year he was crowned champion soya bean producer (under irrigation) in the Weigh to Wintrade National Yield Competition when a block of two hectares he entered yielded an average of 5236tha This year the harvester measured just over 8tha in certain parts of his irrigated fields Roos says careful attention to small things in every aspect of the entire cultivation process makes the difference because he manages everything in a precision farming system
Every year Roos plants strip trials containing the soya bean cultivars of different seed enterprises This allows them to determine which cultivars best suit the conditions on his farm Roos plants approximately 1 000ha maize and 450ha soya beans He also manages a livestock branch
Maize and soya beans are planted in a crop rotation system which means the fields are planted with soya beans every three years When he joined the
By Andries Gouws
An
soya bean yield
enterprise Roos planted soya bean trials and although maize sets
the tone as the primary crop the soya beans have stood their ground especially considering their hidden benefits
Since their first soya bean planting in 199293 they have doubled the average yield on dryland from 18 to 36tha They also plant soya beans under centre pivot irrigation and 20ha with underground drip irrigation These fields deliver an average yield of 4 and 425tha respectively
Strip-till systemOrtman implements are used to strip-till the land During last yearrsquos planting season a large section of the fields was too damp for these implements and a broad-tilling implement (Fieldspan) was used after which the soil was compacted with a roller The advantage of this process is that germination takes place evenly and the soil is much more even thus reducing wear and tear on the blades of the combine harvesterrsquos soya bean table and saves a lot of money
In the strip-till system only the soil in which the seed will be planted is
tilled to a depth of 280mm Every year the strips are moved slightly to eventually utilise the entire land area The fields consist mainly of Avalon soils and care is taken to keep the soil pH level between 6 and 65
Since 2000 they have been using a precision farming system with a diamond pattern (100m times 100m) where soil samples are taken and analysed annually If the analyses indicate a shortage of lime or other nutrients corrections are made continuously Every third year lime is applied across the board and fertilisers are applied throughout according to changing needs
Roos says he has found that soya beans react most favourably to lsquooldrsquo fertilisation For this reason a mixture of 012 fertiliser at 200kgha is broadcast just after the maize which is followed by soya beans that have been harvested This leads to a reaction between the
Spray applications are combined to prevent unnecessary cultivation
Gerrit Roos with his award as winner of the irrigation section of the Weigh to Wintrade National Yield Competition
14 June 2017
15June 2017
crop residues fertiliser and organisms in the soil which in turn stimulates the earthworm numbers in the soil
Roos plants cultivars that exhibit resistance to Roundupreg herbicide Upon planting herbicide is applied to the soil to postpone the first Roundupreg application for as long as possible Proven cultivars are planted as are the best performers in every yearrsquos strip trials The cultivars that grow upright are planted at approximately 300 000 plants per hectare and the shrub-type cultivars at 260 000 to 280 000 plants per hectare in rows 90cm apart The seeds are planted at a depth of between 4 and 5cm to ensure that there is sufficient moisture for even germination
Fungal disease controlAround 40 days after planting the first Roundupreg application is done Supplementary nutrients and fungicides are mixed into the herbicide to respectively lessen the shock and prevent counter fungal diseases from becoming an even greater problem At approximately 60 days after planting a copper spray is applied in support of the effort to control fungal diseases
At the first flowering stage a mixture of mono-ammonium phosphate (MAP) and diammonium phosphate (DAP) specialist fertiliser products for soya beans are applied at 4 to 5kgha with a fungicide and some brown sugar (as agglutinant) Later the cultivars with a long growth period receive another fungicide application As soon as flowering time is over they administer a last application of Roundupreg to ensure that all weeds are eliminated
Fungal diseases are becoming a major problem and especially Sclerotinia can harm the yield Roos says his experience is that soya beans that are planted earlier are not as severely plagued by these diseases Producers traditionally plant soya beans after having planted maize When using underground drip irrigation fungal diseases are not such a big problem
Drip irrigationThey installed the underground drip irrigation around a decade ago The dripper lines are installed approximately 350mm below the ground 200mm apart and the drippers in the lines 20mm apart Every dripper has the capacity to apply two litres of water per hour
The advantages of this irrigation system entailbull That it uses 50 to 75 less water than
a centre pivotbull Irrigation can be done with precisionbull It keeps fungal diseases at baybull At least one less fungicide
application is necessarybull Fertiliser can be placed at the root
zone
The system also has its challenges among others that the depth of cultivations over the pipes should be very accurate The system must be installed in square or rectangular blocks
and the dripper lines can be 180 to 200m in length at most to maintain the pressure for even application Continuous maintenance is necessary and the system must be cleaned regularly to prevent the drippers from clogging
Mice can also present a huge challenge They would typically dig the pipes open and bite holes into them For this reason they have erected owl cages near the fields and planted poles with bails on the contours where owls can rest while they are hunting Only environmentally friendly methods are used to control the mice
The system is initially more expensive to install than a centre pivot but in the long run (after about six years) it becomes the cheaper of the two
Although soya beans can hold their own as a crop in a farming enterprise its use as a rotation crop has numerous advantages The nitrogen (N) deposits that soya beans leave behind in the soil can lead to maize yields of at least 2tha higher than where soya beans were not planted the previous year
Soya crop residues are also manna for sheep The animals ingest the residues and pick up the kernels behind the harvester The additional protein
during mating ensures a higher lambing percentage and in certain years there are between 10 and 15 more twins
All soya beans are processed on farm into soya oil soya oilcake containing 46 protein and 6 energy and full-fat soya oilcake with 37 protein and approximately 20 energy Initially the oil was pressed to use as fuel on the farm but due to the huge increase in plant oil prices it is no longer a viable option The oilcake is used in the cattle and sheep feedlots on the farm Roos says they add value to everything that leaves the farm
For more information contact Gerrit Roos on 083 635 3873 or email
glroosgmailcom
The soya seeds are planted fairly deep to ensure good germination This is a soya bean field on Leeubank near Wonderfontein in Mpumalanga
This year the combine harvester indicated a yield of just over 8tha on certain parts of the soya bean fields
16 June 2017
17June 2017
Promosie-artikel
Phb 65A70Phb 65A70 is rsquon nuwe sonneblomkultivar met hoeuml opbrengspotensiaal Dit is rsquon medium tot lang groeiseisoenkultivar en is geskik vir droeumllandverbouing in die westelike produksiegebiede Die kultivar se dae tot 50 blom is 65
Dit presteer op alle grondtipes in 091m-rye en het rsquon plantdatum van Oktober tot Desember Die beste plantpopulasie is 35 000 tot 40 000 plante per hektaar
Belangrike agronomiese eienskappe (uitstekend = 9 swak = 1)Sekelnek 6Opbrengspotensiaal 7Planthoogte 175Saadvulling 7Eenvormigheid 6Proteiumlenkonsentrasie 176Oliekonsentrasie 428Staanvermoeuml 8Kruistipe 3W
Siekteverdraagsaamheid (verdraagsaam 9 ndash 7 matig 6 ndash 4 vatbaar 3 ndash 1)Bruinroes 7Witroes 6Wortel- en stamsiekte 7
Kies Phb 65A70 vir goeiebull Opbrengste en aanpasbaarheidbull Groeiperiode en eenvormigheidbull Goeie siektebestandheidbull Weerstand teen omvalbull Bestand teen voeumllskadebull Pas in enige kultivarpakket
P65LL02P65LL02 is rsquon sonneblomkultivar wat groot opbrengsverbetering toon van konsepgenetika Dit is rsquon medium tot lang groeiseisoen-kultivar en is geskik vir droeumllandverbouing in die westelike produksiegebiede Die kultivar se dae tot 50 blom is 68
Dit presteer op alle grondtipes in 091 tot 15m-rye en het rsquon plantdatum van Oktober tot Desember Die beste plantpopulasie is 35 000 tot 40 000 plante per hektaar
Belangrike agronomiese eienskappe (uitstekend = 9 swak = 1)Sekelnek 6Opbrengspotensiaal 8Planthoogte 175Saadvulling 7Eenvormigheid 7Staanvermoeuml 8Kruistipe 3W
Siekteverdraagsaamheid (verdraagsaam 9 ndash 7 matig 6 ndash 4 vatbaar 3 ndash 1)Bruinroes 7Witroes 7Wortel- en stamsiekte 7
Kies P65LL02 vir goeiebull Opbrengste en aanpasbaarheidbull Groeiperiode en eenvormigheidbull Goeie siektebestandheidbull Weerstand teen omvalbull Bestand teen voeumllskadebull Pas in enige kultivarpakket
Twee medium tot lang groeiseisoen-sonneblomkultivars is vir droeumllandverbouing in die westelike produksiegebiede beskikbaar
Vir meer inligting kontak Philip Fourie landboukundige van DuPont Pioneer by 082 909 3262 of philipfouriepioneercom
18 June 2017
By Andrew Bennett Asia Africa technology lead Monsanto
Technologies in agriculture and in particular in maize production continue to advance in leaps and bounds It is interesting to examine
how many disease- insect- and herbicide-tolerant transgenic traits are registered globally across all agricultural crops According to the Centre for Environmental Risk Assessment (CERA) database some 206 traits are available in these categories (wwwcera-gmcorg)
Nine virus-resistant traits are available across carnations papaya plum squash common beans and potatoes There are 77 insect-resistant traits in maize cotton tomato potato soya beans and rice There are 120 herbicide-resistant traits spread across cotton maize carnations canola soya bean creeping bent grass tobacco common bean flax sugar beet lucerne rice chicory and wheat
Insect resistance and herbicide tolerance clearly dominate and crops of focus are essentially maize (with 48 insect-resistant traits and 52 herbicide-tolerant traits) soya bean (with three insect-
resistant traits and 17 herbicide-tolerant traits) and cotton (with 20 insect-resistant traits and 20 herbicide-tolerant traits)
Some 92 million hectares of soya beans (83 of all soya beans) 24 million hectares of cotton (75 of all cotton) and 54 million hectares of maize (29 of all maize) are planted with traited varieties and hybrids globally
DroughtGardtradeDroughtGardtrade is one of the new traits that holds much promise especially in maize production regions in South Africa where rainfall is often low uncertain or erratic The trait in DroughtGardtrade is the worldrsquos first drought-tolerant biotechnology trait for maize and is designed to help maize plants better tolerate drought stress and minimise the risk of failure in drought conditions and was commercialised in the United States (US) in 2013
Yield gain in hybrids with DroughtGardtrade occurs because it slows down the growth of maize hybrids experiencing moisture stresses such that existing soil moisture is saved for the
critical period of flowering resulting in less kernel abortion thus protecting the expected yield
Nutritional quality traitsThis is a more complicated segment to quantify but traits such as low lignin (to enhance digestibility in livestock) in lucerne non-browning apples pro-vitamin A and iron-enriched bananas vitamins A- B9- and C-enriched maize high-content omega 3 fatty acid-enriched canola beta carotene-enriched rice and low-saturatedhigh-oleic fatty acid-enriched soya beans are but a few that are receiving attention currently (Agnegraves E Ricroch amp Marie-Ceacutecile Heacutenard-Damave 2016)
CRISPR ndash a new gene-editing toolClustered regularly interspaced short palindromic repeats (CRISPR) is a naturally occurring ancient defence mechanism found in a wide range of bacteria which evolved to protect them against viral infections As far as back the 1980s scientists observed a strange pattern in certain bacterial genomes One deoxyribonucleic acid (DNA) sequence would be repeated continuously with unique sequences in between the repeats
Scientists realised the unique sequences in between the repeats matched the DNA of viruses ndash specifically viruses that prey on bacteria CRISPR form part of the bacteriarsquos immune system keeping parts of the viral DNA of dangerous viruses so it can recognise and defend against such viruses the next time they attack A second part of the defence mechanism is a set of enzymes called CRISPR-associated (Cas) proteins which can precisely snip DNA and remove the DNA of invading viruses
Using this precise gene-editing technology CRISPR could one day
Disease insect and herbicide tolerance
Canola is one of the GM crops that boasts herbicide-resistant traits
19June 2017
hold the cure to a number of genetic diseases although human genetic manipulation is still far from becoming routine Furthermore CRISPR could become a major force in ecology and conservation especially when paired with other molecular biology tools It could for example be used to introduce genes that slowly kill off mosquitos spreading malaria or genes that slow down the growth of invasive species such as weeds
Since its 2013 demonstration as a genome-editing tool in Arabidopsis and tobacco mdash two widely used laboratory plants ndash CRISPR has been tested on crops including wheat rice soya beans potatoes sorghum oranges and tomatoes It is expected to be used widely in agricultural research applications including boosting crop resistance to pests and reducing the toll of livestock diseases
Precision agriculture and big dataPrecision farming is not a new concept and could be defined as ldquousing every acre within its capability and treating it
according to its needsrdquo according to Hugh Hammond Bennett widely considered to be the father of soil and water conservation who was born in 1881 and died in 1961
Precision agriculture could also be defined as ldquoa management system that is information- and technology-based is site specific and uses one or more of the following sources of data soils crops nutrients pests moisture or yield for optimum profitability sustainability and protection of the environmentrdquo
Nonetheless with the increasing availability of data and tools to generate and interpret data rapidly and cost-effectively it has become possible to do more in-depth analyses of increasingly smaller parts of a farmerrsquos field The
digitisation of this data has made precision farming possible
With todayrsquos equipment
that can collect information digitally
farmers have at their disposal huge quantities
of data The ability to use data from multiple sources to
build a lsquodigitalrsquo picture of a production field enables todayrsquos growers to make quality decisions regarding hybrid choices planting densities fertilisation requirements etc
Furthermore they are able to do this for smaller and increasingly more precise areas in their fields This leads to optimisation of productivity in each one of a growerrsquos fields which ultimately leads to a high level of sustainability and productivity Development in maize genetics and production systems also plays an important role in providing greater food security
Some 92 million hectares of soya beans (83 of all soya beans) are planted with traited varieties and
hybrids globally
20 June 2017
By P Lombard Prof A Agenbag and J McDermott
of canola seedlings
Drought resistance in crops is a crucial aspect of crop farming in the Western Cape This article focuses on canolarsquos reaction to drought and certain observations made in this regard in 2016
Water consumption during the growth stages of canola (plant to harvest) shows a linear increase and reaches a peak during flowering after which it decreases rapidly until physiological ripeness occurs (Canola Council of Canada 2008)
Canola is most sensitive to moisture stress during the flowering stage and the early to mid-pod filling stage (Wan et al 2009) However it is also sensitive to drought during germination Sufficient soil moisture during germination is necessary for rapid and even germination ndash hence a higher germination and establishment percentage It also results in the establishment of stronger seedlings
However it has long been known that canola plants can handle water shortages well during drought conditions if these shortages occur after emergence but only in the early stages of development This statement could hardly be better proven than during 2016 in the Swartland and parts of the Overberg
Extreme droughtAt Langgewens a total of 378mm rain fell during the last ten days of April Similar rainfall occurred in large parts of the Swartland and Overberg and was utilised to establish canola During the next 39 days however it was extremely dry across the entire area and the rainfall figures at Langgewens for example was only 66mm
Canola seedlings across the entire area were subjected to severe moisture stress during 2016 shortly after emergence Since the remainder of the 2016 rainy season was normal and temperatures were fairly low in September (Figures 1 2 3 and 4) the canola miraculously recovered due to its drought resistance and the highest canola yields per hectare recorded in history were attained in the Western Cape despite the initial dry period
Figure 1 Monthly and annual rainfall at Langgewens for 2016 and long term
Figure 2 Monthly temperatures at Langgewens for 2016 and long term
Figure 3 Monthly minimum and maximum temperatures at Tygerhoek for 2016 and long term
Figure 4 Monthly temperatures at Tygerhoek for 2016 and long term
In the Swartland no cultivar trials could previously yield more than 29tha Two cultivar trials and a fungus treatment trial yielded an average of 3tha and more (Langgewens 37tha) in 2016 The drought resistance of canola is further illustrated by Photographs 1 and 2Total 2016
Total 2016
Long term monthly
Long term monthly
Monthly 2016
Monthly 2016
Long term total
Long term total
Tota
l Ma
rch
- S
ep
t (m
m)
Tota
l Ma
rch
- S
ep
t (m
m)
Jan Feb Mar Apr May Jun Jul Aug SepMax 2016 Min 2016 Longt Max Longt Min
Jan Feb Mar Apr May Jun Jul Aug
Max 2016 Min 2016
Longt Max Longt Min
Jan Feb Mar Apr May Jun Jul Aug Sep
Jan Feb Mar Apr May Jun Jul Aug Sep
21June 2017
Photograph 1 A canola field in the Eendekuil area during the drought and after good follow-up rains in 2016
June
August
June
July
August
Photograph 2 A canola field in the Swartland during the drought and after good follow-up rains in 2016 (Photographs supplied by J McDermott E Burger and Philip van Schalkwyk)
Photographs 1 and 2 illustrate the drought stress the plants were subjected to after germination in 2016 Although the plants were initially subjected to drought stress the physiological development did not cease This is a crucial aspect which caused clethodim damage in 2016 because applications were only possible around 46 days after the follow-up rain fell
Sclerotinia effect on yieldPictures in Photograph 1 were taken on the farm De Brug in the Swartland The cultivar was 44Y89 and the seed yield of the field was 198tha Sclerotinia was a problem on this field and possibly reduced the yield potential
The pictures in Photograph 2 were taken in the Eendekuil area on a field where minimum tillage was applied The field was planted with the cultivar Hyola 555 and the average yield on this farm (Baviaanskloof ) was 185tha The cultivar trial on the same field was planted on 10 May and established well (Photograph 3) The average yield of the cultivar trial was 203tha and the yield of Hyola 555 was 2tha
Photograph 3 Eendekuil cultivar trial in 2016
The canola plants in the Eendekuil trial took an average of 96 days until the flowering stage (50 of the plants with one flower) It took approximately 14 days longer than usual but is attributed to the above-average temperatures in May June and July 2016 All trials flowered later in 2016 which is characteristic of a hot growth season The result of a longer growth season is that the crop forms more biomass which increases yield potential if sufficient moisture and low temperatures are available late in the season such as in 2016
ConclusionCanola can recover from a dry period shortly after establishment It is however vital that canola is not planted in soil without sufficient moisture as 20mm is regarded as effective rainfall (Arnon 1992) The result of insufficient soil moisture is weak establishment and uneven germination which are both detrimental to the harvesting process and yield
The recommended planting date for canola in the Western Cape is from the beginning of April in the eastern parts of the Southern Cape until the end of April in the Swartland provided that sufficient soil moisture is available
2 June
12 August
1 November
For more information contact the Directorate Plant Sciences Western Cape Department of Agriculture on 021 808 5321 or email pietlelsenburgcom Sponsored by the Protein Research Foundation Visit the
website wwwproteinresearchnet for newsletters and pamphlets
22 June 2017
By Prof Charlie Reinhardt
Biological control (biocontrol for short) when applied in the broadest sense involves the use of animals insects fungi or other microbes
to feed upon parasitise or otherwise interfere with a targeted pest species Classical biocontrol targets a non-native pest (eg alien invasive weeds) for control by one or more species of biocontrol agents (eg insects pathogens) from the pestrsquos native range
Classical biocontrol remains the most popular and successful approach for controlling alien invasive weed species the world over Fundamental to the success of biocontrol as a practice is the 100 host specificity required of biocontrol agents ndash an attribute that is supposed to protect against harmful effects on non-target species and ecosystems
More readily acceptedFollowing several decades of intensive use of synthetic chemicals (herbicides insecticides fungicides bactericides) for crop protection and other purposes Harris (1991) points to public demand for a shift from chemical to biological control However several dilemmas are associated
with a change in emphasis from chemical to biocontrol ndash obstacles in the way of greater adoption of biocontrol range from scientific legal political to practical issues
Therefore biocontrol is essentially subjected to the same scrutiny as synthetic chemicals except for the fact that the public in particular consumers of farm products in developed countries tends to more readily accept the employment of biocontrol practices for food production than they do chemical control practices
Regulatory authorities responsible for the registration of agrochemical products for pesticides in particular are often perceived by the agrochemical industry to be guided more by public perception (politics) than by the real risks (exposure toxicity) associated with the use of agrochemicals Literature abounds with comparisons of the pros and cons of biocontrol compared to chemical control When the authors are proponents of biocontrol their approach is often to promote biocontrol as an adversarial or alternative measure in relation to the use of synthetic chemicals
Undoubtedly some supporters of the use of pesticides make the same
mistake but fortunately the proponents of integrated pest management (IPM) in which all control practices are considered on an equal footing still hold sway
In order to avoid the quagmire of divergent and conflicting opinions the present discussion will focus solely on salient facts as they apply in practice with reference to examples of weed biocontrol in South Africa
Apparent benefitsThe benefits of successful control of an alien invasive weed in for instance the Kruger National Park through the release of this speciesrsquo natural enemies should be manifestly apparent Safeguards against non-target harmful effects are vested in the standard procedures that candidate biocontrol agents imported from their natural habitats undergo exhaustive screening for efficacy and 100 host specificity under quarantine conditions
The rationale for achieving success with biocontrol in natural environments is that non-target plant species which dominate the plant community ie indigenous vegetation will take the invader(s) place Similar logic applies to the control of aquatic alien invasive weeds (eg water lettuce water hyacinth Kariba weed) except that in this case the taking over by indigenous aquatic plants does not apply due to the dearth of free-floating aquatic plants in South Africa
In contrast in crop production systems the crop or desirable species is usually a single one that occurs at fixed density whereas the weed spectrum on
23June 2017
a particular area can be diverse in terms of weed types and levels of infestation In such a setting selective biocontrol of one or even two weed species will hardly make a difference since individuals of other species already present will simply take their place
Economies of scaleHowever in cases where a particularly noxious (herbicide-resistant poisonous extremely competitive etc) weed occurs in crop production it might be practical to employ biocontrol The basic problem with this kind of biocontrol is that economies of scale will dictate whether the product will have a large enough and sustainable market in order to warrant research and development (RampD) and registration costs
One bioherbicide product that was discontinued in South Africa for the reason that the market was deemed too small is Hakattackreg which was a formulation containing spores of the fungus Colletotrichum gloeosporioides used for controlling the alien invader tree of Australian origin silky or needle hakea (Hakea sericea) (Morris 1982 1983) The same fungus is registered in the United States (US) under the tradename LockDownreg (Delta Farm Press 2009) for the control of a rare legume weed species Aeschynomene virginica (common names curly indigo northern jointvetch) which is particularly hard to control in rice with
synthetic herbicides Other fungus-based bioherbicide products registered in the US (year 2000) were the products Smolderreg and DeVinereg for the control of the parasitic weed dodder (Cuscuta sp)
I am unaware of any bioherbicide product currently registered in South Africa for weed control In this country there are several success stories on the biocontrol of alien invader weeds occurring in natural (eg conservation areas) or seminatural (eg game farms) habitats
According to Moran et al (2011) certain target weeds that have been successfully controlled biologically include the following species several cactus species (eg the prickly pear Opuntia ficus-indica) St Johnrsquos wort (Hypericum perforatum) sesbania (Sesbania punicea) the aquatic weeds
Strategies for management of herbicide-resistant weeds are well documented and frequently communicated on the South African Herbicide Resistance
Initiative (SAHRI) website wwwupaczasahri Prof Reinhardt is project leader at SAHRI which is based in the Department of Plant Production and Soil Science
University of Pretoria (UP) dean of Villa Academy extraordinary professor of weed science UP and extraordinary professor at the Department of Agronomy
Stellenbosch University (SU) References are available from the author on 083 442 3427 or email drcharliereinhardtgmailcom
water fern (Azolla filiculoides) kariba weed (Salvinia molesta) and water lettuce (Pistia stratiotes)
Continuing researchIt should be borne in mind that eradication of these weeds has not been achieved nor was it the aim Consequently they can occasionally be problematic in certain locations Research by the Agricultural Research Council ndash Plant Protection Research Institute on these and many other targets for classical biocontrol is underway and continuous
Cover crop or so-called lsquosmother croprsquo practices provide a type of non-classical biocontrol of weeds By means of this practice certain attributes of the crop are employed for weed suppression and cover cropping is a key component of conservation agriculture
Live crops and residual (dead) plant material are used to withhold light from weed seeds thereby preventing or reducing germination Biochemical compounds called allelochemicals which are released from live and dead crop plants in the phenomenon of allelopathy inhibit the germination growth and development of weeds
Although it is generally accepted that the use of synthetic herbicides will remain the mainstay of weed control programmes long into the future it is imperative that we consider the alternative weed management options available An integrated approach to weed management is crucial for sustainable crop production In all instances all the available weed control options deserve consideration in designing a weed management strategy that offers the best chance of contributing to maximise farmer profits and the achievement of optimal yields of safe and sufficient food
Certain target weeds that have been successfully controlled biologically include the prickly pear St Johnrsquos wort and water lettuce
Classical biocontrol remains the
most popular and successful approach for controlling alien
invasive weed species the world over
24 June 2017
By P Lombard J Strauss and C Cummings Directorate of Plant Sciences Western Cape Department of Agriculture
(Source Canola Focus March 2017)
damage in canola
Evidence shows that canola is an ideal crop for crop rotation systems in the Western Cape Not only does it offer the benefit of good returns but it also provides
the opportunity to control weeds with chemical agents from different groups There are several herbicide options that can contribute to ryegrass control Clethodim (cyclohexanedione) is also widely used under various brands for grass control in canola and especially on conventional cultivars
Moisture strainDuring the past 2016 season clethodim damage occurred in various fields varying from mild to severe It was not only limited to certain farms and occurred across the Swartland and Southern Cape The reason for the damage is mostly attributed to the dry month of May 2016
It is important to understand canolarsquos development since its seedlings do not cease development during periods of drought Image 1 shows seedlings that underwent severe moisture strain five weeks after sowing The plants had already formed five leaves The problem is that herbicides do not function properly under such conditions As a result producers sprayed only clethodim for grass control after the rain in June
Seedlings subjected to drought stress five weeks after planting with severe clethodim damage visible on the insert
Visible symptomsStudies in Australia found that a late spray application and a double dose of clethodim during bud formation resulted in a yield loss of up to 55 (Zerner and Wheeler 2013) The damage was between 0 and 15 at the recommended dosage Up until the eight-leaf stage no damage occurred when using the recommended dose although damage did occur at the higher dosage However there were differences among cultivars with some exhibiting no yield loss ndash a good reason to maintain the recommended dosage
The symptoms are best visible when the plants flower From a distance the field appears to be less yellow in the areas where the damage occurred (Image 2) The flowers are deformed and in severe cases it appeared as if the flower buds had melted (Image 3)
Severely deformed flowers
Plants were less yellow where damage occurred
Poor pod formation occurred with severe damage With less severe damage (plants in the middle of Image 4) the pods were deformed Image 4 depicts plants exhibiting conditions from zero to severe damage They were derived from the same field as the plants in Image 1 Although the field did not exhibit any signs of damage damage occurred where the sprayer turned and a consequently higher dosage was applied
Plants with slight clethodim damage flowered over a longer period (Later on plants continued flowering to compensate) For most seasons the climate in the Western Cape is not favourable for pod development late in the growing season
Recommendations madeThe recommended sowing date of canola in the Western Cape province is from the beginning of April in the eastern parts of the Southern Cape to the end of April in the Swartland ndash provided that there is sufficient soil moisture End of April and May is also a time when dry periods can occur and when weed control cannot be applied effectively
Plants with no slight and severe clethodim damage from left to right
25June 2017
It is crucial that clethodim is sprayed onto canola after the two-leaf stage but before flower bud formation (Note that at this stage no flower buds are visible) Effective pre-emergence weed control is essential since the risk of clethodim spraying can become too high if late application becomes necessary Any late application can be defined as the stage where the canola plant has already developed too far This stage differs among cultivars
Do not under any circumstances consider spraying clethodim and a fungicide together in a tank mixture The result will be severe burn When considering an early fungus spray (for instance for blackleg or white leafspot) first spray the fungicide and follow up seven to ten days later with the herbicide It is important to adhere to the recommendations and dosage provided on the label at all times
For more information contact Piet Lombard at pietlelsenburgcom
26 June 2017Oilseeds f ocus
By Izak Hofmeyr
puts sustainability in the spotlight
The theme of the 57th congress of the Fertiliser Association of Southern Africa (Fertasa) in Durban was sustainability with speakers focusing on
sustainability of the fertiliser industry water soil climate and agriculture
Over the last few decades high fertiliser prices have led to the establishment of many more fertiliser plants which started putting pressure on prices as they came into production Therefore although there is a steady and constant growth in demand for fertilisers internationally the supply remains larger than demand something which constantly keeps pressure on
prices noted Adriaan de Lange Fertasa chairmain in his chairmanrsquos report
Balancing prioritiesRegarding the sustainability of the fertiliser industry in Africa Paul Makepeace from the African Fertiliser and Agribusiness Partnership based in Kenya pointed out that the need for distribution and supply of plant-available nutrients from areas of high concentration to those in need of food production and consumption will continue as populations grow urbanisation continues incomes grow and the understanding of science grows ldquoFertilisers as we know themrdquo he said ldquoare likely to be around for a long time to comerdquo
The main demand on water resources in South Africa will be from a growing population and demand for food coupled with the multiplier effect of climate change on the increased scarcity of water There will therefore be a pressing need to balance priorities Agriculture remains crucial in terms of its ability to provide food and income to the rural poor This was the opinion of Dr Sylvester Mpandeli research manager of the Water Research Commission with regard to the sustainability of water usage
Prof Isaiah Wakindiki of the University of Venda painted a bleak picture of what
awaits humankind if the soil runs out ndash and it is fast in the process ldquoWe have about 60 years of topsoil left Soil loss is up to 40 times the rate of formationrdquo he warned
Prof Roland Schulze of the Centre for Water Resources Research at the University of KwaZulu-Natal suggested that we should recognise that climate change and the associated issues are real and that coping strategies would have to be implemented urgently
In the closing session Prof Herman van Schalkwyk CEO of Suidwes Landbou discussed the sustainability of agriculture For countries to reach long-term sustainability he pointed out they would have to become competitive
Awards receivedFertasa awarded several members in various categories Jane McPherson manager of the Grain SA Farmer Development Programme received the Training and Mentor Award in Small-scale Farming for 2017 while Schalk Grobbelaar fertiliser consultant of Louis Trichardt was nominated for the Silver Medal Extension Award
The Gold Medal was awarded posthumously to Prof Willem Foumllscher previously of the University of Pretoria His two grandsons Willem Foumllscher and Henk van Wyk received the award on his behalf Outgoing Fertasa CEO Adam Mostert was awarded honorary membership
Adam Mostert right receiving honorary membership of Fertasa from Adriaan de Lange
Adriaan de Lange chairman of Fertasa with Jane McPherson of Grain SA
Arrie Janse van Vuuren Willem Foumllscher Henk van Wyk and Adriaan de Lange
27June 2017
MARKETS
By Dr Dirk Strydom
supported by Chinese demand
The global oilseeds supply is expected to reach a record level of 5464 million tons for the seven main oilseeds This high supply means that the production surplus will be at 111 million tons The world supply of soya beans is ample and global production is estimated to
reach a new high of 3454 million tons 336 million tons higher than last yearrsquos production levels It is expected that production in the northern hemisphere will reach 161 million tons and the southern hemisphere 184 million tons
Global soya marketsThe estimated soya bean crops in the United States (US) and Brazil have reached levels of 1172 million tons and 1115 million tons respectively Global traders expect that the Argentine crop will likely be below potential at around 55 million tons mainly due to detrimental weather conditions during the season
The global trade in soya beans is increasing with China being the main destination More than 80 of the anticipated growth in world soya bean imports is destined for that country In the last decade growth in terms of imports to China has created additional demand and supported prices The largest contributor to this increase in demand within the Asian nation is the substitution of dried distillerrsquos grain with solubles (DDGS) with soya meal
Global soya bean crushing is estimated to reach levels of approximately 2824 million tons which is roughly 109 million tons higher than the previous yearrsquos figures In the medium term the rest of the worldrsquos focus will mainly be on US soya bean with unfavourable weather conditions in certain states possibly slowing down the planting progress
Table 1 World supply of the seven main oilseeds (Source Oil world)
Global supply and demand (million tons)
Forecast 201617 201516 201415
Opening stocks 931 972 775
Production 5464 5019 5217
Total supplies 6395 5991 5992
Disappearance 5289 506 502
Ending stocks 1106 931 972
Stocksusage () 209 184 194
Table 2 World soya bean supply and demand (Source Oil world)
Global supply and demand (million tons)
Forecast 201617 201516 201415
Opening stocks 8023 8398 6276
Production 3454 31175 320
N hemisphere 16138 14509 14689
S hemisphere 18402 16666 17311
Total supply 42563 39573 38276
Crush (SeptAug) 2824 27154 25733
Other use 4609 4396 4145
Ending stocks 9714 8023 8398
Stocksusage () 296 254 281
EURussia and UkraineCanadaUSChinaIndiaArgentinaBrazilParaguay
Sunflower figuresThe world sunflower seed production forecast is estimated at a record of 483 million tons This is 53 million tons higher than the previous high in the 201516 season International traders expected the global crushing of sunflower seed to decline to 188 million tons for the period from April to September
The crushing of sunflower seed in Black Sea countries is projected to slow down somewhat over the next six months but it is likely to be offset by more crushing in other regions such as Argentina the European Union (EU) and on the local front The world sunflower seed balance is expected to be significantly less in the second half of this season than at the same time last year as a result of the consumption from Ukraine and Russia
28 June 2017
World production is however still expected to exceed demand during this season Assuming normal weather conditions this year a large crop may be seen in Black Sea countries as sunflower seed is one of the most viable crops for producers in the Ukraine and Russia with its low production cost and adaptability to harsh weather conditions
Table 3 World sunflower seed supply and demand (Source Oil world)
Global supply and demand (million tons)
Forecast 201617 201516 201415
Opening stocks 327 307 294
Production 4828 4285 4133
Total supplies 5155 4592 4427
Ending stocks 357 327 307
Stocksusage () 74 77 75
Canola pricesCanola prices have appreciated due to weather and crop concerns in the EU and Canada which account for approximately 63 of the world supply In Canada the canola futures appreciated more sharply than prices in the EU Snowfall and wet fields are currently delaying the spring plantings of canola which could make it challenging to complete this yearrsquos large plant intentions
In Canada the leading canola producer it is expected that production will be at 194 million tons which is higher than the previous year However with higher export and crushing figures the ending stock is 700 000 tons lower than the previous season
Groundnut cropThe Argentine groundnut crop is likely to reach record levels of one million tons (shelled) this season provided that major losses due to excessive rainfall or frost can be avoided during completion of the harvesting in the short term The Argentine crop for the year is expected to increase by 20 to 25 compared to the previous production season
Table 4 Canola supply and demand (Source Oil world)
Canadian supply and demand (million tons)
Forecast 201617 201516 201415
Opening stocks 202 254 059
Production 194 1838 1641
Imports 008 01 008
Exports 1065 103 914
Crushing 916 832 736
Other use 039 038 026
Ending stocks 13 202 254
Global prices of the majority of oilseeds decreased by small margins on a year-on-year (yy) basis However groundnut prices increased by 42 which was mainly due to production constraints International traders are of the view that global groundnut prices are likely to come under some pressure in the near future if the expected crop size is confirmed If expected production realises in the northern hemisphere and vegetable oil production recovers it can be expected that oilseed prices will be under pressure
Table 5 Main oilseed products (US$ton and Rton) (Sources Grain SA and Oil world)
Product Apr 2017 Apr 2016 change
Soya beans (US CIF Rotterdam) 388 396 -2
Soya beans (Brazil) 388 396 -2
Sunflower seed (EU) 400 427 -6
Groundnuts (US 4050) 1 650 1 163 42
Palm oil (Malaysia) 681 707 -4
Soya bean oil (US) 737 758 -3
Sunflower oil (Arg) 720 771 -7
Soya meal (Arg) 352 355 -1
Fishmeal (Peru) 1 250 1 408 -11
Randdollar 1344 146 -8
Sunflower seed 4 610 6 455 -29
Derived sunflower 5 233 6 126 -15
Soya beans 4 945 5 734 -14
Derived soya beans 5 749 6 317 -9
Soil canola 5 543 6 030 -8
The world supply of soya beans is ample and global production is estimated to reach a new high of 3454 million tons
Local productionThe local production of soya beans is also favourable with the National Crop Estimates Committee (NCEC) expecting a production of 1 233 130 million tons of soya beans (742 000 ndash 2016) 853 470 tons of sunflower seed (755 000 ndash 2016) and 86 600 tons of groundnuts (17 680 ndash 2016)
In the NCECrsquos first intentions-to-plant report for winter grains the canola plantings for the season are expected to be 3221 more than last yearrsquos The estimated area for the season is 90 000ha while last yearrsquos area planted was 68 075ha The prices on the local market followed normal seasonal trends with prices under pressure at harvesting time due to larger supplies within the market
The soya bean crop fared better than most expectations which led to increased pressure on prices This means that prices move below derived prices increasing the crushing margins of processors (Figures 1 and 2) Soya beans should therefore remain under pressure in the short term and will most probably recover in the second half of the year closer to derived prices
29June 2017
MARKETS
Figure 1 Safex soya bean prices and the derived soya bean price (Source Grain SA)
Figure 2 Crushing margins of soya beans (Source Grain SA)
Soya bean prices are sensitive to the exchange rate in times of a balanced supply and demand However in terms of a macroeconomic environment the exchange rate is extremely volatile and sensitive to political instability From Figure 3 it is clear that soya bean prices follow the exchange rate with the exception of times when supply and demand are not in balance In the previous season this was due to limited available supply and in 2017 it is as a result of large supplies
Over the next six months it will be crucial to monitor the exchange rate and use the high volatile movements to the advantage of buyers and sellers depending on the direction of such movement
Figure 3 Soya bean price and rand-dollar exchange rate (Source Grain SA)
30 June 2017
31June 2017
South Africarsquos soya bean production has been a great success story over the past decade with a ramp-up in production reaching one million
tons Over the same period the countryrsquos soya bean crushing capacity has also seen a significant increase
For this reason soya bean crushers and commodity traders have expressed significant interest in the ability to trade the entire crush complex This crush complex includes local soya beans and relies on the Chicago Mercantile Exchange (CME) meal and oil as a proxy for global prices
Key componentThe complex a key component in the soya bean market is what is known as the lsquocrushrsquo spread Soya beans are processed into two products namely soya bean meal (SBM) and soya bean oil The crush spread is the difference between the combined value of the products and the value of the soya beans
It is a measurement of the profit margin for soya bean processors The soya bean processor will be interested in the crush spread as part of its hedging strategy and the speculator will look at the crush spread for trading opportunities
Although we have the individual contracts listed the challenge today is the initial margin efficiency to wrap all three
as a single product in the desired ratios For instance when crushing 100 tons of beans this will result in 74 tons of meal and 17 tons of oil with 9 tons as wastage
Separate contractTherefore a crush spread can be calculated as the price of SBM (Rt) multiplied by 74 plus the price of soya bean oil (Rt) multiplied by 17
Figure 1 Soya bean crush margin
The Johannesburg Stock Exchange (JSE) soya bean crush complex is an easily accessible hedging tool for the crusher while traders are also able to participate in the movements of this crush complex This product is not unique to the JSE as globally the CME Group offers it not only for their local soya beans but also links it with the Dalian Commodity Exchange in China
less the price of soya beans (Rt) The current clearing solution does not allow for this and therefore it necessitated the introduction of a separate contract that will trade the complex wrapped up as a single product
Figure 1 represents a time series of the crush margin supporting the urgency for a price risk management tool such as a futures contract
Advertorial
For more information visit the JSE website wwwjsecoza
32 June 2017
By Dr Charl van der Merwe Tiger Brands
The
Between 20 000 and 25 000 tons of peanuts were used annually for the manufacturing of peanut butter between 2006 and 2013 in South Africa This volume includes splits and 80100s
The peanut butter segment is an important one in the groundnut market of the country The prospects for this market segment are promising
Socio-economic factorsThe demand for a product is influenced by the financial status of the consumer and the socio-economic factors in the country The percentage of citizens who passed matric increased by 27 between 2010 and 2014 (Figure 1) The number of people with a monthly income of between R5 000 and R20 000 increased from 44 to 63 (Figure 2) between 2001 and 2015
Figure 1 Education levels
Figure 2 Household income (Source BFAP)
The increase in household income and the decrease in unemployment from 41 in 2001 to 24 in 2015 equate to an increase in the number of people in the middle to upper classes as indicated in Figure 3
Figure 3 LSM class mobility
The upper middle and upper classes have steadily grown between 2005 and 2010 according to the information presented in Figure 3 This is significant because according to the information in Table 1 peanut butter forms part of the diet of the middle and upper classes
market in South Africa
33June 2017
MARKETS
Table 1 Food choices (Source BFAP)
Population Poorest 30 Lower middle class Upper middle class Wealthiest 20
Animal protein foods (continued)
EggsCanned pilchardsPolonyFreshfrozen
chilled fishPork
Beef sausagePolony
Canned pilchardsPolonyMutton and lamb
Mutton and lambCanned pilchardsPolonyFreshfrozen
chilled fish
EggsPorkFreshfrozen
chilled fishPolonyViennasCanned pilchards
Fats oils
Edible oils (eg cooking oils)MargarinePeanut butter
Edible oils (eg cooking oils)Margarine
Edible oils (eg cooking oils)Margarine
Edible oils (eg cooking oils)MargarinePeanut butter
Edible oils (eg cooking oils)MargarinePeanut butterButter
Peanut butter is included in the diets of the upper middle and upper classes An increase in the number of people in the middle class can equate to an increase in peanut butter consumption Local peanut butter consumption over a twelve-year period is indicated in Figure 4
Figure 4 Peanut butter consumption (Source SAGIS)
Health and marketsMore than 25 000 tons of groundnuts were used for the manufacturing of peanut butter in 2013 It is projected that more than 30 000 tons of groundnuts will be used for peanut butter in 2017
Groundnut consumption is supported by the socio-economic factors as discussed above and by a focus on a healthy diet According to Menrsquos Health magazine groundnuts are a good source of protein The vitamin E helps to protect cells and the magnesium (Mg) in groundnuts assists with metabolic activity
Peanut butter consumption is also influenced by wheat consumption Local wheat consumption is indicated in Figure 5 The information indicates a steady growth in wheat consumption due to the growing middle class in South Africa
Figure 5 Wheat consumption
Groundnut consumption is also influenced by the price of groundnuts and normal levels of supply and demand will influence the price Price movements since 2000 are indicated in Figure 6
Figure 6 Groundnut prices
International groundnut prices increased during 2016 as a result of the rain during harvesting in Argentina and the higher demand from China The possibility exists that prices will decrease if the demand and supply situation returns to normal levels Lower prices can support the demand for groundnuts and peanut butter
ConclusionGrowth in the middle and upper classes in South Africa and higher household incomes over the past few years have boosted the peanut butter market in the country The peanut market has grown by approximately 14 since 2010 Socio-economic factors and the international prices will influence growth in the peanut market in the future
The percentage of local groundnuts used for peanut butter manufacturing increased from 41 between 2011 and 2013 to 51 between 2014 and 2016 compared to 60 in the United States (US)
34 June 2017
By Jolanda Nortjeacute manager of the Southern African Grain Laboratory
201516 production season
The deep root system of a sunflower enables the plant to perform better than other crops during dry seasons making sunflower seed production
very suitable amid South African climatic conditions As a result sunflower seed production exceeded soya bean production this season for the first time since the 201011 season
The final commercial sunflower crop figure of the 201516 season is 755 000 tons This figure represents an increase of almost 14 (92 000 tons) compared to the 201415 season The major sunflower-producing provinces Free State and North West contributed 92 of the total crop (Figure 1)
Figure 1 Provincial contribution to the production of the 201516 sunflower crop
The area utilised for sunflower production increased by almost 25 from 576 000ha in the previous season to 718 500ha this season Due to the drought conditions production only increased by 14 as the yield decreased from 115 to 105tha
Annual improvementsGlobal sunflower seed production for the 201516 season stands at
42 465 million tons with the Ukraine and Russia contributing 51 to this total The forecast for the 201617 season is 47 397 million tons according to figures published in the 2016 US Sunflower Crop Quality Report compiled by the United States (US) National Sunflower Association (NSA)
According to the Bureau for Food and Agricultural Policyrsquos BFAP Baseline Agricultural Outlook 2016ndash2025 the sunflower area is expected to decline in 2017 to around 2015 levels assuming normal rainfall patterns before stabilising at approximately 560 000ha by 2025 An average production increase of 14 per annum is expected to result
in a production of 820 000 tons by 2025 driven by average annual improvements in yield of close to 3 in the same year
During the 2016 harvesting season a representative sample of each delivery of sunflower at the various silos was taken according to the prescribed grading regulations A total of 176 composite
sunflower samples representing the different production regions were analysed for quality and the results published in the fourth annual South African Sunflower Crop Quality Report 201516 Season
Of the 176 samples analysed for the purpose of this survey 78 (138) were graded as Grade FH1 and 38 of the samples were downgraded to class other
sunflower seed (COSF) The percentage of FH1 samples showed a decrease compared to the 86 and 82 of the 201415 and 201314 seasons respectively This decreasing trend could not be attributed to any single grading deviation
Collective deviationsThe majority of samples were downgraded as a result of the percentage of either the screenings foreign matter or the collective deviations or a combination of these exceeding the maximum permissible deviations of 4 and 6 respectively The presence of poisonous seeds (Datura sp) exceeding the maximum permissible number one per 1 000g was also a contributing factor
Gauteng represented by two samples reported the highest weighted average percentage screenings of 360 followed by the North West (N = 80) and Free State (N = 80) with 280 and 201 respectively Limpopo (seven samples) reported the lowest average percentage screenings of 109 The weighted national average was 234 compared to the 205 of the previous season The maximum permissible deviation according to the grading regulations is 4
Sclerotia of Sclerotinia sclerotiorum was observed on 18 of the samples (10) compared to the nine and eleven of the previous two seasons respectively Fourteen of these samples originated in the North West and three in the Free State The highest percentage (180) was present on a sample from Mpumalanga This is however still well below the maximum allowable level of 4 Weighted average levels ranged from 0 for Gauteng and Limpopo 003 in the Free State and 004 in North West
35June 2017
to 026 in Mpumalanga The national average of 004 was equal to the previous season
Foreign matterThe highest weighted percentage foreign matter (177) was reported for the seven samples from Mpumalanga The Free State and North West averaged 161 and 123 respectively The lowest average percentage was found in Limpopo namely 101 The national average of 141 was the highest of the last three seasons
Test weight providing a measure of the bulk density of grain and oilseeds does not form part of the grading regulations for sunflower seed in South Africa An approximation of the test weight of these crop samples was done by determining the g1ℓ filling weight of each sample using the Kern 222 apparatus
The test weight was then extrapolated by means of formulas obtained from the lsquoTest Weight Conversion Chart for Sunflower Seed Oilrsquo of the Canadian Grain Commission (CGC) The weighted average this season was 425kghℓ Individual values ranged from 350 to 481kghℓ Last seasonrsquos values ranged from 34 to 505kghℓ and averaged 442kghℓ (Figure 2)
Figure 2 Comparison of the test weight per province over four seasons
Nutritional componentThe nutritional component analyses of crude protein crude fat crude fibre and ash are reported as a percentage (g100g) on an as-received or as-is basis The weighted average crude protein content this season was 1793 almost one percent higher than the previous season and the highest average value since the start of this survey in 201213 The North West had the highest weighted average crude protein content of 1824 and Mpumalanga the lowest with 1714 The Free Statersquos crude protein content averaged 1777 (Figure 3)
Figure 3 Average crude protein content per season
The weighted average crude fat percentage of 382 was the lowest of the last four seasons and 15 lower than the previous season Gauteng had the highest weighted average crude fat content of 403 The lowest average fat content was observed in the Free State (380) North West and Mpumalanga averaged 382 and 388 respectively (Figure 4)
Figure 4 Average crude fat content per season
The weighted average percentage crude fibre increased slightly from 20 in the previous season to 203 this season Average values varied between 192 in Gauteng to 209 in Mpumalanga The weighted average ash content is slightly higher with 259 than last seasonrsquos 255 The provincial averages ranged from 249 in Mpumalanga to 269 in Limpopo
The results of this survey are available on the Southern African Grain Laboratory NPC (SAGL) website wwwsaglcoza Hard copy reports are distributed to directly affected groups and interested parties The report is also available for
download in PDF format With gratitude to the Oil and Protein Seeds Development Trust (OPDT) for financial support of these annual surveys and to the members of Agbiz Grain for providing the crop samples
June 2017
and its effect on broiler performance
Growth depression effects on poultry due to antinutritional factors present in soya beans have been well documented for over 50
years Trypsin inhibitors are the primary antinutritional factor in soya bean meal (SBM) which is a globulin-type protein Trypsin inhibitors inhibit the conversion of zymogens to active proteases of trypsin and chymotrypsin In addition to their detrimental effects on proteolytic action trypsin inhibitors dramatically affect the size of the pancreases and amount of trypsinogen produced
The requirement to heat treat soya beans has been understood for nearly a century The pH rise was adopted as the common method of determining adequate heat A change in pH above 02 pH units is considered underheated Animal feed manufacturers in Brazil use 03 pH units as the upper limit of SBM processing
It has been established that a pH unit change of zero is not an adequate measure of overprocessing but that if it is between zero and 005 the SBM
has been adequately processed This is a level considered ideal and should be strived toward It must be noted that heat treatment of SBM only destroys those antinutritive factors that are heat-labile
High correlation expectedAs recently as 2001 standardised tests were established for trypsin inhibitor analyses The correlation between trypsin inhibitors and urease activity is expected to be high Urease activity is still the methodology of choice for measuring the acceptable estimation of the trypsin inhibitor content in SBM
It is unclear what the optimum residual concentration of trypsin inhibitors should be Work published as far back as 1991 shows a linear response between bird performance body weight gain (BWG) and feed conversion and levels of trypsin inhibitor activity (TIA) (mgg) in soya bean in the ration There still seems to be considerable uncertainty regarding these levels As recently as 2014 Pacheco et al showed optimal bird performances at TIA of 67mgg rather than the lowest value of 36 which was also fed as a treatment
Response of performance to TIA did not appear linear in this trial Ruiz (2012) observed that if feed contained high levels of SBM with a TIA of more than 35mgg or urease activity above 006 pH units rapid feed passage outbreaks could occur (observation not a trial) detrimentally affecting bird performance
Genetic potentialTIA tests are expensive and time-consuming with a repeatability standard deviation of 027 (Sueiro 2015) Considering the correlation found by Belalcazar and Otalora (2012) as quoted by Riaz (2012) (00738x ndash 01224 with an R2 = 09748) it has been proposed that the urease index should continue to be used in conjunction with TIA ndash a more rapid test for underprocessing but a figure as low as zero is not an indication of overprocessing
The genetic potential of the modern-day broiler has resulted in broilers being slaughtered at an earlier age each year also resulting in a continuous improvement in gain-to-feed ratio Diets have become more nutrient-dense since high-density diets not only achieve maximum performance but have become synonymous with optimal performance
Globally soya bean processing has improved with the consequential improvement in SBM quality The measurement of SBM quality is extremely complex and starts with proximate analysis higher protein levels obviously still being the major economic value driver of SBM The ratio of amino acids to protein also differs depending on the source of SBM ndash the main influence on this being the composition of the soya bean used in processing
Digestibility of nutrients is critical
36
By Dr Erhard Briedenhann
37June 2017
and affected by many criteria other than heat-sensitive antinutritive factors such as levels of lectins mannans raffinose and stachyose Lower fibre levels have therefore been required
The nutrient profile differs among the various sources of SBM Higher protein not only increases the quantity of essential amino acids but there is solid evidence that amino acid digestibility improves as the protein content of the SBM increases
Conclusion SBM quality is determined by many other factors other than TIA level The global industry still considers urease index as the appropriate measurement for underprocessing Levels have been driven down to below 01 urease index to ensure sufficient processing SBM with a higher TIA may have significantly higher digestible amino acid levels irrespective of TIA value
Testing methodsThe international standard method for the determination of soya products is ISO 14902 when compared to the American Association of Cereal Chemists (AACC) standard AACC 22-4001 as modified by Hamerstrand in 1981 and expressed as mg of inhibited trypsin per gram of sample TIA values according to ISO 14902 result in significantly lower values than the previously mentioned method These methods are not directly comparable (Sueiro et al 2015) The particle size of samples during analysis was found critical
Conclusion The testing method needs to be clearly stated and understood when TIA levels vs performance is quoted Particle size is of critical importance
OverprocessingTIA unfortunately does not measure overprocessing of SBM and is something which is of definite concern There is compelling evidence that overprocessed SBM would lead to reduced broiler performance (Wiltafsky 2013) The lower the TIA the higher is the risk of overprocessing and reduced amino acid availability
Conclusion TIA is not a measure of overprocessing but has become a key criterion with regard to SBM quality Lower TIA is a higher risk of overprocessing
Broiler performance and TIAIn studies conducted on SBM of various origins it has been found that United States (US) SBM with a TIUmg of 252 (urease 008) versus that of Argentina with a TIUmg of 198 (urease 0007) exhibited a better crude protein (CP) digestibility and an 88 lysine (Lys) and 88 methionine (Met) digestibility versus Argentina at 86 digestibility
The lower potassium hydroxide (KOH) level of 78 for Argentine SBM tended to overprocessing which could have resulted in lower amino acid digestibility (Ravindran 2014) US SBM consistently resulted in better broiler performance due to its protein quality despite higher TIA levels
Gous (2016) replaced Argentine (Molinos) SBM with a TIA of 128 with South African SBM with a TIA of 304 Although not statistically significant the South African SBM had a numerically better feed conversion of 005 and superior BWG of 45g at slaughter for Ross broilers
This could be ascribed to the higher protein content and quality of our local SBM and clearly corroborates what has been experienced commercially that high-quality South African SBM not only performs as well as Argentine-imported meal in broiler rations but can demand a premium due to its higher digestible nutrient content
Conclusion There is no trial work in the literature which demonstrates that a difference of one TIA mgg will have any significant effect on broiler performance at low levels of TIA Such trial work still needs to be done Contrary to this significant difference in broiler performance it has been found between SBMs with the same TIA levels
Particle sizeIn the US Pacheco (2014) concluded that when using expeller SBM there was not a linear response in bird performance to TIA A curvilinear response for both feed conversion and BWG was experienced The particle size of the SBM had a greater effect on bird performance than the TIA
Conclusion Particle size of SBM could have as significant an effect on broiler performance as TIA Broiler performance response to TIA is not necessarily linear
EnzymesThere is compelling evidence that the use of various enzymes ndash mainly protease pectinase and phytase ndash could positively influence the negative effects of antinutritive factors in SBM further complicating the correlation between TIA and bird performance (Stefanello 2012) (Aureli 2013) and (Faruk 2013)
Conclusion Enzyme inclusion and their combinations could have a significant effect on TIA level which will affect broiler performance
UniformityUniformity of SBM is considered globally and by the local feed industry to be an important criterion At the beginning of soya bean volume crushing in South Africa it presented a challenge due to the restricted continuity of processing This aspect has been improved considerably so much so that major end users of certain locally produced material are starting to report subtle differences between Argentine- and South African-produced SBM uniformity
Conclusion High-quality South African SBM if produced in large consistent volumes can obtain the uniformity experienced by Argentine suppliers
TIA in full-fat and expeller SBMIt can be confirmed that laboratories testing TIA are very comfortable to analyse for TIA in soya bean full-fat soya expeller SBM and solvent-extracted SBM TIA tends to be higher in full-fat and expeller SBM but they can confirm this is not due to the TIA test but the fact that trypsin inhibitor content of these raw materials is generally higher than solvent-extracted SBM due to the fact that they have not been heat-treated to the extent that solvent-extracted SBMs are Despite this they can still deliver good broiler performance to the same extent that moderately higher TIA SBMs can
Conclusion TIA analysis can be performed equally well on soya beans full-fat soya expeller oilcake and solvent-extracted meal TIA limits are applicable to all soya bean protein sources
38 June 2017
By Jolanda Nortjeacute manager of the Southern African Grain Laboratory
The extreme drought conditions experienced this past season has led to an approximately 27 (184 500ha) decline in the
local soya bean production area Yield was also negatively impacted with the average national yield decreasing from 156tha in 201415 to 147tha The result was an almost 31 (328 000 tons) decline in the commercial soya bean crop compared to the previous season
Sunflower production surpassed soya bean production for the first time since the 201011 season The major soya bean producing provinces contributing 75 of the total crop were Mpumalanga and the Free State Numbers reflected in Figure 1 were obtained from the National Crop Estimates Committee (NCEC)
Figure 1 Tonnage and area utilised for soya bean production since the 200506 season
201516 season
According to the Bureau for Food and Agricultural Policyrsquos BFAP Baseline Agricultural Outlook 2016ndash2025 a high demand for soya beans arising from expanded crushing capacity is expected to cause a sharp increase in area utilised for soya bean production in 2017
Assuming normal rainfall patterns production is expected to recover to more than 900 000 tons this year
Global productionAn estimated 31281 million tons of soya beans were produced during the 201516 season according to the World Agricultural Supply and Demand Estimates (WASDE) report (WASDE-563) The United States
contributed 34 Brazil 31 and Argentina 18 to this total Global soya bean production during the 201617 season is projected to be 34079 million tons Soya beans account for more than half of the worldrsquos oilseed production
During the 2016 harvesting season
a representative sample of each delivery of soya beans at the various silos was taken according to the prescribed grading regulations A total of 143 composite soya bean samples representing the different production regions were analysed for quality and the results published in the
fifth annual South African Soya Bean Crop Quality Report 201516 Season
Quality results summaryOf the 143 samples analysed for the purpose of this survey 89 (127) were graded as Grade SB1 and 16 of the samples were downgraded to class other soya beans (COSB) During the previous two seasons 87 (201415) and 88 (201314) of the samples were graded SB1
The majority of the samples were downgraded as a result of either the presence of poisonous seeds exceeding the maximum permissible number of either one per 1 000g or seven per 1 000g or as a result of the percentage other grain andor foreign matter exceeding the maximum permissible deviations of 05 and 5 respectively
According to the South African soya bean grading regulations the determination of the percentage wet pods in a consignment must be performed based on a working sample of at least 10kg of soya beans from a representative sample of the consignment Due to practical considerations the samples received at the Southern African Grain Laboratory (SAGL) NPC from the grain storage companies are typically plusmn5kg
Pods were found in twelve of the 143
39June 2017
samples graded All of these pods were green upon receival at the SAGL but not wet according to the definition The percentage of these pods in the samples ranged from 005 to 050 based on a working sample size of at least 200g
The national average percentage of foreign matter has increased over the last five seasons reaching its highest level this season increasing from 034 in 201112 to 082 during the last season and to 085 now The samples from North West had the highest weighted average percentage namely 162 The percentage in the rest of the samples ranged from 026 in the Northern Cape to 091 in Mpumalanga
Presence of sclerotiaThe number of samples containing sclerotia increased from 20 in the previous season to 36 this season The highest percentages of sclerotia observed (076 and 064) were on samples from Mpumalanga followed by a sample from North West with 060 These percentages are however still well below the maximum permissible level of 4 The national weighted average percentage this season was 004 compared to the 001 of the previous season
North West (eight samples) reported the highest weighted average percentage soya beans and parts of soya beans above the 18mm slotted sieve which pass through the 475mm round-hole sieve namely 156 and the sample from the Northern Cape the lowest at 040 Mpumalanga with the highest number of samples (91) reported an average of 090 The Free State averaged 103 (23 samples) The national weighted average percentage decreased from 181 the previous season to 092 this season
The lowest weighted average percentage of defective soya beans on the 475mm sieve were observed on the samples from Mpumalanga namely 146 The Northern Cape reported the highest percentage of 494 followed by North West and KwaZulu-Natal with
399 and 334 respectively The national weighted average increased slightly from 195 last season to 202 this season
The national weighted average percentage soiled soya beans of 206 is the highest since this survey started in the 201112 season when the average was 160 The average was 077 last season Average weighted percentages per province ranged from 128 in the Northern Cape to 446 in Limpopo
Soiled soya beansAlthough the number of samples containing soiled soya beans as well as the average percentage soiled soya beans per sample increased significantly none of the percentages were above the maximum permissible deviation of 10 according to the grading regulations Last season one sample
Figure 2 Average crude protein content per province over five seasons
from Mpumalanga exceeded this limit
Test weight providing a measure of the bulk density of grain and oilseeds does not form part of the grading regulations for soya beans in South Africa An approximation of the test weight of these crop
samples was done by determining the g1ℓ filling weight of each sample using the Kern 222 apparatus
The test weight was then extrapolated by means of formulas obtained from the lsquoTest Weight Conversion Chart for Soya Beanrsquo of the Canadian Grain Commission (CGC) The weighted average this season was 709kghℓ Individual values ranged from 649 to 73kghℓ Last seasonrsquos values ranged from 633 to 782kghℓ and also averaged 709kghℓ
Soya beans are the main oilseed crop produced in South Africa driven mainly by the demand for protein feed in the animal feed industry The nutritional component analyses namely crude protein crude fat crude fibre and ash are reported on a dry basis (DB) (moisture-free basis)
The weighted average crude protein content this season was 4022 slightly higher than the 3989 and 3984 of the previous two seasons The sample from the Northern Cape had the highest weighted average crude protein content of 4156 while Gauteng reported the lowest average that of 3886 (Figure 2)
An estimated 95 of the area planted to soya beans in South Africa consists of genetically
modified crops
Soya beans are the main oilseed crop produced in South Africa driven mainly by the demand for protein feed in the animal feed industry
40 June 2017
Crude fat percentageThe weighted average crude fat percentage of 194 compared very well with the 193 in 201415 The samples from KwaZulu-Natal had the highest weighted average crude fat content of 206 The lowest average fat content was observed in Mpumalanga with 191 (Figure 3)
Figure 3 Average crude fat content per province over five seasons
The weighted average percentage crude fibre varied from 62 in Limpopo to 76 in the Northern Cape The national
GM-crops These soya beans have tolerance
to herbicides (chemical
products used to destroy weeds but
not the crop plants) Worldwide GM soya
beans occupy 80 of the area planted to this crop
Fifteen (10) of the crop samples were screened by means of the EnviroLogix QuickComb Kit for bulk soya beans to quantitatively determine the presence of the CP4 EPSPS trait (Roundup Readyreg) All the samples tested positive
The results of this survey are available on the SAGL website wwwsaglcoza Hard copy reports are distributed to directly affected groups and interested parties The report is also available for download in PDF format With gratitude to the Oil and Protein Seeds Development Trust (OPDT) for financial support of these annual surveys and to the members of Agbiz Grain for providing the crop samples
weighted average of 73 was higher this season than in the previous one when the average was 64 A small variation of only 005 is observed with regard to the national weighted average ash content
over the five seasons that this survey has been conducted This season the average ash content was 461 Samples from the Northern Cape and Limpopo tend to show higher ash contents over seasons
The majority of soya beans producedgrown in
South Africa are genetically modified (GM) An estimated 95 of the area planted to soya beans in South Africa consists of
- OFC - Oilseed June 2017
- IFC - Oilseed June 2017
- p1-5 Intro pages -Oilseed June 2017
- p6-17 Agronomy - Oilseed June 2017
- p18-21 Seeds - Oilseed June 2017
- p22-25 Chemicals amp fertiliser - Oilseed June 2017
- p26 General - Oilseed June 2017
- p27-33 Markets -Oilseed June 2017
- p34 - 40 Quality - Oilseed June 2017
- IBC - Oilseed Dec 2016
- OBC - Oilseed June 2017
-
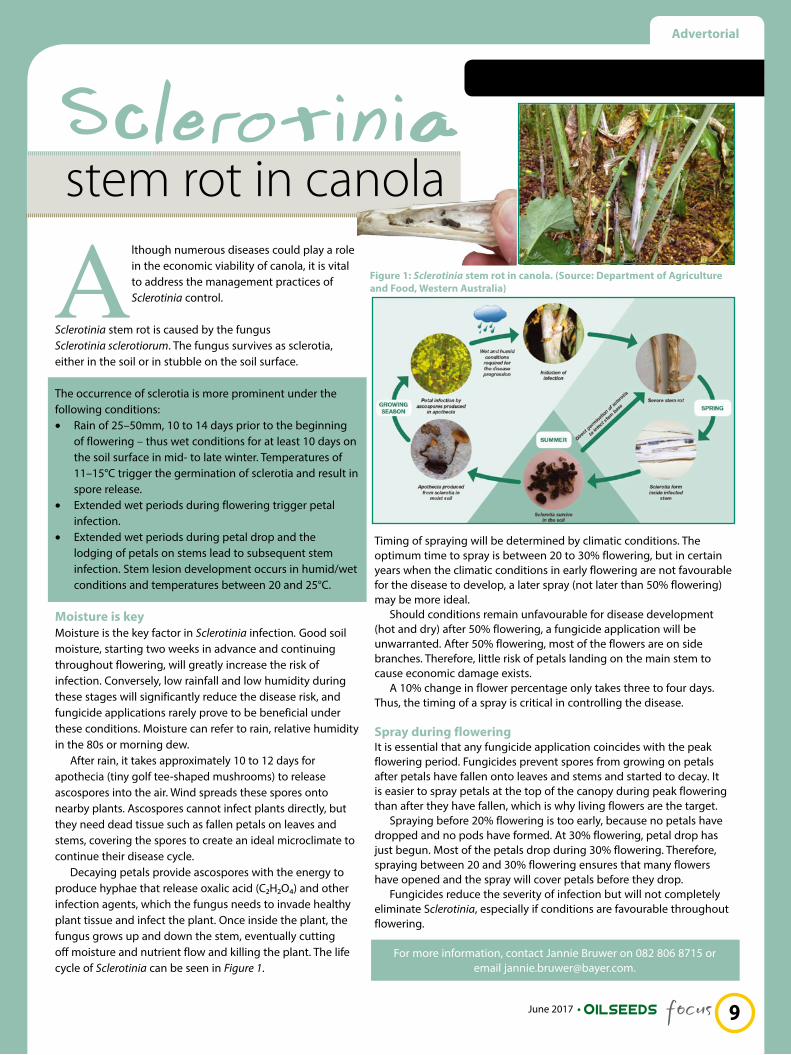
June 2017
During the 201516 production year the groundnut industry in South Africa reached its lowest production figures since records were kept from
1936 Exporters and producers had to pull out all the stops to save the industry and to generate a return to become one of the worldrsquos best producers once again
Alfonso Visser owner of the Golden Peanut and Tree Nuts plant in Hartswater and one of the major groundnut producers in the country says the main reason why the groundnut industry faced challenges was the El Nintildeo climate phenomenon
While it may seem as though producers lost interest in cultivating groundnuts they didnrsquot really stop producing It was rather a matter of late rainfall that forced producers to skip planting over the past three years During this period the first rains came only between 20 and 28 December and by that time it was too late for groundnut plantings In certain parts producers elected to plant maize instead
Visser also says that producers who had the opportunity to plant groundnuts in those three years recorded their best profits ever This year the harvest looks promising and the climate has played its part Groundnut production is set to show better profits than most other crops this year
In the 201516 production year South African producers could only manage to plant 22 600ha and only 17 680 tons of groundnuts were harvested This season South Africa received its first rains from mid-November to mid-December and many producers managed to plant the commodity again Approximately 55 000ha were planted in the Free State Limpopo Northern Cape and the North West Apart from rainfall at the right time there is also a promising export market in Europe and Japan which are all good signs for a profitable year
Keen interest in planting Adri Botha chairperson of the Groundnut Forum of South Africa (SAGF) says groundnut production in the country similar to many other crops experienced hard times due to the drought but when the opportunity presented itself farmers showed keen interest in planting again
Information from the South African Grain Information Service (SAGIS) indicates that an average of 48 720ha were planted over the past ten years and the average harvest during this time was 66 139 tons The average over the last five years has declined however During this time an average of 45 015ha was planted and the average harvest was 52 568 tons In the past two years groundnut production has declined even more
As noted before only 22 600ha were
planted during the 201516 production year and a mere 18 850 tons were harvested The effect of this decrease in volumes is that South Africa failed to produce sufficient quantities of groundnuts for local consumption with international buyers not receiving the regular volumes they are used to
Botha believes that with a stable and adequate supply this market will be regained easily enough because South African exporters are renowned for quality and reliability under normal circumstances Visser is also very optimistic regarding the export market He says South Africa did not lose the international market The supply did decrease which negatively affected the export market because international buyers turned to other more reliable sources Despite this South Africa still exports to Japan and Europe with a focus on the higher-income sector of these countries
Figure 1 South African groundnut production figures 200607ndash201617
10
By Koos du Pisanie
The 2017 harvest looks promising and the climate has played its part in setting the table for better production and higher profits
11June 2017
New possibilities for businessThere are new possibilities available for groundnut producers but these will entail hard work especially in respect of the export market Botha says that due to a changing and declining supply South Africa has lost some of its standing in recent years as a reliable export source for the international groundnut market in Europe and Japan However the markets are still there to be regained and expanded if the broader industry commits to the commodity and consistent supply of high-quality products
Last year was one of the worst production years in South Africa but exporters still managed to provide 36 or 2 317 tons of the harvest to Japan 32 to Mozambique 12 to the Netherlands and 11 to Belgium
ldquoSouth African groundnuts are of a good quality and well known in the international market Up until 1994 the country was known for its excellent quality and buyers didnrsquot hesitate to use South African groundnuts directly in their production lines without the need for more sorting or processing Unfortunately in the move from a single-channel
marketing structure via the Oilseeds Board as well as the challenges brought on by labour issues and adjustments needed on the technological side primary producers started considering other commodities In this process South Africa lost the ability to retain its spot in the market along with many international buyers reluctantly forced to source products from alternative origins
ldquoAt the same time Argentina rose as a worthy opponent in the global supply arena making matters even more difficult for exporters Still the international demand on the back of global population growth along with the marketability of groundnuts as an excellent source of nutrients and healthy oils leaves the door wide open to usrdquo Botha says
Challenges for the futureVisser says groundnut production levels in South Africa have been so low in the past two to three years that even the national market experienced a shortage He believes that one of the challenges for the groundnut industry is achieving an increase in local consumption
In the past peanut butter formed a
major portion of the menus relating to food projects for schools prisons and non-profit organisations assisting the homeless for instance because it is affordable and high in protein Lately however it has become too expensive for this purpose Due to a decline in quality this market has also shrunk Therefore the first challenge will be to increase local consumption again
ldquoThe second challenge is identifying cultivars which will produce higher yields Farming has become expensive and producers have to find ways to cut down on input costs while still delivering higher returns In the groundnut industry we need access to cultivars that will deliver higher yields This way we can cut on unit costs and deliver a more affordable product to the marketrdquo Visser says
Exceptionally high yieldsBotha adds that in addition to hope for continued local cultivar development international cultivar owners are sought and invited to submit seed to be included in the local Elite Cultivar Trials funded and managed via the Oilseeds Advisory Committee (OAC) She says groundnut production has always been more profitable than any other competing crop but is also more intensive and the necessary attention should be given to best practices in an effort to ensure that available cultivars reach their full potential It is no secret that certain farmers will deliver exceptionally high yields with the existing available material
Another of the challenges in the industry ndash for which excellent work has already been done ndash is introducing groundnut production as a high-income crop to emerging farmers The focus and goal is to help these farmers become regular producers of quality products through courses and mentorship ultimately giving them access to the larger and more formal market environment
For any information on the groundnut industry in South Africa contact Alfonso Visser on 082 948 2222
or 053 474 1345 or Adri Botha on 082 376 5940
In addition to continued local cultivar development the industry is also seeking international cultivar owners to submit seed to be included in the local Elite Cultivar Trials funded and managed via the Oilseeds Advisory Committee
12 June 2017
13June 2017
Exceptional yields are possible with soya beans provided that you correctly attend to every facet of the cultivation process This year a soya bean yield of
up to 8tha filled the combine harvester to the brim on the farm Leeubank of Gerrit Roos near Wonderfontein in Mpumalanga
Last year he was crowned champion soya bean producer (under irrigation) in the Weigh to Wintrade National Yield Competition when a block of two hectares he entered yielded an average of 5236tha This year the harvester measured just over 8tha in certain parts of his irrigated fields Roos says careful attention to small things in every aspect of the entire cultivation process makes the difference because he manages everything in a precision farming system
Every year Roos plants strip trials containing the soya bean cultivars of different seed enterprises This allows them to determine which cultivars best suit the conditions on his farm Roos plants approximately 1 000ha maize and 450ha soya beans He also manages a livestock branch
Maize and soya beans are planted in a crop rotation system which means the fields are planted with soya beans every three years When he joined the
By Andries Gouws
An
soya bean yield
enterprise Roos planted soya bean trials and although maize sets
the tone as the primary crop the soya beans have stood their ground especially considering their hidden benefits
Since their first soya bean planting in 199293 they have doubled the average yield on dryland from 18 to 36tha They also plant soya beans under centre pivot irrigation and 20ha with underground drip irrigation These fields deliver an average yield of 4 and 425tha respectively
Strip-till systemOrtman implements are used to strip-till the land During last yearrsquos planting season a large section of the fields was too damp for these implements and a broad-tilling implement (Fieldspan) was used after which the soil was compacted with a roller The advantage of this process is that germination takes place evenly and the soil is much more even thus reducing wear and tear on the blades of the combine harvesterrsquos soya bean table and saves a lot of money
In the strip-till system only the soil in which the seed will be planted is
tilled to a depth of 280mm Every year the strips are moved slightly to eventually utilise the entire land area The fields consist mainly of Avalon soils and care is taken to keep the soil pH level between 6 and 65
Since 2000 they have been using a precision farming system with a diamond pattern (100m times 100m) where soil samples are taken and analysed annually If the analyses indicate a shortage of lime or other nutrients corrections are made continuously Every third year lime is applied across the board and fertilisers are applied throughout according to changing needs
Roos says he has found that soya beans react most favourably to lsquooldrsquo fertilisation For this reason a mixture of 012 fertiliser at 200kgha is broadcast just after the maize which is followed by soya beans that have been harvested This leads to a reaction between the
Spray applications are combined to prevent unnecessary cultivation
Gerrit Roos with his award as winner of the irrigation section of the Weigh to Wintrade National Yield Competition
14 June 2017
15June 2017
crop residues fertiliser and organisms in the soil which in turn stimulates the earthworm numbers in the soil
Roos plants cultivars that exhibit resistance to Roundupreg herbicide Upon planting herbicide is applied to the soil to postpone the first Roundupreg application for as long as possible Proven cultivars are planted as are the best performers in every yearrsquos strip trials The cultivars that grow upright are planted at approximately 300 000 plants per hectare and the shrub-type cultivars at 260 000 to 280 000 plants per hectare in rows 90cm apart The seeds are planted at a depth of between 4 and 5cm to ensure that there is sufficient moisture for even germination
Fungal disease controlAround 40 days after planting the first Roundupreg application is done Supplementary nutrients and fungicides are mixed into the herbicide to respectively lessen the shock and prevent counter fungal diseases from becoming an even greater problem At approximately 60 days after planting a copper spray is applied in support of the effort to control fungal diseases
At the first flowering stage a mixture of mono-ammonium phosphate (MAP) and diammonium phosphate (DAP) specialist fertiliser products for soya beans are applied at 4 to 5kgha with a fungicide and some brown sugar (as agglutinant) Later the cultivars with a long growth period receive another fungicide application As soon as flowering time is over they administer a last application of Roundupreg to ensure that all weeds are eliminated
Fungal diseases are becoming a major problem and especially Sclerotinia can harm the yield Roos says his experience is that soya beans that are planted earlier are not as severely plagued by these diseases Producers traditionally plant soya beans after having planted maize When using underground drip irrigation fungal diseases are not such a big problem
Drip irrigationThey installed the underground drip irrigation around a decade ago The dripper lines are installed approximately 350mm below the ground 200mm apart and the drippers in the lines 20mm apart Every dripper has the capacity to apply two litres of water per hour
The advantages of this irrigation system entailbull That it uses 50 to 75 less water than
a centre pivotbull Irrigation can be done with precisionbull It keeps fungal diseases at baybull At least one less fungicide
application is necessarybull Fertiliser can be placed at the root
zone
The system also has its challenges among others that the depth of cultivations over the pipes should be very accurate The system must be installed in square or rectangular blocks
and the dripper lines can be 180 to 200m in length at most to maintain the pressure for even application Continuous maintenance is necessary and the system must be cleaned regularly to prevent the drippers from clogging
Mice can also present a huge challenge They would typically dig the pipes open and bite holes into them For this reason they have erected owl cages near the fields and planted poles with bails on the contours where owls can rest while they are hunting Only environmentally friendly methods are used to control the mice
The system is initially more expensive to install than a centre pivot but in the long run (after about six years) it becomes the cheaper of the two
Although soya beans can hold their own as a crop in a farming enterprise its use as a rotation crop has numerous advantages The nitrogen (N) deposits that soya beans leave behind in the soil can lead to maize yields of at least 2tha higher than where soya beans were not planted the previous year
Soya crop residues are also manna for sheep The animals ingest the residues and pick up the kernels behind the harvester The additional protein
during mating ensures a higher lambing percentage and in certain years there are between 10 and 15 more twins
All soya beans are processed on farm into soya oil soya oilcake containing 46 protein and 6 energy and full-fat soya oilcake with 37 protein and approximately 20 energy Initially the oil was pressed to use as fuel on the farm but due to the huge increase in plant oil prices it is no longer a viable option The oilcake is used in the cattle and sheep feedlots on the farm Roos says they add value to everything that leaves the farm
For more information contact Gerrit Roos on 083 635 3873 or email
glroosgmailcom
The soya seeds are planted fairly deep to ensure good germination This is a soya bean field on Leeubank near Wonderfontein in Mpumalanga
This year the combine harvester indicated a yield of just over 8tha on certain parts of the soya bean fields
16 June 2017
17June 2017
Promosie-artikel
Phb 65A70Phb 65A70 is rsquon nuwe sonneblomkultivar met hoeuml opbrengspotensiaal Dit is rsquon medium tot lang groeiseisoenkultivar en is geskik vir droeumllandverbouing in die westelike produksiegebiede Die kultivar se dae tot 50 blom is 65
Dit presteer op alle grondtipes in 091m-rye en het rsquon plantdatum van Oktober tot Desember Die beste plantpopulasie is 35 000 tot 40 000 plante per hektaar
Belangrike agronomiese eienskappe (uitstekend = 9 swak = 1)Sekelnek 6Opbrengspotensiaal 7Planthoogte 175Saadvulling 7Eenvormigheid 6Proteiumlenkonsentrasie 176Oliekonsentrasie 428Staanvermoeuml 8Kruistipe 3W
Siekteverdraagsaamheid (verdraagsaam 9 ndash 7 matig 6 ndash 4 vatbaar 3 ndash 1)Bruinroes 7Witroes 6Wortel- en stamsiekte 7
Kies Phb 65A70 vir goeiebull Opbrengste en aanpasbaarheidbull Groeiperiode en eenvormigheidbull Goeie siektebestandheidbull Weerstand teen omvalbull Bestand teen voeumllskadebull Pas in enige kultivarpakket
P65LL02P65LL02 is rsquon sonneblomkultivar wat groot opbrengsverbetering toon van konsepgenetika Dit is rsquon medium tot lang groeiseisoen-kultivar en is geskik vir droeumllandverbouing in die westelike produksiegebiede Die kultivar se dae tot 50 blom is 68
Dit presteer op alle grondtipes in 091 tot 15m-rye en het rsquon plantdatum van Oktober tot Desember Die beste plantpopulasie is 35 000 tot 40 000 plante per hektaar
Belangrike agronomiese eienskappe (uitstekend = 9 swak = 1)Sekelnek 6Opbrengspotensiaal 8Planthoogte 175Saadvulling 7Eenvormigheid 7Staanvermoeuml 8Kruistipe 3W
Siekteverdraagsaamheid (verdraagsaam 9 ndash 7 matig 6 ndash 4 vatbaar 3 ndash 1)Bruinroes 7Witroes 7Wortel- en stamsiekte 7
Kies P65LL02 vir goeiebull Opbrengste en aanpasbaarheidbull Groeiperiode en eenvormigheidbull Goeie siektebestandheidbull Weerstand teen omvalbull Bestand teen voeumllskadebull Pas in enige kultivarpakket
Twee medium tot lang groeiseisoen-sonneblomkultivars is vir droeumllandverbouing in die westelike produksiegebiede beskikbaar
Vir meer inligting kontak Philip Fourie landboukundige van DuPont Pioneer by 082 909 3262 of philipfouriepioneercom
18 June 2017
By Andrew Bennett Asia Africa technology lead Monsanto
Technologies in agriculture and in particular in maize production continue to advance in leaps and bounds It is interesting to examine
how many disease- insect- and herbicide-tolerant transgenic traits are registered globally across all agricultural crops According to the Centre for Environmental Risk Assessment (CERA) database some 206 traits are available in these categories (wwwcera-gmcorg)
Nine virus-resistant traits are available across carnations papaya plum squash common beans and potatoes There are 77 insect-resistant traits in maize cotton tomato potato soya beans and rice There are 120 herbicide-resistant traits spread across cotton maize carnations canola soya bean creeping bent grass tobacco common bean flax sugar beet lucerne rice chicory and wheat
Insect resistance and herbicide tolerance clearly dominate and crops of focus are essentially maize (with 48 insect-resistant traits and 52 herbicide-tolerant traits) soya bean (with three insect-
resistant traits and 17 herbicide-tolerant traits) and cotton (with 20 insect-resistant traits and 20 herbicide-tolerant traits)
Some 92 million hectares of soya beans (83 of all soya beans) 24 million hectares of cotton (75 of all cotton) and 54 million hectares of maize (29 of all maize) are planted with traited varieties and hybrids globally
DroughtGardtradeDroughtGardtrade is one of the new traits that holds much promise especially in maize production regions in South Africa where rainfall is often low uncertain or erratic The trait in DroughtGardtrade is the worldrsquos first drought-tolerant biotechnology trait for maize and is designed to help maize plants better tolerate drought stress and minimise the risk of failure in drought conditions and was commercialised in the United States (US) in 2013
Yield gain in hybrids with DroughtGardtrade occurs because it slows down the growth of maize hybrids experiencing moisture stresses such that existing soil moisture is saved for the
critical period of flowering resulting in less kernel abortion thus protecting the expected yield
Nutritional quality traitsThis is a more complicated segment to quantify but traits such as low lignin (to enhance digestibility in livestock) in lucerne non-browning apples pro-vitamin A and iron-enriched bananas vitamins A- B9- and C-enriched maize high-content omega 3 fatty acid-enriched canola beta carotene-enriched rice and low-saturatedhigh-oleic fatty acid-enriched soya beans are but a few that are receiving attention currently (Agnegraves E Ricroch amp Marie-Ceacutecile Heacutenard-Damave 2016)
CRISPR ndash a new gene-editing toolClustered regularly interspaced short palindromic repeats (CRISPR) is a naturally occurring ancient defence mechanism found in a wide range of bacteria which evolved to protect them against viral infections As far as back the 1980s scientists observed a strange pattern in certain bacterial genomes One deoxyribonucleic acid (DNA) sequence would be repeated continuously with unique sequences in between the repeats
Scientists realised the unique sequences in between the repeats matched the DNA of viruses ndash specifically viruses that prey on bacteria CRISPR form part of the bacteriarsquos immune system keeping parts of the viral DNA of dangerous viruses so it can recognise and defend against such viruses the next time they attack A second part of the defence mechanism is a set of enzymes called CRISPR-associated (Cas) proteins which can precisely snip DNA and remove the DNA of invading viruses
Using this precise gene-editing technology CRISPR could one day
Disease insect and herbicide tolerance
Canola is one of the GM crops that boasts herbicide-resistant traits
19June 2017
hold the cure to a number of genetic diseases although human genetic manipulation is still far from becoming routine Furthermore CRISPR could become a major force in ecology and conservation especially when paired with other molecular biology tools It could for example be used to introduce genes that slowly kill off mosquitos spreading malaria or genes that slow down the growth of invasive species such as weeds
Since its 2013 demonstration as a genome-editing tool in Arabidopsis and tobacco mdash two widely used laboratory plants ndash CRISPR has been tested on crops including wheat rice soya beans potatoes sorghum oranges and tomatoes It is expected to be used widely in agricultural research applications including boosting crop resistance to pests and reducing the toll of livestock diseases
Precision agriculture and big dataPrecision farming is not a new concept and could be defined as ldquousing every acre within its capability and treating it
according to its needsrdquo according to Hugh Hammond Bennett widely considered to be the father of soil and water conservation who was born in 1881 and died in 1961
Precision agriculture could also be defined as ldquoa management system that is information- and technology-based is site specific and uses one or more of the following sources of data soils crops nutrients pests moisture or yield for optimum profitability sustainability and protection of the environmentrdquo
Nonetheless with the increasing availability of data and tools to generate and interpret data rapidly and cost-effectively it has become possible to do more in-depth analyses of increasingly smaller parts of a farmerrsquos field The
digitisation of this data has made precision farming possible
With todayrsquos equipment
that can collect information digitally
farmers have at their disposal huge quantities
of data The ability to use data from multiple sources to
build a lsquodigitalrsquo picture of a production field enables todayrsquos growers to make quality decisions regarding hybrid choices planting densities fertilisation requirements etc
Furthermore they are able to do this for smaller and increasingly more precise areas in their fields This leads to optimisation of productivity in each one of a growerrsquos fields which ultimately leads to a high level of sustainability and productivity Development in maize genetics and production systems also plays an important role in providing greater food security
Some 92 million hectares of soya beans (83 of all soya beans) are planted with traited varieties and
hybrids globally
20 June 2017
By P Lombard Prof A Agenbag and J McDermott
of canola seedlings
Drought resistance in crops is a crucial aspect of crop farming in the Western Cape This article focuses on canolarsquos reaction to drought and certain observations made in this regard in 2016
Water consumption during the growth stages of canola (plant to harvest) shows a linear increase and reaches a peak during flowering after which it decreases rapidly until physiological ripeness occurs (Canola Council of Canada 2008)
Canola is most sensitive to moisture stress during the flowering stage and the early to mid-pod filling stage (Wan et al 2009) However it is also sensitive to drought during germination Sufficient soil moisture during germination is necessary for rapid and even germination ndash hence a higher germination and establishment percentage It also results in the establishment of stronger seedlings
However it has long been known that canola plants can handle water shortages well during drought conditions if these shortages occur after emergence but only in the early stages of development This statement could hardly be better proven than during 2016 in the Swartland and parts of the Overberg
Extreme droughtAt Langgewens a total of 378mm rain fell during the last ten days of April Similar rainfall occurred in large parts of the Swartland and Overberg and was utilised to establish canola During the next 39 days however it was extremely dry across the entire area and the rainfall figures at Langgewens for example was only 66mm
Canola seedlings across the entire area were subjected to severe moisture stress during 2016 shortly after emergence Since the remainder of the 2016 rainy season was normal and temperatures were fairly low in September (Figures 1 2 3 and 4) the canola miraculously recovered due to its drought resistance and the highest canola yields per hectare recorded in history were attained in the Western Cape despite the initial dry period
Figure 1 Monthly and annual rainfall at Langgewens for 2016 and long term
Figure 2 Monthly temperatures at Langgewens for 2016 and long term
Figure 3 Monthly minimum and maximum temperatures at Tygerhoek for 2016 and long term
Figure 4 Monthly temperatures at Tygerhoek for 2016 and long term
In the Swartland no cultivar trials could previously yield more than 29tha Two cultivar trials and a fungus treatment trial yielded an average of 3tha and more (Langgewens 37tha) in 2016 The drought resistance of canola is further illustrated by Photographs 1 and 2Total 2016
Total 2016
Long term monthly
Long term monthly
Monthly 2016
Monthly 2016
Long term total
Long term total
Tota
l Ma
rch
- S
ep
t (m
m)
Tota
l Ma
rch
- S
ep
t (m
m)
Jan Feb Mar Apr May Jun Jul Aug SepMax 2016 Min 2016 Longt Max Longt Min
Jan Feb Mar Apr May Jun Jul Aug
Max 2016 Min 2016
Longt Max Longt Min
Jan Feb Mar Apr May Jun Jul Aug Sep
Jan Feb Mar Apr May Jun Jul Aug Sep
21June 2017
Photograph 1 A canola field in the Eendekuil area during the drought and after good follow-up rains in 2016
June
August
June
July
August
Photograph 2 A canola field in the Swartland during the drought and after good follow-up rains in 2016 (Photographs supplied by J McDermott E Burger and Philip van Schalkwyk)
Photographs 1 and 2 illustrate the drought stress the plants were subjected to after germination in 2016 Although the plants were initially subjected to drought stress the physiological development did not cease This is a crucial aspect which caused clethodim damage in 2016 because applications were only possible around 46 days after the follow-up rain fell
Sclerotinia effect on yieldPictures in Photograph 1 were taken on the farm De Brug in the Swartland The cultivar was 44Y89 and the seed yield of the field was 198tha Sclerotinia was a problem on this field and possibly reduced the yield potential
The pictures in Photograph 2 were taken in the Eendekuil area on a field where minimum tillage was applied The field was planted with the cultivar Hyola 555 and the average yield on this farm (Baviaanskloof ) was 185tha The cultivar trial on the same field was planted on 10 May and established well (Photograph 3) The average yield of the cultivar trial was 203tha and the yield of Hyola 555 was 2tha
Photograph 3 Eendekuil cultivar trial in 2016
The canola plants in the Eendekuil trial took an average of 96 days until the flowering stage (50 of the plants with one flower) It took approximately 14 days longer than usual but is attributed to the above-average temperatures in May June and July 2016 All trials flowered later in 2016 which is characteristic of a hot growth season The result of a longer growth season is that the crop forms more biomass which increases yield potential if sufficient moisture and low temperatures are available late in the season such as in 2016
ConclusionCanola can recover from a dry period shortly after establishment It is however vital that canola is not planted in soil without sufficient moisture as 20mm is regarded as effective rainfall (Arnon 1992) The result of insufficient soil moisture is weak establishment and uneven germination which are both detrimental to the harvesting process and yield
The recommended planting date for canola in the Western Cape is from the beginning of April in the eastern parts of the Southern Cape until the end of April in the Swartland provided that sufficient soil moisture is available
2 June
12 August
1 November
For more information contact the Directorate Plant Sciences Western Cape Department of Agriculture on 021 808 5321 or email pietlelsenburgcom Sponsored by the Protein Research Foundation Visit the
website wwwproteinresearchnet for newsletters and pamphlets
22 June 2017
By Prof Charlie Reinhardt
Biological control (biocontrol for short) when applied in the broadest sense involves the use of animals insects fungi or other microbes
to feed upon parasitise or otherwise interfere with a targeted pest species Classical biocontrol targets a non-native pest (eg alien invasive weeds) for control by one or more species of biocontrol agents (eg insects pathogens) from the pestrsquos native range
Classical biocontrol remains the most popular and successful approach for controlling alien invasive weed species the world over Fundamental to the success of biocontrol as a practice is the 100 host specificity required of biocontrol agents ndash an attribute that is supposed to protect against harmful effects on non-target species and ecosystems
More readily acceptedFollowing several decades of intensive use of synthetic chemicals (herbicides insecticides fungicides bactericides) for crop protection and other purposes Harris (1991) points to public demand for a shift from chemical to biological control However several dilemmas are associated
with a change in emphasis from chemical to biocontrol ndash obstacles in the way of greater adoption of biocontrol range from scientific legal political to practical issues
Therefore biocontrol is essentially subjected to the same scrutiny as synthetic chemicals except for the fact that the public in particular consumers of farm products in developed countries tends to more readily accept the employment of biocontrol practices for food production than they do chemical control practices
Regulatory authorities responsible for the registration of agrochemical products for pesticides in particular are often perceived by the agrochemical industry to be guided more by public perception (politics) than by the real risks (exposure toxicity) associated with the use of agrochemicals Literature abounds with comparisons of the pros and cons of biocontrol compared to chemical control When the authors are proponents of biocontrol their approach is often to promote biocontrol as an adversarial or alternative measure in relation to the use of synthetic chemicals
Undoubtedly some supporters of the use of pesticides make the same
mistake but fortunately the proponents of integrated pest management (IPM) in which all control practices are considered on an equal footing still hold sway
In order to avoid the quagmire of divergent and conflicting opinions the present discussion will focus solely on salient facts as they apply in practice with reference to examples of weed biocontrol in South Africa
Apparent benefitsThe benefits of successful control of an alien invasive weed in for instance the Kruger National Park through the release of this speciesrsquo natural enemies should be manifestly apparent Safeguards against non-target harmful effects are vested in the standard procedures that candidate biocontrol agents imported from their natural habitats undergo exhaustive screening for efficacy and 100 host specificity under quarantine conditions
The rationale for achieving success with biocontrol in natural environments is that non-target plant species which dominate the plant community ie indigenous vegetation will take the invader(s) place Similar logic applies to the control of aquatic alien invasive weeds (eg water lettuce water hyacinth Kariba weed) except that in this case the taking over by indigenous aquatic plants does not apply due to the dearth of free-floating aquatic plants in South Africa
In contrast in crop production systems the crop or desirable species is usually a single one that occurs at fixed density whereas the weed spectrum on
23June 2017
a particular area can be diverse in terms of weed types and levels of infestation In such a setting selective biocontrol of one or even two weed species will hardly make a difference since individuals of other species already present will simply take their place
Economies of scaleHowever in cases where a particularly noxious (herbicide-resistant poisonous extremely competitive etc) weed occurs in crop production it might be practical to employ biocontrol The basic problem with this kind of biocontrol is that economies of scale will dictate whether the product will have a large enough and sustainable market in order to warrant research and development (RampD) and registration costs
One bioherbicide product that was discontinued in South Africa for the reason that the market was deemed too small is Hakattackreg which was a formulation containing spores of the fungus Colletotrichum gloeosporioides used for controlling the alien invader tree of Australian origin silky or needle hakea (Hakea sericea) (Morris 1982 1983) The same fungus is registered in the United States (US) under the tradename LockDownreg (Delta Farm Press 2009) for the control of a rare legume weed species Aeschynomene virginica (common names curly indigo northern jointvetch) which is particularly hard to control in rice with
synthetic herbicides Other fungus-based bioherbicide products registered in the US (year 2000) were the products Smolderreg and DeVinereg for the control of the parasitic weed dodder (Cuscuta sp)
I am unaware of any bioherbicide product currently registered in South Africa for weed control In this country there are several success stories on the biocontrol of alien invader weeds occurring in natural (eg conservation areas) or seminatural (eg game farms) habitats
According to Moran et al (2011) certain target weeds that have been successfully controlled biologically include the following species several cactus species (eg the prickly pear Opuntia ficus-indica) St Johnrsquos wort (Hypericum perforatum) sesbania (Sesbania punicea) the aquatic weeds
Strategies for management of herbicide-resistant weeds are well documented and frequently communicated on the South African Herbicide Resistance
Initiative (SAHRI) website wwwupaczasahri Prof Reinhardt is project leader at SAHRI which is based in the Department of Plant Production and Soil Science
University of Pretoria (UP) dean of Villa Academy extraordinary professor of weed science UP and extraordinary professor at the Department of Agronomy
Stellenbosch University (SU) References are available from the author on 083 442 3427 or email drcharliereinhardtgmailcom
water fern (Azolla filiculoides) kariba weed (Salvinia molesta) and water lettuce (Pistia stratiotes)
Continuing researchIt should be borne in mind that eradication of these weeds has not been achieved nor was it the aim Consequently they can occasionally be problematic in certain locations Research by the Agricultural Research Council ndash Plant Protection Research Institute on these and many other targets for classical biocontrol is underway and continuous
Cover crop or so-called lsquosmother croprsquo practices provide a type of non-classical biocontrol of weeds By means of this practice certain attributes of the crop are employed for weed suppression and cover cropping is a key component of conservation agriculture
Live crops and residual (dead) plant material are used to withhold light from weed seeds thereby preventing or reducing germination Biochemical compounds called allelochemicals which are released from live and dead crop plants in the phenomenon of allelopathy inhibit the germination growth and development of weeds
Although it is generally accepted that the use of synthetic herbicides will remain the mainstay of weed control programmes long into the future it is imperative that we consider the alternative weed management options available An integrated approach to weed management is crucial for sustainable crop production In all instances all the available weed control options deserve consideration in designing a weed management strategy that offers the best chance of contributing to maximise farmer profits and the achievement of optimal yields of safe and sufficient food
Certain target weeds that have been successfully controlled biologically include the prickly pear St Johnrsquos wort and water lettuce
Classical biocontrol remains the
most popular and successful approach for controlling alien
invasive weed species the world over
24 June 2017
By P Lombard J Strauss and C Cummings Directorate of Plant Sciences Western Cape Department of Agriculture
(Source Canola Focus March 2017)
damage in canola
Evidence shows that canola is an ideal crop for crop rotation systems in the Western Cape Not only does it offer the benefit of good returns but it also provides
the opportunity to control weeds with chemical agents from different groups There are several herbicide options that can contribute to ryegrass control Clethodim (cyclohexanedione) is also widely used under various brands for grass control in canola and especially on conventional cultivars
Moisture strainDuring the past 2016 season clethodim damage occurred in various fields varying from mild to severe It was not only limited to certain farms and occurred across the Swartland and Southern Cape The reason for the damage is mostly attributed to the dry month of May 2016
It is important to understand canolarsquos development since its seedlings do not cease development during periods of drought Image 1 shows seedlings that underwent severe moisture strain five weeks after sowing The plants had already formed five leaves The problem is that herbicides do not function properly under such conditions As a result producers sprayed only clethodim for grass control after the rain in June
Seedlings subjected to drought stress five weeks after planting with severe clethodim damage visible on the insert
Visible symptomsStudies in Australia found that a late spray application and a double dose of clethodim during bud formation resulted in a yield loss of up to 55 (Zerner and Wheeler 2013) The damage was between 0 and 15 at the recommended dosage Up until the eight-leaf stage no damage occurred when using the recommended dose although damage did occur at the higher dosage However there were differences among cultivars with some exhibiting no yield loss ndash a good reason to maintain the recommended dosage
The symptoms are best visible when the plants flower From a distance the field appears to be less yellow in the areas where the damage occurred (Image 2) The flowers are deformed and in severe cases it appeared as if the flower buds had melted (Image 3)
Severely deformed flowers
Plants were less yellow where damage occurred
Poor pod formation occurred with severe damage With less severe damage (plants in the middle of Image 4) the pods were deformed Image 4 depicts plants exhibiting conditions from zero to severe damage They were derived from the same field as the plants in Image 1 Although the field did not exhibit any signs of damage damage occurred where the sprayer turned and a consequently higher dosage was applied
Plants with slight clethodim damage flowered over a longer period (Later on plants continued flowering to compensate) For most seasons the climate in the Western Cape is not favourable for pod development late in the growing season
Recommendations madeThe recommended sowing date of canola in the Western Cape province is from the beginning of April in the eastern parts of the Southern Cape to the end of April in the Swartland ndash provided that there is sufficient soil moisture End of April and May is also a time when dry periods can occur and when weed control cannot be applied effectively
Plants with no slight and severe clethodim damage from left to right
25June 2017
It is crucial that clethodim is sprayed onto canola after the two-leaf stage but before flower bud formation (Note that at this stage no flower buds are visible) Effective pre-emergence weed control is essential since the risk of clethodim spraying can become too high if late application becomes necessary Any late application can be defined as the stage where the canola plant has already developed too far This stage differs among cultivars
Do not under any circumstances consider spraying clethodim and a fungicide together in a tank mixture The result will be severe burn When considering an early fungus spray (for instance for blackleg or white leafspot) first spray the fungicide and follow up seven to ten days later with the herbicide It is important to adhere to the recommendations and dosage provided on the label at all times
For more information contact Piet Lombard at pietlelsenburgcom
26 June 2017Oilseeds f ocus
By Izak Hofmeyr
puts sustainability in the spotlight
The theme of the 57th congress of the Fertiliser Association of Southern Africa (Fertasa) in Durban was sustainability with speakers focusing on
sustainability of the fertiliser industry water soil climate and agriculture
Over the last few decades high fertiliser prices have led to the establishment of many more fertiliser plants which started putting pressure on prices as they came into production Therefore although there is a steady and constant growth in demand for fertilisers internationally the supply remains larger than demand something which constantly keeps pressure on
prices noted Adriaan de Lange Fertasa chairmain in his chairmanrsquos report
Balancing prioritiesRegarding the sustainability of the fertiliser industry in Africa Paul Makepeace from the African Fertiliser and Agribusiness Partnership based in Kenya pointed out that the need for distribution and supply of plant-available nutrients from areas of high concentration to those in need of food production and consumption will continue as populations grow urbanisation continues incomes grow and the understanding of science grows ldquoFertilisers as we know themrdquo he said ldquoare likely to be around for a long time to comerdquo
The main demand on water resources in South Africa will be from a growing population and demand for food coupled with the multiplier effect of climate change on the increased scarcity of water There will therefore be a pressing need to balance priorities Agriculture remains crucial in terms of its ability to provide food and income to the rural poor This was the opinion of Dr Sylvester Mpandeli research manager of the Water Research Commission with regard to the sustainability of water usage
Prof Isaiah Wakindiki of the University of Venda painted a bleak picture of what
awaits humankind if the soil runs out ndash and it is fast in the process ldquoWe have about 60 years of topsoil left Soil loss is up to 40 times the rate of formationrdquo he warned
Prof Roland Schulze of the Centre for Water Resources Research at the University of KwaZulu-Natal suggested that we should recognise that climate change and the associated issues are real and that coping strategies would have to be implemented urgently
In the closing session Prof Herman van Schalkwyk CEO of Suidwes Landbou discussed the sustainability of agriculture For countries to reach long-term sustainability he pointed out they would have to become competitive
Awards receivedFertasa awarded several members in various categories Jane McPherson manager of the Grain SA Farmer Development Programme received the Training and Mentor Award in Small-scale Farming for 2017 while Schalk Grobbelaar fertiliser consultant of Louis Trichardt was nominated for the Silver Medal Extension Award
The Gold Medal was awarded posthumously to Prof Willem Foumllscher previously of the University of Pretoria His two grandsons Willem Foumllscher and Henk van Wyk received the award on his behalf Outgoing Fertasa CEO Adam Mostert was awarded honorary membership
Adam Mostert right receiving honorary membership of Fertasa from Adriaan de Lange
Adriaan de Lange chairman of Fertasa with Jane McPherson of Grain SA
Arrie Janse van Vuuren Willem Foumllscher Henk van Wyk and Adriaan de Lange
27June 2017
MARKETS
By Dr Dirk Strydom
supported by Chinese demand
The global oilseeds supply is expected to reach a record level of 5464 million tons for the seven main oilseeds This high supply means that the production surplus will be at 111 million tons The world supply of soya beans is ample and global production is estimated to
reach a new high of 3454 million tons 336 million tons higher than last yearrsquos production levels It is expected that production in the northern hemisphere will reach 161 million tons and the southern hemisphere 184 million tons
Global soya marketsThe estimated soya bean crops in the United States (US) and Brazil have reached levels of 1172 million tons and 1115 million tons respectively Global traders expect that the Argentine crop will likely be below potential at around 55 million tons mainly due to detrimental weather conditions during the season
The global trade in soya beans is increasing with China being the main destination More than 80 of the anticipated growth in world soya bean imports is destined for that country In the last decade growth in terms of imports to China has created additional demand and supported prices The largest contributor to this increase in demand within the Asian nation is the substitution of dried distillerrsquos grain with solubles (DDGS) with soya meal
Global soya bean crushing is estimated to reach levels of approximately 2824 million tons which is roughly 109 million tons higher than the previous yearrsquos figures In the medium term the rest of the worldrsquos focus will mainly be on US soya bean with unfavourable weather conditions in certain states possibly slowing down the planting progress
Table 1 World supply of the seven main oilseeds (Source Oil world)
Global supply and demand (million tons)
Forecast 201617 201516 201415
Opening stocks 931 972 775
Production 5464 5019 5217
Total supplies 6395 5991 5992
Disappearance 5289 506 502
Ending stocks 1106 931 972
Stocksusage () 209 184 194
Table 2 World soya bean supply and demand (Source Oil world)
Global supply and demand (million tons)
Forecast 201617 201516 201415
Opening stocks 8023 8398 6276
Production 3454 31175 320
N hemisphere 16138 14509 14689
S hemisphere 18402 16666 17311
Total supply 42563 39573 38276
Crush (SeptAug) 2824 27154 25733
Other use 4609 4396 4145
Ending stocks 9714 8023 8398
Stocksusage () 296 254 281
EURussia and UkraineCanadaUSChinaIndiaArgentinaBrazilParaguay
Sunflower figuresThe world sunflower seed production forecast is estimated at a record of 483 million tons This is 53 million tons higher than the previous high in the 201516 season International traders expected the global crushing of sunflower seed to decline to 188 million tons for the period from April to September
The crushing of sunflower seed in Black Sea countries is projected to slow down somewhat over the next six months but it is likely to be offset by more crushing in other regions such as Argentina the European Union (EU) and on the local front The world sunflower seed balance is expected to be significantly less in the second half of this season than at the same time last year as a result of the consumption from Ukraine and Russia
28 June 2017
World production is however still expected to exceed demand during this season Assuming normal weather conditions this year a large crop may be seen in Black Sea countries as sunflower seed is one of the most viable crops for producers in the Ukraine and Russia with its low production cost and adaptability to harsh weather conditions
Table 3 World sunflower seed supply and demand (Source Oil world)
Global supply and demand (million tons)
Forecast 201617 201516 201415
Opening stocks 327 307 294
Production 4828 4285 4133
Total supplies 5155 4592 4427
Ending stocks 357 327 307
Stocksusage () 74 77 75
Canola pricesCanola prices have appreciated due to weather and crop concerns in the EU and Canada which account for approximately 63 of the world supply In Canada the canola futures appreciated more sharply than prices in the EU Snowfall and wet fields are currently delaying the spring plantings of canola which could make it challenging to complete this yearrsquos large plant intentions
In Canada the leading canola producer it is expected that production will be at 194 million tons which is higher than the previous year However with higher export and crushing figures the ending stock is 700 000 tons lower than the previous season
Groundnut cropThe Argentine groundnut crop is likely to reach record levels of one million tons (shelled) this season provided that major losses due to excessive rainfall or frost can be avoided during completion of the harvesting in the short term The Argentine crop for the year is expected to increase by 20 to 25 compared to the previous production season
Table 4 Canola supply and demand (Source Oil world)
Canadian supply and demand (million tons)
Forecast 201617 201516 201415
Opening stocks 202 254 059
Production 194 1838 1641
Imports 008 01 008
Exports 1065 103 914
Crushing 916 832 736
Other use 039 038 026
Ending stocks 13 202 254
Global prices of the majority of oilseeds decreased by small margins on a year-on-year (yy) basis However groundnut prices increased by 42 which was mainly due to production constraints International traders are of the view that global groundnut prices are likely to come under some pressure in the near future if the expected crop size is confirmed If expected production realises in the northern hemisphere and vegetable oil production recovers it can be expected that oilseed prices will be under pressure
Table 5 Main oilseed products (US$ton and Rton) (Sources Grain SA and Oil world)
Product Apr 2017 Apr 2016 change
Soya beans (US CIF Rotterdam) 388 396 -2
Soya beans (Brazil) 388 396 -2
Sunflower seed (EU) 400 427 -6
Groundnuts (US 4050) 1 650 1 163 42
Palm oil (Malaysia) 681 707 -4
Soya bean oil (US) 737 758 -3
Sunflower oil (Arg) 720 771 -7
Soya meal (Arg) 352 355 -1
Fishmeal (Peru) 1 250 1 408 -11
Randdollar 1344 146 -8
Sunflower seed 4 610 6 455 -29
Derived sunflower 5 233 6 126 -15
Soya beans 4 945 5 734 -14
Derived soya beans 5 749 6 317 -9
Soil canola 5 543 6 030 -8
The world supply of soya beans is ample and global production is estimated to reach a new high of 3454 million tons
Local productionThe local production of soya beans is also favourable with the National Crop Estimates Committee (NCEC) expecting a production of 1 233 130 million tons of soya beans (742 000 ndash 2016) 853 470 tons of sunflower seed (755 000 ndash 2016) and 86 600 tons of groundnuts (17 680 ndash 2016)
In the NCECrsquos first intentions-to-plant report for winter grains the canola plantings for the season are expected to be 3221 more than last yearrsquos The estimated area for the season is 90 000ha while last yearrsquos area planted was 68 075ha The prices on the local market followed normal seasonal trends with prices under pressure at harvesting time due to larger supplies within the market
The soya bean crop fared better than most expectations which led to increased pressure on prices This means that prices move below derived prices increasing the crushing margins of processors (Figures 1 and 2) Soya beans should therefore remain under pressure in the short term and will most probably recover in the second half of the year closer to derived prices
29June 2017
MARKETS
Figure 1 Safex soya bean prices and the derived soya bean price (Source Grain SA)
Figure 2 Crushing margins of soya beans (Source Grain SA)
Soya bean prices are sensitive to the exchange rate in times of a balanced supply and demand However in terms of a macroeconomic environment the exchange rate is extremely volatile and sensitive to political instability From Figure 3 it is clear that soya bean prices follow the exchange rate with the exception of times when supply and demand are not in balance In the previous season this was due to limited available supply and in 2017 it is as a result of large supplies
Over the next six months it will be crucial to monitor the exchange rate and use the high volatile movements to the advantage of buyers and sellers depending on the direction of such movement
Figure 3 Soya bean price and rand-dollar exchange rate (Source Grain SA)
30 June 2017
31June 2017
South Africarsquos soya bean production has been a great success story over the past decade with a ramp-up in production reaching one million
tons Over the same period the countryrsquos soya bean crushing capacity has also seen a significant increase
For this reason soya bean crushers and commodity traders have expressed significant interest in the ability to trade the entire crush complex This crush complex includes local soya beans and relies on the Chicago Mercantile Exchange (CME) meal and oil as a proxy for global prices
Key componentThe complex a key component in the soya bean market is what is known as the lsquocrushrsquo spread Soya beans are processed into two products namely soya bean meal (SBM) and soya bean oil The crush spread is the difference between the combined value of the products and the value of the soya beans
It is a measurement of the profit margin for soya bean processors The soya bean processor will be interested in the crush spread as part of its hedging strategy and the speculator will look at the crush spread for trading opportunities
Although we have the individual contracts listed the challenge today is the initial margin efficiency to wrap all three
as a single product in the desired ratios For instance when crushing 100 tons of beans this will result in 74 tons of meal and 17 tons of oil with 9 tons as wastage
Separate contractTherefore a crush spread can be calculated as the price of SBM (Rt) multiplied by 74 plus the price of soya bean oil (Rt) multiplied by 17
Figure 1 Soya bean crush margin
The Johannesburg Stock Exchange (JSE) soya bean crush complex is an easily accessible hedging tool for the crusher while traders are also able to participate in the movements of this crush complex This product is not unique to the JSE as globally the CME Group offers it not only for their local soya beans but also links it with the Dalian Commodity Exchange in China
less the price of soya beans (Rt) The current clearing solution does not allow for this and therefore it necessitated the introduction of a separate contract that will trade the complex wrapped up as a single product
Figure 1 represents a time series of the crush margin supporting the urgency for a price risk management tool such as a futures contract
Advertorial
For more information visit the JSE website wwwjsecoza
32 June 2017
By Dr Charl van der Merwe Tiger Brands
The
Between 20 000 and 25 000 tons of peanuts were used annually for the manufacturing of peanut butter between 2006 and 2013 in South Africa This volume includes splits and 80100s
The peanut butter segment is an important one in the groundnut market of the country The prospects for this market segment are promising
Socio-economic factorsThe demand for a product is influenced by the financial status of the consumer and the socio-economic factors in the country The percentage of citizens who passed matric increased by 27 between 2010 and 2014 (Figure 1) The number of people with a monthly income of between R5 000 and R20 000 increased from 44 to 63 (Figure 2) between 2001 and 2015
Figure 1 Education levels
Figure 2 Household income (Source BFAP)
The increase in household income and the decrease in unemployment from 41 in 2001 to 24 in 2015 equate to an increase in the number of people in the middle to upper classes as indicated in Figure 3
Figure 3 LSM class mobility
The upper middle and upper classes have steadily grown between 2005 and 2010 according to the information presented in Figure 3 This is significant because according to the information in Table 1 peanut butter forms part of the diet of the middle and upper classes
market in South Africa
33June 2017
MARKETS
Table 1 Food choices (Source BFAP)
Population Poorest 30 Lower middle class Upper middle class Wealthiest 20
Animal protein foods (continued)
EggsCanned pilchardsPolonyFreshfrozen
chilled fishPork
Beef sausagePolony
Canned pilchardsPolonyMutton and lamb
Mutton and lambCanned pilchardsPolonyFreshfrozen
chilled fish
EggsPorkFreshfrozen
chilled fishPolonyViennasCanned pilchards
Fats oils
Edible oils (eg cooking oils)MargarinePeanut butter
Edible oils (eg cooking oils)Margarine
Edible oils (eg cooking oils)Margarine
Edible oils (eg cooking oils)MargarinePeanut butter
Edible oils (eg cooking oils)MargarinePeanut butterButter
Peanut butter is included in the diets of the upper middle and upper classes An increase in the number of people in the middle class can equate to an increase in peanut butter consumption Local peanut butter consumption over a twelve-year period is indicated in Figure 4
Figure 4 Peanut butter consumption (Source SAGIS)
Health and marketsMore than 25 000 tons of groundnuts were used for the manufacturing of peanut butter in 2013 It is projected that more than 30 000 tons of groundnuts will be used for peanut butter in 2017
Groundnut consumption is supported by the socio-economic factors as discussed above and by a focus on a healthy diet According to Menrsquos Health magazine groundnuts are a good source of protein The vitamin E helps to protect cells and the magnesium (Mg) in groundnuts assists with metabolic activity
Peanut butter consumption is also influenced by wheat consumption Local wheat consumption is indicated in Figure 5 The information indicates a steady growth in wheat consumption due to the growing middle class in South Africa
Figure 5 Wheat consumption
Groundnut consumption is also influenced by the price of groundnuts and normal levels of supply and demand will influence the price Price movements since 2000 are indicated in Figure 6
Figure 6 Groundnut prices
International groundnut prices increased during 2016 as a result of the rain during harvesting in Argentina and the higher demand from China The possibility exists that prices will decrease if the demand and supply situation returns to normal levels Lower prices can support the demand for groundnuts and peanut butter
ConclusionGrowth in the middle and upper classes in South Africa and higher household incomes over the past few years have boosted the peanut butter market in the country The peanut market has grown by approximately 14 since 2010 Socio-economic factors and the international prices will influence growth in the peanut market in the future
The percentage of local groundnuts used for peanut butter manufacturing increased from 41 between 2011 and 2013 to 51 between 2014 and 2016 compared to 60 in the United States (US)
34 June 2017
By Jolanda Nortjeacute manager of the Southern African Grain Laboratory
201516 production season
The deep root system of a sunflower enables the plant to perform better than other crops during dry seasons making sunflower seed production
very suitable amid South African climatic conditions As a result sunflower seed production exceeded soya bean production this season for the first time since the 201011 season
The final commercial sunflower crop figure of the 201516 season is 755 000 tons This figure represents an increase of almost 14 (92 000 tons) compared to the 201415 season The major sunflower-producing provinces Free State and North West contributed 92 of the total crop (Figure 1)
Figure 1 Provincial contribution to the production of the 201516 sunflower crop
The area utilised for sunflower production increased by almost 25 from 576 000ha in the previous season to 718 500ha this season Due to the drought conditions production only increased by 14 as the yield decreased from 115 to 105tha
Annual improvementsGlobal sunflower seed production for the 201516 season stands at
42 465 million tons with the Ukraine and Russia contributing 51 to this total The forecast for the 201617 season is 47 397 million tons according to figures published in the 2016 US Sunflower Crop Quality Report compiled by the United States (US) National Sunflower Association (NSA)
According to the Bureau for Food and Agricultural Policyrsquos BFAP Baseline Agricultural Outlook 2016ndash2025 the sunflower area is expected to decline in 2017 to around 2015 levels assuming normal rainfall patterns before stabilising at approximately 560 000ha by 2025 An average production increase of 14 per annum is expected to result
in a production of 820 000 tons by 2025 driven by average annual improvements in yield of close to 3 in the same year
During the 2016 harvesting season a representative sample of each delivery of sunflower at the various silos was taken according to the prescribed grading regulations A total of 176 composite
sunflower samples representing the different production regions were analysed for quality and the results published in the fourth annual South African Sunflower Crop Quality Report 201516 Season
Of the 176 samples analysed for the purpose of this survey 78 (138) were graded as Grade FH1 and 38 of the samples were downgraded to class other
sunflower seed (COSF) The percentage of FH1 samples showed a decrease compared to the 86 and 82 of the 201415 and 201314 seasons respectively This decreasing trend could not be attributed to any single grading deviation
Collective deviationsThe majority of samples were downgraded as a result of the percentage of either the screenings foreign matter or the collective deviations or a combination of these exceeding the maximum permissible deviations of 4 and 6 respectively The presence of poisonous seeds (Datura sp) exceeding the maximum permissible number one per 1 000g was also a contributing factor
Gauteng represented by two samples reported the highest weighted average percentage screenings of 360 followed by the North West (N = 80) and Free State (N = 80) with 280 and 201 respectively Limpopo (seven samples) reported the lowest average percentage screenings of 109 The weighted national average was 234 compared to the 205 of the previous season The maximum permissible deviation according to the grading regulations is 4
Sclerotia of Sclerotinia sclerotiorum was observed on 18 of the samples (10) compared to the nine and eleven of the previous two seasons respectively Fourteen of these samples originated in the North West and three in the Free State The highest percentage (180) was present on a sample from Mpumalanga This is however still well below the maximum allowable level of 4 Weighted average levels ranged from 0 for Gauteng and Limpopo 003 in the Free State and 004 in North West
35June 2017
to 026 in Mpumalanga The national average of 004 was equal to the previous season
Foreign matterThe highest weighted percentage foreign matter (177) was reported for the seven samples from Mpumalanga The Free State and North West averaged 161 and 123 respectively The lowest average percentage was found in Limpopo namely 101 The national average of 141 was the highest of the last three seasons
Test weight providing a measure of the bulk density of grain and oilseeds does not form part of the grading regulations for sunflower seed in South Africa An approximation of the test weight of these crop samples was done by determining the g1ℓ filling weight of each sample using the Kern 222 apparatus
The test weight was then extrapolated by means of formulas obtained from the lsquoTest Weight Conversion Chart for Sunflower Seed Oilrsquo of the Canadian Grain Commission (CGC) The weighted average this season was 425kghℓ Individual values ranged from 350 to 481kghℓ Last seasonrsquos values ranged from 34 to 505kghℓ and averaged 442kghℓ (Figure 2)
Figure 2 Comparison of the test weight per province over four seasons
Nutritional componentThe nutritional component analyses of crude protein crude fat crude fibre and ash are reported as a percentage (g100g) on an as-received or as-is basis The weighted average crude protein content this season was 1793 almost one percent higher than the previous season and the highest average value since the start of this survey in 201213 The North West had the highest weighted average crude protein content of 1824 and Mpumalanga the lowest with 1714 The Free Statersquos crude protein content averaged 1777 (Figure 3)
Figure 3 Average crude protein content per season
The weighted average crude fat percentage of 382 was the lowest of the last four seasons and 15 lower than the previous season Gauteng had the highest weighted average crude fat content of 403 The lowest average fat content was observed in the Free State (380) North West and Mpumalanga averaged 382 and 388 respectively (Figure 4)
Figure 4 Average crude fat content per season
The weighted average percentage crude fibre increased slightly from 20 in the previous season to 203 this season Average values varied between 192 in Gauteng to 209 in Mpumalanga The weighted average ash content is slightly higher with 259 than last seasonrsquos 255 The provincial averages ranged from 249 in Mpumalanga to 269 in Limpopo
The results of this survey are available on the Southern African Grain Laboratory NPC (SAGL) website wwwsaglcoza Hard copy reports are distributed to directly affected groups and interested parties The report is also available for
download in PDF format With gratitude to the Oil and Protein Seeds Development Trust (OPDT) for financial support of these annual surveys and to the members of Agbiz Grain for providing the crop samples
June 2017
and its effect on broiler performance
Growth depression effects on poultry due to antinutritional factors present in soya beans have been well documented for over 50
years Trypsin inhibitors are the primary antinutritional factor in soya bean meal (SBM) which is a globulin-type protein Trypsin inhibitors inhibit the conversion of zymogens to active proteases of trypsin and chymotrypsin In addition to their detrimental effects on proteolytic action trypsin inhibitors dramatically affect the size of the pancreases and amount of trypsinogen produced
The requirement to heat treat soya beans has been understood for nearly a century The pH rise was adopted as the common method of determining adequate heat A change in pH above 02 pH units is considered underheated Animal feed manufacturers in Brazil use 03 pH units as the upper limit of SBM processing
It has been established that a pH unit change of zero is not an adequate measure of overprocessing but that if it is between zero and 005 the SBM
has been adequately processed This is a level considered ideal and should be strived toward It must be noted that heat treatment of SBM only destroys those antinutritive factors that are heat-labile
High correlation expectedAs recently as 2001 standardised tests were established for trypsin inhibitor analyses The correlation between trypsin inhibitors and urease activity is expected to be high Urease activity is still the methodology of choice for measuring the acceptable estimation of the trypsin inhibitor content in SBM
It is unclear what the optimum residual concentration of trypsin inhibitors should be Work published as far back as 1991 shows a linear response between bird performance body weight gain (BWG) and feed conversion and levels of trypsin inhibitor activity (TIA) (mgg) in soya bean in the ration There still seems to be considerable uncertainty regarding these levels As recently as 2014 Pacheco et al showed optimal bird performances at TIA of 67mgg rather than the lowest value of 36 which was also fed as a treatment
Response of performance to TIA did not appear linear in this trial Ruiz (2012) observed that if feed contained high levels of SBM with a TIA of more than 35mgg or urease activity above 006 pH units rapid feed passage outbreaks could occur (observation not a trial) detrimentally affecting bird performance
Genetic potentialTIA tests are expensive and time-consuming with a repeatability standard deviation of 027 (Sueiro 2015) Considering the correlation found by Belalcazar and Otalora (2012) as quoted by Riaz (2012) (00738x ndash 01224 with an R2 = 09748) it has been proposed that the urease index should continue to be used in conjunction with TIA ndash a more rapid test for underprocessing but a figure as low as zero is not an indication of overprocessing
The genetic potential of the modern-day broiler has resulted in broilers being slaughtered at an earlier age each year also resulting in a continuous improvement in gain-to-feed ratio Diets have become more nutrient-dense since high-density diets not only achieve maximum performance but have become synonymous with optimal performance
Globally soya bean processing has improved with the consequential improvement in SBM quality The measurement of SBM quality is extremely complex and starts with proximate analysis higher protein levels obviously still being the major economic value driver of SBM The ratio of amino acids to protein also differs depending on the source of SBM ndash the main influence on this being the composition of the soya bean used in processing
Digestibility of nutrients is critical
36
By Dr Erhard Briedenhann
37June 2017
and affected by many criteria other than heat-sensitive antinutritive factors such as levels of lectins mannans raffinose and stachyose Lower fibre levels have therefore been required
The nutrient profile differs among the various sources of SBM Higher protein not only increases the quantity of essential amino acids but there is solid evidence that amino acid digestibility improves as the protein content of the SBM increases
Conclusion SBM quality is determined by many other factors other than TIA level The global industry still considers urease index as the appropriate measurement for underprocessing Levels have been driven down to below 01 urease index to ensure sufficient processing SBM with a higher TIA may have significantly higher digestible amino acid levels irrespective of TIA value
Testing methodsThe international standard method for the determination of soya products is ISO 14902 when compared to the American Association of Cereal Chemists (AACC) standard AACC 22-4001 as modified by Hamerstrand in 1981 and expressed as mg of inhibited trypsin per gram of sample TIA values according to ISO 14902 result in significantly lower values than the previously mentioned method These methods are not directly comparable (Sueiro et al 2015) The particle size of samples during analysis was found critical
Conclusion The testing method needs to be clearly stated and understood when TIA levels vs performance is quoted Particle size is of critical importance
OverprocessingTIA unfortunately does not measure overprocessing of SBM and is something which is of definite concern There is compelling evidence that overprocessed SBM would lead to reduced broiler performance (Wiltafsky 2013) The lower the TIA the higher is the risk of overprocessing and reduced amino acid availability
Conclusion TIA is not a measure of overprocessing but has become a key criterion with regard to SBM quality Lower TIA is a higher risk of overprocessing
Broiler performance and TIAIn studies conducted on SBM of various origins it has been found that United States (US) SBM with a TIUmg of 252 (urease 008) versus that of Argentina with a TIUmg of 198 (urease 0007) exhibited a better crude protein (CP) digestibility and an 88 lysine (Lys) and 88 methionine (Met) digestibility versus Argentina at 86 digestibility
The lower potassium hydroxide (KOH) level of 78 for Argentine SBM tended to overprocessing which could have resulted in lower amino acid digestibility (Ravindran 2014) US SBM consistently resulted in better broiler performance due to its protein quality despite higher TIA levels
Gous (2016) replaced Argentine (Molinos) SBM with a TIA of 128 with South African SBM with a TIA of 304 Although not statistically significant the South African SBM had a numerically better feed conversion of 005 and superior BWG of 45g at slaughter for Ross broilers
This could be ascribed to the higher protein content and quality of our local SBM and clearly corroborates what has been experienced commercially that high-quality South African SBM not only performs as well as Argentine-imported meal in broiler rations but can demand a premium due to its higher digestible nutrient content
Conclusion There is no trial work in the literature which demonstrates that a difference of one TIA mgg will have any significant effect on broiler performance at low levels of TIA Such trial work still needs to be done Contrary to this significant difference in broiler performance it has been found between SBMs with the same TIA levels
Particle sizeIn the US Pacheco (2014) concluded that when using expeller SBM there was not a linear response in bird performance to TIA A curvilinear response for both feed conversion and BWG was experienced The particle size of the SBM had a greater effect on bird performance than the TIA
Conclusion Particle size of SBM could have as significant an effect on broiler performance as TIA Broiler performance response to TIA is not necessarily linear
EnzymesThere is compelling evidence that the use of various enzymes ndash mainly protease pectinase and phytase ndash could positively influence the negative effects of antinutritive factors in SBM further complicating the correlation between TIA and bird performance (Stefanello 2012) (Aureli 2013) and (Faruk 2013)
Conclusion Enzyme inclusion and their combinations could have a significant effect on TIA level which will affect broiler performance
UniformityUniformity of SBM is considered globally and by the local feed industry to be an important criterion At the beginning of soya bean volume crushing in South Africa it presented a challenge due to the restricted continuity of processing This aspect has been improved considerably so much so that major end users of certain locally produced material are starting to report subtle differences between Argentine- and South African-produced SBM uniformity
Conclusion High-quality South African SBM if produced in large consistent volumes can obtain the uniformity experienced by Argentine suppliers
TIA in full-fat and expeller SBMIt can be confirmed that laboratories testing TIA are very comfortable to analyse for TIA in soya bean full-fat soya expeller SBM and solvent-extracted SBM TIA tends to be higher in full-fat and expeller SBM but they can confirm this is not due to the TIA test but the fact that trypsin inhibitor content of these raw materials is generally higher than solvent-extracted SBM due to the fact that they have not been heat-treated to the extent that solvent-extracted SBMs are Despite this they can still deliver good broiler performance to the same extent that moderately higher TIA SBMs can
Conclusion TIA analysis can be performed equally well on soya beans full-fat soya expeller oilcake and solvent-extracted meal TIA limits are applicable to all soya bean protein sources
38 June 2017
By Jolanda Nortjeacute manager of the Southern African Grain Laboratory
The extreme drought conditions experienced this past season has led to an approximately 27 (184 500ha) decline in the
local soya bean production area Yield was also negatively impacted with the average national yield decreasing from 156tha in 201415 to 147tha The result was an almost 31 (328 000 tons) decline in the commercial soya bean crop compared to the previous season
Sunflower production surpassed soya bean production for the first time since the 201011 season The major soya bean producing provinces contributing 75 of the total crop were Mpumalanga and the Free State Numbers reflected in Figure 1 were obtained from the National Crop Estimates Committee (NCEC)
Figure 1 Tonnage and area utilised for soya bean production since the 200506 season
201516 season
According to the Bureau for Food and Agricultural Policyrsquos BFAP Baseline Agricultural Outlook 2016ndash2025 a high demand for soya beans arising from expanded crushing capacity is expected to cause a sharp increase in area utilised for soya bean production in 2017
Assuming normal rainfall patterns production is expected to recover to more than 900 000 tons this year
Global productionAn estimated 31281 million tons of soya beans were produced during the 201516 season according to the World Agricultural Supply and Demand Estimates (WASDE) report (WASDE-563) The United States
contributed 34 Brazil 31 and Argentina 18 to this total Global soya bean production during the 201617 season is projected to be 34079 million tons Soya beans account for more than half of the worldrsquos oilseed production
During the 2016 harvesting season
a representative sample of each delivery of soya beans at the various silos was taken according to the prescribed grading regulations A total of 143 composite soya bean samples representing the different production regions were analysed for quality and the results published in the
fifth annual South African Soya Bean Crop Quality Report 201516 Season
Quality results summaryOf the 143 samples analysed for the purpose of this survey 89 (127) were graded as Grade SB1 and 16 of the samples were downgraded to class other soya beans (COSB) During the previous two seasons 87 (201415) and 88 (201314) of the samples were graded SB1
The majority of the samples were downgraded as a result of either the presence of poisonous seeds exceeding the maximum permissible number of either one per 1 000g or seven per 1 000g or as a result of the percentage other grain andor foreign matter exceeding the maximum permissible deviations of 05 and 5 respectively
According to the South African soya bean grading regulations the determination of the percentage wet pods in a consignment must be performed based on a working sample of at least 10kg of soya beans from a representative sample of the consignment Due to practical considerations the samples received at the Southern African Grain Laboratory (SAGL) NPC from the grain storage companies are typically plusmn5kg
Pods were found in twelve of the 143
39June 2017
samples graded All of these pods were green upon receival at the SAGL but not wet according to the definition The percentage of these pods in the samples ranged from 005 to 050 based on a working sample size of at least 200g
The national average percentage of foreign matter has increased over the last five seasons reaching its highest level this season increasing from 034 in 201112 to 082 during the last season and to 085 now The samples from North West had the highest weighted average percentage namely 162 The percentage in the rest of the samples ranged from 026 in the Northern Cape to 091 in Mpumalanga
Presence of sclerotiaThe number of samples containing sclerotia increased from 20 in the previous season to 36 this season The highest percentages of sclerotia observed (076 and 064) were on samples from Mpumalanga followed by a sample from North West with 060 These percentages are however still well below the maximum permissible level of 4 The national weighted average percentage this season was 004 compared to the 001 of the previous season
North West (eight samples) reported the highest weighted average percentage soya beans and parts of soya beans above the 18mm slotted sieve which pass through the 475mm round-hole sieve namely 156 and the sample from the Northern Cape the lowest at 040 Mpumalanga with the highest number of samples (91) reported an average of 090 The Free State averaged 103 (23 samples) The national weighted average percentage decreased from 181 the previous season to 092 this season
The lowest weighted average percentage of defective soya beans on the 475mm sieve were observed on the samples from Mpumalanga namely 146 The Northern Cape reported the highest percentage of 494 followed by North West and KwaZulu-Natal with
399 and 334 respectively The national weighted average increased slightly from 195 last season to 202 this season
The national weighted average percentage soiled soya beans of 206 is the highest since this survey started in the 201112 season when the average was 160 The average was 077 last season Average weighted percentages per province ranged from 128 in the Northern Cape to 446 in Limpopo
Soiled soya beansAlthough the number of samples containing soiled soya beans as well as the average percentage soiled soya beans per sample increased significantly none of the percentages were above the maximum permissible deviation of 10 according to the grading regulations Last season one sample
Figure 2 Average crude protein content per province over five seasons
from Mpumalanga exceeded this limit
Test weight providing a measure of the bulk density of grain and oilseeds does not form part of the grading regulations for soya beans in South Africa An approximation of the test weight of these crop
samples was done by determining the g1ℓ filling weight of each sample using the Kern 222 apparatus
The test weight was then extrapolated by means of formulas obtained from the lsquoTest Weight Conversion Chart for Soya Beanrsquo of the Canadian Grain Commission (CGC) The weighted average this season was 709kghℓ Individual values ranged from 649 to 73kghℓ Last seasonrsquos values ranged from 633 to 782kghℓ and also averaged 709kghℓ
Soya beans are the main oilseed crop produced in South Africa driven mainly by the demand for protein feed in the animal feed industry The nutritional component analyses namely crude protein crude fat crude fibre and ash are reported on a dry basis (DB) (moisture-free basis)
The weighted average crude protein content this season was 4022 slightly higher than the 3989 and 3984 of the previous two seasons The sample from the Northern Cape had the highest weighted average crude protein content of 4156 while Gauteng reported the lowest average that of 3886 (Figure 2)
An estimated 95 of the area planted to soya beans in South Africa consists of genetically
modified crops
Soya beans are the main oilseed crop produced in South Africa driven mainly by the demand for protein feed in the animal feed industry
40 June 2017
Crude fat percentageThe weighted average crude fat percentage of 194 compared very well with the 193 in 201415 The samples from KwaZulu-Natal had the highest weighted average crude fat content of 206 The lowest average fat content was observed in Mpumalanga with 191 (Figure 3)
Figure 3 Average crude fat content per province over five seasons
The weighted average percentage crude fibre varied from 62 in Limpopo to 76 in the Northern Cape The national
GM-crops These soya beans have tolerance
to herbicides (chemical
products used to destroy weeds but
not the crop plants) Worldwide GM soya
beans occupy 80 of the area planted to this crop
Fifteen (10) of the crop samples were screened by means of the EnviroLogix QuickComb Kit for bulk soya beans to quantitatively determine the presence of the CP4 EPSPS trait (Roundup Readyreg) All the samples tested positive
The results of this survey are available on the SAGL website wwwsaglcoza Hard copy reports are distributed to directly affected groups and interested parties The report is also available for download in PDF format With gratitude to the Oil and Protein Seeds Development Trust (OPDT) for financial support of these annual surveys and to the members of Agbiz Grain for providing the crop samples
weighted average of 73 was higher this season than in the previous one when the average was 64 A small variation of only 005 is observed with regard to the national weighted average ash content
over the five seasons that this survey has been conducted This season the average ash content was 461 Samples from the Northern Cape and Limpopo tend to show higher ash contents over seasons
The majority of soya beans producedgrown in
South Africa are genetically modified (GM) An estimated 95 of the area planted to soya beans in South Africa consists of
- OFC - Oilseed June 2017
- IFC - Oilseed June 2017
- p1-5 Intro pages -Oilseed June 2017
- p6-17 Agronomy - Oilseed June 2017
- p18-21 Seeds - Oilseed June 2017
- p22-25 Chemicals amp fertiliser - Oilseed June 2017
- p26 General - Oilseed June 2017
- p27-33 Markets -Oilseed June 2017
- p34 - 40 Quality - Oilseed June 2017
- IBC - Oilseed Dec 2016
- OBC - Oilseed June 2017
-
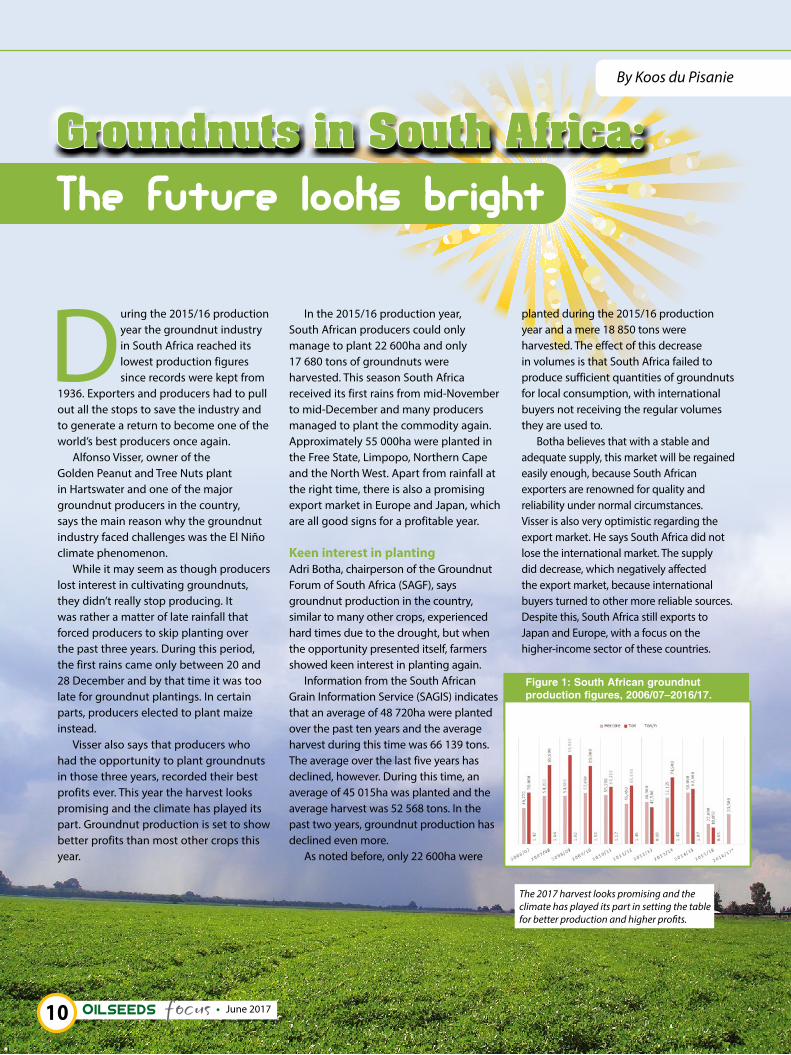
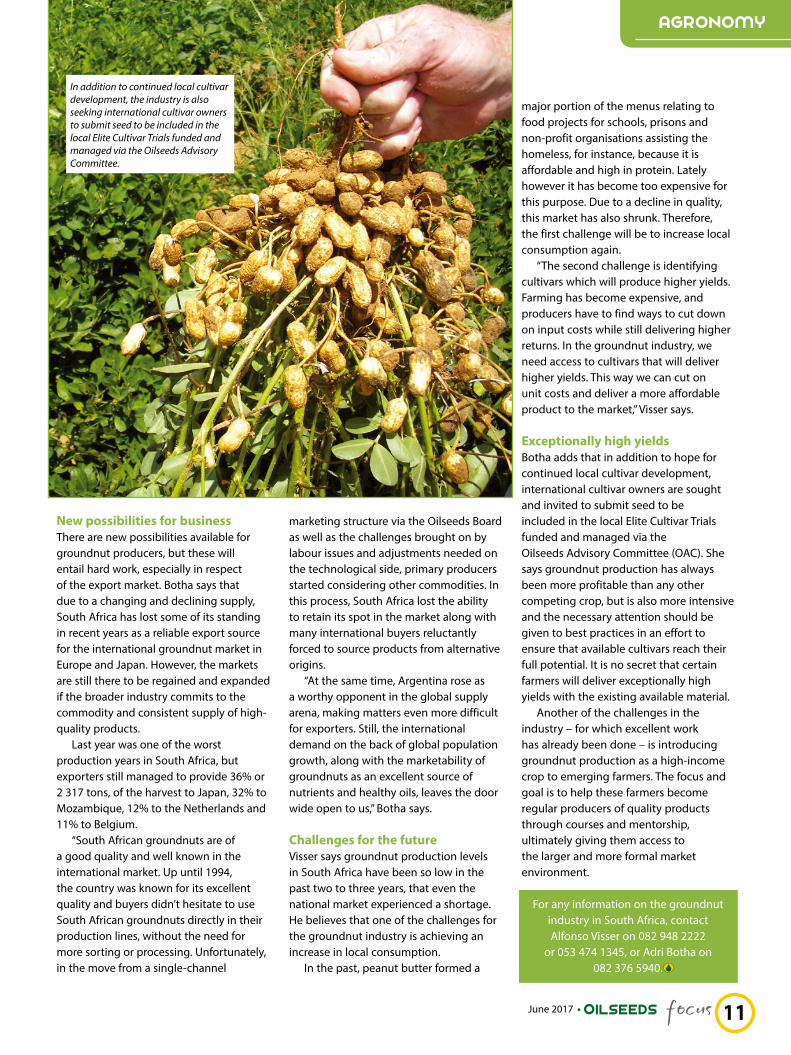
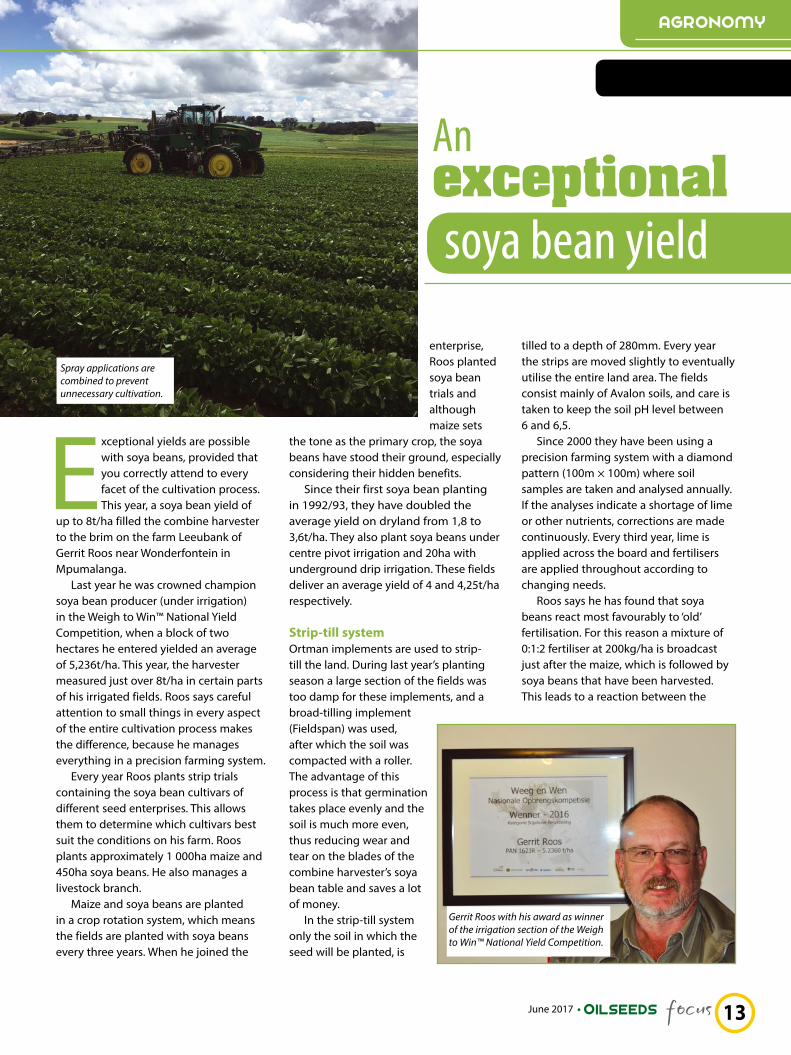
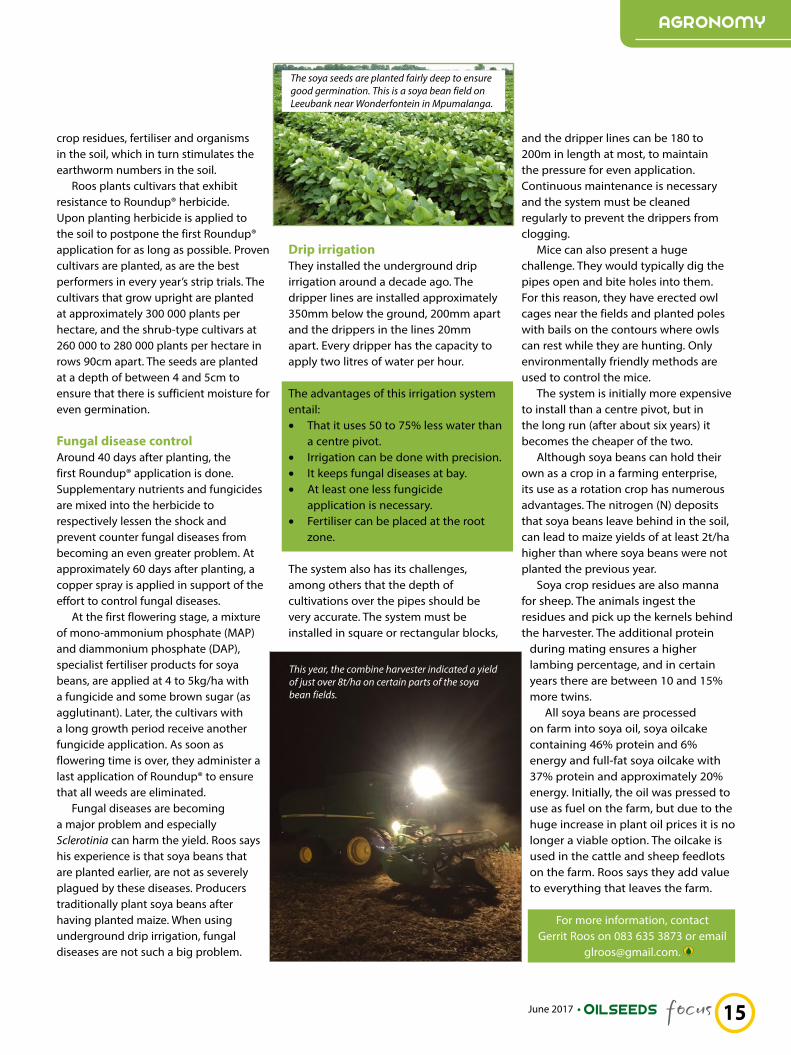
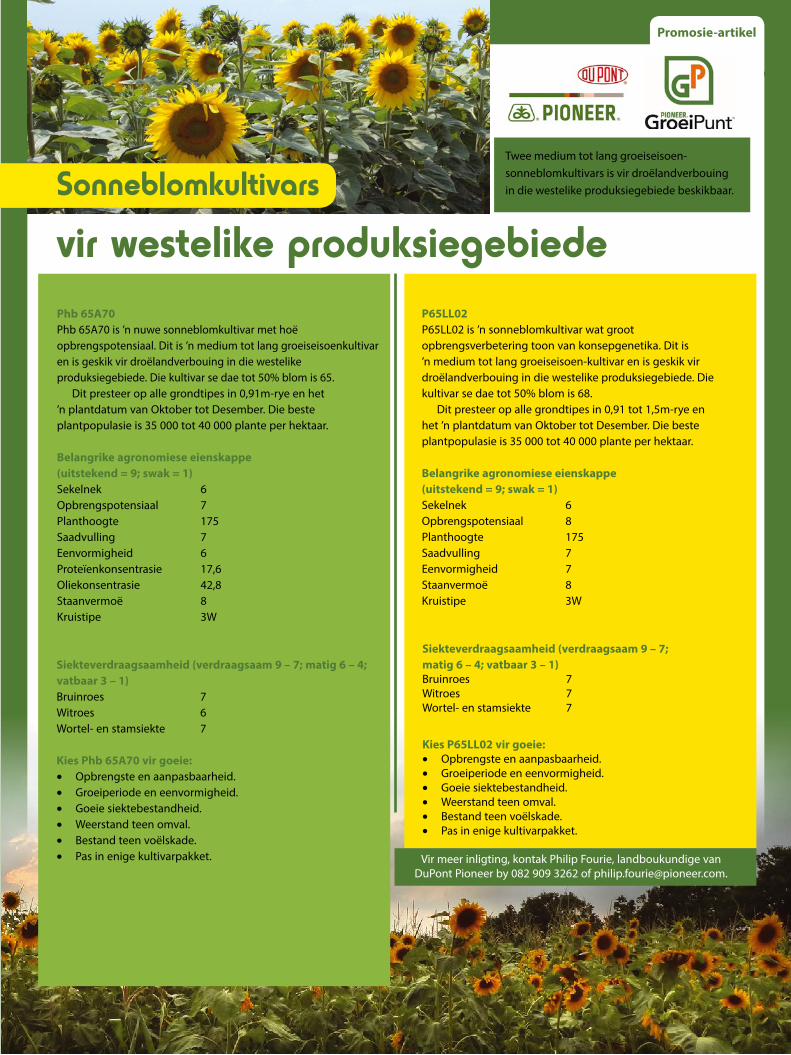
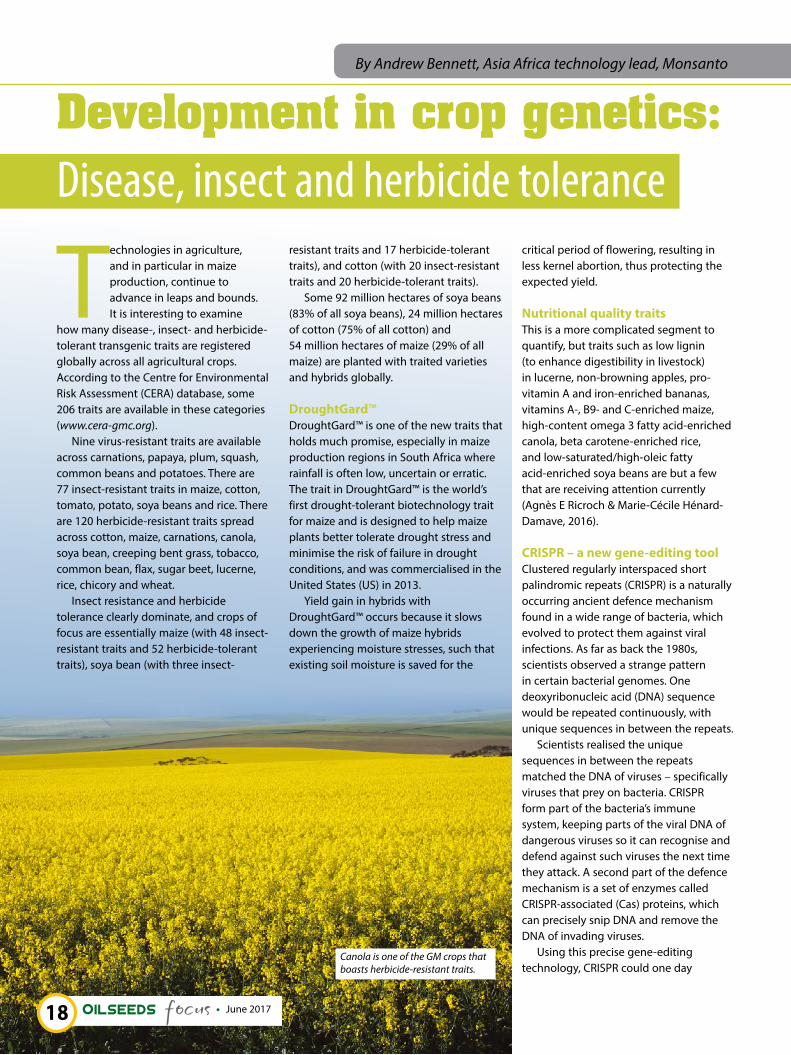
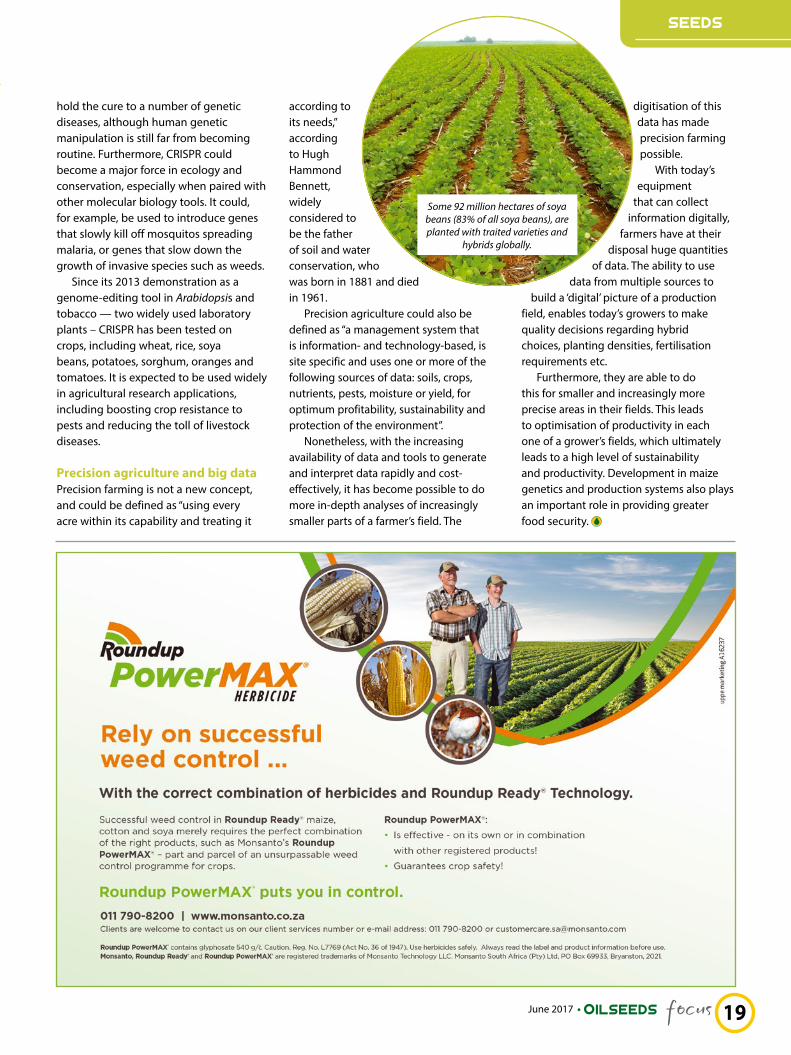
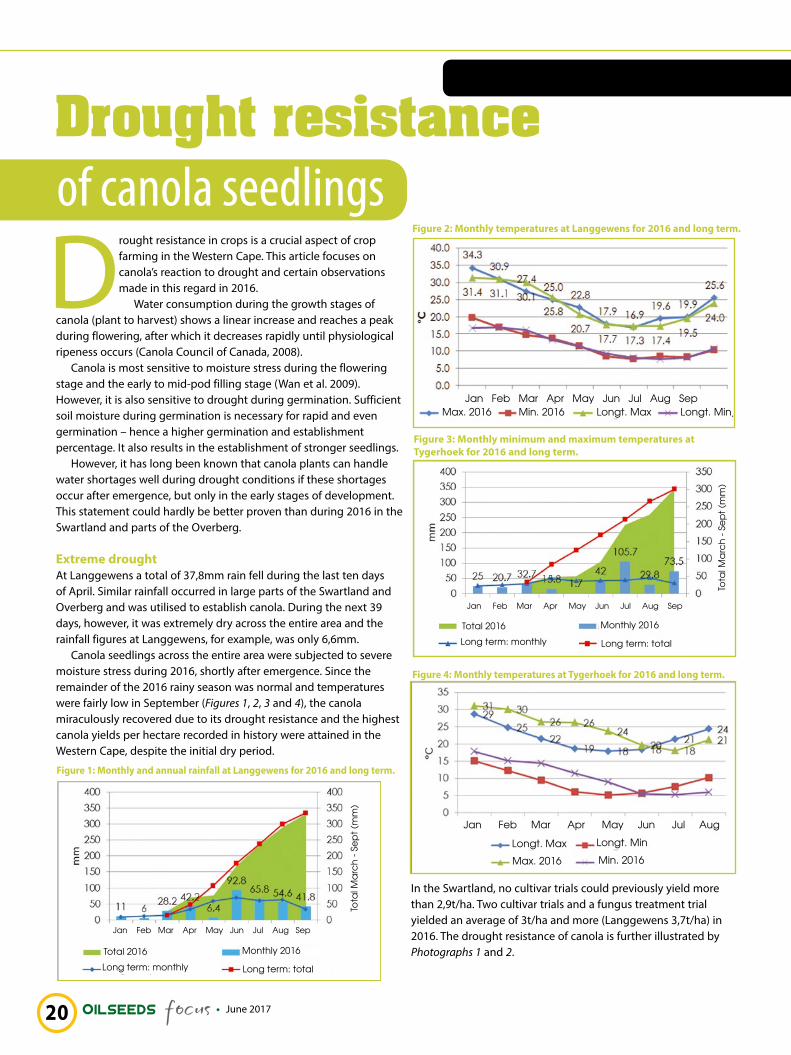
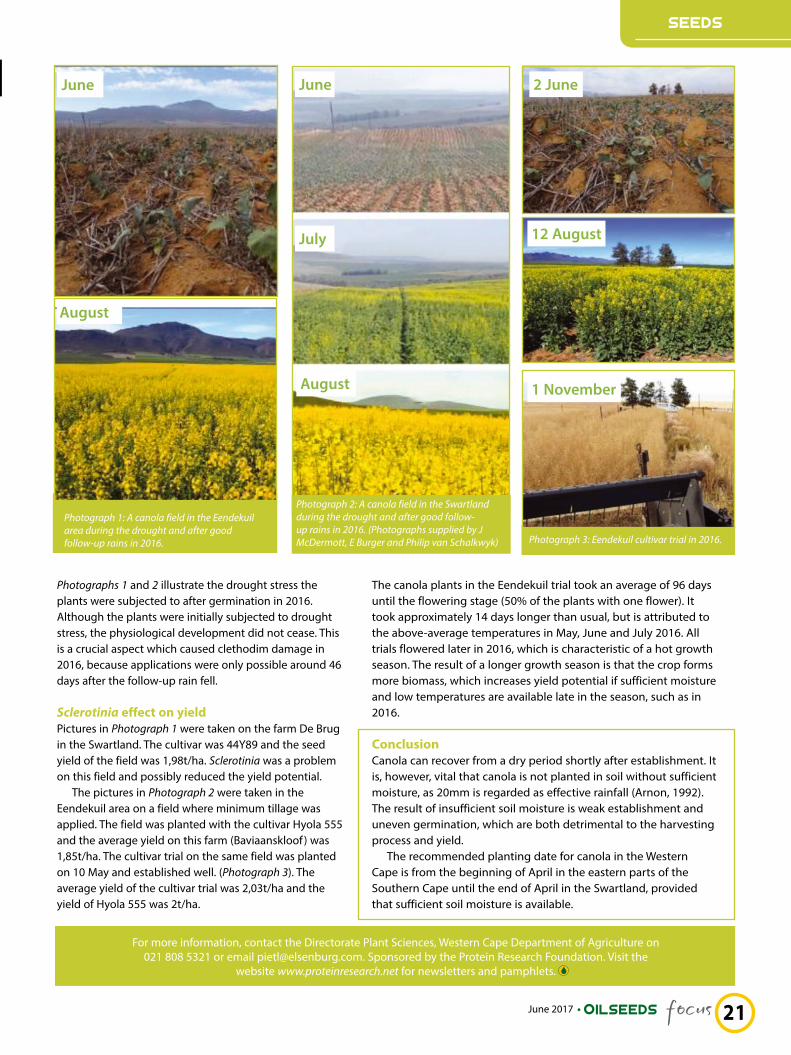
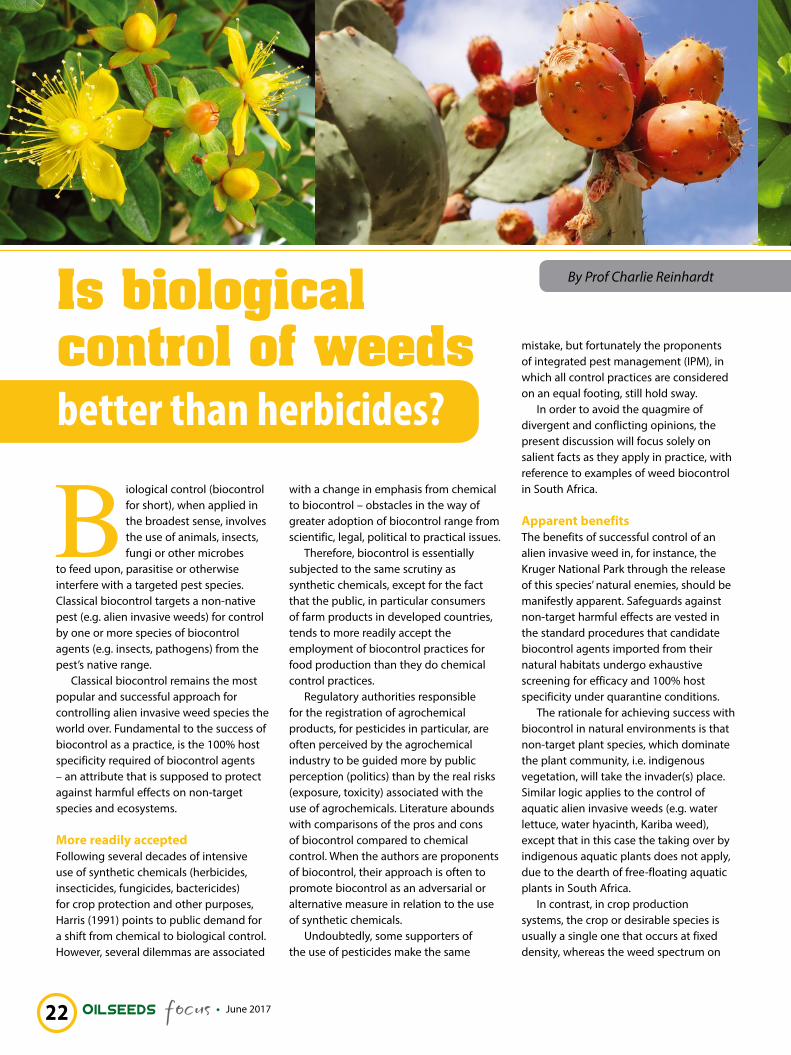
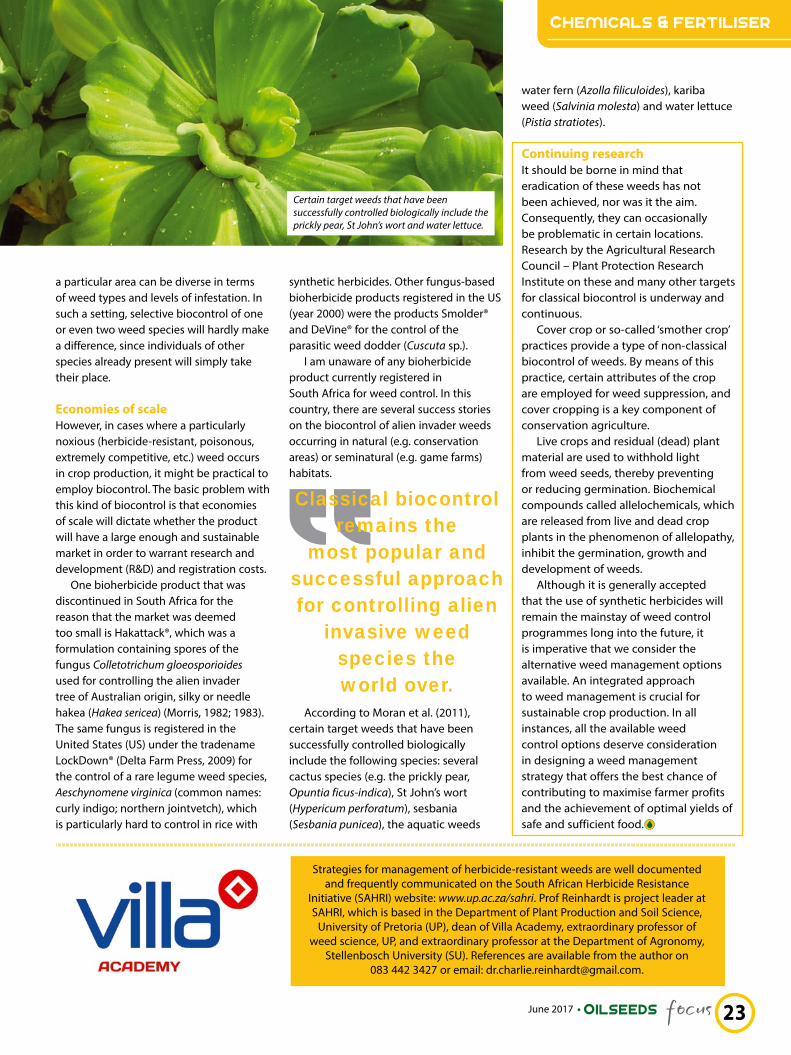
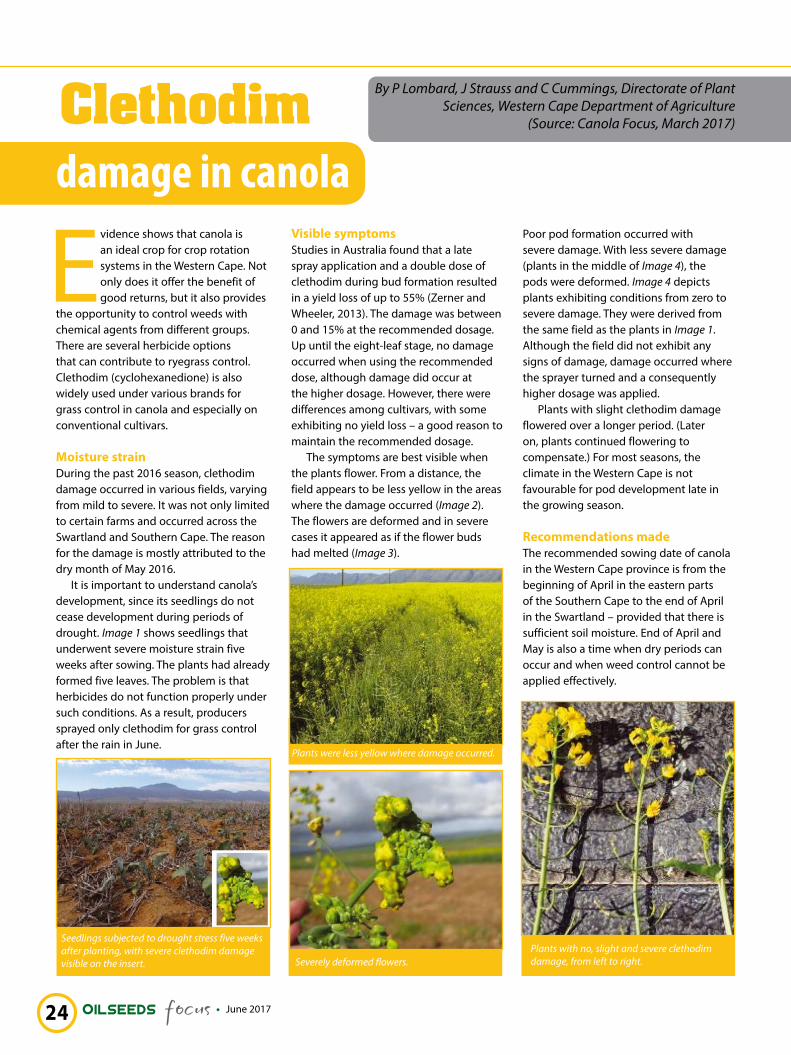
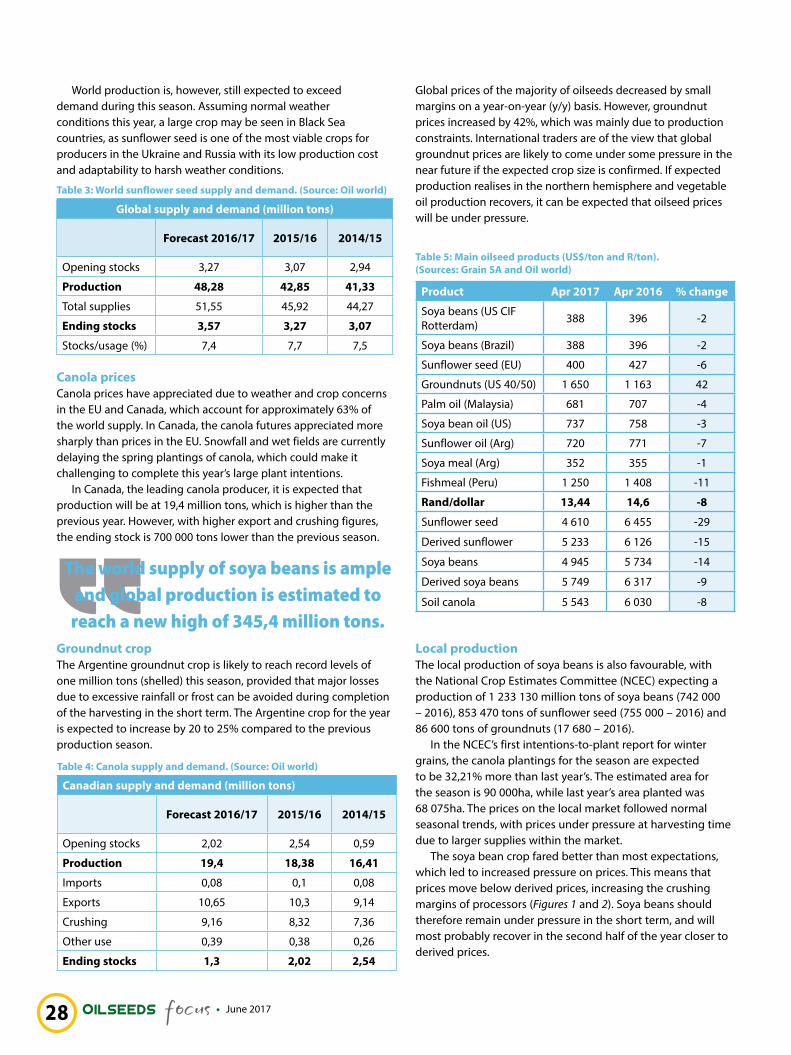
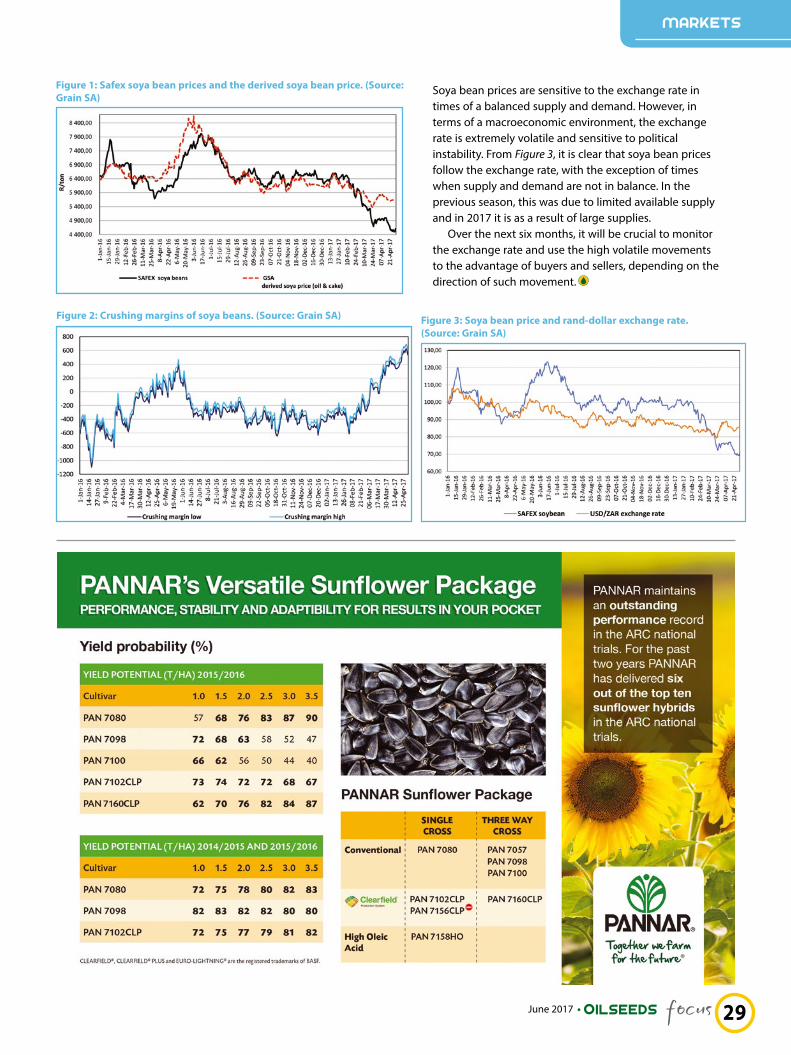
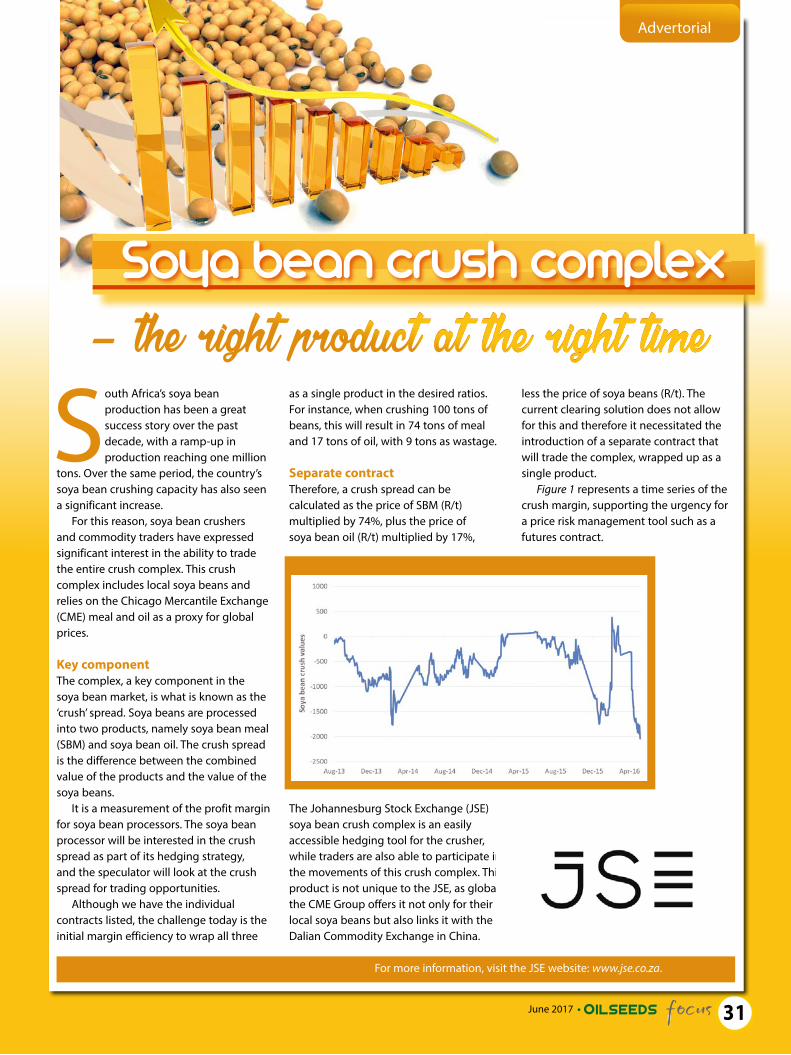
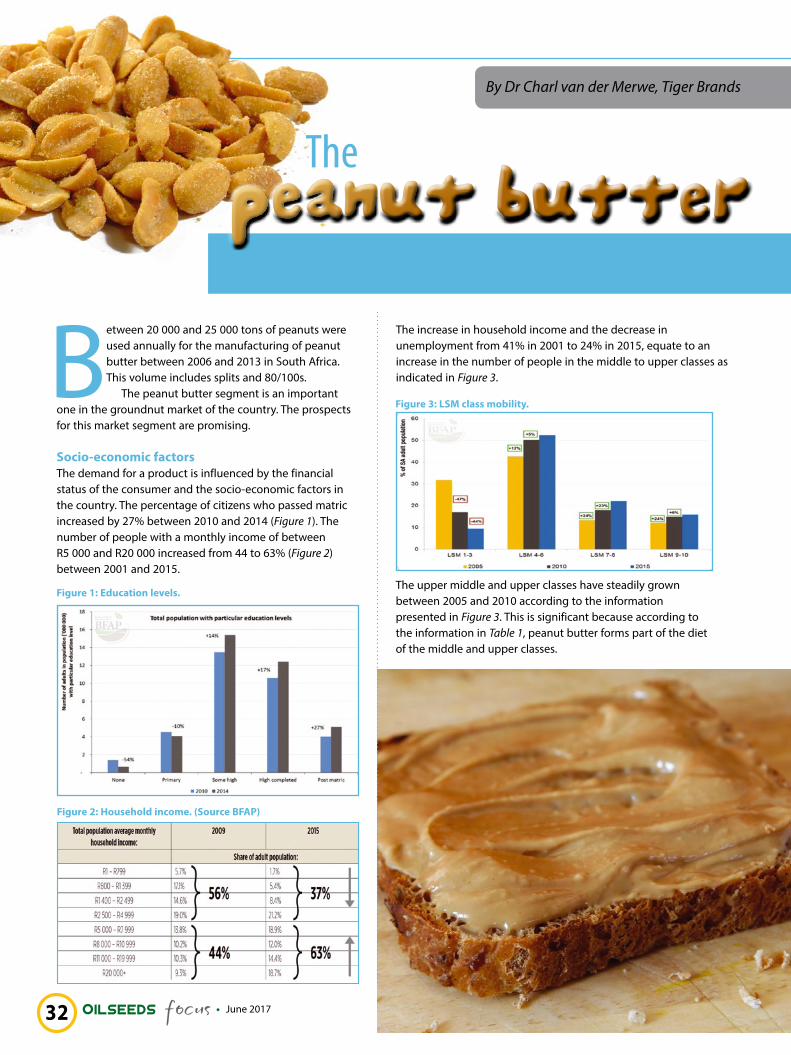
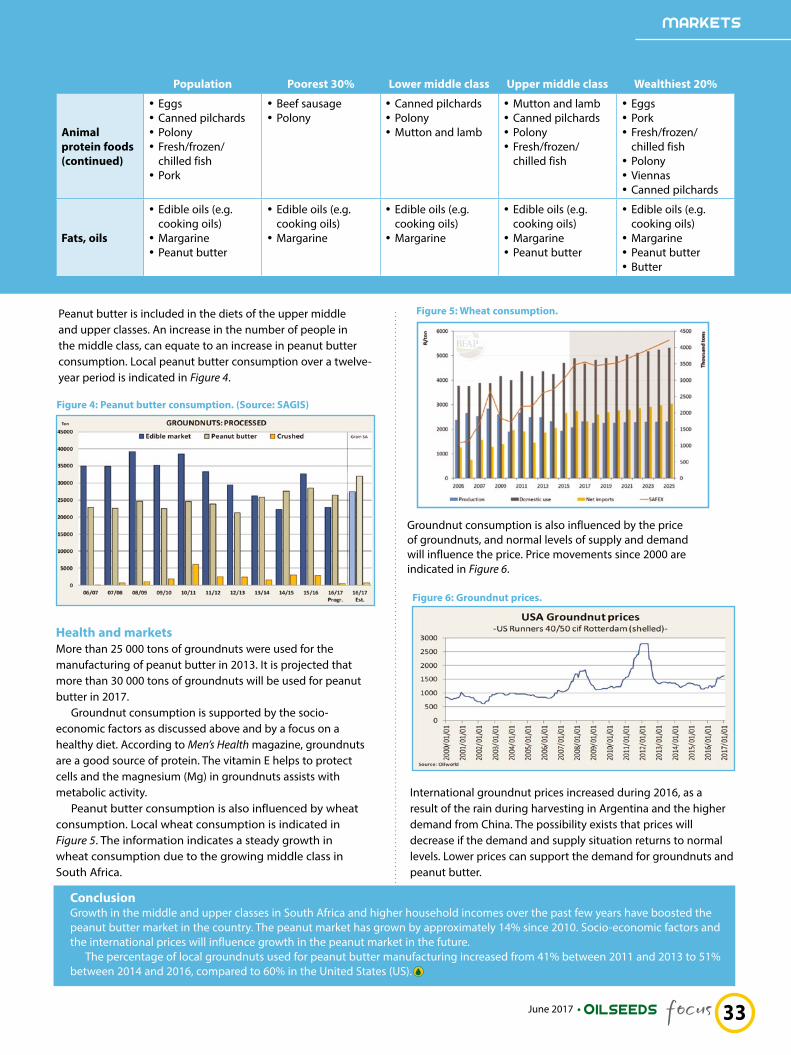
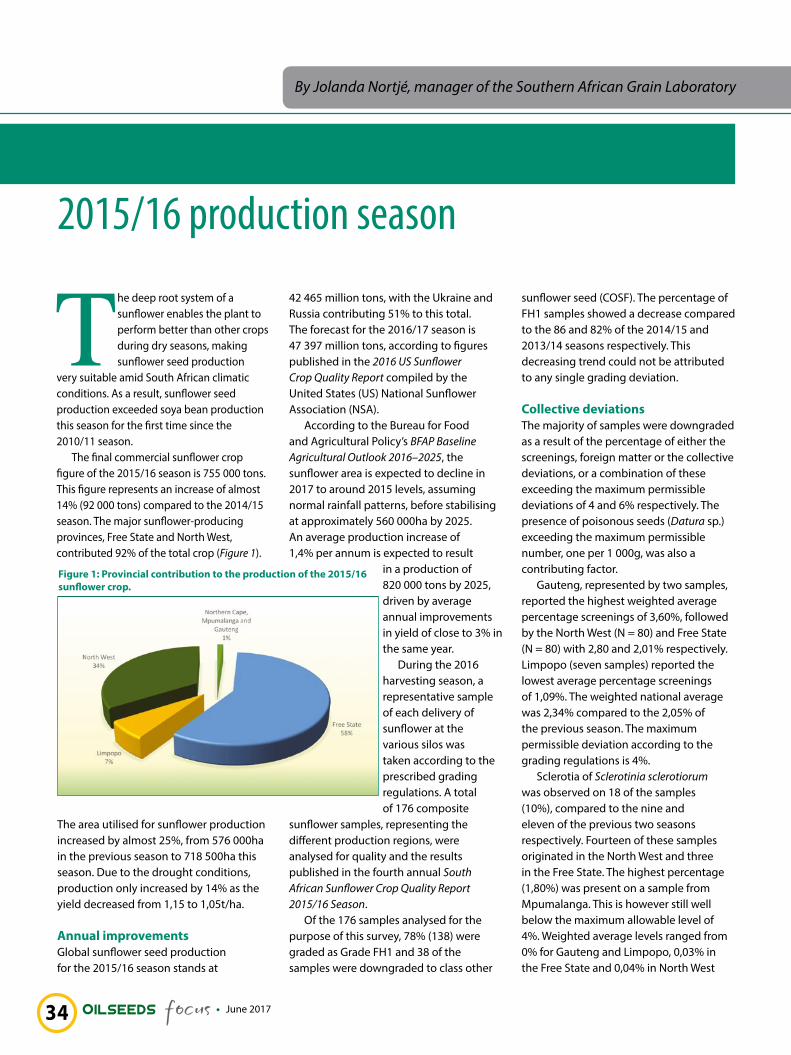
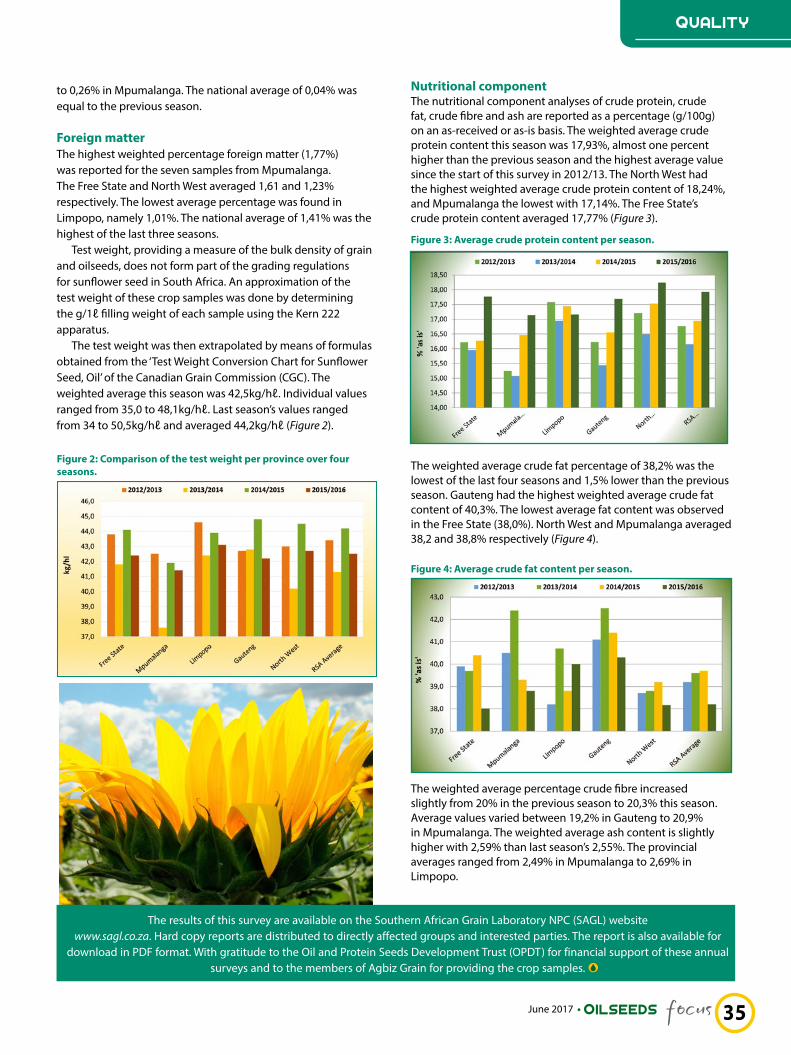
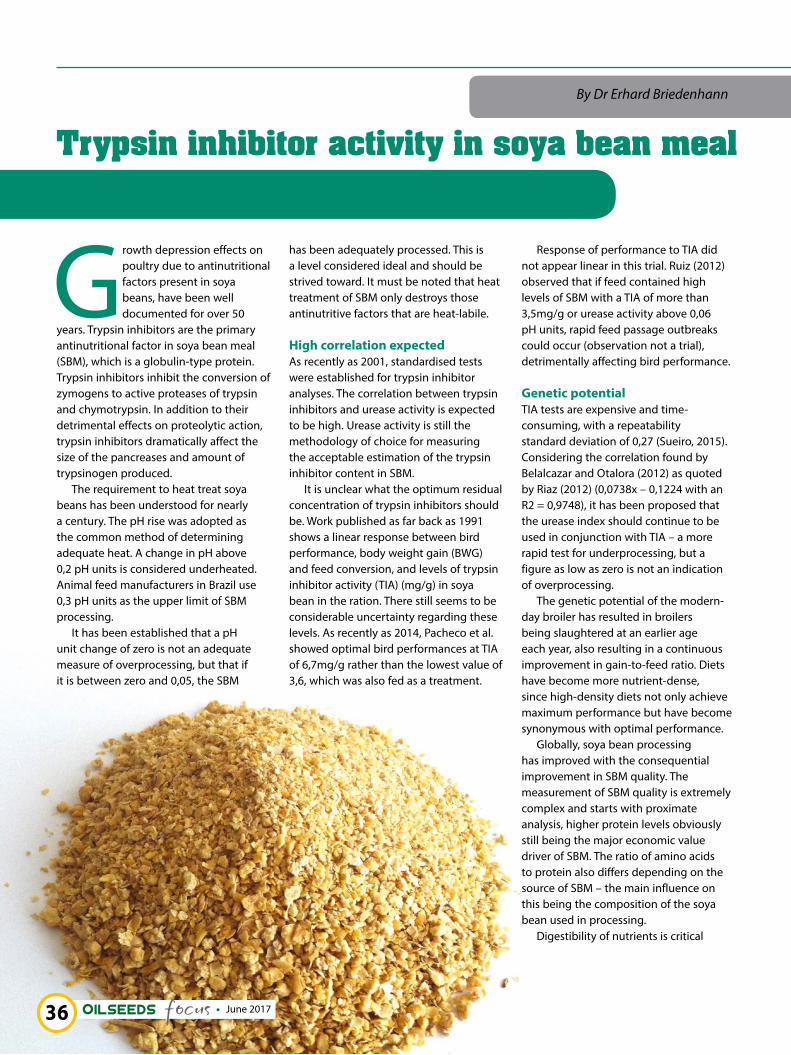
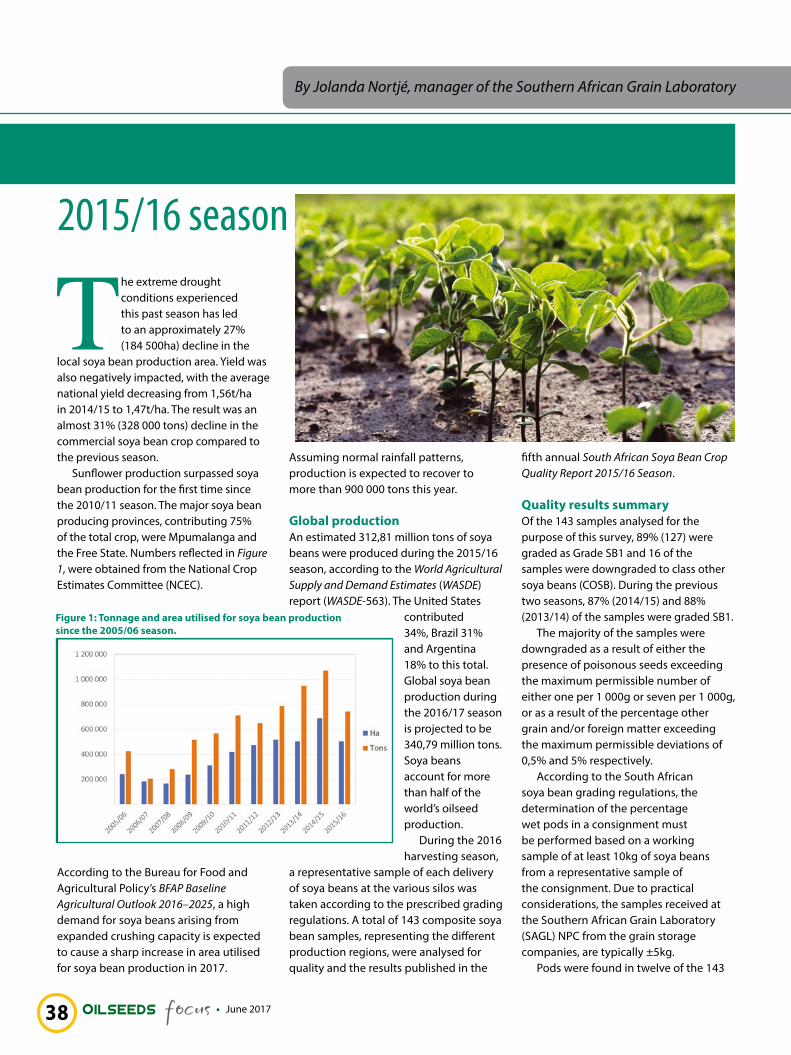
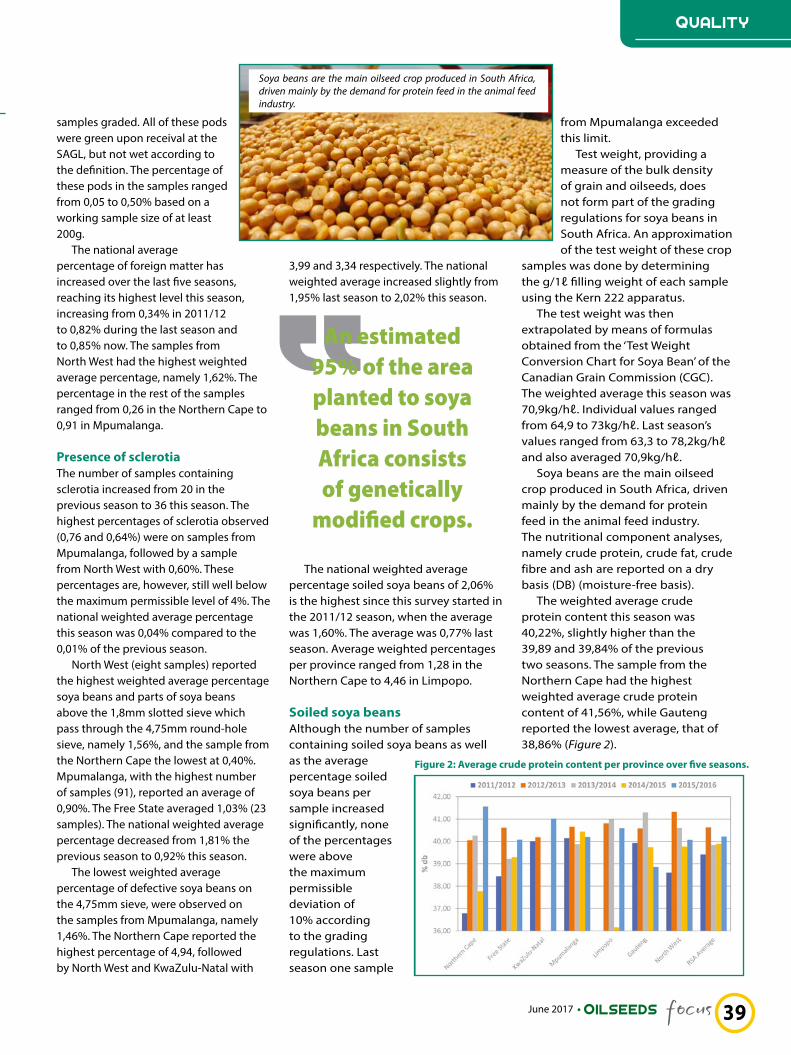
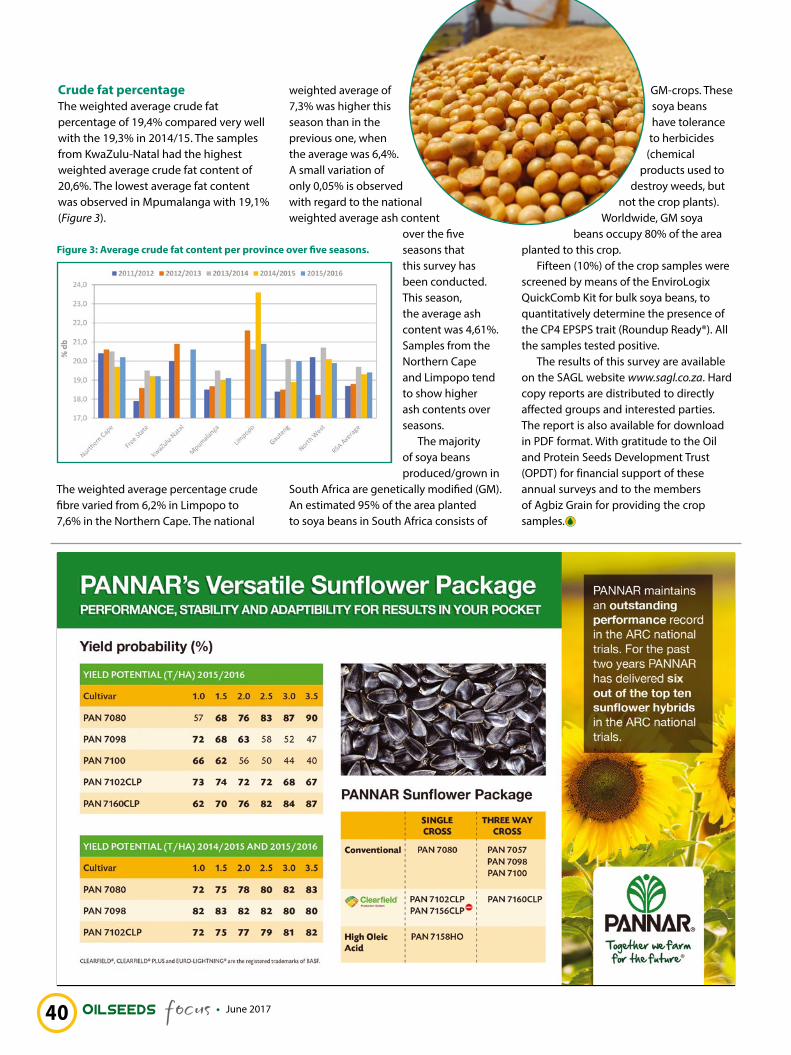