Protein Interaction Networks Aalt-Jan van Dijk Applied Bioinformatics, PRI, Wageningen UR &...
96
Protein Interaction Networks Aalt-Jan van Dijk Applied Bioinformatics, PRI, Wageningen UR & Mathematical and Statistical Methods, Biometris, Wageningen University [email protected] Feb. 21, 2013
-
Upload
brandon-carpenter -
Category
Documents
-
view
216 -
download
0
Transcript of Protein Interaction Networks Aalt-Jan van Dijk Applied Bioinformatics, PRI, Wageningen UR &...

Protein Interaction Networks
Aalt-Jan van DijkApplied Bioinformatics, PRI, Wageningen UR
& Mathematical and Statistical Methods, Biometris, Wageningen [email protected]
Feb. 21, 2013

My research
• Protein complex structures– Protein-protein docking– Correlated mutations
• Interaction site prediction/analysis
– Protein-protein interactions– Enzyme active sites– Protein-DNA interactions
• Network modelling– Gene regulatory networks– Flowering related

Overview
• Introduction: protein interaction networks
• Sequences & networks: predicting interaction sites
• Predicting protein interactions
• Sequence and network evolution
• Interaction network alignment

Protein Interaction Networks
Obligatory
hemoglobin

Obligatory Transient
hemoglobin Mitochondrial Cu transporters
Protein Interaction Networks

Experimental approaches (1)
Yeast two-hybrid (Y2H)

Experimental approaches (2)
Affinity Purification + mass spectrometry (AP-MS)

Interaction Databases
• STRING http://string.embl.de/
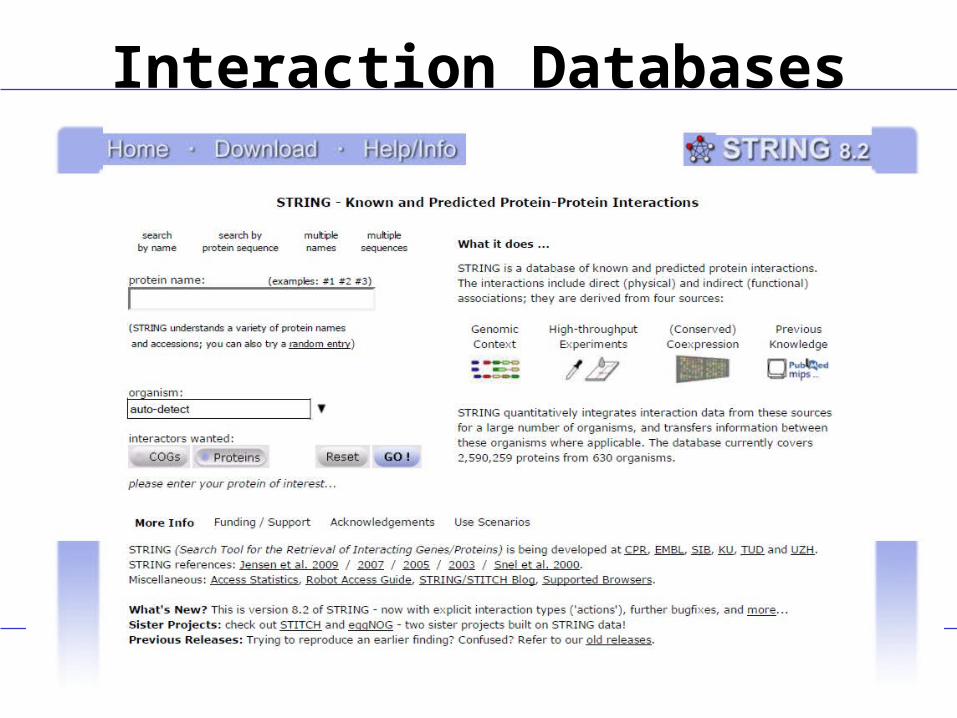
Interaction Databases

Interaction Databases
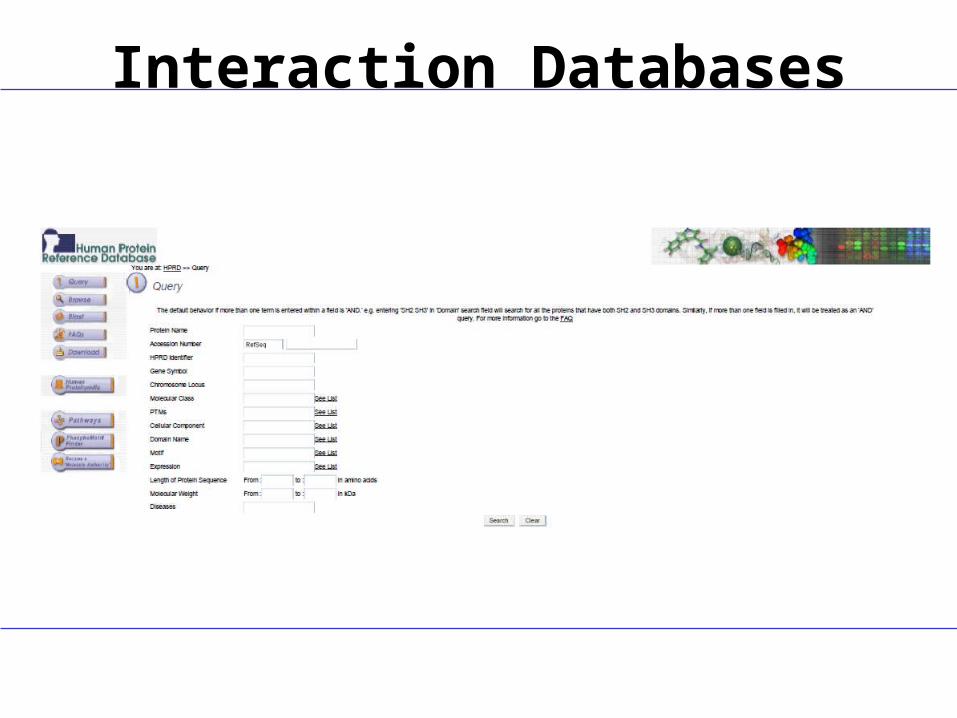
• STRING http://string.embl.de/• HPRD http://www.hprd.org/
Interaction Databases

Interaction Databases
• STRING http://string.embl.de/• HPRD http://www.hprd.org/• MINT http://mint.bio.uniroma2.it/mint/

Interaction Databases

Interaction Databases
• STRING http://string.embl.de/• HPRD http://www.hprd.org/• MINT http://mint.bio.uniroma2.it/mint/• INTACT http://www.ebi.ac.uk/intact/

Interaction Databases

Interaction Databases
• STRING http://string.embl.de/• HPRD http://www.hprd.org/• MINT http://mint.bio.uniroma2.it/mint/• INTACT http://www.ebi.ac.uk/intact/• BIOGRID http://thebiogrid.org/

Interaction Databases
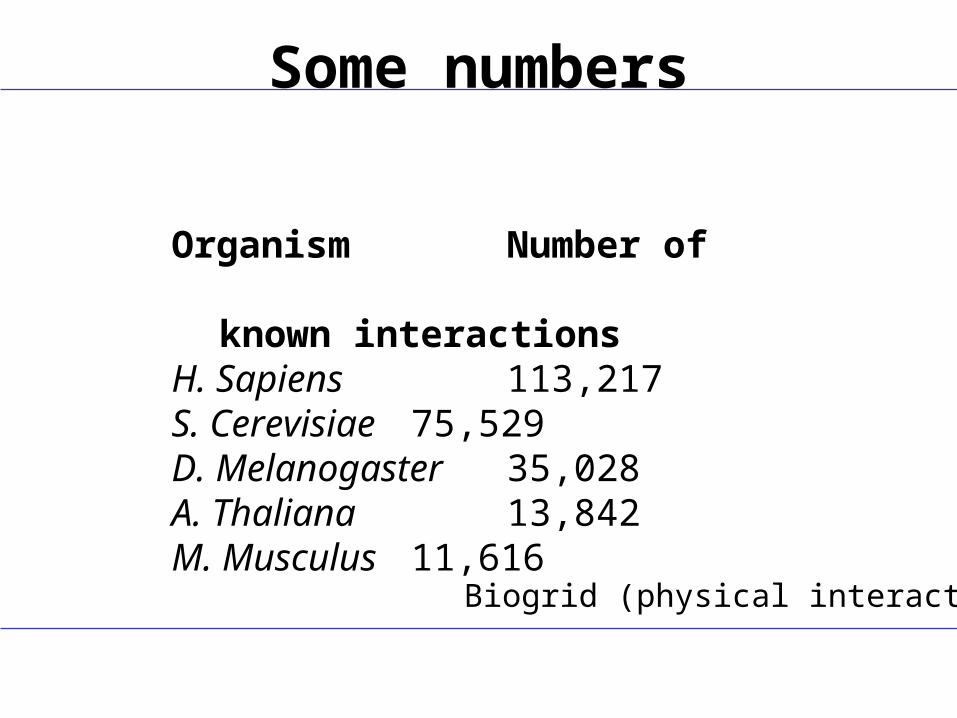
Some numbers
Organism Number of known interactions
H. Sapiens 113,217S. Cerevisiae 75,529D. Melanogaster 35,028A. Thaliana 13,842M. Musculus 11,616
Biogrid (physical interactions)

Overview
• Introduction: protein interaction networks
• Sequences & networks: predicting interaction sites
• Predicting protein interactions
• Sequence and network evolution
• Interaction network alignment

Binding site

Binding site predictionApplications:

Binding site predictionApplications:
•Understanding network evolution
•Understanding changes in protein function
•Predict protein interactions
•Manipulate protein interactions

Binding site predictionApplications:
•Understanding network evolution
•Understanding changes in protein function
•Predict protein interactions
•Manipulate protein interactions
Input data:
•Interaction network
•Sequences (possibly structures)

Sequence-based predictions

Sequences and networks
• Goal: predict interaction sites and/or motifs

Sequences and networks
• Goal: predict interaction sites and/or motifs
• Data: interaction networks, sequences

Sequences and networks
• Goal: predict interaction sites and/or motifs
• Data: interaction networks, sequences
• Validation: structure data, “motif databases”

Motif search in groups of proteins
• Group proteins which have same interaction partner• Use motif search, e.g. find PWMs
Neduva Plos Biol 2005

Correlated Motifs

Correlated Motifs
• Motif model
• Search
• Scoring

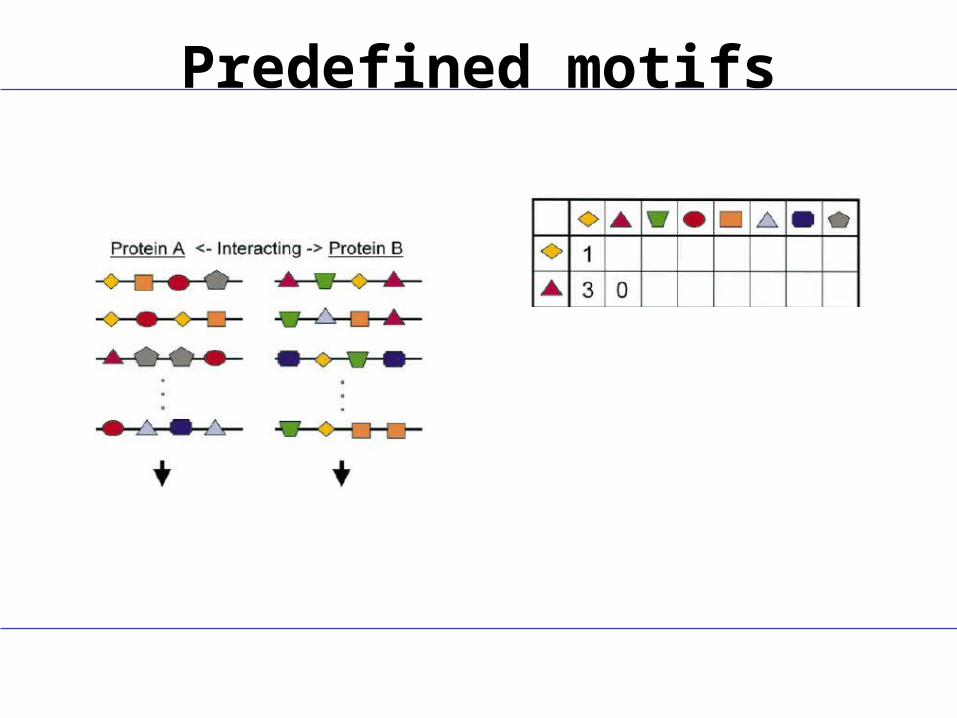
Predefined motifs

Predefined motifs
Predefined motifs

Predefined motifs

Predefined motifs

Correlated Motif MiningFind motifs in one set of proteins which interact with(almost) all proteins with another motif

Correlated Motif MiningFind motifs in one set of proteins which interact with(almost) all proteins with another motif
Motif-models:•PWM – so far not applied•(l,d) with l=length, d=number of wildcards
Score: overrepresentation, e.g. χ2

Correlated Motif MiningFind motifs in one set of proteins which interact with(almost) all proteins with another motif
Search:•Interaction driven•Motif driven

Interaction driven approachesMine for (quasi-)bicliques most-versus-most interactionThen derive motif pair from sequences

Motif driven approachesStarting from candidate motif pairs, evaluate theirsupport in the network (and improve them)

D-MOTIF
Tan BMC Bioinformatics 2006


IMSS: application of D-MOTIF
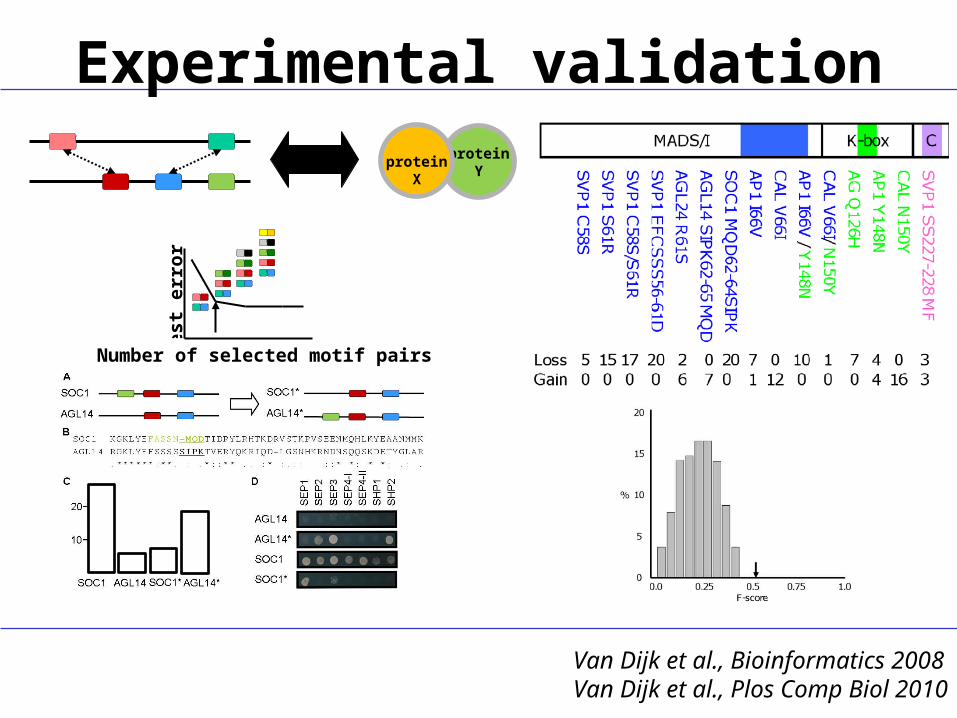
Van Dijk et al., Bioinformatics 2008Van Dijk et al., Plos Comp Biol 2010
proteinY
proteinX
Tes
t er
ror
Number of selected motif pairs

Experimental validationprotein
Yprotein
XT
est
erro
r
Number of selected motif pairs
Van Dijk et al., Bioinformatics 2008Van Dijk et al., Plos Comp Biol 2010

proteinY
proteinX
Van Dijk et al., Bioinformatics 2008Van Dijk et al., Plos Comp Biol 2010
Tes
t er
ror
Number of selected motif pairs
Experimental validation
proteinY
proteinX
Van Dijk et al., Bioinformatics 2008Van Dijk et al., Plos Comp Biol 2010
Tes
t er
ror
Number of selected motif pairs
Experimental validation

SLIDER
Boyen et al. Trans Comp Biol Bioinf 2011
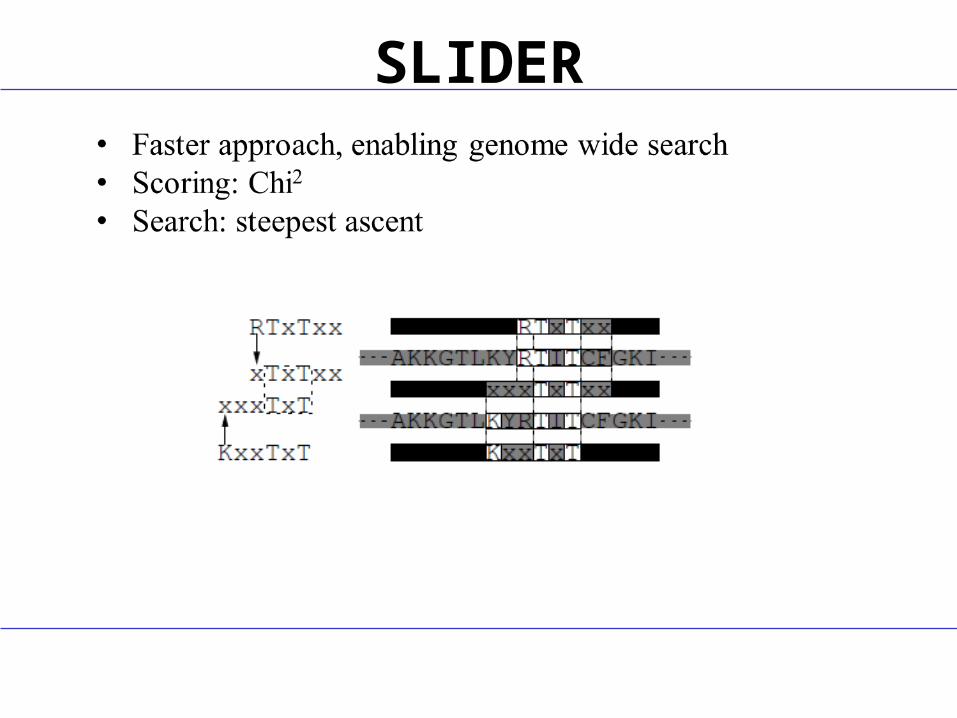
SLIDER

Validation

Extensions of SLIDER
Boyen et al. Trans Comp Biol Bioinf 2013

Extensions of SLIDERExtension I: better coverage of networkExtension II: use of more biological information

bioSLIDER
DGIFELELYLPDDYPMEAPKVRFLTKI

DGIFELELYLPDDYPMEAPKVRFLTKIconservation
bioSLIDER

DGIFELELYLPDDYPMEAPKVRFLTKIconservation
accessibility
bioSLIDER

DGIFELELYLPDDYPMEAPKVRFLTKIconservation
accessibility
bioSLIDER
Thresholds for conservation and accessibilityExtension of motif model: amino acid similarity (BLOSUM)

DGIFELELYLPDDYPMEAPKVRFLTKIconservation
No conservation, no accessibilityConservation and accessibility
Using human and yeast data for training and optimizing parameters
0.0 0.3 0.6Inte
ract
ion-c
overa
ge
0.0 0.3 0.6
0.5
0.4
0.3
0.2
0.1
0.0
accessibility
bioSLIDER
Motif-accuracyLeal Valentim et al., PLoS ONE 2012

Application to Arabidopsis
Arabidopsis Interactome Mapping Consortium, Science 2011
Input data: 6200 interactions, 2700 proteinsInterface predictions for 985 proteins (on average 20 residues)

Ecotype sequence data (SNPs)
SNPs tend to ‘avoid’ predicted binding sites
In 263 proteins there is a SNP in a binding site these proteins are much more connected to each otherthan would be randomly expected

Summary
• Prediction of interaction sites using protein
interaction networks and protein sequences
• Correlated motif approaches

Overview
• Introduction: protein interaction networks
• Sequences & networks: predicting interaction sites
• Predicting protein interactions
• Sequence and network evolution
• Interaction network alignment

Protein Interaction Prediction
Lots of genomes are being sequenced…(www.genomesonline.org)
Complete IncompleteARCHAEA 182 264BACTERIA 3767 14393EUKARYA 183 2897TOTAL 4132 17514

Protein Interaction Prediction
Lots of genomes are being sequenced… (www.genomesonline.org)
Complete IncompleteARCHAEA 182 264BACTERIA 3767 14393EUKARYA 183 2897TOTAL 4132 17514
But how do we know how the proteins in there work together?!

Protein Interaction Prediction
• Interactions of orthologs: interologs
• Phylogenetic profiles
• Domain-based predictions
A 1 0 1 1 0 0 1
B 1 0 1 1 0 0 1

Orthology based prediction

Orthology based prediction

Phylogenetic profiles
A 1 0 1 1 0 0 1
B 1 0 1 1 1 0 1
C 1 0 1 1 1 0 1
D 0 1 0 1 0 0 1

Domain Based Predictions

Domain Based Predictions

Overview
• Introduction: protein interaction networks
• Sequences & networks: predicting interaction sites
• Predicting protein interactions
• Sequence and network evolution
• Interaction network alignment

Duplications
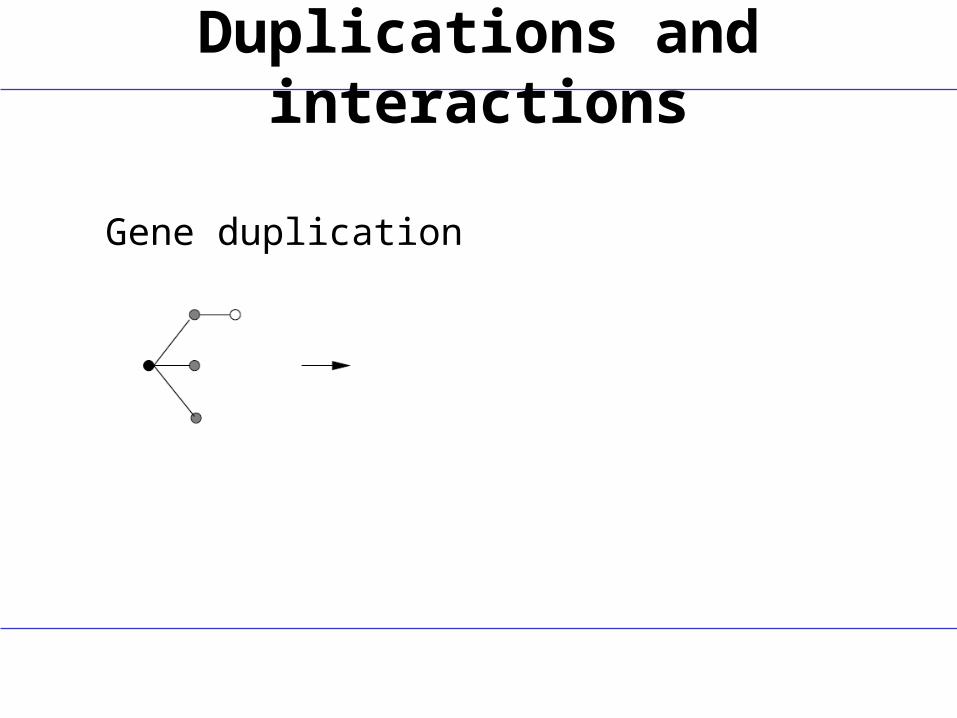
Duplications and interactions
Gene duplication

Duplications and interactions
Gene duplication

Duplications and interactions
0.1 Myear-1
Gene duplication Interaction loss
0.001 Myear-1

Duplications and interaction loss
Duplicate pairs share interaction partners

Interaction network evolution
Science 2011

Overview
• Introduction: protein interaction networks
• Sequences & networks: predicting interaction sites
• Predicting protein interactions
• Sequence and network evolution
• Interaction network alignment

Network alignment
Local Network Alignment: find multiple, unrelated regions ofIsomorphism
Global Network Alignment: find the best overall alignment

PATHBLAST
Kelley, PNAS 2003

PATHBLAST: scoring
Kelley, PNAS 2003
homology
interaction

PATHBLAST: results
Kelley, PNAS 2003

PATHBLAST: results
Kelley, PNAS 2003
For yeast vs H.pylori, with L=4, all resulting paths with p<=0.05 can be merged into just five network regions
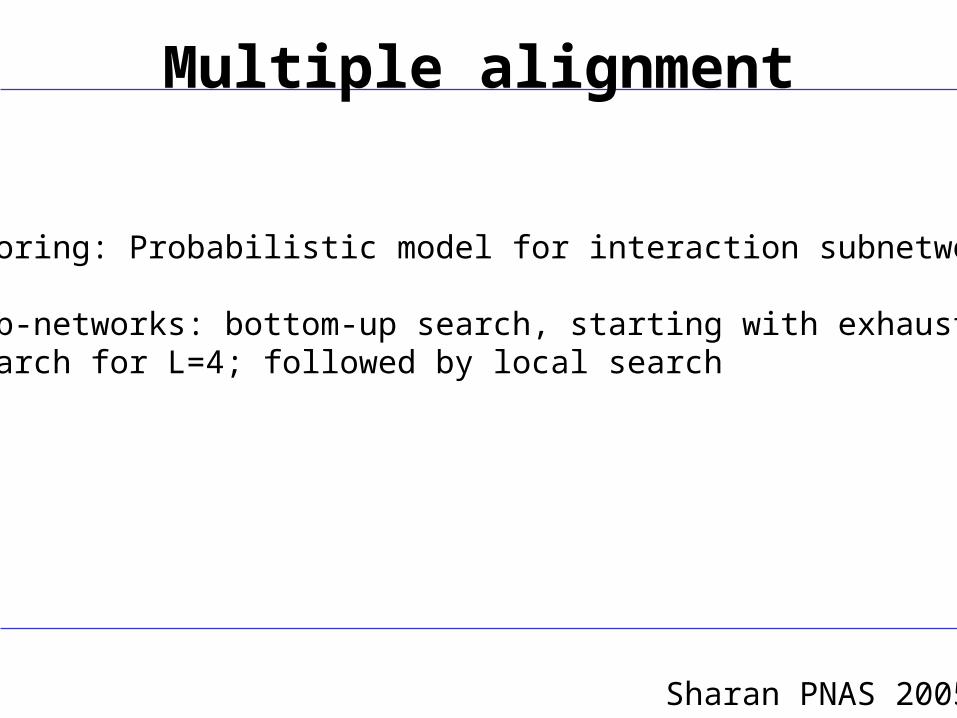
Multiple alignment
Scoring: Probabilistic model for interaction subnetworks
Sub-networks: bottom-up search, starting with exhaustivesearch for L=4; followed by local search
Sharan PNAS 2005

Multiple alignment: results
Sharan PNAS 2005
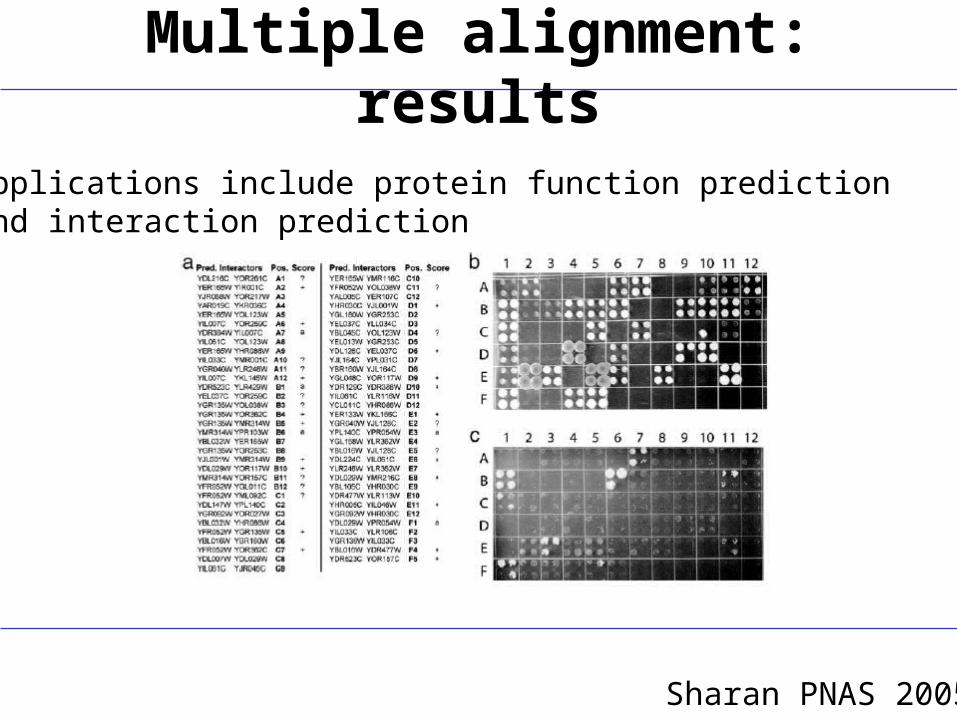
Multiple alignment: results
Applications include protein function predictionand interaction prediction
Sharan PNAS 2005

Global alignment
Singh PNAS 2008

Global alignment
Singh PNAS 2008

Global alignment
Alignment: greedy selection of matches
Singh PNAS 2008

Network alignment: the future?
Sharan & Ideker Nature Biotech 2006

Summary
• Interaction network evolution: mostly “comparative”, not much mechanistic
• Approaches exist to integrate and model network analysis within context of phylogeny (not discussed)
• Outlook: combine interaction site prediction with
network evolution analysis

ExercisesThe datafiles “arabidopsis_proteins.lis” and
“interactions_arabidopsis.data” contain Arabidopsis MADS proteins (which regulate various developmental processes including flowering), and their mutual interactions, respectively.
AGL24 LFYSOC1
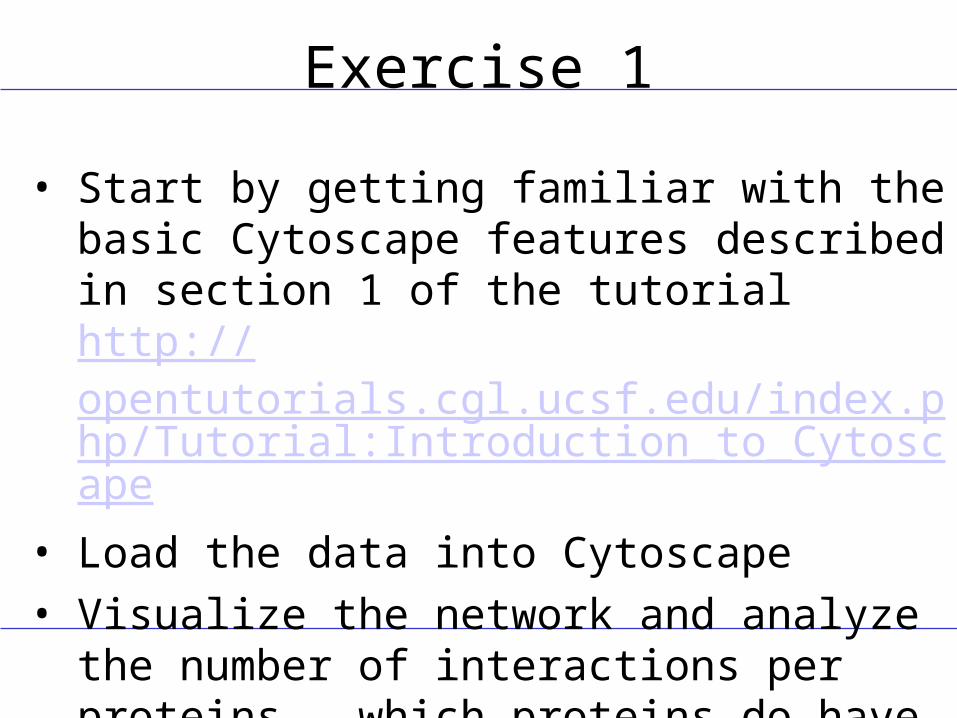
Exercise 1
• Start by getting familiar with the basic Cytoscape features described in section 1 of the tutorial http://opentutorials.cgl.ucsf.edu/index.php/Tutorial:Introduction_to_Cytoscape
• Load the data into Cytoscape• Visualize the network and analyze the number of
interactions per proteins – which proteins do have a lot of interactions?

Exercise 2
Write a script that reads interaction data and implements a datastructure which enables further analysis of the data (see setup on next slides).Use the datafiles “arabidopsis_proteins.lis” and
“interactions_arabidopsis.data” and let the script print a table in the following format:PROTEIN Number_of_interactionsMake a plot of those data

#two subroutines
#input: filename#output: list with content of file
sub read_list { my $infile=$_[0]; YOUR CODEreturn @newlist;}
#input: protein list and interaction list#output: hash with “proteins” list of their partners
sub combine_prot_int($$) { my ($plist,$intlist) = @_; YOUR CODEreturn %inthash;}

#reading input datamy @plist= read_list($ARGV[0]);my @intlist= read_list($ARGV[1]);
#obtaining hash with interactions%inthash=combine_prot_int(\@plist,\@intlist);
YOUR CODE#loop over all proteins and print their name and their number of interactions


In “orthology_relations.data” we have a set of predictedorthologs for the Arabidopsis proteins fromexercise 1. “protein_information.data” describes a.o. from which species these proteins are. Finally, “interactions.data“ contains interactions between those proteins.Use the Arabidopsis interaction data from exercise 1 to “predict” interactions in other species using the orthology information. Compare your predictions with the real interaction data and make a plot that visualizes how good your predictions are.
Exercise 3