
Protein interaction: a response regulatory protein ... · DNA-Protein interaction: a response...
187
Nathália Santos Serrão de Castro Msc. In Genetics and Molecular Biology DNA-Protein interaction: a response regulatory protein associated with Mo homeostasis in Desulfovibrio alaskensis G20. Dissertation for a degree in Doctor in Sustainable Chemistry Supervisor: Isabel Maria Andrade Martins Galhardas de Moura, Prof. Dr., FCT-UNL Co-supervisor: Marta Sofia Peixe Carepo, Dr., FCT-UNL President: Dr.Manuel Luís Magalhães Nunes da Ponte Examiners: Dr. Francisco Jorge Fernandes Caldeia Dra. Sofia Rocha Pauleta Dra. Ana Rosa Leal Lino Dr. Manuel Aureliano Pereira Martins Alves Dr. Stéphane Pierre Besson Dr. Francisco Manuel Ferreia Girio Members: Dra. Isabel Maria Andrade Martins Galhardas de Moura Dra. Marta Sofia Peixe Carepo Dr. César António Tonicha Laia Dr. Céa JULY/2014
Transcript of Protein interaction: a response regulatory protein ... · DNA-Protein interaction: a response...

Nathália Santos Serrão de Castro
Msc. In Genetics and Molecular Biology
DNA-Protein interaction: a response regulatory protein
associated with Mo homeostasis in Desulfovibrio alaskensis
G20.
Dissertation for a degree in Doctor in Sustainable Chemistry
Supervisor: Isabel Maria Andrade Martins Galhardas de Moura, Prof. Dr., FCT-UNL
Co-supervisor: Marta Sofia Peixe Carepo, Dr., FCT-UNL
President: Dr.Manuel Luís Magalhães Nunes da Ponte Examiners: Dr. Francisco Jorge Fernandes Caldeia Dra. Sofia Rocha Pauleta Dra. Ana Rosa Leal Lino Dr. Manuel Aureliano Pereira Martins Alves Dr. Stéphane Pierre Besson Dr. Francisco Manuel Ferreia Girio Members: Dra. Isabel Maria Andrade Martins Galhardas de Moura Dra. Marta Sofia Peixe Carepo Dr. César António Tonicha Laia
Dr. Céa
JULY/2014

II

III
DNA-Protein interaction: a response regulatory protein associated with
Mo homeostasis in Desulfovibrio alaskensis G20
Copyright Nathália Santos Serrão de Castro, FCT/UNL and UNL
A Faculdade de Ciências e Tecnologia e a Universidade Nova de Lisboa têm o
direito perpétuo e sem limites geográficos, de arquivar e publicar esta
dissertação através de exemplares impressos reproduzidos em papel ou de
forma digital, ou por qualquer outro meio conhecido ou que venha a ser
inventado, e de a divulgar através de repositórios científicos e de admitir a sua
cópia e distribuição com objectivos educacionais ou de investigação, não
comerciais, desde que seja dado crédito ao autor e editor.

IV

V
To Dr. César Laia

VI

VII
Acknowledgments
To prof. Isabel Moura to accept me in her scientific group and give me the
entire laboratory supports to develop my PhD.
To Dr. Marta Carepo to be more than a co-supervisor and share with me all her
knowledge about molecular cloning, protein expression, purification and
characterization. Thanks to be my translator during my first days in Portugal
and support me to solve all the bureaucracy that was necessary to stay here as a
PhD student
To prof. José Moura to be more than a professor…to be a friend
To Dr. César Laia to be a friend and give me all the support during the
fluorescence spectroscopy studies (from laboratory practice to results
interpretation).
To Dr. Mireille Ansaldi, Laboratory de Chimie Bactérienne – Centre National
de la Recherché Scientifique, to perform the DNase I footprinting experiments
To Dr. Gustavo Sousa, Centre for Immune Regulation – Faculty of Medicine
University of Oslo, to perform the nano-LC-MS experiments.
To Dr. Jose Miguel Manchenõ and Yana Alvarez, Consejo Superior de
Investigaciones Científicas, thank you for the care and respect that you received
me in your Institution.
To Biplap Maiti to teach me how to synthetize the phosphoramidate compound
and help me with the theoretical calculations.
To Nuno Cerqueira to perform the computational biochemistry analysis.
To Pablo Gonzalez e Gabriela Rivas to be a really good professionals and
friends.
To Célia Silveira to be my gold key.
To my dearest Rashmi Nair to share with me her experience with proteomics
and everyday moments of happiness.
To Susana Ramos to teach me to how to perform enzymatic activities studies
To Magdalena Bober and Sergy George to be more than an “Erasmus” student,
to be partners.
To Fundação para Ciência e Tecnologia for financial support
(SFRH/BD/47040/2008).
To Marcelo Lima to give me all his friendship before, during and after the PhD.

VIII
All my love and respect to Catarina Nunes, Jacopo Marangon and Leonardo
Dallagnol to be with me full time during this journey

IX
RESUMO
Interacção entre DNA e proteína: uma proteína regulatória responsiva associada
com a homeostasia do Mo em Desulfovibrio alaskensis G20
A transdução dos estímulos ambientais é fundamental para sobrevivência e
adaptação bacteriana em diferentes habitats. O sistema de dois componentes é um
mecanismo importante para a percepção e transdução de sinal bioquímico em bactérias.
Esse sistema é composto, basicamente, por uma proteína histidina quinase e uma
proteína reguladora responsiva que atuam em conjunto com a finalidade de fornecer a
plasticidade bioquímica necessária para a sobrevivência e adaptação dos
microorganismos.
A descoberta de um sistema envolvido na regulação da homeostasia do Mo
em Desulfovibrio alaskensis G20 abriu novos questionamentos sobre quais seriam os
mecanismos responsáveis pela regulação desse metal em bactérias sulfato-redutoras.
Nesse sentido, postulou-se que um sistema composto por três proteínas (MorP, MorR e
MorS) seria capaz de realizar a homeostasia do Mo. MorP (“molybdenum response
associated protein”) é uma proteína periplasmática multimérica composta por 16-18
subunidades. Estudos de EXAFS juntamente com estudos de caracterização bioquímica
mostraram que a MorP possui um centro metálico do tipo Mo-2S[2Fe-2S]-2S-Mo onde
cada monómero possui um átomo de Mo e um átomo de Fe. As proteínas MorS e MorR
constituiriam um sistema de dois componentes, onde a MorR actuaria como um factor
54 de transcrição do gene morP (gene responsável pela codificação da proteína MorP).
O objectivo geral desta tese é verificar se a proteína MorR interage com a
região intergénica entre morP e morS, e analisar como ocorre esta interacção.
Adicionalmente, pretende-se verificar qual a influência de moléculas doadores de
radicais fosfato na estrutura conformacional da MorR.
A presente dissertação está dividida em cinco capítulos.
O capítulo I é formado por uma introdução geral sobre as bactérias sulfato
redutoras e sobre a importância do molibdato para o género Desulfovibrio. Esse capítulo
faz uma introdução sobre o sistema de dois componentes (TCS) e seus agentes.
Adicionalmente, alguns mecanismos de expressão genica, regulação e exemplos de
factores de transcrição envolvidos com o TCS também são apresentados. Finalmente, a
hipótese do presente estudo é apresentada.

X
O capítulo II é constituído pelas metodologias e agentes usados para a
clonagem do gene morR. As estratégias utilizadas permitiram que o gene da morR fosse
clonado com sucesso e permitiram a expressão da proteína MorR tanto em pequena
quanto em larga escala, resultando na forma solúvel da proteína. Adicionalmente, o
contexto genómico do gene morR é avaliado e discutido.
O capítulo III é constituído por uma introdução sobre estudos envolvendo a
fosforilação de proteínas similares a MorR. Esse capítulo também mostra os resultados
da purificação e caracterização da proteína MorR. A proteína purificada é um
monómero, e a proteína MorR recombinante não contem nem metal (Zn2+
, Mo, Cu2+
and Mg2+
) nem phosphoamino ácidos e, portanto, não é isolada no seu estado
fosforilado. A região intergenica entre morP e morS foi amplificada e purificada, e os
ensaios de mobilidade por electroforese foram realizados para mostrar se a proteína
MorR ligava a esta região. Os resultados obtidos revelaram que a MorR liga a região
intergenica e os experimentos de DNase I footprinting identificaram o sítio de ligação
específico. O acetylphosphato e o phosphoramidato foram usados para fosforilar a
MorR, e os resultados obtidos não mostraram nenhuma oligomerização após a
fosforilação da proteína.
O capítulo IV é composto por uma breve introdução sobre os conceitos
utilizados em espectroscopia de fluorescência e pelos resultados obtidos com o uso
desta técnica. A forma prototópica de 6-FAM-67mer contendo a região intergénica alvo
foi usada com a finalidade de definir qual a espécie de fluoresceína estaria presente sob
as condições experimentais. Os resultados mostraram que a fluorescência de emissão da
forma monoanionica predomina sob o pH 7.5 e que a fluorescência de emissão da forma
dianionica começa a emergir a valores de pH acima de 8. A associação entre a MorR e
duas regiões diferentes (em tamanho) foram identificadas por meio de estudos de
anisotropia de fluorescência e as análises revelaram a presença de dois sítios de ligação
independentes. Os resultados identificaram duas constantes de associação: 15.5 M-1
para o primeiro sítio de ligação e de 0.02 M-1
para o segundo sítio de ligação. A
mudança conformacional induzida por fosforilação foi investigada usando acetilfosfato
e fosforamidato como pequenos doadores de fosfato. Os resultados mostraram que a e
fluorescência de emissão do triptofano não altera durante os ensaios experimentais. Esse
resultado corrobora com a ideia de que a MorR não altera sua estrutura após esse tipo de
estímulo. O estudo computacional bioquímico identificou que a fosforilação da serina é
cinética e termodinamicamente mais favorável com o phosphoramidato do que com o

XI
acetylphosphato.
O capítulo V é composto pelas conclusões do presente estudo e nós
propomos um mecanismo que pretende explicar como a MorR actuaria como um
regulador transcricional dos genes envolvidos na homeostase do Mo. Desse modo,
nosso modelo propõe que na ausência do Mo, a MorR actuaria como um repressor da
transcrição dos genes da morSR (via 70) e estaria inactiva para a transcrição do gene
morP (via 54). Nesse contexto, MorP actuaria como um repressor da proteína MorS,
sendo esta incapaz de realizar autofosforilação, e, consequentemente, todo o sistema
estaria inactivo. Na presença do metal, MorP desreprimiria MorS a qual realizaria
autofosforilação, e, consequentemente, fosforilaria MorR. A MorR fosforilada
desligaria do promotor 70 e seria capaz de activar a transcrição da morP via promotor
54. Desse modo, acredita-se também que a MorR possui um mecanismo de auto-
regulação.
Termos chave: Sistema de dois componentes, Molibdénio, bactéria sulfato redutora,
factores de transcrição, clonagem, purificação e caracterização bioquímica de proteína,
footprinting, espectroscopia de fluorescência.

XII

XIII
ABSTRACT
DNA-Protein interaction: a response regulatory protein associated with Mo
homeostasis in Desulfovibrio alaskensis G20
The environmental signal transduction is fundamental for bacteria survival
and adaptation to different habitats. The two component system is an important
mechanism for the perception and transduction of the biochemical signal in bacteria.
This system is composed by a histidine kinase and a responsive regulatory protein
acting together in order to provide all the biochemical plasticity for the microorganism
adaptation and survival.
The discovery of a Mo responsive homeostasis system in Desulfovibrio
alaskensis G20 opened new questions about the mechanisms involved in the regulation
of this metal in sulfate reducing bacteria. In this way, it was postulated that three
proteins (MorP, MorS, and MorR) could be involved in the homeostasis of Mo. The
MorP (“molybdenum response associated protein”) is a periplasmic multimeric protein
composed by 16-18 subunits. EXAFS studies together with biochemical
characterization data showed the presence of a heterometallic center, Mo-2S[2Fe-2S]-
2S-Mo, shared by two subunits, where each monomer has one atom of Mo and one
atom of Fe. The MorS and MorR might constitute a two component system where
MorR might acts as a 54 transcriptional factor for morP gene (the gene responsible for
the codification of MorP).
The general objective of this thesis is to verify if MorR interacts with the
intergenic region between morP and morS, and analyze how this interaction occurs.
Additionally, it does intend to verify the influence of phosphodonors molecules on
MorR oligomerization.
The present thesis is divided into five chapters.
The chapter I is formed by a general introduction about sulphate reducing
bacteria and the importance of molybdate for Desulfovibrio genus. This chapter gives an
introduction of Two Component System (TCS) and its components. Additionally, some
mechanisms of prokaryotic gene expression, regulation and examples of transcriptional
factors involved with TCS are also presented. Finally, the hypothesis of the present
work is exposed.
XIV
The chapter II is constituted by the methodologies and agents used to clone
the morR gene. Those strategies allowed the success of the morR cloning and permitted
the expression of the MorR protein both in small and in large scale, resulting in a
soluble form of the protein. Additionally, the genomic context of morR gene is
evaluated and discussed.
The chapter III gives an introduction about some studies of phosphorylation
of proteins that shares similarities with MorR. This chapter shows the results of protein
purification and biochemical characterization. The purified protein is a monomer, the
purification yields is 0.5mg of pure protein per liter and the recombinant MorR does not
contain neither metals (Zn2+
, Mo, Cu2+
and Mg2+
) nor phosphoamino acids and
therefore is not isolated in a phosphorylated state. The intergenic region between morP
and morS was amplified and purified and Electrophoretic Mobility Assay was
performed in order to show if MorR binds to this region. The results obtained revealed
that MorR is binding to the intergenic region and the DNase I footprinting experiments
identified the specific binding sites. Acetylphosphate and phosphoramidate were used to
phosphorylate MorR, and the results obtained did not show any oligomerization upon
phosphorylation of MorR.
The chapter IV is composed by a brief introduction about some fluorescence
spectroscopy concepts and by the results obtained using this technique. The prototropic
form of 6-FAM-67mer carrying the target intergenic region was determinate in order to
define which fluorescein specie is present under experimental procedures. The results
showed that the fluorescence emission of the monoanionic form predominates under pH
7.5 and that the fluorescence emission of the dianionic form starts to emerge above a pH
of 8. The association between MorR and two different (in length) target intergenic
region was assessed by fluorescence anisotropy studies and the analysis revealed the
presence of two independent binding sites. The result identified two association
constants: 15.5 M-1
for the first binding site and 0.02M-1
for the second binding site.
The MorR conformational change induced by phosphorylation was investigated using
acetylphosphate and phosphoramidate as small phosphodonors. The results showed that
MorR phosphorylates, but the fluorescence emission of tryptophan does not shift during
the experiment. This result corroborate with the idea that MorR does not alter its
structure upon this stimulus. A computational biochemical study identified that
phosphorylation of serine residues is kinetic and thermodynamically more favorable
with phosphoramidate than acetylphosphate.

XV
The chapter V is composed by the conclusions of the present study and we
propose a mechanism that hopes to explain how MorR acts as a transcriptional regulator
of genes involved with Mo homeostasis. In this way, our model propose that, in the
absence of Mo, the MorR acts as a repressor of the transcription of the morSR genes
(via 70) and would be inactive for the transcription of the morP gene (via 54). In this
context, MorP would acts as a repressor of the protein MorS, which might be incapable
to perform autophosphorylation, and, consequently, all the system would be inactive. In
the presence of the metal, MorR would derepress MorS which would be allowed to
peform autophosphorylation, and, consequently, phosphorylate MorR. The
phosphorylated form of MorR would disrupt the binding to the 70 promotor and would
be allowed to activate the transcription of morP gene. Moreover, we believe that MorR
has a mechanism of autoregulation.
Keywords: Two component system, Molybdenum, sulfate reducing bacteria,
transcriptional factors, cloning, purification and biochemical characterization of
proteins, footprinting, fluorescence spectroscopy.

XVI

XVII
INDEX OF CONTENT
ACKNOWLEDGMENT VII
RESUMO IX
ABSTRACT XIII
INDEX OF CONTENT XVII
INDEX OF FIGURES XXI
INDEX OF TABLES XXVII
ABBREVIATIONS XXIX
Chapter I: General introduction 1
Context 3
I.1. Sulphate reducing bacteria 5
I.1.1. Molybdate in Desulfovibrio genus 6
I.2. Introduction of TCS 12
I.2.1. Sensor 13
I.2.2. Response regulator (RR) 15
I.2.2.1. TCS RR and DNA binding 16
I.3. Prokaryotic gene expression and regulation 17
I.3.1. Housekeeping 70 and transcriptional factors 19
I.3.1.1. Transcriptional activation 19
I.3.2. The 54 regulation 21
I.3.2.1. NtrC 21
I.3.2.2. CpxRA 24
I.3.2.3. ZraSR 25
I.3.2.4. torRTS system 27
I.4. Hypothesis of the present study 29
I.5. References 30
Chapter II: morR gene, cloning and MorR amino acid composition 43
Context 45
II.1. Methodology 47
II.1.1. Molecular cloning of morR 47
II.1.1.1. Cloning vector characteristic 47
II.1.1.2. DNA restriction mapping 48
II.1.1.3. DNA amplification 49

XVIII
II.1.1.4. Vector and fragment digestion with restriction enzymes 50
II.1.1.5. Vector and insert ligation 50
II.1.2 Protein expression 52
II.1.2.1 Small scale protein expression and optimization 52
II.1.2.2 Large scale protein expression 54
II.2. Results and Discussion 55
II.2.1. morR genomic context 55
II.2.2. Cloning 58
II.2.3 Protein expression 60
II.2.3.1. Small scale expression 60
II.2.3.2. Large scale expression 61
II.3. References 63
Chapter III: MorR biochemical characterization and DNA binding 65
Context 67
III.1. Introduction 69
III.1.1. Phosphorylation and response regulators (RR) 69
III.2. Methodology 71
III.2.1. Protein purification 71
III.2.2. UV-VIS spectroscopy 74
III.2.3. Protein quantification 74
III.2.4. N-terminal sequencing 74
III.2.5. Peptide Mass Fingerprint 74
III.2.6. Protein metal analysis 75
III.2.7. Molecular mass determination 75
III.2.7.1. Molecular mass determination upon phosphorylation 76
III.2.8.Nano LC-MS mass spectrometry 76
III.2.8.1. In solution digest 76
III.2.8.2. LC-MS/MS 76
III.2.8.3. Protein identification 77
III.2.9 Electrophoretic mobility shift assay (EMSA) 77
III.2.10. DNAse I Footprinting assay 78
III.2.11. Ammonium hydrogen phosphoramidate synthesis 79
III.2.11.1. Elemental analysis of Carbon, Hydrogen, Nitrogen and Sulphur 79

XIX
(CHNS)
III.2.11.2. Nuclear magnetic resonance (NMR) 80
III.3. Results and Discussion 80
III.3.1. Amino acid residues composition: MorR 80
III.3.2. Protein purification 82
III.3.3. UV-VIS spectroscopy 83
III.3.4. Sequencing 84
III.3.5. Protein metal content 86
III.3.6. Determination of the molecular mass 86
III.3.7. Phosphorylation status of the pure MorR 88
III.3.8. Electrophoretic mobility shift assay (EMSA) 89
III.3.9. DNAseI footprinting 90
III.3.10. Ammonium hydrogen phosphoramidate synthesis 92
III.3.11. Acetylphosphate and phosphoramidate as MorR oligomeric
inductors
92
III.4. References 95
Chapter IV: MorR-DNA association and phosphorylation 99
Context 101
IV.1. Introduction 103
IV.1.1. Basic concepts of fluorescence 103
IV.1.2. Types of fluorophore 105
IV.1.2.1. Fluorescein 107
IV.1.3. Fluorescence quenching 108
IV.1.4. Fluorescence anisotropy 109
IV.2. Methodology 111
IV.2.1. dsDNA labeling with fluorescein 111
IV.2.2. Tunning the pka of dsDNA labeled with 6-FAM 112
IV.2.3. Protein-DNA binding 114
IV.2.4. MorR oligomerization 116
IV.2.5. Computational biochemistry 118
IV.3. Results and Discussion 118
IV.3.1. Fluorescein labeled oligonucleotide pka determination 118
IV.3.2. MorR-DNA interaction 123

XX
IV.3.3. Study of MorR phosphorylation by fluorescence spectroscopy 131
IV.3.4. Identification of MorR phospho-peptides 134
IV.4. References 144
Chapter V: Conclusion 147
V. Conclusion 149
V.1. Future Perspectives 153

XXI
INDEX OF FIGURES
Figure I.1. Strucuture of ModAB2C2 transporter from Archeoglobus fulgidus. The
ModA with Mo is represented in blue, the ModB in yellow and green and ModC in
red and magenta. Taken from Aguilar-Barajas (2011) Biometals, 24, 687-707.
8
Figure I.2. The modABC operon from E.coli. The arrows above the genes represent
the transcriptional orientation mediated by ModE protein
8
Figure I.3 Structure of molybdenum cofactor (Moco) in the tricyclic form. 1)
Pyrimidine ring. 2) Pyrazine ring. 3) Pyran ring.
9
Figure I.4 The three steps of molybdenum cofactor biosynthesis 10
Figure I.5 Model for transcriptional activation of mor
two component system.
12
Figure I.6. Prototypic form of two component system. The histidine kinase (HK)
senses the environmental stimuli (input signal), autophosphorylates, then transfer the
phosphoryl group to the cognate response regulator (RR).
13
Figure I.7. The diversity of HK sensor proteins. a) PDC sensors where the
extracellular domain senses the stimuli, b) HtrII-SrII where the sensor domain is
membrane embedded, c) NtrB is a free cytoplasmic sensor domain, d) FixL is a
membrane anchored that exhibit a cytoplasmic sensor domain with a PAS folding.
14
Figure I.8. Diversity of the C-terminal domain between the DNA binding regions of
response regulators. In red: the REC is the common N-terminal receiver domain. In
blue: the NtrC/DctD central AAA+ ATPase domain. In green: the C-terminal DNA
binding domain.
16
Figure I.9.HTH motif and DNA interaction. Taken from Carl O. Pabo (1992) Annu.
Rev. Biochem, 61, 1053-1095.
17
Figure I.10. Structural organization of each subunit of bacterial core RNAP and the
holoenzyme.
18
Figure I.11. Mechanism of RNAP complex stability mediated by an activator
protein. Adapted from David J. Lee (2012) Annu. Rev. Microbiol, 66: 125-152
20
Figure I.12. Mechanism of RNAP open complex formation mediated by an activator
protein. . Adapted from David J. Lee (2012) Annu. Rev. Microbiol, 66: 125-152
21
Figure I.13. Mechanism of RNAP54 transcriptional activation mediated by NtrC
protein.
22
Figure I.14. ntrC/ntrB TCS regulating glnA transcription for nitrogen fixation in
bacteria.
24
Figure I.15. Mechanism of cpx regulation during envelope stress response. 25
Figure I.16. zraP and zraRS genes involved in Zn2+
and Pb2+
tolerance in bacteria. 26
Figure I.17. The crystal strucuture of ZraR. The central (C) and DNA binding
domain (D) are highlighted.
27
Figure 1.18. The torRTS and torCAD system. 28
Figure II.1. pET21C cloning vector. A: the cloning vector map. Ap: ampicillin
resistance. Ori: origin of replication. lacI: lac repressor. T7 lac: 25bp lac operator
sequence. f1 origin: bacteriophage origin of replication, and restriction sites are
presented. B: The cloning/ expression region is evidenced. Adapted from Novagen
pet-21-a-d (+) and Novagen 2002-2003 Catalog chapter 5.
47
Figure II.2. Restriction map for morR gene obtained from NEBcutter. The scale bar
represents the number of nucleotides (1401bp) of morR from Desulfovibrio
alaskensis G20, and on the top the correspondent number of aminoacids residues
48

XXII
(466 aa). The display below the scale shows the single cutter restriction enzymes sites
for this gene sequence. Sites show in red have blunt ends, blue have 5` extensions
and green 3` extensions. Enzymes marked with * are susceptible to DNA
methylation.
Figure II.3. Scheme of the PCR cycle conditions. PCR thermal and time cycling are
schematically represented.
50
Figure II.4. Main principal steps of morR gene cloning. A) pET-21c (+) and PCR
fragment containing morR gene with the recognition sites for NheI (in red) and
EcoRI (in purple). B) pET-21c (+) and PCR fragment containing morR gene after
digestion protocol exhibiting the cohesive overhangs produced. C) recombinant
plasmid carrying morR gene after ligation, and subsequent plasmid transformation on
Giga Blues competent cells. D) recombinant bacterial colonies in LB agar plate,
isolation, and plasmid extraction and purification.
52
Figure II.5. Small scale MorR expression. The MorR expression was optimized
according to the experimental conditions: the optical density at 600nm (OD600) (0.5
and 1.0), the IPTG concentration (0, 0.5 and 1 mM) and time (T) of induction (zero
hours, 4 hours and overnight).
54
Figure II.6. Genomic comparison and organization between morR and other similar
response regulators in different types of gram negative bacteria. The genes are
represented by arrows and the arrow direction shows the genomic orientation. The
NCBI gene symbol is presented above and the description is inside the arrows. To
facilitate the comprehension of this study, the morR, morS and morP nomenclature
isn’t following the NCBI gene description. The scheme is organized according to
megablast result taking into consideration the percentage of similarity (76% for zraR
from D. vulgaris H, 72% for fis from D.vulgaris MF and 60% for zraR from E.coli
O127:H6; Shigella F301 and S. Typhymurium LT2).
56
Figure II.7. Genomic context of morP, morS and morR. A) Genomic orientation. B)
Intergenic region between morP and morS showing the conserved boxes, and ATG
start codons. Arrows indicate the transcription direction.
58
Figure II.8. Different steps of molecular cloning process: PCR and pure insert and
plasmid after digestion. A): a) 1kb molecular ladder, b) PCR of morR gene. B): a)
1kb molecular ladder, b) purified digested PCR product, c) purified digested pET-21c
(+).Running was performed in 1% agarose gel, in buffer TAE 1X, during 25 minutes
at 100 V.
59
Figure II.9. Different steps of molecular cloning process: colony PCR and plasmid
extraction. A): a) 1kb molecular ladder, b-f) Colony PCR showing, each band
corresponds to a single recombinant colony. B): a) 1kb molecular ladder, b-e)
Isolated recombinant plasmids, each band correspond to a single recombinant
plasmid. Running was performed in 1% agarose gel, in buffer TAE 1X, during 25
minutes at 100 V.
60
Figure II.10. Small scale protein expression at OD600 0.5. A 12.5% polyacrylamide
SDS-PAGE showing the expression profile of transformed BL21 (DE3) competent
cells induced at OD 0.5. A) Ladders. B) Cells with 0 mM IPTG at zero hour. C) Cells
with 0 mM IPTG after 4 hour. D) Cells with 0 mM IPTG after an overnight period.
E) Cells induced with 0.5 mM IPTG at zero hour. F) Cells induced with 0.5 mM
IPTG after 4 hours. G) Cells induced with 0.5 mM IPTG after an overnight period.
H) Cells induced with 1 mM IPTG at zero hour. I) Cells induced with 1 mM IPTG
after 4 hours. J) Cells induced with 1mM IPTG after an overnight period.
61
Figure II.11. Small scale protein expression at OD600 1.0. A 12.5% polyacrylamide
SDS-PAGE showing the expression profile of transformed BL21 (DE3) competent
61

XXIII
cells induced at OD 1.0. A) Cells with 0 mM IPTG at zero hour. B) Cells with 0 mM
IPTG after 4 hours. C) Cells with 0mm IPTG after an overnight period. D) Ladders
(116, 66.2, 45, 35 and 25 kDa). E) Cells induced with 0.5 mM IPTG at zero hour. F)
Cells induced with 0.5 mM IPTG after 4 hours. G) Cells induced with 0.5 mM IPTG
after an overnight period. H) Cells induced with 1 mM IPTG at zero hour. I) Cells
induced with 1 mM IPTG after 4 hours. J) Cells induced with 1mM IPTG after an
overnight period.
Figure II.12. 12.5% SDS-PAGE showing the cellular localization of MorR. A)
Ladder. B) Cellular fraction.
62
Figure III.1. Diagram of MorR purification 73
Figure III.2. Amino acids residues alignment of the D. alaskensis G20 MorR, S.
typhimurium Zrar, S. Typhimurium NtrC, A. aeolicus NtrC1 and S. melilotiDctD. The
three major conserved regions are represented as follows: receiver domain (red),
ATPase domain (blue) and DNA binding domain (green). The phosphoacceptor
aspartic acid (D55), Walker A, Walker B, GAFTGA and arginine finger (R-finger)
are detached.
81
Figure III.3. Crystallographic structure of the central and C-terminal domains of
ZraR from S. typhimurium (PDB ID:1OJL).The two major conserved regions with
MorR are represented as follows: ATPase domain (blue) and DNA binding domain
(green). In red (Walker A), in orange (Walker B), in magenta (GAFTGA) and the
arginine finger (R-finger) are detached and shown in brown in the second plane.
82
Figure III.4. 12.5% SDS-PAGE of purified MorR after each purification step. A:
ladders, B: after DEAE-FF column, C: after Source 15Q column, D: after Superdex
200 column.
83
Figure III.5. UV/VIS spectrum of purified MorR (20 M) in 10 mM Tris-HCl, pH
7.6. The arrow shows the maximum absorption peak at 278 nm.
84
Figure III.6. N-terminal and amino acid residues sequencing of MorR with the
corresponding nucleotide sequencing of pETMorR. Bold in yellow: N-terminal
sequencing result. Bold in red: matched peptides by peptide mass fingerprint.
85
Figure III.7. Rf of standards proteins and MorR in 12,5% SDS-PAGE. -
galactosidase (-gal), bovine serum albumin (BSA), ovalbumin (Oval), lactate
dehydrogenase (lac dehydro), REase Bsp981 (REase), -lactoglobulin (-lacto),
lysozyme (lyso) and MorR.
87
Figure III.8. Determination of the molecular mass by Superdex 200 10/30 mm gel
filtration. The graphic shows the normalized values of distribution coefficient (Kav)
and logarithm of molecular weight (Log MW). Standard proteins used for the
calibration curve: Ribonuclease A (Ribo A), Ovalbumin (Oval), Conalbumin (Co),
Aldolase (Aldo) and Ferritin (Fe)
87
Figure III.9. EMSA showing the DNA shift observed when MorR was mixed with the
target DNA. The interaction was visualized in 7,5 % Native PAGE. A) DNA shift.
B) free DNA.
89
Figure III.10. EMSA showing the protein shift observed when MorR was mixed
with the 233 bp intergenic region between morP and morS in 7,5 % PAGE. A) Free
MorR. B) MorR shift. C) Free BSA. D) BSA mixed with the intergenic region where
no shift was observed.
90
Figure III.11. MorR DNaseI footprinting experiment using the intergenic region
between morP and morS as DNA template. A 233bp labeled DNA fragment
encompassing the intergenic region was digested with DNaseI. The MorR protected
region are bolded in red. G, A, T and C are sequencing ladders. 1) 10 nM, 2) 6 nM,
3) 2 nM and 4) 0nM of heterologous MorR respectively.
91

XXIV
Figure III.12 Analytical gel filtration chromatography showing the elution profile of
MorR with and without incubation with acetylphosphate or ammonium
phosphoramidate (phosphoramidate). The intensity of UV280 nm was normalized.
93
Figure IV.1. Jablonski diagram and illustration of the relative positions of
absorption, fluorescence and phosphorescence spectra. IC: internal conversion (i.e.
direct return to the ground state without emission of fluorescence). Dashed arrows:
vibrational relaxation. ISC: intersystem crossing (possibly followed by emission of
phosphorescence)
104
Figure IV.2. Normalized fluorescence spectra of W emission residues belonging to
five spectral classes A, S, I, II and III. The variability of the emission of the indole
fluorophore makes W fluorescence a sensitive toll in protein analysis
106
Figure IV.3. Six ionic forms of fluorescein after Zanker and Peter (1958). Taken
from Smith and Pretorius (2002) Water SA, 28, 395-402.
107
Figure IV.4. Scheme of fluorescence anisotropy of a fluorophore according to
molecular motion upon interaction with a molecule (ligand).
111
Figure IV.5. Fluorescence emission and anisotropy of 6-FAM-67-mer dsDNA at
different pH, ranging from 5 to 9.2. A) Fluorescence emission raw spectra. B) Area
normalized fluorescence emission spectra. The arrows indicate pH increase or
decrease.
119
Figure IV.6. pH dependence of fluorescence intensity (circles) and steady-state
anisotropy (squares) of 6-FAM-67-mer dsDNA. Experimental fluorescence emission
values were normalized for pH 7.5. Lines represent the fitting of the data assuming
acid-base equilibrium which allowed the determination of pKa’s.
120
Figure IV.7. Diagram species of 6-FAM-67-mer dsDNA. At pH 7.5 the monoanioc
specie is prevalent (72%), followed by neutral (26%), dianionic (1%), and cationic
(0.4%).
121
Figure IV.8. 6-FAM labeled dsDNA used for fluorescence anisotropy experiments.
The MorR nucleotide binding sites identified by DNaseI footprinting are represented
in red, and the position of 6-FAM is evidenced. A) 6-FAM-67-mer dsDNA. B) 6-
FAM-58-mer dsDNA.
123
Figure IV.9. Area normalized fluorescence emission of 6-FAM-67-mer dsDNA and
6-FAM-58-mer dsDNA along the titrations experiments.
124
Figure IV.10. Fluorescence anisotropy of 6-FAM-67-mer dsDNA and 6-FAM-58-
mer dsDNA during the titrations experiments. The graphic shows the variation of
anisotropy, where errors bars represent the standard deviation, and the squares and
circles show the medium value obtained from seven anisotropy readings for each
DNA strand. The equilibrium binding was analyzed according to equations 4.17, and
the nonlinear least square mathematical model was applied and is presented as a
straight line.
125
Figure IV.11. Distribution of the nucleotide binding sites of 6-FAM-67-mer and 6-
FAM-58-mer dsDNA in response to MorR interaction. The free DNA where that is
no interaction with MorR is presented as line and circles. The first binding site
occupancy is represented by a line and square. The second binding site occupancy is
represented as line and triangle.
127
Figure IV.12. Binding sites occupancy of 6-FAM-67-mer and 6-FAM-58-mer
molecules with the fluorescence anisotropy enhancement. The first binding site
occupancy is presented as line and square. The second binding site occupancy is
presented as line and triangle, and the anisotropy is presented as line and asterisk.
129
Figure IV.13. Predict model for MorR-DNA interaction. The 6-FAM position is
evidenced and the two DNA binding sites are delimitated by rectangles. The blue
130

XXV
circles represents the MorR protein
Figure IV.14. Raw spectra of MorR tryptophan emission during a titration with
phosphodonors. A) Acetylphosphate. B) Phosphoramidate.
132
Figure IV.15. Area normalized spectra of W emission during a titration with
phosphoramidate.
133
Figure IV.16. Static quenching for MorR titration with phosphoramidate (square).
The line represents the fitting of the data.
134
Figure IV.17. The MorR amino acid composition with conserved regions detached,
and the phospho-amino acids identified by nano LC-MS. The amino acids are colored
according to its domain localization: red for receiver domain, blue for ATPase
domain and green for DNA binding domain. W are bolded in yellow. The phospho-
amino acids identified in both samples are bolded in grey and highlighted with an
asterisk (*). The phospho-amino acids identified solely in sample submitted to
phosphoramidate are bolded in red and highlighted with an hashtag (#).
136
Figure IV.18. Alignment between N-terminal receiver domain of MorR and E. coli
CheY. The W are bolded in blue. Conservation is based on the physic-chemical
properties of amino acids and the Consensus is the percentage of the modal residue
per column.
137
Figure IV.19. Comparison of MorR phospho-amino acids localization in the ZraR
central domain crystal structure. A) Phospho-amino acids residues identified in
sample submitted to phosphorylation with acetylphosphate and phosphoramidate. B)
Phospho-amino acids residues identified solely in sample submitted to
phosphorylation with phosphoramidate.
138
Figure IV.20. First step of the phosphorylation process with hydrogen-phosphoamid
and acethyl-phosphate.
140
Figure IV.21. Second step of the phosphorylation process. 141
Figure IV.22. Full energetic profile of the phosphorylation process. 142
Figure V.1. Model for morSR and morP transcriptional regulation proposed by the
present work
152

XXVI

XXVII
INDEX OF TABLES
Table II.1. Primers designed for PCR reaction. Primer orientation, sequence
and restriction endonuclease site are shown. Restriction sites are underlined in
the primer sequence.
49
Table II.2. The PCR protocol for morR gene amplification. The PCR mixture
was designed for a total reaction volume of 20 µl.
49
Table II.3. pET-21c and morR PCR fragment preparation with restriction
enzymes. Amplified morR PCR product and pET-21c were digested with
endonuclease enzymes NheI and EcoRI as follows.
50
Table IV.1. Oligonucleotide name and sequence which were labeled with 6-
FAM at 5` end.
112
Table IV.2. pKa values of free fluorescein, FITC-9-mer dsDNA and 6-FAM-
67.mer dsDNA.
121
Table IV.3.Association constants determined for MorR binding to the
intergenic region between morS and morP following the two step binding
model. K1 is the association constant for the first binding site and K2 for the
second binding site. The anisotropy value (r) of the fluorophore is also shown
125
Table IV.4.MorR binding sites proposed occupancy according to the two
binding sites model.
126
Table IV.5. Fluorescein-dsDNA single-photon counting analysis as a
function of the MorR protein concentration.
131
Table IV.6. Post-translational modifications (phosphorylation) identified by
nano LC-MS mass spectrometry. The modifications are highlighted; the
phospho-amino acids are underlined.
135

XXVIII

XXIX
ABBREVIATIONS
6-FAM 6- Carboxyfluorescein
4aHTH Four-helix helix-turn-helix
Alfa
AAA+
Protein domain responsable for converting
Adenosine Triphosphate hydrolysis to mechanical
force
AgrA DNA binding response regulator belonging to
LytTR family
ABC Ammonium bicarbonate
AmiR RNA binding response regulator of amidase operon
W Tryptophan
AraC Response regulator of arabinose operon
ATP Adenosine Triphosphate
Beta
BL21 Host cell for gene expression
nt Nucleotide
bp Base pair
Bprom Prediction of Bacterial Promoters
BSA Bovine Serum Albumin
CA Histidine kinase catalitic domain
CAP Catabolic Activation Protein
CheA Chemotaxis protein A, histidine kinase
CheW Chemotaxis protein W, purine binding
CheY Chemotaxis protein Y, response regulator
CheZ Chemotaxis protein Z, phosphatase
CHNS Carbon, Hydrogen, Nitrogen and Sulfur elemental
analysis
cI Regulatory protein involved in the maintenance of
lambda lysogeny
CIAP Calf intestinal alkaline phosphatase
CpxA Envelope stress protein, histidine kinase
cpxA Gene for envelope stress protein, histidine kinase
CpxP Envelope stress protein, periplasmic
cpxP Gene for envelope stress protein that codifies the
periplasmic protein
CpxR Envelope stress protein, response regulator
cpxR Gene for envelope stress protein that codifies the
response regulator
cpxRA Genes for envelope stress of two component system
CpxRA Envelope stress two component system
CSIC Consejo Superior de Investigaciones Científicas-
Spain
D Aspartic acid residue
DctD C4-dicarboxylate transport system, response
regulator
DEAE-FF Diethylaminoethanol fast flow
DHp Histidine kinase transmiter domain

XXX
DNA Deoxyribonucleic acid
DrrB Response regulator of the OmpR/PhoB subfamily
dsDNA Duplex Deoxyribonucleic acid
DTT Ditiotreitol
E.coli Escherichia coli
EcoRI Restriction enzyme obtained from Escherichia coli.
R means R-factor
EDTA Ethylenediamine tetraacetic acid
EMSA Electrophoretic mobility shift assay
FeMoco Molybdenum-Iron cofactor of nitrogenase
FIS Factor of inversion
Fis-HTH Factor of inversion helix-turn-helix
FITC fluorescein isothiocyanate
FliM Flagellar motor switch protein
glnA Gene of glutamine synthetase
glnAP1 Promoter for bacterial nitrogen regulation
glnAP2 Promoter for bacterial nitrogen regulation required
during nitrogen starvation
GlnB PII protein involved in signalling in glutamine
synthetase and regulation of NtrB activity
glnLP Promoter for bacterial nitrogen regulation,
autoregulation of NtrC
GlnS Glutamine Synthetase
HK Histidine Kinase
HTH Helix-turn-helix
HydG Old nomenclature of zinc resistance response
regulatory protein (ZraR)
hydH Old nomenclature of gene that codifies a zinc
resistance histidine kinase protein
ICP-AES Coupled Plasma Atomic Emission Spectroscopy
IDT Integrated DNA technologies
IHF Integration Host Factor
IPTG Isopropyl β-D-1-thiogalactopyranoside
IRC Internal reaction coordinate
MES 2-(N-morpholino)ethanesulfonic acid
Epsilon
Kav Distribution coefficient
kDa kilo Daltons
kq Bimolecular quenching constant
L Lysine
l Lambda
lacA Gene of bacterial transacetilase of the lactose
operon
LacI Bacterial transcriptional repressor of lactose operon
lacY Gene of bacterial permease of the lactose operon
lacZ Gene of bacterial beta-galactosidase of the lactose
operon
LB Luria Broth
LC-MS Liquid chromatography mass spectrometry
nL nanoliter

XXXI
min Minute
m/z Mass-to-charge ratio
MS Mass spectrometry
AGC Automatic gain Control
ppm One part per million
Da Daltons
nr
Non-redundant GenBank coding sequencing (CDS)
translations + protein data bank (PDB) + Swiss-Prot
+ protein information resources (PIR) + protein
research foundation (PRF)
LytTR atypical DNA binding domain
MALD TOF matrix-assisted laser desorption ionization time of
flight
mer From Greek meros "part" denotes the
oligonucleotide lenght
mg Milligrams
mM Micromolar
Mo Molybdenum
Moco Molybdenum cofactor
modA Molybdenum ABC transporter, gene of the
periplasmic component
ModA Molybdenum ABC transporter, periplasmic
component
modABC Molybdate transport genes
modB Molybdenum ABC transporter, gene of the
membrane channel protein
ModB Molybdenum ABC transporter, membrane channel
protein
modC Molybdenum ABC transporter, gene of ATP
binding protein
ModC Molybdenum ABC transporter, ATP binding
protein
ModE Molybdenum ABC transporter, regulatory protein
morP Gene for molybdenum response associated protein
MorP Molybdenum Response Associated Protein
MorR Molybdenum response regulatory protein
morR Gene for molybdenum response regulatory protein
morS Gene for molybdenum sensor kinase protein
MorS Molybdenum sensor kinase protein
MtrA Response regulator of genes that codifies bacteria
cell wall peptidases
NarL Nitrate/nitrite response regulator
NbIR Non-bleaching protein B
nblA A gene involved in phycobilisome degradation
(bleaching)
NCBI National Center for Biotechnology
NheI Restriction enzyme obtained from Neisseria
mucosa heidelbergensis
nm nanometer
NMR Nuclear Magnetic Resonance

XXXII
NTP Ribonucleoside triphosphate
NtrB Bacterial nitrogen assimilation, histidine kinase
ntrB Bacterial nitrogen assimilation, gene for histidine
kinase
NtrC Bacterial nitrogen regulatory protein
ntrC Gene for nitrogen regulatory protein
NtrC 1 Nitrogen regulatory protein 1
OD Optical Density
OmpC Outer membrane porin, transport channel
OmpF Outer membrane porin, transport channel
OmpR Outer membrane porin, transcriptional regulator
PAGE Polyacrilamide gel electrophoresis
PAS Signal sensory domain named based on three
protein that it appear (Per, Arnt, Sim)
Pb Lead
PCR Polymerase chain reaction
PDB Protein Data Bank
pET plasmid vector for cloning
PleD Diguanylate cyclase
PMF Peptide Mass Fingerprint
pmol picomole
ppb One part per billion
PRM Promoter for repression maintenance
qRT-PCR Real time quantitative polymerase chain reaction
REC Response regulator domain
R-finger Arginine finger
RNA Ribonucleic acid
RNAP Ribonucleic acid polymerase
rpm Revolutions per minute
RpoS sigma 38 factor
RR Response regulator protein
rRNA Ribosomal ribonucleic acid
S Sulfur
sigma
SDS Sodium dodecyl sulfate
SMART Simple modular architecture research tool
SOC Super Optimal Broth
SRB Sulfate-reducing bacteria
STAGE-TIP Stop And Go Extraction Tip
T4 DNA Ligase Recombinant enzyme from Escherichia coli NM
989.
T4 PNK T4 Polynucleotide Kinase
TAE Buffer Tris-Acetate-EDTA
TAT Twin Arginin Translocation
TCD Thermal Conductivity Detector
TCS Two Component System
TFA Trifluoroacetic acid
TMA Trimethyllamine
TMAO Trimethylamine N-Oxide
TorA Trimethylamine N-Oxide reductase I, catalytic

XXXIII
subunit
TorC Trimethylamine N-Oxide reductase I, cytochrome
c-type subunit
torCAD Genes for trimethylamine N-oxide reduction system
TorD Chaperone involved in maturation of TorA subunit
of trimethylamine N-oxide reductase system
TorR Trimethylamine N-Oxide reductase system,
response regulator
torRTS genes for trimethylamine N-oxide two component
system
TorS Trimethylamine N-Oxide reductase system,
histidine kinase
TorT Trimethylamine N-Oxide reductase system,
periplasmic protein
Trp Tryptophan
UV-VIS Ultraviolet Visible
omega
w-HTH winged helix-turn-helix
YJAI Old nomenclature of periplasmic zinc resistance
associated protein
Zn zinc
ZraP Periplasmic zinc resistance associated protein
zraP gene for zinc resistance associated protein, the
periplasmic protein
ZraR Zinc resistance associated protein, the regulator
zraR gene for zinc resistance associated protein, the
regulator protein
ZraS Zinc resistance associated protein, the histidine
kinase
zraS gene for zinc resistance associated protein, the
histidine kinase
zraSR gene for zinc resistance associated two component
system

XXXIV

Chapter I
General Introduction

General Introduction
2
Chapter I
3
General Introduction
Context
The base of the present study is the bacterium Two Component System (TCS) that can be
involved in Mo homeostasis. The prototypic TCS is formed by a histidine kinase (HK)
sensor protein and a response regulator (RR). In the presence of an environmental stimuli,
the sensor autophosphorylates and transfer the phosphoryl group to the cognate RR. The
activated (i.e. phosphorylated) RR can participate in different metabolic circuits. Usually,
RR acts as transcriptional activators that binds to DNA and interacts with RNA polymerase
in order to orchestrate gene transcription. In Desulfovibrio genus, some proteins are
regulated by molybdenum (Mo) or contain this metal in its structure. The genome analysis
of Desulfovibrio alaskensis G20 predicts the presence of genes involved in Mo transport,
but there is no report about the Mo uptake or regulation in this bacterium. The discovery of
MorP (the molybdenum response associated protein) opened new insights about the
molecular mechanism of molybdenum regulation in sulphate reducing bacteria (SRB). In
order to understand how Mo can influence in gene transcription in D. alaskensis G20, a
general introduction about SRB and the importance of Mo to the bacterial proteins are
presented. Moreover, the principal aspects of the TCS and gene transcription initiation are
described with a special focus on transcriptional factors belonging to TCS and genetic
regulation in bacteria. Finally, this introduction presents the hypothesis of the present study.

General Introduction
4

Chapter I
5
I.1. Sulphate reducing bacteria
Microorganisms have a broad capacity to sense and rapidly respond to
oscillations in the environment. This characteristic is vital to their adaptation and survival.
Escherichia coli, Bacillus subtilis and Saccharomyces cerevisiae have been used as model
for the primary comprehension of the gene expression profile in response to environmental
changes. However, the prokaryotic phylogeny is diverse and the prediction of a universal
code of stress response becomes difficult to follow. A primary mechanism involved in
signal transduction includes histidine kinase (HK) proteins belonging to Two Component
System (TCS). A comparative analysis of 5.000 HK from 207 sequenced prokaryotic
genomes showed that many signaling events were recently developed in the course of
evolution and that some regulatory systems are not found in the key model
microorganisms1,2
.
Sulfate-reducing bacteria (SRB) are a diverse group of anaerobic, heterotrophic
and mixotrophic bacteria. These bacteria can be found widespread in anoxic habitats and
have in common the ability to use sulfate as a terminal electron acceptor in the respiratory
process. They are capable of tolerating a relative wide range of environmental changes,
such as: temperature, pH, chloride concentration and pressure3. Additionally, they show
high plasticity in finding alternative metabolic routes in order to survive, such as the
reduction of energy metabolism through downregulation of ATPase genes4,5
; the
osmoprotection by accumulating the glycine betaine (a cellular osmoprotectant)
concentration6 and the defensive mechanisms against the reactive oxygen species (ROS).
The ROS protection is an important feature of SRB since those microorganisms are
anaerobes and need to control the oxidative stress and ROS production. This feature reflects
in the increase diversity of proteins involved within this process, such as the rubredoxin
oxidoreductase (Rbo)7and therubrerythrin (Rbr)
8, all of them conserved among SRB and
essential to scavenge ROS without regenerating O2. SRB are important in biotechnology
and engineering, since they can be used in heavy metal bioremediation and sulfur
compound removal from waste materials. On the other hand these bacteria can cause
serious problems in industry because of sulfide production, which is a major cause of
corrosion and degradation of metallic equipment 9.

General Introduction
6
SRB can be divided into four groups based on rRNA sequence analysis: Gram-
negative mesophilic SRB, Gram-positive spore forming SRB, thermophilic bacterial SRB,
and thermophilic archaeal SRB. Desulfovibrionaceae include a large family of Gram-
negative mesophilic SRB, which comprise the genera Desulfovibrio and
Desulfomicrobium10
. Until now, 26 Desulfovibrio genomes of SRB are available, and the
genome of Desulfovibrio alaskensis G20 was recently updated11
.
The Desulfovibrio alaskensis G20 (formerly Desulfovibrio desulfuricans G20)
is a gram-negative mesophilic SRB that belongs to the delta subdivision of the
Proteobacteria. The genome of delta subdivision is characterized by the presence of
multiple copies of detoxification genes like rubrerythrin and the presence of predicted
highly expressed 54 activator proteins12
. Moreover, this strain can growth syntrophically,
but no conserved genome feature has been identified as the cause of this ecological
ability13
. The microbial syntrophy under methanogenic conditions requires a mutual
cooperation in order to transfer H2 or formate for electrons transferring. This type of
interaction occurs between Desulfovibrio alaskensis G20 and Methanospirillum hungatei
(methanogen bacteria), which is capable to induce Desulfovibrio alaskensis G20 growth
under lactate and to produce acetate and H2 (used by methanogen to produce CH4). The
quinine reductase complex (Qrc) and the tetrahaem periplasmic cytochrome c3 (TpIc3) is a
family of redox complex that participate specifically in this process (of H2 and formate
metabolism) and that are required by Desulfovibrio alaskensis G20 to grow syntrophically
with lactate14
.
I.1.1. Molybdate in Desulfovibrio genus
Molybdenum (Mo) is a trace element naturally occurring in the earth's crust
(0.05 to 40 g/g)15–17
. In the group of transition metals is the most abundant in the ocean
with residence time exceeding 800 thousand years15,18
. It belongs to the fifth period of the
periodic table, exists in the form of seven stable isotopes (Mo92
, Mo94
, Mo95
, Mo96
, Mo97
,
Mo98
and Mo100
) with relative abundance of 9.2 to 24.2% and may be present in the
oxidation state of -2 to +6. In rocks is mainly in the form of molybdenite (MoS2) and in the
presence of iron oxides and organic matter, even under anoxic environmental conditions,
readily oxidizes to form the oxyanion molybdate ( )
15,16,18. Molybdenum is essential

Chapter I
7
for nearly all living organisms (from bacteria to animals) and it is important for enzymatic
reactions and acts as co-factor of proteins that are responsible for electron transfer in the
processes of nitrogen fixation19–22
It is biologically available in the form of molybdate (MoO42−
)20
. In bacteria,
molybdate enters the cell through specific transporters that are coded and regulated by the
modABCD operon23
. Inside the cell, molybdate is integrated into metal cofactors, such as
Moco in mononuclear Mo enzymes or FeMoco in nitrogenase24
.
The modABCD operon is composed by four genes that are transcribed into a
single polycistronic mRNA that codify proteins involved in Mo and W cell uptake and
transport25
. The modA gene encodes a periplasmic molybdate binding protein ModA that is
indispensable for high affinity of molybdate uptake by the bacteria cell 26,27
. The modB
gene encodes an integral membrane protein ModB which forms a twelve transmembrane
helices of a membrane channel of the ModABC transportes. The modC encodes an ATPase
(ModC) subunit of the ModABC complex that energizes molybdate transport. The interface
between ModC and ModB induce conformational changes that allow ATP binding and
hydrolysis and subsequent transport through the channel. The modD gene encodes a
putative 231 amino acid residues protein of unknown function28
. The crystallographic
structure of the ModABC from Archeoglobus fulgidus shows a presumable pentameric
ModAB2C2 quaternary structure and illustrates how the proteins are organized in order to
perform the molybdate uptake29
(figure I.1).

General Introduction
8
Figure I. 1.Strucuture of ModAB2C2 transporter from Archaeoglobus fulgidus. The ModA with Mo is
represented in blue, the ModBin yellow and green and ModC in red and magenta. Taken from Aguilar-
Barajas (2011) Biometals, 24, 687-707.
modABCD genes are negatively controlled by ModE protein, which binds
modA operator sequences. In the absence of molybdate ModE derepresses the modABCD
operon allowing transcription. ModE controls its own transcriptional level through a
divergent promoter (figure I.2) 30,31
.
Figure I. 2.The modABCD operon from E.coli. The arrows above the genes represent the transcriptional
orientation mediated by ModE protein.
The enzymes whose activity depends on Mo, such as sulfite oxidase, xanthine
oxidase and nitrate reductase, incorporate this metal ion into a cofactor known as Moco32
.
Moco is a pyranopterin-dithiolene moiety where Mo ion is covalently bound to the
dithiolate moiety. Moco is an instable molecule and it is believed that the dithiolate group

Chapter I
9
contributes to the lability. The cofactor has a tricyclic pyranopterin structure with
pyrimidine , pyrazine and pyran rings forming the organic moiety of Moco (often called
molybdopterin (MPT)) (figure I.3). The phosphomethyl group is also labeled in the pyran
ring. The Mo and W are coordinated by two dithiolene sulfurs that are attached to the pyran
ring33
.
Figure I. 3. Structure of molybdenum cofactor (Moco) in the tricyclic form. 1) Pyrimidine ring. 2) Pyrazine
ring. 3) Pyran ring.
Organisms from all kingdoms share a conserved pathway to synthesize Moco34
.
In bacteria, three major steps are necessary to synthesize Moco: 1- conversion of guanosine
nucleotide (GTP) into cyclic pyranopterin monophosphate (cPMP); 2- Synthesis of MPT
and 3- Molybdenum incorporation into MPT. The first step requires MoaA (belonging to S-
adenosylmethionine-dependent radical enzyme superfamily) and MoaC that uses 5-GTP to
forms cPMP35,36
(figure I.4). The resulted cPMP molecule is similar to MPT but lacks the
dithiolene group. The second step requires the incorporation of two sulfur atoms at the C1
and C2 positions of cPMP. This reaction is performed by a heterotetramer MPT synthase
complex that is formed by a central MoaE dimer and two MoaD subunit positioned at each
MoaE side37
. The last step is the incorporation of the metal into the MPT. This reaction
requires the participation of the trimeric MogA protein which binds MPT with high affinity
and mediates the ligation between MPT and Mo in vitro38,39
. In humans, defects in the
biosynthesis of Moco can leads to profound neurologic abnormalities in neonates40
.

General Introduction
10
HNN
N
N
O
OP
OP
OP
O-
OHHO
O
-O
OO
-O-O
O
H2N GTP
HN
N NH
HN
O
O
P
O
H2N
O O
O
O-
MoaA/MoaC
cPMP
MoaD/MoaEMoeB
IscS-SH
HN
N NH
HN
OH2N
O
O
P
SH
SH
O-
O
O-
Molybdopterin (MPT)
MogAMoeAMoO4
2-
HN
N NH
HN
OH2N
O
O
P
O-
O
O-
S
MoS
O
O
Cys
Molybdenum cofator (Moco)
Figure I.4. The three steps of molybdenum cofactor biosynthesis
In bacteria from Desulfovibrio genus the role of molybdate uptake via mod
operon is not elucidated yet. However, the conserved genome characteristic of modABC
transporter is present in Desulfovibrio species genome (NCBI Gene ID 2795627) whereas
there is no report about the mechanisms of molybdate transport in SRB. Conversely, it is
known that some Mo proteins from D. gigas, D. africanus and D.salaxigens have been
Chapter I
11
isolated and characterized 41,42,43,44
. Such an example is the Orange Protein (ORP) that
presents a Mo-Cu-S cluster. Of the utmost importance was the recent characterization of the
structural instability of the ORP cofactor and the gene transcriptional regulation of orp
from D. vulgaris Hildenborough. In this context, the protein locus tag (called DVU2108)
that shares 48% of identity with ORP was identified. DVU2108 is regulated by a 54
transcriptional factor and, in conjunction with other enzymes, may play a role in cell
division is SRB45,46
. Additionally, some studies showed that Mo is an important metal in
Desulfovibrio formate dehydrogenase (FHD) and mod gene expression47,48
. In this way, Mo
is capable to upregulate the Mo/W-fdh gene expression whereas downregulate the genes
responsible for Mo transport. The Mo/W-fdh gene codifies a FDH that incorporate Mo or W
in its structure. Moreover, isoforms of FDH, such as FdhABC3, present specific behavior
and the incorporation of Mo ion into the active site of FDH is selective.
The discovery of a molybdenum response associated protein (MorP) led to the
hypothesis that this protein could be involved in a Mo homeostasis. MorP is a periplasmic
homomultidimer (16-18 subunit) of high molecular mass (260 13kDa). The authors
suggested that each homodimer sharing a Mo-2S-[2Fe-2S]-2S-Mo cluster and therefore
MorP can carry up to 16 Mo atoms per protein. The genomic analysis revealed a putative
σ54 promoter, a putative sensor (Dde_0110), and putative regulator (Dde_0109), all located
upstream of morP. A blast search showed that MorP exhibits 40% of similarity with ZraP,
which is present in Desulfovibrio vulgaris Hildenborough genome. qRT-PCRshowed that
expression of Dde_0109 was up-regulated when molybdenum was present during bacterial
growth. Based on these results, a mechanism of Mo homeostasis was proposed. It predicts
that, in the presence of Mo, the TCS present upstream of morP gene might be responsible
for its transcriptional activation. In this way, the MorS (the putative sensor protein located
at periplasmic membrane) senses the Mo present in the periplasmic space leading to MorS
autophosphorylation. Then the phosphoryl group is transferred to MorR (the putative
cognate response regulator) leading to its activation. Once MorR is activated, it is allowed
to interact with 54 promoter sequence in order to activate the transcription of morP
gene(figure I.5)49

General Introduction
12
Figure I. 5.Model for transcriptional activation of morP gene under control of a 54 two component system.
The two component signaling proteins are among the most prevalent bacterial
genes and are easily identified by sequence homology. Bacterial genomes analysis revealed
that the total number of two component genes per genome is proportional to genome size
and ecological niches preferences. Therefore, two component systems is one most abundant
in genomes of gram-negative bacteria and cyanobacteria50
.
I.2. Introduction of TCS
Bacteria have the ability to occupy a broad range of habitats, from soil to
human intestine. Changes in osmolarity, nitrogen or carbon sources are some of the
common environment fluctuations that bacteria face during development, as a response to
these changes in the course of bacteria evolution; a mechanism of adaptation called TCS
was selected. TCS allows the bacteria to sense and respond quickly to environmental
stimuli in order to survive. In this way, a signal transduction system composed by a sensor
and a response regulator represents a prototypical form of TCS51
.

Chapter I
13
I.2.1. Sensor
The sensor, a component of TCS, is a dimeric histidine kinase (HK) protein
responsible for sensing the environmental stimuli. A prototypical HK consists of three
domains: a membrane associated sensor domain which recognizes the extracellular signals
(Sensor), a cytoplasmic transmitter domain responsible for dimerization and histidine
phosphotransfer (DHp), and a catalytic and ATP binding (CA) domain52
(figure I.6). This
prototype pursues the sensor domain as an extracellular loop located between two
membrane-spanning segments. The DHp and CA domain forms the transmitter domain
which is more conserved among bacterial response regulators and may reflect a common
mechanism of output interection53
.
Figure I. 6.Prototypic form of two component system. The histidine kinase (HK) senses the environmental
stimuli (input signal), autophosphorylates, then transfer the phosphoryl group to the cognate response
regulator (RR). Adapted from Richard C. Stewart (2010) Curr. Pin. Microbiol, 13: 133-141
In spite of the architecture similarities between HK, the sensor domain shows
specific structural variability which relies on its capacity to undergoes a variable input
signal perception54
. The sensor domain can deviate from the prototypical extracellular
profile to membrane-embedded or intracellular type. The extracellular model has as the
main representative the proteins PhoQ, DcuS and CitA which sense divalent ions such as
Mg2+
, C4-dicarboxylates and citrate respectively (figure I.7 a). The triad is also called PDC
sensors and is characterized by a long N-terminal α-helix region with a central five-strand
antiparallel β-sheet scaffold. The central β-sheet share similarities with PAS domain, but

General Introduction
14
each one preserves its own functional characteristic55–57
. As an example of a membrane-
embedded sensor, Rhodopsin II (SRII) lacks the prototypical extracellular domain and the
transmembrane segment is involved in signal perception (figure I.7b). SRII is a retinylidene
protein that forms a complex with the transducer HtrII (halobacterial transducer of
rhodopsin II) in order to regulated cell flagelar motor response through binding and
modulating the activity of the CheA (a chemotaxis HK)58–60
. In this way, CheA controls the
phosphorylation status of CheY, a cytoplasmic flagellar mortor switch regulator. The
combination between SRII-HtrII complex and CheY-CheA avoid photo-oxidative damage
under sunlight exposure in the presence of oxygen61
. Some sensor proteins can be entirely
cytoplasmic, such as NtrB (figure I.7c). Others are cytoplasmic but membrane anchored:
the cytoplasmic sensor domain can be found at N-terminal before the first transmembrane
domain or after the second transmembrane domain (figure I.7d)52
. In spite of the
cytoplasmic sensor domain localization, all of them adopt a PAS fold. PAS is a family of
signaling proteins that exhibit five stranded anti-parallel β-sheet core flanked by α-helices.
The intracellular sensor can be exemplified by FixL that exhibit a heme-binding-PAS
domain that senses O2 in Rhizobium meliloti and participates in nitrogen fixation62
.
Figure I.7. The diversity of HK sensor proteins. a) PDC sensors where the extracellular domain senses the
stimuli, b) HtrII-SrII where the sensor domain is membrane embedded, c) NtrB is a free cytoplasmic sensor
domain, d) FixL is a membrane anchored that exhibit a cytoplasmic sensor domain with a PAS folding.

Chapter I
15
In bacteria, serine, tyrosine, threonine, histidine and aspartic acid residues are
the preferable sites for phosphorylation63–65
. However, the TCS pursue its own specificity
for phosphorylation of the histidine residue in the sensor HK and for the acid aspartic
residue in the RR. Upon activation, the HK undergoes phosphorylation of a conserved
histidine residue at its DHp domain. This autokinase activity is a conserved characteristic of
sensor proteins. After phosphorylation, the phosphoryl group is selectively transferred to an
acid aspartic residue (D) localized in the cognate response regulator (RR). In this way, this
system works in conjunction via specific protein-protein interaction between the HK and
RR using three different strategies: the molecular recognition (the inborn capacity of the
HK to recognize the cognate RR), the phosphatase activity (the HK dephosphorylate the
cognate RR) and the substrate competition (the cognate RR competes for phosphorylated
HK)66
. Under the absence of an input stimulus, the HK is capable to drive in vitro
dephosphorylation of its cognate RR, resetting or limiting the cross-talk67
.
I.2.2. Response regulator (RR)
Once the sensor protein of the TCS is phosphorylated, the phosphoryl group is
transferred to a conserved D residue, located at the receiver domain of cognate RR. The
phosphorylation of the RR drives a conformational change that induces its output response.
However, the N-terminal receiver domain is not an inert partner in phosphotransfer. In fact,
it has enzymatic activity catalyzing the phospho transfer from phospho His of HK to its
own D residue. The phosphotransfer mediated by HK is not mandatory, and small
molecules containing high energy phosphoryl groups can serve as phosphodonors (e.g.
acetyl phosphate, carbamoyl phosphate and phosphoramidate) in in vitro reactions.
Moreover, the RR has autophosphatase activity and regulates its own dephosphorylation.
The modulation of the C-terminal effector domain is so far the most important activity
known of the N-terminal regulatory domain68,69
All the RR proteins share a fundamentally similar strategy. They couple
phosphorylation to regulation. Still, the mechanisms of regulation themselves are varied,
and the diversity of effectors domains create a variety of output signals. 17% of prokaryotic
RR exists as a single receiver regulator (REC) domain, as exemplified by CheY family.
Members of the CheY family contain a conserved aspartic acid residue, corresponding to

General Introduction
16
D57 in CheY, and a conserved lysine residue, corresponding to L10970
. Beyond the
phosphorylation coupled to signal transduction, CheY lysine acetylation have been reported
in vitro and in vivo and this post-translation modification inhibit the binding between CheY
to CheA (the HK), CheZ (phosphatase) and FliM (flagellar motor switch protein)71,72
. The
majority of RR (63%) binds to DNA (e.g. OmpR, NarL, AgrA and NtrC) and the output
response is associated with transcriptional activation or repression. The remaining RR are
diverse and can associated with several functions, such as protein/ligand binding (CheW),
enzymatic activity (PleD), RNA binding (AmiR)73
.
I.2.2.1.TCS RR and DNA binding
The majority of RRs contain a C-terminal tri-helical helix-turn-helix (HTH)
DNA binding domain or a variation (e.g. winged helix-turn-helix (wHTH), four-helix helix-
turn-helix (4HTH), factor of inversion helix-turn-helix (Fis-HTH) and an atypical form
called LytTR domain) (figure I.8)74,75,76,77
.
Figure I. 8.Diversity of the C-terminal domain between the DNA binding regions of examples of response
regulators. In red: the REC is the common N-terminal receiver domain. In blue: the NtrC central AAA+
ATPase domain. In green: the C-terminal DNA binding domain.
The tri-helical domain is a simple structure that is complementary to the
structure of B-DNA. It has a conserved recognition region where the 2nd
and 3rd
helices
form the HTH (figure I.9). The HTH was the first DNA-recognition motif discovered, and
includes a great number of DNA binding proteins, such as: Catabolic Activation Protein
(CAP), LacI, 434 repressor, Trp repressor and Fis protein78,79
.

Chapter I
17
Figure I. 9.HTH motif and DNA interaction.Taken from Carl O. Pabo (1992) Annu. Rev. Biochem, 61, 1053-
1095.
I.3. Prokaryotic gene expression and regulation
In order to comprehend how RR protein acts, it’s important to understand some
basic concepts of gene regulation in bacteria. Gene transcription begins with the copying of
a segment of DNA into RNA, and in bacteria gene expression is frequently regulated at this
level. The RNA polymerase (RNAP) is the enzyme responsible for gene transcription. The
E.coli RNAP core is constituted by a complex (α2) that forms a stable complex in the
presence or absence of DNA80
. Bacteria contain just one form of RNAP. The structure of
bacterial E.coli and Thermus aquaticus RNAP showed conserved features and both
resembles as a “crab claw” where β and β subunits forms the two pincers, the α subunit
forms a dimer and the constitutes the smallest subunit that is associated primary with the
β subunits (figure I.10). Moreover, RNAP requires Mg2+
for catalytic activity 81,82
. RNAP
is incapable of initiate transcription, but the α subunit can recognize promoter elements and
participates in the initial steps of RNAP assembly83,84
. Additionally, the α subunit consist
of two independent domains: an N-terminal domain (α-NTD) and a C-terminal domain (α-
CTD) that are connected by a flexible linker where the α-CTD is capable of dimerization
and DNA binding85,86
.

General Introduction
18
Figure I. 10 Structural organization of each subunit of bacterial core RNAP and the holoenzyme: β (magenta),
β (yellow), α NTD (green/cyan), (pink) and (orange).Taken from Tamaswati Ghosh et al., (2010) FEBS
Microbiol Rev, 34, 611-627.
The specificity of RNAP is determined by a small key element called sigma ()
which carries the major determinant for promoter recognition87
. The 70 and 54 are the
main subunits used by RNAP for transcription initiation. The 70 is a large family of
factors phylogenetically formed by fours groups88,89
. The 70 in E.coli belongs to group 1
(the housekeeping ) and in conjunction with RNAP binds at promoter DNA sequences90
.
The 70 is formed by fours structural domains (1.1, 2, 3 and 4) where 1.1 controls
the DNA binding and 2, 3 and 4 recognize the -10 and -35 conserved boxes82,91,92
.
The term holoenzyme is used to identify the complex formed by the core RNAP
and the factor. Both holoenzymes form a stable closed complex, and the difference
between them is that RNAP70 enables immediate transcription initiation, while the
RNAP54 requires mechano-transcriptional activator proteins. The latter holoenzyme uses

Chapter I
19
ATP hydrolysis to drive a DNA conformational change essential for transcription
initiation93
.
Transcription is divided into three steps: initiation, elongation and termination.
The general aspects of transcription initiation involve the binding of the holoenzyme to a
promoter sequence. This initial structure, named closed complex, is converted to an open
complex in which a localized separation of the two DNA strands occurs. This exposes the
bases of the coding strand, enabling the base pairing of the ribonucleoside triphosphates
(NTP) for synthesis of the RNA. The first phosphodiester bound is formed and the factor
dissociates from the complex. From this point forward, the core enzyme alone is required
for extension of the RNA strand until reaching a termination signal when the mRNA and
the RNAP are released93
.
I.3.1.Housekeeping 70 and transcriptional factors
The interaction between the housekeeping RNAP70 and transcriptional factors
is the base for the discernment between transcription activation and repression.
Transcriptional factors can be classified as activators or repressors according to their
interaction with RNAP and promoters. In the next section, some examples illustrate the
main factors involved in transcriptional regulation by activators and repressors proteins.
I.3.1.1. Transcription activation
A particular activator molecule binding at a bacterial target promoter constitutes
the simplest state for RNAP70 transcription initiation. This mechanism acts by stabilizing
the RNAP70-promoter complex or by accelerating the open complex formation94
.
The stability of RNAP70-promoter complex can be exemplified by the MerR
protein that belongs to mercury-resistence transposon Tn501. The Tn501 contains the mer
operon which is divergently transcribed and is formed by genes for Hg detection, transport,
mobilization and enzymatic detoxification, such as merR, merD, merP, merT and merA,
respectively95,96
. The MerR protein exhibit transcriptional plasticity once negatively
controls its own synthesis and also regulates either positively (in the presence of Hg) or
negatively (in the absence of Hg) the mer genes97
. The nonoptimal space (19bp) between -
10 and -35 promoter create a barrier for RNAP70 initialization, since the -10 element is

General Introduction
20
misplaced, hindering the interaction with the subunit. The MerR transcriptional regulator
causes a twist in the spacer producing a conformation change that allows transcription
initiation by RNAP70 (figure I.11)98–100
.
Figure I. 11.Mechanism of RNAP complex stability mediated by an activator protein.Adapted from David J.
Lee (2012) Annu. Rev. Microbiol, 66: 125-152
The bacteriophage cI protein is another example of how transcriptional
regulators orchestrate its function in order to make efficient transition between the lytic and
lysogenic cycles. The cI is primary a homodimer transcriptional repressor of the lytic
promoters. A cooperative binding between pair of dimers occurs through CTD contact
when cI is bound to DNA and this feature improves a strong repression101–103
. During
lysogen, preventing transcription of lytic genes and continuous maintenance of cI are
important. For constant cI production, a direct contact between the cI and 4 subunit of
RNAP holoenzyme may occur and this interaction induces the cI own transcriptional
expression by the open complex formation104–106
. The cI binds to a target DNA, either
upstream of or overlapping the -35 element and the residues E34 and D38 interact with the
4 subunit. The studies involving cI protein and RNAP70 showed that activation occurs
when both partners are bound to DNA105
(figure I.12).

Chapter I
21
Figure I. 12. Mechanism of RNAP open complex formation mediated by an activator protein. Adapted from
David J. Lee (2012) Annu. Rev. Microbiol, 66: 125-152
I.3.2.The 54 regulation
The 54 recognize promoter sequences usually located at position -24 and -12
relative to the transcriptional +1 start site. The main characteristic of RNAP54 is the
inability to open the double strand DNA to form the open complex required for
transcription initiation given that they depend on activator proteins, ATPases, members of
the AAA+ family. The ATP hydrolysis provide the energy needed to RNAP54 holoenzyme
to isomerize from closed to open promoter complex.107
I.3.2.1. NtrC
The studies about NtrC (nitrogen regulatory protein C) provide a good source
of information about how RNAP54 interacts with transcription factors. The well
characterized promoter glnA of enteric bacteria is recognized by RNAP54 holoenzyme.
The glnA gene encodes a Glutamine Synthetase (Glns) and the transcription from glnA
promoter occurs by the activated NtrC in response to nitrogen starvation108
. The NtrC from
E. coli is one example of a transcriptional mechano-activator protein that interacts with
RNAP54 to prompt gene transcription109
. NtrC binds to DNA located ~80 to 150
nucleotides upstream from the promoter they control (figure I.13, A) and, upon
phosphorylation, it contacts RNAP54 by looping out the intermediary DNA (figure I.13,
B). This process is facilitated by IHF (integration host factor) protein, which stimulates the
DNA-bending110
.

General Introduction
22
Figure I. 13.Mechanism of RNAP54 transcriptional activation mediated by NtrC protein.
The NtrC is composed by three domains: a N-terminal receiver domain, a
central AAA+ ATPase domain, and a C-terminal Fis DNA binding domain. The
unphosphorylated inactive form of NtrC is a dimer in solution and is able to bind DNA and
ATP. NtrC has a conserved aspartate (D54) residue at the receiver domain, which is
phosphorylated by NtrB (HK). Upon phosphorylation, NtrC is active as an oligomer,
coupling the ATP hydrolysis to the formation of open complexes with RNAP54111
. The
central domain of NtrC has two conserved sequences responsible for ATP binding and
hydrolysis: the Walker A (GX4GKT/S) and Walker B (h4DE). Magnesium is essential to
ATP binding and its absence results in fivefold decrease of affinity of NtrC to ATP112
. The
conserved GAFTGA motif senses the conformation adopted by the transcriptional
activator. It interacts with the 54 in order to form the transcriptional open complex113
. The
conserved R-finger might be involved in the intersubunit catalysis and ATP sensing. The
oligomerization status constitutes a modulatory manner for ATPase activity. The central
AAA+ domain is fused to HTH, the last belonging to Fis family. As previous described, Fis
proteins constitute the simplest architecture of DNA binding structure and are responsible
for induction of DNA bending 114
.

Chapter I
23
The bacterial TCS developed many strategies to maintain the abundance of
proteins. RR have the ability to function as activators and/or repressors, and have the
capacity to control their own transcriptional level. The self-control of transcription is well
characterized among RR that participate in TCS circuit115,116
.
As stated above, the NtrC controls the glnA promoter in response to low levels
of nitrogen in bacteria. The glnA codifies the Glutamine synthetase (GlnS) which is
important during bacteria growth because it is capable to converting glutamate to glutamine
in medium containing low concentration of ammonia117,118
. The ntrB/ntrC constitutes the
TCS circuit for nitrogen assimilation in bacteria119,120
. Those genes are organized as operon
as shown in figure I.14. The operon is formed by glnA, ntrB and ntrC loci and contains
three promoters: glnAp1, glnAp2 and glnLP. The last is responsible for the unique
autoregulation of TCS by NtrC. NtrC shows an ability to control the expression of the
operon by interaction with RNAP70 and RNAP54. This interaction is not randomly
organized and occurs according to nitrogen environmental oscillation. The glnAp1 and
glnLP are weak promoters used by the RNAP70 for transcription initiation108
. This
mechanism is capable to maintain a basal level of transcription of glnA, ntrB and ntrC
during bacteria growth in nitrogen favorable conditions. On the other hand, the glnAP2
promoter is required in response to nitrogen deprivation. This promoter is recognized by
RNAP54 which is considered an alternative way for transcription121
. In the absence of
nitrogen source, the activated (phosphorylated) form of NtrC binds to glnAP2 which is
allowed to initiate transcription by RNAP54 to enhance gnlA, ntrB and ntrC transcription
level122
. The NtrB (the sensor) is responsible for NtrC activation. NtrB activity
(phosphatase and kinase) is modulated by GlnB. GlnB is a protein regulated by small
molecules that senses the nitrogen status. In the absence of nitrogen source, GlnB disinhibit
the NtrB which is capable to autophosphorylate and transfer the phosphoryl group to NtrC.
Then, the phosphorylated NtrC activates the transcription at glnAP2 promoter. The inactive
state of NtrC binds to glnAP1 and glnLP and acts as a repressor deactivating the operon and
returning to basal level of transcription123
.

General Introduction
24
Figure I.14. ntrC/ntrB TCS regulating glnA transcription for nitrogen fixation in bacteria.
I.3.2.2. CpxRA
The CpxRA in E.coli constitute a typical TCS that display a variety of
physiological roles (pilus biogenesis124,125
, induction of expression of heat shock protein
126,127, iron transport
128, virulence
129 and biofilm formation
130). Screening tests for
identification of CpxR (the RR) action indicate that this protein regulates diverse
physiological activities in bacteria, such as motility, pathogenesis, envelope protein folding
and copper stress response131,132
.However, the bacterial envelope stress response is the
main function attributed to CpxRA133,134
. The cpxRA operon is formed by cpxA and cpxR,
consisting of a sensor histidine kinase (CpxA) and a cytoplasmic response regulator
(CpxR). The CpxA autophosphorylate in response to envelope stress and transfer the
phosphoryl group to CpxR135
. Adjacent to cpxRA operon, the cpxP gene is divergently
transcribed and is controlled by the activated (phosphorylated) form of CpxR136
.This
activated CpxR binds to the intergenic region between cpxP and cpxA (consensus sequence
5GTAAN(6-7)GTAA) and, in conjunction with RpoS (a 38), controls its own promoter
transcriptional level 137
. Moreover, the genetic circuit adopted by cpxRA operon can be
repressed by overproduction of CpxP leading to down regulation of the Cpx pathway. This

Chapter I
25
repression is mediated by the CpxA sensor domain which is inhibited by CpxP in the
absence of stress conditions138,139
. CpxP is a periplasmic protein formed by 147 amino
acids residues. The CpxP is involved in a variety of cell stress response, such as spheroplast
formation, and might be involved in monitoring the periplasmic protein folding, acting as a
chaperone140–142
. Recently, the crystal structure of CpxP was solved and the protein
presents as a positively charged α-helical dimer. CpxP contain a conserved LTXXQ motif
which may be important for the protein function given that mutations at this site can cause
structure perturbation and disrupt the Cpx inhibitory pathway143
. A general mechanism of
Cpx pathway is presented in figure I.15.
Figure I.15. Mechanism of cpx regulation during envelope stress response.
I.3.2.3. ZraSR
The ZraSR is another prototypical bacterial TCS formed by a sensor histidine
kinase (ZraS) and a response regulator (ZraR) which activates the transcription of zraP
gene in response to high concentration of Zn2+
and Pb2+
.This system was previous related
with the genes responsible for hydrogenase 3 formation, given that its location was

General Introduction
26
positioned upstream of hydL gene144
. The genes zraSR and zraP are divergently transcribed
(figure I.16). The ZraR is the transcriptional regulator that binds to the intergenic region
between zraS and zraP. Their gene expression requires the presence of 54 in vivo and two
possible 54 binding sites were identified for zraSR and zraP promoters regions. In the
absence of metal, a basal level of transcription was verified for zraS gene suggesting the
presence of a constitutive 70 promoter145
. The zraSR TCS is not well comprehended but
have been associated with Salmonella infection and its intrinsic Zn2+
/ Pb2+
tolerance have
been used to design cell based biosensors sensible to these metals146,147
. The ZraP, also
known as YJAI, is a predicted monomer with a molecular mass of 13.5kDa with affinity to
zinc, cobalt and cadmium. However, ZraP exhibit more affinity to Zn2+
and its
transcriptional level is highly activated in the presence of this metal, characterizing ZraP as
an essential protein involved in the bacterial zinc tolerance148,149
.ZraP is a periplasmic
protein that forms higher-order structure (15 ZraP monomers) in the presence of ZnCl2 and
acts as a chaperone that suppresses the thermal aggregation of proteins in the presence of
zinc. Moreover, ZraP is a member of bacterial Cpx family and acts as a repressor of ZraSR
activity150
.
Figure I.16. zraP and zraRS genes involved in Zn2+
and Pb2+
tolerance in bacteria.
The ZraR follows the same domain architecture of NtrC: a REC, a central and a DNA
binding domain. Until now, the full length structure of ZraR wasn’t solved. Nevertheless, the
structure of the central and CTD was determinate by crystallography. The central domain of ZraR
presented as a hexameric ring typical of AAA+ proteins and the DNA binding domain presented as
a dimer (figure I.17). The hexameric structure was observed in the presence of different nucleotides
implying that nucleotides play an important role for ZraR oligomerization. The GAFTGA motif was
observed at the tip of the L1 loop, near to the hexameric pore and biochemical evidences showed
that mutations at this motif usually abolish the interaction between the transcriptional factors and
54151
.

Chapter I
27
Figure I.17. The crystal strucuture of ZraR. The central (C) and DNA binding domain (D) are highlighted.
Adapted from Matheus Rappas et al., (2007) Curr. Opin. Struct. Biol., 17: 110-116
I.3.2.4. torRTS system
Negative autoregulation seems to be less common among TCS but can be
represented by the torRTS system involved in the E.coli trimethylamine N-oxide (TMAO)
respiratory circuit. E.coli is a facultative anaerobe microorganism that can use TMAO (an
organic compound widespread in nature) as an alternative electron acceptor for bacterial
anaerobic respiration152
.The tor system is formed by two divergent operons: the torRTS and
torCAD (figure I.18). The torRTS codifies a response regulator (TorR), a periplasmic
protein (TorT) and a sensor histidine kinase (TorS) forming a phosphorelay cascade
responsible for TMAO regulation 153,154
. The torCAD codifies a c-type cytochrome (TorC),
a TMAO-terminal reductase (TorA) and a TorA chaperone (TorD)155
. The torCAD operon
is under the control of the presence TMAO. TMAO binds to the TorT which induces its
conformational change leading to TorT interaction with TorS. This action is accompanied
by the TorS activation156
. The TorS is formed by a N-terminal detector region anchored
toward the periplasm, a transmitter cytoplasmic domain with three phosphorylation sites
and by an alternative transmitter domain involved in phosphotransfer to the response

General Introduction
28
regulator TorR157
. The TorR (active and inactive forms) binds to torR-torC intergenic
region at four direct repeats called tor boxes dictating the action of the RR: as a negative
autoregulator if TorR binds to box 1 and 2 and as a torCAD activator if binds to box 3 and
4. The negative autoregulation occurs because TorR overlaps the -10 transcription start site
thus inhibiting the access by the RNAP158
. The active form of TorR enhances the
transcriptional level of torCAD operon. Therefore, in the presence of TMAO the torCAD is
codified. The pentahaemic c-type cytochrome TorC is involved in electron transfer to
TorA. TorA is a periplasmic molybdopterin responsible for performing the reduction of
TMAO in trimethyllamine (TMA), a volatile compound. The incorporation of molybdenum
cofactor into TorA occurs at cytoplasm and is important to the translocation of TorA to the
periplasm159
. This maturation process involve the chaperone activity of TorD and the TorA
translocation requires the Twin Arginin Translocation (TAT) system160,161
.
Figure I.18. The torRTS and torCAD system.

Chapter I
29
I.4. Hypothesis of the present study
MorP is a protein that may be involved with molybdenum homeostasis in
Desulfovibrio alaskensis G2049
. In order to understand how morPRS genes are regulate, our
study aims to elucidate if the putative regulator codified by Dde_0109 (morR) binds to the
intergenic region between Dde_0110 (morS) and Dde_0111 (morP). This study comprises
an application of some DNA-protein interactions techniques associated with genetic and
protein bioinformatics analysis which tried to elucidate how MorR could act as a
transcriptional regulatory protein involved in Mo homeostasis in D. alaskensis G20.
Interaction with small phosphodonors as protein phosphorylate agents were also
investigated.

General Introduction
30
I.5. References
1. Zhou, J. et al. How sulphate-reducing microorganisms cope with stress: lessons from
systems biology. Nat. Rev. Microbiol. 9, 452–66 (2011).
2. Alm, E., Huang, K. & Arkin, A. The evolution of two-component systems in
bacteria reveals different strategies for niche adaptation. PLoS Comput. Biol. 2, e143
(2006).
3. Muyzer, G. & Stams, A. J. M. The ecology and biotechnology of sulphate-reducing
bacteria. Nat. Rev. Microbiol. 6, 441–54 (2008).
4. He, Q. et al. Energetic consequences of nitrite stress in Desulfovibrio vulgaris
Hildenborough, inferred from global transcriptional analysis. Appl. Environ.
Microbiol. 72, 4370–81 (2006).
5. Mukhopadhyay, A. et al. Cell-wide responses to low-oxygen exposure in
Desulfovibrio vulgaris Hildenborough. J. Bacteriol. 189, 5996–6010 (2007).
6. Mukhopadhyay, A. et al. Salt stress in Desulfovibrio vulgaris Hildenborough: an
integrated genomics approach. J. Bacteriol. 188, 4068–78 (2006).
7. Coulter, E. D. & Kurtz, D. M. A role for rubredoxin in oxidative stress protection in
Desulfovibrio vulgaris: catalytic electron transfer to rubrerythrin and two-iron
superoxide reductase. Arch. Biochem. Biophys. 394, 76–86 (2001).
8. Heather L. Lumppio, Neeta V. Shenvi, Anne O. Summers, G. V. and D. M. K. J.
Rubrerythrin and rubredoxin oxidoreductase in Desulfovibrio vulgaris: a novel
oxidative stress protection system. J. Bacteriol. 183, 2970 (2011).
9. Javaherdashti, R. Impact of sulphate-reducing bacteria on the performance of
engineering materials. Appl. Microbiol. Biotechnol. 91, 1507–17 (2011).
10. Castro, H., Williams, N. & Ogram, A. Phylogeny of sulfate-reducing bacteria. FEMS
Microbiol. Ecol. 31, 1–9 (2000).
11. Hauser, L. J. et al. Complete genome sequence and updated annotation of
Desulfovibrio alaskensis G20. J. Bacteriol. 193, 4268–9 (2011).
12. Karlin, S., Brocchieri, L., Mrázek, J. & Kaiser, D. Distinguishing features of delta-
proteobacterial genomes. Proc. Natl. Acad. Sci. U. S. A. 103, 11352–7 (2006).
13. Meyer, B. et al. Variation among Desulfovibrio species in electron transfer systems
used for syntrophic growth. J. Bacteriol. 195, 990–1004 (2013).
Chapter I
31
14. Li, X., McInerney, M. J., Stahl, D. a & Krumholz, L. R. Metabolism of H2 by
Desulfovibrio alaskensis G20 during syntrophic growth on lactate. Microbiology
157, 2912–21 (2011).
15. Das, A. K., Chakraborty, R., Cervera, M. L. & de la Guardia, M. A review on
molybdenum determination in solid geological samples. Talanta 71, 987–1000
(2007).
16. Sandell, P. K. K. and E. B. Geochemistry of molybdenum. Geochim. Cosmochim.
Acta 6, 35–63 (1954).
17. Helz, G. R., Bura-Nakić, E., Mikac, N. & Ciglenečki, I. New model for molybdenum
behavior in euxinic waters. Chem. Geol. 284, 323–332 (2011).
18. Williams, R. J. P. & Fraústo da Silva, J. J. R. The involvement of molybdenum in
life. Biochem. Biophys. Res. Commun. 292, 293–9 (2002).
19. Mendel, R. R. Molybdenum: biological activity and metabolism. Dalton Trans.
3404–9 (2005).
20. Hille, R., Nishino, T. & Bittner, F. Molybdenum enzymes in higher organisms.
Coord. Chem. Rev. 255, 1179–1205 (2011).
21. Campo, R. J., Araujo, R. S. & Hungria, M. Molybdenum-enriched soybean seeds
enhance N accumulation, seed yield, and seed protein content in Brazil. F. Crop.
Res. 110, 219–224 (2009).
22. Chatt, J. Molybdenum in nitrogen fixation. J. Less Common Met. 36, 429–435
(1974).
23. Grunden, a M. & Shanmugam, K. T. Molybdate transport and regulation in bacteria.
Arch. Microbiol. 168, 345–54 (1997).
24. Schwarz, G., Mendel, R. R. & Ribbe, M. W. Molybdenum cofactors, enzymes and
pathways. Nature 460, 839–47 (2009).
25. Rech, S. et al. Regulation of the molybdate transport operon , modABCD , of
Escherichia coli in response to molybdate availability. J. Bacteriol. 177, 1023–1029
(1995).
26. Imperial, J., Hadi, M. & Amy, N. K. Molybdate binding by ModA, the periplasmic
component of the Escherichia coli mod molybdate transport system. Biochim.
Biophys. Acta 1370, 337–46 (1998).
27. Rech, S., Wolin, C. & Gunsalus, R. P. Properties of the periplasmic ModA
molybdate-binding protein of Escherichia coli. J. Biol. Chem. 271, 2557–62 (1996).

General Introduction
32
28. Maupin-Furlow, J. A. et al. Genetic analysis of the modABCD (molybdate transport)
operon of Escherichia coli. J. Bacteriol. 177, 4851–6 (1995).
29. Hollenstein, K., Frei, D. C. & Locher, K. P. Structure of an ABC transporter in
complex with its binding protein. Nature 446, 213–6 (2007).
30. Grunden, a M., Ray, R. M., Rosentel, J. K., Healy, F. G. & Shanmugam, K. T.
Repression of the Escherichia coli modABCD (molybdate transport) operon by
ModE. J. Bacteriol. 178, 735–44 (1996).
31. Anderson, L. a et al. Characterisation of the molybdenum-responsive ModE
regulatory protein and its binding to the promoter region of the modABCD
(molybdenum transport) operon of Escherichia coli. Eur. J. Biochem. 246, 119–26
(1997).
32. Johnson, J. L., Hainline, B. E. & Rajagopalan, K. V. Characterization of the
molybdenum cofactor of sulfite oxidase, xanthine, oxidase, and nitrate reductase.
Identification of a pteridine as a structural component. J. Biol. Chem. 255, 1783–6
(1980).
33. Dove, K. &. Novel cofactors. 474 (2001). at <Elsevier>
34. Schwarz, G. & Mendel, R. R. Molybdenum cofactor biosynthesis and molybdenum
enzymes. Annu. Rev. Plant Biol. 57, 623–47 (2006).
35. Hänzelmann, P. & Schindelin, H. Crystal structure of the S-adenosylmethionine-
dependent enzyme MoaA and its implications for molybdenum cofactor deficiency
in humans. Proc. Natl. Acad. Sci. U. S. A. 101, 12870–5 (2004).
36. Wuebbens, M. M., Liu, M. T., Rajagopalan, K. & Schindelin, H. Insights into
molybdenum cofactor deficiency provided by the crystal structure of the
molybdenum cofactor biosynthesis protein MoaC. Structure 8, 709–18 (2000).
37. Rudolph, M. J., Wuebbens, M. M., Rajagopalan, K. V & Schindelin, H. Crystal
structure of molybdopterin synthase and its evolutionary relationship to ubiquitin
activation. Nat. Struct. Biol. 8, 42–6 (2001).
38. Liu, M. T., Wuebbens, M. M., Rajagopalan, K. V & Schindelin, H. Crystal structure
of the gephyrin-related molybdenum cofactor biosynthesis protein MogA from
Escherichia coli. J. Biol. Chem. 275, 1814–22 (2000).
39. Nichols, J. D. & Rajagopalan, K. V. In vitro molybdenum ligation to molybdopterin
using purified components. J. Biol. Chem. 280, 7817–22 (2005).
40. Hospital, C. et al. Molybdenum cofactor deficiency. J. Pediatr. 123, 93–96 (1993).

Chapter I
33
41. George, G. N. et al. A Novel Protein-Bound Copper−Molybdenum Cluster. J. Am.
Chem. Soc. 122, 8321–8322 (2000).
42. Bursakov, S. a et al. Antagonists Mo and Cu in a heterometallic cluster present on a
novel protein (orange protein) isolated from Desulfovibrio gigas. J. Inorg. Biochem.
98, 833–40 (2004).
43. Hatchikian, E. C. & Bruschi, M. Isolation and characterization of a molybdenum
iron-sulfur protein from Desulfovibrio africanus. Biochem. Biophys. Res. Commun.
86, 725–34 (1979).
44. Czechowski, M. et al. Purification and characterization of three proteins from a
halophilic sulfate-reducing bacterium,Desulfovibrio salexigens. J. Ind. Microbiol. 1,
139–147 (1986).
45. Fiévet, A. et al. The anaerobe-specific orange protein complex of Desulfovibrio
vulgaris hildenborough is encoded by two divergent operons coregulated by σ54 and
a cognate transcriptional regulator. J. Bacteriol. 193, 3207–19 (2011).
46. Maiti, B. K. et al. Rearrangement of Mo-Cu-S Cluster Reflects the Structural -
Instability of Orange Protein Cofactor. Zeitschrift für Anorg. und Allg. Chemie 639,
1361–1364 (2013).
47. Mota, C. S. et al. Effects of molybdate and tungstate on expression levels and
biochemical characteristics of formate dehydrogenases produced by Desulfovibrio
alaskensis NCIMB 13491. J. Bacteriol. 193, 2917–23 (2011).
48. Da Silva, S. M., Pimentel, C., Valente, F. M. a, Rodrigues-Pousada, C. & Pereira, I.
a C. Tungsten and molybdenum regulation of formate dehydrogenase expression in
Desulfovibrio vulgaris Hildenborough. J. Bacteriol. 193, 2909–16 (2011).
49. Rivas, M. G. et al. Molybdenum induces the expression of a protein containing a
new heterometallic Mo-Fe cluster in Desulfovibrio alaskensis. Biochemistry 48,
873–82 (2009).
50. Capra, E. J. & Laub, M. T. Evolution of two-component signal transduction systems.
Annu. Rev. Microbiol. 66, 325–47 (2012).
51. Uldis N. Streips & Ronald E. Yasbin. Modern Microbial Genetics, 1st Edition. 0,
(Wiley-Liss, Inc., 2002).
52. Stewart, R. C. Protein histidine kinases: assembly of active sites and their regulation
in signaling pathways. Curr. Opin. Microbiol. 13, 133–41 (2010).
53. Nixon, T. & Ausubel, F. M. Conserved Domains in Bacterial Regulatory Proteins
That Respond to Environmental Minireview Stimuli. Cell 49, 579–581 (1988).

General Introduction
34
54. Krell, T. et al. Bacterial sensor kinases: diversity in the recognition of environmental
signals. Annu. Rev. Microbiol. 64, 539–59 (2010).
55. Cheung, J., Bingman, C. A., Reyngold, M., Hendrickson, W. A. & Waldburger, C.
D. Crystal structure of a functional dimer of the PhoQ sensor domain. J. Biol. Chem.
283, 13762–70 (2008).
56. Cheung, J. & Hendrickson, W. A. Crystal structures of C4-dicarboxylate ligand
complexes with sensor domains of histidine kinases DcuS and DctB. J. Biol. Chem.
283, 30256–65 (2008).
57. Sevvana, M. et al. A ligand-induced switch in the periplasmic domain of sensor
histidine kinase CitA. J. Mol. Biol. 377, 512–23 (2008).
58. Hoff, W. D., Jung, K. H. & Spudich, J. L. Molecular mechanism of photosignaling
by archaeal sensory rhodopsins. Annu. Rev. Biophys. Biomol. Struct. 26, 223–58
(1997).
59. Sasaki, J. & Spudich, J. L. The transducer protein HtrII modulates the lifetimes of
sensory rhodopsin II photointermediates. Biophys. J. 75, 2435–40 (1998).
60. Gordeliy, V. I. et al. Molecular basis of transmembrane signalling by sensory
rhodopsin II-transducer complex. Nature 419, 484–7 (2002).
61. Spudich, J. L. Variations on a molecular switch: transport and sensory signalling by
archaeal rhodopsins. Mol. Microbiol. 28, 1051–8 (1998).
62. Reyrat, J. M., David, M., Blonski, C., Boistard, P. & Batut, J. Oxygen-regulated in
vitro transcription of Rhizobium meliloti nifA and fixK genes. J. Bacteriol. 175,
6867–72 (1993).
63. Prisic, S. et al. Extensive phosphorylation with overlapping specificity by
Mycobacterium tuberculosis serine/threonine protein kinases. Proc. Natl. Acad. Sci.
U. S. A. 107, 7521–6 (2010).
64. Cluzel, M.-E. et al. The Staphylococcus aureus autoinducer-2 synthase LuxS is
regulated by Ser/Thr phosphorylation. J. Bacteriol. 192, 6295–301 (2010).
65. Ge, R. et al. Phosphoproteome analysis of the pathogenic bacterium Helicobacter
pylori reveals over-representation of tyrosine phosphorylation and multiply
phosphorylated proteins. Proteomics 11, 1449–61 (2011).
66. Podgornaia, A. I. & Laub, M. T. Determinants of specificity in two-component
signal transduction. Curr. Opin. Microbiol. 16, 156–62 (2013).

Chapter I
35
67. Kenney, L. J. How important is the phosphatase activity of sensor kinases? Curr.
Opin. Microbiol. 13, 168–76 (2010).
68. Lukat, G. S., McCleary, W. R., Stock, a M. & Stock, J. B. Phosphorylation of
bacterial response regulator proteins by low molecular weight phospho-donors. Proc.
Natl. Acad. Sci. U. S. A. 89, 718–22 (1992).
69. Masayori Inouye, R. D. Histidine kinase in signal transduction, 1st Edition.
(Elsevier Inc., 2002).
70. Lukat, G. S., Lee, B. H., Mottonen, J. M., Stock, a M. & Stock, J. B. Roles of the
highly conserved aspartate and lysine residues in the response regulator of bacterial
chemotaxis. J. Biol. Chem. 266, 8348–54 (1991).
71. Yan, J., Barak, R., Liarzi, O., Shainskaya, A. & Eisenbach, M. In vivo acetylation of
CheY, a response regulator in chemotaxis of Escherichia coli. J. Mol. Biol. 376,
1260–71 (2008).
72. Liarzi, O. et al. Acetylation represses the binding of CheY to its target proteins. Mol.
Microbiol. 76, 932–43 (2010).
73. Gao, R. & Stock, A. M. Biological insights from structures of two-component
proteins. Annu. Rev. Microbiol. 63, 133–54 (2009).
74. Galperin, M. Y. Structural classification of bacterial response regulators: diversity of
output domains and domain combinations. J. Bacteriol. 188, 4169–82 (2006).
75. Sidote, D. J., Barbieri, C. M., Wu, T. & Stock, A. M. Structure of the
Staphylococcus aureus AgrA LytTR domain bound to DNA reveals a beta fold with
an unusual mode of binding. Structure 16, 727–35 (2008).
76. Baikalov, I. et al. Structure of the Escherichia coli response regulator NarL.
Biochemistry 35, 11053–61 (1996).
77. Nikolskaya, A. N. & Galperin, M. Y. A novel type of conserved DNA-binding
domain in the transcriptional regulators of the AlgR/AgrA/LytR family. Nucleic
Acids Res. 30, 2453–9 (2002).
78. Pabo, C. O. & Sauer, R. T. Transcription factors: structural families and principles of
DNA recognition. Annu. Rev. Biochem. 61, 1053–95 (1992).
79. Aravind, L., Anantharaman, V., Balaji, S., Babu, M. M. & Iyer, L. M. The many
faces of the helix-turn-helix domain: transcription regulation and beyond. FEMS
Microbiol. Rev. 29, 231–62 (2005).

General Introduction
36
80. Kansara, S. G. & Sukhodolets, M. V. Oligomerization of the E. coli core RNA
polymerase: formation of (α2ββ’ω)2-DNA complexes and regulation of the
oligomerization by auxiliary subunits. PLoS One 6, e18990 (2011).
81. Zhang, G. et al. Crystal Structure of Thermus aquaticus Core RNA Polymerase at
3.3 A° Resolution. Cell 98, 811–824 (1999).
82. Murakami, K. S. X-ray crystal structure of Escherichia coli RNA polymerase σ70
holoenzyme. J. Biol. Chem. 288, 9126–34 (2013).
83. Ross, W. et al. A third recognition element in bacterial promoters: DNA binding by
the alpha subunit of RNA polymerase. Science 262, 1407–13 (1993).
84. Kimura, M. & Ishihama, a. Functional map of the alpha subunit of Escherichia coli
RNA polymerase: insertion analysis of the amino-terminal assembly domain. J. Mol.
Biol. 248, 756–67 (1995).
85. Blatter, E. E., Ross, W., Tang, H., Gourse, R. L. & Ebright, R. H. Domain
organization of RNA polymerase alpha subunit: C-terminal 85 amino acids
constitute a domain capable of dimerization and DNA binding. Cell 78, 889–96
(1994).
86. Jeon, Y. H., Yamazaki, T., Otomo, T., Ishihama, a & Kyogoku, Y. Flexible linker in
the RNA polymerase alpha subunit facilitates the independent motion of the C-
terminal activator contact domain. J. Mol. Biol. 267, 953–62 (1997).
87. Murakami, K. S., Masuda, S., Campbell, E. a, Muzzin, O. & Darst, S. a. Structural
basis of transcription initiation: an RNA polymerase holoenzyme-DNA complex.
Science 296, 1285–90 (2002).
88. Lonetto, M., Gribskov, M. & Gross, C. a. The sigma 70 family: sequence
conservation and evolutionary relationships. J. Bacteriol. 174, 3843–9 (1992).
89. Lonetto, M. a, Brown, K. L., Rudd, K. E. & Buttner, M. J. Analysis of the
Streptomyces coelicolor sigE gene reveals the existence of a subfamily of eubacterial
RNA polymerase sigma factors involved in the regulation of extracytoplasmic
functions. Proc. Natl. Acad. Sci. U. S. A. 91, 7573–7 (1994).
90. Paget, M. S. B. & Helmann, J. D. The 70 family of sigma factors. Genome Biol. 4,
1–6 (2003).
91. Murakami, K. S., Masuda, S. & Darst, S. a. Structural basis of transcription
initiation: RNA polymerase holoenzyme at 4 A resolution. Science 296, 1280–4
(2002).

Chapter I
37
92. Vassylyev, D. G. et al. Crystal structure of a bacterial RNA polymerase holoenzyme
at 2.6 A resolution. Nature 417, 712–9 (2002).
93. Jeremy W. Dale, S. P. Molecular Genetics of Bacteria. (2004).
94. Lee, D. J., Minchin, S. D. & Busby, S. J. W. Activating transcription in bacteria.
Annu. Rev. Microbiol. 66, 125–52 (2012).
95. Brown, N. L., Ford, S. J., Pridmore, R. D. & Fritzinger, D. C. Nucleotide sequence
of a gene from the Pseudomonas transposon Tn501 encoding mercuric reductase.
Biochemistry 22, 4089–95 (1983).
96. Mathema, V. B., Thakuri, B. C. & Sillanpää, M. Bacterial mer operon-mediated
detoxification of mercurial compounds: a short review. Arch. Microbiol. 193, 837–
44 (2011).
97. Lund, P. a, Ford, S. J. & Brown, N. L. Transcriptional regulation of the mercury-
resistance genes of transposon Tn501. J. Gen. Microbiol. 132, 465–80 (1986).
98. Lund, T. P., Brown, N. & Sciences, M. Up-promoter mutations in the positively-
regulated mer promoter of Tn501. Nucleic Acids Res. V, (1989).
99. Ansari, A. Z., Chael, M. L. & O’Halloran, T. V. Allosteric underwinding of DNA is
a critical step in positive control of transcription by Hg-MerR. Nature 355, 87–9
(1992).
100. Brown, N. L., Stoyanov, J. V, Kidd, S. P. & Hobman, J. L. The MerR family of
transcriptional regulators. FEMS Microbiol. Rev. 27, 145–163 (2003).
101. Maurer, R., Meyer, B. & Ptashne, M. Gene regulation at the right operator (OR)
bacteriophage lambda. I. OR3 and autogenous negative control by repressor. J. Mol.
Biol. 139, 147–61 (1980).
102. Jack Griffith, A. H. & M. P. DNA loops induced by cooperative binding of lambda
repressor. Nature 322, 750–752 (1986).
103. Bell, C. E., Frescura, P., Hochschild, a & Lewis, M. Crystal structure of the lambda
repressor C-terminal domain provides a model for cooperative operator binding. Cell
101, 801–11 (2000).
104. Meyer, B. J. & Ptashne, M. Gene regulation at the right operator (OR) of
bacteriophage lambda. III. lambda repressor directly activates gene transcription. J.
Mol. Biol. 139, 195–205 (1980).
105. Li, M., Moyle, H. & Susskind, M. M. Target of the transcriptional activation
function of phage lambda cI protein. Science 263, 75–7 (1994).

General Introduction
38
106. Nickels, B. E., Dove, S. L., Murakami, K. S., Darst, S. a. & Hochschild, A. Protein–
Protein and Protein–DNA Interactions of σ70 Region 4 Involved in Transcription
Activation by λcI. J. Mol. Biol. 324, 17–34 (2002).
107. Ghosh, T., Bose, D. & Zhang, X. Mechanisms for activating bacterial RNA
polymerase. FEMS Microbiol. Rev. 34, 611–27 (2010).
108. Hirschman, J., Wong, P. K., Sei, K., Keener, J. & Kustu, S. Products of nitrogen
regulatory genes ntrA and ntrC of enteric bacteria activate glnA transcription in
vitro: evidence that the ntrA product is a sigma factor. Proc. Natl. Acad. Sci. U. S. A.
82, 7525–9 (1985).
109. Wedel, A. & Kustu, S. The bacterial enhancer-binding protein NTRC is a molecular
machine: ATP hydrolysis is coupled to transcriptional activation. Genes Dev. 9,
2042–2052 (1995).
110. Shingler, V. Signal sensory systems that impact σ54
-dependent transcription. FEMS
Microbiol. Rev. 35, 425–40 (2011).
111. Rappas, M., Bose, D. & Zhang, X. Bacterial enhancer-binding proteins: unlocking
sigma54-dependent gene transcription. Curr. Opin. Struct. Biol. 17, 110–6 (2007).
112. Rombel, I. et al. MgATP binding and hydrolysis determinants of NtrC, a bacterial
enhancer-binding protein. J. Bacteriol. 181, 4628–38 (1999).
113. Dago, A. E., Wigneshweraraj, S. R., Buck, M. & Morett, E. A role for the conserved
GAFTGA motif of AAA+ transcription activators in sensing promoter DNA
conformation. J. Biol. Chem. 282, 1087–97 (2007).
114. Fu, C.-C. et al. Fis-protein induces rod-like DNA bending. Chem. Phys. Lett. 500,
318–322 (2010).
115. Bijlsma, J. J. E. & Groisman, E. a. Making informed decisions: regulatory
interactions between two-component systems. Trends Microbiol. 11, 359–366
(2003).
116. Goulian, M. Two-component signaling circuit structure and properties. Curr. Opin.
Microbiol. 13, 184–9 (2010).
117. DAVID M. ROTHSTEIN, GREG PAHEL, BONNIE TYLER*, A. B. M. Regulation
of expression from the glnA promoter of Escherichia coli in the absence of
glutamine synthetase. Proc. Natl. Acad. Sci. U. S. A. 77, 7372–7376 (1980).
118. Kim, M. et al. Need-based activation of ammonium uptake in Escherichia coli. Mol.
Syst. Biol. 8, 616 (2012).

Chapter I
39
119. NANCY MCFARLAND, LINDA MCCARTER, STANLEY Awrz, A. S. K.
Nitrogen regulatory locus “glnR” of enteric bacteria is composed of cistrons ntrB
and ntrC: Identification of their protein products. Proc. Natl. Acad. Sci. U. S. A. 78,
2135–2139 (1981).
120. THOMAS P. HUNT AND BORIS MAGASANIK. Transcription of glnA by
purified Escherichia coli components: Core RNA polymerase and the products of
glnF, gLnG, and glnL. Proc. Natl. Acad. Sci. U. S. A. 82, 8453–8457 (1985).
121. Sabine K. Vogel, A. S. and K. R. Binding affinity of Escherichia coli RNA
polymerase sigma54 holoenzyme for the glnAp2, nifH and nifL promoters. Nucleic
Acids Res. 30, 4094–4101 (2002).
122. Ninfa, A. J. & Magasanik, B. Covalent modification of the ginG product , NRI , by
the glnL product , NRII , regulates the transcription of the glnALG operon in
Escherichia coli. Proc. Natl. Acad. Sci. U. S. A. 83, 5909–5913 (1986).
123. L J Reitzer, B. M. Expression of glnA in Escherichia coli is regulated at tandem
promoters. Proc. Natl. Acad. Sci. U. S. A. 82, 1979–1983 (1985).
124. Raivio, T. L. & Silhavy, T. J. The sigmaE and Cpx regulatory pathways: overlapping
but distinct envelope stress responses. Curr. Opin. Microbiol. 2, 159–65 (1999).
125. Hung, D. L., Raivio, T. L., Jones, C. H., Silhavy, T. J. & Hultgren, S. J. Cpx
signaling pathway monitors biogenesis and affects assembly and expression of P pili.
EMBO J. 20, 1508–18 (2001).
126. Hunke, S. & Betton, J.-M. Temperature effect on inclusion body formation and
stress response in the periplasm of Escherichia coli. Mol. Microbiol. 50, 1579–1589
(2003).
127. Danese, P. N. & Silhavy, T. J. The sigma(E) and the Cpx signal transduction systems
control the synthesis of periplasmic protein-folding enzymes in Escherichia coli.
Genes Dev. 11, 1183–93 (1997).
128. Cao, J., Woodhall, M. R., Alvarez, J., Cartron, M. L. & Andrews, S. C. EfeUOB
(YcdNOB) is a tripartite, acid-induced and CpxAR-regulated, low-pH Fe2+
transporter that is cryptic in Escherichia coli K-12 but functional in E. coli O157:H7.
Mol. Microbiol. 65, 857–75 (2007).
129. Jubelin, G. et al. CpxR/OmpR interplay regulates curli gene expression in response
to osmolarity in Escherichia coli. J. Bacteriol. 187, 2038–49 (2005).
130. Dorel, C., Vidal, O., Prigent-Combaret, C., Vallet, I. & Lejeune, P. Involvement of
the Cpx signal transduction pathway of E. coli in biofilm formation. FEMS
Microbiol. Lett. 178, 169–175 (1999).

General Introduction
40
131. De Wulf, P., McGuire, A. M., Liu, X. & Lin, E. C. C. Genome-wide profiling of
promoter recognition by the two-component response regulator CpxR-P in
Escherichia coli. J. Biol. Chem. 277, 26652–61 (2002).
132. Price, N. L. & Raivio, T. L. Characterization of the Cpx regulon in Escherichia coli
strain MC4100. J. Bacteriol. 191, 1798–815 (2009).
133. Pogliano, J., Lynch, A. S., Belin, D., Lin, E. C. & Beckwith, J. Regulation of
Escherichia coli cell envelope proteins involved in protein folding and degradation
by the Cpx two-component system. Genes Dev. 11, 1169–1182 (1997).
134. Rowley, G., Spector, M., Kormanec, J. & Roberts, M. Pushing the envelope:
extracytoplasmic stress responses in bacterial pathogens. Nat. Rev. Microbiol. 4,
383–94 (2006).
135. Raivio, T. L. & Silhavy, T. J. Transduction of envelope stress in Escherichia coli by
the Cpx two-component system. J. Bacteriol. 179, 7724–33 (1997).
136. Danese, P. N. & Silhavy, T. J. CpxP, a stress-combative member of the Cpx regulon.
J. Bacteriol. 180, 831–9 (1998).
137. De Wulf, P., Kwon, O. & Lin, E. C. The CpxRA signal transduction system of
Escherichia coli: growth-related autoactivation and control of unanticipated target
operons. J. Bacteriol. 181, 6772–8 (1999).
138. Raivio, T. L., Popkin, D. L. & Silhavy, T. J. The Cpx envelope stress response is
controlled by amplification and feedback inhibition. J. Bacteriol. 181, 5263–72
(1999).
139. Zhou, X. et al. Structural basis for two-component system inhibition and pilus
sensing by the auxiliary CpxP protein. J. Biol. Chem. 286, 9805–14 (2011).
140. Raivio, T. L., Laird, M. W., Joly, J. C. & Silhavy, T. J. Tethering of CpxP to the
inner membrane prevents spheroplast induction of the cpx envelope stress response.
Mol. Microbiol. 37, 1186–97 (2000).
141. Digiuseppe, P. A. & Silhavy, T. J. Signal Detection and Target Gene Induction by
the CpxRA Two-Component System. 185, 2432–2440 (2003).
142. Ruiz, N. & Silhavy, T. J. Sensing external stress: watchdogs of the Escherichia coli
cell envelope. Curr. Opin. Microbiol. 8, 122–6 (2005).
143. Thede, G. L. et al. Structure of the periplasmic stress response protein CpxP. J.
Bacteriol. 193, 2149–57 (2011).

Chapter I
41
144. Stoker K, Reijnders WN, Oltmann LF, S. A. Initial cloning and sequencing of
hydHG, an operon homologous to ntrBC and regulating the labile hydrogenase
activity in Escherichia coli K-12. J. Bacteriol. 171, 4448–4456 (1989).
145. Leonhartsberger, S., Huber, A., Lottspeich, F. & Bo, A. The hydH / G Genes from
Escherichia coli Code for a Zinc and Lead Responsive Two-component Regulatory
System. J. Mol. Biol. 4, 93–105 (2001).
146. Huang, Y., Leming, C. L., Suyemoto, M. & Altier, C. Genome-wide screen of
Salmonella genes expressed during infection in pigs, using in vivo expression
technology. Appl. Environ. Microbiol. 73, 7522–30 (2007).
147. Wang, B., Barahona, M. & Buck, M. A modular cell-based biosensor using
engineered genetic logic circuits to detect and integrate multiple environmental
signals. Biosens. Bioelectron. 40, 368–76 (2013).
148. Noll, M. Identification of a Novel Transcription Regulator from Proteus mirabilis,
PMTR, Revealed a Possible Role of YJAI Protein in Balancing Zinc in Escherichia
coli. J. Biol. Chem. 273, 21393–21401 (1998).
149. Ravikumar, S., Yoo, I., Lee, S. Y. & Hong, S. H. A study on the dynamics of the
zraP gene expression profile and its application to the construction of zinc adsorption
bacteria. Bioprocess Biosyst. Eng. 34, 1119–26 (2011).
150. Appia-Ayme, C. et al. ZraP is a periplasmic molecular chaperone and a repressor of
the zinc-responsive two-component regulator ZraSR. Biochem. J. 442, 85–93 (2012).
151. Bordes, P. et al. The ATP hydrolyzing transcription activator phage shock protein F
of Escherichia coli : Identifying a surface that binds sigma 54. Proc. Natl. Acad. Sci.
U. S. A. 100, 2278–83 (2003).
152. Unden G, B. J. Alternative respiratory pathways of Escherichia coli: energetics and
transcriptional regulation in response to electron acceptors. Biochim. Biophys. Acta
1320, 217–234 (1997).
153. Simon, G., Méjean, V., Jourlin, C., Chippaux, M. & Pascal, M. C. The torR gene of
Escherichia coli encodes a response regulator protein involved in the expression of
the trimethylamine N-oxide reductase genes. J. Bacteriol. 177, 275 (1995).
154. Jourlin C, Simon G, Pommier J, Chippaux M, M. V. The periplasmic TorT protein is
required for trimethylamine N-oxide reductase gene induction in Escherichia coli. J.
Bacteriol. 178, 1219–1223 (1996).
155. Méjean, V. et al. TMAO anaerobic respiration in Escherichia coli: involvement of
the tor operon. Mol. Microbiol. 11, 1169–79 (1994).

General Introduction
42
156. Baraquet, C. et al. TorT, a member of a new periplasmic binding protein family,
triggers induction of the Tor respiratory system upon trimethylamine N-oxide
electron-acceptor binding in Escherichia coli. J. Biol. Chem. 281, 38189–99 (2006).
157. Jourlin, C., Ansaldi, M. & Méjean, V. Transphosphorylation of the TorR response
regulator requires the three phosphorylation sites of the TorS unorthodox sensor in
Escherichia coli. J. Mol. Biol. 267, 770–7 (1997).
158. Ansaldi, M., Simon, G., Lepelletier, M., Méjean, V. & Simon, N. The TorR High-
Affinity Binding Site Plays a Key Role in Both torR Autoregulation and torCAD
Operon Expression in Escherichia coli. J. Bacteriol. 182, 961 (2000).
159. Santini, C. L. et al. A novel sec-independent periplasmic protein translocation
pathway in Escherichia coli. EMBO J. 17, 101–12 (1998).
160. Pommier, J., Méjean, V., Giordano, G. & Iobbi-Nivol, C. TorD, a cytoplasmic
chaperone that interacts with the unfolded trimethylamine N-oxide reductase enzyme
(TorA) in Escherichia coli. J. Biol. Chem. 273, 16615–20 (1998).
161. Dalbey, R. E. & Robinson, C. Protein translocation into and across the bacterial
plasma membrane and the plant thylakoid membrane. Trends Biochem. Sci. 24, 17–
22 (1999).

Chapter II
43
morR gene, cloning and MorR expression

morR gene, cloning and MorR expression
44

Chapter II
45
morR gene, cloning and MorR expression
Context
In order to obtain the putative regulator MorR for biochemical characterization, the gene
Dde_0109 was cloned using a pET system. Then, the recombinant plasmid was isolated and
the competent cells BL21 (DE3) were transformed. This method provides advantages for
protein purification toward native protein expression, such as: high growth rates of E.coli
joined with high percentage of their total protein as the expressed gene product and control
of the gene transcription. Finally, the protein was expressed as soluble form which enables
subsequent protein purification. Moreover, the genetic context of morR gene is also present
in this chapter. Therefore, the analysis revealed that this gene shares high similarities with
other response regulators that belong to two component system that are present in Gram-
negative bacteria. Moreover, morR is located downstream of morS (a putative histidine
kinase sensor) and morP gene (previously associated with Mo homeostasis). The
bioinformatics analysis of the intergenic region between morS and morP revealed the
presence of divergent conserved boxes that may be associated with the genetic control of
the entire system via 70 and 54.

morR gene, cloning and MorR expression
46

Chapter II
47
II.1. Methodology
II.1.1 Molecular cloning of morR
Genetic engineering techniques were applied in order to obtain a recombinant
plasmid carrying the morR gene from D.alaskensis G20. The gene was amplified, cloned
on pET expression-vector and transformed into different E.coli competent cells used first
for plasmid multiplication (Nova Blue Giga Single Competent Cells, Novagen) and after
for gene transcription induction (BL21 (DE3) Competent Cells, Nzytech).
II.1.1.1 Cloning vector characteristic
The pET system is a set of cloning vectors capable of maintaining a gene under
the control of a strong bacteriophage T7 promoter. The gene transcription is induced by T7
RNA polymerase. T7 RNA polymerase needs to be provided by the hosted cell, and the
expression is induced by Isopropyl β-D-1-thiogalactopyranoside (IPTG)1.
The pET-21c was chosen as cloning vector for this study, since it fulfills some
principal prerequisites: it has the correct insert size and cloning sites, it is easy to handle
and available in our laboratory. The map of pET-21c is presented in figure II.1.
Figure II. 1. pET21C cloning vector. A: the cloning vector map. Ap: ampicillin resistance. Ori: origin of
replication. lacI: lac repressor. T7 lac: 25bp lac operator sequence. f1 origin: bacteriophage origin of
replication, and restriction sites are presented. B: The cloning/ expression region is evidenced. Adapted from
Novagen pet-21-a-d (+) and Novagen 2002-2003 Catalog chapter 5.

morR gene, cloning and MorR expression
48
II.1.1.2 DNA restriction mapping
The morR gene is composed by 1401 nucleotides. A restriction map of morR
was created using a bioinformatic tool available at NEBcutter V.2.0
(http://tools.neb.com/NEBcutter2/). This online program compares the target DNA
sequence with E.coli genetic code, and performs a screening for all NEB (New England
Biolabs) restriction enzymes. The restriction map evaluation acts as an exclusion criterion,
showing which restriction enzyme cut the target gene.
For pET-21c, the NdeI is the preferable restriction enzyme to start the cloning
procedure given that its restriction site is located immediately downstream of the ribosome
binding site (rbs) (figure II.1). However, for experimental approaches, the use of NdeI was
banished once the restriction map (Figure II.2) showed that this enzyme can also cut the
morR gene sequence. For that reason, the NheI was selected as the first enzyme to start the
cloning procedure. However, this experimental selection predicted the creation of three
additional amino acids in the N-terminal of the MorR sequence: one methionine, one
alanine and one serine. The evaluation of the possibilities of cloning using the pET21c
allowed the selection of NheI and EcoRI as restriction enzymes for morR cloning.
Figure II. 2. Restriction map for morR gene obtained from NEBcutter. The scale bar represents the number of
nucleotides (1401bp) of morR from Desulfovibrio alaskensis G20, and on the top the correspondent number
of aminoacids residues (466 aa). The display below the scale shows the single cutter restriction enzymes sites
for this gene sequence. Sites show in red have blunt ends, blue have 5` extensions and green 3` extensions.
Enzymes marked with * are susceptible to DNA methylation.

Chapter II
49
II.1.1.3 DNA amplification
A pair of oligonucleotides (table II.1) was designed based on morR DNA
sequence. Flanking regions containing the restriction sites for NheI and EcoRI were added.
Table II. 1. Primers designed for PCR reaction. Primer orientation, sequence and restriction endonuclease site
are shown. Restriction sites are underlined in the primer sequence.
The primers were resuspended in deionized water according to manufacturer`s
instruction, and the PCR reaction was carried out using a High Fidelity PCR Enzyme Mix
(Fermentas) with some modification to the manufacturer`s procedure (table II.2).
Table II. 2. The PCR protocol for morR gene amplification. The PCR mixture was designed for a total
reaction volume of 20 µl.
Reagent Final concentration/or volume
10X High Fidelity PCR buffer with 15mM MgCl2 1x/2.5μL
DNTP mix, 1mM each 0.27mM each
Forward primer 0.27μM
Reverse primer 0.27μM
Template genomic DNA 10pg – 1μg
High Fidelity PCR Enzyme 0.5 units
Deionized water up to 20 μL
The PCR was performed using a MyCycler thermal cycling instrument
(BioRad). The experimental conditions are schematically represented in figure II.3.
Primer orientation Sequence Restriction
enzyme
Forward 5’ AGGAGCTAGCATGACAAACGCTCC3’ NheI
Reverse 5’ GGCCGAATTCTTATTCCATGCCGT 3’ EcoRI

morR gene, cloning and MorR expression
50
Figure II.3. Scheme of the PCR cycle conditions. PCR thermal and time cycling are schematically
represented.
II.1.1.4 Vector and fragment digestion with restriction enzymes
The expression vector pET-21c and PCR fragment containing morR were used
as template for digestion with NheI and EcoRI endonuclease enzymes in order to create
cohesive flanking regions. The digestion was performed in 1X Buffer Tango™
(Fermentas), and 16 units of each restriction enzyme were added sequentially. The total
reaction time was 4h (2 hours for each enzyme) at 37ºC (table II.3). The product of
reaction was then purified using NZY gel pure (Nzytech), and visualized in 1% agarose gel.
Table II. 3. pET-21c and morR PCR fragment preparation with restriction enzymes. Amplified morR PCR
product and pET-21c were digested with endonuclease enzymes NheI and EcoRI as follows.
II.1.1.5 Vector and insert ligation
The vector and insert ligation was performed using Rapid DNA Ligation Kit
(Roche) according to the manufacturer’s instruction. The ratio of expression vector to insert
was 1:3, e.g. 50 ng linearized plasmid plus 150 ng insert DNA. Vector and insert were
mixed in 1X DNA Dilution Buffer, and then incubated with T4 DNA Ligation Buffer and
T4 DNA Ligase for 30 minutes at room temperature.
Reagent pET-21c PCR fragment
Nuclease- free water 5 μL 15 μL
10X Buffer Tango TM
4 μL 4 μL
Sample 30μL (1μg/μl) 20μL (0.5 μg/μl)
NheI 16 units 16 units
2 hoursat 37ºC
EcoRI 16 units 16 units
2 hoursat 37ºC

Chapter II
51
The Nova Blue Giga Single Competent cells were immediately transformed
with the recombinant plasmid. According to a standard protocol, the cells were thawed on
ice, and 1µL of the plasmidial DNA was added. The mixture was incubated on ice for 5
min, heated during 30 sec in a 42ºC water bath and incubated on ice for 2 min more; and
250 µL of Super Optimal Broth (SOC) medium were then added. The cells grew for 1 h,
spread in Luria Broth (LB) agarose plate supplemented with ampicillin (100 µg/ml), and
grew overnight at 37ºC. Five colonies were selected. They were used as DNA template for
PCR using the primers that amplify for morR (table II.1). This procedure confirmed the
presence of morR gene in the plasmid.
The PCR positive colonies were isolated, and grown overnight in 5ml of LB
medium supplemented with ampicillin (100 µg/ml). The plasmids were extracted from
competent cells using a small-scale extraction kit from Nzytech. The 5ml of bacterial
growth were centrifuged at 11.000 rpm, the pellet was lysed with buffer A1 (a Tris-EDTA
Buffer, but the concentration is not provided by the manufacturer), centrifuged, the
supernatant was then loaded into a spin column and centrifuged for 1 min at 11.000 rpm.
The spin columns were washed with buffer AY (a mixture of guanidine hydrochloride with
ethanol, but the concentration is not provided by the manufacturer), dried, and the plasmids
were eluted with buffer AE (a solution of water). Finally, the plasmids were visualized in
1% agarose gel. An aliquot of 20μl (100ng/µl) of each plasmid was analyzed by DNA
sequencing reaction in order to evaluate if the cloning had succeed. The sequencing was
carried out using T7 promoter primer (5'-TAATACGACTCACTATAGGG-3') and T7
terminator primer (5'-GCTAGTTATTGCTCAGCGG-3'), using the BigDye Terminator 3
(Applied Biosystems) The reaction product was purified by gel filtration and resolved in an
ABI 3730XL sequencer. The resulting sequences were analyzed in order to identify its
correctness and the conserved nucleotide sequences from the vector that are important for
protein expression , such as the ribosome binding site (rbs) and T7 promoter, that could
result from the cloning process. The cloning and transformation steps are represented in
figure II.4.

morR gene, cloning and MorR expression
52
Figure II.4. Main principal steps of morR gene cloning. A) pET-21c (+) and PCR fragment containing morR
gene with the recognition sites for NheI (in red) and EcoRI (in purple). B) pET-21c (+) and PCR fragment
containing morR gene after digestion protocol exhibiting the cohesive overhangs produced. C)recombinant
plasmid carrying morR gene after ligation, and subsequent plasmid transformation on Giga Blues competent
cells. D)recombinant bacterial colonies in LB agar plate, isolation, and plasmid extraction and purification.
II.1.2 Protein expression
II.1.2.1 Small scale protein expression and optimization
The Bl21 (DE3) competent cells (Nzytech) was transformed with the
recombinant plasmid, pETMorR, according to the manufacturer`s protocol with some
modifications. 1µL of the recombinant plasmid DNA (0.2 to 50ng DNA) was added to 25
µL of competent cells, and the mixture was incubated on ice for 30 minutes. The cells were
submitted to a heat shock treatment for 40 seconds at 42ºC in water bath, and subsequently
incubated on ice for 2 minutes. 113µL of SOC Medium was added, and the cells grew for 1
hour, at 37ºC, on an orbital shaker at 225 rpm. After this period, 50 µl of the transformed
Chapter II
53
cells were spread on LB agar plates containing 100µg/ml ampicillin, and incubated
overnight at 37ºC.
A well separated colony was selected, picked-up and submitted to growth in
25ml of LB medium supplemented with 100 µg/ml ampicillin in order to obtain a pre-
inoculum. The pre-inoculum grew overnight at 37ºC, with agitation (225 rpm).
The small scale protein expression was optimized taking into account three
different parameters: the optical density at 600nm (OD600) (0.5 and 1.0), the IPTG
concentration (0, 0.5 and 1 mM) and time of induction (zero hour, 4 hours and overnight).
The log phase of bacterial cells growth is the ideal stage to induce protein expression, and
OD600 around 0.5 to 1.5 is a good range of choice. The IPTG concentration should be also
optimized, since its concentration needs to be maintained along the experiment.
The experiment was performed by inoculating 1ml of the pre-inoculum in 100
ml of LB medium (100 µg/ml ampicillin). After inoculation, the cells grew at 37ºC, in an
orbital shaker at 225 rpm, until the OD600 reached 0.5. An aliquot of 5ml was collected
immediately before induction (time zero hour). The cells were induced with 0, 0.5 and 1
mM of IPTG. For each tested conditions, an aliquot of 5ml was collected and stored at 4ºC
after 4 hours and overnight period. The same procedure was performed when cells reached
an OD600 of 1.0 (figure II.5).

morR gene, cloning and MorR expression
54
Figure II.5..Small scale MorR expression. The MorR expression was optimized according to the experimental
conditions: the optical density at 600nm (OD600) (0.5 and 1.0), the IPTG concentration (0, 0.5 and 1 mM) and
time (T) of induction (zero hours, 4 hours and overnight).
In order to adjust the amount of bacterial cells present in each different aliquot,
the values of OD600 were normalized for 1.2, and this procedure allowed protein expression
visualization by Sodium Dodecyl Sulfate-Polyacrilamide Gel Electrophoresis (SDS-
PAGE). The cells were centrifuged at 14.000 rpm for 10 minutes; the pellet was
resuspended in 40μl of SDS sample buffer, and boiled for 8 min. An aliquot of 5μl was then
analyzed by SDS-PAGE in 12.5% acrylamide gels.
II.1.2.2 Large scale protein expression
In order to obtain amounts of protein enabling MorR purification the cells were
grown in large scale. A single colony was selected from a plate containing the transformed
BL21 (DE3) cells carrying the recombinant plasmid pETMorR, and placed in 80 ml of LB
medium supplemented with 100µg/ml ampicillin to obtain a pre-inoculum. The pre-
inoculum grew overnight at 37ºC, in an orbital shaker at 225 rpm. A 10 ml sample of the
pre-inoculum was added to each 1 L of LB medium supplemented with 100µg/ml
ampicillin, until a total volume of 6 L. When cells reach an OD600nm of 1.0, 1 mM of IPTG

Chapter II
55
was added to induce heterologous morR transcription, and, consequently, protein
expression.
After an overnight growth period, the cells were harvested by centrifugation at
8.000 rpm for 16 min at 4°C, and after resuspended in 10mM Tris-HCl, pH 7.6 (3ml/g of
wet cells). The cells were thermally disrupted by rapid liquid nitrogen freezing and thawing
processes, followed by mechanical lysis by French-press at 28,000 psi. Proteolytic activity
was inhibited with EDTA-free Protease Inhibitor Cocktail (Roche), and DNase I from
bovine pancreas (Roche) was added to remove (undesirable) single and double strand
DNA. Unbroken cells and cell debris were removed by centrifugation at 8.000 rpm for 16
min at 4ºC.The soluble extract was obtained by ultracentrifugation at 44.000 rpm for 1h at
4ºC.
II.2. Results and Discussion
II.2.1 morR genomic context
Genomic analysis of D. alaskensis G20 revealed the presence of a putative
responsive regulatory protein codified by Dde_0109 gene, corresponding to morR, which is
formed by 1401 nucleotides (GI: 3758851)2 and is annotated in the genome as zraR, zinc
associated response regulator. A Blast search revealed that this gene shares common
features with other transcriptional regulatory genes present in different gram negative
bacteria (figure II.6).
The main characteristic of this type of transcriptional regulatory genes is the
genomic position and orientation which reveals the presence of surrounding genes
classically involved in signal transduction, and the divergent gene regulation profile. The
morR gene is conserved on Desulfovibrio genus, but also has a good similarity with other
regulatory genes (zraR) present in some pathogenic bacteria. A megablast search revealed
that morR shares 76% of sequence homology with transcriptional regulator zraR in
Desulfovibrio vulgaris str. Hildenborough, 72% with fis transcriptional regulators in
Desulfovibrio vulgaris str.`Miyazaki F` and 60% with three others zraR transcriptional
regulator present in Escherichia coli O127:H6 str. E2348/69; Shigellaflexneri 2a str. 301
and Salmonella entericaserovar Typhimurium LT2.

morR gene, cloning and MorR expression
56
The similarity arises on the fact that all these bacterial species are Gram-
negative (containing a periplasmic space), and the zraR gene is located downstream of a
sensor histidine kinase (zraS) and by a gene that codifies a periplasmic protein (zraP),
characterizing a type of gene rearrangement classically involved in TCS. This architecture
is in agreement with the idea that genes responsible for codifying regulatory proteins are
often situated near their target genes3. The general conservation of this type of gene
rearrangement among some gram negative bacteria could indicate ecological preferences
and biochemical signaling capacity under stress conditions4. Members of zraRSP TCS are
divergently transcribed from zraSP intergenic region, and are involved, primarily, with a
zinc associated response. ZraP is a periplasmic protein involved in envelope stress
response, metal homeostasis and acts as a chaperone5,6,7
.
Figure II.6. Genomic comparison and organization between morR and other similar response regulators in
different types of gram negative bacteria. The genes are represented by arrows and the arrow direction shows
the genomic orientation. The NCBI gene symbol is presented above and the description is inside the arrows.
To facilitate the comprehension of this study, the morR, morS and morP nomenclature isn’t following the
NCBI gene description. The scheme is organized according to megablast result taking into consideration the
percentage of similarity (76% for zraR from D. vulgaris H, 72% for fis from D.vulgaris MF and 60% for zraR
from E.coli O127:H6; Shigella F301 and S. Typhymurium LT2).

Chapter II
57
The morP gene (Dde_0111), annotated in the genome as zraP, was found to be
involved in Mo regulatory mechanisms in D.alaskensis G20;it is composed by 519
nucleotides2. According to NCBI datatabase, it codifies a putative zinc resistance-
associated protein composed by 172 amino acids residues (GI:78355158). This protein
contains a conserved CpxP domain identified in the amino acid sequence from residue 65 to
132. Proteins belonging to CpxP family have a periplasmic location, they are a part of TCS,
and act as a global modulator of cell-envelope stress in gram-negative bacteria8.
The morS gene (Dde_0110) is formed by 1779 nucleotides, and codifies a
putative histidine kinase (NtrB) containing 592 amino acids residues (GI: 78355157).
According to Simple Modular Architecture Research Tool (SMART, http://smart.embl-
heidelberg.de/), the translated sequence codifies a protein with five main conserved
regions: two transmembrane domains, one signal sensor PAS domain (Per, Arnt, Sim
superfamily), one HK A domain and one HK like ATPase domain. Proteins displaying this
type of secondary structure architecture may be acting as biological sensors, and are
involved in phosphorelay processes9.
DNA analysis of the intergenic region between morP and morS displayed the
presence of four putative promoters clustered in a double manner. Each cluster is composed
by two promoters sequences oriented in an opposite direction.
The first cluster region, called σ54-P, contains – 24 (GGCACG) and -12
(TTGC), (core consensus TGGCACG N4 TTGC)conserved promoters relative to the
predictive morP transcriptional +1 start2. These conserved sequences might be responsible
for σ54 binding. Likewise, a ribosome binding site (rbs) is present 4 nucleotides upstream of
morP gene.
The second cluster, called σ70-P, comprises -35 (TACACC) and -10
(GTATAAA) conserved boxes (core consensus TTGACA N17 TATAAT), that are located
upstream of the predictive morS transcriptional +1 start site. This second cluster was
identified by the Prediction of Bacterial Promoters (BProm) software, and is a putative σ70
binding site. Additionally, other conserved features compose this cluster, such as: a
conserved rbs situated five nucleotides upstream of morS gene, and a conserved 16 bp
spacer located between -35 and -1010,11,12
. A schematic overview on the genomic context
and intronic region between morP and morS is showed in figure II.7.

morR gene, cloning and MorR expression
58
CATTGCCGTCACCTTGCGTGTTCAATATTTGTACAGCGTCTATTTTTTATACAGTGCTTT
GTAACGGCAGTGGAACGCACAAGTTATAAACATGTCGCAGATAAAAAATATGTCACGAAA
TTCTCAAAGGTGTATGTTTTTTATACACTGACTTTCACTGTACTGTCCCGCTTCTGTGCA
AAGAGTTTCCACATACAAAAAATATGTGACTGAAAGTGACATGACAGGGCGAAGACACGT
TAACATGCCGGTTTGTTGTGCGATATTGCTTCATGTGCGTGTATGGCACGCCTGTTGCTC
ATTGTACGGCCAAACAACACGCTATAACGAAGTACACGCACATACCGTGCGGACAACGAG
TATCATGAGCAAATGCAAGCAACGCACCAGAAGGTGCACAAGGTAATCCGGAGGACATT
ATAGTACTCGTTTACGTTCGTTGCGTGGTCTTCCACGTGTTCCATTAGGCCTCCTGTAA
ATG
TAC
Figure II.7. Genomic context of morP, morS and morR. A) Genomic orientation. B) Intergenic region
between morP and morS showing the conserved boxes, and ATG start codons. Arrows indicate the
transcription direction.
The genomic profile presented for morP, morS and morR indicates that those
genes might be transcribed by divergent and non-overlapping promoters, and such a set of
genes would be controlled by the cognitive response regulator: MorR.
II.2.2 Cloning
Classical genetic engineering tools were used as a strategy to obtain a
recombinant plasmid carrying de morR gene. The objective was to transform a competent
cell with the recombinant plasmid, and control the morR transcriptional level and
expression.
morS rbs -10
-35
-24 -12
rbs
morP
5`
3`
3`
5`
A
B
σ70-P σ54-P
morR morS morP

Chapter II
59
The morR gene from D. alaskensis G20 was amplified by PCR and visualized
in 1% agarose gel (figure II.8 [1]). The result shows the presence of a single band in
agarose gel between 1000 and 1500 bp corresponding to the morR expected result
(1401bp).
The PCR product and pET-21c (+) were digested with NheI and EcoRI, and no
star activity was visualized. Both were purified and visualized in 1% agarose gel before
ligation (figure II.8 [2]). After ligation, the recombinant plasmid was transformed in Nova
Blues Giga Blues Competent Cells. Following bacterial growth, five colonies were
selected, and identified by PCR. Four of the colonies were positive (figure II.9 [3]), and the
resulting plasmid, carrying the morR gene, was named as pETMorR. The plasmids were
isolated from competent cells and purified (figure II.9 [4]). Then, they were submitted to
DNA sequencing and the results showed no mutations and the gene was correctly oriented
allowing induction of gene transcription and, subsequent, protein expression.
Figure II.8. Different steps of molecular cloning process: PCR and pure insert and plasmid after digestion. A):
a) 1kb molecular ladder, b) PCR of morR gene. B): a) 1kb molecular ladder, b) purified digested PCR
product, c) purified digested pET-21c (+). Running was performed in 1% agarose gel, in buffer TAE 1X,
during 25 minutes at 100 V.

morR gene, cloning and MorR expression
60
Figure II.9. Different steps of molecular cloning process: colony PCR and plasmid extraction. A): a) 1kb
molecular ladder, b-f) Colony PCR: each band corresponds to a single recombinant colony. B): a) 1kb
molecular ladder, b-e) Isolated recombinant plasmids, each band correspond to a single recombinant plasmid.
Running was performed in 1% agarose gel, in buffer TAE 1X, during 25 minutes at 100 V.
The sequencing analysis of the recombinant plasmid revealed that morR was
preceded by the rbs binding site, and that no DNA mutation was created during the cloning
procedure. The presence of the T7 promoter was not possible to verify through sequencing
reaction.
II.2.3 Protein expression
II.2.3.1. Small scale expression
A small scale protein expression was performed in order to evaluate if morR
was under T7 promoter control, and to optimize the growth and induction conditions. The
control parameters evaluated were the OD600 (0.5 and 1.0), the IPTG concentration (0, 0.5
and 1.0 mM), and the time of induction (4h and overnight).
The results show that the transcription of morR is induced in all the conditions
tested (figure II.10 and II.11). However, the majority of protein was obtained when bacteria
was induced at OD600 of 1.0 with 1mM of IPTG and during an overnight period (figure
II.11,[J]). Thus, this condition was chosen for the future experiments. The control
experiment, with no IPTG induction, revealed a significant degree of morR expression
(figure II.10 [C, D] and figure II.11 [B, C]) indicating a misrule of the T7 RNA polymerase
expression from lacUV5 promoter which represent a low degree of expression control.
However, this same result suggests that MorR is a nontoxic product for E.coli, since the
growth was not inhibited for this basal level of transcription.

Chapter II
61
Figure II. 10. Small scale protein expression at OD600 0.5. A 12.5% polyacrylamide SDS-PAGE showing the
expression profile of transformed BL21 (DE3) competent cells induced at OD 0.5. A) Ladders. B) Cells with
0 mM IPTG at zero hour. C) Cells with 0 mM IPTG after 4 hour. D) Cells with 0 mM IPTG after an overnight
period. E) Cells induced with 0.5 mM IPTG at zero hour. F) Cells induced with 0.5 mM IPTG after 4 hours.
G) Cells induced with 0.5 mM IPTG after an overnight period. H) Cells induced with 1 mM IPTG at zero
hour. I) Cells induced with 1 mM IPTG after 4 hours. J) Cells induced with 1mM IPTG after an overnight
period.
Figure II. 11. Small scale protein expression at OD600 1.0. A 12.5% polyacrylamide SDS-PAGE showing the
expression profile of transformed BL21 (DE3) competent cells induced at OD 1.0. A) Cells with 0 mM IPTG
at zero hour. B) Cells with 0 mM IPTG after 4 hours. C) Cells with 0mm IPTG after an overnight period. D)
Ladders (116, 66.2, 45, 35 and 25 kDa). E) Cells induced with 0.5 mM IPTG at zero hour. F) Cells induced
with 0.5 mM IPTG after 4 hours. G) Cells induced with 0.5 mM IPTG after an overnight period. H) Cells
induced with 1 mM IPTG at zero hour. I) Cells induced with 1 mM IPTG after 4 hours. J) Cells induced with
1mM IPTG after an overnight period.
The optimal condition chosen for protein expression was O.D600 of 1.0 with
1mm of IPTG after an overnight period (figure II.11J) given that the results showed a high
amount of MorR protein along this condition.
II.2.3.2. Large scale expression
The large scale protein expression was performed in order to evaluate where the
expressed protein was localized in the cell and also as a preliminary step before protein
purification. The experiment was performed in Bl21 (DE3) cells and following the

morR gene, cloning and MorR expression
62
experimental conditions optimized in the small scale protein expression. This experiment is
identify if the the protein is in the soluble fraction and not present as insoluble inclusion
bodies or membrane protein. The heterologous protein was present in all cellular fractions
with the highest amount existing as soluble form (figure II.12).
Figure II. 12. 12.5% SDS-PAGE showing the cellular localization of MorR. A) Ladder. B) Cell debris
fraction. C) Membrane fraction. D) Soluble fraction.
The presence of a considerable amount of protein in the membrane fraction
indicates an absence of an optimal condition during the cell lysis. Moreover, the presence
of a high quantity of protein in the cell debris fraction may be related with an high
percentage of protein expression which can block a correct protein folding and, therefore,
part of the protein may be not available as soluble form.

Chapter II
63
II.3. References
1. Mierendorf, R. C., Morris, B. B., Hammer, B. & Novy, R. E. Expression and
Purification of Recombinant Proteins Using the pET System. Methods Mol. Med. 13,
257–92 (1998).
2. Rivas, M. G. et al. Molybdenum induces the expression of a protein containing a
new heterometallic Mo-Fe cluster in Desulfovibrio alaskensis. Biochemistry 48,
873–82 (2009).
3. Studholme, D. J. & Dixon, R. Domain Architectures of 54 -Dependent
Transcriptional Activators. J. Bacteriol. 185, 1757–1767 (2003).
4. Galperin, M. Y. Diversity of structure and function of response regulator output
domains. Curr. Opin. Microbiol. 13, 150–9 (2010).
5. Franke, S., Grass, G. & Nies, D. H. The product of the ybdE gene of the Escherichia
coli chromosome is involved in detoxification of silver ions. Microbiology 147, 965–
72 (2001).
6. Ravikumar, S., Yoo, I., Lee, S. Y. & Hong, S. H. A study on the dynamics of the
zraP gene expression profile and its application to the construction of zinc adsorption
bacteria. Bioprocess Biosyst. Eng. 34, 1119–26 (2011).
7. Appia-Ayme, C. et al. ZraP is a periplasmic molecular chaperone and a repressor of
the zinc-responsive two-component regulator ZraSR. Biochem. J. 442, 85–93 (2012).
8. Danese, P. N. & Silhavy, T. J. CpxP, a stress-combative member of the Cpx regulon.
J. Bacteriol. 180, 831–9 (1998).
9. Weiss, V., Kramer, G., Dünnebier, T. & Flotho, A. Mechanism of regulation of the
bifunctional histidine kinase NtrB in Escherichia coli. J. Mol. Microbiol. Biotechnol.
4, 229–33 (2002).
10. Alain Dolla, Rongdian Fu, M. J. B. and & Voordouw, G. Nucleotide Sequence of
dcrA, a Desulfovibrio vulgaris Hildenborough Chemoreceptor Gene, and Its
expression in Escherichia coli. J. Bacteriol. 174, 1726–1733 (1992).
11. Ross, W. & Gourse, R. L. Analysis of RNA polymerase-promoter complex
formation. Methods 47, 13–24 (2009).
12. Typas, A. & Hengge, R. Role of the spacer between the -35 and -10 regions in
sigmas promoter selectivity in Escherichia coli. Mol. Microbiol. 59, 1037–51 (2006).

morR gene, cloning and MorR expression
64

Chapter III
MorR biochemical characterization and DNA binding

Chapter III
66

MorR biochemical characterization and DNA binding
67
MorR biochemical characterization and DNA binding
Context
The response regulatory proteins are mainly regulated by post-translational modifications,
such as phosphorylation. The phosphorylation status and effect have been studied in some
RR proteins that belong to TCS. Usually, those proteins are activated by phosphorylation
which induces protein conformational changes that enhance specific transcriptional
regulatory networks, usually through DNA binding. The biochemical characterization is the
first step to perform protein studies. In order to study MorR, the recombinant plasmid
carrying the morR gene was induced to express the MorR protein. The protein was purified
as soluble form and was characterized. MorR has an extinction coefficient of 280= 30823
M-1
cm-1
and the ICP-AES revealed the absence of Mg, Zn, Mo and Cu
. The MorR was
purified as a monomer and does not contain any phospho amino acid in its structure. In
order to identify if MorR binds to DNA, the intergenic region between morS and morP was
amplified and purified. The EMSA experiment revealed that MorR binds to the target
intergenic region and the DNaseI footprinting experiment showed the site of binding. The
interaction between phosphodonors and RR are reviewed given that RRs like MorR are
susceptible to phosphorylation. In this way, the MorR was used in interaction studies with
small phosphodonors in order to visualize possible conformational changes. The oligomeric
status of MorR was not altered upon incubation with acetylphosphate and
phosphoramidate.

Chapter III
68

MorR biochemical characterization and DNA binding
69
III.1.Introduction
III.1.1. Phosphorylation and response regulators (RR)
Among RR proteins belonging to TCS, phosphorylation is the main post-
translational signal capable to induce conformational changes and protein output
response.Acetylation of RR has been reported, but only few examples are available1,2
. The
oligomeric states of RR have hardly been investigated, and post-translational modifications
(e.g., phosphorylation) have been associated with the transformation of inactive
monomers/dimers to active oligomers. Small phosphodonors, such as acetylphosphate,
ammonium hydrogen phosphoramidate, carbamoyl phosphate and beryllofluoride have
been identified as RR oligomer`s inducers3,4,5,6
.
As previously mentioned in chapter II, the MorR shares sequence similarities
with ZraR and NtrC. To date, the ZraR (also known as HydG) has been characterized as a
zinc/lead responsive protein which binds in the intergenic region between zraP and hydH7.
However, the ZraR mechanisms of DNA binding and post-translational modification are
not well comprehended. On the other hand, research on the NtrC oligomerization coupled
to phosphorylation progressed in recent years and can serve as an example for the present
study.
A variety of analytical tools have been applied in order to elucidate RR
oligomerization upon phosphorylation, such as: gel filtration and reverse-phase
chromatography, fluorescence spectroscopy, scanning force microscopy and analytical
ultracentrifugation. Changes in oligomeric state were investigated in proteins belonging to
OmpR family (OmpR, DrrB, MtrA and NblR). OmpR is a TCS transcriptional activator
protein involved in the regulation of ompC and ompF genes, which codifies two major
outer membrane porin (OmpC and OmpF) in E.coli8. The OmpR family is characterized by
the presence of two distinct domains: a N-terminal receiver domain with a conserved
phosphoacceptor D55, and a C-terminal DNA binding wHTH domain9. Thermotoga
maritima DrrB is a RR which can serve as a model for structural comprehension of OmpR
family. The crystal structure of the protein has been solved. The oligomeric state of DrrB
changed after incubation with ammonium hydrogen phosphoramidate. A small amount (30
µM) of DrrB was incubated with 100 mM of ammonium hydrogen phosphoramidate for 10
min at 60ºC. The sample was injected in a Superdex 75 10/30, and the unphosphorylated

Chapter III
70
DrrB presented a molecular mass of 22.2 kDa, and the phosphorylated DrrB had a
molecular mass of 42.1 kDa. The results showed that DrrB forms a dimer when
phosphorylated10
.
The role of phosphorylation was also investigated for Corynebacterium
glutamicum MtrA, a RR involved in transcriptional repression and activation of genes
required during hyperosmotic stress and cell wall peptidase secretion11,12
. A HiLoad 26/60
Superdex 200 was used to monitor protein oligomerization, and ammonium hydrogen
phosphoramidate (and not acetylphosphate) led to dimerization of MtrA (56.6 kDa). In both
cases, the experimental concentration of phosphodonor was 50 mM. Moreover, the binding
affinity between MtrA and DNA was also improved by ammonium hydrogen
phosphoramidate11
.
The use of acetylphosphate as a protein conformational inducer was also
investigated by analytical gel filtration for cyanobacteria Synechococcus sp NblR. NblR is a
transcriptional activator of nblA gene that is involved in nutrient starvation response
exhibiting a phosphorylation-independent activity13,14
. Gel filtration was carried out using a
Superdex 200 HR 10/30, and no significant alteration in elution profile was visualized
when NblR was incubated with 12.5 mM of acetylphosphate for 1h at room temperature. It
is important to mention that NblR is a non-canonical RR, but contains a conserved
phosphorylate site at D57. Moreover, phosphorylation of D57 is not required for NblR
function15
.
The NtrC protein is a dimer in solution; it should interact with RNAPσ54 in
order to activate the transcription16,17
. Scanning force microscopy was used as a tool to
visualize NtrC oligomerization after carbamoyl phosphate and NtrB (the physiological
phosphodonor) incubation. The results clearly showed that NtrC dimers must built large
oligomers to activate transcription. Interestingly, the NtrC behavior is completely different
from eukaryotic enhancer-binding proteins: NtrC binds solely by protein-protein interaction
in contrast to eukaryotic enhancers that bind directly to DNA18
. In what concerns the NtrC
binding profile, analytical ultracentrifugation showed that the unphosphorylated form binds
as a dimer to a single site in DNA. Moreover, the NtrC-DNA interaction occurs essentially
without cooperativity and the phosphorylated protein forms a complex (oligomers) at the
enhanced sequence in the DNA duplex19
.The fluorescence anisotropy and fluorescence

MorR biochemical characterization and DNA binding
71
correlation spectroscopy corroborate the previous assumption that NtrC binds with no
cooperativity and that one dimer of NtrC forms two ion pairs (one per NtrC monomer) with
the DNA backbone. In that way, one unphosphorylated NtrC dimer binds to one DNA
binding site and two unphosphorylated dimers to two adjacent binding sites20
. The
phosphorylation is crucial to NtrC transcription initiation, which is coupled to the protein
ATPase activity21
. Thus, the phosphorylation status of the N-terminal REC domain
regulates the activity of the central AAA+ domain and this intermolecular interaction might
be mediated by the contact of a flexible helix-α4 of the phosphorylated REC domain with
the adjacent partner subunit5,22
. X ray solution scattering and electron microscopy studies
corroborates that a binding mechanism between the both subunits occurs and that the
phosphorylation has a direct contribution to hexamer stability23
.
The variety of analytical tools used in order to comprehend the effect of
phosphorylation into oligomerization of RR varies dramatically. Moreover, some RR
shows a preference for a phosphodonor agent than other. This preference is not
comprehended but might be correlated with the structural characteristic of the RR and/or
the experimental conditions used.
III.2. Methodology
III.2.1. Protein purification
In order to obtain pure protein, the soluble fraction was dialyzed overnight
against 10 mM Tris-HCl, pH 7.6 and loaded onto a DEAE Sepharose FF column (2.6 X 25
cm) previously equilibrated with the same buffer using a flow rate of 3 ml/min. The protein
was eluted using a two-step discontinuous gradient. The first gradient, from 10 to 150 mM
Tris-HCl, pH 7.6, was performed with one bed volume. The MorR was eluted using a
second gradient, from 150 to 300 mM Tris-HCl, pH 7.6, over the course of two bed
volumes. The protein was dialyzed against 10 mM Tris-HCl, pH 7.6, and loaded onto a
Source 15Q (2.6 X 24 cm) equilibrated with the same buffer at a flow rate of 1 ml/min.
Again, a two-step discontinuous gradient was applied. The first gradient, from 10 to 150
mM of Tris-HCl, pH 7.6, was performed over the course of one bed volume. The MorR

Chapter III
72
was then eluted using a gradient from 150 to 300 mM Tris-HCl, pH 7.6, over the course of
four bed volumes.
All the dialysis procedures were performed using a membrane with a molecular
mass cut-off of 10 kDa, activated by boiling for 10 min (distillated water) with 1 mM of
EDTA. After each chromatographic step, the protein purity was checked by SDS-PAGE
electrophoresis, in 12.5% acrylamide gels stained with Coomassie Blue.
An additional purification step using a Superdex 200 (2.6 X 66 cm) gel
filtration column was performed. The column was equilibrated with 50 mM Tris-HCl, pH
7.6, and 150 mM NaCl using a flow rate of 2 ml/min. The central part of the peak obtained
in the chromatogram corresponded to MorR. The corresponded fractions were collected,
concentrated and dialyzed using a concentrator (Millipore) with a molecular weight cut-off
of 30kDa, and stored in 10 mM Tris-HCl, pH 7.6, at -80ºC.The overall protein purification
protocol is presented in figure III.1.

MorR biochemical characterization and DNA binding
73
Figure III. 1. Diagram of MorR purification
Chapter III
74
III.2.2. UV-VIS spectroscopy
UV/VIS absorption data were recorded by Shimadzu UV-1800
spectrophotometer in 1cm quartz cuvettes.
III.2.3 Protein quantification
Protein was quantified according to Miller et al., 195924
. This methodology
applies some modification in the method described by Lowry (1951). A 200 µL of aliquots
of alkaline copper reagent (composed of 10 parts of 10% sodium carbonate in 0.5% sodium
hydroxide and 1 part of 0.5 % copper sulfate in 1% potassium tartrate) were added to 200
µL of protein sample in eppendorfs tubes. The mixture was incubated for 10 min at room
temperature, and a 600 µL aliquot of a 1 to 11 dilution of Folin Ciocalteau reagent was
added to the sample, mixed and incubated for 10 min at 50ºC. The mixtures were cooled to
room temperature, and absorbance was measured at 660 nm in a Shimadzu UV-1800
spectrophotometer using a cuvette of 1 cm. The calibration curve was prepared with Bovine
Serum Albumin (BSA) (stock 2 mg/ml) standards.
III.2.4. N- terminal sequencing
The N-terminal sequencing was performed by automated Edman degradation in
an Applied Biosystem 120 analyser model 477, following the manufacture instructions. A
total of 100 pmol of MorR was used.
III.2.5. Peptide Mass Fingerprint
The sample (100 pmol) was digested according to Santos et al., 2007 with some
modification25
. The modification was the substitution of urea to 50% acetonitrile to
denature the protein sample. The sample was analyzed by MALDI-TOF-MS (model
Voyager-DE PRO Workstation) using a positive reflector as ionization mode and the
peptides were identified using the MASCOT
(http://www.matrixscience.com/cgi/search_form.pl) applying the following parameters:
Bank of data: NCBInr and SwissProt
Fixed modification: Carbamidomethyl (C)
Variable modification: Oxidation (M)

MorR biochemical characterization and DNA binding
75
Enzyme: Trypsin
III.2.6. Protein metal analysis
Protein metal content (Zn, Mg, Mo and Cu) was quantitatively determinate by
Inductively Coupled Plasma - Atomic Emission Spectroscopy (ICP-AES) (Horiba Jobin-
Yvon, France), which uses a source of atomization temperature of 10000K to decompose
sample components. A detection quantification limit of 1 ppb was attained for samples
diluted in water, and 5 ppb for samples diluted in buffer. The Reagecom 23 ICP
multielement was used for the calibration curve.
III.2.7. Molecular mass determination
The oligomeric state of the purified MorR was determined by two independent
analytical gel filtration using the Superdex200 column (10/30 GL) equilibrated with 50 mM
Tris-HCl (pH 7.6) and 150 mM NaCl using a flow rate of 0.4ml/min. The first calibration
was performed at Faculdade de Ciência e Tecnologia at Universidade Nova de Lisboa using
Ferritin (440 kDa), aldolase (158 kDa), conalbumin (75 kDa), ovalbumin (44 kDa) and
ribonuclease A (13.7 kDa) (GE Healthcare Life Sciences) as protein standards. The second
calibration was performed at Consejo Superior de Investigaciones Científicas (CSIC) using
Thyroglobulin (670 kDa), Globulin (150 kDa), Ovalbumin (44 kDa) and Myoglobin (17
kDa) (BioRad) as protein standards. The distribution coefficient (Kav) was calculated as
follows:
⁄ Eq.3. 1
Where:
V0= void volume of the column
Vr= retention (elution) volume of the protein
Vc= the geometric bed volume in ml
The molecular mass of MorR was determined by matrix-assisted laser
desorption ionization time of flight (MALD TOF) mass spectrometry. The spectrometer
was equipped with a nitrogen laser radiating at 337 nm (Applied Biosystems, Foster City,
USA, model voyager DE-PRO biospectrometry workstation). A total of 100 pmol of MorR
was used.

Chapter III
76
III.2.7.1 Molecular mass determination upon phosphorylation
The oligomeric state of MorR was monitored after incubation with
acetylphosphate (SIGMA A0262) or hydrogen phosphoramidate incubation. Both reactions
were performed under the same experimental conditions:9 M of MorR was diluted in 10
mM Tris-HCl, pH 7.6, with 2 mM MgCl2 and the sample was incubated with 50 mM of
phosphodonor on ice for 30 min. Then, the sample was injected in Superdex 75 HR 10/30
equilibrated in 50 mM Tris-HCl and 150 mM NaCl. The chromatography was monitored at
280 nm.
III.2.8.Nano LC-MS mass spectrometry
III.2.8.1. In solution digest
For mass spectrometry analysis, approximately 1 pmol of the protein was
dissolved in 4µL of 100mM ammonium bicarbonate (ABC) and submitted to disulfide
bond reduction using 1µL of 1mM DTT in 100mM ABC for 45min at room temperature.
Cysteine thiol groups were further blocked through alkylation using 1µL 5.5mM
Iodacetamide in 100mM ABC for 1 hour at room temperature and dark environment.
Sample volume was increased to 40µL with ABC, and 10µg of MS-grade modified trypsin
(Promega) was added to the sample overnight at 37oC. Enzymatic reaction was quenched
by acidification using Trifluoroacetic acid (TFA). Before injection into the mass
spectrometer, the salts were removed from the peptide mixture through C18 resin (Empore
3M) cleaning steps (STAGE-TIP method).
III.2.8.2. LC-MS/MS
Peptides were separated by reversed-phase liquid chromatography using a
Dionex Ultimate 3000 nanoLC (Thermo) coupled directly to a QExactive mass
spectrometer (Thermo) equipped with a nanoelectrospray source (Thermo). The organic
gradient used for separation was performed during a 60 minute run, starting at 5% solvent
B up to 35% solvent B (solvent A is 0.1% formic acid in water, while solvent B is 90%
acetonitrile 0.1% formic acid in water). The stationary phase was an Acclaim PepMap 100
column (C18, 2 µm beads, 100 Å, 75 μm inner diameter). Flow used was 300nL/min.

MorR biochemical characterization and DNA binding
77
The QExactive was operated in data-dependent mode to automatically
switch between MS and MS/MS acquisition. Survey full scan MS spectra were collected at
resolution 70,000 (at m/z 200), with scan range between 300 to 1750 m/z, Automatic Gain
Control (AGC) target of 1E6 and maximum injection time of 20ms. The Top 10 most
abundant ions in each scan were selected for isolation and fragmentation. MS/MS scans
were collected at 17,500 resolution (at 200 m/z), AGC target of 2E5, maximum injection
time of 60ms, isolation width of 3 m/z, and collision energy of 25%. Unassigned and single
charged ions were excluded. Once selected for MS/MS, ions were dynamically excluded
for re-sequence for 45s.
III.2.8.3. Protein identification
MS raw files were processed using the Proteome Discoverer software
(Thermo). Sequence information was then submitted to an in-house Mascot server v2.2
(Matrix Science) using the following search parameters: Enzyme: Trypsin without proline
restrictions; two miscleavages allowed; MS mass accuracy of 5ppm; MS/MS mass
accuracy of 0.05 Da; cysteine carbamidomethylation as fixed modification; N-terminal
glutamine pyroglutamate, N-terminal glutamic acid pyroglutamate, methionine oxidation,
lysine acetylation, serine/threonine phosphorylation and aspartic acid phosphorylation as
variable modification. Sequenced were compared to an updated NCBInr database for
bacteria.
III.2.9.Electrophoretic mobility shift assay (EMSA)
EMSA is a technique used to detect DNA binding protein. The principle of this
technique is that DNA bound to a protein migrates slowly through a polyacrylamide gel.
Usually, the target DNA is labeled with radioactive isotopes like 32
P. An alternative to
radioactive isotopes is the use SYBR Green I (Promega) in order to visualize the DNA
shift. The use of SYBR Green I could be a good alternative to label DNA for EMSA
experiment. It can serves as a screening method to detect DNA-protein interactions, but
exhibit lower resolution when compared with isotopes methods. This feature limits the
measurement of association constants using SYBR Green I in EMSA experiments.

Chapter III
78
The intergenic region between morP and morS was amplified by PCR from
D.alaskensis G20 cells using the primers forward (5'-TGCCGTCACCTTGCGT-3`) and
reverse (5`-GTCCTCCGGATTACCTTGT-3`). The fragment was gel purified using the QI
Aquick extraction kit (Qiagen), quantified at 260nm, and 0.078 μM of this fragment were
mixed with 6 μM of purified MorR in a buffer containing 10 mM Tris-HCl, pH 7.6, 250
mM KCl, 0.2 mM EDTA, 0.2 mM DTT and glycerol 10%. The mixture (total volume of 19
μl) was incubated for 1 hour on ice. It was then applied in a native 7.5% polyacrylamide
gel, running for 1h at 100 mV and stained with Syber green.
III.2.10.DNAse I Footprinting assay
The sequence-specific interaction of proteins to DNA can be studied using
DNase I footprinting. In this technique an end-labeled DNA sequence is allowed to interact
with a DNA-binding protein. Then the complex is digested with DNase I, where the bound
protected region is intact from attack by the enzyme. The degraded DNA is submitted to
electrophoresis, and the region of protection is detected as a gap in autoradiography. DNase
I from Bovine pancreas has 29 kDa and approximately 40 Å in diameter. It binds in the
minor groove of the DNA, and cleaves the phosphodiester bound of double and single
strand DNA. The enzyme does not cleave the DNA indiscriminately, and the characteristics
of DNase prevents it from cutting the DNA under and around a bound protein26
. For
footprinting experiment, the target DNA sequence should be labeled with a radioactive
isotope. To construct the desired DNA molecule, a PCR reaction is performed using
primers labeled with [-32
P]. For molecular biology purposes, the oligonucleotide probes
(primers) are dephosphorylated by Calf Intestinal Alkaline Phosphatase (CIAP) in order
remove the 5` phosphate from DNA, which allow the subsequent end-labeled with a
radioactive phosphate by T4 Polynucleotide Kinase (T4 PNK) (5). For end-label short
oligonucleotides, the enzyme T4 PNK catalyzes the transfer and exchange of the terminal
[-32
P] of ATP to the 5`-hydroxyl terminus of DNA and RNA.
The primers used for amplification of the intergenic region (section III. 2.8)
were labeled with [γ-32P
]ATP (4000 Ci mmol−1
) using T4 PNK (New England Biolabs).
The labeled primer was separated from unincorporated [γ-32P
]ATP using the Nucleotide
Removal Kit (Qiagen). The morS-morP intergenic region (233 bp) was PCR amplified

MorR biochemical characterization and DNA binding
79
using D. alaskensis G20 chromosomal DNA as a template and with appropriate labeled and
unlabeled primers. The footprint assays were performed as follows: the labeled DNA
fragment was diluted to a concentration of ∼1 nM in 50 μl of binding mix (10 mM Tris–
HCl, pH 7.5, 50 mM NaCl, 2.5 mM MgCl2, 0.5mM dithiothreitol, 4% glycerol, and 40 ng
μl−1 poly(dI–dC)·poly(dI–dC)) to which different amounts of purified MorR (2-10 µM)
were added. After 30 min of incubation at room temperature, DNase I was added (1.2 unit,
Promega), and the reaction was conducted for 1 min, then stopped by the addition of 140 μl
of DNase Stop Solution (192 mM sodium acetate, 32 mM EDTA, 0.14% SDS, and 64 μg
ml−1 yeast RNA). Following DNA ethanol-precipitation in the presence of a DNA carrier
(Pellet Paint co-precipitant, Novagen), the pellets were resuspended in a loading dye
solution (95% formamide, 10 mM EDTA, 0.3% bromophenol blue, 0.3% xylene cyanol)
and loaded onto a 8% polyacrylamide/6 M urea electrophoresis gel. The locations of the
protected nucleotides were deduced by running a ladder with products of the Sanger
reaction (Thermo Sequenase Cycle Sequencing Kit, Affymetrix).
III.2.11. Ammonium hydrogen phosphoramidate synthesis
The phospho-donor ammonium hydrogen phosphoramidate (NH4HPO3NH2)
was synthetized according to the method described by Sheridan et al., 197227
. 18.3 ml of
Phosphoryl chloride (Merck) were added to 300 ml of ice cold 10% aqueous ammonia
solution, and stirred for 15 min. The mixture was diluted with 1L of acetone, resulting in
the formation of two layers. The bottom layer was separated, neutralized with 8ml of
glacial acetic acid, and cooled to 4ºC to induce the crystallization of the target compound.
After crystallization, the compound was filtered, washed with Isopropanol, and air dried. In
this work, for nomenclature simplification, ammonium hydrogen phosphoramidate is called
as phosphoramidate.
III.2.11.1. Elemental Analysis of Carbon, Hydrogen, Nitrogen and Sulphur (CHNS)
After phosphoramidate synthesis, the resulting product was characterized based
on the presence of carbon, hydrogen, nitrogen and sulfur in order to confirm the presence of
the desired compound. In this way, an aliquot of 2 mg of the synthetized NH4HPO3NH2
was submitted to CHNS analysis which was performed in aFlashEA 1112 analyzer

Chapter III
80
(Thermo Finnigan). The procedure of CHNS determination is based on the combustion of
the sample by a special furnace heated at 900 – 1000ºC with a small proportion of oxygen
which burns the organic and inorganic material, and, consequently, converts the sample
into elemental gases that are separated in a column. Athermal conductivity detector (TCD)
permits the elements concentrations identification.
III.2.11.2. Nuclear magnetic resonance (NMR)
The synthetized compound was also identified by NMR using a BlunkerAvance
III of 400 MHz.A 20 mg of phosphoramidate was diluted in 600 l of Deuterium Oxide
(Sigma). The sample was analyzed by 1H and 31P. The data was collected using the
Topspin 3.1 software.
III.3.Results and Discussion
III.3.1 Amino acid residues composition: MorR
Analysis of translated morR nucleotide sequence indicated that this gene
codifies a putative transcriptional regulatory protein belonging to Fis family, and shares
76% of similarity with zraR from D. vulgaris Hildenborough. According to Protein Data
Bank (PDB), the putative protein shares sequence similarity and conserved domains with
structural well solved proteins like ZraR (S. typhimurium) and NtrC (S. typhimurium).
Additionally, it is possible to observe domain similarities with other proteins involved in
transcriptional regulation, as such as DctD (S.meliloti) and Ntrc1 (A.aeolicus). The amino
acid sequences of the proteins cited above were aligned using the Jalview program (figure
III.2).
The putative protein MorR (GI: 78355156) is composed by 466 amino acids
residues which combine the three domains: a N-terminal, a central and a C-terminal
domain. The N-terminal domain constitutes the receiver part of the protein, and includes
the amino acids residues from 7 to 118. This domain is responsible for stimulus recognition
from cognate histidine kinase (HK), it contains a phosphoacceptor site at a conserved
aspartic acid (D55), and a dimerization interface. The central domain might be involved in
ATP binding and interaction with σ54 subunit. It is comprised of the amino acids residues
from 167 to 310, and contains conserved features which classify MorR as a member of the

MorR biochemical characterization and DNA binding
81
AAA+ superfamily due to the presence of a Walker A and Walker B motif, an arginine
finger (R-finger) and a GAFTGA sequence. These conserved structures are involved in
ATP binding/hydrolysis, and σ54 interaction. The C-terminal domain encompasses amino
acids residues from 424 to 465 and forms a tri-helical helix-turn-helix (HTH) portion that
controls the output response associated with DNA binding. This domain classifies MorR as
a member of Fis family, and the HTH domain binds to the major groove of DNA being
directly involved in transcriptional activation and/or repression.
Figure III.2. Amino acids residues alignment of the D. alaskensis G20 MorR, S. typhimuriumZrar, S.
Typhimurium NtrC, A. aeolicus NtrC1 and S. melilotiDctD. The three major conserved regions are
represented as follows: receiver domain (red), ATPase domain (blue) and DNA binding domain (green). The
Walker A
Walker B
R-finger

Chapter III
82
phosphoacceptor aspartic acid (D55), Walker A, Walker B, GAFTGA and arginine finger (R-finger) are
detached.
To date, the MorR structure is not available. The related crystallographic
structure available refer to response regulators containing single receiver domain (NtrC4,
PDB ID: 3DZD), single central domain (NtrC1, PDB ID: 1NY6), single ATPase domain
(Ntrc1, PDB ID: 3M0E), regulatory and central domain (NtrC1, PDB ID: 1NY5), and
central and C-terminal domain (Zrar, PDB ID: 1OJL). According to PDB data bank, the last
one exhibits the highest similarity (57%) with MorR, and its structure, as a monomer, is
presented in figure III.3.
Figure III.3. Crystallographic structure of the central and C-terminal domains of ZraR from S. typhimurium
(PDB ID:1OJL).The two major conserved regions with MorR are represented as follows: ATPase domain
(blue) and DNA binding domain (green). In red (Walker A), in orange (Walker B), in magenta (GAFTGA)
and the arginine finger (R-finger) are detached and shown in brown in the second plane.
III.3.2. Protein purification
The soluble fraction containing MorR was purified aerobically by three
chromatographic steps: DEAE Sepharose FF, Source 15Q and Superdex 200 (figure III.4).
The first chromatographic step (DEAE Sepharose FF) was very important given that
removed the majority of the contaminants. The second chromatographic step used a strong
anionic exchange matrix (Source 15Q that is based on a 15 m monosized, rigid
polystyrene/divinyl benzene polymer matrix). The combination of the Source 15Q
properties with the application of a discontinuous gradient became a good methodological
step for MorR purification. In this step, the remaining contaminants were highly removed
and the MorR was recovered efficiently. However, even applying three optimized

MorR biochemical characterization and DNA binding
83
chromatographic steps, the SDS-PAGE showed a low degree of a remaining contaminant
with a molecular weight of approximately 90 kDa. After purification, 3 mg/ml of protein
were obtained in a total volume of 10 ml.
Figure III. 4. 12.5% SDS-PAGE of purified MorR after each purification step. A: ladders, B: after DEAE-FF
column, C: after Source 15Q column, D: after Superdex 200 column.
III.3.3. UV-VIS spectroscopy
The electronic absorption spectrum of the pure MorR in 10 mM Tris-HCl, pH
7.6 is show in figure III.5. The molar extinction coefficient was calculated using the
maximum absorbance peak at 280 nm: 280 = 30823 M-1
cm-1
. For comparison, the
theoretical molar extinction coefficient was calculated according to protparam
(http://web.expasy.org/protparam/) as 280 =27515M-1
cm-1
. Our results indicate a similarity
between the practical and the theoretical molar extinction coefficient for MorR.

Chapter III
84
Figure III. 5. UV/VIS spectrum of purified MorR (20 M) in 10 mM Tris-HCl, pH 7.6.
III.3.4. Sequencing
The N-terminal sequence is an important tool to confirm the presence of a
recombinant protein. The N-terminal was determined for purified heterologous MorR from
D.alaskensis G20, A S M T N A P T I L I V D D D Q A H R T , and is in agreement with the
nucleotide sequence produced by genetic engineering. As previously mentioned in the
methodology (cloning section) the NheI restriction site created six additional nucleotides at
5` end position. Analysis of the recombinant plasmid DNA sequence revealed the presence
of an alternative ATG start codon, which is originated by the plasmid architecture.
Consequently, three amino acids were added at N-terminal: methionine (M), Alanine (A)
and Serine (S). However, the first methionine was absent in the N-terminal sequencing
results, probably reflecting an alternative bacterial post-translational excision mechanism.
The purified MorR was also identified using the Peptide mass fingerprint
(PMF) approach, it corresponded to the target protein (GI: 78355156), showing a sequence
coverage of 63% with a score of 176. The complete recombinant plasmid DNA sequencing
results, and the corresponding amino acids obtained by N-terminal and PMF are displayed
in figure III.6.

MorR biochemical characterization and DNA binding
85
atggctagcatgacaaacgctcctaccatattgatagtggatgatgatcaggcgcacaga
1 ·M··A··S··M··T··N··A··P··T··I··L··I··V··D··D··D··Q··A··H··R·
accatgctgcgcaccatgctgcgcggctggcagtactcggcggaagaagccgacgacggt
21 ·T··M··L··R··T··M··L··R··G··W··Q··Y··S··A··E··E··A··D··D··G·
tccgtggccgtgagcaaggtgcaggagcgcgcatatgacgccatcctgatggatatccgc
41 ·S··V··A··V··S··K··V··Q··E··R··A··Y··D··A··I··L··M··D··I··R·
atggcccgcatgagcggcatagaagccctgcggcatatcatggcccacaatccggccatt
61 ·M··A··R··M··S··G··I··E··A··L··R··H··I··M··A··H··N··P··A··I·
cccgtgcttatcatgacggcatattcttcggtgaatacagcggtggaagccctgaaaata
81 ·P··V··L··I··M··T··A··Y··S··S··V··N··T··A··V··E··A··L··K··I·
ggtgcttatgactacctgacaaagccgcttgatttcgacgagctgaaactgacgctggag
101 ·G··A··Y··D··Y··L··T··K··P··L··D··F··D··E··L··K··L··T··L··E·
cgcgcgcttgatcacacgcggctggcctcggaaaacagagagctgcgcagctctctgtcc
121 ·R··A··L··D··H··T··R··L··A··S··E··N··R··E··L··R··S··S··L··S·
gcggggcaggctgcctcgcgcattatcggccgcagcgaggccgtgcgccggcttaccgag
141 ·A··G··Q··A··A··S··R··I··I··G··R··S··E··A··V··R··R··L··T··E·
ctggtggccacagtggcgcccagcgacgccacggtactcatcaccggagaatcgggcaca
161 ·L··V··A··T··V··A··P··S··D··A··T··V··L··I··T··G··E··S··G··T·
ggcaaagaactggtggccagagccatacacgaaggaagcagcagacgtgacagaccgctg
181 ·G··K··E··L··V··A··R··A··I··H··E··G··S··S··R··R··D··R··P··L·
gtaaccgtcaactgcgccgcccttacggaatcgctgctggaatcagaactgttcggccac
201 ·V··T··V··N··C··A··A··L··T··E··S··L··L··E··S··E··L··F··G··H·
gaaaaaggtgcttttaccggtgcggacaaaaaacgcgacgggcggtttgttcaggcggac
221 ·E··K··G··A··F··T··G··A··D··K··K··R··D··G··R··F··V··Q··A··D·
ggcggtacgttgtttctggatgaactgggcgaaatgtctctggcactgcaggcaaagctg
241 ·G··G··T··L··F··L··D··E··L··G··E··M··S··L··A··L··Q··A··K··L·
ctgcgtgcgctgcagcagggtgaaatccagagggtgggcagcgacaacccgctgagagtc
261 ·L··R··A··L··Q··Q··G··E··I··Q··R··V··G··S··D··N··P··L··R··V·
gatgtacgcgtcatcgccgcaaccaaccgcaatctgaccgcagaggtgaccgcaggcagg
281 ·D··V··R··V··I··A··A··T··N··R··N··L··T··A··E··V··T··A··G··R·
ttccgcgaagacctgttttaccggctcaacgtcatcggcatagcggtaccggcactgcgg
301 ·F··R··E··D··L··F··Y··R··L··N··V··I··G··I··A··V··P··A··L··R·
gaacggcgcgacgacatccccctgctggccggacactttctgacccgctatgccgaacgt
321 ·E··R··R··D··D··I··P··L··L··A··G··H··F··L··T··R··Y··A··E··R·
aaccgcaagatgctcaaaggattcaccccgcaggccatgaactgtctggtcaactatgac
341 ·N··R··K··M··L··K··G··F··T··P··Q··A··M··N··C··L··V··N··Y··D·
tggccgggcaatgtgcgtgaactggaaaacgccgtggagcgcgccgttatcatgagcatg
361 ·W··P··G··N··V··R··E··L··E··N··A··V··E··R··A··V··I··M··S··M·
ggcgaatatgtcaccggacgcgaactgccgccggacattgcagcggctgacggcgaaacg
381 ·G··E··Y··V··T··G··R··E··L··P··P··D··I··A··A··A··D··G··E··T·
gatatcaccgcagcagtgcccgatacggacacaccgctgcccgacaccgtccatgacccc
401 ·D··I··T··A··A··V··P··D··T··D··T··P··L··P··D··T··V··H··D··P·
tatgcggggctctcgctggaaaatctggaacgccgcgccattgaggcaacgctgcgcgaa
421 ·Y··A··G··L··S··L··E··N··L··E··R··R··A··I··E··A··T··L··R··E·
tgtgccgacaataaaagcgaagccgcccgccggctgggcatcacccgcgcaacactgcac
441 ·C··A··D··N··K··S··E··A··A··R··R··L··G··I··T··R··A··T··L··H·
aacaagctgaaaaaatacggcatggaataa
461 ·N··K··L··K··K··Y··G··M··E··*·
Figure III.6. N-terminal and amino acid residues sequencing of MorR with the corresponding nucleotide
sequencing of pETMorR. Bold in yellow: N-terminal sequencing result. Bold in red: matched peptides by
peptide mass fingerprint.

Chapter III
86
III.3.5. Protein metal content
Metals are essential to maintain some functions that are associated with
transcriptional regulatory proteins which shares conserved features with MorR. As an
example, the conserved acid aspartic residue (D239) in the Walker B motif of NtrC is
essential for ATP binding and this interaction requires the presence of Mg2+
. The absence
of Mg2+
results in five folds decrease in the affinity between NtrC and ATP28
. Another
example of a transcriptional regulatory protein that shares conserved characteristics with
MorR and requires metal is the ZraR. The interaction between ZraR and Zn2+
is not
completely understood, but the evidence supports the idea that ZraR is a Zn-responsive
TCS given that its expression increases in the presence of this metal7. However, to date,
there is no information if ZraR has a Zn2+
binding site motif in its structure.
In spite of the evidences suggesting that transcriptional regulators, like MorR,
can incorporate metals in its structure, the metal content analysis of purified MorR
performed by ICP-AES revealed the absence of Mg, Zn, Mo and Cu.
III.3.6. Determination of the molecular mass
MorR has a theoretical isoelectric point of 5.6 and a theoretical molecular mass
of 51kDa according to protparam. SDS-PAGE of the purified MorR showed a retention
factor (Rf) of 0.33 with a mobility corresponding to a molecular mass of 42 kDa (figure
III.7).

MorR biochemical characterization and DNA binding
87
0.0 0.2 0.4 0.6 0.8 1.04.0
4.2
4.4
4.6
4.8
5.0
5.2
Lo
g M
W
Mobility (Rf)
Gal
BSA
Oval
MorR
REase
lacto
lyso
lac dehydro
Figure III.7. Rf of standards proteins and MorR in 12,5% SDS-PAGE. -galactosidase (-gal), bovine serum
albumin (BSA), ovalbumin (Oval), lactate dehydrogenase (lac dehydro), REase Bsp981 (REase), -
lactoglobulin (-lacto), lysozyme (lyso) and MorR. Curve Equation: y=-1.0289x+5.0934. R2=0.9779.
A molecular mass of 52 kDa ± 1.52 was estimated by MALD-TOF. This
technique is more robust and shows a much smaller associated error when compared with
the SDS-PAGE. An analytical Superdex 200 10/30 mm column was used in order to
determine the oligomeric state of MorR. MorR presented a molecular mass of ~56 kDa ±
2.8, indicating that it is present as a monomer in solution (figure III.8).
0.0 0.2 0.4 0.6 0.8 1.0
0.0
0.2
0.4
0.6
0.8
1.0
Kav
Log MW
Ribo A
Oval
MorR
Co
Aldo
Fe
Figure III.8. Determination of the molecular mass by Superdex 200 10/30 mm gel filtration. The graphic
shows the normalized values of distribution coefficient (Kav) and logarithm of molecular weight (Log MW).
Standard proteins used for the calibration curve: Ribonuclease A (Ribo A), Ovalbumin (Oval), Conalbumin
(Co), Aldolase (Aldo) and Ferritin (Fe). Curve Equation: y=-0.248x+1.5829. R2=0.9971.

Chapter III
88
Another calibration at Consejo Superior de Investigaciones Científicas (CSIC)
using the same type of column with different standards determined a molecular mass of
~60 kDa ± 3 for MorR, quite identical to the molecular mass determined previously.
The association between structure and the monomeric state of MorR differs
from the oligomeric state of the closer related proteins where the structures were solved,
such as ZraR, NtrC and NtrC1. It is important to note that MorR was purified entirely, i.e.
containing all the three major domains: R (the regulator), C (the AAA+ central) and D (C-
terminal DNA binding). For that reason, we can also call the purified protein of this work
as MorRRCD
. Crystal or NMR structural studies characterized several isolated domains or
truncated construct, such as: ZraRCD
(hexamer), active and non-active NtrCR (monomer),
NtrCD (homodimer), NtrC1
RC (inactive dimer) and NtrC1
C (active ring-shaped heptamer)
29–
34. The full length variant of NtrC was determined by Small and Wide Angle X-ray
Scaterring (SAXS/WAXS) and Electron Microscopy (EM). This NtrCRCD
variant carried a
S160F, R456A, N457A and R461A mutations that confers stability and prevents
aggregation of the activated form. The studies support the idea that NtrC is an inactive
homodimer where the unphosphorylated receiver subunit represses the formation of the
assembly of the central AAA+ subunit. This inactive state is uncovered by phosphorylation
which alleviates the repression status. The stability of the activated form of NtrCRCD
occurs
by the intersubunit contact between the activated receiver domain of one subunit with the
ATPase domain of a second non-identical subunit, forming the activated hexameric ring.
Moreover, the C-terminal DNA binding domain contain a dimerization determinant and
that oligomerization seems to be a prerequisite for ATPase activity, but not for ATP
binding23
. In this context, MorRRCD
shares a high similarity with ZraR and NtrC variants,
but the monomeric state of MorRRCD
shows that dimerization determinant might be
structurally and/or functionally different from its counterparts.
III.3.7.Phosphorylation status of the pure MorR
Response regulatory proteins belonging to TCS are mainly characterized by an
output response associated with post-translational modifications, such as phosphorylation.
However, in heterologous protein expression, post-translational changes might occur, since
host E.coli maintains this type of regulatory processes active. Taking into consideration, the

MorR biochemical characterization and DNA binding
89
present study verified the existence of phosphoamino acid residues in heterologous MorR
using nano liquid chromatography-tandem mass spectrometry. Two samples (in gel and
lyophilized) were submitted for this analysis. The results identified, for both samples, the
presence of a protein belonging to “two component Fis family transcriptional regulator”
which matched with GI: 78355156 from D. alaskensis G20. The percentage of sequence
coverage was 65% for gel sample, and 44% for lyophilized sample. No phosphoamino acid
(serine, threonine and aspartic acid) were identified. The results showed that the purified
monomeric form of MorR was not phosphorylated by the host bacteria.
III.3.8.Electrophoretic Mobility Shift Assay (EMSA)
In order to visualize if MorR binds to the intergenic region between morS and
morP, a DNA-Protein interaction experiment was performed. A 233 bp comprising the
entire intergenic region between morP and morS was amplified by PCR. A DNA mobility
retardation was observed in the native PAGE when MorR was added in the reaction
mixture (figure III.9). This results shows that MorR interacts with the intergenic region
between morP and morS and might be involved in the gene regulation. As an alternative,
the same experiment could be visualized through Coomassie Brilliant Blue staining, with
BSA (bovine serum albumin) used as a control (figure III.10). These results show that the
BSA do not interact with the intergenic region and shows that the interaction between the
target DNA and MorR is specific.
Figure III. 9. EMSA showing the DNA shift observed when MorR was mixed with the target DNA. The
interaction was visualized in 7,5 % Native PAGE. A) DNA + MorR. B) free DNA.

Chapter III
90
Figure III. 10. EMSA showing the protein shift observed when MorR was mixed with the 233 bp intergenic
region between morP and morS in 7,5 % PAGE. A) Free MorR. B) MorR shift. C) Free BSA. D) BSA mixed
with the intergenic region where no shift was observed.
III.3.9.DNaseI footprinting
In order to identify the specific DNA binding region, a DNaseI footprinting
experiment was performed. The intergenic region between morP and morS was amplified
using the same primers designed for EMSA studies. Radioactive labeling was used for
DNA visualization, and different amounts of purified MorR were tested (0, 2, 6 and 10nM).
The results showed that a region covered by 54 nucleotides was not subjected to DNaseI
digestion. This indicates that the intergenic region between morS and morP is the specific
binding region for MorR. The protected region encompassed positions -145 up to -200
relative to the morP ATG transcription start site. It also encompasses the predicted -10 and
-35 conserved boxes that might be responsible for MorR autoregulation. Five protected hot
spots were identified, including a palindromic region (TTTTTTATA) (figure III.11).

MorR biochemical characterization and DNA binding
91
Figure III. 11. MorR DNaseI footprinting experiment using the intergenic region between morP and morS as
DNA template. A 233bp labeled DNA fragment encompassing the intergenic region was digested with
DNaseI. The MorR protected region are bolded in red. G, A, T and C are sequencing ladders. 1) 10 nM, 2) 6
nM, 3) 2 nM and 4) 0nM of heterologous MorR respectively.
The footprinting result is in agreement with the gene regulation mediated by 54
transcriptional activators that binds ~80 to 150 nt upstream from the promoter they control.
This result can elucidate how morP gene transcription is enhanced when Mo is added to the
medium. Probably, in the presence of Mo MorP incorporates this metal into its structure,
and then derepress MorS (the HK sensor). The derepression hypothesis comes from the
idea that MorP contains a Cpx domain, and might function as the CpxP (the envelope stress

Chapter III
92
chaperone) protein. Then, the MorS autophosphorylates and transfers the phosphoryl group
to the cognate response regulator (MorR). The active form of MorR, can probably, interact
with 54 and activate the transcription of morP gene. The activate form might be able to
hydrolyze ATP and provide the mechanical force for RNAP54.The results show that
phosphorylation is not a prerequisite for MorR-DNA binding. Moreover, MorR binds to the
putative -10 and -35 boxes that might be involved in the morR autoregulation. The fact that
MorR binds to the putative 70 promoter can open a new insight onto the self-regulatory
mechanism of morS and morR genes. So, the inactive (not phosphorylated) form of MorR
binds to DNA and it is plausible to consider that MorR could control its own transcriptional
level by interaction with RNP70. Our hypothesis is that in the absence of Mo, MorR binds
as a repressor to the intergenic region between morS and morP inhibiting the access of
RNP70 but maintaining a basal level of transcription of those genes. In the presence of Mo,
MorR acquires the active form;derepress its own promoter and acts as a transcriptional
activator of morP gene.
III.3.10. Ammonium hydrogen phosphoramidate synthesis
The synthesis of ammonium hydrogen phosphoramidate (NH4HPO3NH2)
produced 150mg of a crystal compound. The corresponding product was investigated by
elemental analysis of carbon, hydrogen, nitrogen and sulphur which identified 22.65% of
nitrogen, 0% of carbon and sulphur, and 5.93% of hydrogen. The results match the
expected mass percentages of the compound: 24.56 % of nitrogen and 6.14% of hydrogen.
Additionally, the resulting compound was identified by 1H and 32P NMR spectroscopy
which confirmed its molecular structure.
III.3.11.Acetylphosphate and phosphoramidate as MorR oligomeric inductors
The oligomeric state of MorR was monitored after in situ phosphorylation using
50 mM of acetylphosphate or phosphoramidate. After reactions were performed, each
mixture was applied in an analytical gel filtration column. A control experiment, where no
phosphodonors were used, was also monitored. No changes in elution volume profile were
observable with acetylphosphate or ammonium hydrogen phosphoramidate compared with
the control. The resulting chromatograms are presented in figure III.12.

MorR biochemical characterization and DNA binding
93
0 2 4 6 8 10 12 140.0
0.4
0.8
1.2
0.0
0.4
0.8
1.2
0.0
0.4
0.8
1.2
Elution volume (ml)
Phosphoramidate
No
rma
lize
d U
V2
80
ab
sorb
an
ce (
mA
U)
Acetylphosphate
Control
Figure III. 12. Analytical gel filtration chromatography showing the elution profile of MorR with and without
incubation with acetylphosphate or ammonium phosphoramidate (phosphoramidate). The intensity of UV280
nm was normalized.
The results showed that the oligomeric status of MorR is not altered upon
incubation with phosphodonors. We believe that the shoulder presented in the
chromatograms is not associated with oligomerization after phosphorylation given that it is
also present in the control experiment without phosphorylation. Although we could not
exclude the possibility that native MorR can be present as different oligomeric form or that
the shoulder might be due to a contaminant of approximately 100kDa that is always
observed in small amounts after purification on the SDS-PAGE gels (figure III.4). Future

Chapter III
94
studies, like mass spectrometry identification of the protein corresponding to the shoulder
or analytical ultracentrifugation, can help to solve it. However, MorR contains all the
conserved features that support the idea that this protein has autophosphorylation capacity.
We propose that MorR autophosphorylation activity could be very fast and, therefore, gel
filtration is not properly accurate for MorR oligomer visualization. As a result, fluorescence
spectroscopy and nano LC-MS were chosen in order to understand the real behavior of
MorR upon phosphodonor incubation.

MorR biochemical characterization and DNA binding
95
III.4. References
1. Yan, J., Barak, R., Liarzi, O., Shainskaya, A. & Eisenbach, M. In vivo acetylation of
CheY, a response regulator in chemotaxis of Escherichia coli. J. Mol. Biol. 376,
1260–71 (2008).
2. Liarzi, O. et al. Acetylation represses the binding of CheY to its target proteins. Mol.
Microbiol. 76, 932–43 (2010).
3. Wolfe, A. J. Physiologically relevant small phosphodonors link metabolism to signal
transduction. Curr. Opin. Microbiol. 13, 204–9 (2010).
4. Lukat, G. S., McCleary, W. R., Stock, a M. & Stock, J. B. Phosphorylation of
bacterial response regulator proteins by low molecular weight phospho-donors. Proc.
Natl. Acad. Sci. U. S. A. 89, 718–22 (1992).
5. Lee, J., Owens, J. T., Hwang, I., Meares, C. & Kustu, S. Phosphorylation-induced
signal propagation in the response regulator ntrC. J. Bacteriol. 182, 5188–95 (2000).
6. Wemmer, D. E. & Kern, D. Beryllofluoride Binding Mimics Phosphorylation of
Aspartate in Response Regulators. J. Bacteriol. 187, 8229–8230 (2005).
7. Leonhartsberger, S., Huber, A., Lottspeich, F. & Bo, A. The hydH / G Genes from
Escherichia coli Code for a Zinc and Lead Responsive Two-component Regulatory
System. J. Mol. Biol. 4, 93–105 (2001).
8. Head, C. G., Tardy, a & Kenney, L. J. Relative binding affinities of OmpR and
OmpR-phosphate at the ompF and ompC regulatory sites. J. Mol. Biol. 281, 857–70
(1998).
9. Itou, H. & Tanaka, I. The OmpR-family of proteins: insight into the tertiary structure
and functions of two-component regulator proteins. J. Biochem. 129, 343–50 (2001).
10. Robinson, V. L., Wu, T. & Stock, A. M. Structural Analysis of the Domain Interface
in DrrB , a Response Regulator of the OmpR / PhoB Subfamily. J. Bacteriol. 185,
4186–4194 (2003).
11. Brocker, M., Mack, C. & Bott, M. Target genes, consensus binding site, and role of
phosphorylation for the response regulator MtrA of Corynebacterium glutamicum. J.
Bacteriol. 193, 1237–49 (2011).
12. Möker, N., Krämer, J., Unden, G., Krämer, R. & Morbach, S. In vitro analysis of the
two-component system MtrB-MtrA from Corynebacterium glutamicum. J. Bacteriol.
189, 3645–9 (2007).

Chapter III
96
13. KATO, H., CHIBAZAKURA, T. & YOSHIKAWA, H. NblR Is a Novel One-
Component Response Regulator in the Cyanobacterium Synechococcus elongatus
PCC 7942. Biosci. Biotechnol. Biochem. 72, 1072–1079 (2008).
14. Luque, I., Zabulon, G., Contreras, A. & Houmard, J. Convergence of two global
transcriptional regulators on nitrogen induction of the stress-acclimation gene nblA
in the cyanobacterium Synechococcus sp. PCC 7942. Mol. Microbiol. 41, 937–47
(2001).
15. Ruiz, D. et al. Phosphorylation-independent activation of the atypical response
regulator NblR. Microbiology 154, 3002–15 (2008).
16. Klose, K. E., North, A. K., Stedman, K. M. & Kustu, S. The major dimerization
determinants of the nitrogen regulatory protein NTRC from enteric bacteria lie in its
carboxy-terminal domain. J. Mol. Biol. 241, 233–45 (1994).
17. Yan, D. & Kustu, S. “Switch I” mutant forms of the bacterial enhancer-binding
protein NtrC that perturb the response to DNA. Proc. Natl. Acad. Sci. U. S. A. 96,
13142–6 (1999).
18. Wyman, C. Unusual Oligomerization Required for Activity of NtrC, a Bacterial
Enhancer-Binding Protein. Science (80-. ). 275, 1658–1661 (1997).
19. Rippe, K., Mücke, N. & Schulz, a. Association states of the transcription activator
protein NtrC from E. coli determined by analytical ultracentrifugation. J. Mol. Biol.
278, 915–33 (1998).
20. Sevenich, F. W., Langowski, J., Weiss, V. & Rippe, K. DNA binding and
oligomerization of NtrC studied by fluorescence anisotropy and fluorescence
correlation spectroscopy. Nucleic Acids Res. 26, 1373–81 (1998).
21. Weiss, D. S., Batut, J., Klose, K. E., Keener, J. & Kustu, S. The phosphorylated form
of the enhancer-binding protein NTRC has an ATPase activity that is essential for
activation of transcription. Cell 67, 155–67 (1991).
22. Tripathi, S. & Portman, J. J. Allostery and Folding of the N-terminal Receiver
Domain of Protein NtrC. J. Phys. Chem. B 117, 13182–93 (2013).
23. De Carlo, S. et al. The structural basis for regulated assembly and function of the
transcriptional activator NtrC. Genes Dev. 20, 1485–95 (2006).
24. Miller, G. Protein Determination of Large Numbers of Samples. Anal. Chem. 31,
964–964 (1959).

MorR biochemical characterization and DNA binding
97
25. Santos, H. M. et al. Improving sample treatment for in-solution protein identification
by peptide mass fingerprint using matrix-assisted laser desorption/ionization time-of-
flight mass spectrometry. J. Proteome Res. 6, 3393–9 (2007).
26. Moss, T. DNA-Protein Interactions: Principles and Protocols (Methods in
Molecular Biology), 2nd Edition. (Humana Press, 2001).
27. F.A, C. Inorganic Syntheses Vol XIII. (Mc-Graw Hill Book Company, 1972).
28. Rombel, I. et al. MgATP binding and hydrolysis determinants of NtrC, a bacterial
enhancer-binding protein. J. Bacteriol. 181, 4628–38 (1999).
29. Sallai, Â. & Tucker, P. A. X-ray crystallographic characterization and phasing of an
NtrC homologue crystallization papers. Acta Crystallogr. D59, 1656–1658 (2003).
30. Sallai, L. & Tucker, P. a. Crystal structure of the central and C-terminal domain of
the σ54-activator ZraR. J. Struct. Biol. 151, 160–170 (2005).
31. Kern, D. et al. Structure of a transiently phosphorylated switch in bacterial signal
transduction. Nature 402, 894–8 (1999).
32. Volkman, B. F., Nohaile, M. J., Amy, N. K., Kustu, S. & Wemmer, D. E. Three-
dimensional solution structure of the N-terminal receiver domain of NTRC.
Biochemistry 34, 1413–24 (1995).
33. Pelton, J. G., Kustu, S. & Wemmer, D. E. Solution structure of the DNA-binding
domain of NtrC with three alanine substitutions. J. Mol. Biol. 292, 1095–110 (1999).
34. Lee, S.-Y. et al. Regulation of the transcriptional activator NtrC1: structural studies
of the regulatory and AAA+ ATPase domains. Genes Dev. 17, 2552–63 (2003).

Chapter III
98

Chapter IV
MorR-DNA association and phosphorylation

Chapter IV
100

MorR-DNA association and phosphorylation
101
MorR-DNA association and phosphorylation
Context
MorR interacts with the intergenic region between morS and morP. The
knowledge about the association constant involved in this interaction could be useful to
understand the real behavior between those two macromolecules given that it describes the
strength of binding. Fluorescence anisotropy was applied in order to determine the
association constant between MorR and the target DNA. To understand the parameters that
need to be controlled in the interaction process and in order to obtain as accurate result for
the association constant, the acid-base equilibria influence in the fluorescence of 6-
carboxyfluorescein (6-FAM) covalently attached to the DNA duplex was characterized and
the binding conditions were optimized. This optimization was of paramount importance to
guarantee that anisotropic variation of 6-FAM was a consequence of MorR-DNA binding
and no other stimulus.
The MorR oligomeric experiments using gel filtration chromatography have
showed no apparent oligomerization of this protein upon its interaction with
phosphodonors. However, the amino acid composition of MorR and its homology with
other response regulators reinforce the idea that MorR could autophosphorylate and
oligomerize in the presence of phosphodonors. Because of that, fluorescence emission of
MorR-tryptophan was monitored in the presence of phosphodonors in order to identify if
those compounds caused a protein conformational change mediated by phosphorylation.
Finally, nano-LC-MS was applied to identify which (if any) amino acid residue was
phosphorylated and mathematical biochemistry calculations were applied in order to clarify
the experimental results.

Chapter IV
102

MorR-DNA association and phosphorylation
103
IV.1. Introduction
Fluorescence spectroscopy has been widely used in biological sciences. It has a
broad range of applications in DNA technology, e.g. in DNA sequencing, nucleic acid
hybridization assay and DNA arrays for genetic analyses, and in biochemistry in what
respects protein-ligand interaction, conformational changes and activity assays1. The
present introduction shows the principal topics in fluorescence spectroscopy with a special
focus in fluorescence emission and anisotropy.
IV.1.1 Basic concepts of fluorescence
When molecules are excited by the absorption of a photon, the passage from the
singlet ground state S0 to an excited state Sn (n > 1) is induced. The excited molecules will
return to S0 following successive steps. The Jablonski diagram (figure IV.1) is convenient
for visualizing in a simple way the possible processes: internal conversion, fluorescence,
intersystem crossing, phosphorescence, delayed fluorescence and triplet-triplet transition.
In that way the singlet electronic states are denoted as S0, S1 and S2, and the triplet states.
T1 and T2 2. The process represented in the diagram is described below:
1. SnS1 (internal conversion). The molecule Sn returns to the lowest excited
state S1 by dissipating a part of its energy. This process is followed by a vibrational
relaxation toward the lowest vibrational level of the final electronic state.
2. S1S0 (fluorescence). Emission of photon. It’s the transition from the
excited singlet state S1 to lower vibrational level S0. The fluorescence intensity decreases
exponentially with a characteristic time, reflecting the average lifetime of the molecule in
the S1 excited state.
3. S1T1 (intersystem crossing). Non-radiative transition between two
isoenergetic vibrational levels belonging to electronic states of different multiplicities.
4. T1S0 (phosphorescence). In solution at room temperature, non-radiative
de-excitation from the triplet state T1, is predominant over radiative de-excitation. The
radiative rate constant is very low, and this transition is forbidden.
5. T1S1 (delayed fluorescence). A reverse intersystem crossing can occur
when the energy difference between S1 and T1 is small and when the lifetime of T1 is long
enough.

Chapter IV
104
Figure IV.1. Jablonski diagram and illustration of the relative positions of absorption, fluorescence and
phosphorescence spectra. IC: internal conversion (i.e. direct return to the ground state without emission of
fluorescence). Dashed arrows: vibrational relaxation. ISC: intersystem crossing (possibly followed by
emission of phosphorescence). Adapted from Bernard Valeur in Molecular Fluorescence: Principles and
Application, 2001.
Absorption of photons allows a chromophore to reach an excited state. The
absorption energy is higher than the emission energy. As observed by the Jablonski
diagram, the energy absorbed by the molecule is released in the medium via different ways.
Thus, the energy of the emitted photons is lower than the energy of the absorbed photons.
A fluorophore is a chromophore that emits a photon, and this emission occurs from a
population of n excited fluorophores with intensity I. The intensity, position of the emission
wavelength, and lifetime are some of the recognizable parameters that will distinguish a
fluorophore. The resulting fluorescence spectrum is the plot of the fluorescence intensity as
a function of wavelength 3.
The fluorescence quantum yield () is the fraction of excited molecules that
return to S0 with emission of fluorescence photons. Upon external perturbation, the is
proportional to the lifetime (τ) of the excited state, as observed in dynamic quenching or
during variation of temperature. The τ of the excited state is defined by the average time the

MorR-DNA association and phosphorylation
105
molecule spends in the excited state prior to its return to the ground state. The τ determines
the time available for the fluorophore to interact with or diffuse in its environment, and
hence collect the information available from its emission 4.
IV.1.2. Types of fluorophore
There are two types of fluorophore: intrinsic and extrinsic. An intrinsic
fluorophore occurs naturally and is a small part of a molecule, while an extrinsic is when it
is added to the molecule. Proteins display intrinsic fluorophores due to the presence of
aromatic amino acids residues (phenylalanine, tyrosine and tryptophan). Extrinsic
fluorophores, such as fluorescein and rhodamines, can be linked to different
macromolecules. Those fluorophores are mainly used to bind covalently to lysines and
cysteines of protein, and to 5` or 3` ends of DNA. Their fluorescence properties are
dependent on their structure and on the surrounding environment 3.
The fluorescence of phenylalanine (F) is not considerable in the presence of
other aromatic groups. When excited at 280 nm wavelength, tyrosine (Y) contributes to
protein fluorescence; however its fluorescence is detected in low yield in the presence of
tryptophan (W). Moreover, proteins containing W display a fluorescence spectrum that can
be attributed to this amino acid residue alone, even when Y predominate. Typically, W
fluorescence is essentially selected when using an excitation of 295nm. At this wavelength,
Y and F emission fluorescence are superimposed by W. The position of the maximum of
the fluorescence spectrum of W in proteins varies from 307 to 352 nm, giving five
possibilities to spectral forms (figure IV.2).

Chapter IV
106
Figure IV.2. Normalized fluorescence spectra of W emission residues belonging to five spectral classes A, S,
I, II and III. The variability of the emission of the indole fluorophore makes W fluorescence a sensitive toll in
protein analysis. Taken from Alexey S. Lakoklin in Encyclopedia of Analytical Chemistry - Fluorescence
spectroscopy in peptide and protein analysis, 2000.
The form A is due to fluorescence emission of the indole chromophores in non-
polar environment. It can be exemplified by the azurin protein that display the shortest máx
emission indicating that the W residue is located in a very strong hydrophobic region. The
spectral form S (máx 307 to 317 nm) correspond to the emission of the indole located in the
relatively nonpolar environment inside the protein globule forming 1:1 exciplex with
neighboring polar groups. The spectral form I (máx 330 nm) correspond to the emission of
indole located in polar but rigid environment inside the protein globule forming 2:1
exciplex with neighboring polar groups. The form I can be exemplified by the emission
spectra of actin, chrymotrypsin and tetrameric melitin under high salt conditions. The
spectral form II (máx 340 nm) corresponds to the emission of the indole chromophores at
the protein surface in contact with bound water. The spectral form III (máx 350 nm)
corresponds to the emission of indole located at the protein surface in contact with free
water molecules. For those reason, the spectral form and maximum intensity of W can be a
good indicator of the local surroundings5.
Fluorescein and rhodamine are extrinsic fluorophores examples that are widely
used in biosciences because of their spectroscopic properties. These compounds have a

MorR-DNA association and phosphorylation
107
broad range of applications like labeling of antibodies for immunoassays, or
oligonucleotides for hybridization assay or even in DNA-protein interaction studies. The
reasons for selecting these probes include the high quantum yields and the long
wavelengths of absorption and emission, which minimize the problems of background
fluorescence of biological samples and eliminate the need for quartz optics. The lifetimes
of these compounds are about 4 ns and their emission spectra are not significantly sensitive
to solvent polarity 4.
IV.1.2.1. Fluorescein
The high fluorescence intensity of fluorescein allowed a wide application of
this fluorophore in physics and biology. The protolytic forms of free fluorescein can vary
according to acid-base equilibria, and its spectroscopic properties have been well studied.
The fluorescence of fluorescein is stronger in alkaline solution than in acidic medium.
According to acid-base equilibria there are seven prototropic species: cation, monoanion,
dianion, and neutral that are present as quinonoid, lactone and zwitterion (figure IV.3), each
of them having an associated fluorescence intensity, but the dianion form shows the
strongest absorptivity. Particular species predominate along the pH range. The spectra at
pH 0, 3.3, 5.5 and 12 are due to cation, the neutral, monoanion and the dianion, respectively
6,7,8,9.
Figure IV.3. Six ionic forms of fluorescein after Zanker and Peter (1958). Taken from Smith and Pretorius
(2002) Water SA, 28, 395-402.

Chapter IV
108
In biochemistry, fluorescein has been used to label macromolecules and its
acid-base properties can be modified upon conjugation 10,11,12,13
. Oligonucleotides attached
to fluorescein derivatives, like fluorescein isothiocyanate (FITC) and 6-carboxyfluorescein
(6-FAM), have been used in biology to monitor oligonucleotide hybrid formation, DNA-
protein interactions, and as an alternative to the use of radiolabeled oligonucleotides
14,15,16,17.
IV.1.3. Fluorescence quenching
Fluorescence quenching is any process that depopulates an excited state of a
molecule in a non-radiative away. A fluorescence quencher is a compound that participates
in this process and leads to a decrease of the fluorescence quantum yield and lifetime. In
protein biochemistry, the fluorescence quenching of W can be used to determine the
fraction of protein fluorescence accessible to quenchers, the protein conformational
changes and folding. It is important to consider that quenchers can also induce protein
denaturation, and, consequently, take W from a buried to an exposed state. Acrylamide,
disulfides, hydrogen peroxide and imidazole are some examples of W quenchers 4.
Fluorescence quenching can be classified as static or dynamic (also called
collisional). Both require molecular contact between the fluorophore and quencher.
However, quenching mechanism can also occur by excited-state reactions, molecular
rearrangements, energy transfer or ground-state complex formation 4.
Quenching data is presented as plots of I0/I versus [Q], where I0 and I are the
fluorescence intensities in the absence and presence, respectively, of a concentration of
quencher [Q].
In biochemistry, the fluorescence quenching data of proteins that contains two
W (Wᴀ and Wʙ) can be calculated using the following equation:
I=Iᴀfᴀ+Iʙ(1-fᴀ) Eq.4.1
Where: I is the total intensity, Iᴀ is the intensity of Wᴀ, fᴀ is the fraction of Wᴀ and Iʙ is
the intensity of Wʙ.

MorR-DNA association and phosphorylation
109
The equation 4.1 could be applied if a dynamic quenching results from a diffusive
encounter between the fluorophore (W) and quencher during the lifetime of the excited
state.
Static quenching is characterized by the formation of a nonfluorescent ground
state complex between the fluorophore and quencher. An important characteristic of static
quenching is its decrease with increasing temperature, since the stability of the complex in
the ground state is generally lower at higher temperatures. The principal difference between
dynamic and static quenching refers to a decrease in the lifetime of fluorophore. Both
mechanisms lead to a reduction in the fluorescence intensity, but a decrease in fluorescence
lifetime is only observed if dynamic quenching occurs within the time-scale of the time-
resolved experiment 4.
The fluorescence static quenching can be expressed in terms of quantum yields
(). The gives the efficiency of the fluorescence process since it is a ratio of photons
emitted to photons absorbed. This parameter is useful to understand the quenching of W, by
the following equation:
(
) Eq.4.2
Where N
is the quantum frequency of the native protein, 𝜒N is the fraction of
native protein and Q
is the quantum frequency of the quenched protein.
IV.1.4. Fluorescence Anisotropy
The natural light is unpolarized; which means that it has no preferential
direction. Excite the fluorophores with a polarized light (definite orientation) and record
the emitted light in a polarized system enables to study the molecules dynamics during the
excited-state lifetime. When excitation is performed with polarized light, absorption of the
fluorophore will depend on the orientation of its dipole in the ground state compared to the
polarized excitation light 3
Fluorescence anisotropy can be very useful in molecular biophysics. The
anisotropy is defined as the ratio of the difference between the emission intensity parallel to

Chapter IV
110
the polarization of the electric vector of the exciting light (I||) and that perpendicular to that
vector (I) divided by the total intensity (IT) 18
.
( ) ( )⁄ Eq.4.3
Because the anisotropy of emission (A) is related to the correlation time of the
fluorophore (τc) through the Perrin equation:
⁄ Eq.4.4
where A is the limiting anisotropy of the probe, which depends on the angle between the
absorption and emission transition dipoles and τ is the fluorescence lifetime. These
measurements can be used to obtain hydrodynamic information concerning
macromolecules and macromolecular complexes 18
.
The anisotropy is based on the observation that when a small fluorescent
molecule is excited with plane-polarized light, the emitted light is largely depolarized
because molecules tumble in solution during its τ0. Nevertheless, if the small molecule is
bound to a bigger molecule its effective molecular volume is increased. In that case, the
molecular rotation of the fluorophore is slowed down so that the emitted light is in the same
plane as the excitation energy. The bound and free states of the fluorophore each have an
intrinsic polarization values: a high value for the bound state and a low value for the free
state 4 (figure IV.4).

MorR-DNA association and phosphorylation
111
Figure IV.4. Scheme of fluorescence anisotropy of a fluorophore according to molecular motion upon
interaction with a molecule (ligand). Adapted from Rossi A.M & Taylor C.W (2011) Nature Protocols, 6,
365-387.
In spite of all the physic processes involved in molecular motion, the
complexation between two macromolecules always leads to an increase in the steady-state
fluorescence anisotropy. If no alteration in quantum yield occur upon complexation, the
data can be fitted in terms of the equilibrium constant. The sensitivity of this approach has
recently been significantly improved such that it is now applicable to the study of high-
affinity protein-nucleic acid interactions 18
.
IV.2. Methodology
IV.2.1 dsDNA labelling with fluorescein
The DNA sequences used in this section were selected based on the MorR
binding sites identified by the DNaseI footprinting experiment. Purified complementary
DNA oligonucleotides containing a 67 bp and 58 bp of the intergenic region between morP
and morS were purchased from SIGMA. The 5 end of each duplex was labeled with 6-
carboxyfluorescein (6-FAM). The labeled oligonucleotide sequences are presented in table
IV.1.
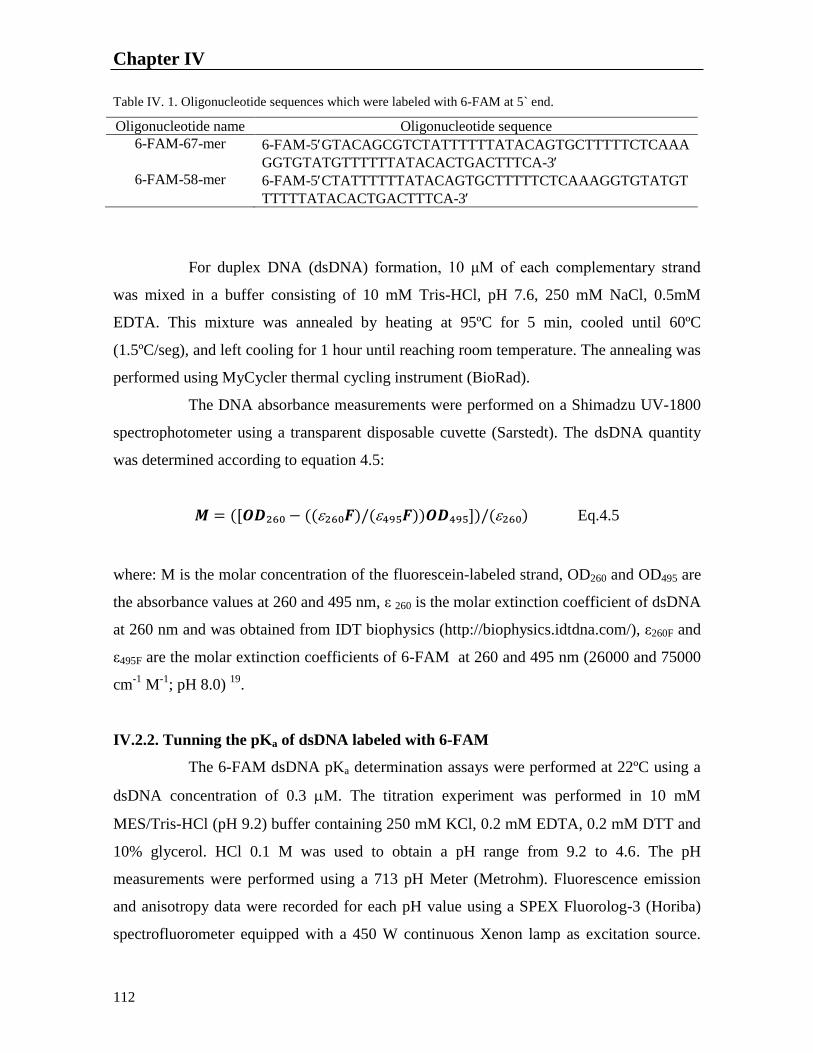
Chapter IV
112
Table IV. 1. Oligonucleotide sequences which were labeled with 6-FAM at 5` end.
Oligonucleotide name Oligonucleotide sequence
6-FAM-67-mer 6-FAM-5GTACAGCGTCTATTTTTTATACAGTGCTTTTTCTCAAA
GGTGTATGTTTTTTATACACTGACTTTCA-3
6-FAM-58-mer 6-FAM-5CTATTTTTTATACAGTGCTTTTTCTCAAAGGTGTATGT
TTTTTATACACTGACTTTCA-3
For duplex DNA (dsDNA) formation, 10 μM of each complementary strand
was mixed in a buffer consisting of 10 mM Tris-HCl, pH 7.6, 250 mM NaCl, 0.5mM
EDTA. This mixture was annealed by heating at 95ºC for 5 min, cooled until 60ºC
(1.5ºC/seg), and left cooling for 1 hour until reaching room temperature. The annealing was
performed using MyCycler thermal cycling instrument (BioRad).
The DNA absorbance measurements were performed on a Shimadzu UV-1800
spectrophotometer using a transparent disposable cuvette (Sarstedt). The dsDNA quantity
was determined according to equation 4.5:
( (( ) ( )) ) ( ) Eq.4.5
where: M is the molar concentration of the fluorescein-labeled strand, OD260 and OD495 are
the absorbance values at 260 and 495 nm, ε 260 is the molar extinction coefficient of dsDNA
at 260 nm and was obtained from IDT biophysics (http://biophysics.idtdna.com/), ε260F and
ε495F are the molar extinction coefficients of 6-FAM at 260 and 495 nm (26000 and 75000
cm-1
M-1
; pH 8.0) 19
.
IV.2.2. Tunning the pKa of dsDNA labeled with 6-FAM
The 6-FAM dsDNA pKa determination assays were performed at 22ºC using a
dsDNA concentration of 0.3 M. The titration experiment was performed in 10 mM
MES/Tris-HCl (pH 9.2) buffer containing 250 mM KCl, 0.2 mM EDTA, 0.2 mM DTT and
10% glycerol. HCl 0.1 M was used to obtain a pH range from 9.2 to 4.6. The pH
measurements were performed using a 713 pH Meter (Metrohm). Fluorescence emission
and anisotropy data were recorded for each pH value using a SPEX Fluorolog-3 (Horiba)
spectrofluorometer equipped with a 450 W continuous Xenon lamp as excitation source.

MorR-DNA association and phosphorylation
113
Suprasil quartz fluorescence cuvette, pathlength 10x10 mm with a chamber volume of
500 μL was used during the experiment.
The emission data were collected using an excitation wavelength of 475 nm and
monitoring the emission from 490 to 650 nm. The band-pass was 5 nm for excitation and
emission, and the integration time was 0.5 sec. All the emissions values were corrected for
the respective dilution factors.
The anisotropy data were recorded using an excitation wavelength of 475 nm
and monitoring the emission from 505 to 535 nm. The band pass was 5 nm for excitation
and emission, and the integration time was 2 sec. All the fluorescence measurements were
made under magic angle conditions.
The present study used a three pKa fluorescein model in order to evaluate the
distribution of different species according to the ionic strength of the medium. The
concentration of each species was determined according to the equilibrium equation (Eq.
4.6) where “F” represents the deprotonated state of fluorescein molecule:
F2-
+ H+ FH
- + H
+ FH + H
+ FH
+ Eq.4.6
( ) Eq.4.7
( ) Eq.4.8
( ) Eq.4.9
Rearrangement of equations 4.7, gives:
Eq.4.10
Replacing 4.10 on 4.8 and rearranging it gives,
Eq.4.11

Chapter IV
114
And replacing 4.11 on 4.9 gives,
Eq.4.12
The corresponding concentration fraction (α) of F2-
is given by:
Eq. 4.13
Substituting 4.10, 4.11 and 4.12 into 4.13, we obtain:
Eq.4.14
The same procedure was done for α[FH-] and α[FH]
Eq.4.15
Eq.4.16
Eq.4.17
IV.2.3 Protein-DNA binding
Fluorescence anisotropy of the 6-FAM attached to the 5end of dsDNA was
used to monitor the interaction between MorR and the intergenic region located between
morP and morS. Two different DNA strand were used: one containing 67 and other 58

MorR-DNA association and phosphorylation
115
oligonucleotides. The 6-FAM was attached to 5 end of both molecules; however, it was
covalently attached to guanine (purine) in 67-mer dsDNA, and to cytosine (pyrimidine) in
58-mer dsDNA.
The MorR-DNA binding reaction was performed identically for both 6-FAM
labeled dsDNA. The reaction occurred in 10 mM Tris-HCl, pH 7.6, with 250 mM NaCl, 0.2
mM of EDTA and DTT, and 10% glycerol. The MorR protein was also diluted in the same
buffer. A fixed concentration of 6-FAM dsDNA, 8.3 nmol, was used, with MorR being
titrated from 0 to 60 μΜ until a final volume of 3 ml in a Suprasil quartz fluorescence
cuvette, pathlength 10x10 mm, with chamber volume of 3.5 ml. Fluorescence emission and
anisotropy were recorded using a SPEX Fluorolog-3 (Horiba) spectrofluorimeter equipped
with a 450 W continuous Xenon lamp as excitation source.
The emission and anisotropy parameters were the same used for determination
of pKa (unit IV.2.2) except for the integration time that was 0.5 sec.
For MorR-DNA binding, a model consisting of two nucleotide binding sites
was evaluated in order to determine the association constants (K1 and K2). This model
contemplates the consecutive binding of two protein monomers to the DNA, according to
equation 4.18.
Eq.4.18
( ) Eq.4.19
Eq.4.20
( ) ( ) Eq.4.21
Eq.4.22
And substituting the equation 4.20 into equation 4.22, we obtain:
Eq.4.23

Chapter IV
116
The total concentration of DNA (DNAT) is equal to:
Eq.4.24
And the fraction of DNAfree is equal to:
( ) Eq.4.25
Substituting the equation 4.20 and 4.23 into 4.25 gives,
( ) Eq.4.26
The same procedure was done for α[DNAP] and α[DNAP2]
( ) Eq.4.27
( ) Eq.4.28
( ) Eq.4.29
( ) Eq.4.30
The data were evaluated according to equations 4.26, 4.28 and 4.30 and fitted
according to the nonlinear last square calculation.
IV.2.4. MorR oligomerization
The fluorescence emission of MorR was measured in the presence of the
phosphodonors acetylphosphate and phosphoramidate. The reaction was performed with 2
μM of MorR diluted in a buffer consisting of 10 mM Tris-HCl, pH 7.6, with 2 mM of

MorR-DNA association and phosphorylation
117
MgCl2 in a final volume of 3 ml. A Suprasil quartz fluorescence cuvette was used,
pathlength 10x10 mm, with chamber volume of 3.5 ml.
The fluorescence emission was recorded using a SPEX Fluorolog-3
spectrofluorometer equipped with a 450 W continuous Xenon lamp as excitation source.
The W was excited at 290 nm and emission was monitored from 300 to 550 nm. The band
pass was 2 nm for excitation, and emission, and the integration time was 0.5 sec. All the
emissions values were corrected for their respective dilution factors.
The data were evaluated as Static Quenching according to equation 4.31:
( ) Eq.4.31
Where N is the quantum frequency of the Native protein (without quencher),
𝜒N is the fraction of the native protein and Q is the quantum frequency of the quencher.
Rearrangement of equation 4.31, gives:
( ) Eq.4.32
( ) Eq.4.33
( ) Eq.4.34
( ) Eq.4.35
(
)
Eq.4.36
Where = quenching efficiency
Rearrangement of equation 4.36, gives:
( ) ( ( ) Eq.4.37
( ) ( ) Eq.4.38
Chapter IV
118
where: I is the total intensity, I₀ is the intensity of tryptophan in the absence of
quencher (Q) and K is the quenching constant. The data was fitted using nonlinear least
square calculation.
IV.2.5. Computational biochemistry
All geometry optimizations were performed with Gaussian 09, applying density
functional theory methods20
. Becke’s three-parameter exchange functional was used
together with the functional of Lee et al. (B3LYP) 21,22,23
as implemented in Gaussian and
the 6-31G(d) basis set. In all geometry optimizations, we first searched for the transition
state starting from a structure similar to the reactants model. This was generally obtained
with mono-dimensional scans where the reaction coordinate that we were interested in, was
shortened or stretched. Once the transition state was located, the reactants and the products,
associated with it, were determined through internal reaction coordinate (IRC) calculations.
In all cases, the geometry optimizations and the stationary points were obtained with
standard Gaussian convergence criteria. The transition state structures were all verified by
vibrational frequency calculations, having exactly one imaginary frequency with the correct
transition vector, even using frozen atoms, which shows that the frozen atoms are almost
free from steric strain.
IV.3. Results and Discussion
IV.3.1. Fluorescein labeled oligonucleotide pKa determination
In order to understand the fluorescence behavior of the fluorophore that was
chosen for the DNA labeling, the fluorescence emission and anisotropy of 6-FAM-67-mer
dsDNA were measured at different pHs. The raw and area normalized spectra obtained are
present in figure IV.5.

MorR-DNA association and phosphorylation
119
500 550 600 6500
1x10⁵
2x10⁵
3x10⁵
4x10⁵
5x10⁵
6x10⁵
7x10⁵
8x10⁵
pH
9.2
8.9
8.7
8.5
8.3
8.1
7.8
7.5
7.2
7
6.8
6.6
6.4
6.2
6
5.6
5.3
Inte
nsi
ty /
a.u
.
wavelength / nm
A
480 500 520 540 560 580 600 620 6400.000
0.005
0.010
0.015
0.020
pH
9.2
8.9
8.7
8.5
8.3
8.1
7.8
7.5
7.2
7.0
6.8
6.6
6.4
6.2
6.0
5.6
5.3
No
rm
ali
zed
In
ten
sity
wavelength / nm
B
Figure IV.5. Fluorescence emission and anisotropy of 6-FAM-67-mer dsDNA at different pH, ranging from 5
to 9.2. A) Fluorescence emission raw spectra. B) Area normalized fluorescence emission spectra.
The results showed that as the pH becomes more acidic, the total fluorescence
emission decreases. However, the fluorescence shifted at 545 nm where the fluorescence
intensity of 6-FAM increased in acidic conditions. Moreover, the decrease in fluorescence
emission intensity is accompanied by an increase in anisotropy (figure IV.6). This result is
important for protein-DNA interaction studies where oligonucleotides are labeled with 6-
FAM and when anisotropy is used to monitor the binding reaction. In those cases, the
fluorescence emission should not vary during the experiment, and the anisotropy values

Chapter IV
120
should be the only parameter allowed to change upon binding. Because of that, it is
important to control the reaction in order to avoid variations of pH.
5 6 7 8 9 100.06
0.07
0.08
0.09
0.10
0.11
0.12
0.0
0.2
0.4
0.6
0.8
1.0
1.2
1.4
1.6
1.8
An
iso
tro
py
pH
Anisotropy
Emission
Norm
ali
zed
in
ters
ity
Figure IV.6. pH dependence of fluorescence intensity (circles) and steady-state anisotropy (squares) of 6-
FAM-67-mer dsDNA. Experimental fluorescence emission values were normalized. Lines represent the
fitting of the data assuming acid-base equilibrium which allowed the determination of pKa’s.
The 6-FAM-67-mer dsDNA diagram species was based on the three pKa
fluorescein model (methodology section IV.2.2) that considers four types of fluorescein
species: the cationic (FH+), neutral (FH), monoanionic (FH
-), and dianionic (F
2-). In acidic
conditions, at pH 5.3, 71% of the fluorescein is FH+, and 29% is FH. Once the pH became
more alkaline, the percentage of cationic species decreases and, at pH 7, only 3% is FH+,
53% is FH, 45% is FH- and no F
2- form is present. Under the experimental conditions used
for the present study (pH 7.5), 72% is FH- and 27% is FH. The FH
- is the predominant
species from pH 7.5 to 9.2 (figure IV.7). It is known that the dianionic fluorescein has the
highest fluorescence intensity over the other fluorescein species9. However, our results
shows that this species starts to emerge above a pH 8 and its fluorescence intensity is
modest even at pH 9 and therefore the use of reactional conditions to obtain a considerable
amount of dianionic fluorescein are not suitable for protein stabilization. The presence of
the monoanionic species under the pH used in this study does not invalid assays of MorR-
DNA interaction. The monoanionic species pursues a considerable degree of fluorescence
that is capable to sense the interaction between two macromolecules. Moreover, the

MorR-DNA association and phosphorylation
121
anisotropy of 6-FAM does not changed significantly from pH 7 to 8. So any significant
anisotropic change observed for MorR-DNA interaction in a future experiment using a
buffer around this pH range would be a result of a reliable macromolecules association.
5 6 7 8 9 10
0
20
40
60
80
100
Mola
r fr
act
ion
(%
)
pH
F2-
FH-
FH
FH+
Figure IV.7. Diagram species of 6-FAM-67-mer dsDNA. At pH 7.5 the monoanioc specie is prevalent (72%),
followed by neutral (26%), dianionic (1%), and cationic (0.4%).
The fitting of both set of data (fluorescence emission and anisotropy) allowed
the calculation of apparent pKa’s for the 6-FAM-67-mer dsDNA which were compared
with those of fluorescein free in solution, and FITC-9-mer dsDNA as presented on the table
IV.2.
Table IV. 2. pKa values of free fluorescein, FITC-9-mer dsDNA and 6-FAM-67.mer dsDNA.
pKa1 pKa2 pKa3
“free fluorescein”a 2.3 4.2 6.3
FITC-9-mer dsDNA b - - 7.02
6-FAM-67-mer dsDNA 5.7 7.1 9.3
a – taken from H. Diehl (1989) Talanta, 36, 413-415
b – taken from R. Sjöback (1998) Biopolymers, 46, 445-453
The studies about the fluorescein attached to DNA are under constant
evolution, and there is a debate concerning the influence of oligonucleotide length on any
spectroscopic alterations, pKa and anisotropy values. However, the prevalence of the
fluorescein monoanionic species under the experimental conditions of this study (pH 7.5) is

Chapter IV
122
not in agreement with some previously published data. Sjöback et al., (1998) reported that
at pH 7.46, 72% of fluorescein conjugated with DNA oligonucleotides was in the dianion
form and 28% as monoanion 24
. This study proved that the oligonucleotide length (ranging
from 9 to 18 bp) did not significantly alter the fluorescein pKa values when compared with
solution of free fluorescein (pKa of 6.43). However, other studies regarding the
characteristics of fluorescein-labeled oligonucleotides have shown that differences in the
oligonucleotide length and base pair composition beside the fluorophore caused
spectroscopic variations. Anderson et al., (2008) verified that smaller (17 pb)
oligonucleotides had higher anisotropy upon protein binding than longer (22 bp)
oligonucleotides 25
. Moreover, changes in anisotropy and quantum yields have been
identified after a single strand fluorescein-labeled oligonucleotide hybridizes to its
complementary strand 26,27
. The evaluation of the GC content of the oligonucleotides
reported by Sjöback and Anderson showed no significant difference: 43.15% and 54.4%,
respectively. However, the 6-FAM position differed between them. The oligonucleotides
studied by Sjöback were linked at the 5 end of the duplex; on the contrary Anderson
labeled the probes at 3 end. Moreover, based on the Sjöback work, some studies which
used fluorescein labeled oligomers were carried out under the fundamental assumption that
the dianionic form predominates or that a single fluorescein species was present under pH 7
to 8 28,29
. Our results show the absence of single fluorescein specie and a low degree of the
dianionic species around pH 7 to 8. Around this pH at least 2 species predominated (FH-
and FH).
The present study evaluated the prototropic forms of 6-FAM attached to the 5
end of a 67-mer oligonucleotide with 31% of GC content. The results indicate that
fluorescein acid - base equilibrium changed upon conjugation to the nucleic acids.
However, it is not possible to predict if this equilibrium is affected by DNA length,
conformations or composition.
The present study showed that the anisotropy values were affected by the
protonation status of the fluorophore (figure IV.6). In this context, the acid base
equilibrium of fluorescein-labeled oligonucleotide is an important tool to optimize binding
assays. The variation in 6-FAM fluorescence emission was related with the emerging
fluorescein species along the pH range (figure IV.7). Because of that, a constant 6-FAM

MorR-DNA association and phosphorylation
123
emission should be a prerequisite during studies that monitor DNA-protein binding using
anisotropy as a tool to access the interaction.
IV.3.2. MorR-DNA interaction
Fluorescence anisotropy of MorR-DNA interaction was measured in order to
determine the association constant between the target intergenic region and MorR. For this
reason and considering the results obtained from the calculation of the apparent pKa, a
constant fluorescence emission was made a prerequisite, and solely the anisotropy values
varied. Moreover, two 6-FAM labeled dsDNA were constructed (figure IV.8). Both
molecules contained the entire MorR binding sites identified by DNaseI footprinting. The
first molecule is the 6-FAM-67-mer dsDNA where fluorescein is covalently attached to
guanine (purine), and the second molecule is the 6-FAM-58-mer dsDNA where fluorescein
is covalently attached to cytosine (pyrimidine).
Figure IV.8. 6-FAM labeled dsDNA used for fluorescence anisotropy experiments. The MorR nucleotide
binding sites identified by DNaseI footprinting are represented in red, and the position of 6-FAM is
evidenced. A) 6-FAM-67-mer dsDNA. B) 6-FAM-58-mer dsDNA.
In both experiments, a fixed concentration of 6-FAM dsDNA was used, and the
MorR concentration varied from 0 to 60 µM. The results show that fluorescence emission
was constant along the titration so that a single fluorescein species was present during the
experiment (figure IV.9) and therefore the anisotropy values were a result of MorR-DNA
interaction and are not due to protonation status of the fluorophore.
A
B

Chapter IV
124
500 550 600 6500.000
0.005
0.010
0.015
0.020
No
rma
lize
d I
nte
nsi
tyWavelength/nm
6-FAM-67-mer
500 550 600 6500.000
0.005
0.010
0.015
0.020
N
orm
ali
zed
in
ten
sity
Wavelength/nm
6-FAM-58-mer
Figure IV.9. Area normalized fluorescence emission of 6-FAM-67-mer dsDNA and 6-FAM-58-mer dsDNA
along the titrations experiments.
The anisotropy values were enhanced with increasing concentrations of MorR,
and the resulting binding curve was fitted to the proposed two steps model (see equation
4.18) (figure IV.10). Furthermore, the anisotropy of 6-FAM-67-mer dsDNA was shown to
vary from 0.071 to 0.107, and that of 6-FAM-58-mer dsDNA from 0.073 to 0.127.

MorR-DNA association and phosphorylation
125
0 10 20 30 40 50 600.06
0.07
0.08
0.09
0.10
0.11
0.12
0.13
0.14
0.0 0.5 1.0 1.5 2.0 2.5 3.00.064
0.068
0.072
0.076
0.080
58mer
An
iso
tro
py
MorR (M)
6-FAM-67-mer
6-FAM-58-mer
An
iso
tro
py
orR(M) Figure IV.10. Fluorescence anisotropy of 6-FAM-67-mer dsDNA and 6-FAM-58-mer dsDNA during the
titrations experiments. The graphic shows the variation of anisotropy, where errors bars represent the standard
deviation, and the squares and circles show the medium value obtained from seven anisotropy readings for
each DNA strand. The equilibrium binding was analyzed according to equations 4.18, and the nonlinear least
square mathematical model was applied and is presented as a straight line. The insert shows the anisotropy
variation for 6-FAM-58-mer dsDNA from 0 to 3µM.
The similarity of both experiment allowed the fitting of both data using
nonlinear least square in order to determine the association constant between MorR and
DNA and also the anisotropy values (r) of the fluorophore according to the binding state
(table IV.3).
Table IV.3. Association constants determined for MorR binding to the intergenic region between morS and
morP following the two step binding model. K1 is the association constant for the first binding site and K2 for
the second binding site. The anisotropy value (r) of the fluorophore is also shown.
dsDNA
Association constants
K1 (x105 M
-1) K2(x10
5 M
-1)
15.5 0.02
Anisotropy r1 r2
0.074 0.127
The observed data for 6-FAM-67-mer and 6-FAM-58-mer is presented in table
IV.4 and figure IV.11. The interaction of MorR with 6-FAM-67-mer dsDNA reveals that

Chapter IV
126
the protein binds highly to a first binding site and with lower affinity to a second binding
site. Analysis of the data showed that when MorR reached a concentration of 8.78 µM,
13% of the 6-FAM-67-mer DNA was free, 85% of the first binding site was bound, and 1%
of the second binding site was occupied. As soon as MorR concentration increases, a
greater fraction of first and second binding sites is bound. However, the first binding site
reaches a plateau at 20 µM of MorR, with 90% of the site was occupied by the protein. This
is followed by a slight decrease in the percentage of occupancy of this site. In an opposite
way, there was no observable plateau for the second binding site. When MorR reached a
final concentration of 60 µM, 2% of the DNA remained free, 88% of the first binding site
was occupied, and 10% the second binding site was bound.
The affinity of MorR to 6-FAM-58-mer dsDNA is similar to the one observed
for 6-FAM-67-mer dsDNA, except for the fact that fluorescein position facilitated the
visualization of the MorR binding to the second site. This result is in agreement with the
DNaseI footprinting experiment given that, in this case, the fluorescein was positioned
nearest of the binding site. When MorR reached a concentration of 8.78 µM, 0% of the 6-
FAM-58-mer dsDNA was free, while 84% was bound to the first binding site, and 16% of
the second binding position. Increasing the concentration of MorR leads to increase in the
number of occupied sites. At 20µM of MorR, 0% of the DNA was free, 70% of the first
binding site was bound, and 30% of the second binding site was occupied. When MorR
reached a final concentration of 60 µM, there was no (0%) free DNA, 44% of the first
binding site was bound, and 56% of the second binding site was occupied.
Table IV.4. MorR binding sites proposed occupancy according to the two binding sites model.
Site of occupancy MorR (M) % of occupancy
67mer 58mer
free 8.78 13 0
20 6 0
60 2 0
1st 8.78 85 84
20 90 70
60 88 44
2nd 8.78 1 16
20 3 30
60 10 56

MorR-DNA association and phosphorylation
127
0.04 0.32 1.48 5.7 12.8 20 50
0
20
40
60
80
100
Mola
r fr
act
ion
(%
)
MorR (µM) *
Free
1st
binding site
2nd
binding site
6-FAM-67-mer
0.04 0.32 1.48 5.7 12.8 20 50
0
20
40
60
80
100
Mo
lar
fra
ctio
n (
%)
MorR (µM) *
Free
1st
binding site
2nd
binding site
6-FAM-58-mer
(*) Multiple concentration scale in different orders of magnitude in order to better visualize the distribution of the MorR
occupation sites.
Figure IV.11. Occupation of the nucleotide binding sites of 6-FAM-67-mer and 6-FAM-58-mer dsDNA in
response to MorR interaction. The free DNA where that is no interaction with MorR is presented as line and
circles. The first binding site occupancy is represented by a line and square. The second binding site
occupancy is represented as line and triangle.
A
B

Chapter IV
128
The fluorescence anisotropy of both molecules followed the same profile, since
increase in the concentration of MorR leads to enhanced anisotropy values. Moreover, a
considerable increase in anisotropy was visualized above a MorR concentration of 8.78
µM. At this point, the second binding site starts to be occupied (figure IV.12). The results
showed that the anisotropy increases as soon as the second binding site was bound, even
though with lower affinity, and this interaction could be visualized because of the
proximity of the fluorophore to this site (figure IV.8, B). The data comparison between 6-
FAM-67-mer and 6-FAM-58-mer showed that changes in 6-FAM position influenced in the
sensitivity of the assay for MorR interaction with the second binding site (figure IV.12, B).
This assumption is based on the analysis of MorR binding profile to 6-FAM-58-mer. In that
way, it is plausible to consider that MorR binds firstly to a site located far from 6-FAM
(with high affinity giving rise to low anisotropy values), and subsequently the protein
interacts to a second binding site positioned near to the fluorophore (figure IV.13). Those
binding sites cover the predicted -35 (first site) and -10 (second site) promoters sequences
(figure II.7). We cannot predict if this protein behavior occurs in vivo, but it indicates that
MorR could acts as a repressor given that it occupies a binding site that might be used by
RNA polymerase for transcription initiation.

MorR-DNA association and phosphorylation
129
0.04 0.32 1.48 5.7 12.8 20 50
0
20
40
60
80
100
0.06
0.07
0.08
0.09
0.10
0.11
0.12
0.13
Mola
r fr
act
ion
(%
)
MorR (µM)
1st
binding site
2nd
binding site
anisotropy
6-FAM-67-mer
An
iso
tro
py
0.04 0.32 1.48 5.7 12.8 20 50
0
20
40
60
80
100
0.06
0.07
0.08
0.09
0.10
0.11
0.12
0.13
Mola
r fr
act
ion
(%
)
MorR (µM)
1st
binding site
2nd
binding site
anisotropy
An
isotr
op
y
6-FAM-58-mer
Figure IV.12. Binding sites occupancy of 6-FAM-67-mer and 6-FAM-58-mer molecules with the
fluorescence anisotropy enhancement. The first binding site occupancy is presented as line and square. The
second binding site occupancy is presented as line and triangle, and the anisotropy is presented as line and
asterisk.
A
B

Chapter IV
130
Figure IV.13. Predict model for MorR-DNA interaction. The 6-FAM position is evidenced and the two DNA
binding sites are delimitated by rectangles. The blue circles represents the MorR protein.
Regarding the 6-FAM-58-mer interaction with MorR, the anisotropy shape of
the fluorophore during the initial stage of the binding curve showed a decrease in the values
ranging from 0.074 (no protein) to 0.069 (0.7M of protein) (figure IV.10, internal
graphic). This result is not in line with the conjecture that the interaction between the
protein and DNA increase the anisotropy values of the fluorophore. Additionally, this
behavior was not observed for MorR interaction with 6-FAM-67-mer. So, any factor (pH or
fluorescence lifetime) enhanced the fluorophore rotational capacity of 6-FAM-58-mer.
There are two possible explanations for this result:
1. or the addition of MorR changed the local acid condition around the fluorophore leading
to emergence of other fluorescein species.
2. or the interaction of MorR with 6-FAM-58-mer led to a DNA conformational change
that facilitated the rotational capacity of the fluorophore.
In other to solve this question, the fluorescence lifetime of the 6-FAM-58-mer
dsDNA was evaluated under the same experimental conditions, and the results are
presented in table IV.5

MorR-DNA association and phosphorylation
131
Table IV.5. Fluorescein-dsDNA single-photon counting analysis as a function of the MorR protein
concentration.
[MorR] /M /ps 2
0.0 3432 1.081
0.9 3416 1.104
4.4 3461 1.163
4.1 3472 1.246
8.0 3537 1.183
The result shows a quite constant fluorescence lifetime of the fluorophore upon
MorR interaction and a mono-exponential decay profile. Those evidences reinforce the
assumption that a single fluorescein species was present during the experiment (excluding
the pH variation hypothesis) and indicate that fluorescein became more available to rotate
after MorR addition. Finally, we conclude that a conformational change of the 6-FAM-58-
mer DNA occurred upon MorR binding, which increased the fluorophore rotation. We
propose that 6-FAM-58-mer dsDNA was coiled (with 6-FAM less available to rotate) and
MorR binding straightened the molecule during the first interaction process enhancing the
fluorophore rotational capacity.
IV.3.3. Study of MorR phosphorylation by fluorescence spectroscopy
The comprehension about the protein photochemical characteristics associated
with phosphorylation by small phosphodonors is an important aspect to understand the real
influence of its compounds in the oligomerization status of transcriptional regulatory
protein belonging to two component systems.
Analysis of the amino acid sequence of MorR revealed the presence of 2 W, 9 F
and 11 Y. The first W is at position 29 and the second at 360, and they are part of the
receiver and central domain, respectively. In order to study the MorR conformational
change induced by small phosphodonors, the MorR fluorescence emission was excited
during independent titration reactions using two different phosphodonors: acetylphosphate
and phosphoramidate. The results showed that both phosphor-donors induced a decrease in
W fluorescence intensity (figure IV.14). However, phosphoramidate caused a higher
decrease in W emission but without any observed shift (figure IV.15).

Chapter IV
132
300 350 400 450 500 5500.0
5.0x10⁶
1.0x10⁷
1.5x10⁷
2.0x10⁷
2.5x10⁷
3.0x10⁷
Inte
nsi
ty /
a.u
Wavelength / nm
0 mM
0.49 mM
9.8 mM
19 mM
27 mM
35 mM
Trp emission
Acetylphosphate
300 350 400 450 500 550
5.0x10⁶
1.0x10⁷
1.5x10⁷
2.0x10⁷
2.5x10⁷
Inte
nsi
ty /
a.u
Wavelength / nm
0 mM
0.49 mM
9.8 mM
19 mM
27 mM
35 mM
Trp emission
Phosphoramidate
Figure IV.14. Raw spectra of MorR tryptophan emission during a titration with phosphodonors. A)
Acetylphosphate. B) Phosphoramidate.
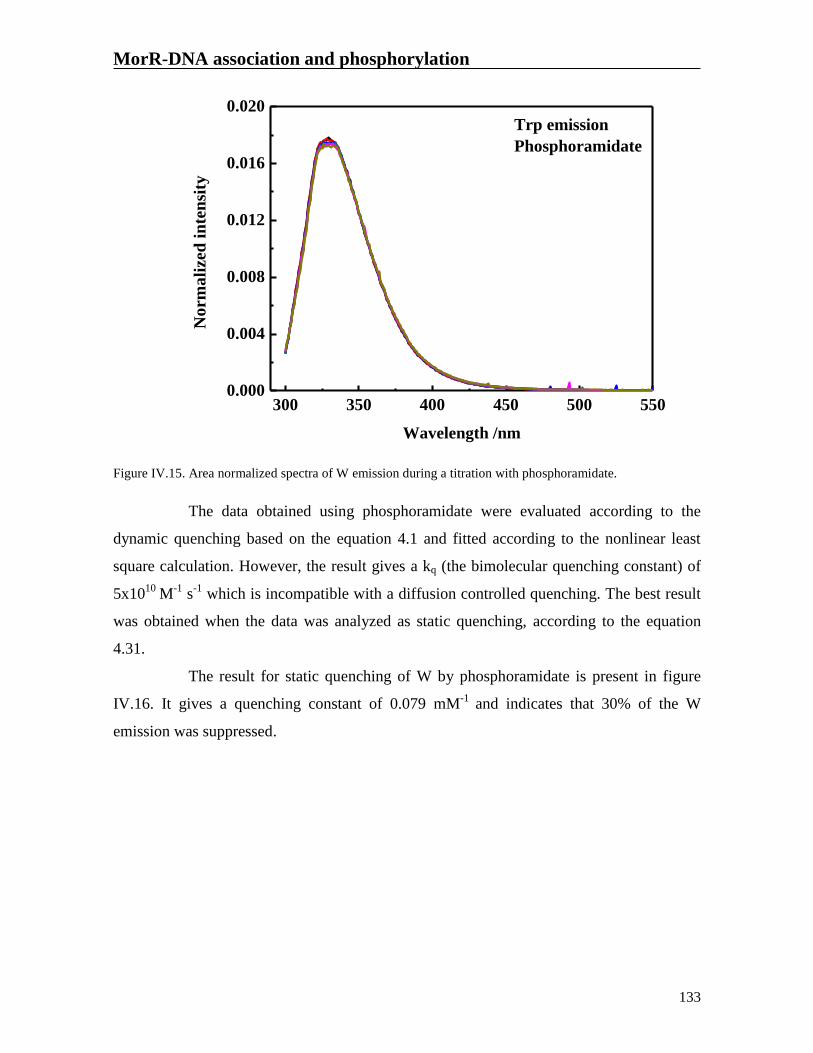
MorR-DNA association and phosphorylation
133
300 350 400 450 500 5500.000
0.004
0.008
0.012
0.016
0.020
No
rm
ali
zed
in
ten
sity
Wavelength /nm
Trp emission
Phosphoramidate
Figure IV.15. Area normalized spectra of W emission during a titration with phosphoramidate.
The data obtained using phosphoramidate were evaluated according to the
dynamic quenching based on the equation 4.1 and fitted according to the nonlinear least
square calculation. However, the result gives a kq (the bimolecular quenching constant) of
5x10¹⁰
M-1
s-1
which is incompatible with a diffusion controlled quenching. The best result
was obtained when the data was analyzed as static quenching, according to the equation
4.31.
The result for static quenching of W by phosphoramidate is present in figure
IV.16. It gives a quenching constant of 0.079 mM-1
and indicates that 30% of the W
emission was suppressed.

Chapter IV
134
0 5 10 15 20 25 30 35 40 450.70
0.75
0.80
0.85
0.90
0.95
1.00
F/F
0
Phosphoramidate (mM)
Figure IV.16. Static quenching for MorR titration with phosphoramidate. The line represents the fitting of the
data using nonlinear least square and the squares represents the experimental data.
The results show that MorR interaction with phosphoramidate, and not with
acetylphosphate, caused a considerable decrease in fluorescence emission of W. This
quenching probably is not followed by any conformational alteration in the protein
structure since no wavelength shift was observed. This result is in agreement with the gel
filtration chromatography where no MorR oligomerization was visualized in the presence
of phosphodonors. The fluorescence quenching of W caused by the phosphodonor is not a
direct prove that the protein was phosphorylated. In order to visualize phospho-amino acid
(if existent), the samples that were submitted to titration with both phosphodonors were
analyzed by nano-LC-MS.
IV.3.4. Identification of MorR phospho-peptides
In order to identify the presence of phospho-amino acid in the MorR that was
submitted to phospho-donors titrations, the samples were analyzed by nano LC-MS tandem
mass spectrometry. Phospho-peptides were identified in both samples, with coverage of
89% and 95% for MorR with acetylphosphate, and phosphoramidate, respectively. The
results showed the presence of common phospho peptides for the two phosphodonors, but
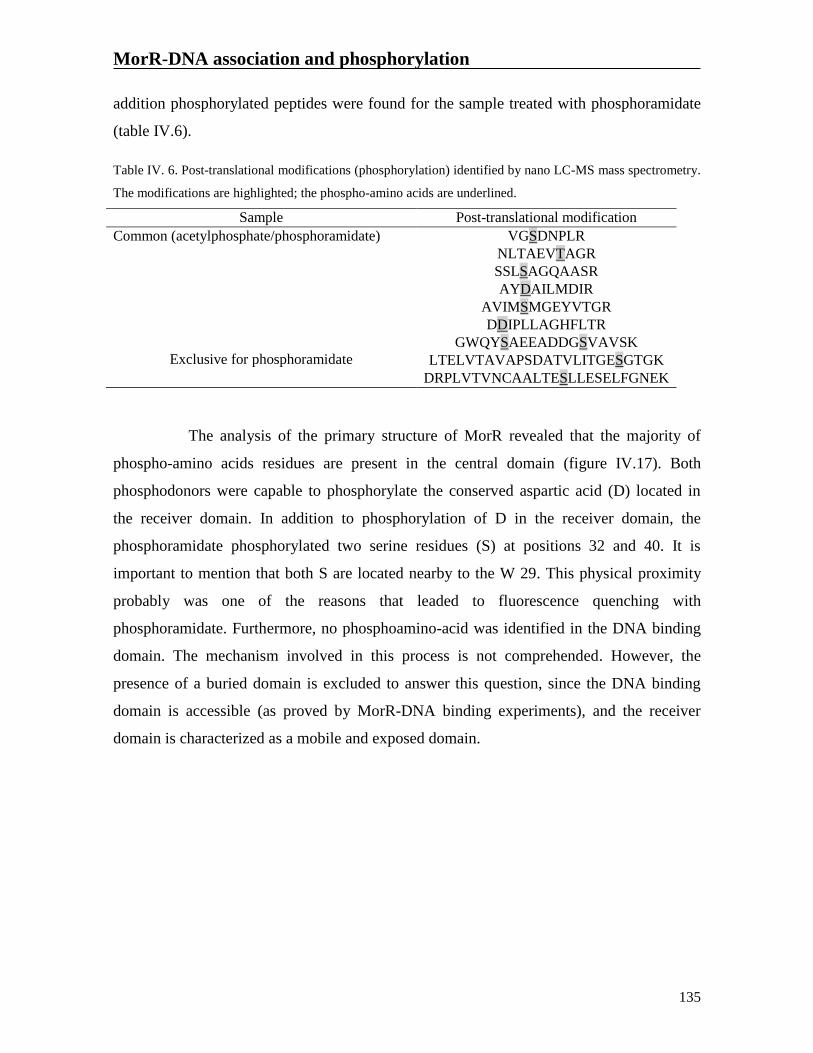
MorR-DNA association and phosphorylation
135
addition phosphorylated peptides were found for the sample treated with phosphoramidate
(table IV.6).
Table IV. 6. Post-translational modifications (phosphorylation) identified by nano LC-MS mass spectrometry.
The modifications are highlighted; the phospho-amino acids are underlined.
Sample Post-translational modification
Common (acetylphosphate/phosphoramidate) VGSDNPLR
NLTAEVTAGR
SSLSAGQAASR
AYDAILMDIR
AVIMSMGEYVTGR
DDIPLLAGHFLTR
Exclusive for phosphoramidate
GWQYSAEEADDGSVAVSK
LTELVTAVAPSDATVLITGESGTGK
DRPLVTVNCAALTESLLESELFGNEK
The analysis of the primary structure of MorR revealed that the majority of
phospho-amino acids residues are present in the central domain (figure IV.17). Both
phosphodonors were capable to phosphorylate the conserved aspartic acid (D) located in
the receiver domain. In addition to phosphorylation of D in the receiver domain, the
phosphoramidate phosphorylated two serine residues (S) at positions 32 and 40. It is
important to mention that both S are located nearby to the W 29. This physical proximity
probably was one of the reasons that leaded to fluorescence quenching with
phosphoramidate. Furthermore, no phosphoamino-acid was identified in the DNA binding
domain. The mechanism involved in this process is not comprehended. However, the
presence of a buried domain is excluded to answer this question, since the DNA binding
domain is accessible (as proved by MorR-DNA binding experiments), and the receiver
domain is characterized as a mobile and exposed domain.

Chapter IV
136
Figure IV. 17. The MorR amino acid composition with conserved regions detached, and the phospho-amino
acids identified by nano LC-MS. The amino acids are colored according to its domain localization: red for
receiver domain, blue for ATPase domain and green for DNA binding domain. W are bolded in yellow. The
phospho-amino acids identified in both samples are bolded in grey and highlighted with an asterisk (*). The
phospho-amino acids identified solely in sample submitted to phosphoramidate are bolded in red and
highlighted with an hashtag (#).
Analysis of the alignment (figure III.2) shows that both tryptophan residues are
conserved between MorR and ZraR. However, the ZraR crystal structure available (PDB
code: 1OJL) lacks the receiver domain containing the W 29 residue. Moreover, the receiver
domain of MorR shares similarities with the RR CheY (31.4%). However, the amino acid
residue alignment between MorR and CheY revealed the absence of the conserved W
(figure IV.18). As the inactive state of NtrC shows an intrinsic flexibility of the receiver
domain 30
. So, this characteristic is attributed to solvent exposed domains 31
we may expect
that this can also occur for the MorR receiver domain. Hence, it is reasonable to predict that
the MorR receiver domain has a similar characteristic and might be solvent exposed.
Walker A
Walker B
R-finger
#
#
#
#
#
#
*
*
*
*
* * *
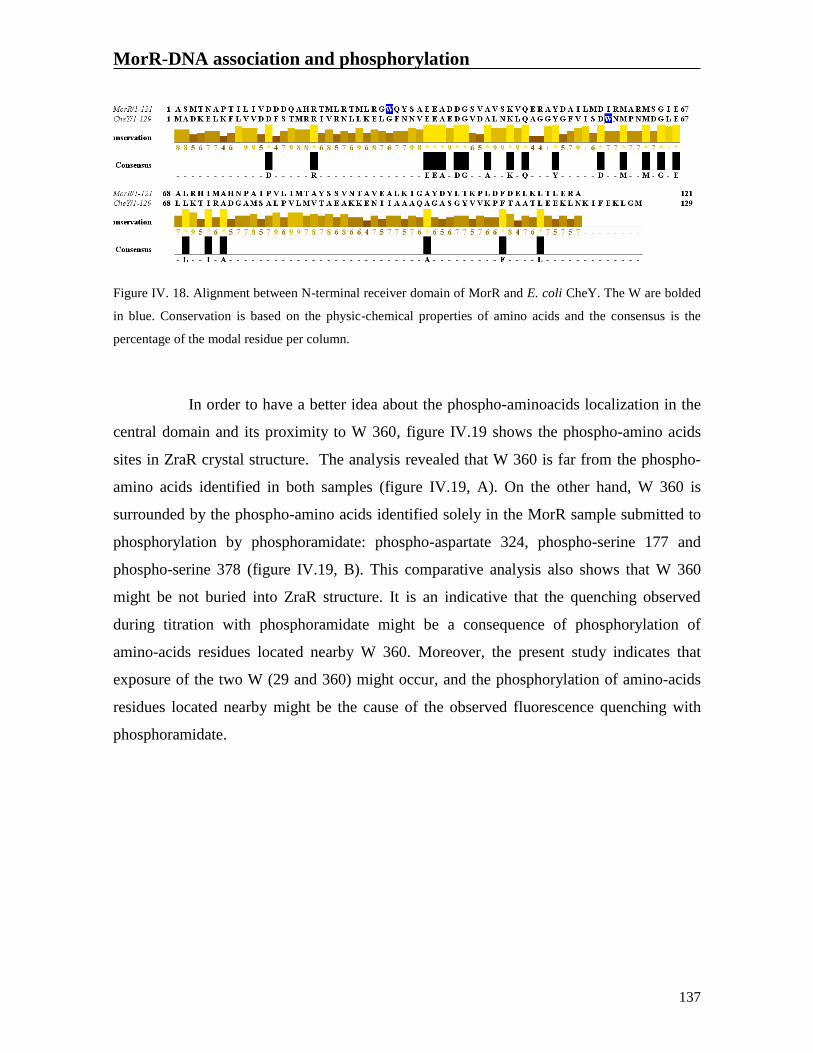
MorR-DNA association and phosphorylation
137
Figure IV. 18. Alignment between N-terminal receiver domain of MorR and E. coli CheY. The W are bolded
in blue. Conservation is based on the physic-chemical properties of amino acids and the consensus is the
percentage of the modal residue per column.
In order to have a better idea about the phospho-aminoacids localization in the
central domain and its proximity to W 360, figure IV.19 shows the phospho-amino acids
sites in ZraR crystal structure. The analysis revealed that W 360 is far from the phospho-
amino acids identified in both samples (figure IV.19, A). On the other hand, W 360 is
surrounded by the phospho-amino acids identified solely in the MorR sample submitted to
phosphorylation by phosphoramidate: phospho-aspartate 324, phospho-serine 177 and
phospho-serine 378 (figure IV.19, B). This comparative analysis also shows that W 360
might be not buried into ZraR structure. It is an indicative that the quenching observed
during titration with phosphoramidate might be a consequence of phosphorylation of
amino-acids residues located nearby W 360. Moreover, the present study indicates that
exposure of the two W (29 and 360) might occur, and the phosphorylation of amino-acids
residues located nearby might be the cause of the observed fluorescence quenching with
phosphoramidate.

Chapter IV
138
Figure IV.19. Comparison of MorR phospho-amino acids localization in the ZraR central domain crystal
structure. A) Phospho-amino acids residues identified in sample submitted to phosphorylation with
acetylphosphate and phosphoramidate. B) Phospho-amino acids residues identified solely in sample submitted
to phosphorylation with phosphoramidate.
A
B

MorR-DNA association and phosphorylation
139
The results obtained by nano LC-MS corroborate the data observed during the
fluorescence spectroscopy experiments. The data indicate that W emission is quenched
when amino acids positioned around the fluorophore are phosphorylated. The first
phospho-S (GWQYSAEEADDGSVAVSK) identified solely in the sample submitted to
titration with phosphoramidate is positioned two amino acids away from W 29 (located at
the receiver domain). Furthermore, the ZraR crystal structure comparison shows that the W
360 residue might not be buried inside the protein structure, indicating that its fluorescence
was affected by phosphorylation of amino-acids residues located near its position. So, these
results show that the fluorescence quenching was not attributed to any oligomerization
process. Moreover, no fluorescence shift was observed during the experiments (figure
IV.15). Our results indicate that W fluorescence emission quenching reflected the
phosphorylation process that occurred in amino acids located surrounding it.
There are some works reporting the use of fluorescence W emission to monitor
phosphorylation process in RR proteins32,33,34
. A study evaluating the fluorescence
spectrum of six different copies of CheY upon interaction with acetylphosphate showed
that a conserved W106
emission was quenched in the presence of this phosphodonor. In
spite of the highest similarity between the target proteins, the fluorescence profile was not
the same among them. One of the proteins, the variant CheY1, does not present any W
quenching upon interaction with acetylphosphate. In order to answer this unexpected result,
the authors postulated that the conformational alteration of CheY1 mediated by
acetylphosphate did not change the environment around the W 35
. The fluorescence studies
of W quenching in RR have the same principal focus: monitor the phosphorylation status of
the adjacent phospho-accepting D residue upon phosphorylation. Our results show that
other aminoacids, rather than D, are phosphorylated in the presence of phosphodonors.
However, an open question remains. Why does phosphoramidate have an
enhanced capacity to phosphorylate MorR when compared to acetylphosphate? To answer
this question we have performed some theoretical calculations regarding the catalytic
mechanism of the phosphorylation process using density functional theory and the 6-
31G(d) basis set.
Regarding the total number of phospho-amino acids identified by nano-LC MS,
most of them are serines, we have studied the catalytic mechanism of phosphorylation only

Chapter IV
140
with serine. We believe that such mechanism can serve as a general example for the
phosphorylation mechanism of any amino acid.
Figure IV.20. First step of the phosphorylation process with hydrogen-phosphoamid and acethyl-phosphate.
The theoretical calculations have shown that the phosphorylation process
requires two sequential steps. The first step (figure IV.20) involves two concerted proton
transfers involving serine as catalyst. In both cases, the proton of one of the hydroxyl
groups of the phosphate groups is abstracted by the hydroxyl group of serine, at the same
time that the proton some hydroxyl group of serine is transferred to the amino group or the
acetate group of the phosphate compound depending on the phosphorylating agent. In the
end of both reactions, two products are obtained: phosphenic acid and ammonia when the
phosphorylating agent is phosphoramidate and phosphenic acid and acetic acid if the
phosphorylating agent is acetylphosphate.
Although the mechanism of the first step of both reactions is apparently similar,
the energetic profile is very different. When the phosphorylating agent is phosphoramidate
this reaction requires 10.1 kcal/mol and is endothermic in 3.6 kcal/mol. While when the

MorR-DNA association and phosphorylation
141
phosphorylating agent is acetylphosphate the reaction is less favorable requiring 19.6
kcal/mol for the activation energy and 19.1 kcal/mol for the reaction energy. The
differences observed in the calculated energies are dependent on how easy the hydrogen
atom transfer occurs between serine and the phosphorylating agent. The higher energies
observed with acetylphosphate result from the bulkier nature of the groups attached to the
oxygen atom that receives the proton and therefore difficulties the reaction.
It must be mentioned that we have also tried to study the same reaction without
the presence of serine as catalyst. In all the studied cases there was no reaction, a results
that indicates that the phosphorylation process requires the presence of a catalyst.
Figure IV.21. Second step of the phosphorylation process.
The second step of both reactions (figure IV.21) is identical in both cases and
involves the nucleophilic attack of serine to the phosphenic acid that resulted from the first
step of both reactions. The theoretical calculations revealed that in the course of this
process the proton from the hydroxyl group of serine is transferred to one of the keto
groups of the phosphenic acid. This allowed the formation of phospho-serine in a single
step without requiring additional steps. This reaction requires 11.0 kcal/mol and it is
exothermic in -8.9 kcal/mol.

Chapter IV
142
Figure IV. 22. Full energetic profile of the phosphorylation process.
The full energetic profile of both reactions is displayed at figure IV.22. This
figure shows that when the phosphorylating agent is phosphoramidate, the full energetic
profile of the reaction is exothermic in -5.3 kal/mol, while when the phosphorylating agent
is acetylphosphate it is endothermic in 10.2 kcal/mol. In addition the energies involved in
the phosphorylation of serine by phosphoramidate are much lower when compared to the
ones obtained with the acetylphosphate. These two facts reveal that the phosphorylation of
serine is from the kinetic and thermodynamic point of view much more favorable when the
phosphorylation takes place with phosphoramidate than with acetylphosphate. The reasons
behind such behavior is dependent on the first step of the mechanism and how easy the
concomitant hydrogen atom transfer occurs between serine and the phosphorylation agent
that is required for the formation of the phosphenic acid. These data goes in line with the
fluorescence and nano LC-MS results and explain why phosphoramidate phosphorylate
more amino acids than acetylphosphate
When looking into family of proteins, similar to MorR, the conserved D56
present at the receiver domain is the amino acid residue that usually undergoes
phosphorylation. This process leads to an effective output response associated with
enhanced of DNA binding. In the present study the anisotropy of 6-FAM dsDNA was
investigated in the presence of phospho-MorR. However, no changes in anisotropy values
were observed relatively to control experiments (data not shown). However, we believe that

MorR-DNA association and phosphorylation
143
some experimental optimatimization should be performed to conclude any influence of
MorR phosphorylation in DNA binding.

Chapter IV
144
IV.4. References
1. JOSEPH R. LAKOWICZ. Topics in Fluorescence Spectroscopy, Vol. 7: DNA
Technology. (KLUWER ACADEMIC PUBLISHERS, 2003).
2. Bernard Valeur. Molecular Fluorescence: Principles and Applications. (Wiley-VCH
Verlag GmbH, 2001).
3. Albani, J. R. Principles and Applications of Fluorescence Spectroscopy. (Blackwell,
2007).
4. JOSEPH R. LAKOWICZ. Principles and Applications of Fluorescence
Spectroscopy, 2nd Edition. (KLUWER ACADEMIC PUBLISHERS, 1999).
5. Ladoklin, A. S. Fluorescence Spectroscopy in Peptide and Protein Analysis. 5762–
5779 (in Encyclopedia of Analytical Chemistry, 2000).
6. Sjback, R., Nygren, J. & Kubista, M. Absorption and fluorescence properties of
fluorescein. Spectrochim. acta part A 51, L7–L21 (1995).
7. Gholivand, M. B., Ghasemi, J. B., Saaidpour, S. & Mohajeri, A. Spectrophotometric
study of the effects of surfactants and ethanol on the acidity constants of fluorescein.
Spectrochim. Acta. A. Mol. Biomol. Spectrosc. 71, 1158–65 (2008).
8. Smith, S. A. & Pretorius, W. A. Spectrophotometric determination of pKa values for
fluorescein using activity coefficient corrections. Water SA 28, 395–402 (2002).
9. Martin, M. M. & Lindqvist, L. The pH dependence of fluorescein fluorescence. J.
Lumin. 10, 381–390 (1975).
10. Klonis, N. & Sawyer, W. H. Spectral properties of the prototropic forms of
fluorescein in aqueous solution. J. Fluoresc. 6, 147–157 (1996).
11. Lavis, L. D., Rutkoski, T. J. & Raines, R. T. Tuning the pKa of Fluorescein to
Optimize Binding Assays. Anal. Chem. 79, 6775–6782 (2007).
12. Stanton, S. G., Kantor, A. B., Petrossian, A. & Owicki, J. C. Location and dynamics
of a membrane-bound fluorescent hapten a spectroscopic study. Biochim. Biophys.
Acta 776, 228–236 (1984).
13. Friedrich, K., Woolley, P. & Steinhäuser, K. G. Electrostatic potential of
macromolecules measured by pKa shift of a fluorophore. 2. Transfer RNA. Eur. J.
Biochem. 173, 233–9 (1988).

MorR-DNA association and phosphorylation
145
14. Murakami, A. et al. Fluorescent-labeled oligonucleotide probles: detection of hybrid
formation in solution by fluorescence polarization spectroscopy. Nucleic Acids Res.
19, 4097–4102 (1991).
15. Qin, J. et al. Convergent evolution of a new arsenic binding site in the ArsR/SmtB
family of metalloregulators. J. Biol. Chem. 282, 34346–55 (2007).
16. Reedstrom, R. J., Brown, M. P., Grillo, a, Roen, D. & Royer, C. a. Affinity and
specificity of trp repressor-DNA interactions studied with fluorescent
oligonucleotides. J. Mol. Biol. 273, 572–85 (1997).
17. Ballal, R., Cheema, A., Ahmad, W., Rosen, E. M. & Saha, T. Fluorescent
oligonucleotides can serve as suitable alternatives to radiolabeled oligonucleotides.
J. Biomol. Tech. 20, 190–4 (2009).
18. Royer, C. a. Approaches to teaching fluorescence spectroscopy. Biophys. J. 68,
1191–5 (1995).
19. Heyduk, T., Ma, Y., Tang, H. & Ebright, R. H. Fluorescence anisotropy: rapid,
quantitative assay for protein-DNA and protein-protein interaction. Methods
Enzymol. 274, 492–503 (1996).
20. M. J., D. J. F. et al. Gaussian09. Gaussian, Inc., Wallingford CT (2009).
21. Becke, A. D. Density-functional thermochemistry. III. The role of exact exchange. J.
Chem. Phys. 98, 5648 (1993).
22. Lee, C., Yang, W. & Parr, R. Development of the Colle-Salvetti correlation-energy
formula into a functional of the electron density. Phys. Rev. B. Condens. Matter 37,
785–789 (1988).
23. Stephens, P. J., Devlin, F. J., Chabalowski, C. F. & Frisch, M. J. Ab Initio
Calculation of Vibrational Absorption and Circular Dichroism Spectra Using
Density Functional Force Fields. J. Phys. Chem. 98, 11623–11627 (1994).
24. Robert Sjoback, Jan Nygren, M. K. Characterization of Fluorescein –
Oligonucleotide Conjugates and Measurement of Local Electrostatic Potential. Biopo
46, 445–453 (1998).
25. Anderson, B. J., Larkin, C., Guja, K. & Schildbach, J. F. Using fluorophore-labeled
oligonucleotides to measure affinities of protein-DNA interactions. Methods
Enzymol. 450, 253–72 (2008).
26. Nazarenko, I., Pires, R., Lowe, B., Obaidy, M. & Rashtchian, A. Effect of primary
and secondary structure of oligodeoxyribonucleotides on the fluorescent properties
of conjugated dyes. Nucleic Acids Res. 30, 2089–195 (2002).

Chapter IV
146
27. Wang, L., Gaigalas, a K., Blasic, J. & Holden, M. J. Spectroscopic characterization
of fluorescein- and tetramethylrhodamine-labeled oligonucleotides and their
complexes with a DNA template. Spectrochim. Acta. A. Mol. Biomol. Spectrosc. 60,
2741–50 (2004).
28. Kumke, M. U., Li, G., McGown, L. B., Walker, G. T. & Linn, C. P. Hybridization of
fluorescein-labeled DNA oligomers detected by fluorescence anisotropy with protein
binding enhancement. Anal. Chem. 67, 3945–51 (1995).
29. Delgadillo, R. F. & Parkhurst, L. J. Spectroscopic properties of fluorescein and
rhodamine dyes attached to DNA. Photochem. Photobiol. 86, 261–72 (2010).
30. Liu, M. S. et al. Coarse-grained dynamics of the receiver domain of NtrC:
fluctuations, correlations and implications for allosteric cooperativity. Proteins 73,
218–27 (2008).
31. Roche, P., Mouawad, L., Perahia, D., Samama, J.-P. & Kahn, D. Molecular
dynamics of the FixJ receiver domain: movement of the beta4-alpha4 loop correlates
with the in and out flip of Phe101. Protein Sci. 11, 2622–30 (2002).
32. Lukat, G. S., McCleary, W. R., Stock, a M. & Stock, J. B. Phosphorylation of
bacterial response regulator proteins by low molecular weight phospho-donors. Proc.
Natl. Acad. Sci. U. S. A. 89, 718–22 (1992).
33. Schuster, M., Silversmith, R. E. & Bourret, R. B. Conformational coupling in the
chemotaxis response regulator CheY. Proc. Natl. Acad. Sci. U. S. A. 98, 6003–8
(2001).
34. McCleary, W. R. The activation of PhoB by acetylphosphate. Mol. Microbiol. 20,
1155–63 (1996).
35. Ferré, A., De La Mora, J., Ballado, T., Camarena, L. & Dreyfus, G. Biochemical
study of multiple CheY response regulators of the chemotactic pathway of
Rhodobacter sphaeroides. J. Bacteriol. 186, 5172–7 (2004).

Chapter V
Conclusion

Chapter V
148

Conclusion
149
V. Conclusion
Analysis of the intergenic region between morS and morP reveals the presence
of two divergently transcribed promoters (54 and 70). The 54 promoter might be involved
in gene transcription regulation of morP gene. The 70 might be involved in regulation of
morS and morP genes.
The morR gene was cloned on a pET expression vector and the expression
conditions to obtain MorR protein were optimized. The expression profile reveals that
morR is transcribed even in the absence of transcription inducer (IPTG). This evidence
indicates a misrule of T7 RNA polymerase expression from lacUV5 promoter revealing the
leaky nature of the pET expression systems, but also that MorR is a nontoxic product for
E.coli.
The MorR protein was expressed as soluble protein and purified. It is a
monomer in solution, with a molecular mass of ~52kDa and a molar extinction coefficient
at 280 nm of 30823M-1
cm-1
.
EMSA determine that MorR protein binds the intergenic region between morP
and morS and therefore might be involved in gene transcription regulation of those genes.
This regulation might be mediated from the divergently 54 and 70 promoters. DNA
footprinting assays have shown that MorR binds to a target 54 bp intergenic region. This
protected region covers positions -145 to -200 relative to morP transcription start site +1.
This result is in agreement with a transcription mediated via RNAP54, where
transcriptional activators bind far from the promoter they control. The MorR protein also
binds to the putative -10 and -35 promoters located upstream of morS gene. This result
indicates that MorR could control morS transcriptional level and its own transcriptional by
interaction with RNAP70 since both genes morR and morS might be are encoded by the
same operon.
MorR binds to a palindromic region (TTTTTTATA) located in the intergenic
region between morS and morP. This evidence suggests that MorR has two distinct binding
regions.
The prototropic form of 6-FAM-67mer carrying the target intergenic region
was determinate in order to define which fluorescein specie is present under experimental
procedures. The fluorescence spectroscopy characterization of the 6-FAM revealed that

Chapter V
150
anisotropy varies according to the acid-base equilibrium of the medium. This is an
important parameter to consider for biochemistry studies that wish to determine protein-
DNA interaction using fluorescein as a probe. For such studies, a constant fluorescein
emission is a prerequisite to determine association constants between macromolecules.
The fluorescence spectroscopy results confirmed that MorR binds to the target
DNA at two different regions. The result identified two association constants: 15.5 M-1
for
the first binding site and 0.02M-1
for the second binding site. The results also
demonstrated that MorR has different affinities for those two binding sites. In this way,
MorR binds firstly and highly to the conserved DNA region that covers the putative -35
box. Then, the protein binds with low affinity to the second binding site that covers the -10
conserved box.
The monoanionic specie of fluorescein covalently attached to 67-mer
oligonucleotide was predominant under pH 7.5.
The 6-FAM position near the protein binding site, rather than the
oligonucleotide length, is the factor that influences in the anisotropy values. So, this
proximity of the fluorophore to the protein binding site increased the sensitivity of the
assay. The pka of fluorescein labeled with DNA is different from the pka of free
fluorescein. This evaluation is important for optimization of techniques that use fluorescein
conjugated with oligonucleotides.
The nano-LC-MS revealed that MorR was purified without any phospho amino
acid. The MorR conformational change induced by phosphorylation was investigated using
acetylphosphate and phosphoramidate as small phosphodonors. The phosphorylation status
of MorR was determined by gel filtration and the experiments revealed that MorR do not
oligomerize in the presence of those small phosphodonors.
Phosphoramidate, rather than acetylphosphate, caused a static quenching in the
MorR-tryptophan emission. The tryptophan emission is 30% suppressed in the presence of
phosphoramidate. This quenching is not followed by a shift in the tryptophan emission.
Therefore, the MorR oligomerization may not occur in the presence of phosphoramidate
which corroborate with the gel filtration experiments. Additionally, the conserved acid
aspartic residue (D55) was phosphorylated by both small phosphodonors.

Conclusion
151
The phosphorylation reaction of serine, mediated by phosphoramidate and
acetylphosphate, requires two sequential steps. The first step is crucial to determine the
reactivity of the reaction. In this way, the reaction is more favorable when the
phosphorylating agent is phosphoramidate. Therefore, phosphorylation of serine residues is
kinetic and thermodynamically more favorable with phosphoramidate than
acetylphosphate. This result explains why phosphoramidate phosphorylated more amino
acids than acetylphosphate.
The quenching of MorR indicates that amino acids located near to the
tryptophan were phosphorylated. As a perspective, it will important to determine if the
phosphorylation alter the MorR binding affinity to the intergenic region between morS and
morP.
The present study proposes a new mechanism for morP, morS and morR
transcription regulation (figure V.1). We postulate that the inactive form of MorR represses
its own promoter by binding to the -35 conserved box, blocking the RNAP70 polymerase
activity. This model considers that a basal level of transcription of morP, morS and morR
exists. The inactive MorR (not phosphorylated) although bound to the target intergenic
region is powerless to enhance the morP transcription through 54 promoter. We believe
that the inactive form does not have all the potential to give the mechanical force that is
necessary to RNAP54 activity.

Chapter V
152
Figure V. 1. Model for morSR and morP transcriptional regulation proposed by the present work.

Conclusion
153
In the presence of Mo in the medium (figure V.1, B), MorP incorporates this
metal in its structure which leads to a protein conformation change. Then, the uninhibited
MorS is capable to autophosphorylates and transfer the phosphoryl group to MorR.
However, we believe that this route for MorR activation isn’t unique and the MorR
autophosphorylation enhanced capacity should be considered. The active form of MorR
might has an enhanced ATPase activity that allows the interaction with RNAP54 which
leads to morP transcription activation. In this way, the activated form is not able anymore
to binds to the putative -35 conserved sequence which allows the transcription of morSR
genes by RNAP70. We believe that the MorR binding to the putative -10 conserved box
(less preferable for MorR binding) could be an additional way for transcriptional regulation
of morSR. This mechanism might be involved with an enhanced capacity for deactivation
of the transcriptional apparatus that are necessary for Mo homeostasis.
V.1. Future Perspectives
Perform crystallographic studies of MorR
Identify if the DNA binding constants are altered when MorR is phosphorylated
Perform transcriptional assay studies to address if the activated form of MorR
enhance the transcription of the morP gene
Perform transcriptional assay studies to address if MorR acts as a negative self-
regulator of morR gene and morS and identify if the activated form derepress the
morRS.
Identify if other post translational modifications, such as glycosylation, alters the
conformational structure of MorR and if it has any influence on the function of the
protein.
Perform ATPase activity experiments


![Capping Protein Modulates Actin Remodeling in Response to ... · Capping Protein Modulates Actin Remodeling in Response to Reactive Oxygen Species during Plant Innate Immunity1[OPEN]](https://static.fdocuments.in/doc/165x107/5eac886ca71dc066fd5b1a1e/capping-protein-modulates-actin-remodeling-in-response-to-capping-protein-modulates.jpg)
