Protein-Energy Malnutritionscripties.umcg.eldoc.ub.rug.nl/.../2010/MendelMarijke/Mendel.docx ·...
39
Protein-Energy Malnutrition Hypoglycemia and the role of endogenous glucose production Paediatric Department Queen Elizabeth Central Hospital, Blantyre, Malawi & Metabolic Lab Center University Medical Center Groningen Dr. R.H.J. Bandsma, lokale begeleider Dr. P.F. van Rheenen, facultaire begeleider January 2008 – July 2008
Transcript of Protein-Energy Malnutritionscripties.umcg.eldoc.ub.rug.nl/.../2010/MendelMarijke/Mendel.docx ·...
Protein-Energy MalnutritionHypoglycemia and the role of endogenous glucose production
Paediatric DepartmentQueen Elizabeth Central Hospital, Blantyre, Malawi
&Metabolic Lab Center
University Medical Center Groningen
Dr. R.H.J. Bandsma, lokale begeleiderDr. P.F. van Rheenen, facultaire begeleider
January 2008 – July 2008
By
Marijke Mendel2010
Revised version

- Malawi -The warm heart of Africa
November 2007 – April 2008
2
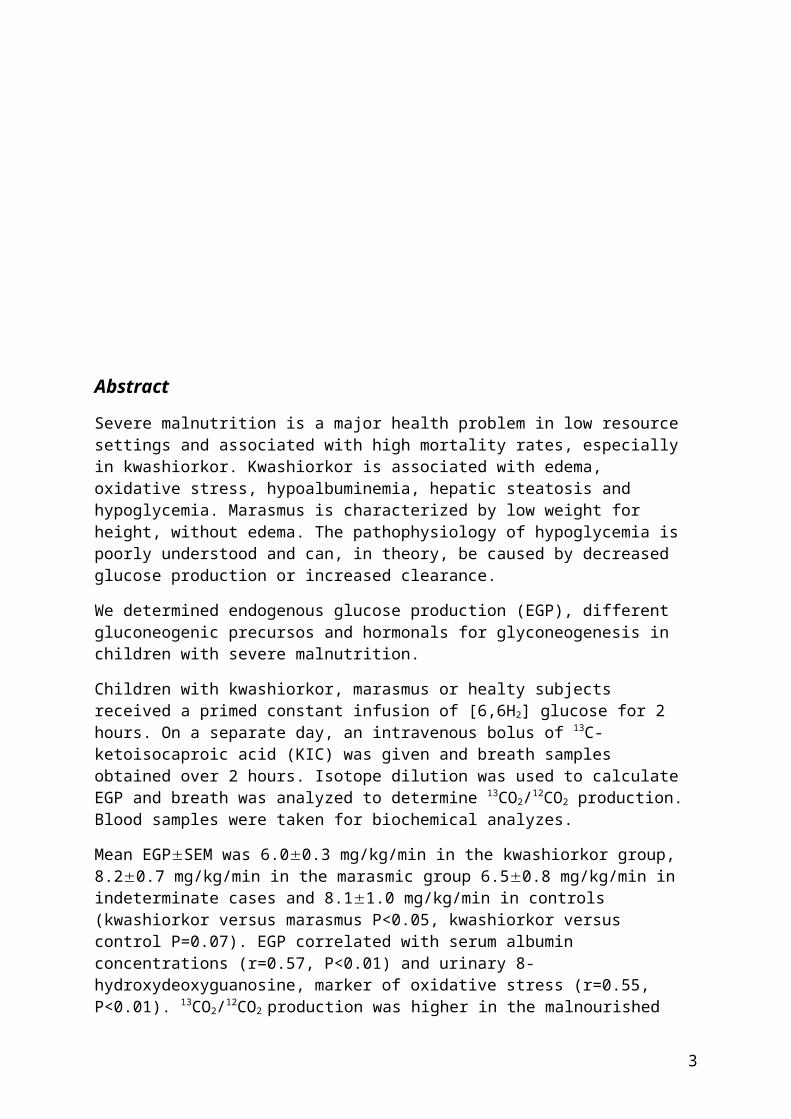
Abstract
Severe malnutrition is a major health problem in low resource settings and associated with high mortality rates, especially in kwashiorkor. Kwashiorkor is associated with edema, oxidative stress, hypoalbuminemia, hepatic steatosis and hypoglycemia. Marasmus is characterized by low weight for height, without edema. The pathophysiology of hypoglycemia is poorly understood and can, in theory, be caused by decreased glucose production or increased clearance.
We determined endogenous glucose production (EGP), different gluconeogenic precursos and hormonals for glyconeogenesis in children with severe malnutrition.
Children with kwashiorkor, marasmus or healty subjects received a primed constant infusion of [6,6H2] glucose for 2 hours. On a separate day, an intravenous bolus of 13C-ketoisocaproic acid (KIC) was given and breath samples obtained over 2 hours. Isotope dilution was used to calculate EGP and breath was analyzed to determine 13CO2/12CO2 production. Blood samples were taken for biochemical analyzes.
Mean EGPSEM was 6.00.3 mg/kg/min in the kwashiorkor group, 8.20.7 mg/kg/min in the marasmic group 6.50.8 mg/kg/min in indeterminate cases and 8.11.0 mg/kg/min in controls (kwashiorkor versus marasmus P<0.05, kwashiorkor versus control P=0.07). EGP correlated with serum albumin concentrations (r=0.57, P<0.01) and urinary 8-hydroxydeoxyguanosine, marker of oxidative stress (r=0.55, P<0.01). 13CO2/12CO2 production was higher in the malnourished groups compared to controls. Glyconeogenic precursors and hormones were similar in all groups, except lower glucagon levels in kwashiorkor.
Decreased EGP is related to the degree of hypoalbuminemia and oxidative stress in severely malnourished children. Hepatic mitochondrial dysfunction does not seem to play a role in decreased EGP compared to controls in severe malnutrition.
3
Table of Contents
I. Abstract 3
II. Introduction 5
III. Material and Methods 8
IV. Results 11
V. Discussion 15
VI. Conclusion(s) 18
VII. Bibliography 19
VIII. Appendices 23
IX. Dutch summary 27
4

Introduction
The health burden of malnutrition
In sub Saharan Africa severe acute and chronic malnutrition presenting as kwashiorkor or marasmus is one of the major health problems and in the underlying cause of child mortality, associated with 54% of the annual 10 million global child deaths.1
Severe malnutrition presents as two clinical forms. Kwashiorkor is clinically characterized by irritability, loss of appetite, hair discoloration and loss changes, edema, hepatomegaly and dyspigmentation. Metabolic features include hypoalbuminemia, hepatic steatosis and hypoglycemia.2-5 In non-HIV infected children, kwashiorkor is associated with a higher mortality rate than marasmus. Marasmus is characterized by severe wasting (Weight for Height (Wght/Hght) < 70%, i.e. > 3SD under reference range according to WHO) without edema, caused by deficient energy intakes.
While the HIV/AIDS epidemic has altered the epidemiology, pathophysiology, and prognosis of severe malnutrition1, several basic pathophysiological differences between kwashiorkor and marasmus are poorly understood.
Malnutrition in Malawi
In Malawi, located in the southern east of Africa, the infant mortality rate (per 1,000 live births) for children under 5 is 110.2 Severe malnutrition increases the risk of disease and early death, especially in all under-five deaths each year in developing countries.3
The Queen Elizabeth Central Hospital (QECH) located in Blantyre, the economic center of Malawi, is the largest hospital in Malawi with 1,100 beds and more than 1,300 patients at any given time. It also has the largest malnutrition ward in Africa. The paediatric department serves 100,000 children a year for various illnesses, including malnutrition, malaria, and gastritis. In a study performed in March 2000, the prevalence of HIV infection in 991 admitted children, and infection was particularly common in children with malnutrition.3
This district government teaching and referral hospital provides free services to the population. The hospital was built in 1964; the College of Medicine was built in 1991. The paediatric department provides tertiary paediatric clinical care to referred patients from the district, the region and beyond. It also serves as the district hospital for the Blantyre District for which it needs primary care. The department has provided limited outreach support to the health units in the southern region of Malawi. The department carries out research into locally relevant health problems, such as malnutrition.
Metabolic disturbances and oxidative stress
Kwashiorkor is associated with metabolic disturbances. In the past a hypothesis was proposed that dysadaptation of protein and lipid metabolism to chronic food deprivation results in kwashiorkor.6,7 The hypothesis was based on the findings in marasmus compared to kwashiorkor. Adaption to food deprivation involved the gradual wasting of muscle and fat to provide energy for survival and amino acids to protect various metabolic processes such as synthesis of proteins essential for homeostasis. In kwashiorkor tissue catabolism was found not to occur to the same extent as in marasmus, leading to the conclusion there was an insufficient supply of amino acids and
5
fatty acids from muscle and adipose tissue breakdown to fill the shortage created by inadequate dietary intakes.8
Later, investigators reformed their hypothesis by the observations that children with edematous malnutrition, i.e., kwashiorkor had lower blood glutathione (GSH), a primary intracellular anti-oxidant/detoxicant, and evidence of oxidative stress-induced damage leading to the hypothesis of free radical damage of cellular membranes. Golden et all proposed that depletion of erythrocyte GSH in children with oedemateous severe malnutrition was caused primarily by increased consumption rather than decreased synthesis.9 On the other hand, Farook et al. suggested that plasma cysteine concentration, a precursor of glutathione, was markedly lower in children with kwashiorkor but not in marasmus, supported the notion of decreased GSH synthesis related to a shortage of cysteine.8 The results of study by Jahoor et al. on erythrocyte GSH kinetics and plasma and erythrocytefree cysteine concentrations indicated that GSH deficiency is characteristic in kwashiorkor and related to a reduced rate of synthesis secondary to a shortage in cysteine supply. They conclude children with kwashiorkor had impaired ability to synthesise the anti-oxidant GSH, but there was no evidence that this impairment existed prior to the disease and therefore caused it, but suggesting that anti-oxidant depletion might be a consequence of kwashiorkor.8
Hypoglycaemia in malnutrition
Hypoglycemia has been a well established feature of kwashiorkor2,10,11, although it has also been described in patients with severe wasting. Hypoglycemia could be caused by substrate deficiency leading to impaired gluconeogenesis or disturbed glycogenolysis results of endocrine imbalance 3. Baig and Edozien observed a low level of growth hormone and adrenal glucocorticoids, both antagonist of insulin, as an explanation of endocrine imbalance.12 Glucocorticoids are important in starvation as blood glucose fall to low. Glucocorticoids stimulate gluconeogenesis, and if levels of glucocorticoids are low it might affect gluconeogenesis in malnutrition. In a small study with malnourished children they didn’t found impaired glucose production. The measurements of glucose production in two nutritional states, before treatment and in recovered children, was not different in spite of a large difference in availability of gluconeogenic amino acids.13 Data from a kwashiorkor rat model, however, did suggest impaired hepatic endogenous glucose production (EGP).14
Several hormones control hepatic glucose production. Insulin lowers the blood glucose level and stimulates the synthesis of glycogen from glucose in the liver, as well as promoting synthesis of protein and lipids. Insulin inhibits lipolysis, a process to breakdown lipids to glycerol and fatty acids. Glycerol is a precursor of glucose. In contrast, glucagon stimulates the gluconeogenic pathway by stimulating the liver to convert glycogen into glucose. Cortisol stimulates glyconeogenesis in another way. It mobilizes amino acids from the non-hepatic tissues. Amino acids are one of the noncarbohydrate precursors of glyconeogenesis. Growth hormone increased the rate of protein synthesis and also mobilization and stimulates the use of fatty acids.
Free fatty acids (FFA) concentrations are increased in kwashiorkor.15 Hadden et al. suggested in 1967 that a block in the utilisation of FFA could lead to impaired glucose tolerance in kwashiorkor.3 Limited data suggest there is an impairment of glucose tolerance in kwashiorkor.12 Glucose tolerance depends upon the interaction between insulin sensitivity and secretion. Indirect evidence suggests that glucose intolerance
6
could be related to a disturbed insulin secretion.16,17 The plasma FFA levels are likely elevated due to increased adipose tissue lipolysis, perhaps related to impairment in insulin secretion, as insulin is the main hormone regulating lipolysis. FFA stimulates hepatic synthesis of VLDL-triglyceride. Inadequate insulin secretion resulted in the dysfunction of the liver in the synthesis of triglyceride, indirect leading to hepatic steatosis.18
Rao20 observed in malnutrition diet receiving weanling-littermate rats hepatic insulin resistance and impairment of glucagon secretion. Normally the hormone glucagon causing the liver to convert glycogen to glucose, when blood glucose level fall too low. There is also evidence for an association between hepatic glucagon resistance and an increase in liver lipid infiltration.19
Hepatic mitochondrial dysfunction could be one of the causes of impaired gluconeogenesis. There is indirect data to suggest that a defect in mitochondrial function kwashiorkor is present.9,21 Oxidative stress has been found to play a key role in kwashiorkor, which is known to affect mitochondrial function.22 Patients with hepatic steatosis demonstrate increased peroxidation of lipids and decreased antioxidant capacity.23 Severe hepatic steatosis in kwashiorkor is likely to contribute to increased hepatic oxidative stress. Surplus tissue fatty acids has been shown to stimulate oxidative stress, leading to mitochondrial damage and cell death.22 A combination of oxidative stress and steatosis can thus lead to impairment of mitochondrial function24,25 and ATP production26, whereas ATP, produced in mitochondria, is necessary for glyconeogenesis.
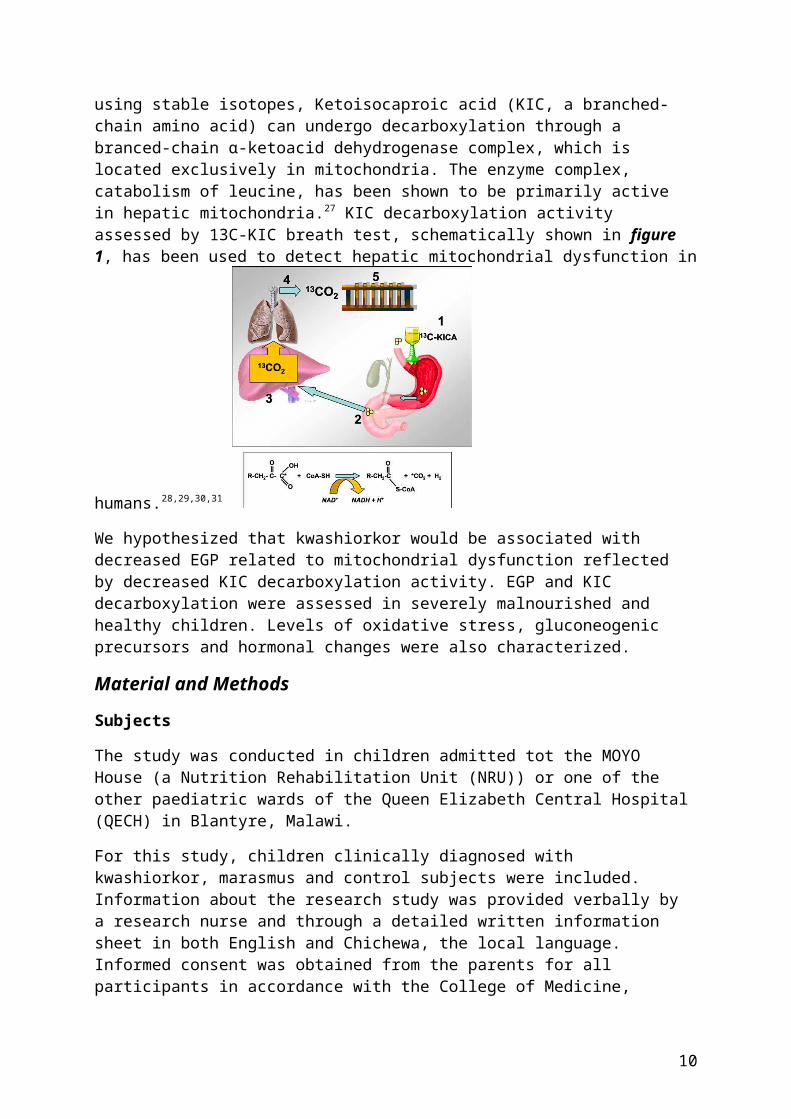
Various biochemical functions can be determine by breath tests using stable isotopes, Ketoisocaproic acid (KIC, a branched-chain amino acid) can undergo decarboxylation through a branced-chain -ketoacid dehydrogenase complex, which is located αexclusively in mitochondria. The enzyme complex, catabolism of leucine, has been shown to be primarily active in hepatic mitochondria.27 KIC decarboxylation activity assessed by 13C-KIC breath test, schematically shown in figure 1, has been used to detect hepatic mitochondrial dysfunction in humans.28,29,30,31
We hypothesized that kwashiorkor would be associated with decreased EGP related to mitochondrial dysfunction reflected by decreased KIC decarboxylation activity. EGP and KIC decarboxylation were assessed in severely malnourished and healthy children. Levels of oxidative stress, gluconeogenic precursors and hormonal changes were also characterized.
Figure 1. General principles of the 13C-stable breath test for the dynamic study of liver function.32 It shows schematically how the 13C-breath test is applied in practice. In our study with children the labelled isotope 13C-ketocisocaproic acid was given intravenously, so this picture is not true to our study.
7

Material and Methods
Subjects
The study was conducted in children admitted tot the MOYO House (a Nutrition Rehabilitation Unit (NRU)) or one of the other paediatric wards of the Queen Elizabeth Central Hospital (QECH) in Blantyre, Malawi.
For this study, children clinically diagnosed with kwashiorkor, marasmus and control subjects were included. Information about the research study was provided verbally by a research nurse and through a detailed written information sheet in both English and Chichewa, the local language. Informed consent was obtained from the parents for all participants in accordance with the College of Medicine, University of Malawi, Ethical Committee guidelines. (Appendix 1)
Kwashiorkor was defined as edema, not related to cardiac failure or renal disease, with hepatomegaly and dyspigmentation of skin and/or hair. Marasmus was defined as clinical wasting or a weight/age ratio ratio <70%, i.e., > 3 standard deviations below the mean of the WHO reference population. Children with and without HIV infection were included, tested by an ELISA HIV test. The control subject were children admitted to the orthopaedic ward with a minor health problem, or children who had fully recovered from viral pneumonia.
Exclusion criteria were malaria (tested by blood film analysis), clear signs of sepsis, i.e., respiratory distress or circulatory failure, clinical signs of pneumonia, haemoglobin concentration below 8 mg/dl or a packed cell volume (PCV) below 24% diagnosed as anaemic, and neurological symptoms of convulsions or decreased mental status.
All malnourished children were treated according to the standard, WHO based33, protocol. Children were started on a liquid diet (F75), every 2 hours to a total of 75 kcal enery/kg/day. With F75, enery from fat is 32%, protein 5% and the remaining from carbohydrates.
Experimental protocol
The children were included as soon as possible after admission, and studied at least within 4 days following hospital admission. The afternoon prior to the study, children were admitted to the research ward. A peripheral intravenous access was placed in an antebrachial vein. From midnight onwards patients and controls were fasted and a glucose infusion (2mg/kg/min) was given in all subjects until 30 minutes before the start of the isotope infusion to prevent hypoglycaemia in the malnourished patients. Glucose concentrations were only checked when clinically indicated. A baseline bloodsample following the overnight fast was obtained.
At 8.00 hr, a second peripheral venous access was established and a primed (13 mg/kg in 10 ml aqueous solution), constant infusion (0,15 mg/kg/min) of the stable isotope [6,6-H2]-glucose was given over 2 hours. Bloodspots (50 µl) were obtained at regular time intervals for glucose concentration and collection on filter paper. Subsequently, children resumed their specific diets until midnight when they were again fasted and received a glucose infusion to prevent hypoglycemia. On day 2, an intravenous bolus of 1 mg/kg [1-13C]-ketoisocaproate, together with an intravenous bolus of 20 mg/kg leucine, was given at t=0 and breath samples were obtained at t=0, 10, 15,20, 30, 60, 90 and 120
8

minutes. (Experimental protocol; appendix 2). Breath samples were taken by allowing children to breath into a mask sealed to the face to which a collection bag was attached. Room air could not enter because of a unidirectional valve system.
Biochemical analyses
Analyses for basic biochemistry were performed using routine methods. Plasma ß-hydroxybutyrate and free fatty acid concentrations were determined using commercially available kits (Roche Diagnostics, Mannheim, Germany and Wako Chemicals GmbH, Neuss, Germany). Amino acid analysis was performed according to Moore et al.34 based on liquid chromatography and post-column derivatisation using ninhydrine. Amino acid concentrations were measured using a Biochrom 20 aminoacid analyzer (Biochrom Ltd. Cambridge UK). Determination of insulin, c-peptide and glucagon concentrations was performed using enzyme immunoassays (EIA; Diagnostic Systems Laboratories, Sinsheim, Germany). Cortisol and growth hormone were determined using an EIA kit (ALPCA Diagnostics, Salem, NH, USA). Urinary 8-hydroxydeoxyguanosine (8-OhdG), a marker of oxidative stress, was determined using an ELISA (Northwest, Vancouver, Canada) and corrected for the creatinine excretion. Total plasma glutathione concentrations were determined using an enzymatic recycling method (Caymen, Ann Arbor, USA).
Stable isotope analyses
All the breath test measurements were performed by gas isotope ratio mass spectrometry (Delta Plus, Thermo Electron, Bremen, Germany). The CO2 pulse was separated from other gas components in breath, ionized and separated in the mass spectrometer into 12CO2 (m/z 44) and 13CO2 (m/z 45) ions. Measured values were expressed as 13C vs PeeDeeBelemnite limestone.35 For the glucose analyses, a disk (6.5 mm in diameter) was punched out of a bloodspot. The disk was transferred to an Eppendorff reaction vial and wetted with 40 µl water followed by 400 µl ethanol and the solution was shaken for 45 min at room temperature and then centrifuged in an Eppendorff centrifuge for 5 min. The supernatant was transferred to a Teflon capped reaction vial and dried at 60% under a stream of N2. Glucose was converted to its penta-acetate derivative by adding 150µl pyridine/acetide anhydride (1:2) to the residue and incubation for 30 min at 60°C, followed by drying at 60 °C under stream of N2. The dry residue was dissolved in 100µl ethylacetate. All samples were analyzed by gas chromatography quadrupole mass spectrometry (SSQ7000; Thermo Finnigan, San Jose, CA, USA). For all calculations of mass isotopomer distribution Excaliber software (ThermoFinnigan, San Jose, CA, USA) was used. Derivatives were separated on an AT-5MS 30mx0.25mm ID (0.25 µm film thickness) capillary column (Alltech, Breda, the Netherlands). The GC oven temperature program for separation of glucose penta-acetate was as follows: the oven temperature started at 80°C for 1 min, increased to 280 °C at a rate of 20 °C min/min after which the oven was held at 280 °C for 3 min. Mass spectrometric analyses were performed by positive ion chemical ionization with methane. Ions monitored for glucose penta-acetate were m/z 331-333, corresponding to the m0-m2 mass isotopomers.
Calculations
The whole-body blood glucose production rate [Ra(glc; whole body)] was calculated according to: Ra (glc; whole body) = M2infusate/M2blood x infusion (glc,M2), where total
9
Ra glucose is the total rate of appearance of glucose and [glc] is the glucose concentration just prior to start of the stable isotope infusion. The rate of EGP was calculated according to: Ra (glc;endogenous) = Ra(glc;whole body) – Ra(glc;exogenous). Metabolic clearance rate (MCR) was calculated with the formula MCR = Ra (glc)/[glc], [glc] is the blood glucose concentration in mmol/L. For children with kwashiorkor weight used for calculations of EGP and rate of exhalation of 13CO2 was the lowest weight at the time of clinical loss of edema, hence approaching normalised gross body composition. The calculations of mitochondrial KIC decarboxylation activity were done as follows. The rate of exhalation of 13CO2 at each time point was calculated from the measured increment in the isotopic abundance of 13CO2 (13CPDB), the known purity of the labelled compound and an assumed constant endogenous production of CO2 (400 mmol/m2/hr). The cumulative recovery of 13CO2 in breath was calculated as the area under the curve of the 13CO2 exhalation rate compared with the time curve determined by linear interpolation. Results were expressed as the percentage of the administered dose exhaled.
Statistical analysis
The data were analyzed by using SPSS software version 16.0 (SPSS Inc, Chicago, IL). All values are represented as the mean SEM. ANOVA test with Tukey's post-hoc tests was used for the statistical analyses between study groups. Correlation analyses were performed using Pearson correlation. Differences were considered significant at p<0.05.
10

Results
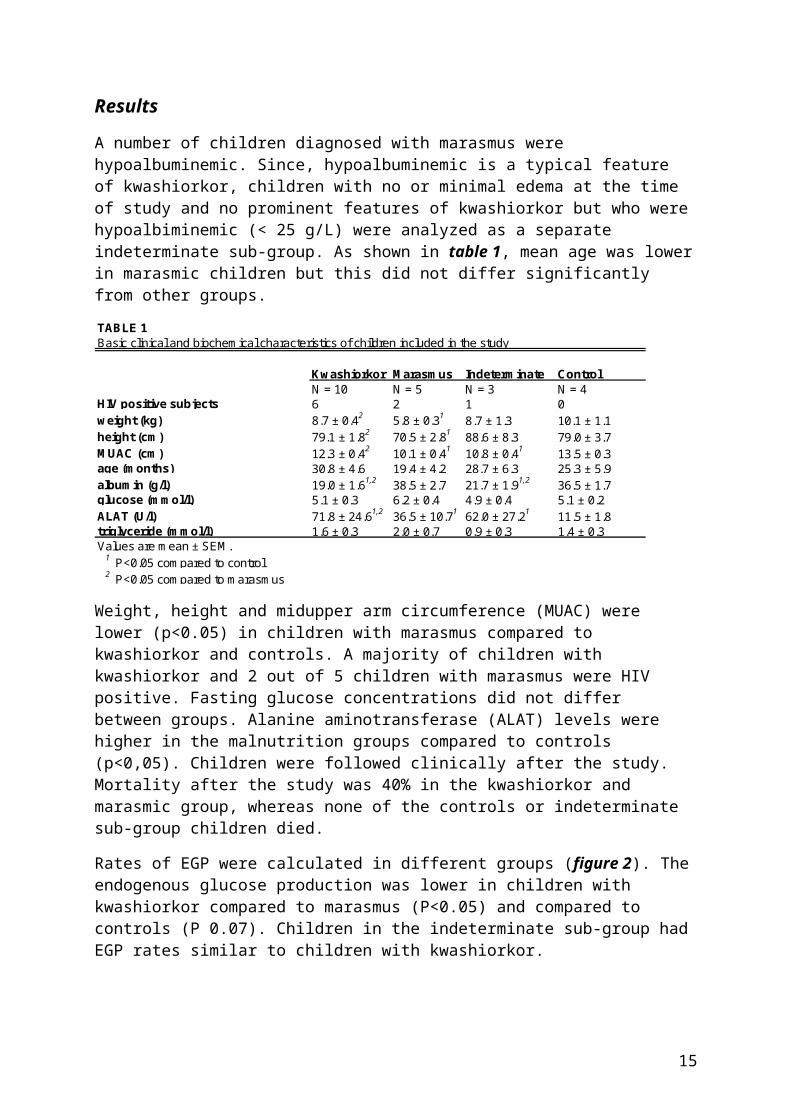
A number of children diagnosed with marasmus were hypoalbuminemic. Since, hypoalbuminemic is a typical feature of kwashiorkor, children with no or minimal edema at the time of study and no prominent features of kwashiorkor but who were hypoalbiminemic (< 25 g/L) were analyzed as a separate indeterminate sub-group. As shown in table 1, mean age was lower in marasmic children but this did not differ significantly from other groups.
TABLE 1Basic clinical and biochemical characteristics of children included in the study
Kwashiorkor Marasmus Indeterminate ControlN = 10 N = 5 N = 3 N = 4
HIV positive subjects 6 2 1 0weight (kg) 8.7 ± 0.42 5.8 ± 0.31 8.7 ± 1.3 10.1 ± 1.1height (cm) 79.1 ± 1.82 70.5 ± 2.81 88.6 ± 8.3 79.0 ± 3.7MUAC (cm) 12.3 ± 0.42 10.1 ± 0.41 10.8 ± 0.41 13.5 ± 0.3age (months) 30.8 ± 4.6 19.4 ± 4.2 28.7 ± 6.3 25.3 ± 5.9albumin (g/l) 19.0 ± 1.61,2 38.5 ± 2.7 21.7 ± 1.91,2 36.5 ± 1.7glucose (mmol/l) 5.1 ± 0.3 6.2 ± 0.4 4.9 ± 0.4 5.1 ± 0.2ALAT (U/l) 71.8 ± 24.61,2 36.5 ± 10.71 62.0 ± 27.21 11.5 ± 1.8triglyceride (mmol/l) 1.6 ± 0.3 2.0 ± 0.7 0.9 ± 0.3 1.4 ± 0.3Values are mean ± SEM. 1 P<0.05 compared to control 2 P<0.05 compared to marasmus
Weight, height and midupper arm circumference (MUAC) were lower (p<0.05) in children with marasmus compared to kwashiorkor and controls. A majority of children with kwashiorkor and 2 out of 5 children with marasmus were HIV positive. Fasting glucose concentrations did not differ between groups. Alanine aminotransferase (ALAT) levels were higher in the malnutrition groups compared to controls (p<0,05). Children were followed clinically after the study. Mortality after the study was 40% in the kwashiorkor and marasmic group, whereas none of the controls or indeterminate sub-group children died.
Rates of EGP were calculated in different groups (figure 2). The endogenous glucose production was lower in children with kwashiorkor compared to marasmus (P<0.05) and compared to controls (P 0.07). Children in the indeterminate sub-group had EGP rates similar to children with kwashiorkor.
Figure 2. Endogenous glucose production (EGP) in children with kwashiorkor (K), marasmus (M), indeterminate sub-group with severe malnutrition (I) and controls (C). * indicates P<0.05 compared to marasmus.
11
Regardless of the group allocation there was a clear correlation between serum albumin concentrations and EGP (figure 3). Since hypoglycemia can be caused by a decreased EGP or increased metabolic clearance of glucose, basal metabolic clearances rates were calculated (figure 4). Metabolic clearance rates were similar in all groups.
Whether differences in EGP were related to altered KIC decarboxylation was determined. Figure 5a shows the maximum percentage of 13CO2 recovery per hour, and figure 5b the cumulative percentage of 13CO2 recovery in study objects.
Figure 3. Correlation between albumin concentrations and endogenous glucose production (EGP) in children with severe malnutrition. Spearman’s correlation coefficient r=0.57 (P0.001)
Figure 4. Basal glucose metabolic clearance in children with kwashiorkor (K), marasmus (M), indeterminate sub-group with severe malnutrition (I) and controls (C).
Figure 5. Hepatic decarboxylation activity in children with kwashiorkor (K), marasmus (M), indeterminate sub-group with severe malnutrition (I) and controls (C). Maximal (a) and cummulative (b) recovery of 13CO2 in breath. * Significantly different compared to controls (P<0.01). † Significantly different compared to marasmus (P<0.05).
Both maximum and cummulative 13CO2 recovery were lower in control subjects compared to marasmic children (P<0.05), or those with kwashiorkor (P<0.01). Cumulative recovery in children with kwashiorkor was lower than in children with marasmus (P<0.05). There was a significant correlation between EGP and maximum and cummulative 13CO2 recovery for all malnutrition groups combined (P<0.05); r=0.46 and 0.53; figure 6).
12
Endogenous glucose production is controlled by different hormones and can be limited by glyconeogenic precursor availability. We therefore determined relevant hormone concentrations and gluconeogenic precursor concentrations, which are shown in table 2.
TABLE 2Concentrations of gluconeogenic precursors and hormones in children with severe malnutrition and controls
Kwashiorkor Marasmus Indeterminate Controllactate (mmol/l) 3.8 ± 0.07 2.7 ± 0.04 2.3 ± 0.04 1.8 ± 0.05pyruvate (mmol/l) 0.21 ± 0.05 0.16 ± 0.03 0.18 ± 0.03 0.13 ± 0.02alanine (µmol/l) 185 ± 28 220 ± 30 261 ± 97 226 ± 37glycine (µmol/l) 231 ± 20 201 ± 16 254 ± 40 236 ± 27glutamine (µmol/l) 250 ± 23 281 ± 64 304 ± 32 474 ± 67proline (µmol/l) 166 ± 24 142 ± 17 216 ± 72 145 ± 17total amino acids (µmol/l) 1466 ± 85 1565 ± 150 1760 ± 22 1882 ± 106acetoacetate (mmol/l) 0.043 ± 0.017 0.057 ± 0.019 0.02 ± 0.01 0.065 ± 0.022hydroxybutyrate (mmol/l) 0.13 ± 0.06 0.22 ± 0.10 0.05 ± 0.03 0.19 ± 0.08glucagon 62 ± 391,2 337 ± 2091 185 ± 45 3.3 ± 0.91,2
cortisol (µg/dl) 35.1 ± 7.2 36.2 ± 8.6 31.2 ± 20.3 28.9 ± 2.2growth hormone (ng/ml) 39.4 ± 5.0 18.7 ± 10.7 7.0 ± 2.03 28.7 ± 20.51 P<0.05 compared to marasmus2 P<0.05 compared to indeterminate3 P<0.05 compared to kwashiorkor
Puryvate, lactate concentrations as well as concentrations of the most abundant amino acid were similar across all groups, indicating no limited precursor availability. Cortisol and growth hormone concentrations did not differ between groups although glucagon concentrations were lower in children with kwashiorkor and controls compared to marasmus (p <0.05).
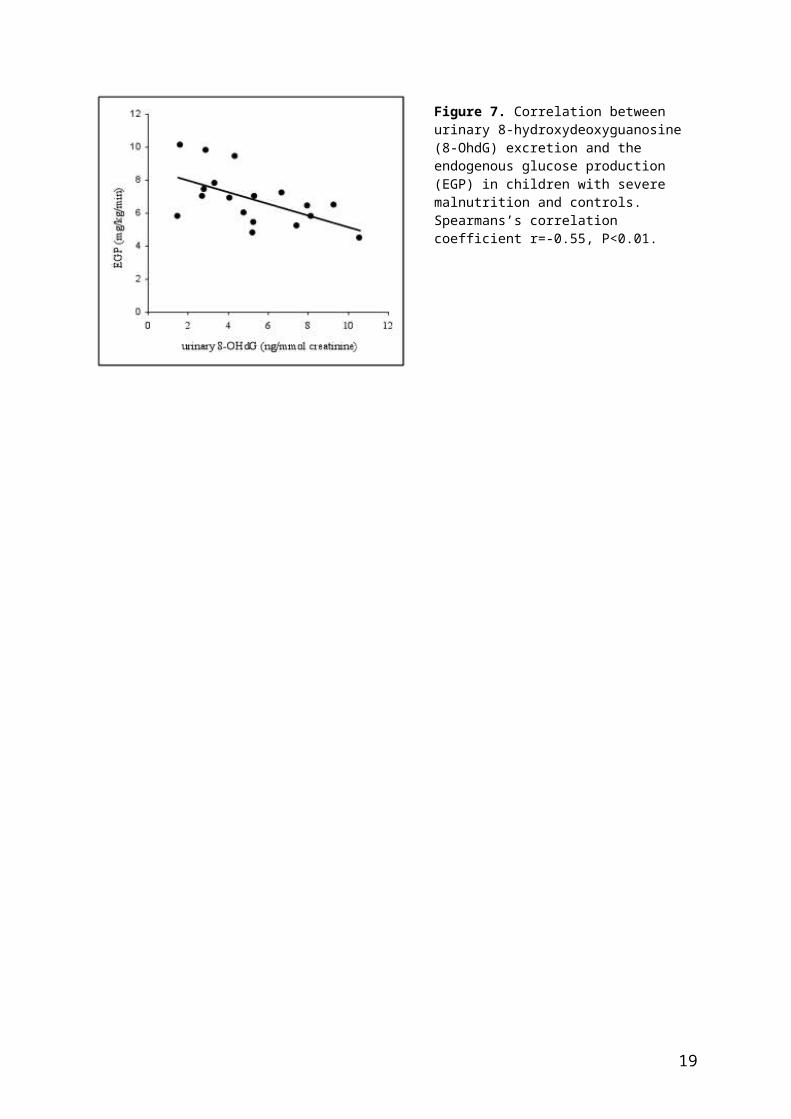
Figure 7 shows the correlation between urinary 8-OhdG, a marker of oxidative stress, excretion and EGP. There was a significant inverse correlation between the urinary 8-OhdG, corrected for creatinine excretion, and EGP. Total plasma glutathione and vitamin E concentrations also showed a correlation with EGP (r=0.50 and r=0.55, respectively, P<0.05; data not shown).
Figure 6. Correlation between cummulative 13CO2 recovery from the [1-13C]-ketoisocaproate breath test and the EGP in children with severe malnutrition. Spearmans’s correlation coefficient r=0.47 (P<0.05).
13
Figure 7. Correlation between urinary 8-hydroxydeoxyguanosine (8-OhdG) excretion and the endogenous glucose production (EGP) in children with severe malnutrition and controls. Spearmans’s correlation coefficient r=-0.55, P<0.01.
14
Discussion
Severe malnutrition is a major health problem in the sub Sahara African world. Case fatality rates of 10%, despite management practices following WHO guidelines, and between 30-40% have been reported, respectively in HIV non-infected and HIV infected children.1,33,36 Child mortality in kwashiorkor is associated with sepsis, with infection compromised adaptation to dietary intake37 and hypoglycaemia. One of the main causes of acute death in children suffering kwashiorkor is hypoglycaemia. Decreased hepatic glucose production (EGP) or increased glucose clearance could be related to sudden hypoglycaemia. The results of this study indicated decreased EGP in children with severe malnutrition.
Young children have a limited capacity for fasting, followed by developing hypoglycemia after 24 hours due to insufficient glucose production.38,39 There is limited data on EGP in young children. A recent study in young children (1-5 years) with malaria showed rates of EGP in similar range as found in this study.40 Decreased EGP, observed in children with kwashiorkor and the indeterminate sub-group, could be caused by a decrease in glycogenolysis or glyconeogenesis. During short-term fasting glycogen, stored in liver and muscle, is a primary source of glucose. It has been found to be high40, low41 or normal2 in biopsies from children with kwashiorkor. The differences in EGP observed in the current study are probably related to alterations in gluconeogenis, as glycogen stores were very likely depleted after the overnight fasting.
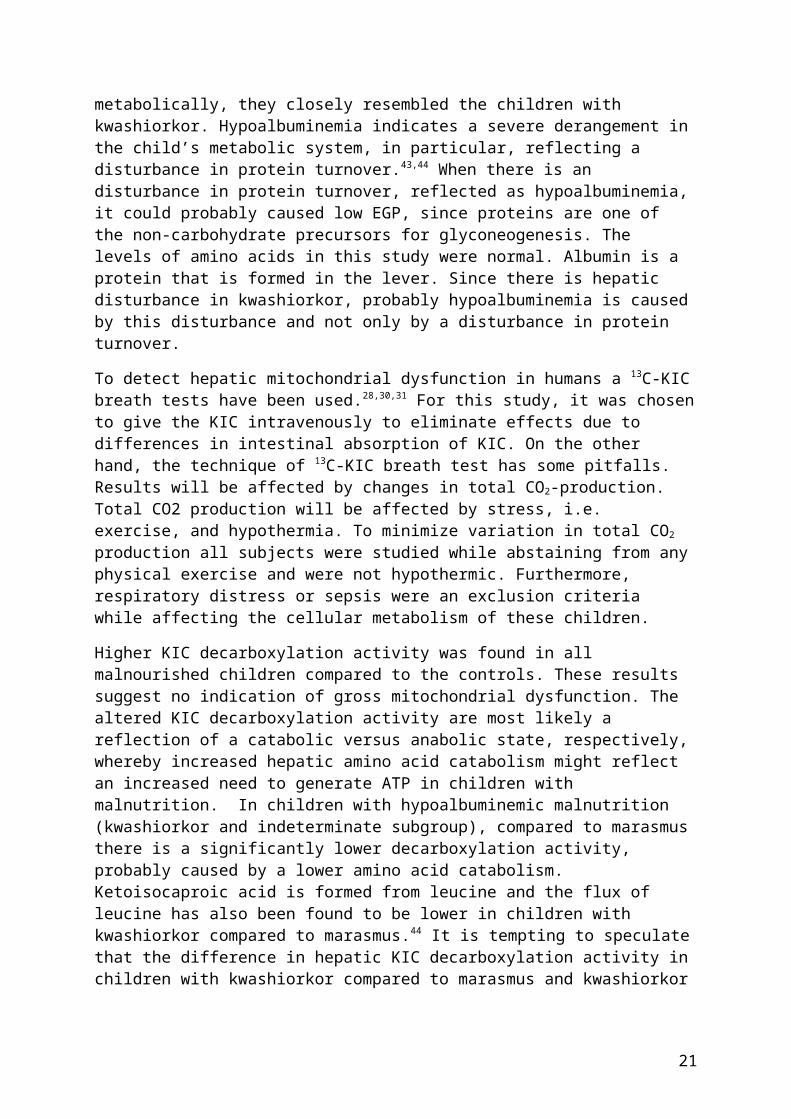
Children were diagnosed on admission as kwashiorkor or marasmus. Marasmus was defined as Wght/Hght <70%, i.e., >3 standard deviations below the mean of the WHO reference population, without edema en specific biochemical changes. After blood analyse some of these children were found to be hypoalbuminemic. These children had no edema or additional features of kwashiorkor (hair discoloration, skin lesions). However, hypoalbuminemia is characteristic of kwashiorkor. When these children would have had minimal or mild edema, they might have been considered as cases of kwashiorkor. But in the absence of other kwashiorkor features we decided to analyze them as a separate sub-group. The current data indicate that, metabolically, they closely resembled the children with kwashiorkor. Hypoalbuminemia indicates a severe derangement in the child’s metabolic system, in particular, reflecting a disturbance in protein turnover.43,44 When there is an disturbance in protein turnover, reflected as hypoalbuminemia, it could probably caused low EGP, since proteins are one of the non-carbohydrate precursors for glyconeogenesis. The levels of amino acids in this study were normal. Albumin is a protein that is formed in the lever. Since there is hepatic disturbance in kwashiorkor, probably hypoalbuminemia is caused by this disturbance and not only by a disturbance in protein turnover.
To detect hepatic mitochondrial dysfunction in humans a 13C-KIC breath tests have been used.28,30,31 For this study, it was chosen to give the KIC intravenously to eliminate effects due to differences in intestinal absorption of KIC. On the other hand, the technique of 13C-KIC breath test has some pitfalls. Results will be affected by changes in total CO2-production. Total CO2 production will be affected by stress, i.e. exercise, and hypothermia. To minimize variation in total CO2 production all subjects were studied while abstaining from any physical exercise and were not hypothermic. Furthermore,
15

respiratory distress or sepsis were an exclusion criteria while affecting the cellular metabolism of these children.
Higher KIC decarboxylation activity was found in all malnourished children compared to the controls. These results suggest no indication of gross mitochondrial dysfunction. The altered KIC decarboxylation activity are most likely a reflection of a catabolic versus anabolic state, respectively, whereby increased hepatic amino acid catabolism might reflect an increased need to generate ATP in children with malnutrition. In children with hypoalbuminemic malnutrition (kwashiorkor and indeterminate subgroup), compared to marasmus there is a significantly lower decarboxylation activity, probably caused by a lower amino acid catabolism. Ketoisocaproic acid is formed from leucine and the flux of leucine has also been found to be lower in children with kwashiorkor compared to marasmus.44 It is tempting to speculate that the difference in hepatic KIC decarboxylation activity in children with kwashiorkor compared to marasmus and kwashiorkor is related to a relative impairment in hepatic mitochondrial function.
In a different light a decrease in hepatic mitochondrial function could be caused by oxidative stress-induced mitochondrial dysfunction. There is a relation between decreased EGP and the oxidative marker urinary 8-hydroxydeoxyguanosine (8-OhdG). Endogenous glucose production takes place in mitochondria. Therefore, decreased EGP could be related to impairment in mitochondrial function directly. Alternatively, a decrease in ATP production caused by a lower mitochondrial function could be responsible for a lower capacity for gluconeogenesis. Compared to impaired hepatic mitochondrial function Badaloo et al. showed a strongly decreased -oxidation, which takes place in mitochondria, in kwashiorkor compared to marasmus.46 In addition, well described increases in transaminase concentrations, which were also found in this study, suggest an hepatic insult.
As precursor availability can limit gluconeogenic capacity, the major gluconeogenic precursors as lactate, several amino acids and hormones who deriving the gluconeogenic, were measured. Studies on prolonged fasting in young children suggested a deficiency in amino acids used for gluconeogenesis.38 Concentrations of the most abundant amino acids were not significantly different, nor was there a significant correlation between the plasma concentration of the total of amino acids and EGP. Therefore results of this study do not support a role for limited availability of these precursors causing decreased EGP in kwashiorkor. Growth hormone concentration was generally higher in children with kwashiorkor falling quickly after initiation of re-feeding.47 Cortisol stress response has not been shown to be impaired in severe malnutrition.48 Plasma glucagon concentrations have been reported relatively low in severe kwashiorkor2,48 and plasma glucose concentrations have been shown to respond to glucagon injection, although impaired compared to marasmic and healthy children.49 In this study glucagon concentrations were lower in children with kwashiorkor compared to marasmus, but similar to control children. Specific fasting studies are needed to conclusively determine whether there is a defect in the glucagon response in children with kwashiorkor.
A limitation of this study was that EGP could not be examined under completely fasted conditions, due to the mortality risk related to hypoglycemia. An intravenously glucose infusion over night, may cause a smaller difference between the results. To minimize this change in the results the IV glucose infusion was stopped before the isotope
16

infusion. Another limitation was that children with less severe malnutrition were included, because of the exclusion criteria of sepsis or respiratory distress what affect the cellular metabolism strongly. Also children with severe edema were excluded because the inability to obtain intravenous access in these children. Probably these exclusion criteria biased the results leading to underestimation of effects on EGP. Additional fluid as edema in children with kwashiorkor was not considered to be metabolically active; it was decided to use the weight at the time of the disappearance of the edema to make the isotope calculations. Using the measured weight at the time of the study would have underestimated calculated EGP rates and 13CO2 exhalation rates.
Many studies have reported that anti-retroviral therapy causes mitochondrial dysfunction and induction of insulin resistance.50,51,52,53,54 Mitochondrial dysfunction after initiation of anti-retroviral therapy could therefore potentially influence hypoglycemia risk in severe malnutrition. In our study none of the children were receiving anti-retroviral therapy at the time of the study. It would be of interest to design a study to evaluating the effect of HAART therapy in malnourished children. The focus of the study should be the mitochondrial function as a possible cause of decreased endogenous glucose production resulting in hypoglycemia.
In conclusion the results of this study demonstrate decreased endogenous glucose production in children with hypoalbuminemic severe malnutrition compared to normoalbuminemic malnutrition and healthy children without limited glyconeogenic precursors. There were no clear signs of mitochondrial dysfunction, which could potentially have explained the differences in EGP. The alterations in hepatic mitochondrial decarboxylation activity in kwashiorkor versus marasmus might reflect a relative disturbance in hepatic mitochondrial function. If so, this will probably have repercussions for starting these often HIV infected patients on HAART-therapy known impair hepatic and more specifically mitochondrial function. Clinical criteria alone are insufficient to distinguish the severity of metabolic derangements in children with different forms of severe malnutrition.
17

Conclusion(s)
1. Decreased endogenous glucose production in children with hypoalbuminemic severe malnutrition.
2. Hypoglycemia in severe malnutrition is not due to increased clearance of glucose.
3. EGP isn’t limited by glyconeogenic precursos availability.
4. Increased KIC decarboxylation activity in all malnourished children, indicating no clear mitochondrial dysfunction;
5. EGP correlates with a degree of oxidative stress, measured by increased urinary-8-hydroxydeoxyguanosine.
18
Bibliography
1. Heikens, G.T., Bunn, J., Amadi, B. et al. Case management of HIV-infected severely malnourished children: challenges in the area of highest prevalence. Lancet 2008; 371:1305-1307.
2. Buchanan, N., Moodley, G., Eyberg, C., Bloom, S.R., Hansen, J.D. Hypoglycemia associated with severe kwashiorkor. S. Afr. Med. J. 1976; 50:1442-1446.
3. Hadden, D.R. Glucose, free fatty acid, and insulin interrelations in kwashiorkor and marasmus. Lancet 1976; 2:589-592.
4. Williams, C.D. Kwashiorkor: A nutritional disease of children associated with a maize diet. Arch. Dis. Child. 1933; 8:423-433.
5. Chanda, N.K. Pathological study of the liver in kwashiorkor. Br. Med. J. 1958; 1:1263-1266.
6. Gopalan C. Kwashiorkor and marasmus: evolution and distinguishing features. In: McCance RA, Widdowson EM, eds. Calorie Deficiencies and Protein Deficiencies. London: Churchill, 1968;49–58.
7. Whitehead RG, Alleyne GA. Pathophysiological factors of importance in protein-calorie malnutrition. Br Med Bull 1972;28:72–9.
8. Jahoor, F., Badaloo, A., Reid, M., Forrester, T. Protein metabolism in severe childhood malnutrition. Ann. of Tropical Paediatrics 2008; 28:87-101.
9. Golden MH, Ramdath D. Free radicals in the pathogenesis of kwashiorkor. Proc Nutr Soc 1987; 46:53–68.
10. Kerpel-Fronius, E., Kaiser, E. Hypoglycaemia in infantile malnutrition. Acta Paediatr. Scand. 1976; 172:119.
11. Wharton, B. Hypoglycaemia in children with kwashiorkor. Lancet 1970; 295:171-173.
12. Baig, H.A, Edozien, J.C. Carbohydrate metabolism in kwashiorkor. Lancet 1965; 286:662-665.
13. Kerr, D.S., Stevens, M.C., Picou, D.I. Fasting metabolism in infants: II. The effect of severe undernutrition and infusion of alanine on glucose production estimated with U-13C glucose. Metabolism 1978; 27:831-848.
14. Heard, C.R., Frangi, S.M., Wright, P.M., McCartney, P.R. Biochemical characteristics of different forms of protein-energy malnutrition: an experimental model using young rats. Br. J. Nutr. 1977; 37:1-21.
15. Franco, V.H., Hotta, J.K., Jorge, S.M., et al. Plasma fatty acids in children with grade III protein-energy malnutrition in its different clinical forms: marasmus, marasmic kwashiorkor, and kwashiorkor. J. Trop. Pediatr. 1999; 45:71-75.
16. Das, B.K., Ramesh, J., Agarwal, J.K., et al. Blood sugar and serum insulin response in protein-energy malnutrition. J. Trop. Pediatr. 1998; 44:139-141.
19

17. Jaya Rao, K.S., and Raghuramulu, N. Insulin secretion in kwashiorkor. J. Clon. Endocrinol. Metab. 1972; 35: 63-66.
18. Soliman, A.T., Alsalmi, I., Asfour, M. Hypoinsulinaemia has an important role in the development of oedema and hepatomegaly during malnutrition. J. Trop. Ped. 1996; 42:297-299.
19. Lavoie, J.M. and Gauthier, M.S. Regulation of fat metabolism in the liver: link to non-alcoholic hepatic steatosis and impact of physical exercise. Cell. Mol. Life Science 2006; 63:1393-1409
20. Rao, R.H. Adaptations in glucose homeostasis during chronic nutritional deprivation in rats: Hepatic resistance to both insulin and glucagon. Metabolism 1995; 44:817-824.
21. Manary, M.J., Leeuwenburgh, C., and Heinecke, J.W. Increased oxidative stress in kwashiorkor. J. Pediatr. 2000; 137:421-424.
22. Schrauwen, P. and Hesselink, M.K. Oxidative capacity, lipotoxicity, and mitochondrial damage in type 2 diabetes. Diabetes 2004; 53:1412-1417.
23. Yesilova, Z., Yaman, H., Oktenli, C. et al. Systemic markers of lipid peroxidation and antioxidants in patients with nonalcoholic fatty liver disease. Am. J. Gastroenterol. 2005; 100:850-855.
24. Sanyal, A.J., Campbell-Sargant, C., Mirshahi, F. et al. Nonalchoholic steatohepatitis association of insulin resistance and mitochondrial abnormalities. Gastroenterology 2001; 120:1183-1192.
25. Perez-Carreras, M., del Hoyo, P., Martin, M.A., et al. Defective haptic mitochondrial respiratory chain in patients with nonalcoholic steatohepatitis. Hepatology 2003; 38:999-1007.
26. Cortez-Pinto, H., Chatham, J., Chacko, V.P., Arnold, C., Rashid, A., Diehl, A.M. Alterations in liver ATP homeostatis in human nonalcoholic statohepatitis: a pilot study. JAMA 1999; 282:1659-1664.
27. Kharta, B.S., Chwla, R.K., Sewell, C.W., Rudman, D. Distribution of branced-chain alpha-keto acid dehydrogenases in primate tissues. J. Clin. Invest. 1977; 59:558-564.
28. Mion, F., Rousseau, M., Brazier, J.L., Minaire, Y. Human hepatic macrovesicular steatosis: a noninvasive study of mitochondrial ketoisocaproic acid decarboxylation. Metabolism 1995; 44:699-700.
29. Gabe, S.M., Bjarnason, I., Tolou-Ghamari, Z., et al. The effect of tacrolimus (FK506) on intestinal barrier function and cellular energy production in humans. Gastroenterology 1998; 115:67-74.
30. Zocco, M.A., Di Campli, C., Gaspari, R., et al. Improvement of mitochondrial function evaluated by ketoisocaproic acid breath test in patient with HCV infection undergoing albumin dialysis. Transplant. Proc. 2005; 37:2554-2556.
31. Witschi, A., Mossi, S., Meyer, B., Junker, E., Lauterburg, B.H. Mitochondrial function
20
reflected by the decarboxylation of [13C]ketoisocaproate is impaired in alcoholics. Alcohol Clin. Exp. Res. 1994; 18:951-955.
32. Portincasa, P. Grattagliano, I., Palmieri, V.O., Palasciano, G. Nonalcoholic steatohepatitis: recent advances from experimental models to clinical management. Clinical Biochemistry 2005; 38:203-217.
33. World Health Organization. Management of severe malnutrition: a manual for physicians and other senior health workers. 1999
34. Moore, S., Spackman, D.H., Stein, W.H. Chromatography of amino acids on sulfonated polystyrene resins. An improved system. Anal. Chem. 1958; 30:1185-1190.
35. Stellaard, F., Geypens, B. European interlaboratory comparison of breath 13CO2 analysis. Gut 1998; 43: Suppl 3 S2-S6.
36. Kerac, M., Bunn, J., Seal, A. et al. Probiotics and prebiotics for severe acute malnutrition (PRONUT study): a double-blind efficacy randomized controlled trial in Malawi. Lancet 2009; 473:136-144.
37. Heikens, G.T. How can we improve the care of severely malnourished children in Africa? P.Lo.S. Med. 2007; 4:e45.
38. Haymond, M.W., Karl, I.E., Clarke, W.L., Pagliara, A.S., Santiago, J.V. Differences in circulating glyconeogenic substrates during short-term fasting in men, women and children. Metabolism 1982; 31:33-42.
39. Chaussain, J.L., Georges, P., Calzada, L., Job, J.C. Glycemic response to 24-hour fast in normal children: III. Influence of age. J.Pediatr. 1977; 91:711-714.
40. Zijlmans, W., Kempen van, A., Ackermans, M., Metz de, J., Kager, P., Sauerwein, H. Glucose kinetics during fasting in young children with severe and non-severe malaria in Suriname. Am. J. Trop. Med. Hyg. 2008; 79:605-612.
41. Waterlow, J.C., Weisz, T. The fat, protein and nucleic acid content of the liver in malnourished human infants. J. Clin. Inves. 1956; 35:346-354.
42. Aballi, A.J. Disturbances of carbohydrate metabolism in infantile malnutrition. Rev. Cubana Pediatr. 1950; 22: 509-541.
43. Golden, M.H., Waterlow, J.C., Picou, D. Protein turnover, synthesis and breakdown before and after recovery from protein-energy malnutrition. Clin. Scie. Mol. Med. 1977; 53:473-477.
44. Jahoor, F., Badaloo, A., Reid, M., Forrester, T. Protein kinetic differences between children with edematous and nonedematous severe childhood undernutrition in the fed and postabsorptive states. Am. J. Clin. Nutr. 2005; 82:792-800.
46. Badaloo, A.V., Forrester, T., Reid, M., Jahoor, F. Lipid kinetic differences between children with kwashiorkor and those with maramsus. Am. J. Clin. Nutr. 2006; 83:1283-1288.
47. Pimstone, B.L., Barbezat, G., Hansen, J.D., Murray, P. Studies on growth hormone
21

secretion in protein-calorie malnutrition. Am. J. Clin. Nutr. 1968; 21:482-487.
48. Jaya Rao, K.S., Srikantia, S.G., Gopalan, C. Plasma cortisol levels in protein-calorie malnutrition. Arch. Dis. Child. 1968; 43:365-367.
49. Kassem, A.S., Badr-El-Din, M.K., Hassan, A.H., Hafez, M. The liver and carbohydrate metabolism in protein calorie malnutrition. J. Trop. Pediatr. Environ. Child Health 1975; 21:3-6.
50. Hommes, M.J., Romijn, J.A., Endert, E., Eeftinck Schattenkerk, J.K., Sauerwein, H.P. Insulin sensitivity and insulin clearance in human immunodeficiency virus-infected men. Metabolism 1991; 40:651-655.
51. Bisschop, P.H., Romijn, J.A. et al. Lipodystrophy in HIV-1-positive patients is associated with insulin resistance in multiple metabolic pathways. AIDS 2001; 15:2093-2100.
52. Blumer, R.M., Vonderen van, M.G., Sutinen, J., et al. Zidovudine/lamivudine contributes to insulin resistance within 3 months of starting combination antiretroviral therapy. AIDS 2008; 22:227-236.
53. Walker, U.A., Bauerle, J., Laguno, M. et al. Depletion of mitochondrial DNA in liver under antiretroviral therapy with didanosine, stavudine, or zalcitabine. Hepatology 2004; 39:311-317.
54. Banasch, M., Goetze, O., Hollborn, I., et al. 13C-methionine breath test detects distinct hetpaic mitochondrial dysfunction in HIV-infected patients with normal serum lactate. J. Acquir. Immune. Defic. Syndr. 2005; 40:149-154.
22

Appendices
Appendix 1
The role of insulin in the development of Kwashiorkor and the influence of HIV
We are conducting a study on the factors that influence the development of malnutrition. Two types of malnutrition exist: kwashiorkor in which the child develops skin problems, and a big belly. The other type of malnutrition, marasmus does not cause these problems. It is not known why a child will develop kwashiorkor instead of marasmus. We want to study whether a lack of insulin or ineffectiveness of insulin is important in the development of kwashiorkor but not of marasmus. If this is the case, it will have important consequences for the treatment of future children with malnutrition.
To study the role of insulin in malnutrition, the child will receive two intravenous catheters. This will cause some temporary discomfort and the parent should not worry. A small amount of blood will be taken for analysis of levels of fats, sugars and hormones. Thereafter, a solution will be infused that contains normal sugar and sugar that is a bit heavier than normal sugar. During the study small drops of blood will be taken to check for the amount of glucose and for later analysis. The infusion of the sugar does not cause any health risks for the child, nor does any other part of the study.
You are free to participate or not, and this will not influence the way your child is cared for here at the hospital. You are requested to decide within the next 48 hours if you want your child to participate in the study.
If you do not understand any part of this consent form, please inform the investigator so that further explanation can be given.
____________________________
I have understood the above information and have agreed to participate in the study.
Name of Child Date
Signature OR Right Thumbprint
Name of Interviewer
Signature
23

FOMU YA CHILOLEZO KWA MAKOLO
MUTU WA KAFUKUFUKU: GAWO LA INSULIN PA CHIYAMBI CHAKUTUPIKANA NDINSO GAWO LA KACHILOMBO KA HIV KUVUTOLI
Tikupanga kafukufuku wa zomwe zimayambitsa ku nyentchera. Kunyentchera kuli mmagulu awiri. Gulu loyamba: kutupikana (Kwashioko mchingerezi): mwana amatupa mimba ndinso khungu lake limakhala ndi matenda; Gulu lachiwiri: ndi kunyentchera kosatupa mimba kapena matenda pakhungu (Marasimasi mchingerezi).
Pali zizindikiro zoti kunyentcheraku kukukhudzana ndi insulini amene amathandiza kuti sugar agwiritsidwe moyenera mthupi. Tikufuna tidziwe ngati nkusowekedwa kapena nkuchepekedwa kwa insulini amaneyu komwe kumabweretsa Kwashioko koma osati marasimasi. Chifukwa ngati zili chomwecho, ndiye kuti zidzakhala zothandiza kwambiri popereka chithandizo kwa ana odwala matendawa mtsogolo muno.
Kuti tifufuze ntchito ya insulini ameneyu, mwana adzalandira madiripi awiri. Izi zidzapangitsa kuti mwana asowe kamtendere kwa kanthawi kochepa ndipo tikupempha kholo lilonse kuti lisakhale lodandaula. Komanso, magazi okwana ma tiyi supuni anayi adzatengedwa kuchokera kwa mwana kuti tifufuze muyezo wa mafuta, sugar ndinso ma homoni (ngati insulin). Kuchoka apo, mwana adzalandiranso sugar wa madzi wamitundu iwiri: sugar wamba ndi wina olemelelapo pang’ono. Nkati mwakafukufukuyu, madontho amagazi ochepa azidzatengedwa kokwanira kakhumi ndi katatu (9) kuti tiunike kuchuluka kwa sugar komanso magazi omwewo adzagwiritsidwira ntchito patsogolo pakafukufuku yemweyu. Tikutsimikizira makolo onse pano kuti palibe vuto lirilonse lodza chifukwa cha sugar ameneyu kapena mbali ina iliyonse ya kafukufuku ameneyu kwa ana wo, ayi.
Kafukufukuyu siokakamiza ayi. Kholo lilonse lili ndi ufulu kupanga nawo kapena ayi. Komanso tikutsindika pano kuti amene wakana kupanga nawo sindiye kuti mwana wake salandira chithandizo nchipatala, ayi. Aliyense adzalandira chithandizo ndi chipatala.
Choncho kholo lililonse likufunsidwa kuti lipereka maganizo ake pasanathe maola 48. Ngati simukumvetsa bwino-bwino zokhudzana ndi fomuyi, ndinso kafukufukuyu, muli ndi ufulu kutipempha kuti tilongosole bwino-bwino.
______________________________
Ndamvetsa bwino lomwe zonse zalembedwazi ndipo ndalola kupanganawo kafukufukuyu.
Dzina la Mwana Tsiku:
Kusaina kapena chidindo
Dzina la Wofunsa
Kusaina
24

Appendix 2
Practical Protocol Sheet
Patient number:
Date:
Kg of patient:
Temperature:
Clinical status:
Heart rate
Respiratory rate
Comments:
Time: - 00.30 hr (30 min before start)
Breath sample (10 sec) Y / N
- tube: breath tube (code: P1)
Time: t = 0 tijd:
Breath sample (10 sec) Y / N
- tube: breath tube (code: P2)
Infusion of [13C] ketoisocoproate Y / N
> KICA (mg) = 1x ... (kg) Volume KICA:
> Leucine (mg) = 20x ... (kg) Volume Leucine:
Time: t = 10
Breath sample (10 sec) Y / N
- tube: breath tube (code: P3)
Time: t = 15
Breath sample (10 sec) Y / N
- tube: breath tube (code: P4)
25

Time: t = 20
Breath sample (10 sec) Y / N
- tube: breath tube (code: P5)
Time: t = 30
Breath sample (10 sec) Y / N
- tube: breath tube (code: P6)
Time: t = 60
Breath sample (10 sec) Y / N
- tube: breath tube (code: P7)
Time: t = 90
Breath sample (10 sec) Y / N
- tube: breath tube (code: P8)
Time: t = 120
Breath sample (10 sec) Y / N
- tube: breath tube (code: P9)
26
Dutch summary
Ernstige ondervoeding is een groot gezondheidsprobleem in de ontwikkelingslanden. onderontwikkelde derde wereld. Ondervoeding kent twee uitingsvormen, bekend als maramsus en kwashiorkor. Marasmus wordt gekenmerkt door ernstige vermagering, uitend in een laag gewicht voor de lengte. Marasmus kent geen vormen van oedeem. Daarentegen is oedeem een karakteristieke uiting van kwashiorkor. Kwashiorkor wordt daarnaast klinisch gekenmerkt door verhoogde prikkelbaarheid, verlies van eetlust, verlies van pigmentatie van het hoofdhaar en verlies aan haardikte, hepatomegalie en dispigmentatie. Metabole veranderingen bij kwashiorkor zijn hypoalbuminemie, steatosis hepatis en hypoglycemie. Er bestaat grote kindsterfte onder kwashiorkor kinderen. Hypoglycemie draagt in hoofdzaak bij aan deze sterfte. Hypoglycemie kan ontstaan door verlaagde endogene glucose productie of een toegenomen glucose klaring. Tot op heden is de pathofysiologie van hypoglycemie in ernstige ondervoeding onduidelijk.
In deze studie is getracht het mechanisme achter de ontstaanswijze van hypoglycemie te ontrafelen. Om de endogene glucose productie te meten is analyse met isotopen uitgevoerd. Hierbij is constante glucose [6,6H2] infuus met primer gegeven voor 2 uren. De daarop volgende dag is een intraveneuze bolus 13C-ketoisocaporoic acid (KIC) gegeven, om de hepatische mitochondriële functie te meten. Dit is een isotoop gelabelde ketoisocaproic acid (KIC) blaas test toegepast. KIC ondergaat decarboxylatie uitsluitend in de mitochondriën in de lever door een branched-chain -ketoacid dehydrogenase complex. Om nu exact de endogene glucose productie te berekenen werd de verdunning berekend, geanalyseerd door middel van gas chromotografie quadrupole mass spectrometrie. De blaastesten werden door een gas isotope ratio mass spectrometrie geanalyseerd. Voorafgaand aan de studie werd verwacht een verlaagde mitochondriële functie te vinden in de ondervoede kinderen. Echter werd een toegenomen functie gevonden, waarbij de hypoalbumenische ondervoede kinderen wel een verlaagde functie weergaven ten op zichten van de normoalbumenische kinderen. Een verhoogde KIC decarboxylatie zou mogelijk een reflectie kunnen zijn van de verhoogde behoefte aan ATP productie of glyconeogene precursors.
Hypoglycemie kan veroorzaakt worden door een afgenomen endogene glucose productie of een toegenomen glucose klaring. In deze studie populatie zijn voor een toegenomen glucose klaring geen aanwijzingen gevonden, in tegenstelling tot een verlaagde endogen glucose productie. Een verlaagde hepatische endogene glucose productie gevonden in hypoalbumenische sterk ondervoede kinderen. Veranderingen in de endogene glucose productie kan geassocieerd worden met veranderingen optredend in de mitochondriële decarboxylatie activiteit en oxidatieve stress. Oxidatieve stress werd gemeten met behulp van verschillende biochemische markers, als urinary-8-hydroxydeoxyguanosine. Er werd verder een relatie gevonden tussen een afgenomen EGP en een toename van oxidatieve stress markers, wat speculerend voor een afgenomen endogene glucose productie kan zorgen. De verschillende uitkomsten kunnen een reflectie weergeven van een verandering in de hepatische mitochondriële functie. Voor de toekomst kunnen deze uitkomsten invloed hebben op het starten van HAART-therapie bij HIV-positieve kinderen. Het is bekend dat HAART-therapy hepatische mitochondriële functie doet verminderen.
27