Protein and metabolite biomarkers in personalized healthcare
52
Protein and metabolite biomarkers in personalized healthcare Prof Alain van Gool Head Radboud Center for Proteomics, Glycomics and Metabolomics Coordinator Radboud Technology Centers Head Biomarkers in Personalized Healthcare 1 st Dutch Life Science Technology event Leiden, 26 th Nov 2013
Transcript of Protein and metabolite biomarkers in personalized healthcare

Protein and metabolite biomarkers in personalized healthcare
Prof Alain van Gool
Head Radboud Center for Proteomics, Glycomics and Metabolomics Coordinator Radboud Technology Centers
Head Biomarkers in Personalized Healthcare
1st Dutch Life Science Technology event
Leiden, 26th Nov 2013

Personalized Healthcare
Right patient with right drug at right dose at right time
In other words: Apply a well characterized therapy in a biological system you know well to treat a disease you understand well, in a way that you know works. Often: Co-develop (molecular) biomarkers as diagnostic companions of a drug
2

Companion Diagnostics – some numbers
At present in pharmaceutical development:
40.000 clinical trials ongoing
16.000 trials in oncology
8.000 trials in oncology have a companion diagnostic (many genetic)
At present on market:
113 Biomarker in drug label (2012; up from 69 in 2010 = +64%)
16 CDx testing needed (2012; up from 4 in 2010 = +400%)
Costs of development:
>1.000 MUSD per drug
~10 MUSD per diagnostic Source: www.fda.gov
3

Companion Diagnostics
Metabolism
Efficacy or safety
Source: www.fda.gov {Kumar and van Gool, 2013}
4
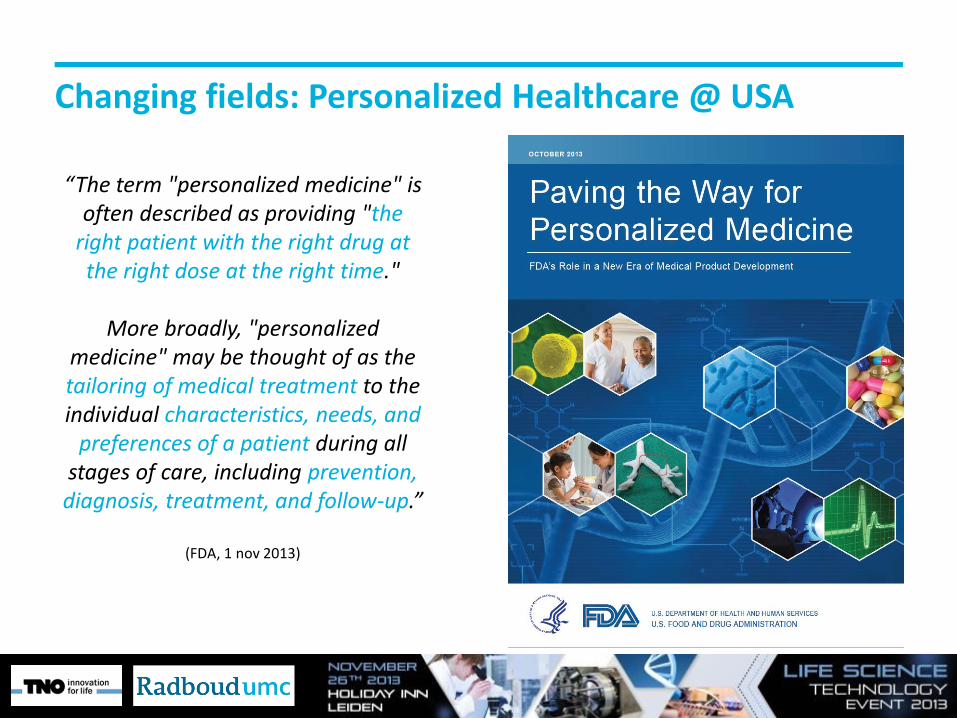
Changing fields: Personalized Healthcare @ USA
“The term "personalized medicine" is often described as providing "the
right patient with the right drug at the right dose at the right time."
More broadly, "personalized
medicine" may be thought of as the tailoring of medical treatment to the individual characteristics, needs, and
preferences of a patient during all stages of care, including prevention,
diagnosis, treatment, and follow-up.”
(FDA, 1 nov 2013)

Changing fields: Personalized Healthcare @ EU
(ESF, 30 Nov 2012) (IMI2, 8 July 2013) (EC, draft Nov 2013)

Personalized Healthcare in a systems view
Source: Barabási 2007 NEJM 357; 4}
• People are different • Different networks and influences • Different risk factors
7

Personalized Healthcare in a systems view
Source: Thomas Kelder
Marijana Radonjic

System biology model for Personalized Health(care) (a.k.a. Next Generation Life Sciences)
Ho
meo
sta
sis
A
llo
sta
sis
D
isease
Time
Disease
Health
Personalized Intervention
of patients-like-me
Big Data
Risk profiles of persons-like-me
Molecular Non-molecular Environment …
Personal profile
Selfmonitoring
Adapted from Jan van der Greef (2013)

Personalized Healthcare @ TNO
• Focus on translation to applications in pharma, nutrition
and healthcare
• System biology based
• Maximum use of knowledge from other areas in TNO
(pharma, nutrition, biology, (pre)clinical, ICT, etc)
• Input different types of data
(molecular, fysiological, psychological, environment)
• Output persons/systems profiles
• Test added value in real life through field labs
10
“Industry as partner”

TNO’s applied biomarker tool box
Widely used preclinical translational models
Pharma, nutrition and chemical industry, academia
Focus on etiology of disease and mechanism of action
Human studies
Experimental medicine through CRO’s
Microdosing
Validated analytical platforms
Metabolomics profiling and targeted analysis, with focus on
lipids, ceramids, cannabinoides
Genomics, transcriptomics, proteomics and imaging through
a wide network of selected partners
Clinical chemistry
Data analysis
Network biology for mechanistic understanding
Multiparameter statistics and chemometrics
PK/PD translational modelling
Comprehensive system dynamics modelling
Biomarker expertise
Best practise strategies and approaches
A wide network with biomarker academia and industry
Metabolic Syndrome
• Atherosclerosis
• Diabetes
• Obesity
• Vascular inflammation
• NASH, fibrosis
11

Year 1
Applying lessons learned across fields
e.g. System Biology @TNO
Year 2
Year 3

Personalized Healthcare @ Radboudumc
“It’s far more important
to know what person
the disease has than
what disease the
person has.”
Hippocrates, 400 B.C
“Patient as partner”
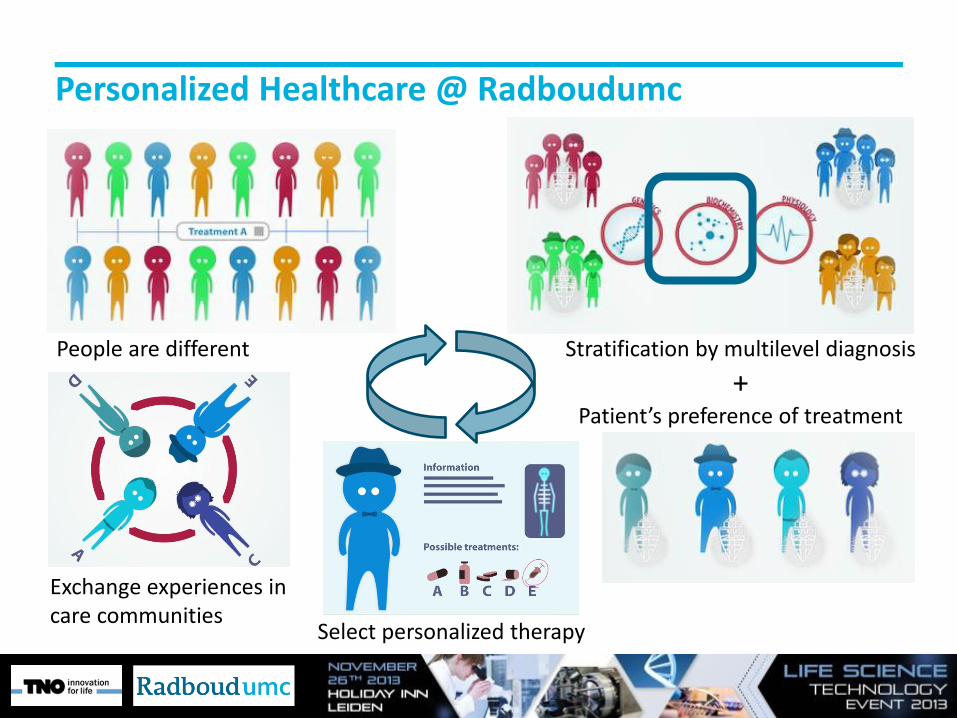
Personalized Healthcare @ Radboudumc
People are different Stratification by multilevel diagnosis
+ Patient’s preference of treatment
Exchange experiences in care communities
Select personalized therapy

Centre for Proteomics, Glycomics & Metabolomics
Radboud Proteomics Center
Radboud Metabolomics Group
Radboud Glycomics Facility
Research Biomarkers Diagnostics
Mass spectrometry – NMR based, 20 dedicated fte, part of diagnostic laboratory (Department Laboratory Medicine), close interaction with Radboudumc scientists and external partners

Source: Allison Doerr, Nature Methods 9,36 (2012)
Case1: Glycoproteomics

Personalized Healthcare in rare diseases
17
• 12 families with liver disease and dilated cardiomyopathy (5-20 years)
• Initial clinical assessment didn’t yield clear cause of symptoms
• Specific sugar loss of serum transferrin identified via glycoproteomics
• Genetic defect in glycosylation enzyme identified via exome sequencing
• Outcome 1: Explanation of disease
• Outcome 2: Dietary intervention as succesful personalized therapy
• Outcome 3: Glycoprofile transferrin applied as diagnostic test (MS-based)
{Dirk Lefeber et al,
accepted NEJM 2013}
Dietary intervention
Incomplete glycosylation Complete glycosylation
ChipCube-LC- Q-tof MS

Case 2: Untargeted metabolomics
A typical plasma sample by Q-tof MS metabolomics analysis shows
> 5000 “features”

Where is Wally?
Chemometric data analysis methods crucial !
Where is Wally?

A blind study
Plasma sample choice : Dr. C.D.G Huigen
Analytical chemistry : E. van der Heeft
Chemometrics : Dr. U.F.H. Engelke
Diagnosis : Prof. dr. R.A. Wevers;
Dr. L.A.J. Kluijtmans
Test 10 samples from 10 patients with 5 different
Inborn Error of Metabolism’s
21 controls

The blind study
MSUD (2) → leucine, isoleucine, valine, 3-methyl-2-oxovaleric acid
Aminoacylase I deficiency (2) → N-acetylglutamine, N-acetylglutamic acid, N-acetylalanine, N-acetylserine, N-acetylasparagine, N-acetylglycine
Prolinemia type II (2) → proline, 1-pyrroline-5-carboxylic acid
Hyperlysinemia (2) → pipecolic acid, lysine, homoarginine, homocitrulline
3-Hydroxy-3-methylglutaryl-CoA lyase deficiency (2) → 3-methylglutaryl-carnitine, 3-methylglutaconic acid, 3-hydroxy-2-methylbutanoic acid, 3-hydroxy-3-methylglutaric acid
Diagnostic metabolites found in blood plasma
Correct diagnosis in all 10 patients
Five different IEM’s identified by differential
metabolites
The approach works!!!
Validated method diagnostic SOP
Planned for execution in line with genetics

MAB ESI - MS Intact MAB spectrum
Compound Spectra
147916.0294
148062.0367
148224.0781
148387.2015
148550.0889
148713.2075
+MS, 0.985-10.524min, Smoothed (0.07,6,SG), Baseline subtracted(0.80), Deconvoluted (MaxEnt, 2673.57-3122.37, *1.75, 10000)
0
2000
4000
6000
8000
Intens.
147250 147500 147750 148000 148250 148500 148750 149000 149250 149500 m/z
Case 3: Top down proteomics
Analysis of intact proteins by ESI-Q-tof MS
Complements: - Bottom-up proteomics (shotgun peptide profiling) - Targeted proteomics (biomarker quantification)

Analysis of intact Trastuzumab by top-down proteomics
Multiple charged ion
Single charged ion = intact protein
Analysis:
- Single proteins OK
- Protein (sub)complexes ?
Quantitative analysis of intact protein isoforms - N/C-terminal truncations - Splice variants - Post-translational modifications
(glycosylation, phosphorylation, etc)
148 kDa!

Analysis of a 40-subunit protein complex
Mitochondrial complex I of Y. lipolytica
• Problem: 3D structures of modelled subunits do not fit within measured structure by electron miscroscopy
• Hypothesis: Unknown N-terminal and/or C-terminal processing
• Study: Combine Top-Down and Bottom-Up characterization of all subunits
• Established subunits: 40 • Subunits encoded by mitochondrial DNA: 7 • Subunits encoded by nuclear DNA: 33 • Structural elucidation in progress

Experimental setup

LC-MS ion map of 40-subunit protein complex Survey View
500
1000
1500
2000
2500
m/z
10 20 30 40 50 60 70 Time [min]

ESI spectrum of 1 subunit Survey View
500
1000
1500
2000
2500
m/z
10 20 30 40 50 60 70 Time [min]
'1009.716810+
'1121.79549+
'1261.89388+
'1442.02087+ '1682.1905
6+
'2018.42955+
+MS, 56.8-58.7min #3408-3522
0
1
2
3
4
5
4x10
Intens.
1000 1200 1400 1600 1800 2000 2200 m/z
5+
6+
7+
8+
9+
10+
5+
6+ 7+
8+
9+
10+
1.682 m/z Da

ESI spectrum of 6+ charged subunit Survey View
500
1000
1500
2000
2500
m/z
10 20 30 40 50 60 70 Time [min]
6+
'1679.35506+
'1682.19056+
'1684.85616+
'1686.01806+
'1688.51476+
'1690.928612+
'1692.67456+
+MS, 56.8-58.7min #3408-3522
0
1
2
3
4
5
4x10
Intens.
1677.5 1680.0 1682.5 1685.0 1687.5 1690.0 1692.5 1695.0 1697.5 m/z
6+
1.682 m/z Da

Deconvoluted spectrum of 1 subunit Survey View
500
1000
1500
2000
2500
m/z
10 20 30 40 50 60 70 Time [min]
'10069.0770Mr
'10087.0920Mr
'10103.0766Mr
'10110.0557Mr
'10125.0318Mr
'10132.0368Mr
'10141.0021Mr
'10149.0079Mr
+MS, 56.8-58.7min, Baseline subtracted(0.80), Deconvoluted (MaxEnt, 503.09-2244.16, *0.063125, 50000)
0
2
4
6
8
4x10
Intens.
10070 10080 10090 10100 10110 10120 10130 10140 10150 m/z
10.088 m/z Da

Small to large intact subunits in a single analysis
9 kDa subunit (deconvoluted)
75 kDa subunit (deconvoluted) 49 kDa subunit (deconvoluted)
'9603.9448Mr
'9617.9600Mr
'9631.9697Mr
'9644.9081Mr
'9654.9367Mr
'9669.9202Mr
'9685.8928Mr
+MS, 51.9-52.6min, Deconvoluted (MaxEnt, 503.09-2410.26, *0.10625, 50000)
0.0
0.5
1.0
1.5
5x10
Intens.
9550 9600 9650 9700 9750 m/z
49989.6584
+MS, 54.6-56.9min, Smoothed (0.07,3,SG), Deconvoluted (MaxEnt, 498.39-2528.81, *0.664063, 8000)
2
4
6
8
4x10
Intens.
49400 49600 49800 50000 50200 50400 50600 m/z
74340.9883
75196.3196
76237.1362
+MS, 37.9-41.1min, Deconvoluted (MaxEnt, 503.09-2472.80, *0.664063, 8000)
0
1
2
3
4
5
6
4x10
Intens.
73500 74000 74500 75000 75500 76000 76500 77000 77500 m/z
20 kDa subunit (deconvoluted)
'20707.5208Mr
'20725.4879Mr
'20744.4732Mr
'20755.4811Mr '20763.4648
Mr
'20781.4432Mr
+MS, 43.0-44.3min, Deconvoluted (MaxEnt, 503.09-2421.67, *0.10625, 50000)
0.0
0.2
0.4
0.6
0.8
1.0
5x10
Intens.
20680 20700 20720 20740 20760 20780 20800 m/z

Top down / bottom up analysis of NUMM protein (13,2 kDa)
Top-Down LC-MS/MS (ETD)
Top-Down NSI-MS/MS (ETD)
Bottom-Up LC-MS/MS (CID & ETD)
Matched peptide sequences in red, amino acids matched as ETD fragment ions are marked yellow (only for Top-Down data)
Hypothesized protein form
• N-terminus processing: Targeting sequence cleavage at S18 • C-terminus processing: None • Additional PTMs: None

Deconvoluted and simulated spectra Compound Spectra
'13107.3636Mr +MS, 14.5-15.6min, Deconvoluted (MaxEnt, 566.30-2196.57, *0.063125, 50000)
15128.45671+C₆₆₃H₁₀₂₈N₁₉₂O₂₀₃S₆, , 15119.4339
13114.37681+ C₅₇₄H₈₈₁N₁₆₆O₁₇₈S₅, , 13107.3587
0.0
0.5
1.0
1.5
2.0
2.5
5x10
Intens.
0.0
0.5
1.0
1.5
2.0
2.5
3.0
5x10
0.0
0.5
1.0
1.5
2.0
2.5
3.0
5x10
13000 13250 13500 13750 14000 14250 14500 14750 15000 m/z
Measured spectrum
Simulated spectrum - unprocessed form (database entry)
Simulated spectrum - hypothesized form (according to MS/MS results)

Overlay of deconvoluted and simulated spectra NUMM subunit
Mass error: 0.0049 Da (0.4 ppm)
13.114 m/z Da

Overlay of deconvoluted and simulated spectra N7BM subunit
Mass error: 0.0145 Da (0.9 ppm)
Characterized protein form
• N-terminus processing: Methionine truncation • C-terminus processing: None • Additional PTMs: Protein N-terminal acetylation (S2)
16.062 m/z Da

Top down proteomics
Foresight Research Biomarkers Diagnostics
Current: • Analytics possible in biotech and in biomedical research • High detail analysis of intact proteins (single or complex) • 40 subunits in 1 complex well doable (up to 100 proteins possible) • 50 fmol of protein complex enough (about 1 g)
Near future: • Decrease amount needed • Protein complex analysis in biological samples • Genetic/environment effects on complex composition and dynamics • Diagnostics ?

Genetics
Bioinformatics Preclinical
pharmacology
Clinical trials
Flow cytometry
Cleanrooms
Neuroscience unit
Robotic operations
Preclinical Imaging
Microscopy
Malaria lab Biobank
Big Data
Radboudumc Technology Centers
Proteomics Metabolomics
Glycomics
Radboudumc Technology
Centers
Maximize synergy within Radboudumc and with external partners / organisations
Eg. Next Generation Life Sciences

Translational medicine @ Radboudumc

Issue 1: A problem in biomarker land
Imbalance between biomarker discovery and application.
• Gap 1: Strong focus on discovery of new biomarkers, few biomarkers progress beyond initial publication to multi-center clinical validation.
• Gap 2: Insufficient demonstrated added value of new clinical biomarker and limited development of a commercially viable diagnostic biomarker test.
Discovery Clinical validation/confirmation
Diagnostic test
Number of biomarkers
Gap 1
Gap 2
38
The innovation gap in biomarker research & development

Some numbers
Data obtained from Thomson Reuters Integrity Biomarker Module (April 2013)
Alzheimer’s Disease
Chronic Obstructive Pulmonary Disease
Type II Diabetes Mellitis
Eg Biomarkers in time: Prostate cancer May 2011: 2,231 biomarkers Nov 2012: 6,562 biomarkers Oct 2013: 8,358 biomarkers
EU: CE marking
USA: LDT, 510(k), PMA
39

Shared biomarker research through open innovation
We need to set up a open innovation network to share biomarker knowledge and jointly develop and validate biomarkers (at level of NL and EU):
1. Assay development of (diagnostic) biomarkers
2. Clinical biomarker quantification/validation/confirmation
Shared knowledge,
technologies and objectives
Funding: NL – STW; EU - Horizon2020, IMI; Fast track pharma funds

Issue 2:
The big current bottleneck in Next Generation Life Sciences:
41
(Big) data
Knowledge
Understanding
Decision
Action
Translation is key !
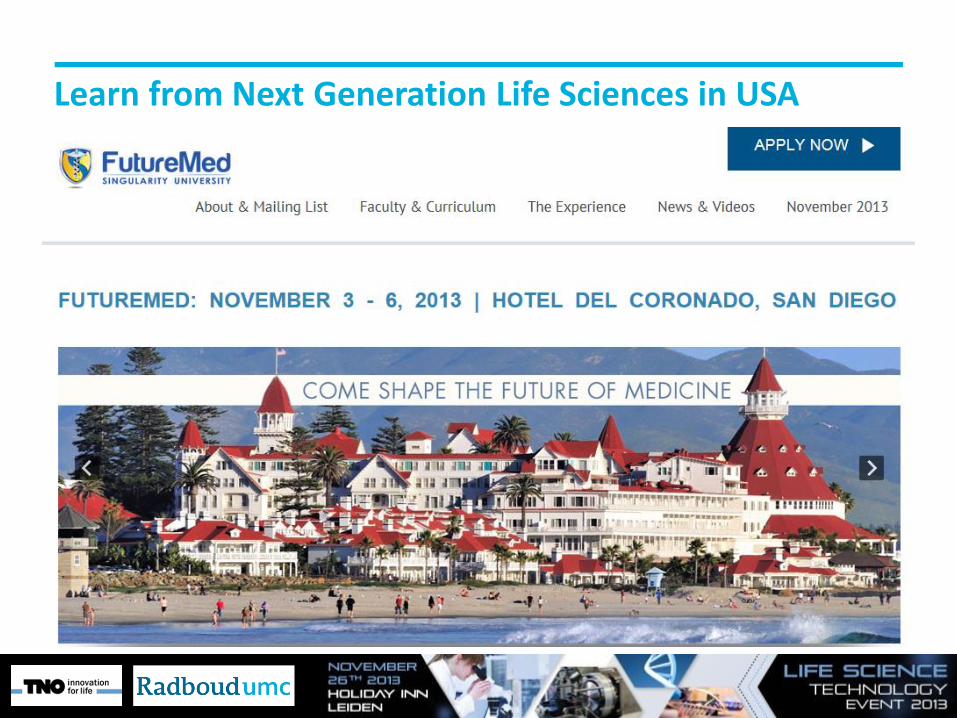
Learn from Next Generation Life Sciences in USA

Singularity University’s FutureMed 2013 speakers
Exponential technologies
Digital medicine
Integrated care
Artifical intelligence
Robotics Patients included
Lifestyle
Self quantification
Global health
Watson Artifical intelligence
Regenerative medicine
23andme Robotics
and Jamie Heywood (Patientslikeme)

Singularity University’s FutureMed 2013 conference

Exponential progress
“The only constant is change, and the rate of change is
increasing”
We are at the knee of the exponential curve
of progress

1. Imaging of every part of human body in high resolution
2. Smartphone as the most important pieve of clothing
3. Self-diagnosis as a continous monitoring to quantified self
4. Artifical intelligence and robots
5. Digital medicine, Big Data and wisdom of the crowd
6. Our body as a lego box using 3D printing for spare parts
7. Our brain online using brainsensing headbands to transfer thoughts
Exponential trends

The future is nearly there …
47
Personalized advice
Action
Selfmonitor Cloud
Lifestyle Nutrition Pharma

Self-diagnosis


3 days high speed innovation in one slide
• Buzzwords:
• Exponential technologies
• Disruptive innovation
• Progress and beyond
• Digital quantified self
• Focus on:
• Where will we be in 5-20 years?
• Technologies, genomics, robotics, Big Data, eHealth, patient empowerment
• Less focus on:
• What to do next year?
• Biomarkers, robustness assays for decision, translating data to knowledge, innovation in clinical drug testing

Personalized Healthcare
51
My view on ways forward:
• Data sharing
• Selfmonitoring
• Big Data
• System biology
• Lifestyle + Nutrition + Pharma

Acknowledgements
Jan van der Greef
Ben van Ommen
Peter van Dijken
Ton Rullmann
Lars Verschuren
Bas Kremer
Marijana Radonjic
Thomas Kelder
Robert Kleemann
Suzan Wopereis
and others
Ron Wevers
Jolein Gloerich
Dirk Lefeber
Monique Scherpenzeel
Leo Kluijtmans
Udo Engelke
Ulrich Brandt
Lucien Engelen
and others
Lutgarde Buydens
Jasper Engel
Lionel Blanchet
Jeroen Jansen
and others
Radboud umc Personalized Healthcare Taskforce:
Andrea Evers, Alain van Gool, Maroeska Rovers, Joris Veltman,
Jan Kremer, Bas Bloem, Jack Schalken, Paul Smits, Gerdi
Egberink, Viola Peulen, Martijn Hoogboom, Martijn Gerretsen