Protection, Trade Policy and Transport Costs: Effective ... · Protection and Transport Costs 6...
34
Protection and Transport Costs 1 _____________________________________________________________________ CREDIT Research Paper No. 98/13 _____________________________________________________________________ Protection, Trade Policy and Transport Costs: Effective Taxation of Ugandan Exporters by Chris Milner, Oliver Morrissey and Nicodemus Rudaheranwa DFID-TERP: CREDIT DISCUSSION PAPER 7 (CDP007) This is Discussion Paper No. 7 in the CREDIT Project on ‘Infrastructural and Institutional Constraints to Export Promotion’, as part of the DFID Trade and Enterprise Research Programme (TERP). The TERP involves research projects by teams in CREDIT, CREEM (SMF, Nottingham), CSAE (Oxford) and IDS. _____________________________________________________________________ Centre for Research in Economic Development and International Trade, University of Nottingham
Transcript of Protection, Trade Policy and Transport Costs: Effective ... · Protection and Transport Costs 6...
Protection and Transport Costs 1
_____________________________________________________________________CREDIT Research Paper
No. 98/13_____________________________________________________________________
Protection, Trade Policy andTransport Costs: Effective Taxation
of Ugandan Exporters
by
Chris Milner, Oliver Morrissey and Nicodemus Rudaheranwa
DFID-TERP: CREDIT DISCUSSION PAPER 7 (CDP007)This is Discussion Paper No. 7 in the CREDIT Project on ‘Infrastructural andInstitutional Constraints to Export Promotion’, as part of the DFID Trade andEnterprise Research Programme (TERP). The TERP involves research projects byteams in CREDIT, CREEM (SMF, Nottingham), CSAE (Oxford) and IDS.
_____________________________________________________________________Centre for Research in Economic Development and International Trade,University of Nottingham

Protection and Transport Costs 2
Protection and Transport Costs 3
The Centre for Research in Economic Development and International Trade is basedin the School of Economics at the University of Nottingham. It aims to promoteresearch in all aspects of economic development and international trade on both along term and a short term basis. To this end, CREDIT organises seminar series onDevelopment Economics, acts as a point for collaborative research with other UK andoverseas institutions and publishes research papers on topics central to its interests. Alist of CREDIT Research Papers is given on the final page of this publication.
Authors who wish to submit a paper for publication should send their manuscript tothe Editor of the CREDIT Research Papers, Professor M F Bleaney, at:
Centre for Research in Economic Development and International Trade,School of Economics,University of Nottingham,University Park,Nottingham, NG7 2RD,UNITED KINGDOM
Telephone (0115) 951 5620Fax: (0115) 951 4159
CREDIT Research Papers are distributed free of charge to members of the Centre.Enquiries concerning copies of individual Research Papers or CREDIT membershipshould be addressed to the CREDIT Secretary at the above address. Papers may alsobe downloaded from the School of Economics web site at: www.nottingham.ac.uk/economics/research/credit

Protection and Transport Costs 4
_____________________________________________________________________CREDIT Research Paper
No. 98/13
Protection, Trade Policy andTransport Costs: Effective Taxation
of Ugandan Exporters
by
Chris Milner, Oliver Morrissey and Nicodemus Rudaheranwa
_____________________________________________________________________
Centre for Research in Economic Development and International Trade,University of Nottingham

Protection and Transport Costs 5
The AuthorsChris Milner is Professor and Head of School, and Oliver Morrissey is Directorof CREDIT and Senior Lecturer, both in the School of Economics, University ofNottingham. Nicodemus Rudaharenwa is a Research Student in the School ofEconomics, University of Nottingham.
AcknowledgementsThis is Discussion Paper CDP007 in the CREDIT Project on ‘Infrastructural andInstitutional Constraints to Export Promotion’, as part of the DFID Trade andEnterprise Research Programme (Research Grant CNTR 96 0494A). NicodemusRudaheranwa is grateful to DFID for funding his position as a Research Studenton this project.
____________________________________________________________Manuscript received: December 1998

Protection and Transport Costs 6
PROTECTION, TRADE POLICY AND TRANSPORT COSTS: EFFECTIVE
TAXATION OF UGANDAN EXPORTERS
by
Chris Milner, Oliver Morrissey and Nicodemus Rudaheranwa
Abstract
Uganda has made significant progress in reducing the anti-export bias in its trade
policy in the 1990s. Taxes on exports have been abolished, and import protection has
been reduced considerably. Trade policy barriers are only a component, albeit
important, of the transactions costs associated with trade. Poor infrastructure, notably
by increasing transport costs, and institutional inefficiencies (for example, in customs
clearing procedures), can significantly increase trade costs. This paper uses data from
a range of sources to estimate the transport costs for imports to, and exports from,
Uganda. Separate estimates are provided for road freight, sea freight and air freight
for fourteen productive sectors of the economy. The effective protection of imports,
and implicit tax on exports, due to transport costs is calculated and compared to
effective protection due to trade policy barriers. The results reveal that transport costs
are often very high, in many cases representing a greater cost (tax) to exporters than
trade policy. Investment in improved transport infrastructure could be of significant
benefit to Uganda, especially to exporters.
Outline
1. Introduction
2. Barriers to International Trade
3. Analytical Framework
4. Data and Estimation Procedures
5. Results and Discussion
6. Conclusions

Protection and Transport Costs 7
1 Introduction
The main objective in this paper is to quantify the relative importance of ‘policy-
induced’ and ‘non-policy’ barriers to trade, using an effective protection approach. By
policy-induced barriers we refer to price distortions and trade costs associated with
trade policy. In particular, this quantifies the effect of taxes on imports (tariffs), non-
tariff barriers (NTBs) and taxes on exports. The non-policy barriers are strictly those
not associated directly with trade policy. Some will be transactions costs resulting
from other (non-trade) policies. For example, a highly regulated exchange rate regime
can increase the costs of exchanging currency; exporters may not be able to retain the
full true value of foreign exchange earnings, or importers may have difficulty getting
the hard currency they require. Similarly, an inefficient financial system can increase
the costs of, and ration access to, credit (necessary, for example, to finance trade).
More importantly, for present purposes, are what can be termed natural barriers. Some
countries will face additional trade costs because of their geographical characteristics.
For example, countries like Uganda are land-locked whilst islands like Mauritius are
remote. These natural barriers will increase costs (of getting goods to market) for
affected countries, relative to countries with more favourable geographical
characteristics. We address this by examining transport costs.
To some extent the distinction between trade policy and non-policy barriers is
arbitrary. In principle, one could envisage various ways of categorising trade
distortions or barriers: trade policy-induced, non-trade policy, infrastructure
inefficiencies (that, for example, increase transport, storage and distribution costs),
institutional constraints (slow customs procedures at borders, lack of marketing
information) and natural barriers. Many of these are difficult to measure, even
approximately; we confine attention to two and take the example of Uganda. First, we
will measure effective protection due to trade policy (specifically, taxes on imports
and exports). Second, using the effective protection formula, we will measure
transport costs as an implicit tax on producers; note that this measure conflates two
barriers, infrastructure inefficiencies and natural barriers, into one. Importers and
exporters in Uganda will face higher transport costs than, for example, competitors in
Kenya simply because they have to transport goods further to get to ports to ship

Protection and Transport Costs 8
goods overseas.1 This is the natural element. However, if transport infrastructure is
poorly maintained and inefficient within Uganda, this increases trade costs; if the
modes of transport to a port are inefficient, this increases trade costs. These costs
associated with poor infrastructure are avoidable, by improving the quality of
infrastructure. By quantifying the costs, one can estimate the potential benefits from
investing in improved infrastructure.
The principal aim of this paper is to demonstrate that the implicit tax associated with
transport costs in Uganda is quite high, and for many sectors exceeds the costs of
trade policy barriers. These high transport costs are one factor that can help to
explain why, although significant trade liberalisation has been implemented by
Uganda in the 1990s, the supply response of exporters has been sluggish and limited
(Morrissey and Rudaheranwa, 1998). Section 2 briefly reviews the literature on the
role of transport costs in international trade. Section 3 then presents the analytical
framework we will use, while Section 4 describes the data and estimation procedure.
The results are discussed in Section 5, with concluding observations in Section 6.
2 Barriers to International Trade
Trade barriers, be they artificial (e.g. tariffs and import restrictions) or natural, such as
geographical distance between producing and market centres, increase transaction
costs of traders. Early studies (Balassa, 1965; Basevi, 1966; Corden, 1966 and 1971)
were concerned with determining the extent to which artificial trade barriers in the
importing country impact on domestic prices. Transport costs may pose even more of
a constraint to foreign trade (Waters II, 1970; Finger and Yeats, 1976; Yeats, 1977a).
Although acknowledged as important, the literature on the impact of transport costs is
sparse. This limited attention is often attributed to several factors such as lack of
reliable data on incidence, the assumption that transport costs are outside the direct
control of policy makers, and that the influence of transport costs on trade flows
relative to that of tariffs is small. The latter assumption may have been true in highly
protected economies, but one can question whether it is still true following bouts of
trade liberalisation over the past decade or so.
1 This specific argument relates to trade with overseas markets. The case of regional markets isdifferent, and addressed below. For example, its land-locked status does not impose a differential cost

Protection and Transport Costs 9
Evidence on the importance of freight costs from Waters II (1970), Finger and Yeats
(1976), Clark (1981) and Milner (1996) shows that the effective rate of protection due
to transport costs is often as high or higher than their tariff counterparts. Finger and
Yeats (1976) further indicate that the incidence of freight charges is higher on goods
exported by developing countries relative to those of industrial nations. Arguments
have been advanced indicating that there are policy options that would reduce the
impact of high freight costs in international trade (Amjadi and Yeats, 1995a,b). Such
options include exploiting economies of scale in transportation (increasing the volume
shipped), increasing efficiency in the shipping system, or increasing the unit value of
commodities shipped. All would reduce the relative impact of freight charges on trade
flows. Milner and Morrissey (1999) and Milner (1996 and 1998) disaggregate natural
barriers into ‘avoidable’ and ‘unavoidable’ components and argue that increasing
infrastructure efficiency would reduce the avoidable trade barriers.
There are salient advantages of reducing transaction costs resulting from avoidable
natural trade barriers relative to the provision of subsidies or export incentives.
Reducing transaction costs is an efficient means to resource utilisation and, unlike the
provision of subsidies, does not invite retaliation by trading partners. The provision of
subsidies encourages rent-seeking and induces economic inefficiency by distorting
relative prices. Moreover, there may be inefficiencies and administrative costs on
trading agents associated with the implementation of subsidies (Corden, 1971).
Most past research concentrates on protection due international (air/marine) transport
costs only, with no adjustment made for overland transport costs borne by land-locked
countries.2 Most researchers use the difference between the f.o.b. and c.i.f. values (a
method initially developed by Moneta, 1959) as a proxy for transport costs. The f.o.b.
value includes production costs and all charges incurred in placing the goods on board
a ship, while the c.i.f. value equals the f.o.b. value plus freight and insurance charges
to the entry port of the importing country. Clearly this is a proxy for the extent to
which the domestic producer is protected (or an exporter disprotected) by
international (both air and marine) transport costs. It excludes transaction costs in the
on Uganda’s trade with neighbours.2 See for example studies by Waters II (1970), Finger and Yeats (1976), Sampson and Yeats (1977),

Protection and Transport Costs 10
goods distribution chain between the port of entry and the inland destination. Such
transaction costs may arise from inefficiencies in transport, clearing procedures, port
facilities and losses due to poor storage facilities in the distribution network. High
transaction costs from such a poor infrastructure system may reduce and even nullify
any comparative advantage that might be revealed by producer price comparisons (for
a broader ranging and innovative study of transactions costs in trade, see Abdel-Latif
and Nugent, 1996).
It may not matter whether the country is land-locked or not; significant trade barriers
may originate from inefficiency in seaport services. Clark (1981) shows that a high
proportion of transport costs originate from inefficiency in stowing, loading and
unloading, and clearing of cargo at ports. Furthermore, large countries may have to
transport goods long distances over-land. However, the problems are even greater for
land-locked countries, especially in the case of exports. For example, Kenya,
Tanzania and Uganda all export coffee. Kenya’s internal transport infrastructure is
probably less inefficient than Tanzania’s, although the port at Dar-es-Salaam is
probably less inefficient than Mombassa. The transport costs facing Kenyan and
Tanzanian producers may be similar, but Ugandan producers (and those in Rwanda
and Burundi) face even higher costs as they have to go through one of the former
countries. In addition to the overland transport costs, there may also be costs
associated with delays and processing at customs points.
Our analysis goes beyond previous studies in a number of respects. First, our transport
costs are not based on cif-fob differentials; we use direct estimates of marine and air
shipping costs. Second, we incorporate overland freight charges incurred in shipping
goods between seaport and inland destinations. Third we use a more general
analytical framework to measure transport costs not simply as increasing the price of
the good in question but as increasing production costs. In other words, we estimate
the effective protection (implicit tax on production) associated with transport costs,
rather than simply the nominal protection.
Yeats (1977a,b), Jansson and Shneerson (1978), Clark (1981).
Protection and Transport Costs 11
3 Analytical frameworkMethods for measuring the impact of trade barriers are well developed (e.g.
Greenaway and Milner, 1993). The nominal rate of protection (NRP) captures the
price raising effect of a trade barrier on the affected product. For example, a tariff of
15 per cent increases the prices of imports by that percentage, hence domestic
producers of competing goods can price up to that level, i.e. the domestic price can
exceed the world price by 15 per cent (NRP = 0.15). This ignores the fact that some
domestic producers use imported inputs; trade barriers increase the price of inputs,
therefore increase production costs (or reduce value added). The effective rate of
protection (ERP) incorporates this by measuring the proportional change in the value
added for a product (j) as a result of a given trade barrier. Both measures can be
adapted to measure the protection (implicit tax) associated with transport costs.
We assume that domestically produced and foreign goods are perfect substitutes. This
is a restrictive assumption if one is using a high level of commodity aggregation or for
manufactures, but may not be too unrealistic for agricultural commodities (Tsakok
1990). Sadoulet et al. (1995), de Melo et al. (1981) and Devarajan and Sussangkarn
(1992) argue that import penetration and the elasticity of substitution have opposing
biases on ERP estimates. Measured ERP is based on the shares of particular inputs in
production costs. If import penetration (the share of imports in the market) is high,
measured ERP will tend to over-estimate protection; if domestic producers really
were being protected, import penetration would not be so high. On the other hand, if
the elasticity of substitution is high, measured ERP is more ‘accurate’ in the sense that
(protected) domestic goods can be used in place of imports. Thus, if the elasticity of
substitution is high, import penetration should be low for protected goods; in this
sense, the two have opposite biases on the interpretation of ERPs. Our assumption of
an infinite elasticity of substitution implies that our estimates should be interpreted as
at the higher end.
We adopt the following commonly used formula of the ERP,
ej = [tj - ∑iaijti]/[1 - ∑iaij] [1]
Protection and Transport Costs 12
Where tj and ti are ad valorem tariff rates on imported final output (j) and intermediate
inputs (i) respectively while aij is the technical coefficient that represents the amount
of input i used in producing one unit of output j. In the absence of non-policy
protective factors, the effective rate of protection afforded by tariffs on product j is
given by ej. This formula can relatively easily be extended to incorporate non-traded
inputs and non-tariff barriers (if one has a measure of the tariff-equivalent), issues we
return to below.
Extension of the analysis of effective protection to include transport costs can be
achieved with a relatively straightforward modification of equation [1] (e.g. Milner
and Morrissey, 1999). Assume a world without tariffs and consider the protection
afforded to domestic industries by shipping costs on imports. If we let rj and ri be the
ad valorem freight rates borne when shipping output j and input i respectively in the
absence of trade policy barriers, we get:
ej = [rj - ∑iaijri]/[1 - ∑iaij] [2]
In equations [1] and [2], tariffs and freight costs on outputs provide an implicit
subsidy to domestic producers of import-competing goods, but disprotect (tax)
producers of exports. Tariffs and transport costs on inputs increase costs of
production, whether for domestic sales or export market, and therefore implicitly tax
both import-competing and export producers. Natural barriers have a double negative
impact on production for export, through increased costs on inputs and reduced
margins on export sales (Box 1). Unlike producers for the domestic market, exporters
may not be able to pass on the cost increases to consumers because of high
competition in the export markets. Therefore, the impact of trade barriers will be
greater on export producers than producers for the domestic market.
Disprotection to exporters resulting from natural trade barriers is slightly different
from that originating from policy barriers. Under trade policy barriers some
compensation may be provided to exporters, such as relief of duties paid on imported
inputs for production for exports. Measures to offset the impact of duties on imported
inputs often include tariff exemptions and duty drawback schemes or provision of

Protection and Transport Costs 13
explicit export subsidies. If such compensating measures are in place the anti-export
bias due to trade policy barriers can be minimised or eliminated. In contrast, it is
difficult to avoid the disprotection of exports originating from natural trade barriers,
or infrastructure constraints. For example, it may be difficult to compute the subsidy
equivalent of the implicit tax originating from a given natural barrier, and there may
be no guarantee that if such a subsidy is granted it would benefit export producers
rather than shipping agents. It may also be difficult to target the subsidy to exporters.
Thus, even if subsidies were possible, they would be indiscriminate and would not
eliminate the anti-export bias inherent in natural trade barriers. Measures to reduce
infrastructure or institutional constraints, while they would benefit importers, would
reduce the anti-export bias as they reduce costs in both directions (from, for imports,
and to, for exports, foreign markets). This is especially true for primary commodity
exports, where internal transport costs are often high. The various possibilities are
summarised in Box 1.
Box 1: The Impact of Trade Barriers
Trade barrier Importables ExportablesOutput
Policy-induced subsidy tax / neutralNon-policy subsidy tax
InputPolicy-induced tax tax / neutralNon-policy tax tax
Source: adapted from Milner (1998).
In practice, both policy and non -policy barriers may apply in which case a combined
effect from the two sources is expected. Following Balassa (1968) and Johnson
(1969) there are two approaches when both tariffs and transport costs apply. If tariffs
are levied on the f.o.b. value of imports, the combined effect of both barriers is the
sum of the two rates of effective protection (equations [1] and [2]). Alternatively,
where tariffs are calculated as a proportion of the c.i.f. value (and therefore paid on

Protection and Transport Costs 14
transportation costs), an interactive effect should de added to the two ERPs.3
Whether the f.o.b. or c.i.f. system is used, the party that bears the burden of the tariff
or freight costs depends on relative elasticities of demand and supply for the
commodity in question (Amjadi and Yeats, 1995a). When the demand elasticity is
higher than that of supply, a higher proportion of freight costs will be borne by the
exporter. A small country like Uganda is likely to face a more elastic demand than
supply for her exports (especially as these are primary commodities for which Uganda
is a small producer on the global market), but more elastic supply than demand for
imports. Therefore, the burden of shipping costs is likely to be incident on Ugandan
exporters and importers. This implies that reducing transaction costs woud be of
particular benefit to Uganda. Overall protection is given by:
ej = [(tj-Σaijti)/(1-Σaij)]+[(rj-Σaij ri)/(1-Σaij)]+[(rj tj-Σaij ti ri)/(1-Σaij)] [3]
Equation [3] gives the total protection that would result from both tariffs and transport
costs under the c.i.f. valuation system. That is, the first term on the right-hand side is
the tariff protection given by equation [1], the second term is the natural protection
given by equation [2], and the last term is the protection due to the interactive effect.
The signs of each component depend on both the market orientation of production and
the nature of the trade policy regime (Milner 1996). The relationship between the
nominal and effective rates of protection can be distinguished if we assume uniform
nominal rates of protection due to natural barriers on inputs and output, i.e. that ri =
rj. For domestic sales, the escalating tariff scenario (output tariffs exceed input tariffs)
implies that effective protection exceeds nominal protection4 (i.e. ej ≥ tj ≥ ti). Under
the de-escalating tariff scenario, effective protection will fall short of nominal
protection on output (ej ≤ tj ≤ ti). In case of production for the export market, trade
barriers would always increase costs of production (ti ≥ 0) and if there are no
subsidies on exports then effective protection would be negative, or zero if there are
exemptions or refunds of duties on inputs (ej ≤ 0). For cases where export subsidies
3 For detailed discussion on the impact of using the c.i.f. or f.o.b. valuation on international trade flowssee Yeats (1980) and Erzan and Yeats (1991)4 An implicit assumption is being made that aij < 1.

Protection and Transport Costs 15
(sj) are granted but at lower rates than the weighted rates on inputs then exports would
still be disprotected, i.e. when sj < Σaijti.
Similar arguments apply for natural trade barriers with two exceptions. First, as noted
earlier, exemptions and refunds to off-set costs increases will not effectively target
exporters. Second, there will always be net negative protection (implicit tax) on
export output from natural trade barriers. It follows that even under assumed uniform
nominal rates of protection from natural trade barriers, the effective disprotection on
exports from natural trade barriers will always be higher than (or at best equal to) that
originating from policy-induced trade constraints. Effective protection due to the
interaction of tariffs and natural barriers will be positive for domestic sales under
escalating tariffs but negative for export sales in the absence of export subsidies.
The production process also employs non-traded inputs. Ideally, tradables and non-
traded goods would be incorporated into measures of protection within a general
equilibrium framework (Milner, 1995). An import duty, for example, would affect the
demand for (and therefore the price of) non-traded goods. The impact of protection on
non-traded goods depends on the substitutability or complementarity between
tradables and non-traded goods.5 First, protection on importables tends to increase
the price and therefore production (but reduce consumption) of importables at the
expense of both exportables and non-traded goods. Second, where non-traded goods
are inputs to production of importables, increased production will increase the
demand for, and prices of, non-tradables. This second influence leads to a gap
between the intended and true protection of importables, and creates an implicit anti-
export bias.
Two approaches (the Corden and Balassa methods) have been developed in the
literature to handle non-traded inputs. Under the Corden method, value added is the
sum of the returns to the primary factors directly involved in the productive activity
and to primary factors embodied in non-traded inputs. The Balassa method refers to
the direct value added in the production process only, and therefore encompasses a
5 The substitution index ranges between one and zero, where one implies perfect substitutes. Forexample, the substitution index in Cameroon is 0.95 for agricultural prices and 0.62 for industrial

Protection and Transport Costs 16
narrower set of activities than the Corden measure. The modified Balassa method
considers how protection affects the cost of non-traded inputs. The essential
differences between these alternative measures are summarised in Box 2.
Box 2: Alternative Computations of Value Added
Method Treatment of Value Added
Simple
Corden
method
Value added = Value of output - cost of traded intermediate inputs directly
used in production. The value added is the return to primary factors and non-
traded inputs and therefore overstates the true value added by the cost of
traded components of non-traded intermediate inputs.
Simple
Balassa
Method
Direct value added = Value of output - (cost of traded + non-traded
intermediate inputs). The value added is the return to primary factors
directly involved in the productive activity. This underestimates value added
by the cost of primary factors used in the production of intermediate non-
traded inputs.
Sophisticated
Corden
method
Value added = Value of output - (cost of direct traded inputs + cost of traded
components of non-traded intermediate inputs). This computation requires
information on the traded components in the production of non-traded
intermediate inputs. Under such a decomposition, the value added correctly
measures the return to primary factors directly involved in the productive
activity and to primary factors indirectly involved in the productive activity
(i.e. via intermediate non-traded inputs).
Modified
Balassa
Method
Direct value added for border prices = Value of output - (cost of traded +
non-traded intermediary inputs - tariff/subsidy on traded components).
The modified Balassa method considers how the protective factors change the cost of
non-traded intermediary inputs. In summary, traded inputs, whether direct or indirect,
are subtracted from the value of output under the Corden measure while both traded
and non-traded intermediary inputs are subtracted under the Balassa system. In our
prices (Milner, 1990), while it is 0.66 for Uganda (Milner and Morrissey, 1997).

Protection and Transport Costs 17
estimation process, non-traded inputs are treated according to the Balassa method6,
which assumes an infinite elastic supply of non-traded inputs and therefore that all-
non-traded inputs are supplied to the processing sectors at constant costs. It disregards
value added embodied in the production of non-traded inputs. As a result the prices of
their value added components remain unchanged when domestic values of output and
inputs are re-valued at world prices. The resulting formula is:
ej = [(tj-Σaijti)+(rj-Σaij ri) +(rj tj-Σaij ti ri)]/(1-Σiaij-Σnanj) [4]
4 Data and Estimation Procedure
To estimate equation [4] we need information on tariffs and transport costs for outputs
j and inputs i, and for the technical coefficients. The technical coefficients are
extracted from the 1992 Ugandan Input-Output table, classified into 30 sectors (we
are only concerned with the 14 tradables sectors). As these are post-protection
technical coefficients they are deflated to arrive at free trade technical coefficients.
We employ the method of Balassa et al. (1982), given by aijw = +
+( )( )11
ttj
i aij relating the
post-protection (aij) and free trade (aijw) input-output coefficients7. In transforming the
technical coefficients in the production of non-traded inputs, ti is assumed to equal
zero under the Balassa method. The estimated free trade technical coefficients are
employed in the ERP estimation.
Uganda uses the c.i.f. valuation system for sales on the domestic market and the f.o.b.
valuation system for sales in the export market. Recently Uganda shifted from the
f.o.b. Mombasa to f.o.t. (free on truck, or alternatively free on rail) Kampala valuation
6 The simple Balassa method treats nontradable inputs like tradable inputs with unchanged prices,while the modified Balassa (sometimes called Scott) method treats nontradable inputs like tradableinputs with an allowance of their prices to change as a result of protective measures. There arecomputation difficulties with the Corden method while the Scott method is not suitable for estimationof ERP under the partial equilibrium framework. This leaves us with the simple Balassa method optiononly. 7 Tariffs imposed on inputs would discourage the production of j (thus reduced output) and thereforeaij>aij
w while tariffs on output would encourage production of output j thus aij<aijw and would result
into the following relationship aij= +
+( )( )11
tti
j aijw.

Protection and Transport Costs 18
system (which would increase the interaction effect) but the current analysis is based
on f.o.b. and c.i.f. Mombasa. Some points need be noted when estimating the ERP for
exports. Duties and freight costs on imported inputs explicitly and implicitly tax
producers, whether for domestic or export markets. On the other hand freight costs
implicitly tax output for export markets. Thus, shipping costs implicitly tax export
producers twice, i.e. they increase the costs of imported inputs and exported output
hence reducing their profit margin in exporting activities. Moreover, exporters are
disadvantaged in that they are price-takers in international markets and therefore may
not be able to shift such costs to consumers. In estimating the ERP for exports we set
policy-induced NRP equal to zero given that there are neither export subsidies nor
export taxes in Uganda (the tax on coffee exports was abolished in 1992, although
temporarily reinstated later, see Morrissey and Rudaheranwa, 1998). 8
The choice of variables is dictated by data availability. The nominal rate of protection
would be the ex-ante or listed tariff rate if there are no other policy impediments to
trade, such as quantitative restrictions, and if there are no exemptions from import
duties. To accommodate exemptions, it is appropriate to use ex-post or implicit
(revenue collected) tariff rates. The tariff rates used in our analysis are ex-post rates
computed from the 1993/94 tariff schedule provided by Uganda Customs Department,
distinguishing trade with African countries in the Preferential Trading Arrangement
(PTA, or COMESA) and with the rest of the world (non-PTA, or NPTA).
The commodity categories in the tariff schedule are reported according to the SITC
commodity classification although their HS codes (into 97 commodities) are also
reported. We first reclassify these commodities under the analysis according to the HS
chapter and then aggregated them into various groups that are consistent with sectors
given by the Uganda Input-Output table (the sectors are listed in the tables below).
This is necessary because the technical coefficients are available at the sector level.
Tariff rates on output (sector) j for PTA markets is the ratio of total duty collected on
8 There may be implicit export subsidies on duties paid on imported inputs for export production butwe are unable to get relevant information. In practice, the paid duties are supposed to be reimbursedunder the duty drawback scheme but it may not be attractive to traders because of the lengthy anddifficult bureaucratic procedures of getting the refunds.
Protection and Transport Costs 19
commodity j to the value of imports of j from PTA countries. An equivalent procedure
is used to get tariff rates on final outputs from NPTA countries. We use the average
tariff rates on imported inputs (averaging across both sources) as we do not know
from which market imports to a particular sector were sourced. Import taxes
employed in Uganda include import duties, withholding tax and commission charges.
Sales tax and Excises are imposed on domestic products also therefore do not provide
protection. The implicit tariff rate is given by t = (Duty + withholding tax +
commission)/c.i.f. value. As the reported tariff rates are on a commodity level within
each sector, the tariff rates used for each sector are an average of tariff rates on
commodities in that sector. This commodity tariff averaging in a given sector may
mask the dispersion of tariff rates across commodities. To allow for this we compute
and report maximum and minimum protection rates (i.e. the range) in each sector
where possible.
The freight rates used in our estimation are measured as a ratio of shipment value, i.e.
ad valorem freight rates. Data on individual commodity freight rates for NPTA trade
flows were derived from Amjadi and Yeats (1995a) and used to compute sectoral
average freight rates. From this source, we can distinguish average marine and air
freight costs for each sector; note that these estimates for marine freight include the
costs of shipping the goods overland to the seaport. Freight rates on PTA trade flows
(which provide an estimate of overland costs) are derived from World Bank (1994),
which reports freight rates as an overall average for the country. However, we need
freight rates on a sectoral level.
We use NPTA freight rates to derive proxies for PTA freight rates by computing
backwards using the following procedure. Let AVFN and AVFP be the overall average
freight rates for the NPTA and PTA trade flows respectively, while FiN and FiP are
freight rates for sector i on NPTA and PTA trade respectively. We have data on AVFP
and FiN and we can compute the value AVFN but no data on FiP. Computing
AVFN=(ΣFiN)/Σi where Σi is the number of sectors (in our case 14) and then using it
in FiP = (FiN*AVFP)/AVFN, we get the nominal freight rates used in the computation of
freight rates of protection for each sector on PTA trade. In other words, we assume for
each sector that the ratio of sector transport costs to average transport costs is the
Protection and Transport Costs 20
same for PTA as for NPTA trade.
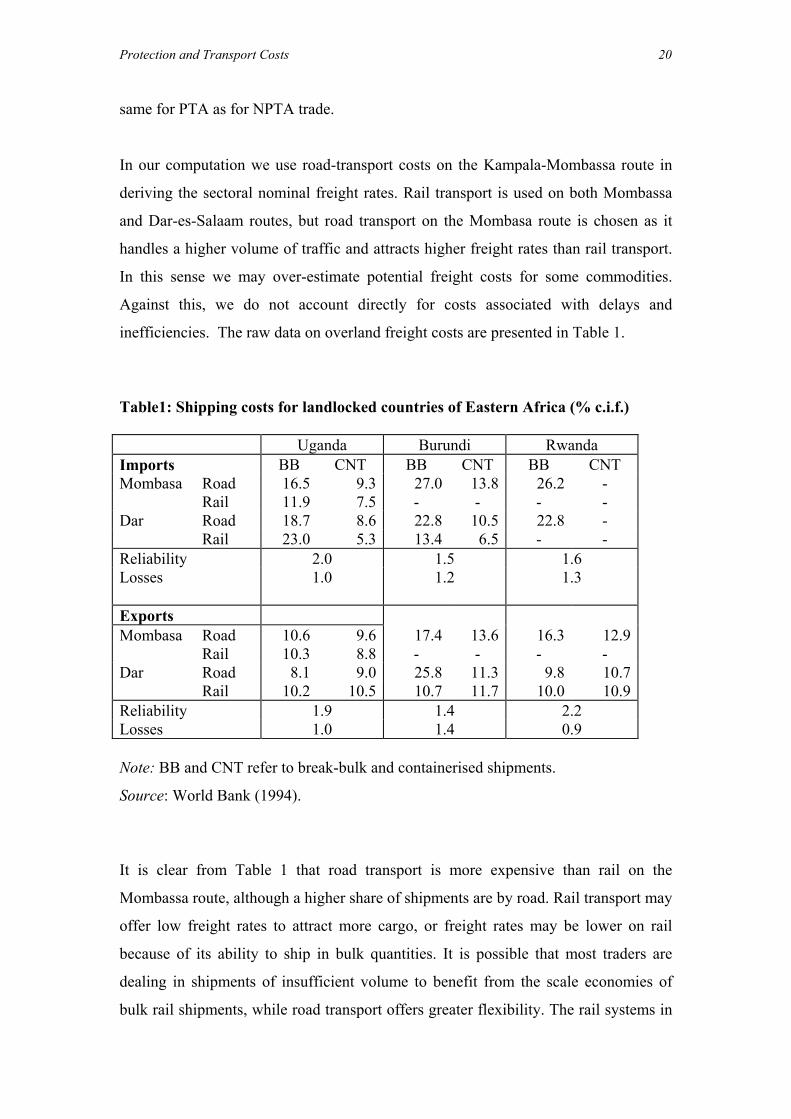
In our computation we use road-transport costs on the Kampala-Mombassa route in
deriving the sectoral nominal freight rates. Rail transport is used on both Mombassa
and Dar-es-Salaam routes, but road transport on the Mombasa route is chosen as it
handles a higher volume of traffic and attracts higher freight rates than rail transport.
In this sense we may over-estimate potential freight costs for some commodities.
Against this, we do not account directly for costs associated with delays and
inefficiencies. The raw data on overland freight costs are presented in Table 1.
Table1: Shipping costs for landlocked countries of Eastern Africa (% c.i.f.)
Uganda Burundi RwandaImports BB CNT BB CNT BB CNTMombasa Road 16.5 9.3 27.0 13.8 26.2 -
Rail 11.9 7.5 - - - -Dar Road 18.7 8.6 22.8 10.5 22.8 -
Rail 23.0 5.3 13.4 6.5 - -Reliability 2.0 1.5 1.6Losses 1.0 1.2 1.3
ExportsMombasa Road 10.6 9.6 17.4 13.6 16.3 12.9
Rail 10.3 8.8 - - - -Dar Road 8.1 9.0 25.8 11.3 9.8 10.7
Rail 10.2 10.5 10.7 11.7 10.0 10.9Reliability 1.9 1.4 2.2Losses 1.0 1.4 0.9
Note: BB and CNT refer to break-bulk and containerised shipments.
Source: World Bank (1994).
It is clear from Table 1 that road transport is more expensive than rail on the
Mombassa route, although a higher share of shipments are by road. Rail transport may
offer low freight rates to attract more cargo, or freight rates may be lower on rail
because of its ability to ship in bulk quantities. It is possible that most traders are
dealing in shipments of insufficient volume to benefit from the scale economies of
bulk rail shipments, while road transport offers greater flexibility. The rail systems in
Protection and Transport Costs 21
the three East African countries are government-managed and notoriously
inefficiencient. This does not imply that road transport is efficient in itself (only
efficient relative to rail transport). Freight rates on exports are generally lower than
those on imports due to imbalances in trade flows. Import volumes exceed export
volumes so that there is excess capacity in trucks or trains returning to sea-ports.
Combining these various sources of data permits us to estimate the average ad
valorem freight costs for each sector (these transport NRPs are reported in Appendix
Tables A2-A4). We do not know the extent to which a sector utilises break bulk or
containerised shipping, although we do know that the former is more expensive
(Table 1). Similarly, we do not know the extent to which a sector uses alternative road
or rail routes. However, we do know which commodities are relatively more
expensive to transport, hence which sectors have relatively higher transport costs
(from the calculations for NPTA trade outlined above). We can infer that sectors with
relatively high transport costs are those using relatively more expensive forms or
routes of transport. We will consider the reasons why this may be the case.
5 Results and Discussion
Using data and procedures outlined in the previous section, and assuming perfect
substitution between domestic and imported goods, nominal and effective rates of
protection associated with trade policy and transport costs (distinguishing land, sea
and air freight) are estimated for fourteen production sectors. The detailed results are
given in Appendix Tables A1-A4 (we do not report the interactive effect in equation
[4] as the values are relatively small). A summary of measures of effective protection
against imports is provided in Table 2 (these estimates refer to 1993/94, since when
there has been considerable trade liberalisation so that current levels of protection will
be much lower). Goods traded within the PTA region receive preferential treatment
relative to goods originating outside the region (NPTA), as seen from the evidence
that weighted average effective protection rates are 22.3% and 35.8% against imports
from PTA and NPTA respectively. The exceptions (manufactured foods, chemicals,
beverages and tobacco) are products for which Uganda is concerned about
competition from neighbours, in particular Kenya. These are also among the sectors
attracting the highest rates of protection. The most highly protected sectors, at least

Protection and Transport Costs 22
relative to NPTA imports, are textiles, clothing and footwear, and building materials.
Table 2 reports average ERPs; we can note that protection rates against NPTA trade
exhibit a wider dispersion, with ERPs ranging between 97.9% to 15.2% relative to
ERPs against PTA imports ranging between 45.8% and 11.5% (Table A1). This wide
dispersion reflects preferential tariff rates and exemptions on PTA imports.
Table 2: Estimates of Effective Protection on Imports
Sector PTA NPTA Land Marine AirFood Products 0.235 0.274 0.274 0.182 0.183Animal Products 0.151 0.324 0.093 0.061 0.155Forestry Products 0.118 0.155 0.237 0.149 0.366Fish Products 0.320 0.351 0.089 0.055 0.681Mining & Quarrying 0.045 0.165 0.213 0.137 0.254Coffee, Cotton, Sugar Mnf. 0.191 0.299 0.163 0.107 0.323Manufactured Foods 0.268 0.238 0.483 0.287 0.320Beverages & Tobacco 0.501 0.300 0.613 0.373 1.265Textile, Cloth & Footwear 0.268 1.419 0.220 0.113 0.392Building Materials 0.289 0.550 0.609 0.357 1.101Chemicals 0.272 0.098 0.081 -0.016 0.128Metal Prod. & Machinery 0.033 0.385 0.159 0.076 0.247Other Manufactures 0.233 0.213 0.208 0.092 0.390Transport Equipment 0.201 0.243 0.157 0.077 0.242Average 0.223 0.358 0.257 0.147 0.432
Turning to freight costs, separate estimates are presented for land (road through
Kenya, for PTA trade), marine (average Mombassa to US) and air (average Entebbe
to US).9 On average, effective protection due to transport costs (25.7%) is higher than
that originating from tariffs (22.3%) for PTA trade but falls short of the tariff
protection on non-PTA trade (35.8%). There is no clear tendency for sectors with
relatively ‘heavy’ commodities to have higher freight costs, even if one considers
only nominal protection associated with transport costs (Tables A2-A4). While
building materials tend to have the highest costs, foods (products and manufactures),
beverages and tobacco also have relatively high freight costs. As freight costs are
9 The available data is for international transport to the US. As Ugandan trade is more likely to be withEurope, this implies an overestimate of true transport costs. We hope to address this in future work.
Protection and Transport Costs 23
measured relative to value, the latter could have low value-to-weight ratios.
Alternatively, shipment volumes may be relatively low, hence do not avail of bulk
efficiencies. It is not clear why metal products and machinery, mining and quarrying,
and transport equipment have relatively low freight costs. One possibility is that such
goods can fill capacity in bulk carriers and/or unit freight costs are low for relatively
high value goods (note that the estimation procedure imposes sea freight relativities
on land freight). The combined effect is that ad valorem transport costs are relatively
low.
As all goods have to be transported to a port for shipment overseas, in principle land
and marine freight costs should be added to get total transport costs. We do not do this
because we are not confident of the accuracy of our land transport cost estimates. The
ERPs associated with over-land transport in Table 2 should be interpreted as
indicative of magnitudes and relativities. Land transport costs are high, about 10 per
cent of value on average (Table 1), and therefore confer protection to domestic
producers of importables. This can translate into high levels of effective protection;
while the values in excess of 50 per cent for manufactured foods, building materials,
beverages and tobacco may be excessive, an overall average around 20 per cent is not
unreasonable. Further investigation, to determine the modes of land transport adopted
in different sectors, would be necessary to validate the relativities in Table 2.
The column of ERPs associated with costs of sea transport (marine) can be interpreted
as at the lower end, as over-land costs are not incorporated. While there is
considerable variability, transport costs appear to confer relatively high degrees of
protection (ERPs exceeding 25 per cent) for manufactured foods, building materials,
beverages and tobacco. These are also sectors with relatively high trade protection.
Thus, while the significant trade liberalisation since 1993 (Morrissey and
Rudaheranwa, 1998) will reduce levels of trade protection, natural protection still
remains high for some sectors. Transport costs may continue to isolate Ugandan
producers from world competition. Finally, we simply note that the alternative of
importing by air is excessively costly for most goods.

Protection and Transport Costs 24
Transport costs impose a very high burden (implicit tax) on export sectors (Table 3).
The disprotection of exports from policy-induced barriers is mainly through taxes on
imported inputs with no off-setting export subsidies. Average policy-induced
disprotection to exports is equivalent to a tax of 12.5 per cent (Table 3). However, we
can note that the implicit tax is low on those sectors that provide most of Uganda’s
exports – coffee, cotton, food and animal products, fish and forestry products.
Subsequent tariff reductions will have eroded this disprotection further, but any
export response to trade liberalisation in Uganda has at best been sluggish (Morrissey
and Rudaheranwa, 1998). Our estimates of the implicit tax on exports associated with
transport costs suggests a reason why. Overall, land and marine transport costs each
represent an average implicit tax on exports of 30 per cent; air freight represents a tax,
on average, almost twice this.
In general, the implicit tax due to transport, of similar magnitudes for land and sea, is
lower in the exporting sectors. Sea transport costs represent a tax of about 20 per cent
on food and forestry products, though this falls to around ten per cent for coffee and is
below ten per cent for animal and fish products. As a guide, we can compare the air
alternative to the sum of land and marine transport. Even on this basis, air freight
appears to be cost effective only for food products. This may not be surprising given
that air transport is likely to be suitable only for high-value goods which may be
shipped in relatively small amounts, and therefore may attract high freight rates. Air
transport is likely to be faster, more flexible and may be specialised to handle delicate
goods with high insurance costs or commodities with short shelf life (perishables) that
require urgent deliveries. All these factors contribute to high air freight rates. On the
other hand, marine freight rates may be lower because of the nature of the goods
being shipped, as it is suitable for goods that can be transported in bulk.

Protection and Transport Costs 25
Table 3: Effective Protection Estimates for Exports
Sector Trade Land Marine AirFood Products -0.007 -0.183 -0.191 -0.192Animal Products -0.004 -0.067 -0.070 -0.164Forestry Products -0.039 -0.202 -0.209 -0.425Fish Products -0.055 -0.078 -0.081 -0.707Mining & Quarrying -0.035 -0.167 -0.173 -0.291Coffee, Cotton, SugarManufactures
-0.013 -0.115 -0.120 -0.335
Manufactured Foods -0.177 -0.496 -0.513 -0.546Beverages & Tobacco -0.129 -0.584 -0.605 -1.497Textile, Cloth & Footwear -0.354 -0.316 -0.325 -0.605Building Materials -0.149 -0.649 -0.670 -1.414Chemicals -0.231 -0.402 -0.410 -0.554Metal Products & Machinery -0.190 -0.252 -0.259 -0.430Other Manufactures -0.199 -0.371 -0.381 -0.679Transport Equipment -0.166 -0.240 -0.247 -0.411Average -0.125 -0.294 -0.304 -0.589
The most important point is that transport costs are high. Over-land transport in the
region is inefficient, with many delays and losses due to damage or inadequate storage
(Morrissey and Rudaheranwa, 1998). It also true that the ports of Mombassa and Dar-
es-Salaam are not very efficient. The ERPS associated with land and marine transport
could feasibly be halved through investment in improved infrastructure and
administrative processing, at customs points and ports. As Uganda tries to diversify
its exports it is moving into goods, such as green beans and cut flowers, for which
speedy transport is essential. Air freight is appropriate here, but costly (partly because
of a lack of refrigeration facilities). Our estimates demonstrate that natural barriers,
especially transport costs, are an important constraint to Ugandan exporters.
6 Conclusions
In this paper we used data on freight costs from a variety of sources in an effective

Protection and Transport Costs 26
protection framework to estimate the protection to imports and implicit taxation of
exports associated with transport costs. While some of the estimates are admittedly
rough, we have been able to demonstrate that transport costs are in general high, often
exceeding the protection (or disprotection of exports) attributable to trade barriers,
and represent a significant constraint to Ugandan exporters. Trade liberalisation does
much to reduce the anti-export bias inherent in protectionist trade policies, but one
reason for the limited export response observed in countries like Uganda could be the
significant remaining natural barriers. Investment in infrastructure, and other
measures to reduce transactions costs, can play an important role in supporting export
growth and diversification in Uganda.
In this analysis we have been unable to distinguish fully the individual components of
transport costs. A next step will be to identify each stage: internal (overland) costs in
Uganda, Uganda border to seaport overland costs, seaport to market marine costs, and
airport to market air freight costs. In particular, it would be informative to be able to
compare land plus sea transport costs to air freight costs for particular commodities.
However, air freight will only be viable for a few commodities, and the bulk of trade
is likely to be transported over land for shipment from ports. It follows that improved
road, rail and port facilities would be of major benefit to trade.
The current analysis covers only freight costs, just one component of the
infrastructural and institutional constraints facing traders. There are likely to be high
transaction costs arising from lack of information, both on local and foreign market
conditions, poor communication and cumbersome administrative procedures. Limited
access and high costs of credit may be another constraint that is not captured by our
analysis. Inefficiency in the banking system in Uganda is reflected in the wide gap
between the deposit and lending rates of interest, which stood at 3.2 per cent and 20.3
per cent respectively in 1997. Milner (1996), for example, estimates that inefficiency
in the banking system increases the cost of credit by 20 per cent.
There is potential for increased trade flows within the PTA region, given proximity,

Protection and Transport Costs 27
similarities in level of development and patterns of demand. Increased efficiency in
production to increase the quality and value of Ugandan exports within the PTA
region could avoid the high transaction costs of shipping goods to overseas markets.
One problem to be resolved if this potential is to be exploited is the improvement of
internal transport facilities. Transaction costs from natural trade barriers are difficult
to eliminate, but one can distinguish avoidable costs associated with inefficiencies
from the truly natural barriers. There are ways of minimising transaction costs,
including reducing vessel turn around times, simplifying cargo handling and clearing
procedures at ports, and in the distribution system generally. Such measures can have
important effects in reducing the costs of trade and facilitating an increased volume of
trade, especially of exports.
Protection and Transport Costs 28
References
Abdel-Latif, A. and J. Nugent (1996), ‘Transaction Cost Impairments to International
Trade: Lessons from Egypt’, Contemporary Economic Policy, 14, 1-14.
Amjadi, A. and A. Yeats (1995a), ‘Nontariff barriers Africa faces; What did the
Uruguay Round accomplish, and what remains to be done’, Policy Research
Working Paper 1439, Washington DC: World Bank, International Trade Division.
Amjadi, A. and A. Yeats (1995b), ‘Have transport costs contributed to the relative
decline of sub-Saharan African exports? Some preliminary empirical evidence’,
Policy Research Working Paper 1559, Washington DC: World Bank, International
Trade Division.
Balassa, B. (1965), ‘Tariff Protection in Industrial Countries: An Evaluation’, Journal
of Political Economy, 73, 573-594.
Balassa, B. (1968), ‘Tariff Protection in Industrial Nations and its Effects on Exports
of Processed goods from Developing Countries’, Canadian Journal of Economics,
Vol. 1, 583-594.
Balassa, B., and Associates (1982), Development Strategies in Semi-industrial
Economies, Washington, DC: Johns Hopkins University Press.
Basevi, G. (1966), ‘The United States Tariff Structure: Estimates of Effective Rates of
Protection of United States Industries and Industrial Labour’, The Review of
Economics and Statistics, 48, 147-160.
Clark, D. (1981), ‘Protection by International Transport Charges: Analysis by Stage
of Fabrication’, Journal of Development Economics, 8, 339-345.
Corden, W. M. (1966), ‘The Structure of a Tariff System and the Effective Protective
Rate’, Journal of Political Economy, 74: 3, 221 -237.
Corden, W. M. (1971), The Theory of Protection, London: Oxford University Press.
de Melo, J. and S. Robinson (1981), ‘Trade Policy and Resource Allocation in the
Presence of Product Differentiation’, R. Economics and Statistics, 63, 169-177.
Devarajan, S. and C. Sussangkarn (1992), ‘Effective Rates of Protection when
Domestic and Foreign Goods are not Imperfect Substitutes: The Case of Thailand’,
Review of Economics and Statistics, 74, 701-711.
Protection and Transport Costs 29
Erzan, R. and A. Yeats (1991), ‘Tariff Valuation Bases and Trade among Developing
Countries: Do Developing Countries Discriminate Against their own Trade?’
Journal of Development Studies, 27: 4, 64-83.
Finger, J. and A. Yeats (1976), ‘Effective Protection by Transportation Costs and
Tariffs: A Comparison of Magnitude’, Quarterly Journal of Economics, Vol. XC:
1, 169-176.
Greenaway, D. and C. Milner (1993), Trade and Industrial Policy in Developing
Countries, London: The Macmillan Press Ltd.
Jansson, J. and D. Shneerson (1978), ‘The Effective Protection Implicit in Liner
Shipping Freight Rates’, Review of Economics and Statistics, 60, 569-573.
Johnson, H. G. (1969), ‘The Theory of Effective Protection and Preferences’,
Economica, 36, 119-138.
Milner, C. (1990), ‘Identifying and Quantifying Anti-Export Bias: The Case of
Cameroon’, Weltwirtschaftliches Archiv, 126, 142-155.
Milner, C. (1996), ‘On Natural and Policy-Induced Sources of Protection and Trade
Regime Bias’, Weltwirtschaftliches Archiv, 132, 740-752.
Milner, C. (1998), ‘Trade Regime Bias and the Response to Trade Liberalisation in
Sub-Saharan Africa’, Kyklos, 51, 219-236.
Milner, C. and O. Morrissey (1999), ‘Measuring Trade Liberalisation in Africa’, in
M. McGillivray and O. Morrissey (eds), Evaluating Economic Liberalisation,
London: Macmillan (forthcoming).
Morrissey, O. and N. Rudaheranwa (1998), ‘Ugandan Trade Policy and Export
Performance in the 1990s’, CREDIT Research paper 98/12 (CDP006).
Moneta, C. (1959), ‘The Estimation of Transportation Costs in International Trade’,
Journal of Political Economy, LXVII, 41-58.
Sadoulet, E. and A. de Janvry (1995), Quantitative Development Analysis, Baltimore
and London: Johns Hopkins University Press.
Sampson, G. and A. Yeats (1977), ‘Tariff and Transport Barriers Facing Australian
Exports’, Journal of Transport Economics and Policy.
Tsakok, I. (1990), Agricultural Price Policy: A Practitioners Guide to Partial
Equilibrium Analysis, New York: Cornell University Press.
Waters II, W. (1970), ‘Transport Costs, Tariffs, and the Pattern of Industrial
Protection’, American Economic Review, 60, 1013-1020.
Protection and Transport Costs 30
World Bank (1994), The Great Lakes Corridor Study, Washington, DC: World Bank.
Yeats, A. (1977a), ‘A Comparative Analysis of the Incidence of Tariffs and
Transportation Costs on India’s Exports’, Journal of Development Studies, Vol. 14,
97-107.
Yeats, A. (1977b), ‘Do International Transport Costs Increase with Fabrication? Some
Empirical Evidence’, Oxford Economic Papers, 29, 458-471.
Yeats, A. (1980), ‘Tariff Valuation, Transport Costs and the Establishment of Trade
Preferences among Developing Countries’, World Development, 8, 129-136.

Protection and Transport Costs 31
APPENDIX TABLES
Table A1: Nominal and Effective Protection by Sector, 1994
PTA-Trade NRP ERPSector Average Max Min Average Max MinFood Products 0.232 0.338 0.050 0.235 0.345 0.045Animal Products 0.146 0.369 0.034 0.151 0.386 0.032Forestry Products 0.113 0.240 0.062 0.118 0.292 0.047Fish Products 0.308 0.308 0.308 0.320 0.321 0.321Mining & Quarrying 0.053 0.072 0.032 0.045 0.073 0.013Coffee, Cotton, SugarMnf.
0.166 0.261 0.165 0.191 0.308 0.190
Manufactured Foods 0.185 0.269 0.093 0.268 0.470 0.046Beverages & Tobacco 0.323 0.323 0.300 0.501 0.500 0.455Textile, Cloth &Footwear
0.196 0.362 0.139 0.268 0.795 0.087
Building Materials 0.155 0.313 0.144 0.289 0.739 0.259Chemicals 0.151 0.297 0.034 0.272 0.762 -0.118Metal Prod. &Machinery
0.078 0.223 0.059 0.033 0.445 -0.022
Other Manufactures 0.153 0.339 0.122 0.233 0.755 0.145Transport Equipment 0.134 0.140 0.100 0.201 0.219 0.109Average 0.171 0.275 0.117 0.223 0.458 0.115
NPTA-Trade NRP ERPSector Average Max Min Average Max MinFood Products 0.270 0.340 0.121 0.274 0.347 0.119Animal Products 0.310 0.339 0.083 0.324 0.355 0.084Forestry Products 0.141 0.338 0.049 0.155 0.427 0.029Fish Products 0.333 0.333 0.333 0.351 0.351 0.351Mining & Quarrying 0.133 0.145 0.090 0.165 0.183 0.100Coffee, Cotton, SugarMnf.
0.253 0.320 0.220 0.299 0.381 0.258
Manufactured Foods 0.172 1.439 0.126 0.238 3.288 0.126Beverages & Tobacco 0.220 0.340 0.199 0.300 0.533 0.259Textile, Cloth &Footwear
0.559 1.428 0.183 1.419 4.178 0.227
Building Materials 0.246 0.320 0.190 0.550 0.759 0.390Chemicals 0.099 0.341 0.021 0.098 0.909 -0.161Metal Prod. &Machinery
0.202 0.357 0.115 0.385 0.826 0.138
Other Manufactures 0.146 0.337 0.104 0.213 0.750 0.094Transport Equipment 0.149 0.215 0.103 0.243 0.424 0.117Average 0.231 0.471 0.138 0.358 0.979 0.152

Protection and Transport Costs 32
Table A2: Protection due to Overland Freight Costs (PTA trade)
Imports Freight InteractionSector NRP ERP NRP ERPFood Products 0.267 0.274 0.062 0.064Animal Products 0.092 0.093 0.014 0.014Forestry Products 0.194 0.237 0.022 0.026Fish Products 0.083 0.089 0.026 0.027Mining & Quarrying 0.154 0.213 0.008 0.010Coffee, Cotton, SugarMnf.
0.137 0.163 0.023 0.027
Manufactured Foods 0.247 0.483 0.046 0.088Beverages & Tobacco 0.374 0.613 0.121 0.209Textile, Cloth &Footwear
0.103 0.220 0.020 0.033
Building Materials 0.270 0.609 0.042 0.095Chemicals 0.088 0.081 0.013 0.009Metal Prod. &Machinery
0.088 0.159 0.007 0.005
Other Manufactures 0.125 0.208 0.019 0.027Transport Equipment 0.088 0.157 0.012 0.020Average 0.165 0.257 0.031 0.047
Exports Freight InteractionSector NRP ERP NRP ERPFood Products -0.171 -0.183 0.000 -0.001Animal Products -0.059 -0.067 0.000 -0.001Forestry Products -0.124 -0.202 0.000 -0.004Fish Products -0.054 -0.078 0.000 -0.005Mining & Quarrying -0.099 -0.167 0.000 -0.003Coffee, Cotton, SugarMnf.
-0.088 -0.115 0.000 -0.001
Manufactured Foods -0.159 -0.496 0.000 -0.022Beverages & Tobacco -0.240 -0.584 0.000 -0.027Textile, Cloth &Footwear
-0.066 -0.316 0.000 -0.031
Building Materials -0.173 -0.649 0.000 -0.024Chemicals -0.056 -0.402 0.000 -0.035Metal Prod. &Machinery
-0.056 -0.252 0.000 -0.015
Other Manufactures -0.080 -0.371 0.000 -0.027Transport Equipment -0.056 -0.240 0.000 -0.013Average -0.106 -0.294 0.000 -0.015

Protection and Transport Costs 33
Table A3: Protection due to Vessel Freight Rates
Imports NRP ERPSector Average Max Min Average Max Min
Food Products 0.179 0.272 0.056 0.182 0.279 0.054Animal Products 0.062 0.138 0.020 0.061 0.142 0.017Forestry Products 0.130 0.225 0.073 0.149 0.280 0.071Fish Products 0.056 0.056 0.056 0.055 0.055 0.055Mineral Products 0.103 0.203 0.018 0.137 0.287 0.009Coffee, Cotton, SugarMnf.
0.092 0.126 0.064 0.107 0.149 0.072
Manufactured Foods 0.166 0.559 0.041 0.287 1.233 -0.014Tobbaco & Beverages 0.251 0.354 0.148 0.373 0.574 0.173Textile, Clothing,Footwear
0.069 0.192 0.038 0.113 0.503 0.014
Building Materials 0.181 0.323 0.086 0.357 0.761 0.088Chemicals 0.059 0.138 0.009 -0.016 0.248 -0.183Metal Prod. &Machinery
0.059 0.237 0.002 0.076 0.583 -0.086
Other Manufactures 0.084 0.175 0.027 0.092 0.348 -0.069Transport Equipment 0.059 0.237 0.002 0.077 0.566 -0.079Average 0.111 0.231 0.046 0.147 0.429 0.009
Exports NRP ERPSector Average Max Min Average Max Min
AVR Range AVR RangeFood Products -0.179 -0.272 -0.056 -0.191 -0.288 -0.063Animal Products -0.062 -0.138 -0.020 -0.070 -0.150 -0.025Forestry Products -0.130 -0.225 -0.073 -0.209 -0.340 -0.131Fish Products -0.056 -0.056 -0.056 -0.081 -0.081 -0.081Mineral Products -0.103 -0.203 -0.018 -0.173 -0.324 -0.045Coffee, Cotton, SugarMnf.
-0.092 -0.126 -0.064 -0.120 -0.162 -0.085
Manufactured Foods -0.166 -0.559 -0.041 -0.513 -1.459 -0.212Tobbaco & Beverages -0.251 -0.354 -0.148 -0.605 -0.805 -0.404Textile, Clothing,Footwear
-0.069 -0.192 -0.038 -0.325 -0.716 -0.227
Building Materials -0.181 -0.323 -0.086 -0.670 -1.074 -0.401Chemicals -0.059 -0.138 -0.009 -0.410 -0.674 -0.243Metal Prod. &Machinery
-0.059 -0.237 -0.002 -0.259 -0.766 -0.097
Other Manufactures -0.084 -0.175 -0.027 -0.381 -0.637 -0.221Transport Equipment -0.059 -0.237 -0.002 -0.247 -0.735 -0.090Average -0.111 -0.231 -0.046 -0.304 -0.586 -0.166
Protection and Transport Costs 34
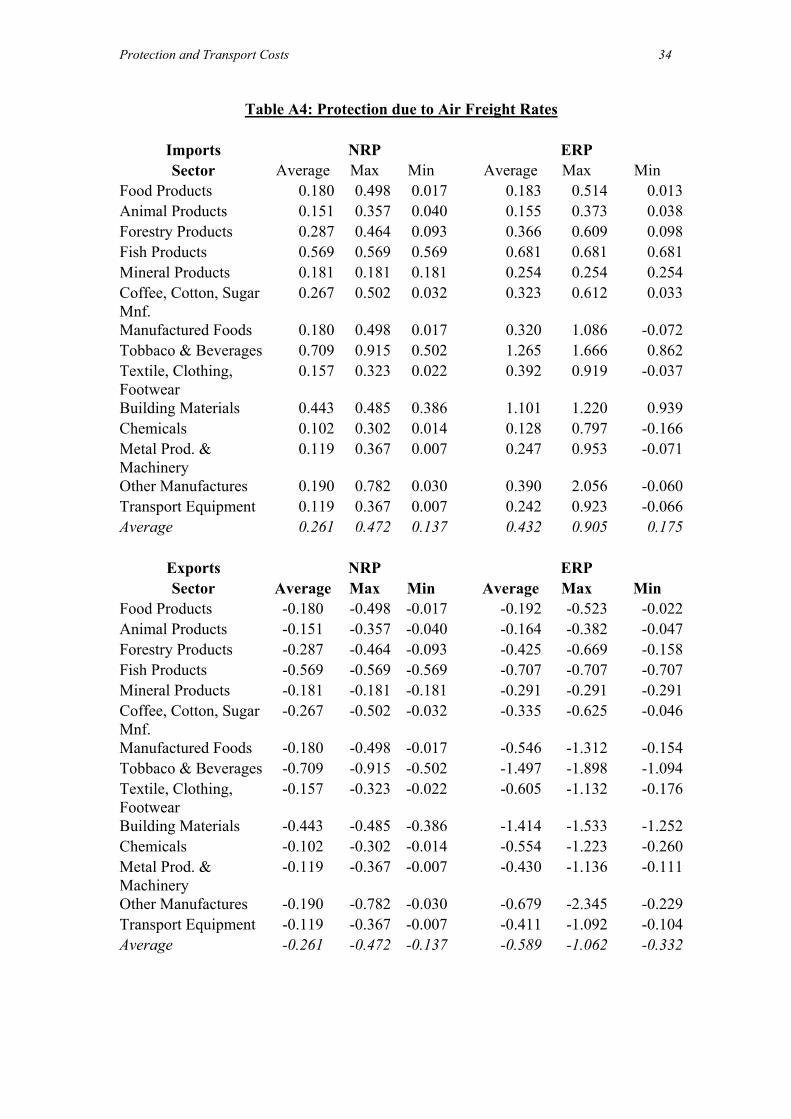
Table A4: Protection due to Air Freight Rates
Imports NRP ERPSector Average Max Min Average Max Min
Food Products 0.180 0.498 0.017 0.183 0.514 0.013Animal Products 0.151 0.357 0.040 0.155 0.373 0.038Forestry Products 0.287 0.464 0.093 0.366 0.609 0.098Fish Products 0.569 0.569 0.569 0.681 0.681 0.681Mineral Products 0.181 0.181 0.181 0.254 0.254 0.254Coffee, Cotton, SugarMnf.
0.267 0.502 0.032 0.323 0.612 0.033
Manufactured Foods 0.180 0.498 0.017 0.320 1.086 -0.072Tobbaco & Beverages 0.709 0.915 0.502 1.265 1.666 0.862Textile, Clothing,Footwear
0.157 0.323 0.022 0.392 0.919 -0.037
Building Materials 0.443 0.485 0.386 1.101 1.220 0.939Chemicals 0.102 0.302 0.014 0.128 0.797 -0.166Metal Prod. &Machinery
0.119 0.367 0.007 0.247 0.953 -0.071
Other Manufactures 0.190 0.782 0.030 0.390 2.056 -0.060Transport Equipment 0.119 0.367 0.007 0.242 0.923 -0.066Average 0.261 0.472 0.137 0.432 0.905 0.175
Exports NRP ERPSector Average Max Min Average Max Min
Food Products -0.180 -0.498 -0.017 -0.192 -0.523 -0.022Animal Products -0.151 -0.357 -0.040 -0.164 -0.382 -0.047Forestry Products -0.287 -0.464 -0.093 -0.425 -0.669 -0.158Fish Products -0.569 -0.569 -0.569 -0.707 -0.707 -0.707Mineral Products -0.181 -0.181 -0.181 -0.291 -0.291 -0.291Coffee, Cotton, SugarMnf.
-0.267 -0.502 -0.032 -0.335 -0.625 -0.046
Manufactured Foods -0.180 -0.498 -0.017 -0.546 -1.312 -0.154Tobbaco & Beverages -0.709 -0.915 -0.502 -1.497 -1.898 -1.094Textile, Clothing,Footwear
-0.157 -0.323 -0.022 -0.605 -1.132 -0.176
Building Materials -0.443 -0.485 -0.386 -1.414 -1.533 -1.252Chemicals -0.102 -0.302 -0.014 -0.554 -1.223 -0.260Metal Prod. &Machinery
-0.119 -0.367 -0.007 -0.430 -1.136 -0.111
Other Manufactures -0.190 -0.782 -0.030 -0.679 -2.345 -0.229Transport Equipment -0.119 -0.367 -0.007 -0.411 -1.092 -0.104Average -0.261 -0.472 -0.137 -0.589 -1.062 -0.332


![The Round Trip E ect: Endogenous Transport Costs and ...1 Introduction \If transport costs varied with volume of trade, the [iceberg transport costs] would not be constants. Realistically,](https://static.fdocuments.in/doc/165x107/5fee33565d72df536c477535/the-round-trip-e-ect-endogenous-transport-costs-and-1-introduction-if-transport.jpg)