Protection of line LN5 against cross winds - Railway · PDF fileProtection of line LN5 against...
12
1 Protection of line LN5 against cross winds Louis-Marie CLEON (1) , Alain JOURDAIN (2) (1) SNCF, Research and Technology Department Deputy director 45, rue de Londres, 75379 Paris Cedex 08, France Tél.˚: +33(0)1 53 42 92 55 / Fax˚: +33(0)1 53 42 92 54 e-mail˚: [email protected] (2) SNCF, TGV Mediterranean line Deputy director 1, bd Camille Flamarion – BP 22 13234 Marseille cedex 04 Tél.˚: +33(0)1 04 95 04 19 11 / Fax˚: +33(0)1 04 95 04 19 02 e-mail˚: [email protected] SUMMARY Vehicle sensitivity to the influence of side winds is a relatively well-know phenomenon. Indeed this question had already been investigated as part of research connected with the introduction of TGV systems, findings of the study had confirmed the compatibility of TGV runs with this phenomenon on existing TGV lines given their layout and meteorological situation. The presentation reviews studies and methodology to ensure safety, that had been undertaken for the TGV-MED line («˚LN5˚»), which holds a very specific risk. The TGV MED line («˚LN5˚») is located in a zone characterised by strong gusts. The existence of tall engineering structures and high embankments increases the velocity of winds blowing hard by reference to the line axis. The operation on this line of TGV-Duplex trainsets whose main cross-sectional area – at least for the trailing coaches – presents a higher wind-take the that of other TGV trains. Key words
Transcript of Protection of line LN5 against cross winds - Railway · PDF fileProtection of line LN5 against...

1
Protection of line LN5 against cross winds
Louis-Marie CLEON (1), Alain JOURDAIN (2)
(1)SNCF, Research and Technology Department
Deputy director45, rue de Londres, 75379 Paris Cedex 08, France
Tél. : +33(0)1 53 42 92 55 / Fax : +33(0)1 53 42 92 54e-mail : [email protected]
(2)SNCF, TGV Mediterranean line
Deputy director1, bd Camille Flamarion – BP 22
13234 Marseille cedex 04Tél. : +33(0)1 04 95 04 19 11 / Fax : +33(0)1 04 95 04 19 02
e-mail : [email protected]
SUMMARY
Vehicle sensitivity to the influence of side winds is a relatively well-know phenomenon.
Indeed this question had already been investigated as part of research connected with theintroduction of TGV systems, findings of the study had confirmed the compatibility of TGVruns with this phenomenon on existing TGV lines given their layout and meteorologicalsituation.
The presentation reviews studies and methodology to ensure safety, that had been undertakenfor the TGV-MED line (« LN5 »), which holds a very specific risk.
The TGV MED line (« LN5 ») is located in a zone characterised by strong gusts.
The existence of tall engineering structures and high embankments increases the velocity ofwinds blowing hard by reference to the line axis.
The operation on this line of TGV-Duplex trainsets whose main cross-sectional area – at leastfor the trailing coaches – presents a higher wind-take the that of other TGV trains.
Key words

2
Side winds, TGV MED, safety
INTRODUCTION
The sensitivity of transport vehicles to cross winds is a relatively well-identified phenomenonin the automotive industry. Japan pioneered in-depth investigations into cross winds regardingthe rail domain, due to their severe typhoons and to narrow-gauge lines. DBAG followed withthe operation of lightweight end-coaches and more recently SNCF with the commissioning ofthe TGV Med high-speed new link ”.
The new rail infrastructure, when compared to other new lines and to the existing Valence-Marseilles conventional line, present specific train overturning hazards under severe crosswind :
- the TGV Mediterranean line (LN5) is located in a very windy area (the current standardwith respect to building standards assumes peak wind velocities of 183 km/h) ;
- the presence of very high structures (60 m for Les Angles viaduct) (Fig. 1) and of sizeable
embankments up to 26 m has a dramatic acceleration effect over wind velocities.
Figure 1 : View of double Viaduc des Angles, from the left bank of Rhône River

3
- As regards the comparison with the conventional line, the enhanced running speed of 300km/h which is vectorially added to the wind velocity, induces a higher relative windvelocity , as withstood by the train itself.
- The larger model frontal area of TGV Duplex trailers therefore presents a larger section
area to wind loads and generates additional forces to be reckoned with. This obviously limited-in-scope presentation will outline the overall protective arrangementsadopted to cover potential hazards. However, It will pick on several investigations conductedon that occasion. 1 – Methodology SNCF set up the following protective approach : - The line safety is first based on the installation of wind barriers in susceptible sites over
which the minimum running speed would not be reached for winds with a 50 year returncycle period and secondly on a fail-safe anemometer-based surveillance system triggeredthrough appropriate speed restriction signals to 170 km/h and 80 km/h.
The surveillance system and associated algorithms are addressed in another presentation andwill not be described in full detail. The implementation of this approach has to go through investigative steps into susceptiblesites in tandem with given rolling stock characteristics, so as to be able to chose the mostadequate means of protection. A synoptic flow chart of this methodology is shown herebelow : Fig. 2 The 14 stages reported will only be commented when they present a special character.

4
LN5 Topology –Division into
elemental sites
Stationary Aerodynamics
Wind Tunnel Measurements
MeteorologicalStudies
Wind Model
Calculations underDynamic conditions
TGV TrainsetModelling : TGV Duplex TGV Réseau
Investigation intooverturningcriterion
Abacus ChartConstruction :
investigation into speedthresholds therrecherche
de vitesses seuils
Site CriticalityAppraisal Relative toNumerical Outputs
Regional and LocalMeteorological Studies
Site-by-Site Outputs
Identification ofSusceptible Sites
Multi-level ProtectionSystem
Studies regarding Thresholdovershootings
Surveillance Algorithm
for LN5 operations
Figure 2 - Synoptic Representation of the Methodological Approach :General Introduction
Experience FeedbackSpeed Restrictions In-situ Mesurements, offorces/wind loads
Visit to LN5 byexperts
Site CriticalityNotice
1
4
5
6
2 3
8
7
9
10
12 13 14
11

5
2 – The various stages in the methodology 2.1 –Wind Modelling over LN5 ( + + ) The analysis of strong wind situations on LN5 Valence-Marseilles was conducted aftercollecting all the data from METEO France weather stations which characterised thisgeographical field This study is based on the weather data available for the interestedgeographical field covering the 1996-1999 period and then on a 50 year return cycle period. Any area under investigation is also influenced by its topography. The presence of naturalobstacles (relief) may cause variations in wind velocities. In order to obtain the velocities anddirections of winds in areas remote from METEO France weather stations (on the routealignment, for instance), an approach purely based on a statistical analysis of weather data istherefore not sufficient per se. In order to overcome the problem, a numerical modelling of the wind field to the regional(1km-resolution) and local (from 100 to 200m-resolution) scales was made. Overall, 9000weather simulations were carried out. The wind field modelling considers the following inputs : Measurement from individual weather stations as available, Relief's influence over wind flows (for example, embankments), Large-scale phenomena, Mean wind velocities and maximum recorded wind gust along the TGV Line route alignment(with a good accuracy). 2.2 –Wind Tunnel Measurements The wind-generated aerodynamic forces affecting TGV trainsets were measured on various1/15th models of TGV Duplex and TGV Réseau units: power car, R1 to R4 trailers. The TGV line includes a broad spectrum of wind exposure configurations, given the largenumber of structures. In order to characterise exposure situations, three base cases wereidentified and tested : - Flat land tracks- Tracks laid on embankments from 4 m to 22.50 m heights- Tracks laid on viaducts The aerodynamic forces generated by slip streams are measured by means of two separatesystems :
1 3 9
2

6
- a direct measurement of the tension wrench using a dynamometer scale,- an original indirect measurement of tension wrench that will be described in more detail
later.
Indirect Measurement of Tension Wrench by Pressure Integration
The wind slip stream being turbulent by nature, pressure fields established within vehicleenvelopes are random functions of space and time. In order to characterise optimally suchloads, the CSTB (Centre Scientifique et Technique du Bâtiment) developed an instrumentationcapable of measuring rapidly, instantaneously and synchronously 256 pressure channels.
Pressures are measured at peripheral intakes by means of high-sensitivity piezoresistivetransducers using pneumatic links.
The overall loads are computed by integrating the pressure field surrounding vehicleenvelopes. Each pressure item of data is associated to an elemental area and to lever crankscorresponding to elemental moments induced by such aerodynamic pressure. Therefore, foreach instrumented vehicle, a linear combination matrix of the tension wrench is constructed.
After an initial calibration and after comparing pressure integration and overall weighingsobtained from the dynamometer scale, forces can be accessed per vehicle block andaerodynamic load fluctuations can also be obtained. This latter data enables to define anaerodynamic admittance function combining wind velocity changes and vehicle pressure loadstypical of filtering with dimensional effect.
The power car instrumentation consists of about 600 pressure intakes connected to 256measurement channels. In the power car frontal area, intake density was raised, each intakebeing connected to a measurement channel. For other areas , the intake density was reducedand intakes were fitted with averagers, so as to measure directly an average space-relatedpressure.
2.3 – Calculations under dynamic conditions - -
The dynamic calculations, from various types of data (wind model, aerodynamic coefficients)enable to determine wind velocity permissible limits relative an overturning criterion for eachrunning configuration of a TGV train.The permissible wind limit curves called abacus diagrams will then be used by cross-referencewith the results form weather studies, to determine LN5 susceptible sites to be monitored byan anemometric system or to be protected by wind fences.
2
5 6 7
7
From various analyses and assuming notably the movements (and associated modes) formingpart of an unloading study (lateral displacement modes and roll), the criterion retained as
safety-critical for drawing limiting curves is the following : 0
0
0 Q
Q)t(Q
Q
)t(Q
where Q0 is the vertical load for a balanced wheel, and Q(t) is the vertical load transmitted bya wheel at an instant t .
The time signal is filtered at 2 Hz, so as to ignore the frequencies associated to the overturningphenomenon , since the frequency of eigen modes for rock and roll that could be a contributorto the phenomenon and the signal is averaged over both wheels of the same leeway bogie.
The criterion limit was set at 0.9 (90% unloading for leeway wheels of the same bogie). Thislimit should not be exceeded during the various simulations under rail dynamics, afterconsideration of :
- the train dynamic responses- the wind scenario (average-force wind and wind gusts)- and the track alignment lay-out
Other aggravating factors may be present under conventional operating conditions :
- effect of track defects and other specific irregularities,- effect of transit over diverging line of switch and crossing,- impact of passing trains.
The phenomena are globally integrated into the 10% margin as maintained for the limitingvalue of the wheel unloading criterion .
We shall subsequently address the wind modelling options considered as regards simulations.
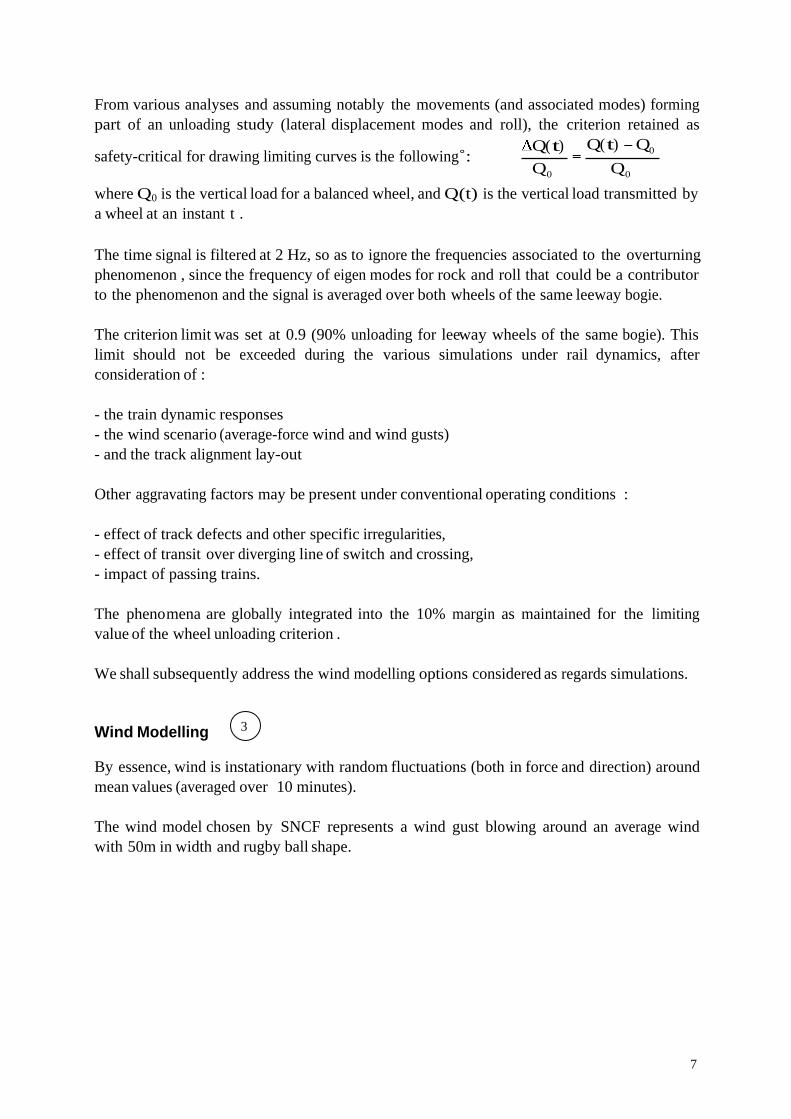
Wind Modelling
By essence, wind is instationary with random fluctuations (both in force and direction) aroundmean values (averaged over 10 minutes).
The wind model chosen by SNCF represents a wind gust blowing around an average windwith 50m in width and rugby ball shape.
3

8
The comparison with the rugby ball is given by the wind gust shape and its projection alongthe various planes assumes the form of a rugby ball half :
The densities per unit length per one-metre blocks derived from pressure transducers andincorporated into this block are used to wind instationarity along the vehicle (or train) duringthe transit through a wind field or a wind gust To some degree, this reflects the aerodynamicadmittance effect.
Fy Case Histories along the Power Car
0 2 4 6 8 10 12 14 16 18 20 22 24
X (m)
Fy - 15°
Fy - 30°
Profil TVG
Tranches

9
The space vs time simulation of the impact consists in combining train models in motion and -wind gust models in order to characterise the impact between the train and the wind gust andin documenting for each time instant the wind force and direction regarding each 1m-trainblock.
Once wind is known at each instant and for each block, the aerodynamic tension wrench maybe calculated for each vehicle using aerodynamic coefficients derived from scale measurementsand densities per unit length as obtained from pressure-transducers .
The impact is defined by the instant at which the maximum point of the wind gust meets thetrain.
For each sideslip angle , the following aerodynamic forces are obtained Fj. (j = x, y, z)
)t,i(xV)L(Cs5.0)t,i(F)t(F 2r
ii
aérojj
ij
)L(Ci
aéroj aerodynamic coefficient density j over vehicle block Li
2t
2r )Vcos)t,i(U()sin)t,i(U()t,i(V
)t,i(Vr relative wind over vehicle block Li
)t,i(U "meteo" wind impacting vehicle block Li and including an average wind and a space-
time dependent wind gust
)),t,i(U,V()t,i( t average wind impact angle relative to track
= )),t,i(U,V()t,i( t
tV train speed
Abacus Diagram Constructions
Abacus diagrams represent maximum permissible wind velocities relative to wind impact angle
with reference to line, so that the unloading criterion: 9.00Q
Q can be complied with.
Therefore, these are iso-unloading curves at 0.9 from the TGV set.
As regards embankments, diagrams are drawn along a plane (upstream wind incidence angleinfinite relative to line, upstream maximum wind velocity infinite at 4m).
7

10
Regarding viaducts, diagrams are drawn along a plane (upstream wind incident angle infiniterelative to line, upstream maximum wind velocity infinite over the viaduct)
Identification of Susceptible Sites +
The data bases required to perform this identification are the following :
- Detailed description of LN5 sites - Weather forecasts are regional and local levels for there four year period from 1996 to 1999
and forescasts for a 50-year return period. - Abacus diagrams resulting from dynamic calculations relative to train and wind models and
to the outputs from wind tunnel measurements (both results from weighing scale and frompressure probes).
The main calculation stages are the following :
For each weather data extraction point, a wind rose is constructed and presents all thepoints calculated by weather specialits in a polar form, so as to distinguish the varioustypes of wind.
The site characteristics contained on abacus drawings are superimposed on this wind rose.
The site criticality analysis is based on the predicted number of overshooting cases relative
to the curve at 300km/h first, then to the 170km/h curve and finally to the 80km/h curve.The site considered will be all the more susceptible as more wind predictions are actuallyexceeding the curve drawn for the lowest train running speed.
The abacus diagrams define 4 areas :
Area below the limiting curve for 300 km/h running speeds : area without potential runningsafety risk
Area between limiting curves for running speed of 300 and 170 km/h : area where speed willhave to be restricted at 170 km/h.
Area between limiting curves for running speed of 170 and 80 km/h : area where a speedrestriction at 80 is required.
Area beyond the limiting curve for a 80km/h running speed : susceptible site on the linewhere an all-weather operation is not guaranteed. In such a case, the premises will be fittedwith wind fences.
8 11
11
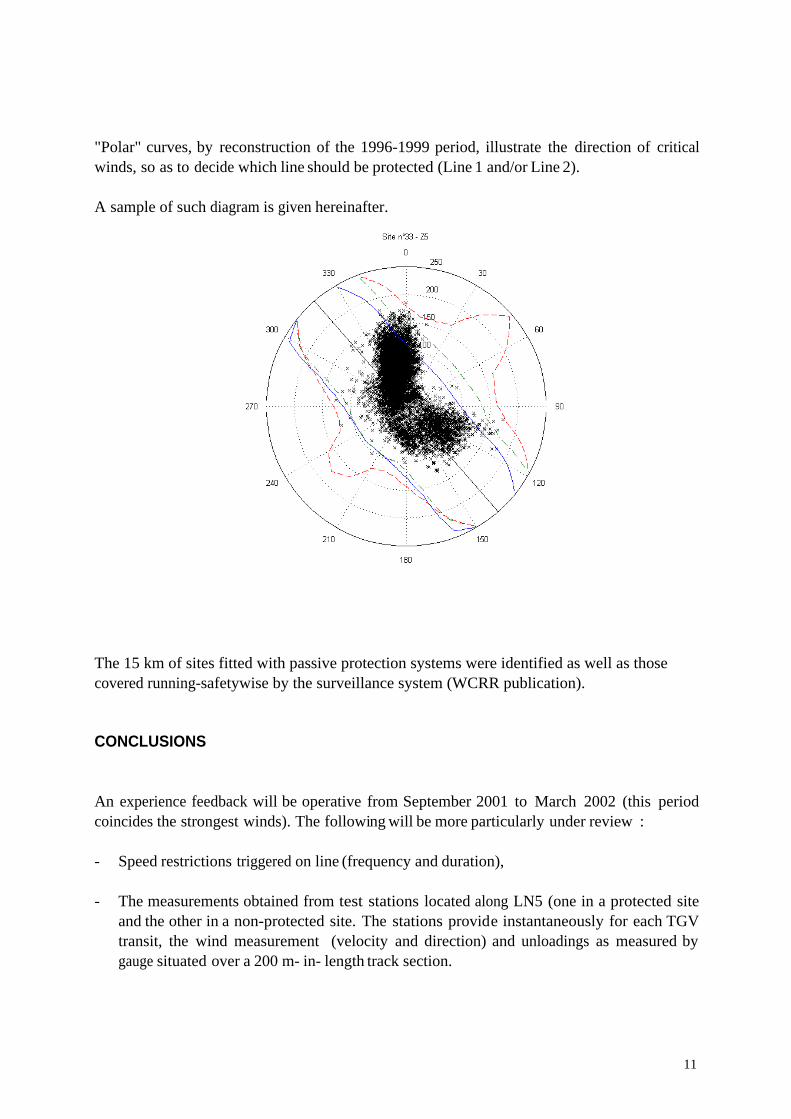
"Polar" curves, by reconstruction of the 1996-1999 period, illustrate the direction of criticalwinds, so as to decide which line should be protected (Line 1 and/or Line 2).
A sample of such diagram is given hereinafter.
The 15 km of sites fitted with passive protection systems were identified as well as thosecovered running-safetywise by the surveillance system (WCRR publication).
CONCLUSIONS
An experience feedback will be operative from September 2001 to March 2002 (this periodcoincides the strongest winds). The following will be more particularly under review :
- Speed restrictions triggered on line (frequency and duration), - The measurements obtained from test stations located along LN5 (one in a protected site
and the other in a non-protected site. The stations provide instantaneously for each TGVtransit, the wind measurement (velocity and direction) and unloadings as measured bygauge situated over a 200 m- in- length track section.

12
This feedback practice will enable to reinforce safety steps and to minimise effects over trainoperations.