Protecting Your Financial Future in Today’s Market · 2020. 5. 13. · White Paper: Protecting...
14
Protecting Your Financial Future in Today’s Market 8152 S. Cass Avenue Darien, Illinois 60561 630-963-2477 www.kbfinancialinc.com WHITE PAPER | APRIL 2020
Transcript of Protecting Your Financial Future in Today’s Market · 2020. 5. 13. · White Paper: Protecting...

Protecting
Your Financial Future
in Today’s Market
8152 S. Cass Avenue
Darien, Illinois 60561
630-963-2477
www.kbfinancialinc.com
WHITE PAPER | APRIL 2020

White Paper: Protecting Your Financial Future in Today’s Market
1 ©2020 Simplicity Group | 1165661-0420
Protecting
Your Financial Future
in Today’s Market
Today we are facing one of the most significant economic declines as a direct result of an
unprecedented global health crisis: COVID-19. Nothing has prepared our country for this pandemic
economically or health-wise, and no country is left immune. Why this crisis is so detrimental to the
global economy is that it is operating in an environment with a high degree of uncertainty. Contributing
drivers such as the shortage of COVID-19 testing and no viable vaccine continue to widen existing
health gaps and have forced the U.S. government to institute social distancing policies with the intent to
help control the spread of the virus and strain on the health system. Past actions and current
circumstances will continue to impact the demand for goods and services and drive even greater
pressure on the earnings of businesses both large and small. For or against these government actions,
which are centered around the country’s health of its citizens, is not the debate of this paper. The focus
of this paper is to educate on actionable steps to protecting one’s financial future in today’s uncertain
time.
In order to properly understand the different types of risk and how to potentially address them, the
following topics will be examined:
Key Topics
• Where We Were: The U.S. economy prior to the COVID-19 pandemic
• What Changed: How COVID-19 spread globally and the U.S. government’s response
• Where We Are Now: The current U.S. health guidelines and economic status
• How History Can Guide Us: Government spending’s impact and market recovery spans
• Key Takeaways: What information can be utilized to base future financial decisions
• Action Steps: What you can consider doing today to protect your financial future
White Paper: Protecting Your Financial Future in Today’s Market
2 ©2020 Simplicity Group | 1165661-0420
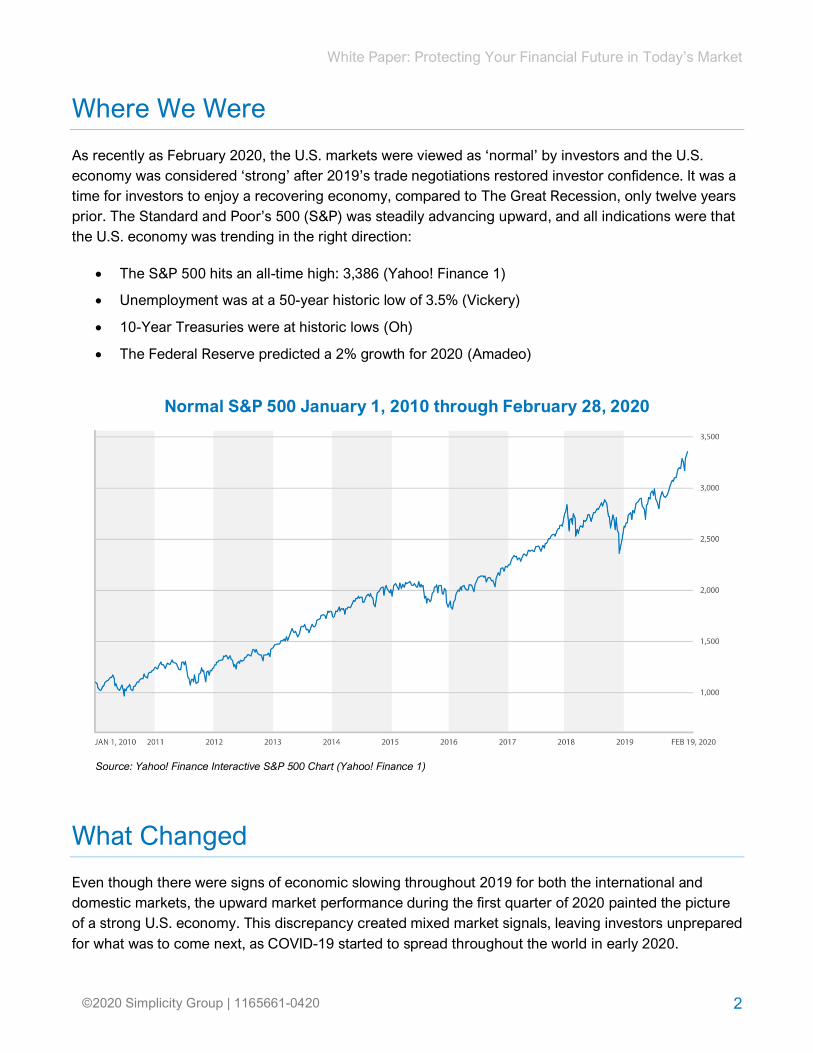
Where We Were
As recently as February 2020, the U.S. markets were viewed as ‘normal’ by investors and the U.S.
economy was considered ‘strong’ after 2019’s trade negotiations restored investor confidence. It was a
time for investors to enjoy a recovering economy, compared to The Great Recession, only twelve years
prior. The Standard and Poor’s 500 (S&P) was steadily advancing upward, and all indications were that
the U.S. economy was trending in the right direction:
• The S&P 500 hits an all-time high: 3,386 (Yahoo! Finance 1)
• Unemployment was at a 50-year historic low of 3.5% (Vickery)
• 10-Year Treasuries were at historic lows (Oh)
• The Federal Reserve predicted a 2% growth for 2020 (Amadeo)
Normal S&P 500 January 1, 2010 through February 28, 2020
Source: Yahoo! Finance Interactive S&P 500 Chart (Yahoo! Finance 1)
What Changed
Even though there were signs of economic slowing throughout 2019 for both the international and
domestic markets, the upward market performance during the first quarter of 2020 painted the picture
of a strong U.S. economy. This discrepancy created mixed market signals, leaving investors unprepared
for what was to come next, as COVID-19 started to spread throughout the world in early 2020.

White Paper: Protecting Your Financial Future in Today’s Market
3 ©2020 Simplicity Group | 1165661-0420
Governments in multiple countries started responding by issuing initiatives to protect the public’s
health. Travel restrictions between countries and regions implemented as emergency health measures
to combat COVID-19 proved that the virus was relentless. The world watched as lives were lost and
global economies started to tumble. It appeared that no country was prepared to combat the virus as
mass numbers of victims emerged, regardless of their health condition. As this virus spread, the young
and healthy were not immune, nor were the rich, famous, or otherwise.
Meanwhile, here in the United States, the S&P 500 peaked at 3,386 as the U.S. seemed unaware that
COVID-19 would also soon impact its shores. Unfortunately, less than 60 days later, the U.S. entered
the ‘Health Phase’ of response to COVID-19. Investors responded to COVID-19, and the S&P 500
suffered the fastest historical decline ever recorded, losing 34% of its value over two weeks (Yahoo!
Finance 1). The velocity of the decline required trading to be suspended on multiple occasions as a loss
prevention measure. Soon after, trading was no longer happening on trade floors or by electronic
trading.
COVID-19’s Timeline
• 12/31 China announced the first cases of COVID-19
• 1/11 China reported the first official death
• 1/21 Multiple countries, including the U.S. confirmed new cases of COVID-19
• 1/30 The World Health Organization (W.H.O) declared a global health emergency
• 2/2 First COVID-19 death outside of China
• 2/14 First COVID-19 death in Europe
• 2/19 S&P 500 closed at all-time high: 3,386
• 2/23 Deaths in Italy spiked to 132
• 2/29 First U.S. death from COVID-19
• 3/11 The W.H.O declared COVID-19 a global pandemic
Source: NBC News “Coronavirus timeline: Tracking the critical moments of COVID-19”
How the U.S. Government Responded
Part 1: Health
At the end of February 2020, The U.S. administration issued travel restrictions and warnings covering
countries in Europe and Asia. An $8.3 billion emergency health spending package to fight COVID-19
was approved, and two days later, new travel restrictions were announced for 26 additional countries.
In mid-March, President Trump declared a national state of emergency and extended travel bans to
Ireland and the United Kingdom, social distancing advisories were implemented in multiple states,
discretionary travel was halted, and 95% of Americans in 42 states found themselves under a COVID-19

White Paper: Protecting Your Financial Future in Today’s Market
4 ©2020 Simplicity Group | 1165661-0420
lockdown. All were measures to help curb the loss of American lives. Americans started working from
home, or not working at all, and the stock market tumbled as the reality of a collapsing economy began
to sink in (Muccari and Secon).
Part 2: Economic
On March 27th, 2020, the U.S. government responded to COVID-19 with The CARES Act (The
Coronavirus Aid, Relief, and Economic Security Act), a $2.3 trillion stimulus bill to help sustain the U.S.
economy. Topping the responsive spend was stimulus for businesses in the form of loans and grants,
expansion of unemployment benefits, one-time checks for all Americans, and disaster assistance for
state and local governments and healthcare initiatives (CFRB).
CARES Act Breakdown
Expand & Extend Unemployment Benefits $260 billion
Issue One-Time Checks $290 billion
Provide Small Business Loans & Grants $377 billion
Support Loans & Guarantees for Businesses & Governments $510 billion
Support State and Local Governments $150 billion
Increase Health-Related Spending >$180 billion
Support the Safety Net $42 billion
Increase Disaster Assistance $45 billion
Increase Education Spending > $32 billion
Support Transportation Providers & Industries $72 billion
Reduce Individual Taxes ~$20 billion
Cut Business Taxes ~$280 billion
Other Spending >$25 billion
TOTAL ~$2.3 trillion Source: Committee for Responsible Budget (CFRB)
The government actions related to passing the CARES Act were the catalysis for the S&P 500 to
respond positively, tracing back up 21% in just three days. However, these historical moves only left
investors with additional uncertainty, as the marked reacted in unexpected ways. Historically, rising
unemployment has caused the markets to drop in value. Yet, that did not occur; instead, it left investors
speculating and wondering if this change represented the new “normal” (Yahoo! Finance 1).
Volatile markets then reacted in unexpected ways:
• March 26th, 2020 - 3.3 million new applications for unemployment, the S&P 500 rallies 6.24%
(Long and Fitzgerald)
• April 14th, 2020 - Unemployment reaches 17 million, the S&P 500 rallies 3.06%
(Zarroli and DeCambre)

White Paper: Protecting Your Financial Future in Today’s Market
5 ©2020 Simplicity Group | 1165661-0420
S&P 500 January 1, 2020 – April 7, 2020
Source: Yahoo! Finance Interactive S&P 500 Chart (Yahoo! Finance 1)
Where Do the Markets Go from Here?
The unknown future impact of the coronavirus, coupled with market confusion, leads to many differing
opinions on how the markets might recover:
U RECOVERY
“I don’t think it’s going to be rapid. We’ll probably have to restart activity fairly
gradually and there may be subsequent periods of slower activity again.”
Ben Bernanke, Former Federal Reserve Chairman
April 7, 2020 (Miller)
V RECOVERY
“I think a ‘V’ is possible, but I am worried that the outcome will be worse, and it really
depends to my mind on just how much damage is done during the time the economy is
shut down in the way it is now.”
Janet Yellen, Federal Reserve Chairman
April 6, 2020 (Cox)
W RECOVERY
“How long and how deep it's going to be, we really don't know. And this one is unique
in that ... its root cause is a pandemic, and because it is the actual economy itself
pulling down the financial markets.”
Paul Kaplan, Morningstar Research Director
April 21, 2020 (McCormick)
COVID-19 Phase (1/1 – 2/19)
S&P peaks at 3,386
Health Phase (2/20-3/26)
S&P loses 34% of its value over two weeks
Stimulus Phase (2/24-4/15)
S&P gains 21% in 3 days

White Paper: Protecting Your Financial Future in Today’s Market
6 ©2020 Simplicity Group | 1165661-0420
How History Can Guide Us
Market Recovery Spans Vary
Investors need to be aware that true market recovery occurs when prices fully return to the peaks they
had reached, prior to the decline in market value. Investors can often be confused by headlines
declaring that a market is out of being in a “bear market.”
The following are important technical terms to understand:
• “Bear markets”: Defined by a decline of 20% or more. (Fidelity)
• “Bull markets”: Defined by an increase of 20% or more. (Fidelity)
The chart below illustrates different historical stock market events that moved into an official bear
market, but more importantly, the data communicates the time difference between a market coming out
of a bear market “technically,” verses the market recovering to a full “price” recovery. This is a major
takeaway for all investors, as not all crises are the same and recovery times are complex. Investors
should plan accordingly by looking towards a longer time frame for “full price” recovery.
Years to Recover to Previous All-Time High
Source: FT Portfolios “History of U.S. Bear & Bull Markets”
Future Earnings Influence Price Recovery
The U.S. economy is driven by consumer consumption and with 95% of Americans ordered to stay-at-
home as early as April, it has quickly crushed the majority of both large and small business across the

White Paper: Protecting Your Financial Future in Today’s Market
7 ©2020 Simplicity Group | 1165661-0420
country (Secon). Historically, when certain sectors are impacted negatively, it has reflected in share
prices, while other uncorrelated sectors have performed strongly. COVID-19 has impacted every
sector, which has never been witnessed on a similar scale before.
Government Action Comes with a Price
Another consideration for investors is the long-term impact of government actions relating to economic
support during falling markets like COVID-19. What history can teach us is that these types of actions
come with a price, usually in the form of higher taxes. The reality is that taxpayers will more than likely
carry the burden of paying off the level of debt that the government has created.
They are several points to consider when examining government spending, tax rates and national debt:
• World War II: After the Great Depression, the U.S. officially entered the war and the national debt
quickly rose, but the Debt/Gross Domestic Product (GDP) ratio climbed to 119% in 1946. During
this time the government raised taxes in the highest tax bracket level to 94%.
• Tax rates are raised by the government above 70% for over 40 years (1940-1981).
• The 2020 U.S. debt reaches 24.2 trillion and the Debt/GDP ratio is estimated to be 106%.
Income Tax versus National Debt: 1929 through Q1 2020
Source: Investopedia “A Brief History of Taxes in the U.S.” (Fontinelle) and The Balance “U.S. National Debt by Year
Compared to GDP and Major Events” (Amadeo)
Fundamentally, when you begin to raise taxes you are taking away purchasing power from the
consumer, which is the driving force behind the U.S. economy. The typical response to raising taxes is
a drag on the U.S. GDP, with a possible result of a shrinking economy.

White Paper: Protecting Your Financial Future in Today’s Market
8 ©2020 Simplicity Group | 1165661-0420
For example, during the Great Depression and into WWII, the U.S. experienced historical debt and tax
levels, at a time when tax rates were held by the government above 40% for over 40 years. Some
additional outcomes from this period included higher-interest rates, higher prices, and a broader
displacement of class between the rich and poor (Fontinelle).
Using history as a benchmark and comparing to where we currently stand, the U.S. now carries close to
$24.2 trillion in debt with a 106% Debt/GDP ratio (PGPF). Our Debt/GDP ratio indicates that the U.S.
owes more than it produces or exports and consumes domestically. Because an economy can only
truly recover by producing and selling more than it spends, COVID-19’s social and economic impact
implies uncertainty for the U.S. based on its ‘upside-down economy.’ As investors plan for the future,
the probability of high taxes seems almost a certainty.
Can Need for Tax Revenue be Offset by GDP?
When examining this question under the current economic
conditions, it places more pressure on the potential need
for the government to look at different areas in which they
can tax to increase overall revenue.
The following are the four main sources of federal tax
revenue, with their associated percentages.
1. Personal: 51%
2. Payroll: 35%
3. Corporate: 6%
4. Other 8%
So how does GDP play a role around a potential increase in
future taxes? At the beginning of 2020, the Federal Reserve
projected a growth rate of 2.0% for the overall U.S. economy.
This growth rate would have continued to support the
forecasted revenue for the government, until the COVID-19
crisis, which has significantly altered 2020 GDP projections. It is
now projected that all major economies will experience a
decrease in GDP, with the U.S. suffering close to a -5% decline.
This type of pressure coming from a lack of overall output,
combined with so many unemployed Americans, will likely force
the U.S. and other countries to look at raising taxes to maintain
government operations (The Economist.)

White Paper: Protecting Your Financial Future in Today’s Market
9 ©2020 Simplicity Group | 1165661-0420
Will Reduced Economic Activity Impact Markets?
If the projected GDP forecasts are accurate and the job market stays in its current status, this will be
reflected in the ability of many companies to post projected earnings that will inevitably impact the PE
ratio that is used to help establish the stock price of publicly traded companies.
The graph below illustrates that at current trading levels, the market price represents the same
multiples recorded at the peak of the market on February 19th, that being a multiple of 19x. There are
many economists and trading professionals who believe this number is not representative of what is
acutally taking place, and that the multiple should be should be closer to 16.8. Additionally, they note
the potential for this number to move lower in the months to come.
As the earning seasons continue to roll out, it will be important for investors to understand what this
could mean to the future value of different investments that they have in the market.
S&P 500 NTM P/E
Key Takeaways
What We Know
Unknowns include not knowing when social distancing guidelines will be lifted, when domestic and
international travel can resume, how the market’s price valuations will recover, future unemployment

White Paper: Protecting Your Financial Future in Today’s Market
10 ©2020 Simplicity Group | 1165661-0420
rates, and how much our economy can recover? No one is sure what type of recovery to expect or
when it will happen. What investors do know to be certain:
• Solutions to the Coronavirus are still unknown.
• The COVID-19 market recovery time span is unknown.
• There is a cost to rescue economies.
What We Can Control
Investors can and do have control over an important element in the equation, which is their own
emotions and how they respond to market crises such as COVID-19. So, the question comes down to
how best to execute at a time when it can be emotionally difficult to stay committed to a long-term plan.
One of the easiest ways an investor can create an environment for staying emotionally strong is by
establishing a solid foundation inside their portfolio. This can be accomplished by allocating the proper
percentage of investable assets to investment vehicles that have certain features and benefits that
address the critical types of risk:
Features and Benefits of Principal Products
Risks to Retirement Income Principal Protected Products Solution
Market Risk Loss of principal value can decrease
investment capital.
Principal protection provides a buffer
against stock market fluctuations.
Inflation Risk
Investments not optimally positioned to
address the rising costs of goods and
services will deplete a portfolio.
Allocating to “safe money” products allow
asset allocation strategies to address
inflation.
Taxes Risk
Increased taxes erode the investment
capital; the investment type and timing are
critical.
Leveraging tax-free investment strategies
increases investment capital.
Longevity Risk
Investment capital isn’t enough to
supporting longer lives and long-term care
needs.
Utilizing “income for life” features address
longevity risks and long-term care risks.
Survivorship
Risk
Unexpected loss of a life-partner can lead to
lower investment capital.
“Death Benefits” provide a tax-advantaged
mitigant against untimely death.
Action Steps

White Paper: Protecting Your Financial Future in Today’s Market
11 ©2020 Simplicity Group | 1165661-0420
So, how do you go about protecting your financial future and establishing a plan that properly
addresses the different risks to your retirement income in any type market condition?
As complicated as it might seem, especially during times of crisis like COVID-19, establishing this type
of plan requires a complete and intelligent conversation around defining the appropriate portfolio
allocation. To do so, investors should consider their own risk tolerance and timeline to retirement.
Investors can further determine the proper allocation in their retirement portfolio by answering the
following questions:
• How much risk can I afford to take?
• How much risk am I willing to take?
• When do I start taking money?
• How do I create a tax-efficient retirement plan?
• How do I address longevity risk inside my portfolio?
• How do I protect my retirement income from long-term
care needs?
COVID-19 will impact our economy and markets over the coming
months and years. For this reason, it is critical that investors
consider their retirement portfolio’s allocation and prepare to
protect their financial future during today’s volatile market
environment. This will prepare their portfolio for future possible
COVID-19 scenarios. If you are nearing or in retirement, it is important to consider acting now.
If you would like to learn more about your retirement portfolio’s allocations,
please schedule a complimentary, no-obligation Strategy Session with:
“The best way to
measure your investing
success is not by whether
you’re beating the
market, but by whether
you’ve put in place a
financial plan and a
behavioral discipline that
are likely to get you
where you want to go.”
- Benjamin Graham
Author of The Intelligent Investor
Chris Cooper, Agent Representative K&B Financial, Inc.
O: 630-963-2202
C:815-354-1196
8152 S. Cass Avenue,
Darien, Illinois 60561
www.kbfinancialinc.com

White Paper: Protecting Your Financial Future in Today’s Market
12 ©2020 Simplicity Group | 1165661-0420
Works Cited
Amadeo, Kimberly. “U.S. economic outlook for 2020 and beyond.” The Balance. www.thebalance.com/us-economic-
outlook-3305669
Amadeo 2, Kimberly. “U.S. national debt by year compared to GDP and major events.” The Balance.
https://www.thebalance.com/national-debt-by-year-compared-to-gdp-and-major-events-3306287
Cox, Jeff. “Why the chances for a ‘V’-shaped economic recovery are getting less likely by the day.” CNBC.
www.cnbc.com/2020/04/06/coronavirus-update-a-v-shaped-economic-recovery-getting-less-likely.html
CRFB. COVID Money Tracker, “What’s in the $2 trillion Coronavirus Relief Package?” Committee for a Responsible
Federal Budget. http://www.crfb.org/blogs/whats-2-trillion-coronavirus-relief-package
DeCambre, Mark. “The S&P 500 just posted the most daily swings of 3% or greater in more than a
decade - even as the stock market hits a 5-week high.” MarketWatch. www.marketwatch.com/story/the-sp-500-just-
posted-the-most-daily-swings-of-3-or-greater-in-more-than-a-decadeeven-as-the-stock-market-hits-a-5-week-high-
2020-04-14
Fidelity. “Bear market basics.” Fidelity. www.fidelity.com/viewpoints/market-and-economic-insights/bear-markets-the-
business-cycle-explained
Fitzgerald, Maggie. Imbert, Fred. Pound, Jesse. “Stock Market live Thursday: Dow rallies 1,300, jobless
claims top 3 million, stimulus bill to House.” CNBC. www.cnbc.com/2020/03/26/stock-market-today-live.html
Fontinelle, Amy. “A brief history of taxes in the U.S.” Investopedia. www.investopedia.com/articles/tax/10/history-
taxes.asp
FT Portfolios. “History of U.S. bear & bull markets.” FT Portfolios
www.ftportfolios.com/Common/ContentFileLoader.aspx?ContentGUID=4ecfa978-d0bb-4924-92c8-628ff9bfe12d
Long, Heather. Fowers, Alyssa. “A record 3.3 million Americans filed for unemployment benefits as the
coronavirus slams economy.” The Washington Post. www.washingtonpost.com/business/2020/03/26/unemployment-
claims-coronavirus-3-million/
McCormick, Emily. “What we can learn from the 17 stock market crashes since 1870.” Yahoo! Finance.
finance.yahoo.com/news/what-we-can-learn-from-the-17-stock-market-crashes-since-1870-142848079.html
Miller, Rich. “Bernanke doesn’t see V-shaped U.S. recovery after steep fall.” Bloomberg.
www.bloomberg.com/news/articles/2020-04-07/bernanke-doesn-t-see-v-shaped-u-s-recovery-after-steep-fall
Muccari, Robin. Chow, Denise. “Coronavirus timeline: Tracking the critical moments of COVID-19.” NBC
News www.nbcnews.com/health/health-news/coronavirus-timeline-tracking-critical-moments-covid-19-n1154341
Oh, Sunny. “10-year treasury yield sets record low below 1% after Fed rate cut.” MarketWatch.
www.marketwatch.com/story/treasury-yields-pare-rise-as-stocks-point-lower-on-lack-of- pledged-action-from-g-7-
2020-03-03
PGPF. “The national debt is now more than $24 trillion. What does that mean?” Peter G. Peterson
Foundation. www.pgpf.org/infographic/the-national-debt-is-now-more-than-24-trillion-what-does-that-mean
Secon, Holly. Woodward, Aylin. “About 95% of Americans have been ordered to stay at home.” Business Insider
https://www.businessinsider.com/us-map-stay-at-home-orders-lockdowns-2020-3
The Economist. “Business This Week.” The Economist. www.economist.com/the-world-this-
week/2020/04/16/business-this-week
Vickery, Mark. “Unemployment rate 3.5%, lowest in half-century.” Yahoo! Finance.
finance.yahoo.com/news/unemployment-rate-3-5-lowest-140702520.html

White Paper: Protecting Your Financial Future in Today’s Market
13 ©2020 Simplicity Group | 1165661-0420
Yahoo! Finance 1. S&P 500, “Interactive stock chart January 2-February 18, 2020.” Yahoo! Finance
finance.yahoo.com/chart/%5EGSPC.
Yahoo! Finance 2. S&P 500, “S&P Real Time February 19, 2020.” Yahoo! Finance
finance.yahoo.com/quote/%5EGSPC/
Zarroli, Jim. Schneider, Avie, “Jobs carnage mounts: 17 million file for unemployment in 3 weeks.” NPR
www.npr.org/sections/coronavirus-live-updates/2020/04/09/830216099/6-6-million-more-file-for-unemployment-as-
coronavirus-keeps-economy-shut
The source(s) used to prepare this material is/are believed to be true, accurate and reliable, but is/are not
guaranteed. Investment advisors and financial planning services offered through Simplicity Wealth, a SEC
Registered Investment Advisors. Insurance and Consulting Services offered through K & B Financial, Inc., is a
separate and unaffiliated entity from Simplicity Wealth and Advisory Alpha LLC. Simplicity Group is an independent
marketing organization and is not a FINRA registered broker dealer or a SEC registered investment advisor.
Simplicity Group and Advisory Alpha LLC share ownership of Simplicity Wealth.


![0360-0420, Sulpicius Severus, Chronicorum [Schaff], En](https://static.fdocuments.in/doc/165x107/577ce04a1a28ab9e78b30107/0360-0420-sulpicius-severus-chronicorum-schaff-en.jpg)