Prospects for the world economy in 2017–2018 · 2017-01-17 · Prospects for the world economy in...
44
Chapter I Global economic outlook Prospects for the world economy in 2017–2018 Global growth prospects e global economy remains trapped in a prolonged period of slow economic growth and dwindling international trade growth. Since 2012, world gross product (WGP) has expand- ed at an average annual rate of 2.5 per cent, much lower than the average of 3.4 per cent ob- served in the decade prior to the financial crisis (figure I.1). In 2016, growth in both WGP and world trade dropped to their slowest pace since the Great Recession of 2009. WGP is estimated to have expanded by just 2.2 per cent, reflecting a downward revision of 0.7 per- centage points relative to forecasts a year ago (table I.1). e weaker-than-expected growth performances in Japan, the United States of America and in several countries in Africa, the Commonwealth of Independent States (CIS) and Latin America and the Caribbean have contributed to this downward revision relative to forecasts presented in the World Economic Situation and Prospects ( WESP) 2016 (United Nations, 2016a). e prolonged sluggishness in the global economy has been characterized by a wide- spread slowdown of productivity growth in many parts of the world, weak investment, low wage growth, low inflation and rising debt levels. Low commodity prices have exacerbated these trends in many commodity-exporting countries since mid-2014, while conflict and geopolitical tensions continue to weigh on economic prospects in several regions. 1 While some of the exceptional factors that restrained global growth in 2016 — such as the destocking cycle in the United States and adjustment to the sharp terms-of-trade shock faced by commodity-exporters — can be expected to ease, the longer-term pressures restraining the global economy continue to prevent more robust growth. WGP is forecast to expand by 2.7 per cent in 2017 and 2.9 per cent in 2018, with this modest recovery more a reflection of stabilization in the aftermath of negative short-term shocks than a signal of a dynamic revival of global demand. In per capita terms, this equates to average global growth of just 1.5 per cent per annum in 2016-2018, compared to an average of 2.1 per cent in 1998-2007 (figure I.2). e relatively slow pace of economic growth will hamper progress towards achieving the Sustainable Development Goals (SDGs), as defined in the 2030 Agenda for Sustainable Development, which was adopted by the Member States of the United Nations in 2015. If downside risks to the outlook were to materialize, this could push global growth rates down even further, with additional setbacks towards achieving the SDGs, particularly the goals of eradicating extreme poverty and creating decent work for all. 1 According to the Global Conflict Tracker, conflict in 28 countries was either worsening or unchanged in 2016. In addition to the devastating humanitarian crises, conflict zones and neighbouring regions have suffered heavy economic losses. In 2016, growth in both world gross product and world trade dropped to their slowest pace since the Great Recession of 2009 Sluggish economic growth poses a challenge for the Sustainable Development Goals
Transcript of Prospects for the world economy in 2017–2018 · 2017-01-17 · Prospects for the world economy in...

Chapter I
Global economic outlook
Prospects for the world economy in 2017–2018Global growth prospects
The global economy remains trapped in a prolonged period of slow economic growth and dwindling international trade growth. Since 2012, world gross product (WGP) has expand-ed at an average annual rate of 2.5 per cent, much lower than the average of 3.4 per cent ob-served in the decade prior to the financial crisis (figure I.1). In 2016, growth in both WGP and world trade dropped to their slowest pace since the Great Recession of 2009. WGP is estimated to have expanded by just 2.2 per cent, reflecting a downward revision of 0.7 per-centage points relative to forecasts a year ago (table I.1). The weaker-than-expected growth performances in Japan, the United States of America and in several countries in Africa, the Commonwealth of Independent States (CIS) and Latin America and the Caribbean have contributed to this downward revision relative to forecasts presented in the World Economic Situation and Prospects (WESP) 2016 (United Nations, 2016a).
The prolonged sluggishness in the global economy has been characterized by a wide-spread slowdown of productivity growth in many parts of the world, weak investment, low wage growth, low inflation and rising debt levels. Low commodity prices have exacerbated these trends in many commodity-exporting countries since mid-2014, while conflict and geopolitical tensions continue to weigh on economic prospects in several regions.1
While some of the exceptional factors that restrained global growth in 2016 — such as the destocking cycle in the United States and adjustment to the sharp terms-of-trade shock faced by commodity-exporters — can be expected to ease, the longer-term pressures restraining the global economy continue to prevent more robust growth. WGP is forecast to expand by 2.7 per cent in 2017 and 2.9 per cent in 2018, with this modest reco very more a reflection of stabilization in the aftermath of negative short-term shocks than a signal of a dynamic revival of global demand. In per capita terms, this equates to average global growth of just 1.5 per cent per annum in 2016-2018, compared to an average of 2.1 per cent in 1998-2007 (figure I.2). The relatively slow pace of economic growth will hamper progress towards achieving the Sustainable Development Goals (SDGs), as defined in the 2030 Agenda for Sustainable Development, which was adopted by the Member States of the United Nations in 2015. If downside risks to the outlook were to materialize, this could push global growth rates down even further, with additional setbacks towards achieving the SDGs, particularly the goals of eradicating extreme poverty and creating decent work for all.
1 According to the Global Conflict Tracker, conflict in 28 countries was either worsening or unchanged in 2016. In addition to the devastating humanitarian crises, conflict zones and neighbouring regions have suffered heavy economic losses.
In 2016, growth in both world gross product and world trade dropped to their slowest pace since the Great Recession of 2009
Sluggish economic growth poses a challenge for the Sustainable Development Goals

2 World Economic Situation and Prospects 2017
The factors underlying the protracted economic slowdown have a tendency to rein-force one another, through the close linkages between demand, investment, trade and productivity. Firms are unlikely to invest in new projects and expand production when demand is weak or expected profits are low. This reluctance has been particularly acute in extractive industries since 2015, as adjustment to the lower level of commodity prices has intensified the weakness in aggregate demand.
Economic and political uncertainties have also weighed on investment demand in many countries, while the nexus between profits and investment has weakened in both developed and developing countries (UNCTAD, 2016a). The declining demand for capi-tal goods associated with weak investment restrains global trade, which in turn curtails
Factors underpinning sluggish economic
growth are self-reinforcing, prolonging
the slowdown
Figure I.1Revision of world gross product forecast since WESP 2016
Source: UN/DESA, based on United Nations Statistics
Division National Accounts Main Aggregates Database and
UN/DESA forecasts.
Average 1998-2007
WESP 2016
WESP 20171.9
-1.8
4.3
3.1
2.5 2.32.6 2.5
2.22.7 2.9
-3
-2
-1
0
1
2
3
4
5
2008 2009 2010 2011 2012 2013 2014 2015 2016 2017 2018
Percentage
Figure I.2Gross domestic product per capita growth by region
Source: UN/DESA, based on United Nations Statistics
Division National Accounts Main Aggregates Database, United
Nations Population Division World Population Prospects and
UN/DESA forecasts. * Includes estimates for 2016 and
forecasts for 2017-2018
Percentage
-2
0
2
4
6
8
World Developedeconomies
Economiesin
transition
Africa East Asia SouthAsia
WesternAsia
LatinAmericaand the
Caribbean
Leastdevelopedcountries
Average 1998–2007Average 2011–2015Average 2016–2018*

3Chapter I. Global economic outlook
Table I.1Growth of world output, 2014–2018
Change from WESP 2016
Annual percentage change 2014 2015 2016a 2017b 2018b 2016 2017
World 2.6 2.5 2.2 2.7 2.9 -0.7 -0.5
Developed economies 1.7 2.1 1.5 1.7 1.8 -0.7 -0.6
United States of America 2.4 2.6 1.5 1.9 2.0 -1.1 -0.9
Japan -0.1 0.6 0.5 0.9 0.9 -0.8 0.3
European Union 1.5 2.2 1.8 1.8 1.8 -0.2 -0.4
EU-15 1.4 2.0 1.7 1.6 1.7 -0.3 -0.5
EU-13 2.8 3.6 3.0 3.2 3.3 0.0 0.0
Euro area 1.1 1.9 1.6 1.7 1.7 -0.3 -0.3
Other developed countries 2.5 1.6 1.7 2.0 2.2 -0.4 -0.5
Economies in transition 0.9 -2.8 -0.2 1.4 2.0 -1.0 -0.5
South-Eastern Europe 0.2 2.0 2.6 3.1 3.3 0.0 0.1
Commonwealth of Independent States and Georgia 1.0 -3.0 -0.3 1.4 2.0 -1.0 -0.4
Russian Federation 0.7 -3.7 -0.8 1.0 1.5 -0.8 -0.2
Developing economies 4.3 3.8 3.6 4.4 4.7 -0.7 -0.4
Africa 3.8 3.1 1.7 3.2 3.8 -2.7 -1.2
North Africa 1.8 3.2 2.6 3.5 3.6 -1.5 -0.6
East Africa 7.0 6.6 5.5 6.0 6.3 -1.3 -0.6
Central Africa 5.4 1.5 2.4 3.4 4.2 -1.9 -0.8
West Africa 6.1 3.2 0.1 3.1 4.1 -5.1 -2.2
Southern Africa 2.7 1.9 1.0 1.8 2.6 -2.0 -1.5
East and South Asia 6.1 5.7 5.7 5.9 5.9 -0.1 0.1
East Asia 6.1 5.7 5.5 5.6 5.6 -0.1 0.0
China 7.3 6.9 6.6 6.5 6.5 0.2 0.0
South Asia 6.2 6.0 6.7 6.9 6.9 0.0 -0.1
Indiac 7.3 7.3 7.6 7.7 7.6 0.2 0.2
Western Asia 2.6 2.7 2.1 2.5 3.0 -0.3 -0.5
Latin America and the Caribbean 0.7 -0.6 -1.0 1.3 2.1 -1.7 -1.4
South America 0.1 -1.9 -2.3 0.9 2.0 -2.2 -1.5
Brazil 0.1 -3.9 -3.2 0.6 1.6 -2.4 -1.7
Mexico and Central America 2.5 2.7 2.3 2.3 2.2 -0.6 -1.1
Caribbean 3.1 4.0 2.7 2.7 2.8 -0.9 -0.6
Least developed countries 5.7 3.7 4.5 5.2 5.5 -1.1 -0.4
Memorandum items
World traded 3.8 2.6 1.2 2.7 3.3 -2.8 -2.0
World output growth with PPP weightse 3.3 3.1 2.9 3.5 3.7 -0.7 -0.4
Source: UN/DESA. a Estimated. b Forecast, based in part on Project LINK. c Fiscal year basis. d Includes goods and services. e Based on 2012 benchmark.

4 World Economic Situation and Prospects 2017
investment further. Meanwhile, the extended period of weak investment is a driving factor behind the more medium-term phenomenon of a slowdown in productivity growth. Weak-er productivity growth may be compounded by the broad slowdown in global trade growth, as international trade, supported by a universal, rules-based, open, non-discriminatory and equitable multilateral trading system, has the potential to speed the rate of technological diffusion between countries and improve the efficiency of resource allocation. Weak pro-ductivity growth has also curbed wages and progress in poverty reduction, aggravating the slowdown in aggregate demand. In the absence of concerted policy efforts to revive pro-ductive investment and foster a recovery in productivity, there is a risk that the protracted episode of weak global growth may linger for several more years.
Stable private consumption will remain the mainstay of growth in the developed economies (figure I.3). The slight increase in gross domestic product (GDP) growth that is forecast for 2017 is driven primarily by the end of the destocking cycle in the United States and additional policy support in Japan, including an expansion of government investment spending. Uncertainty related to the withdrawal of the United Kingdom of Great Britain and Northern Ireland from the European Union (EU) has led to downward revisions to growth forecasts for the United Kingdom and several other countries in Europe in 2017. Meanwhile, the lack of clarity about the future direction of policy in the United States, with potentially far-reaching spillover effects on both domestic and global economic pros-pects, has increased the margin of uncertainty around global baseline forecasts.
GDP growth in developing countries, especially in East and South Asia, is expected to remain driven by domestic consumption. China’s expansion is expected to remain stable, supported by the strong policy stance, but the rebalancing of the economy continues to weigh on global trade flows. India is expected to remain the fastest growing large devel-oping economy, as the country benefits from strong private consumption and the gradual introduction of significant domestic reforms. The downturn in Brazil may have turned a corner, following the sharp decline in output in 2015 and 2016. Political uncertainty in Brazil has declined and the foundations of a programme for macro-management have been introduced. However, high unemployment and a relatively tight fiscal policy stance will
Policy uncertainty in the United States and
Europe has widened the confidence bounds
around global economic forecasts
The economic downturn in Brazil may have turned
a corner
Figure I.3Projected contributions to GDP growth, 2016–2018
Source: UN/DESA forecasts.
Percentage point
-4
-2
0
2
4
6
2016 2017 2018 2016 2017 2018 2016 2017 2018
Developed economies Developing economies Economies in transition
Private consumptionInvestmentGovernment consumption
Net exportsGDP

5Chapter I. Global economic outlook
continue to weigh on the economy. Meanwhile, growth in the least developed countries (LDCs) is expected to rise modestly from an estimated 4.5 per cent in 2016 to 5.2 per cent and 5.5 per cent in 2017 and 2018, respectively (box I.1).
Box I.1Prospects for the least developed countries
Aggregate growth in the LDCs will remain well below the Sustainable Development Goal (SDG) target of “at least 7 per cent GDP growth” in the near term, but is expected to rise modestly from an estimated 4.5 per cent in 2016 to 5.2 per cent and 5.5 per cent in 2017 and 2018, respectively, with the rise in per capita GDP averaging just 2.6 per cent between 2016 and 2018. The below-target growth poses a risk to critical public expenditure on healthcare, education, social protection and climate change, which may in turn constrain improvements in living standards and limit progress on poverty reduction.
Among the LDCs, growth performance varies significantly. Fuel and metal exporters have been ad-versely affected by persistently low global commodity prices, and the loss of commodity-related revenue has induced significant deterioration in the fiscal balance of countries such as Angola, the Democratic Re-public of the Congo, Equatorial Guinea, Mozambique and Zambia. Rising inflationary pressures, fueled in part by weaker domestic currencies, have also weighed on private consumption and business investment in these economies. For Angola, where oil accounts for almost 95 per cent of its total exports, growth decelerated to 0.8 per cent in 2016 and is expected to only improve modestly to 1.8 per cent in 2017.
Growth in many LDCs also remains highly vulnerable to natural catastrophes and weather-relat-ed shocks. In 2016, LDCs in the East and Southern African regions, including Ethiopia, Lesotho, Malawi and Uganda, experienced the worst drought in decades, dampening agriculture production and overall growth. A prolonged and severe drought also hit agriculture output in Haiti, where the economy also remains constrained by political uncertainty and institutional weaknesses. Meanwhile, the Nepalese economy is still recovering from the aftermath of the devastating earthquake of 2015. Amid ongoing reconstruction efforts, growth in Nepal strengthened in the second half of 2016 and is forecast to exceed 4.0 per cent in 2018.
A few LDCs are expected to achieve a growth rate close to or above the 7 per cent target in 2017-2018, including Bangladesh, Bhutan, Cambodia, Djibouti, Ethiopia, Lao People’s Democratic Republic, Myanmar, Rwanda and the United Republic of Tanzania. Myanmar is set to be the fastest growing LDC, with a projected expansion of 8.0 per cent in 2017, supported by accommodative monetary and fiscal policies, as well as the implementation of growth enhancing reforms. Growth in Bangladesh is likely to remain robust at 6.8 per cent in 2017 and 6.6 per cent in 2018, driven by buoyant domestic demand and a more proactive fiscal stance. As the impact of drought dissipates, growth in Ethiopia is expected to rebound to above 7.0 per cent in 2017 and 2018, supported by investment to improve power supply, and the recent completion of a cross-border railway connecting Ethiopia and Djibouti, where growth is forecast to average 6.8 per cent in 2017-2018. Strong infrastructure investment, particularly in the energy and transport sectors, is also supporting growth in Cambodia, the Lao People’s Democratic Republic, Rwanda and the United Republic of Tanzania.
For many LDCs, weak productivity growth, amid poorly diversified economic structures and insuf-ficient levels of investment, remains a challenge to achieving stronger medium-term growth prospects. If the current pattern continues, related shortfalls in essential investment also put at risk many other economic, social and environmental targets set in the SDGs.
Figure I.1.1 decomposes the medium-term projections for GDP growth in a selection of LDCs into the expected average annual contributions from labour input growth and labour productivity growth over the period 2015-2030.
Productivity growth in most countries is expected to fall well short of what is needed to achieve the targeted level of GDP growth in the LDCs. Tackling the shortfall in productivity growth will require an increase in the rate of investment in order to upgrade the existing capital stock and increase the available capital per worker in the economy.a A model simulation exercise to assess the magnitude of additional investment needed to close the productivity gaps, and approach an average GDP growth rate of 7 per cent per annum in the LDCs, suggests that investment growth in the LDCs as a whole would need to average 11.3 per cent per annum through 2030, an increase of roughly 3 percentage points relative to
a See discussion in United Nations (2016b).
(continued)

6 World Economic Situation and Prospects 2017
baseline projections. While this exceeds the average rate of investment growth of 8.9 per cent recorded between 2010 and 2015, it is in line with the investment rate recorded during the period of rapid growth of 2000-2005, when GDP growth in the LDCs as a whole averaged 6.8 per cent per annum. However, the external environment is expected to be much less supportive to growth in the LDCs than it was in 2000-2005, when export growth for the group averaged 6.5 per cent per annum.
Figure I.1.1 Decomposition of average annual GDP growth projections, 2015–2030
Figure I.1.2 illustrates the expected rate of convergence in GDP per capita between the LDCs and the developed economies under two different scenarios. The baseline scenario represents prospects ac-cording to the current forecast, which sees GDP growth in the LDCs averaging 5.2 per cent per annum to 2030. At this rate of growth, GDP per capita can only be expected to converge marginally towards aver-age levels in the developed economies, rising from just 2 per cent of the developed economy average in 2015 to just under 2.5 per cent in 2030.
If, on the other hand, the shortfalls in productivity growth could be closed through an accelera-tion in investment, there would be a more rapid pace of convergence. This would allow GDP per capita in the LDC to rise from 2 per cent of the developed country average in 2015 to 3 per cent by 2030.
Source: UN/DESA forecasts. Note: See Table J in the
Statistical Annex for definitions of country codes.
-1 0 1 2 3 4 5 6 7 8
LAOETH
MMRTZASEN
UGABFABDI
TCDAFGTLS
NERBENSLESTP
RWACODKHMMOZ
MLITGO
GMBCAF
MRTGNBSOM
LBRERI
ZMBBTNAGO
DJIBGDGIN
COMMWIVUT
MDGSLB
SDNLSONPLKIR
YEMHTI
GNQ
Percentage point
Contribution of labour inputContribution of productivity
(continued)
Box I.1 (continued)

7Chapter I. Global economic outlook
The economies in transition suffered a sharp collapse in domestic demand in the CIS region in 2016, while net trade made a positive contribution to GDP growth, reflecting the impact of lower imports as a result of steep exchange rate realignments in several coun-tries. In 2017, the economy of the Russian Federation is expected to register its first year of growth since 2014, as the country has largely absorbed the sharp terms-of-trade shock suffered in 2014-2015 (see Chapter IV for more detailed discussion of regional prospects).
Global economic prospects remain subject to significant downside risks, with the potential to obstruct the modest acceleration in growth that is currently forecast for 2017-2018. Considerable uncertainty shrouds both the path and impact of monetary policy actions in major developed economies. The effects of introducing untested monetary policy instruments — such as the negative interest rate policies in Japan and Europe — remains unclear, with a risk of unintended consequences, such as a deterioration of bank balance sheets and tightening of credit conditions, which could destabilize fragile and undercapi-talized banks.
While the path of policy interest rates in the United States remains unclear, interest rate differentials relative to other developed economies are expected to widen, potential-ly triggering financial volatility, capital outflows from developing economies and abrupt adjustments in exchange rates. The future direction of certain international policy stances is uncertain. There is a lack of clarity over the shape and timing of future changes by the new Administration of the United States to crucial policies in international trade, immigration, and climate change. The decision by the United Kingdom to leave the EU, or “Brexit”, and its potential implications for the free movement of goods and workers in Europe, also poses considerable regional uncertainty.
Finally, risks facing developing countries include vulnerabilities associated with high levels of debt and rising default rates in a number of countries, with the potential to push up borrowing costs, raise deleveraging pressures and increase banking sector stress. Such risks are exacerbated by the volatility of international capital flows. All of these uncertain-
Russian Federation to register positive growth in 2017
Downside risks could undermine any projected recovery in business investment, impede international trade growth and prolong the self-propagating cycle of weak global growth
Garnering the financial resources required to finance the necessary investment to put the LDCs on a more rapid growth path remains a key challenge for achieving the SDGs. With private financing and domestic resource mobilisation limited by structural factors, additional concessional international public financing may be needed to close this financing gap (see Chapter III for further discussion of sources of finance).
Figure I.1.2 GDP per capita in LDCs relative to developed country average, 1995–2030
Authors: Dawn Holland and Poh Lynn Ng
Source: UN/DESA forecast and World Economic Forecasting Model (WEFM) scenarios.
0
1
2
3
4
1995 2000 2005 2010 2015 2020 2025 2030
Baseline scenarioHigh growth scenario
Percentage
Box I.1 (continued)

8 World Economic Situation and Prospects 2017
ties have the potential to undermine any projected recovery in business investment, impede international trade growth and prolong the self-propagating cycle of weak global growth.
Inflation prospects In 2016, average global inflation edged up slightly to an estimated rate of 2.4 per cent from 2.1 per cent in 2015, which was the lowest level registered since the global financial crisis.2 Inflation in the developed economies remained below 1 per cent, reflecting the impact of the drop in global energy prices, persistently weak wage growth and the generally high level of economic slack. Inflation forecasts for both the EU and Japan have undergone significant downward revisions in the last 12 months, and both economies dipped back into deflation in the first half of 2016. The low level of inflation is broad-based across developed econo-mies, and also prevalent in many developing countries in Asia.
Figure I.4 compares estimated consumer price inflation to central bank targets for inflation in 2016.3 More than two-thirds of the countries in the sample are experiencing inflation rates below their targeted level. The countries exceeding official inflation targets are predominantly in Africa, while a few countries in South America and the CIS are also experiencing high inflation relative to targets. Higher inflation in these regions largely reflects the impact of currency depreciations, and in some cases food price spikes related to El Niño.
By the end of 2016, the contribution of the oil price to year-on-year inflation reached a turning point, and will have a significant upward impact on inflation in most countries in early 2017 (figure I.5). The spike in inflation driven by the oil price is likely to be short-lived, and the impact on headline inflation and wages is likely to remain contained in most coun-
2 Aggregate figures for inflation reported throughout this report are weighted averages based on GDP in 2010, denominated in US dollars. They exclude Venezuela (Bolivarian Republic of ), due to the distortionary impacts of very high inflation in a single country.
3 The sample only includes countries that have an explicit or implicit target rate for inflation.
Inflation is low in most countries, but exceeds official targets in parts
of Africa, South America and the CIS
Oil price will put upward pressure on inflation
in 2017
Percentage point
PER
COLBRA
URY
MOZ
ZMB
NGA
GHA
MWI
POL
AZE
KAZ
KGZ
BLR
UKR
MNG
TUR
-5
0
5
10
15
20
25
-5 0 5 10 15 20 25
Infla
tion
rate
Central Bank target
Latin America and the CaribbeanEconomies in transitionDeveloped economiesAfricaEast and South AsiaWestern Asia
Figure I.4Inflation relative to central bank target in 2016
Source: Central Bank News, UN/DESA estimates for inflation.
Note: See Table J in the Statistical Annex for definitions of
country codes.

9Chapter I. Global economic outlook
tries. However, if there is a more sustained pass-through, inflation could rise above target in more countries in 2017, which may in turn prompt a more significant rise in interest rates than currently expected.
Employment and labour productivityThe protracted period of weak global growth has also impacted employment, wages and household welfare, leading to a slowdown in household consumption growth. At the global level, growth in household consumption has averaged 2.2 per cent per annum since 2012, compared to an annual average of 3.3 per cent in the decade prior to the global financial crisis, exhibiting a marked slowdown despite the greater resilience of consumer spending relative to other components of demand. According to estimates by the International La-bour Organization (ILO), there are over 27 million more unemployed people today than before the financial crisis, an increase of about 0.5 per cent of the working age population (ILO, 2016).
While the unemployment rates in some large developed countries, including Ger-many, Japan, the United Kingdom and the United States, have receded towards or below pre-crisis levels, most other members of the EU continue to struggle with high unemploy-ment rates. Unemployment rates are generally low in East Asia, but rising unemployment in parts of South America, including Argentina, Brazil and Colombia, is raising concerns. Western Asia also suffers high unemployment, particularly among youth.
Youth unemployment is a widespread global concern, impeding progress towards the SDGs. In 2016, 35 per cent of unemployed people globally were aged 15-24, although this cohort represents only 15 per cent of the world’s labour force. Youth unemployment remains high in Western Asia, and it is rising in Latin America and the Caribbean, as well as in parts of the CIS and South-Eastern Asia. High levels of youth unemployment can have significant longer-term social and economic costs, resulting in labour force withdrawal, outward migration, disincentives to pursue education and social unrest.
Job security is also a widespread global concern. Vulnerable employment — defined as own-account work and contributing family employment, which are typically subject to
More than 27 million additional people are unemployed today compared to before the financial crisis
Youth unemployment is a global concern, with significant longer-term social and economic costs
Figure I.5Price of Brent crude, January 2014–December 2018
Source: US. Energy Information Administration retrieved from FRED and UN/DESA projections.
United States dollars per barrel Percentage
-80
-40
0
40
80
0
30
60
90
120
Jan
2014
Jul 2
014
Jan
2015
Jul 2
015
Jan
2016
Jul 2
016
Jan
2017
Jul 2
017
Jan
2018
Jul 2
018
Year-on-year percentage change (right-hand scale) Price of Brent crude (left-hand scale)

10 World Economic Situation and Prospects 2017
low levels of job security and volatile income – accounts for 46 per cent of employed people worldwide, and is especially high in South Asia and many parts of Africa.
Nominal wage increases in most developed economies have slowed since the financial crisis. The incidence is widespread, including in countries where the unemployment rate is low. Despite low headline inflation, real wages have been stagnant or declining in many countries, and have for the most part lagged behind productivity growth. This is illustrated in figure I.6, where two-thirds of the developed countries in the sample have seen smaller gains in real wages than in productivity since the financial crisis. This is a reflection of the quality of jobs that have been created over this period, which have been dominated by low quality, low paid jobs, and a rise in the incidence of part-time and temporary contracts.
Labour productivity growth in the majority of developed economies has slowed markedly since the global financial crisis, with an even more pronounced slowdown in real wages. Many large developing economies and those in transition have also experienced a significant decline in labour productivity growth, including Brazil, China, the Russian Federation and South Africa. GDP growth can be decomposed into the contribution from growth in labour inputs and the contribution from growth in labour productivity.
In terms of welfare, the input of labour productivity to GDP growth is particular-ly important. Changes to labour inputs are largely driven by demographic developments, although they may also reflect shifts in labour force participation, the average number of hours worked and shifts in the unemployment rate. If GDP growth is spurred entirely by a rise in labour from an expanded population, income per capita remains stagnant. Therefore, in order to raise average incomes in the economy, labour productivity growth is essential. This growth may need to be supported by policies to ensure that the benefits are more equi-tably shared, as evidenced by the recent tendency for real wages to lag behind productivity growth. The links between productivity growth, decent wages and reduction of poverty are recognized in the 2030 Agenda for Sustainable Development, which underscores the importance of generating full employment and decent work for all.
Wage growth is weak, including in
countries where the unemployment rate
is low
Labour productivity growth has slowed
markedly in most developed economies,
and in many large developing and
transition economies
Figure I.6Average annual labour productivity and real wage growth, 2008–2015
Source: UN/DESA, based on data from OECDStat.
Note: See Table J in the Statistical Annex for definitions of
country codes.
AUS
CANDEUDNK FRA
GBR
GRC
HUN
IRLITA
JPNKOR
LUX
MEX
NOR POL
PRT
SVKSWE
USA
-2.5
-1.5
-0.5
0.5
1.5
2.5
3.5
-2.5 -1.5 -0.5 0.5 1.5 2.5 3.5Average productivity growth
Ave
rage
wag
e gr
owth
Percentage

11Chapter I. Global economic outlook
Figures I.7 and I.8 parse average GDP growth in the largest economies by contribu-tions from labour input and from labour productivity, which is further broken down into contributions from the capital intensity of production (capital deepening) and total factor productivity (TFP).
Figure I.7Decomposition of average annual GDP growth in major developed economies
Figure I.8Decomposition of average annual GDP growth in major developing economies and economies in transition
Source: UN/DESA derived from OECDStat, Annual macro-economic database of the European Commission’s Directorate General for Economic and Financial Affairs and United Nations Statistics Division National Accounts Main Aggregates Database.
Source: UN/DESA derived from Penn World Tables 9.0 retrieved from FRED, The Conference Board Total Economy Database and United Nations Statistics Division National Accounts Main Aggregates Database.
-1
0
1
2
3
2000–2007 2011–2015 2000–2007 2011–2015 2000–2007 2011–2015 2000–2007 2011–2015
Canada EU-15 Japan United States
Percentage point
Contribution of labour inputOf which contribution of capital deepeningOf which contribution of TFPContribution of labour productivity
Percentage point
Contribution of labour inputOf which contribution of capital deepeningOf which contribution of TFPContribution of labour productivity
-4
0
4
8
12
2000–2007 2011–2015 2000–2007 2011–2015 2000–2007 2011–2015 2000–2007 2011–2015 2000–2007 2011–2015
Brazil China India Russian Federation South Africa

12 World Economic Situation and Prospects 2017
In the large developing and transition countries, the falling contribution of produc-tivity to GDP growth is primarily attributable to a decline in TFP growth, whereas the slowdown in labour productivity growth in the major developed economies has been also driven by the very low rate of capital deepening. Germany, Japan and the United States have, in fact, undergone a period of ‘capital shallowing’ since 2011, as the volume of pro-ductive capital stock per hour of labour input has actually declined. This is indicative of the collapse in investment growth in developed economies post-crisis, which has allowed the existing capital stock to decay. The widespread slump in capital deepening in developed economies reflects low rates of both private and public investment, as discussed in the next section.
Capital deepening and TFP growth are closely interconnected, and a slowdown in capital deepening in the short-term may presage weaker TFP growth over the medi-um-term. Investment in new capital can affect factors such as the rate of innovation, labour force skills and the quality of infrastructure. These in turn drive the technological change and efficiency gains underpinning TFP growth in the medium-term.
As the private sector remains hesitant about making new investments amid significant worldwide economic and political uncertainties, governments may need to step in and help fill the investment gaps as part of a move towards a more balanced policy mix. While this may be difficult for many countries, especially commodity exporters that suffered a sharp loss of revenue, some large economies have the scope to take advantage of low borrowing costs to finance investment. It is particularly important to stem the decline in investment in key areas such as research and development (R&D), education and infrastructure.
InvestmentWeak investment has been at the foundation of the mediocre global economy, through its interplay with demand, productivity and international trade. The contribution of invest-ment to global growth has declined from an average of 1.4 percentage points per annum in 2003-2007 to 0.7 percentage points per annum since 2012.
Both global and country-specific factors have contributed to the weakening of invest-ment. Protracted weak global demand has reduced firms’ incentive to invest, especially those in export-oriented industries. Since the onset of the broad-based decline in com-modity prices in late-2014, commodity sectors in particular have suffered from delays and cancellation of infrastructure investment and exploration activities. Global investment in energy sectors, for example, declined by 8 per cent in 2015 (International Energy Agency, 2016). Policy uncertainty and in some cases social unrest have also held back investment in several countries, including Brazil, South Africa, Turkey, the United Kingdom and the United States. A lack of access to finance has also created barriers, especially in Europe where certain banks remain undercapitalised as well as in developing countries that are struggling with high interest rates or where financial markets are under-developed.
In developed economies, private non-residential investment growth has been excep-tionally weak in the past two years, especially when compared to the pre-crisis years 2005-2007. In the first half of 2016, most major developed economies experienced a con-traction in private non-residential investment activity (figure I.9). The sharp contractions in Australia and Canada largely reflect large cutbacks in mining-related capital expenditure, while the United States has seen a significant decline in investment in the shale-oil sec-tor. These declines have not been matched by a commensurate expansion of investment in
Germany, Japan and the United States have
undergone a period of ‘capital shallowing’, reflecting a collapse in
investment growth
Investment in R&D, education and
infrastructure is essential to support productivity
growth in the medium term
Weak investment underpins the sluggish
global economy, through its close linkages with demand, productivity
and international trade
Since late-2014, commodity sectors,
in particular, have experienced declining
investment
Contractions in investment in extractive
industries do not necessarily signal
progress towards a less fossil fuel-intensive
economy

13Chapter I. Global economic outlook
renewable energy, and are likely to prove temporary, rather than signal significant structural progress towards a less fossil fuel-intensive economy.
In the United States, in particular, an expansion of investment in fossil fuel indus-tries would be expected in 2017, should the new Administration lift certain environmental restrictions on production in the shale, oil, natural gas and clean coal sectors, risking set-backs to environmental targets in the SDGs and the Paris Agreement on climate change.
Investment in manufacturing sectors in Japan and the United States has been dis-couraged by the strength of their currencies, which is suppressing exports and the earnings of companies operating abroad. Private investment growth in France and Germany has seen more resilience, reflecting modest improvement in the euro area. However, the heightened levels of uncertainty following the Brexit vote in June 2016 may have restrained investment in Europe in the second half of 2016.
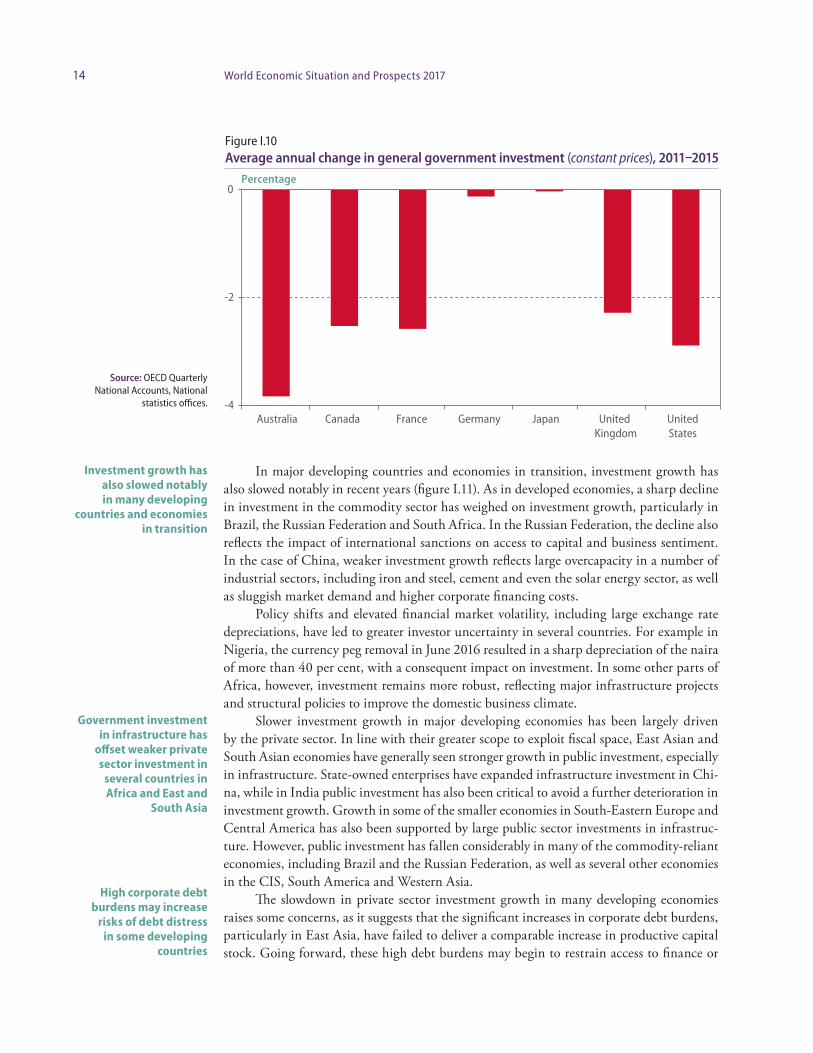
Despite record-low, often negative bond yields, Governments in developed countries have been reluctant to increase public sector investments to fill the gap in private invest-ment. Steep cuts in government investment largely reflect fiscal adjustment policies that have been implemented in many developed economies since 2010 in response to soaring levels of government debt (figure I.10). In recent quarters, Australia, France, Germany and the United States have experienced some recovery in public investment, although the ratio of public investment to GDP remains low. Fiscal stimulus programmes in Canada and Japan will revive government investment in 2017, while policy measures in Australia are expected to stem the decline in investment by small and medium-sized businesses, which will support a modest increase in the contribution of investment to GDP growth in the forecast period. While the policy outlook for the United States remains highly uncertain, proposals to boost infrastructure spending would support a revival of investment in the fiscal year starting October 2017 if implemented.
Public sector investment has contracted significantly in many developed countries since 2010
Figure I.9Average year-on-year change in private non-residential investment in developed economies (constant prices)
Source: National statistics offices.
Percentage
-15
-10
-5
0
5
10
15
United States Japan Australia Canada United Kingdom
Germany France
Pre-crisis (2005–2007)2010–201420151H 2016
14 World Economic Situation and Prospects 2017
In major developing countries and economies in transition, investment growth has also slowed notably in recent years (figure I.11). As in developed economies, a sharp decline in investment in the commodity sector has weighed on investment growth, particularly in Brazil, the Russian Federation and South Africa. In the Russian Federation, the decline also reflects the impact of international sanctions on access to capital and business sentiment. In the case of China, weaker investment growth reflects large overcapacity in a number of industrial sectors, including iron and steel, cement and even the solar energy sector, as well as sluggish market demand and higher corporate financing costs.
Policy shifts and elevated financial market volatility, including large exchange rate depreciations, have led to greater investor uncertainty in several countries. For example in Nigeria, the currency peg removal in June 2016 resulted in a sharp depreciation of the naira of more than 40 per cent, with a consequent impact on investment. In some other parts of Africa, however, investment remains more robust, reflecting major infrastructure projects and structural policies to improve the domestic business climate.
Slower investment growth in major developing economies has been largely driven by the private sector. In line with their greater scope to exploit fiscal space, East Asian and South Asian economies have generally seen stronger growth in public investment, especially in infrastructure. State-owned enterprises have expanded infrastructure investment in Chi-na, while in India public investment has also been critical to avoid a further deterioration in investment growth. Growth in some of the smaller economies in South-Eastern Europe and Central America has also been supported by large public sector investments in infrastruc-ture. However, public investment has fallen considerably in many of the commodity-reliant economies, including Brazil and the Russian Federation, as well as several other economies in the CIS, South America and Western Asia.
The slowdown in private sector investment growth in many developing economies raises some concerns, as it suggests that the significant increases in corporate debt burdens, particularly in East Asia, have failed to deliver a comparable increase in productive capital stock. Going forward, these high debt burdens may begin to restrain access to finance or
Investment growth has also slowed notably in many developing
countries and economies in transition
Government investment in infrastructure has
offset weaker private sector investment in
several countries in Africa and East and
South Asia
High corporate debt burdens may increase
risks of debt distress in some developing
countries
Source: OECD Quarterly National Accounts, National
statistics offices.
Figure I.10Average annual change in general government investment (constant prices), 2011–2015
Percentage
-4
-2
0
Australia Canada France Germany Japan United Kingdom
United States

15Chapter I. Global economic outlook
prompt firm deleveraging, perpetuating the slowdown in investment growth, and may also increase the risks of debt distress and financial instability in some developing countries.
Trade, capital flows and remittancesInternational trade flows
Dwindling world trade growth is both a contributing factor and a symptom of the global economic slowdown. Trade and investment are strongly interconnected and mutually rein-forcing. The current weak investment trends in major developed and developing economies have constrained trade in capital goods, while at the same time, the weakness in trade is propagating and reinforcing the slump in investment, especially in other export-oriented sectors. There may also be spillovers from weak global trade to productivity, especially in developing countries (box I.2).
The 2030 Agenda for Sustainable Development recognizes the important role of trade as an engine of inclusive and sustainable growth (e.g. SDG 17 calls for significantly increa-sing the exports of developing countries). The appropriate design of policies to support these objectives requires an understanding of the factors behind the slowdown in world trade growth, distinguishing between temporary cyclical factors and more permanent structural factors.
While global trade growth has been volatile over the past four decades, the prolonged downturn is exceptional, suggesting that not only cyclical factors are at play. The volume of world trade in goods and services is estimated to have expanded by just 1.2 per cent in 2016, the slowest growth rate since the financial crisis, marking a significant downward revision of nearly 3 percentage points compared to projections in the WESP 2016. In first half of 2016, world merchandise trade virtually stagnated, continuing the downward trend — both in historical terms and also relative to GDP growth — of international trade growth observed
Dwindling world trade growth is both a contributing factor and a symptom of the global economic slowdown
World trade volumes expanded by just 1.2 per cent in 2016, the third-lowest rate in the past 30 years
Figure I.11Average year-on-year change in gross fixed capital formation in developing and transition economies (constant prices)
Source: OECD Quarterly National Accounts, United Nations Statistics Division National Accounts Main Aggregates Database. * Data for 1H 2016 is not available.
Percentage
-20
-10
0
10
20
Brazil China* India Indonesia RussianFederation
South Africa
Turkey Mexico Republicof Korea
Pre-crisis (2005-2007)2010-201420151H 2016

16 World Economic Situation and Prospects 2017
Box I.2The slowdown in productivity growth: a view from international trade
Despite measurement concerns, there is a growing consensus that productivity growth has slowed down across developed and developing countries. However, there is much less unanimity on the reasons be-hind this trend, and both cyclical and structural factors have been suggested as main drivers. Some au-thors have argued that the pace of technological progress has declined and that incremental innovations observed in recent decades have smaller effects on productivity than the radical innovations of the late nineteenth and early twentieth centuries (Gordon, 2012). Others authors have highlighted the role of weak demand and lower capital investment, as a long-lasting consequence of the global financial crisis. More structural factors such as demography, education and inequality have also been proposed as key drivers for lower productivity growth (OECD, 2015a). Less attention has been given to the slowdown in international trade growth as a cause.
In the last fifteen years, the analysis of international trade has changed radically. Traditional trade theories emphasized comparative advantages as a key rationale for trade flows, mostly in the form of inter-industry trade. Since the 1980s, new trade theories have given intuitive explanations for intra- industry trade flows, focusing on the role of increasing returns to scale and consumers’ love for varie-ty (Krugman, 1981; Helpman, 1981). More recently, theoretical and empirical studies have included firm heterogeneity as a key dimension to understand how economies respond to international trade (Ber-nard and others, 2011). The seminal model by Melitz (2003) shows how firm heterogeneity, even within narrowly defined industries, affects aggregate outcomes, including productivity growth, when trade barriers diminish or transportation costs fall. This model is key. In particular, high-productivity exporting firms survive and expand, while low-productivity non-exporting firms shrink or exit, leading to with-in-industry productivity gains. Furthermore, the increase in operational scale in foreign markets leads to investments in technology and innovation. Firms specialize by adjusting the extensive margins of prod-ucts and destinations (Melitz and Redding, 2015). This reallocation of resources related to international trade raises aggregate productivity.
The current subdued export flows and slowing pace of trade liberalization are constraining pro-ductivity growth. Exports can boost productivity growth by creating economies of scale and introduc-ing new production techniques, inputs and product designs from international contacts. Empirical evi-dence for countries such as Canada, Chile, India, Slovenia and many economies in Africa has supported this cau sal link (Lileeva, 2008; Van Biesebroeck, 2006; De Loecker, 2007; Alvarez and Lopez, 2005 and Mukim, 2011).
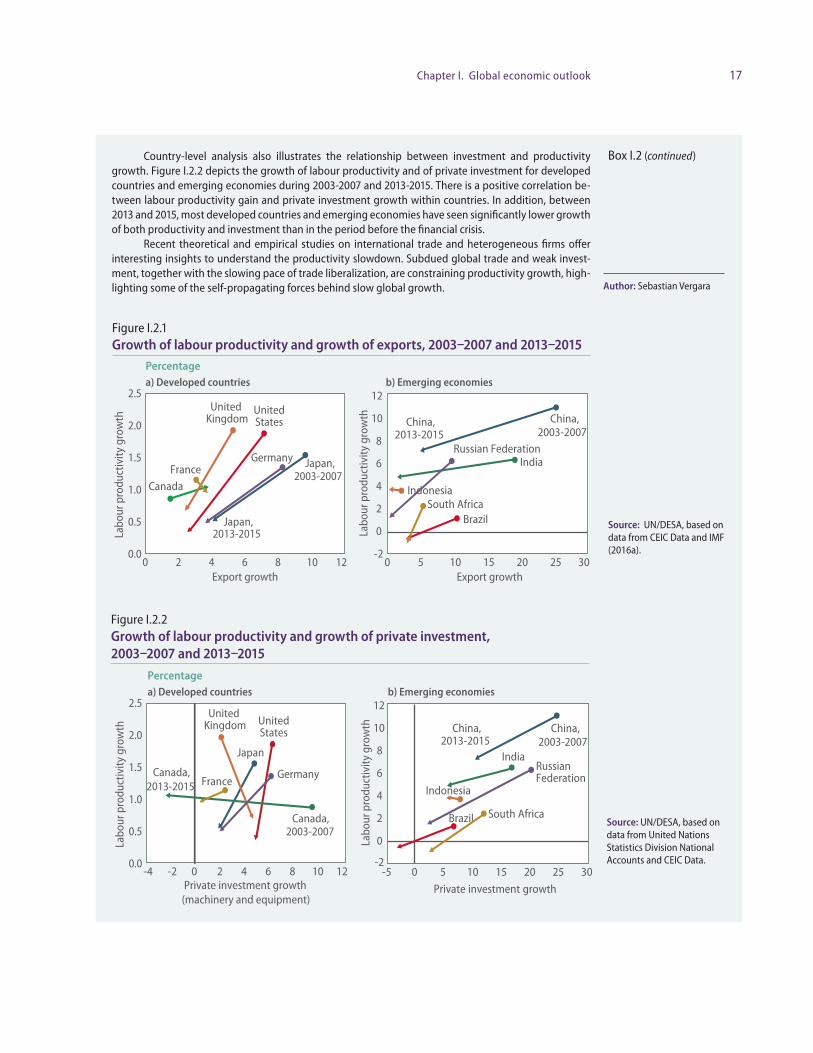
An aggregate analysis at country level also illustrates this relationship. Figure I.2.1 displays labour productivity growth and export gains for developed and emerging economies during 2003-2007 and 2013-2015. Noticeably, the data illustrates a positive correlation between export and labour productivity growth within countries. In addition, the period between 2013 and 2015 is characterized by lower pro-ductivity and export growth in most developed countries and emerging economies.
In addition to the export channel, the slowing pace of trade liberalization, coupled with the rising protectionist measures recently, also restrain productivity growth. Trade liberalization is associated with productivity gains from variety and economies of scale, resource reallocation within industries and from exporters innovating for a larger market (Melitz and Trefler, 2012; Alvarez and Vergara, 2010; Bustos, 2011; Amiti and Konings, 2007). However, trade liberalization usually entails a significant exit of firms and work-er displacements. The reallocation of resources can encounter huge difficulties, as experienced in some African and Latin American countries during the 1980s.
The dynamics of trade are closely connected to investment behaviour. A firm’s decision whether to enter or expand in foreign markets is ultimately made jointly with its decisions on investment, techno-logy, product-mix and R&D (Lileeva and Trefler, 2010). At the firm level, productivity growth arises from a number of decisions taken jointly with trade participation (Aw and others, 2011; Bustos, 2011; and Bloom and others, 2011).
(continued)
17Chapter I. Global economic outlook
Country-level analysis also illustrates the relationship between investment and productivity growth. Figure I.2.2 depicts the growth of labour productivity and of private investment for developed countries and emerging economies during 2003-2007 and 2013-2015. There is a positive correlation be-tween labour productivity gain and private investment growth within countries. In addition, between 2013 and 2015, most developed countries and emerging economies have seen significantly lower growth of both productivity and investment than in the period before the financial crisis.
Recent theoretical and empirical studies on international trade and heterogeneous firms offer interesting insights to understand the productivity slowdown. Subdued global trade and weak invest-ment, together with the slowing pace of trade liberalization, are constraining productivity growth, high-lighting some of the self-propagating forces behind slow global growth.
Source: UN/DESA, based on data from United Nations Statistics Division National Accounts and CEIC Data.
Box I.2 (continued)
Figure I.2.2Growth of labour productivity and growth of private investment, 2003–2007 and 2013–2015
-2
0
2
4
6
8
10
12
0 5 10 15 20 25 30
Labo
ur p
rodu
ctiv
ity g
row
th
Export growth
0.0
0.5
1.0
1.5
2.0
2.5
0 2 4 6 8 10 12
Labo
ur p
rodu
ctiv
ity g
row
th
Export growth
a) Developed countries b) Emerging economies
Percentage
UnitedStates
Japan, 2003-2007
Japan,2013-2015
Canada
United Kingdom
GermanyFrance
Brazil
China,2003-2007
China,2013-2015
India
Indonesia
Russian Federation
South Africa
Figure I.2.1Growth of labour productivity and growth of exports, 2003–2007 and 2013–2015
Source: UN/DESA, based on data from CEIC Data and IMF (2016a).
Author: Sebastian Vergara
Brazil
China,2003-2007
China,2013-2015
India
Indonesia
RussianFederation
South Africa
-2
0
2
4
6
8
10
12
Labo
ur p
rodu
ctiv
ity g
row
th
Japan
2013-2015
2003-2007
Canada,
Canada,
GermanyFrance
0.0
0.5
1.0
1.5
2.0
2.5
Labo
ur p
rodu
ctiv
ity g
row
th
a) Developed countries b) Emerging economies
Percentage
-5 0 5 10 15 20 25 30
Private investment growth
-4 -2 0 2 4 6 8 10 12 Private investment growth (machinery and equipment)
UnitedStates
United Kingdom
18 World Economic Situation and Prospects 2017
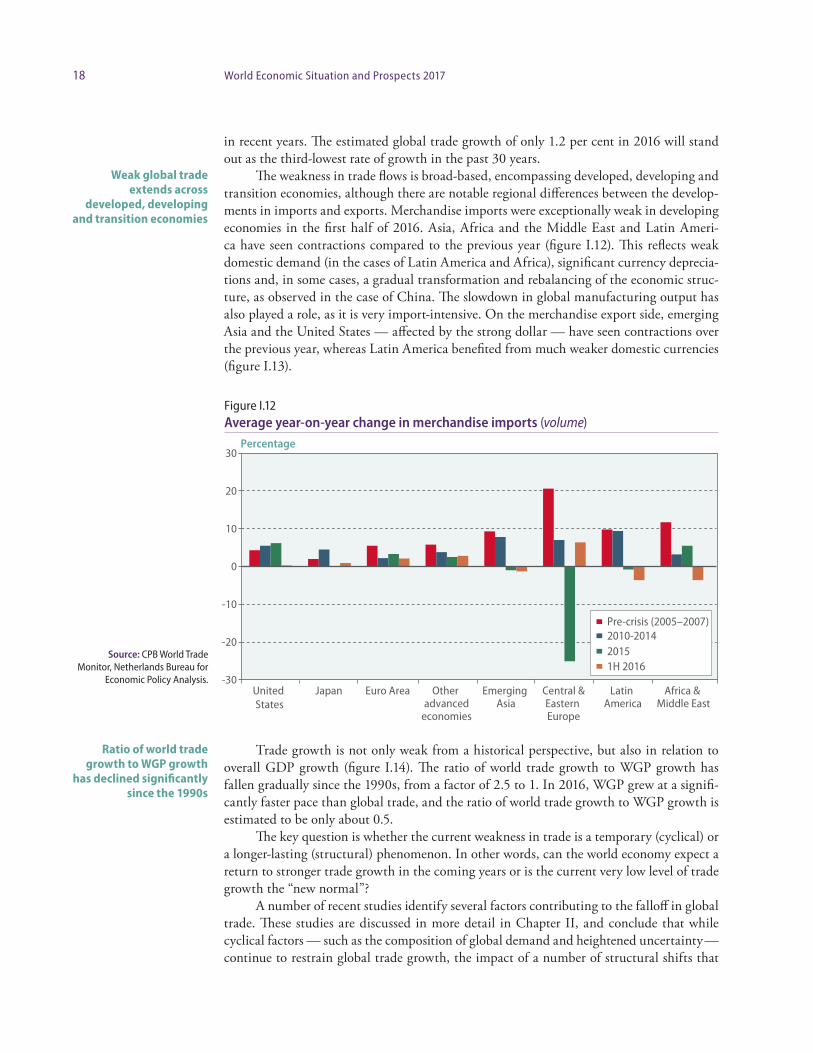
in recent years. The estimated global trade growth of only 1.2 per cent in 2016 will stand out as the third-lowest rate of growth in the past 30 years.
The weakness in trade flows is broad-based, encompassing developed, developing and transition economies, although there are notable regional differences between the develop-ments in imports and exports. Merchandise imports were exceptionally weak in developing economies in the first half of 2016. Asia, Africa and the Middle East and Latin Ameri-ca have seen contractions compared to the previous year (figure I.12). This reflects weak domestic demand (in the cases of Latin America and Africa), significant currency deprecia-tions and, in some cases, a gradual transformation and rebalancing of the economic struc-ture, as observed in the case of China. The slowdown in global manufacturing output has also played a role, as it is very import-intensive. On the merchandise export side, emerging Asia and the United States — affected by the strong dollar — have seen contractions over the previous year, whereas Latin America benefited from much weaker domestic currencies (figure I.13).
Trade growth is not only weak from a historical perspective, but also in relation to overall GDP growth (figure I.14). The ratio of world trade growth to WGP growth has fallen gradually since the 1990s, from a factor of 2.5 to 1. In 2016, WGP grew at a signifi-cantly faster pace than global trade, and the ratio of world trade growth to WGP growth is estimated to be only about 0.5.
The key question is whether the current weakness in trade is a temporary (cyclical) or a longer-lasting (structural) phenomenon. In other words, can the world economy expect a return to stronger trade growth in the coming years or is the current very low level of trade growth the “new normal”?
A number of recent studies identify several factors contributing to the falloff in global trade. These studies are discussed in more detail in Chapter II, and conclude that while cyclical factors — such as the composition of global demand and heightened uncer tainty— continue to restrain global trade growth, the impact of a number of structural shifts that
Weak global trade extends across
developed, developing and transition economies
Ratio of world trade growth to WGP growth
has declined significantly since the 1990s
Figure I.12Average year-on-year change in merchandise imports (volume)
Source: CPB World Trade Monitor, Netherlands Bureau for
Economic Policy Analysis.
Percentage
-30
-20
-10
0
10
20
30
United States
Japan Euro Area Other advanced
economies
Emerging Asia
Central &Eastern Europe
Latin America
Africa & Middle East
Pre-crisis (2005–2007)2010-201420151H 2016

19Chapter I. Global economic outlook
favoured the rapid expansion of global trade in the 1990s and 2000s have started to wane. These structural shifts include, for example, the reduction in transportation costs support-ed by information and communications technology (ICT) advancements; the integration process of the economies in transition and China into global trade networks; deeper inte-gration in Europe with the European Single Market; and the expansion of global value chains (GVCs).
Global import penetration is expected to stabilize in 2017, and exhibit a partial reco-very in 2018 of some of its recent losses. However, the elasticity between trade and GDP growth is likely to remain closer to 1 over the next several years.
World trade growth will track WGP growth more closely in the coming years
Figure I.13Average year-on-year change in merchandise exports (volume)
Figure I.14Average annual change in world trade and world gross product by decade (constant prices)
Source: CPB World Trade Monitor, Netherlands Bureau for Economic Policy Analysis.
Source: United Nations Statistics Division National Accounts Main Aggregates Database. * Includes UN/DESA estimates for 2016.
Percentage
United States
Japan Euro Area Other advanced
economies
Emerging Asia
Central &Eastern Europe
Latin America
Africa & Middle East
-5
0
5
10
15
Pre-crisis (2005–2007)2010-201420151H 2016
Percentage
Average world trade growthAverage WGP growth
0
2
4
6
8
1970s 1980s 1990s 2000s 2010s*

20 World Economic Situation and Prospects 2017
Capital inflows to emerging economiesAmid a slower-than-expected pace of interest rate rises in the United States and a further expansion of unconventional monetary policy measures in other developed economies, in-ternational financial markets were relatively stable for the most part in 2016, after a tu-multuous January of selling-off in equity markets. Private non-resident capital inflows to emerging markets4 have seen some recovery, after experiencing outflows of portfolio debt and banking flows in 2015 and early 2016 (Institute of International Finance, 2016). The re-vival of capital inflows partly reflects a recovery in portfolio flows to China and other Asian markets, and a stabilisation of cross-border banking outflows. While portfolio inflows to the Russian Federation have also improved, total non-resident private capital continues to be withdrawn from the country.
The recovery in non-resident capital inflows to emerging market economies reflects both internal and external factors. These include a mild recovery in international commod-ity prices, a slightly improved growth outlook in Brazil and the Russian Federation and a renewed search for yield amid record-low returns in developed economies. Global equity and debt markets have largely proven resilient, despite elevated global uncertainty. Finan-cial markets recovered quickly from the unexpected outcome of the Brexit referendum in June 2016, in large part due to the rapid and forceful response of central banks in developed countries.
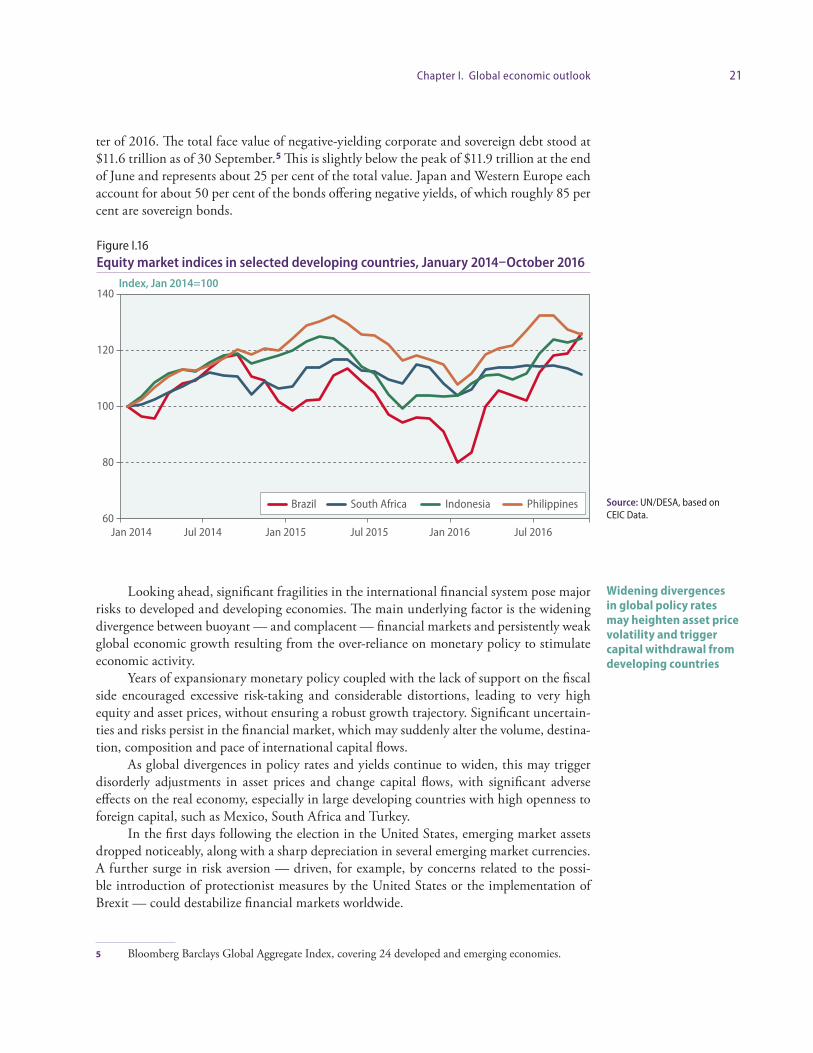
The recovering capital inflows have resulted in significantly lower government and corporate bond yields in emerging economies (figure I.15) and higher equity prices (figure I.16). Meanwhile, developed country bond yields declined to record lows in the third quar-
4 This definition differs from data presented in Chapter III, which apply the ‘net net flows’ concept, which is net inflows less net outflows. The use of ‘net inflows’ focuses on the effects of volatility in foreign capital inflows, while the use of ‘net net flows’ focuses on the balance of payments effects.
Private non-resident capital inflows to
emerging markets recovered some losses
in 2016
Global equity and debt markets have largely
proven resilient, despite elevated global
uncertainty
About 25 per cent of global bonds are offering
negative yields
Figure I.15Yield spreads on emerging economies sovereign bonds, January 2007–November 2016
Source: JPMorgan Chase.
Percentage point
0
2
4
6
8
10Africa Asia Europe Latin America
Jan
2007
Jul 2
007
Jan
2008
Jul 2
008
Jan
2009
Jul 2
009
Jan
2010
Jul 2
010
Jan
2011
Jul 2
011
Jan
2012
Jul 2
012
Jan
2013
Jul 2
013
Jan
2014
Jul 2
014
Jan
2015
Jul 2
015
Jan
2016
Jul 2
016
21Chapter I. Global economic outlook
ter of 2016. The total face value of negative-yielding corporate and sovereign debt stood at $11.6 trillion as of 30 September.5 This is slightly below the peak of $11.9 trillion at the end of June and represents about 25 per cent of the total value. Japan and Western Europe each account for about 50 per cent of the bonds offering negative yields, of which roughly 85 per cent are sovereign bonds.
Looking ahead, significant fragilities in the international financial system pose major risks to developed and developing economies. The main underlying factor is the widening divergence between buoyant — and complacent — financial markets and persistently weak global economic growth resulting from the over-reliance on monetary policy to stimulate economic activity.
Years of expansionary monetary policy coupled with the lack of support on the fiscal side encouraged excessive risk-taking and considerable distortions, leading to very high equity and asset prices, without ensuring a robust growth trajectory. Significant uncertain-ties and risks persist in the financial market, which may suddenly alter the volume, destina-tion, composition and pace of international capital flows.
As global divergences in policy rates and yields continue to widen, this may trigger disorderly adjustments in asset prices and change capital flows, with significant adverse effects on the real economy, especially in large developing countries with high openness to foreign capital, such as Mexico, South Africa and Turkey.
In the first days following the election in the United States, emerging market assets dropped noticeably, along with a sharp depreciation in several emerging market currencies. A further surge in risk aversion — driven, for example, by concerns related to the possi-ble introduction of protectionist measures by the United States or the implementation of Brexit — could destabilize financial markets worldwide.
5 Bloomberg Barclays Global Aggregate Index, covering 24 developed and emerging economies.
Widening divergences in global policy rates may heighten asset price volatility and trigger capital withdrawal from developing countries
Figure I.16Equity market indices in selected developing countries, January 2014–October 2016
Source: UN/DESA, based on CEIC Data.
Index, Jan 2014=100
60
80
100
120
140
Jan 2014 Jul 2014 Jan 2015 Jul 2015 Jan 2016 Jul 2016
Brazil South Africa Indonesia Philippines
22 World Economic Situation and Prospects 2017
RemittancesRemittances are resource transfers between residents and non-resi dents, generally in the form of wages transferred from migrant workers to their families. In several countries they comprise a significant share of disposable household income. Amid subdued global eco-nomic growth, remittance flows to developing countries in dollar terms virtually stagnated in 2015. Officially recorded remittances to developing countries amounted to $431.6 bil-lion in 2015, an increase of only 0.4 per cent from 2014 — the lowest rate of increase since the global financial crisis.6 Preliminary data for 2016 underscore large differences not only across major geographic regions, but also within regions.
The appreciation of the dollar and the low oil price constrained the growth in the dol-lar value of remittances in 2015, and continued to weigh on remittance flows in the first half of 2016. The CIS countries that receive most of their remittance inflows from the Russian Federation have suffered particularly steep contractions, reflecting the sharp decline in the rouble’s value, amid the challenging labour market conditions and economic outlook in the Russian Federation. The contraction in domestic currency terms was much more moderate, as the CIS currencies also weakened versus the dollar, but still weighed on households’ pur-chasing power and private consumption of extra-regional goods and services.
Outflows from the Cooperation Council for the Arab States of the Gulf (GCC) have also slowed, negatively impacting Egypt in North Africa and South Asian economies, nota-bly Bangladesh, India and Nepal. In certain cases, the flow of remittances in the “reverse direction” increased in 2016, for example, from Asian to Gulf countries or from the Cauca-sus to the Russian Federation, as families in home countries tried to provide some support to the migrant workers facing temporary difficulties.
Remittance-receiving economies with a strong exposure to the United States and euro area countries have generally performed well, thanks to positive labour market trends. Remittance flows to Mexico, for example, increased by over 8 per cent year-on-year in the first half of 2016 in US dollar terms, and by even more in terms of domestic currency. At $13.2 billon, remittance inflows far exceeded oil export revenues. The outlook for remit-tance flows from the United States is highly uncertain, depending on whether any of the proposed changes to immigration policies and taxation are introduced by the new Admi-nistration of the United States.
The post-2014 experience in CIS economies, including Kyrgyzstan, Tajikistan and Uzbekistan, illustrates the risks for countries whose inflows come almost exclusively from one country. Among the major remittance-receiving developing countries, the degree of source country concentration varies significantly (figure I.17). Countries with a higher con-centration of remittance sources tend to have more volatile remittance inflows.
The weakening of the British pound in the wake of Brexit will have a considerably negative impact on countries for which the United Kingdom provides a large share of total remittance inflows. Figure I.18 depicts the 10 countries with the largest share of inflows from the UK in total inflows, which includes four African countries.
The Addis Ababa Action Agenda (AAAA) includes a commitment to reduce, by 2030, the average transaction costs of migrant remittances to less than 3 percent, recognizing the important role that remittances can play in reducing poverty. While remittance costs have continued to decline, they remain higher in sub-Saharan Africa, where remittance transac-
6 World Bank Migration and Remittances Data(http://www.worldbank.org/en/topic/migrationremit-tancesdiasporaissues/brief/migration-remittances-data).
Remittance flows to developing countries
virtually stagnated in 2015
Declining remittance flows from the Russian
Federation weighed on household income in
other CIS countries
Low oil prices have also constrained remittances from other oil-exporting
countries
The outlook for remittance flows from the United States may be impacted by policy
changes
Countries with a higher concentration of
remittance sources tend to have more volatile
remittance inflows
A weaker British pound will weigh on
remittances from the United Kingdom

23Chapter I. Global economic outlook
tion costs averaged 9.5 per cent in the fourth quarter of 2015, with costs in some corridors between South Africa and nearby countries as high as 18–20 per cent.
Better access to financial services, and more effective use of formal providers, can facilitate speedier and safer remittance flows, and lower the high remittance transaction costs in underserved areas, as called for in the AAAA.
Global imbalancesWhile the dispersion of global current-account deficits and surpluses has narrowed some-what from the peaks leading up to the global financial crisis, a significant degree of im-
Global current account imbalances have narrowed, but may still pose a risk to global financial stability
Figure I.17Degree of concentration of remittance sources for selected countries, 2015
Figure I.18Share of remittances from the United Kingdom in total remittance inflows, 2015
Source: UN/DESA derived from World Bank Bilateral Remittances Matrix 2015. Note: A higher index refers to more concentrated remittance sources. The remittance concentration index is measured as the sum of squared shares of each source (remittance-sending country) in the total inflow of remittances into the recipient country.
Source: World Bank Bilateral Remittances Matrix 2015. Note: Ten top countries depending on remittances from the United Kingdom.
Index
0.0
0.2
0.4
0.6
0.8
1.0
Uzb
ekis
tan
Mex
ico
Kyrg
yzst
an
Tajik
ista
n
Dom
inic
an R
epub
lic
Arm
enia
Viet
Nam
Alba
nia
Keny
a
Indo
nesi
a
Egyp
t
Nep
al
Bang
lade
sh
Phili
ppin
es
Paki
stan
Pola
nd
Chin
a
Nig
eria
Indi
a
Share
0.0
0.2
0.4
0.6
Ireland Cyprus Kenya Mauritius Uganda SouthAfrica
Malta Australia Lithuania Oman

24 World Economic Situation and Prospects 2017
balance still persists, posing a potential risk to global financial stability. The United States current-account deficit narrowed from 1.6 per cent of WGP in 2006 to 0.5 per cent in 2013, combined with a decline in China’s current-account surplus from 0.5 per cent of WGP to 0.2 per cent over the same period.
However, the United States current account deficit has been widening since 2014, and is expected to widen further in 2017-2018 (figure I.19). The current account surplus in East Asia, after widening slightly in 2014 and 2015, has narrowed again, and a return to the level of global imbalances in 2006 is unlikely.
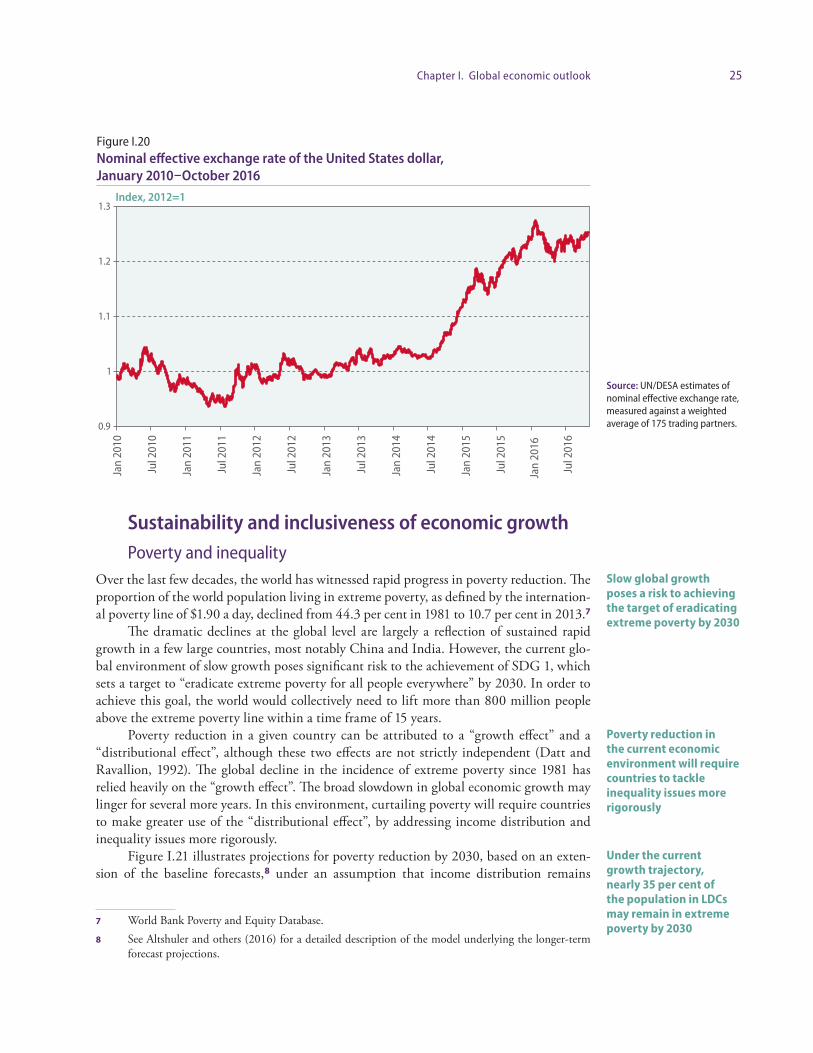
The United States dollar has appreciated by more than 15 per cent since mid-2014 (figure I.20). The strong dollar has restrained exports of the United States, and has been an important factor underpinning the recent widening of the current account deficit of the United States. As interest rates in the United States are expected to rise relative to other major developed economies in 2017-2018, some upward pressure on the dollar is expected to continue, further unwinding some of the improvement in the current account deficit of the United States since 2006.
The drop in oil prices in 2015 helped contain greater imbalances, as the majority of fuel exporters have historically run persistent current-account surpluses. However, many commodity exporters are now running large external deficits due to the steep loss of export revenue. The partial recovery in oil and other commodity prices in 2017-2018 will ease some of these pressures. Nonetheless, if global imbalances were to begin to deteriorate, this could pose an additional risk to the already modest global economic recovery.
The strong US dollar has underpinned a
widening of the current account deficit in the
United States
Many commodity exporters are now
running large external deficits due to the steep
loss of export revenue
Figure I.19Global imbalances: Current account balances in per cent of world gross product, 2000–2018
Source: UN/DESA derived from IMF International Financial
Statistics. Includes UN/DESA estimates and projections for
2016-2018.
Percentage
-3
-2
-1
0
1
2
3
2000
2001
2002
2003
2004
2005
2006
2007
2008
2009
2010
2011
2012
2013
2014
2015
2016
2017
2018
United States
Rest of the World
Oil exportersGermany and JapanEuropean Union less Germany
East Asia less ChinaChina
25Chapter I. Global economic outlook
Sustainability and inclusiveness of economic growthPoverty and inequality
Over the last few decades, the world has witnessed rapid progress in poverty reduction. The proportion of the world population living in extreme poverty, as defined by the internation-al poverty line of $1.90 a day, declined from 44.3 per cent in 1981 to 10.7 per cent in 2013.7
The dramatic declines at the global level are largely a reflection of sustained rapid growth in a few large countries, most notably China and India. However, the current glo-bal environment of slow growth poses significant risk to the achievement of SDG 1, which sets a target to “eradicate extreme poverty for all people everywhere” by 2030. In order to achieve this goal, the world would collectively need to lift more than 800 million people above the extreme poverty line within a time frame of 15 years.
Poverty reduction in a given country can be attributed to a “growth effect” and a “distributional effect”, although these two effects are not strictly independent (Datt and Ravallion, 1992). The global decline in the incidence of extreme poverty since 1981 has relied heavily on the “growth effect”. The broad slowdown in global economic growth may linger for several more years. In this environment, curtailing poverty will require countries to make greater use of the “distributional effect”, by addressing income distribution and inequality issues more rigorously.
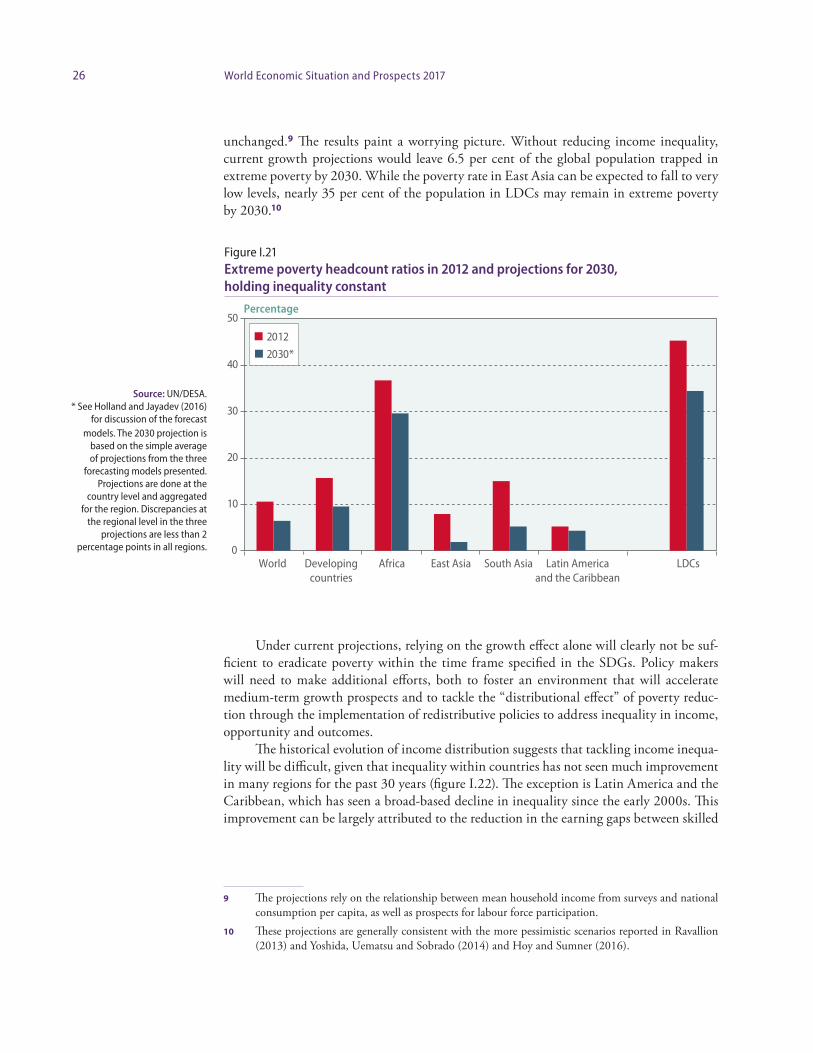
Figure I.21 illustrates projections for poverty reduction by 2030, based on an exten-sion of the baseline forecasts,8 under an assumption that income distribution remains
7 World Bank Poverty and Equity Database.8 See Altshuler and others (2016) for a detailed description of the model underlying the longer-term
forecast projections.
Slow global growth poses a risk to achieving the target of eradicating extreme poverty by 2030
Poverty reduction in the current economic environment will require countries to tackle inequality issues more rigorously
Under the current growth trajectory, nearly 35 per cent of the population in LDCs may remain in extreme poverty by 2030
Figure I.20Nominal effective exchange rate of the United States dollar, January 2010–October 2016
Source: UN/DESA estimates of nominal effective exchange rate, measured against a weighted average of 175 trading partners.
Index, 2012=1
0.9
1
1.1
1.2
1.3
Jan
2010
Jul 2
010
Jan
2011
Jul 2
011
Jan
2012
Jul 2
012
Jan
2013
Jul 2
013
Jan
2014
Jul 2
014
Jan
2015
Jul 2
015
Jan
2016
Jul 2
016
26 World Economic Situation and Prospects 2017
unchanged.9 The results paint a worrying picture. Without reducing income inequality, current growth projections would leave 6.5 per cent of the global population trapped in extreme poverty by 2030. While the poverty rate in East Asia can be expected to fall to very low levels, nearly 35 per cent of the population in LDCs may remain in extreme poverty by 2030.10
Under current projections, relying on the growth effect alone will clearly not be suf-ficient to eradicate poverty within the time frame specified in the SDGs. Policy makers will need to make additional efforts, both to foster an environment that will accelerate medium-term growth prospects and to tackle the “distributional effect” of poverty reduc-tion through the implementation of redistributive policies to address inequality in income, opportunity and outcomes.
The historical evolution of income distribution suggests that tackling income inequa-lity will be difficult, given that inequality within countries has not seen much improvement in many regions for the past 30 years (figure I.22). The exception is Latin America and the Caribbean, which has seen a broad-based decline in inequality since the early 2000s. This improvement can be largely attributed to the reduction in the earning gaps between skilled
9 The projections rely on the relationship between mean household income from surveys and national consumption per capita, as well as prospects for labour force participation.
10 These projections are generally consistent with the more pessimistic scenarios reported in Ravallion (2013) and Yoshida, Uematsu and Sobrado (2014) and Hoy and Sumner (2016).
Figure I.21Extreme poverty headcount ratios in 2012 and projections for 2030, holding inequality constant
Source: UN/DESA. * See Holland and Jayadev (2016)
for discussion of the forecast models. The 2030 projection is
based on the simple average of projections from the three
forecasting models presented. Projections are done at the
country level and aggregated for the region. Discrepancies at
the regional level in the three projections are less than 2
percentage points in all regions.
Percentage
0
10
20
30
40
50
World Developingcountries
Africa East Asia South Asia Latin Americaand the Caribbean
LDCs
2012
2030*

27Chapter I. Global economic outlook
and low-skilled workers — a result of expanding basic education — and significant changes in labour and social policies, including an increase in public transfers.11
Hoy and Sumner (2016) argue that there are sufficient public resources at the natio-nal level — at least in upper middle income countries — to end three-quarters of extreme global poverty even in the absence of acceleration in economic growth. While Ravallion (2009) concluded that the marginal tax rates needed to fund the fight against poverty in the mid-2000s were prohibitively high, updated estimates by Hoy and Sumner (2016) suggest that this may no longer be the case. According to the study, many national Gov-ernments in developing countries have the financial capacities to support those in extreme poverty through well-targeted cash transfers, funded either via new taxation on those not facing poverty or through the reallocation of public spending away from fossil fuel subsi-dies or military spending. The scope for poverty reduction via tax funded public transfers remains — for the most part — restricted to upper middle income countries12 and will do little to redress the persistently high rates of poverty in the LDCs. However, the removal of fossil fuel subsidies — which often disproportionately benefit rich and middle-class households — could provide national resources to reduce extreme poverty levels in several of the LDCs as well.
Without accelerated GDP growth and progress towards improving income inequa-lity, eradicating the high levels of extreme poverty in the least developed economies by 2030 will remain a formidable challenge. While policies aimed at reducing inequality must
11 For more detailed discussions, please refer to López-Calva and Lustig (2010). 12 It is estimated that a marginal tax rate of less than 10 per cent would be sufficient to support the
tax-funded public transfers in upper middle income countries.
Reallocation of public spending can strengthen support for poverty reduction in many developing countries
Eradicating extreme poverty will require commitments to share prosperity both within and across national borders
Figure I.22Evolution of income distribution, by region, 1984–2014
Source: UN/DESA, based on data from the Global Consumption and Income Project. Note: The box plots used here are standard box plots. The ends of the whiskers indicate the highest (lowest) observations within 1.5 interquartile range of the third (first) quartile.
Gini coefficient
Europe and Central Asia
North America
East and South Asia
Latin America and the
Caribbean
Middle East and North
Africa
Sub-Saharan Africa
1984
1994
2004
2007
2014
1984
1994
2004
2007
2014
1984
1994
2004
2007
2014
1984
1994
2004
2007
2014
1984
1994
2004
2007
2014
1984
1994
2004
2007
2014
.8
.6
.4
.2
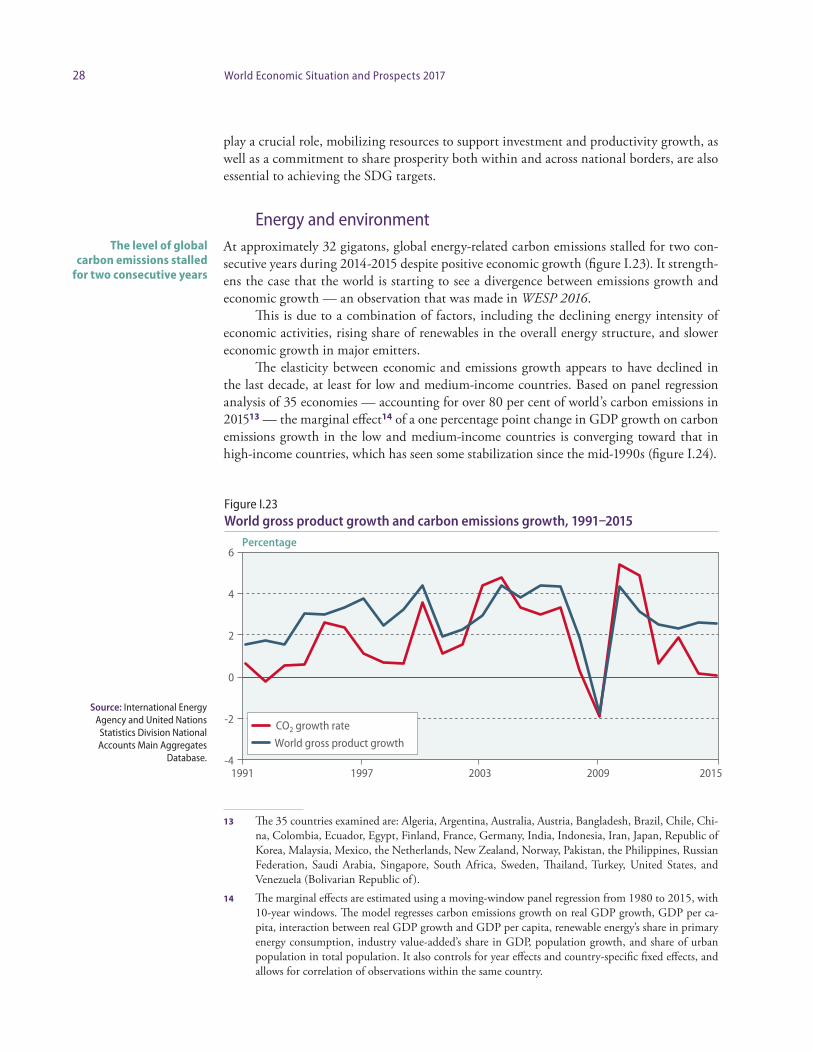
28 World Economic Situation and Prospects 2017
play a crucial role, mobilizing resources to support investment and productivity growth, as well as a commitment to share prosperity both within and across national borders, are also essential to achieving the SDG targets.
Energy and environmentAt approximately 32 gigatons, global energy-related carbon emissions stalled for two con-secutive years during 2014-2015 despite positive economic growth (figure I.23). It strength-ens the case that the world is starting to see a divergence between emissions growth and economic growth — an observation that was made in WESP 2016.
This is due to a combination of factors, including the declining energy intensity of economic activities, rising share of renewables in the overall energy structure, and slower economic growth in major emitters.
The elasticity between economic and emissions growth appears to have declined in the last decade, at least for low and medium-income countries. Based on panel regression analysis of 35 economies — accounting for over 80 per cent of world’s carbon emissions in 201513 — the marginal effect14 of a one percentage point change in GDP growth on carbon emissions growth in the low and medium-income countries is converging toward that in high-income countries, which has seen some stabilization since the mid-1990s (figure I.24).
13 The 35 countries examined are: Algeria, Argentina, Australia, Austria, Bangladesh, Brazil, Chile, Chi-na, Colombia, Ecuador, Egypt, Finland, France, Germany, India, Indonesia, Iran, Japan, Republic of Korea, Malaysia, Mexico, the Netherlands, New Zealand, Norway, Pakistan, the Philippines, Russian Federation, Saudi Arabia, Singapore, South Africa, Sweden, Thailand, Turkey, United States, and Venezuela (Bolivarian Republic of ).
14 The marginal effects are estimated using a moving-window panel regression from 1980 to 2015, with 10-year windows. The model regresses carbon emissions growth on real GDP growth, GDP per ca-pita, interaction between real GDP growth and GDP per capita, renewable energy’s share in primary energy consumption, industry value-added’s share in GDP, population growth, and share of urban population in total population. It also controls for year effects and country-specific fixed effects, and allows for correlation of observations within the same country.
The level of global carbon emissions stalled
for two consecutive years
Figure I.23World gross product growth and carbon emissions growth, 1991–2015
Source: International Energy Agency and United Nations Statistics Division National Accounts Main Aggregates
Database.
Percentage
-4
-2
0
2
4
6
1991 1997 2003 2009 2015
CO2 growth rate
World gross product growth

29Chapter I. Global economic outlook
The continued rise in renewable energy investment has significantly contributed to the decline in the elasticity between economic growth and emissions growth. Global renewable energy investment (excluding large hydro-electric projects) hit a new record in 2015, totaling $285.9 billion (figure I.25). Notably, developing countries have — for the first time — surpassed developed economies in new renewables investment. China leads the trend with investment of $102.9 billion in 2015, which accounted for 36 per cent of global new renewables investment in that year.
Approximately 134 gigawatts of renewable power capacity (excluding large hydro) were commissioned globally in 2015, meaning that renewables account for over 50 per cent of all newly installed power generation capacity for the first time. Renewable ener-gy (excluding large hydro), however, still accounts for only 16.2 per cent of global power capacity and 10.3 per cent of global power generation. The current share of renewables in global power generation is thought to have prevented the emission of 1.5 gigatons of carbon dioxide-equivalent, i.e. 4.7 per cent of total carbon emissions in 2015 (Frankfurt School–UNEP Centre/BNEF, 2016).
Despite significant progress in 2015, the early 2016 data indicates a slowdown in renewables investment. In the first half of 2016, new renewables investment in clean energy dropped by around 23 per cent year-over-year.15 Around half of the year-over-year decline in clean energy investment in the first half of 2016 can be attributed to China, which is fac-ing weak electricity demand and uncertainty regarding the country’s feed-in tariff policy, which pays users for generating their own sustainable energy. At the global level, the weaker investment also partly reflects the sustained low fossil-fuel energy prices, which might start to weigh on renewables investment.
15 Bloomberg New Energy Finance. Clean energy investment differs from renewable energy investment, as the former also include low carbon services (e.g. carbon markets) and energy smart technologies (e.g. energy storage and fuel cells). Renewable energy investment accounts for around 82 per cent of global clean energy investment in 2015.
The level of new renewable energy investment in developing countries surpassed that of developed countries in 2015
Despite advancements, renewable energy still only accounts for a small share of global power generation
New renewable investment dropped sharply in the first half of 2016
Figure I.24Marginal effect of one percentage point change in GDP growth on carbon emissions growth, 1980–2015
Source: UN/DESA staff estimation.
Percentage
0
0.3
0.6
0.9
1980
-198
9
1981
-199
0
1982
-199
1
1983
-199
2
1984
-199
3
1985
-199
4
1986
-199
5
1987
-199
6
1988
-199
7
1989
-199
8
1990
-199
9
1991
-200
0
1992
-200
1
1993
-200
2
1994
-200
3
1995
-200
4
1996
-200
5
1997
-200
6
1998
-200
7
1999
-200
8
2000
-200
9
2001
-201
0
2002
-201
1
2003
-201
2
2004
-201
3
2005
-201
4
2006
-201
5
Countries with income levels at the 25th percentileCountries with income levels at the 50th percentileCountries with income levels at the 75th percentile

30 World Economic Situation and Prospects 2017
The world is still some distance from achieving a sustained decoupling between eco-nomic growth and carbon emissions growth and ensuring sustainable consumption and production patterns (SDG 12). While China’s carbon emissions have stabilized in the past two years, other developing countries are still seeing them rise. The improvements witnessed in recent years could easily reverse if there is a lack of concerted effort from the public and private sectors to improve energy efficiency and promote renewable energy. There must be international cooperation on clean technology transfer and climate finance. Countries will have to continue to pursue nationally-appropriate low-carbon development paths that are sustainable on economic, social and environmental fronts.
Major uncertainties and risks in the global economy Uncertainties about major changes in the international policy environment
There is considerable uncertainty related to the evolution of international policy. For exam-ple, the new Administration in the United States has discussed far-reaching changes to the current direction and stance in policy related to macroeconomics, trade, immigration, for-eign affairs and the environment, as well as the nature of its participation in multilateral or-ganizations and institutions. Should some of these changes be implemented, the substantial economic impact would mostly manifest itself beyond the forecasting period of this report, but heightened uncertainty could weigh on investment decisions in the short-term as well. This uncertainty may also trigger capital withdrawal from developing economies with open capital markets, such as Mexico, South Africa and Turkey, in a general “flight to safety”.
Some measures recently proposed by the incoming Administration in the United States may have the potential to accelerate GDP growth in the short-run, such as a large expansion of infrastructure investment coupled with significant cuts in taxation, although it is not clear whether Congress would agree to the rise in government debt levels that such a move would entail. The introduction of ad hoc tariff barriers to some important trade partners, such as China and Mexico, on the other hand, would be counterproductive and slow economic growth, especially if such actions trigger retaliatory measures that could potentially spread to other countries.
Any backtracking in energy and environmental policy may endanger the environ-mental targets in the SDGs and the Paris Agreement on climate change.
Without further efforts to improve energy
efficiency and promote renewable energy, recent
progress could reverse
The new Administration in the United States has
proposed policy changes in a number of spheres
The potential economic impact of any new measures remains
unclear
Figure I.25Global new investment in renewable energy, 2004–2015
Source: Frankfurt School-UNEP Centre/BNEF (2016).
Billions of United States dollars
0
100
200
300
2004 2005 2006 2007 2008 2009 2010 2011 2012 2013 2014 2015
Developed economiesDeveloping economies
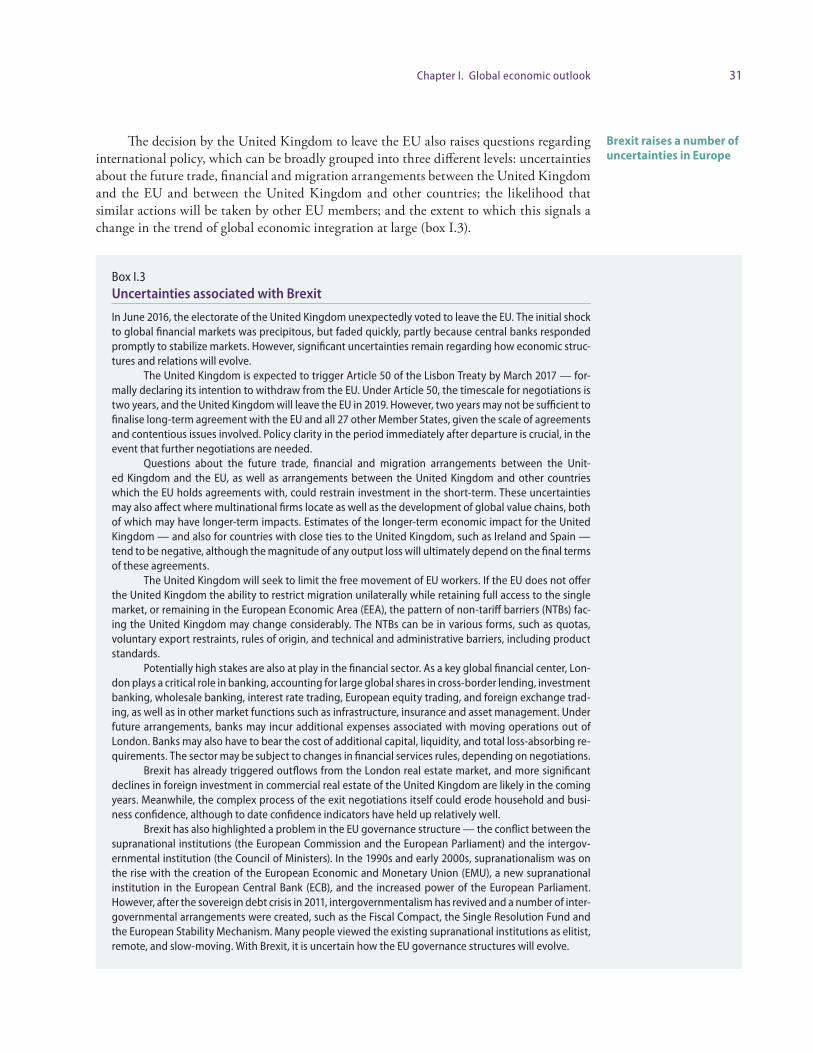
31Chapter I. Global economic outlook
The decision by the United Kingdom to leave the EU also raises questions regarding international policy, which can be broadly grouped into three different levels: uncertainties about the future trade, financial and migration arrangements between the United Kingdom and the EU and between the United Kingdom and other countries; the likelihood that similar actions will be taken by other EU members; and the extent to which this signals a change in the trend of global economic integration at large (box I.3).
Brexit raises a number of uncertainties in Europe
Box I.3 Uncertainties associated with Brexit
In June 2016, the electorate of the United Kingdom unexpectedly voted to leave the EU. The initial shock to global financial markets was precipitous, but faded quickly, partly because central banks responded promptly to stabilize markets. However, significant uncertainties remain regarding how economic struc-tures and relations will evolve.
The United Kingdom is expected to trigger Article 50 of the Lisbon Treaty by March 2017 — for-mally declaring its intention to withdraw from the EU. Under Article 50, the timescale for negotiations is two years, and the United Kingdom will leave the EU in 2019. However, two years may not be sufficient to finalise long-term agreement with the EU and all 27 other Member States, given the scale of agreements and contentious issues involved. Policy clarity in the period immediately after departure is crucial, in the event that further negotiations are needed.
Questions about the future trade, financial and migration arrangements between the Unit-ed Kingdom and the EU, as well as arrangements between the United Kingdom and other countries which the EU holds agreements with, could restrain investment in the short-term. These uncertainties may also affect where multinational firms locate as well as the development of global value chains, both of which may have longer-term impacts. Estimates of the longer-term economic impact for the United Kingdom — and also for countries with close ties to the United Kingdom, such as Ireland and Spain — tend to be negative, although the magnitude of any output loss will ultimately depend on the final terms of these agreements.
The United Kingdom will seek to limit the free movement of EU workers. If the EU does not offer the United Kingdom the ability to restrict migration unilaterally while retaining full access to the single market, or remaining in the European Economic Area (EEA), the pattern of non-tariff barriers (NTBs) fac-ing the United Kingdom may change considerably. The NTBs can be in various forms, such as quotas, voluntary export restraints, rules of origin, and technical and administrative barriers, including product standards.
Potentially high stakes are also at play in the financial sector. As a key global financial center, Lon-don plays a critical role in banking, accounting for large global shares in cross-border lending, investment banking, wholesale banking, interest rate trading, European equity trading, and foreign exchange trad-ing, as well as in other market functions such as infrastructure, insurance and asset management. Under future arrangements, banks may incur additional expenses associated with moving operations out of London. Banks may also have to bear the cost of additional capital, liquidity, and total loss-absorbing re-quirements. The sector may be subject to changes in financial services rules, depending on negotiations.
Brexit has already triggered outflows from the London real estate market, and more significant declines in foreign investment in commercial real estate of the United Kingdom are likely in the coming years. Meanwhile, the complex process of the exit negotiations itself could erode household and busi-ness confidence, although to date confidence indicators have held up relatively well.
Brexit has also highlighted a problem in the EU governance structure — the conflict between the supranational institutions (the European Commission and the European Parliament) and the intergov-ernmental institution (the Council of Ministers). In the 1990s and early 2000s, supranationalism was on the rise with the creation of the European Economic and Monetary Union (EMU), a new supranational institution in the European Central Bank (ECB), and the increased power of the European Parliament. However, after the sovereign debt crisis in 2011, intergovernmentalism has revived and a number of inter-governmental arrangements were created, such as the Fiscal Compact, the Single Resolution Fund and the European Stability Mechanism. Many people viewed the existing supranational institutions as elitist, remote, and slow-moving. With Brexit, it is uncertain how the EU governance structures will evolve.

32 World Economic Situation and Prospects 2017
From a global perspective, the shifting direction of policy in the United States and the United Kingdom partly reflects increasing discontent with the imbalanced distribution of the burdens and gains that deepening global economic integration has brought in the past few decades. For example, more open international trade has indeed generated substantial economic gains for many countries through improved efficiency in allocating resources worldwide. At the same time, more open trade has been associated with widening income inequality in many countries, along with job losses and declining wages for certain cate-gories of workers, although these developments also reflect factors such as technological progress. These concerns have enhanced the appeal of protectionism and inward-looking policies in many countries. More concerted international efforts to improve global gov-ernance, along with more effective domestic redistribution policies, are needed to ensure that the gains from global economic integration are more inclusive. In the absence of such efforts, protectionist tendencies may escalate, which could prolong the slow growth in the world economy and lead to a less-efficient allocation of resources and slower pace of tech-nological diffusion.
Uncertainties and risks associated with unconventional monetary policy
Developed economies continue to rely heavily on monetary policy to support their mac-roeconomic objectives. As the scope for conventional monetary stimulus was to a large extent exhausted when interest rates were cut to near zero levels in the aftermath of the global financial crisis, central banks have made greater use of unconventional policy, such as quantitative and qualitative easing, negative interest rate policies and yield curve targeting. Proposals have also been made to explore new tools such as “helicopter money”, which is essentially a fiscal expansion financed by a central bank. The longer-term impacts of these measures, which have limited historical precedence, remain unclear.
Currently, at least six central banks (five in Europe, plus Japan), with the GDP of these economies accounting for 25 per cent of the world total, have set negative policy inter-est rates. Moreover, the yields of many long-term bonds, which are not set by central banks but determined by capital markets, are also below zero. This shows investors are willing to accept a loss by holding these bonds, as the price paid by investors today is greater than the interest payments and principle repayment in the future.
Negative policy rates in these economies have produced some intended effects through interest rate, credit, portfolio, and exchange rate channels — declines in money market rates and lower bank lending rates, although inflation expectation continued to decline in these countries. However, in the longer run, a number of risks are associated with the neg-ative policy rates and yields on longer term bonds.
If central banks hold negative policy rates for a protracted period and/or push rates further below zero, risks to financial stability could escalate. Financial insti tutions rely on lending at higher rates than they borrow. As central bank deposit rates drop below zero, there may be contrac tual or market constraints on the ability to pass these negative inter-est rates on to customers. This would erode the profitability of banks and other financial intermediaries, undermining their financial resilience and curbing their lending capacity.
Moreover, the negative yields on longer term bonds, as well as the broad low inter-est rate environment, pose risks to the solvency of certain types of financial institutions, including insurance companies and pension funds (IMF, 2016b). The business models of
Should protectionism escalate, it could prolong
slow growth in the world economy
Several central banks in Europe and Japan have
introduced negative interest rate policies
An extended period of negative interest rates
may erode bank profits and tighten lending
conditions, rather than encourage bank lending
as intended
33Chapter I. Global economic outlook
insurance companies are very sensitive to low interest rates. During 2016, equity prices for many insurance companies declined more than that of other sectors and credit default swap spreads for these companies increased. A rising systemic risk of the insurance sector could trigger contagion to the broader financial sector.
Risks associated with debt overhang in emerging economiesThe significant rise of corporate debt in emerging markets in recent years has emerged as an important risk to the global growth outlook. This trend has been largely driven by loose financing conditions in the post-crisis period, facilitated by capital inflow seeking higher-yield assets. Some of the larger developing economies, including China, have con-tinued to see rising leverage in non-financial firms in recent years. Rising leverage does not necessarily pose a risk if it reflects the deepening of financial markets, which is natural as economies progress. However, in some cases — most recently especially in firms operating in commodity sectors — profitability has deteriorated in conjunction with the accumula-tion of debt, putting balance sheets on a more fragile footing. This has been associated with a rise in default rates among firms in some emerging markets, notably in Latin America and the Caribbean. If these pressures were to develop into a disorderly deleveraging process, this would expose banking sector fragilities with the potential to introduce banking sector stress.
In addition, productive investment in many developing countries has slowed in recent years, with much of the accumulated debt channeled into financial sector and real estate assets (see discussion in box III.1), escalating risks of assets bubbles, rather than boosting overall productivity.
Government debt has also risen in many developing countries, reflecting the deteri-oration of fiscal positions related to slower growth, subdued commodity prices and higher financing costs, especially in countries that have suffered sharp currency depreciations. For-eign currency-denominated debt has been gaining importance in pockets of the developing countries, leaving borrowers exposed to exchange rate risk. Since the United States dollar is expected to continue to strengthen as interest rate differentials relative to other developed economies widen, this will continue to raise the debt servicing burden in countries where significant levels of debt are issued in dollars.
Should widening interest rate differentials in the developed economies heighten financial volatility, including an abrupt depreciation in currencies of emerging economies, the risks associated with debt overhang in emerging economies would escalate.
Other risks to the outlookOther risks and uncertainties in the world economic prospects include banking sector fra-gilities, especially in Europe, but also in some developing and transition economies, which could trigger financial distress in response to a further squeeze on bank lending margins or rising defaults related to exchange rate shocks; the response to recovery in commodity prices, which could lead to a stronger pass-through to inflation than currently forecast; as well as the political, geopolitical and security risks which continue to weigh on regional prospects in many parts of the world.
On the upside, non-oil commodity prices have shown some signs of revival. If sus-tained, this recovery can be expected to ease the pressure on several countries, especially non-oil commodity exporters in Africa, which may trigger a recovery in investment and act
Loose financing conditions have encouraged a significant rise in corporate debt in emerging markets
The rise in foreign currency-denominated debt may pose risks as the US dollar strengthens

34 World Economic Situation and Prospects 2017
as an upside risk to the regional prospects. However, as much of the upward pressure on commodity prices has been related to supply pressures, for example due to the impact of El Niño on agriculture, and the suspension of production in certain metal industries, the rise in commodity prices may have a greater impact on inflation than on aggregate demand.
Policy challenges Reorienting towards a more effective policy mix
The macroeconomic policy stances discussed in the Appendix to this chapter are mostly based on the policy announcements made by the authorities of individual countries. These policy stances are, however, not necessarily the optimal options for these economies, nor for the global economy as whole. They may not be sufficient to extricate the world economy from the protracted quagmire of subdued growth, stagnated trade flows, feeble investment, flagging productivity, rising inequality and ballooned debt levels in the aftermath of the global crisis.
In order to restore the global economy to a healthy growth trajectory over the medium-term, as well as tackle poverty, inequality and climate change, policy measures need to target a wide range of objectives, including, for example, improving education; investing in worker training; promoting investment, including in inclusive and resilient infrastructure, social protection and green technology; and progressive reform of the regu-latory environment.
Currently, many economies depend excessively on monetary policy alone to support their objectives. Although it played an important role in the aftermath of the global crisis and remains an important policy tool, a much broader approach is needed, incorporating a more effective use of fiscal policy (box I.4), as well as moving beyond policies of demand management to include structural reforms. As revealed at the Hangzhou G20 Summit, there is a consensus on the need for a more balanced policy mix in the global economy.
A much broader policy toolkit is demanded, adapted as appropriate to country cir-cumstances. For example, structural reforms to the business environment can increase transparency in administrative processes and support effective protection of property rights. A broader use of income policy may be introduced to tackle inequalities and sustain demand, as well as active labour market policies to support vulnerable or marginalized sectors of the labour market. Micro- and macro-prudential policies can be employed to contain financial risks while supporting inclusive access to finance, especially for small- and medium-sized firms, while financial regulation and incentives along the investment chain should encourage long-term and sustainable investment, including in green technology and environmental protection. Finally, industrial policies can remedy market failures and science and technology polices may be introduced to increase investments in R&D and foster innovation.
Weak growth, rising inflationary pressures and low commodity prices have com-plicated the conduct of policy in many commodity-exporting developing economies and economies in transition, notably in Africa, the CIS and Latin America and the Caribbean. Several countries have introduced pro-cyclical interest rate rises to stem capital outflows, mitigate currency depreciation, and contain rising inflation, at the expense of higher bor-rowing costs that weigh on domestic activity.
Low global commodity prices have also intensified fiscal pressures in commodity- dependent economies. As a result, cutbacks or delays occurred in much needed investment
Policy measures must target a wide range
of objectives to meet the economic, social
and environmental dimensions of
sustainable development
A more balanced policy mix is needed, moving
beyond excessive reliance on monetary
policy
Fiscal and monetary policy space is restricted
in many commodity-exporting economies

35Chapter I. Global economic outlook
Box I.4 Measuring fiscal space
While the term “fiscal space” is widely used by government officials and economists alike, there is no clear consensus on its definition and measurement. The most widely-used definition provided by Heller (2005) describes fiscal space as the “availability of budgetary room that allows a government to provide resources for a desired purpose without any prejudice to the sustainability of a government’s financial position.” Other definitions of fiscal space focus more specifically on countries’ potential to expand their financing capacity in support of pursuing development objectives (Roy and others, 2009).
Given the lack of a clear and unique definition, a range of alternative measures have been pro-posed. Conventional measures rely on the concept of debt sustainability, defining fiscal space as the distance between the current levels of public debt and estimated sustainable public debt levels. Three of the most common and widely used approaches to estimate a country’s sustainable debt level are:
1. The median or mean debt-to-GDP ratio of a defined group of countries, e.g. regional groups or income groups, which are associated with the country of interest (World Bank, 2015).
2. The classic approach of calculating the present discounted value of all future projected pri-mary balances of a country (IMF, 2013). Debt levels below that level would be considered sus-tainable.
3. The ability-to-pay model, which estimates a non-linear response function of the primary bal-ance to public debt levels and an effective interest payment schedule that depends on public debt levels (Ghosh and others, 2013). Within this framework, sustainable debt levels are de-fined as those beyond which the primary balance adjustment would not be sufficient to offset growing debt service.
An alternative fiscal space measure is de facto fiscal space (Aizenman and Jinjarak, 2010), defined as the ratio of the public debt level to the “de facto tax base”, or the number of tax years a Government needs to repay its debt. This differs fundamentally from conventional fiscal space measures in that it does not involve estimation of sustainable debt levels.
It is perhaps not surprising that estimates of fiscal space vary significantly with the methodology that is used. We illustrate this by applying the following four measures to a sample of 27 economies:
1. Gross general government debt; 2. De facto fiscal space; 3. Ability-to-pay-model fiscal space; and 4. Effective ability-to-pay-model fiscal space. This measure corresponds to the ability- to-
pay-model fiscal space scaled by a country-specific fiscal multiplier based on the most recent estimates found in the literature. The motivation for this adjustment is to capture the main ob-jective of fiscal space assessments, namely measuring the fiscal capacity to support economic growth.
For each of these four measures, figure I.4.1 depicts an economy’s percentage deviation from the group mean of the 27 selected economies. It is evident that for a number of economies, not only the rel-ative distance from the group mean changes with the fiscal space measures, but also the ordinal position in the group. The latter is particularly the case for countries in the middle of the pack.
Countries with higher public debt-to-GDP ratios do not necessarily have smaller fiscal space ac-cording to the ability-to-pay model. For example, Singapore and the United States have bigger ability- to-pay-model fiscal space than many economies with lower public debt-to-GDP ratio. This can at least partly be attributed to their relatively sanguine economic outlook and institutional stability. When taking fiscal spending effectiveness into account, further changes to the landscape can be seen.
According to the effective ability-to-pay-model, the United States has considerable fiscal space, whereas Singapore has effectively none. This result stems from the significant differences in the two countries’ estimated fiscal multipliers and underscores the fact that a Government has a much weaker case to engage in fiscal stimulus if its estimated fiscal multiplier is small or, as in the case of Singapore, even negative. De facto fiscal space often paints a different picture than the other measures since it mainly reflects a Government’s revenue collection capacity.
(continued)

36 World Economic Situation and Prospects 2017
in infrastructure, social protection and social services, energy and transport. This has in turn constrained productivity growth and undermined social and environmental progress.
In order to achieve the SDGs, policy makers will need to step up efforts. Garnering the resources required to finance investment levels needed to put the LDCs on a more rapid growth path remains a key challenge. Tackling the high levels of poverty requires acce-lerating medium-term growth and implementing redistributive policies to address multi- dimensional inequalities. Governments, particularly in developing countries, need to augment public investments in education, health and infrastructure to ensure that those with low-in-come enjoy equal opportunities for a decent livelihood. With private financing and domes-tic resource mobilisation limited by structural factors, additional concessional internatio-nal public financing is needed to support developing countries (see chapter III for further discussion).
Enhancing international policy coordination under the new 2030 Agenda
The year 2016 marked the beginning of the implementation of the 2030 Agenda for Sus-tainable Development, which includes 17 SDGs and 169 targets, cross-cutting economic, social and environmental dimensions of sustainable deve lopment.
Additional concessional international public
financing may be needed to ensure LDCs reach
the levels of investment needed to achieve
the SDGs
This simple empirical exercise illustrates that relying on any single fiscal space measure leads to an incomplete, and potentially biased assessment of the fiscal resources available to a Government. A comprehensive approach to assess fiscal space for policy decisions would instead require a scoreboard of measures. Such a scoreboard should not only include the above-mentioned measures — along with some modifications — but other indicators that capture important aspects of fiscal sustainability. This includes, for example, the extent to which a country issues debt in its own sovereign currency, the geo-graphical composition of debt and the determinants of interest rates.
Figure I.4.1A comparison of different fiscal space measures in 2014
Source: UN/DESA calculations, based on data from IMF
(2016a), Moody’s Analytics, and estimates of country-specific fiscal multipliers taken from
the literature. Note: The signs on the
percentage deviation of each economy’s gross general
government debt-to-GDP ratio and de facto fiscal space
from the group mean have been reversed to ensure
comparability with the other two measures.
See Table J in the Statistical Annex for definitions of
country codes.
-300
-200
-100
0
100
200
HKG NZL
AUS
KOR
SWE
DN
KCH
EFI
NIS
RN
LDM
LTD
EU ISL
AUT
CAN
GBR FR
AES
PSG
PU
SA BEL
CYP
IRL
PRT
ITA
GRC JP
N
Percentage deviation from group mean
Gross general government debt-to-GDP ratio
De facto fiscal spaceAbility-to-pay-model fiscal space
Effective ability-to-pay-model fiscal space
Authors: Hoi Wai Cheng and Ingo Pitterle
Box I.4 (continued)
37Chapter I. Global economic outlook
It is imperative to recognize that any efforts to revitalize global economic growth, attain full employment and maintain macroeconomic stability are integral to overall efforts to implement the 2030 Agenda. Sustained, inclusive and sustainable growth, full employ-ment and macroeconomic stability are already included in the SDGs. Therefore, macro-economic policy measures to support economic growth should be integrated with social and environmental policies so as to promote balanced achievement of the SDGs. These issues were recognized at the Hangzhou G20 Summit, where the need for deeper interna-tional policy coordination in the areas discussed below was duly stressed.
While a systematic integrative policy approach to realising the 2030 Agenda can only be developed through the engagement of Member States and international organizations in years to come, some ad hoc measures can be taken to improve international policy coher-ence and consistency in a number of areas.
Boosting international trade
International trade will not revive independently of a recovery in aggregate demand. How-ever, the process can be encouraged through a number of measures at the global and the national levels.
The central role of the World Trade Organization (WTO) in the global economy must be strengthened. As the WTO provides a unique rules-based, transparent, non-discrimina-tory, open and inclusive multilateral trading system, its central role should be strengthened through the conclusion of the negotiations on the Doha Development Agenda. Concerted efforts should be made to curb the rising number of restrictive measures on trade in goods and services since the global financial crisis, and to roll back old protectionist measures, subsidies and tariffs that are particularly damaging to developing countries’ exports.
WTO members should expedite the implementation of the Trade Facilitation Agree-ment (TFA), in order to lower global trade costs. In this regard, international efforts are needed to provide capacity building and technical assistance for developing countries in their implementation of TFA.
International coordination is needed to ensure consistency between trade, investment and other public policies so as to prevent the dismantling of GVCs, which have been impor-tant drivers of international trade and investment flows, and align the multilateral trading system with the 2030 Agenda for Sustainable Development, ensuring inclusive growth and decent work for all.
Accordingly, efforts are needed to support an open, transparent, and competitive services market, so as to facilitate the participation of service providers, especially from developing countries and low income countries in GVCs. Countries need to link their export-oriented sectors to the rest of the economy, developing backward, forward and income linkages, avoiding the generation of enclave economies.
International cooperative efforts are also needed to reduce trade financing gaps, which are found to be highest among the LDCs, notably in Africa, developing Asia and small island developing States, as well as small and medium-sized enterprises.
International cooperation on clean technology transfer and climate finance is also necessary. Countries will have to continue to pursue nationally-appropriate low-carbon development paths that are sustainable on economic, social and environmental fronts.
Macroeconomic policy measures to support economic growth should be integrated with social and environmental policies to promote balanced achievement of the SDGs
To ensure development concerns are addressed by the global trading system, a stronger role for the World Trade Organization is needed
International cooperation is needed to align the multilateral trading system with the SDGs, integrate export sectors with domestic economies and reduce trade financing gaps

38 World Economic Situation and Prospects 2017
Promoting infrastructure investment
Increased investment in sustainable and resilient infrastructure is a prerequisite for achiev-ing the 2030 Agenda, and at the same time can also stimulate short-term global growth and boost potential growth in the longer run.
In the AAAA, an integral part of the 2030 Agenda, countries agreed on actions to help overcome barriers to infrastructure investment on both the demand and supply sides. The Addis Agenda encourages long-term institutional investors to allocate a greater per-centage of their investment to infrastructure, particularly in developing countries. Policy frameworks should be geared toward long-term investment, so as to mitigate the risk that global efforts for increased investment in infrastructure will focus on a limited number of countries, and only on sectors with potential cash flows. Incentive structures of private investors need to be aligned with the long-term investment horizon necessary for many infrastructure projects.
Development banks play important roles in infrastructure investment. The Global Infrastructure Forum launched by the World Bank Group, in cooperation with other mul-tilateral development banks (MDBs) and UN-DESA in April 2016 can help coordinate the efforts among MDBs, so that they can work together on infrastructure financing in project preparation and improving data and information, keeping their focus on LDCs and ensur-ing resilient and sustainable infrastructure investment.
In addition, international policy cooperation and coordination need to be strength-ened in international public finance and official development assistance (ODA), interna-tional tax cooperation, illicit financial flows, global financial safety nets, governance reform of the International Monetary Fund (IMF) and World Bank Group as well as refugees and migrants.
Building sustainable and resilient infrastructure requires a realignment of incentives to ensure
that investment is widespread across
countries and sectors

39Chapter I. Global economic outlook
Appendix
Global assumptions
Baseline forecast assumptionsThis appendix summarizes the key assumptions underlying the baseline forecast, includ ing monetary and fiscal policies for major economies, exchange rates for major currencies and the international prices of oil. Key assumptions include:
• The United States Federal Reserve Board (Fed) will raise its policy rate by 50 basis points and 75 basis points in 2017 and 2018, respectively.
• The price of Brent crude oil is projected to average $52 per barrel in 2017 and $61 per barrel in 2018.
• Most major currencies are expected to depreciate against the US dollar in 2017-2018.
Monetary policyMonetary policy in major developed economies is expected to remain broadly accommo-dative in 2017-2018, despite further divergence in interest rates among these economies (figure I.A.1).
Percentage
-0.5
0.0
0.5
1.0
1.5
2.0
Mar
201
2
Sep
2012
Mar
201
3
Sep
2013
Mar
201
4
Sep
2014
Mar
201
5
Sep
2015
Mar
201
6
Sep
2016
Mar
201
7
Sep
2017
Mar
201
8
Sep
2018
European Central Bank main refinancing operationsFed funds target rateBank of Japan policy rate
Source: National central banks and UN/DESA forecast assumptions.
Figure I.A.1Key policy rates, March 2012–December 2018
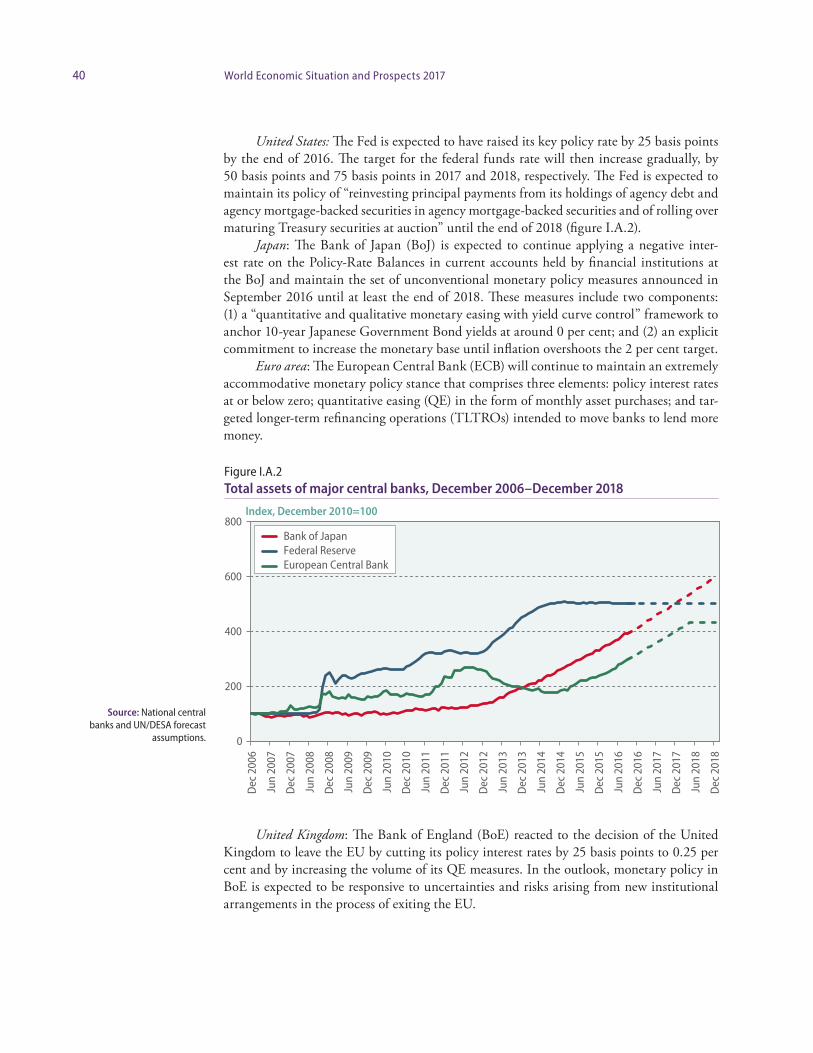
40 World Economic Situation and Prospects 2017
United States: The Fed is expected to have raised its key policy rate by 25 basis points by the end of 2016. The target for the federal funds rate will then increase gradually, by 50 basis points and 75 basis points in 2017 and 2018, respectively. The Fed is expected to maintain its po licy of “reinvesting principal payments from its holdings of agency debt and agency mortgage-backed securities in agency mortgage-backed securities and of rolling over maturing Treasury securities at auction” until the end of 2018 (figure I.A.2).
Japan: The Bank of Japan (BoJ) is expected to continue applying a negative inter-est rate on the Policy-Rate Balances in current accounts held by financial institutions at the BoJ and maintain the set of unconventional monetary policy measures announced in September 2016 until at least the end of 2018. These measures include two components: (1) a “quantitative and qualitative monetary easing with yield curve control” framework to anchor 10-year Japanese Government Bond yields at around 0 per cent; and (2) an explicit commitment to increase the monetary base until inflation overshoots the 2 per cent target.
Euro area: The European Central Bank (ECB) will continue to maintain an extremely accommodative monetary policy stance that comprises three elements: policy interest rates at or below zero; quantitative easing (QE) in the form of monthly asset purchases; and tar-geted longer-term refinancing operations (TLTROs) intended to move banks to lend more money.
United Kingdom: The Bank of England (BoE) reacted to the decision of the United Kingdom to leave the EU by cutting its policy interest rates by 25 basis points to 0.25 per cent and by increasing the volume of its QE measures. In the outlook, monetary policy in BoE is expected to be responsive to uncertainties and risks arising from new institutional arrangements in the process of exiting the EU.
Figure I.A.2Total assets of major central banks, December 2006–December 2018
Source: National central banks and UN/DESA forecast
assumptions. 0
200
400
600
800
Dec
200
6
Jun
2007
Dec
200
7
Jun
2008
Dec
200
8
Jun
2009
Dec
200
9
Jun
2010
Dec
201
0
Jun
2011
Dec
201
1
Jun
2012
Dec
201
2
Jun
2013
Dec
201
3
Jun
2014
Dec
201
4
Jun
2015
Dec
201
5
Jun
2016
Dec
201
6
Jun
2017
Dec
201
7
Jun
2018
Dec
201
8
Index, December 2010=100
Bank of JapanFederal ReserveEuropean Central Bank

41Chapter I. Global economic outlook
Monetary policy stances vary significantly among developing countries and econo-mies in transition. Figure I.A.3 illustrates the share of each major global region that has increased and reduced interest rates since the Federal Reserve’s first interest rate rise in December 2015.
There has been a clear tendency towards tightening in Africa and Latin America and the Caribbean, despite deteriorating economic prospects in these regions. In many cases (Angola, Azerbaijan, Egypt, Mexico, Mozambique, Namibia, Nigeria, South Africa and Sri Lanka), recent interest-rate increases followed sharp exchange-rate depreciations, and the rates of return for international investors have declined despite higher domestic interest rates. This leaves countries exposed to capital withdrawal, as investors seek higher rates of return elsewhere.
CIS: Most central banks in the CIS reduced interest rates during 2016 in view of slowing inflation; however, in the largest economies of the region, monetary easing will remain cautious.
East Asia: Policy rates across major economies in developing East Asia are approach-ing or have reached historic low levels. With few exceptions, there remains some — albeit limited — room for further rate cuts given the overall low inflationary environment. How-ever, central banks will remain sensitive to the potential impact on capital outflows, private sector leverage and bank profit margins. The People’s Bank of China (PBoC) is expected to make at most two 50 basis-point reserve requirement ratio cuts in 2017 and continue to pursue a prudent monetary stance. Credit growth will continue to outpace GDP growth in 2016-2018, but at a rate lower than in 2015.
South Asia: Monetary policy in South Asia continues to be moderately accommo-dative, on the back of subdued inflationary pressures and remaining output gaps in some economies. The accommodative stance is expected to continue in the forecast period, with further easing in some countries.
Figure I.A.3Global divergence in policy rates since December 2015
Source: UN/DESA.-0.6
-0.3
0.0
0.3
0.6
Latin America
DevelopingAsia
Africa Economiesin transition
Developedeconomies
Share
Share of region that raised ratesShare of region that cut rates
42 World Economic Situation and Prospects 2017
Western Asia: GCC countries will continue to follow the movement of the Fed, due to the pegging of their currencies to the dollar, and inject liquidity into the banking system through measures such as repurchase agreements. In Turkey, after cuts in interest rates in the second half of 2016, room for further monetary easing is limited in the face of the weak currency and high inflation.
Latin America and the Caribbean: The monetary tightening cycle in South America is mostly over and some easing is expected for 2017-2018. In Mexico, the central bank increased interest rates three times in 2016 as the peso tumbled to a record low, and further rate rises are likely.
Africa: In Africa, policy is expected to remain constrained by inflation and currency pressures in many economies. However, in some countries, including Botswana, Kenya and Morocco, where inflation is relatively low, some additional policy space is available to support growth. Nigeria removed its currency peg to the dollar in mid-2016 in an effort to alleviate severe foreign currency shortages and reduce price distortions in the economy. The Nigerian naira subsequently depreciated sharply, losing more than 40 per cent of its value over just a few months. Similarly, Egypt devalued its domestic currency by more than 30 per cent and announced a move to a more flexible exchange rate regime, as persistent for-eign currency shortages weighed on business activity and investor sentiments.
Fiscal policyFiscal policy in developed economies is expected to be somewhat less restrictive in 2017-2018, moving away from the tight fiscal austerity programmes that have been in place for the most part since 2010. A few countries have announced expansionary measures, includ-ing Australia, Canada and Japan.
United States: The new Administration has indicated an intention to significantly expand government investment in infrastructure and introduce substantial tax cuts for corporations. However, there is a lack of clarity and specificity at the time of writing. Given the uncertainty, the forecasts presented in this report are predicated on a broadly neutral fiscal stance in 2017-2018.
Japan: The new fiscal stimulus programme announced in mid-2016 is expected to increase spending by national and local governments by 7.5 trillion yen, which includes 4.6 trillion yen in additional spending in the 2016 fiscal year (FY2016). The additional spending allocated for FY2016 is equivalent to around 0.9 per cent of GDP and a 4.8 per cent expansion from the original government budget for the fiscal year. The Government has postponed the next consumption tax increase to 2019 at the earliest, and announced a significant expansion of public works spending.
EU: Fiscal policy in the EU maintains a tightening stance overall, given institutional requirements such as the excessive-deficit mechanism of the EU. However, the fiscal stance has become less restrictive for the most part. Some countries, such as Austria and Germany will see significant fiscal spending requirements in view of the large number of migrants and the challenge of integrating them into their societies and labour markets. In the United Kingdom, the decision to leave the EU has important implications for fiscal policy, with an expected increase in its budget deficit in coming years.
Among developing countries and economies in transition, fiscal policy stance contin-ues to vary significantly from region to region.

43Chapter I. Global economic outlook
CIS: Energy-exporting countries are expected to tighten government spending, while energy-importing countries will maintain largely a neutral or slightly expansionary fiscal stance. In the Russian Federation, while the budget for 2017-2019 is still under discussion, spending is likely to be reduced in nominal terms, implying an even deeper real contrac-tion. The authorities are planning to increase domestic borrowing and to mobilize house-hold savings to channel them into investment.
East Asia: The fiscal stance was mostly expansionary and countercyclical in 2015-2016, amid weak regional growth and limited room for furthering monetary easing. Chi-na is expected to maintain a mildly expansionary stance in 2017-2018, with more active intervention in infrastructure investment and promotion of new strategic industries. The on-budget deficit increased in 2016 and will remain at similar levels in 2017-2018. In addi-tion, significant fiscal support will also be provided through off-budget channels, such as policy banks, public-private partnership, and deployment of rising local government reve-nues from land sales.
South Asia: Fiscal policies are officially expected to be in a moderately tight stance in most economies, but in reality, some economies have implemented more expansionary policies. Budget deficits are expected to remain high in most economies. The region needs to increase its efforts to strengthen the tax base.
Western Asia: Fiscal policy is under consolidation in GCC countries, including signif-icant cuts in spending and subsidies and increases in taxes, as well as new issuance of debt. In October 2016, Saudi Arabia raised $17.5 billion in its first international bond issuance to finance its large budget deficit, which reached a record high of about 15 per cent of GDP in 2015. In some cases, privatization plans are also underway. The fiscal situation in con-flict-affected countries worsened in 2016, particularly in Iraq, the Syrian Arab Republic and Yemen. Meanwhile, weak revenue prospects continue in Jordan and Lebanon, and public debt levels look set to expand. Both countries continued to require international financial support for their efforts to accommodate Syrian refugees. In Turkey, fiscal policy is expect-ed to remain relatively tight.
Latin America and the Caribbean: Fiscal policy will remain tight in Latin America in the outlook period as Governments respond to lower commodity prices and macroeconom-ic imbalances. The fiscal adjustment will generally be gradual, to minimize the downward pressure on aggregate demand.
Africa: Persistently low commodity prices have intensified fiscal pressures in the com-modity-dependent economies. As a result, many African countries announced budget cuts or fiscal reform measures. For example, Algeria, Angola and the Congo announced signi-ficant budget cuts during 2016. Nigeria and Zambia have sought financial assistance from international organisations amid deterioration in their external and fiscal positions.
Exchange ratesThe dollar/euro exchange rate is assumed to average 1.112 in 2016, and to depreciate in line with the widening differential between ECB and Fed interest rates to 1.104 in 2017 and 1.079 in 2018.
The yen/dollar exchange rate is assumed to average 107.46 in 2016, 105.41 in 2017 and 105.99 in 2018.

44 World Economic Situation and Prospects 2017
The renminbi/dollar exchange rate is assumed to average 6.61 in 2016, 6.79 in 2017 and 6.92 in 2018.
Oil priceThe price of Brent crude oil is assumed to average $43 per barrel in 2016, $52 per barrel in 2017 and $61 per barrel in 2018.
Figure I.A.4Data and assumptions on major currency exchange rates
Figure I.A.5 Data and assumptions for the price of Brent crude
Source: IMF Exchange Rate Query Tool and UN/DESA
forecast assumptions.
Source: Energy Information Administration and UN/DESA
forecast assumptions.
0.9
1
1.1
1.2
1.3
1.4
1.5
Jan
2013
Apr 2
013
Jul 2
013
Oct
201
3
Jan
2014
Apr 2
014
Jul 2
014
Oct
201
4
Jan
2015
Apr 2
015
Jul 2
015
Oct
201
5
Jan
2016
Apr 2
016
Jul 2
016
Oct
201
6
2017
2018
Index, January 2013=1
€/$ indexYuan/$ indexYen/$ index2016 average2017 assumption2018 assumption
0
20
40
60
80
100
120
14020
1720
18
United States dollars per barrel
Brent price2016 average2017 assumption2018 assumption
Jan
2013
Apr 2
013
Jul 2
013
Oct
201
3
Jan
2014
Apr 2
014
Jul 2
014
Oct
201
4
Jan
2015
Apr 2
015
Jul 2
015
Oct
201
5
Jan
2016
Apr 2
016
Jul 2
016
Oct
201
6