InTech-Materials in Automotive Application State of the Art and Prospects

Prospects for Canada in the NAFTA Automotive Industry:
A Global Value Chain Analysis
Timothy Sturgeon (MIT), Johannes Van Biesebroeck (University of Toronto), and Gary Gereffi (Duke University),
Paper prepared for Industry Canada
March 14, 2007
i

Table of Contents INTRODUCTION .......................................................................................................................................................1 1) GLOBAL VALUE CHAINS IN THE AUTOMOTIVE INDUSTRY............................................................4 2) THE NORTH AMERICAN AUTOMOTIVE PRODUCTION SYSTEM..................................................11
A SHIFT TO THE SOUTH?..........................................................................................................................................16 3) THE GROWING IMPORTANCE OF LARGE SUPPLIERS.....................................................................22
VALUE CHAIN LINKAGES IN THE AUTOMOTIVE INDUSTRY .......................................................................................25 THE NEW GLOBAL SUPPLY BASE ..............................................................................................................................28 TRENDS IN PARTS PRODUCTION: THE RISE OF MEXICO AND CHINA..........................................................................31
4) CANADIAN AUTOMOTIVE FIRMS: LOCATION, SIZE, AND SPECIALIZATION ..........................37 THREE TRENDS ........................................................................................................................................................37 LOCATIONAL PATTERNS IN THE CANADIAN AUTOMOTIVE SUPPLY BASE..................................................................40 THE SIZE DISTRIBUTION OF CANADIAN AUTOMOTIVE SUPPLIERS.............................................................................48 SPECIALIZATION IN THE CANADIAN AUTOMOTIVE SUPPLY BASE .............................................................................50 CANADA’S POSITION IN THE AUTOMOTIVE GLOBAL VALUE CHAIN...........................................................................54
5) CONCLUSIONS AND RECOMMENDATIONS .........................................................................................59 BIBLIOGRAPHY......................................................................................................................................................62
Tables
TABLE 1. MOTOR VEHICLE PRODUCTION, SELECTED COUNTRIES, THOUSANDS OF UNITS, RANKED BY 1996-2005 AVERAGE ANNUAL GROWTH RATE ......................................................................................................................6
TABLE 2. SHARE OF APPARENT U.S. DEMAND MET BY U.S. PRODUCTION, NAFTA IMPORTS, AND IMPORTS FROM THE REST OF THE WORLD, 1989 - 2005......................................................................................................................14
TABLE 3. LIGHT VEHICLE PRODUCTION BY COUNTRY AND AUTOMAKER HOME REGION, 2005 AND 2010 PROJECTION...........................................................................................................................................................................17
TABLE 4. RECENTLY ANNOUNCED BIG 3 ASSEMBLY PLANT EMPLOYMENT CUTS IN NORTH AMERICA.......................19 TABLE 5. RECENT FOREIGN ASSEMBLY PLANT INVESTMENT IN THE NORTH AMERICA ...............................................20 TABLE 6. EXAMPLES OF JAPANESE PARTS SUPPLIER INVESTMENTS NEAR NISSAN’S ASSEMBLY PLANT IN
AGUASCALIENTES, MEXICO................................................................................................................................32 TABLE 7. AUTOMOTIVE PARTS EXPORTS TO THE UNITED STATES, $M, 1990 - 2005....................................................34 TABLE 8. CHINA, CANADA, AND MEXICO’S SHARE OF U.S. IMPORTS IN 1995 AND 2005, BY PART, RANKED BY
CHINA’S SHARE IN 2005......................................................................................................................................36 TABLE 9. CORRELATION BETWEEN DIFFERENT SECTORS OF THE NORTH AMERICAN AUTOMOTIVE INDUSTRY .............39 TABLE 10. CHANGING GEOGRAPHICAL EXPOSITION FOR CANADIAN SUPPLIERS...........................................................40 TABLE 11. PROVINCIAL DISTRIBUTION OF CANADIAN SUPPLIERS.................................................................................41 TABLE 12 THE CONCENTRATION OF PRODUCTION IN AUTOMOTIVE CLUSTERS ...........................................................42 TABLE 13. AUTOMOTIVE INDUSTRY RELATED ESTABLISHMENTS: WINDSOR-ESSEX COUNTY (2003) ..........................46 TABLE 14. PRIORITY AREAS INDICATED BY THE CANADIAN AUTOMOTIVE PARTNERSHIP COUNCIL (STATISTICS
INDICATE URGENCY OF REQUIRED ACTION ON A 0-10 SCALE) .............................................................................47 TABLE 15. DISTRIBUTION OF FIRMS, PLANTS, EMPLOYMENT, AND REMUNERATION BY EMPLOYEE SIZE CLASS (1994).49 TABLE 16. PUBLIC COMPANIES WITH A SUBSTANTIAL AUTOMOTIVE SPECIALIZATION LISTED ON THE TORONTO STOCK
EXCHANGE (2004-2006).....................................................................................................................................50 TABLE 17. CANADIAN PRESENCE ON THE LIST OF THE WORLD’S LARGEST AUTOMOTIVE PARTS SUPPLIERS .................55 TABLE 18. CANADIAN FIRMS IN TOP 150 OEM SUPPLIERS FOR NORTH AMERICA ........................................................56
ii

Figures
FIGURE 1. THE GEOGRAPHIC FRAGMENTATION OF VEHICLE PRODUCTION, 1975 – 2005...............................................5 FIGURE 2. THE NESTED GEOGRAPHIC AND ORGANIZATIONAL STRUCTURE OF THE AUTOMOTIVE INDUSTRY..............11 FIGURE 3. NORTH AMERICA’S FALLING RELATIVE IMPORTANCE IN GLOBAL VEHICLE PRODUCTION..........................12 FIGURE 4. NORTH AMERICAN VEHICLE ASSEMBLY PLANTS – BY LOCATION AND NATIONAL OWNERSHIP.................13 FIGURE 5. NET VEHICLE IMPORTS TO THE UNITED STATES FROM MEXICO, CANADA, AND COUNTRIES OUTSIDE OF
NORTH AMERICA, 1989 - 2005 ...........................................................................................................................15 FIGURE 6. NORTH AMERICAN PASSENGER CAR PRODUCTION, 1985 – 2005, MILLIONS OF VEHICLES...........................18 FIGURE 7. OUTSOURCING IN THE U.S. AUTOMOTIVE INDUSTRY, ASSEMBLY AND PARTS EMPLOYMENT, 1958-2002 ..23 FIGURE 8. INCREASING IMPORTANCE OF SUPPLIERS......................................................................................................24 FIGURE 9. MAJOR AUTOMOTIVE SUPPLIER BANKRUPTCIES, 1999 - 2006.....................................................................28 FIGURE 10. REGIONAL ORGANIZATION OF THE AUTOMOTIVE SUPPLY-BASE .................................................................33 FIGURE 11. RISING IMPORTANCE OF IMPORTS FROM LOW-WAGE (ASIAN) COUNTRIES..................................................35 FIGURE 12. RISING IMPORTANCE OF PARTS VERSUS ASSEMBLY IN CANADA AND THE UNITED STATES ........................38 FIGURE 13. CHANGING GEOGRAPHY OF AUTO PARTS SUPPLIERS, BY PLANT DENSITY...................................................44 FIGURE 14. BREAKDOWN OF THE AUTOMOTIVE PARTS SECTOR BY EMPLOYMENT SHARES (2003)................................51 FIGURE 15. BREAKDOWN OF THE AUTOMOTIVE PARTS SECTOR BY VALUE ADDED SHARES (2003) ...............................52 FIGURE 16. RELATIVE SPECIALIZATION AND PRODUCTIVITY PERFORMANCE OF CANADIAN PARTS SECTORS. ..............54 FIGURE 17. NATIONALITY COMPOSITION OF TOP NORTH AMERICAN SUPPLIERS (NATIONALITY OF PARENT) ...............58 FIGURE 18. LOCATION OF SUPPLIER HEADQUARTERS ...................................................................................................58
Acknowledgements
This paper benefited from excellent research assistance provided by Anne Bax and Kimberly Rogers from Duke University. Comments on an earlier draft from Industry Canada were extremely helpful. Responsibility for the content, however, rests with the authors.
Author Biographies
Gary Gereffi is Professor of Sociology and Director of the Center on Globalization,
Governance, and Competitiveness at Duke University (http://www.cggc.duke.edu/), where he
teaches courses in economic sociology, globalization and comparative development, and
international competitiveness. He received his B.A. degree from the University of Notre Dame
and his Ph.D. degree from Yale University. Gereffi has published six books and numerous
articles on business-government relations in various parts of the world. His books include:
Commodity Chains and Global Capitalism (Praeger Publishers, 1994); The Value of Value
Chains: Spreading the Gains from Globalisation (special issue of the IDS Bulletin, vol. 32, no. 3,
July 2001); and Free Trade and Uneven Development: The North American Apparel Industry
after NAFTA (Temple University Press, 2002). Gereffi's research interests deal with social and
iii

environmental certification in global industries, the competitive strategies of global firms, and
industrial upgrading in East Asia and Latin America. His major ongoing research projects are:
(1) industrial upgrading in East Asia, North America, and Eastern Europe/Central Asia; (2) a
book on global consolidation, using a global value chains perspective; (3) a study of the
emergence of public and private governance systems in the Americas; and (4) analyzing the
competitiveness of North Carolina industries in the global economy <see
http://www.soc.duke.edu/NC_GlobalEconomy/>.
Timothy J. Sturgeon is a Senior Research Affiliate at the Industrial Performance Center
(IPC) at the Massachusetts Institute of Technology (MIT); co-organizer of the Global Value
Chains Initiative (http://www.globalvaluechains.org); and Research Fellow at the Institute for
Technology, Enterprise, and Competitiveness at the Doshisha Management School in Kyoto,
Japan. Prior to these activities, Tim served as Executive Director of the IPC’s Globalization
Study, and Globalization Research Director for the International Motor Vehicle Program at the
Center for Technology, Policy and Industrial Development. Prior to this, he served as Director
of the MIT/Carnegie Mellon Project on Globalization and Jobs in the Automotive Industry,
funded by the Alfred P. Sloan Foundation. To support these activities, Tim has conducted
extensive field research in dozens of countries, with a focus on the automotive and electronics
industries.
Johannes Van Biesebroeck is an Assistant Professor of Economics at the University of
Toronto and a Faculty Research Fellow at the National Bureau of Economic Research. His work
on the automobile industry has been supported with grants by the Social Science and Humanities
Research Council, the Canadian Foundation for Innovation, and the Ontario Innovation Trust and
for his current research on supply chains he is a Network Researcher of AUTO21, the Canadian
Network of Centers of Excellence, and of the International Motor Vehicle Program in Boston.
He has served as a consultant on the automotive industry for Industry Canada and International
Trade Canada, most recently investigating the potential impact of the Free Trade Agreement with
South Korea. His papers on the automotive industry have appeared in international refereed
journals like the Review of Economic Studies, the Journal of Applied Econometrics, Assembly
Automation, and the Economic and Social Review.
iv

Introduction
The automotive industry is Canada’s most important manufacturing and export sector. In
2005, Canada’s automotive industry employed 7.7 percent of the manufacturing workforce and
accounted for nearly a third of manufactured goods exports. Canada’s twelve high-volume final
assembly plants directly employed more than 51,000 workers.1 More than two and a half million
vehicles were produced, valued at $69.8 billion, of which nearly 85% was exported.2 The
automotive parts sector is an even larger employer. In 2005, 97,000 workers, working in 941
establishments, produced $32.2 billion worth of original equipment and aftermarket auto parts,
components, and sub-systems. Although the trade surplus that Canada enjoyed in finished
vehicles, of $22.2 billion, was diminished by a $17.7 billion deficit in parts, local value added
stood at a robust $33.3 billion in 2003.3 The Canadian industry is heavily concentrated within
the province of Ontario.
In this paper, we examine trends in the North American automotive industry, and ask if
Canada’s historical comparative advantage in the industry is sustainable. The size and
importance of the automotive industry in Canada is a legacy of its historic ties to the “Big 3”
American automakers, General Motors, Ford, and Chrysler (now DaimlerChrysler), and
Ontario’s proximity to the traditional heartland of the U.S. industry in Michigan and its
surrounding Mid-western states. Canada had, and continues to have, marginally lower operating
costs than the United States and a strong industrial culture that attracts investment. But Mexico’s
integration into the North American production system, and the rise of the southern United States
as a new center of automotive production, has begun to erode this advantage. Because the North
American market is saturated, and comprised largely of sales of replacement vehicles, locational
shifts in production and employment within North America are essentially “zero-sum games,”
with some places losing out as others gain.
1 Automotive assembly plants in Canada are owned by CAMI, a joint venture between General Motors (GM) and Suzuki, DaimlerChrysler, Ford, GM, Honda, and Toyota. All 13 active assembly plants are located in Southern Ontario and a new Toyota facility is slated to open for production in 2008 in Woodstock, ON. 2 Unless otherwise noted, all figures are in Canadian dollars. 3 Automotive industry data are drawn from The Statistical Survey of Canada’s Automotive Industry, compiled annually by Industry Canada (see; http://strategis.ic.gc.ca/epic/site/auto-auto.nsf/en/am01934e.html). Sectoral trade and employment data are from Statistics Canada (see: http://www40.statcan.ca/l01/cst01/gblec04.htm and http://www40.statcan.ca/l01/cst01/econ40.htm).
1

These trends are long standing and well known. They have led Canada’s future
competitiveness in autos to be examined, and re-examined, on a regular basis. If the market
share of the Big 3 continues the fall, and the southward shift of the industry within the United
States continues — both very likely scenarios in our view — the Canadian industry could
eventually face more difficult times and even permanent decline.4 This uncertainty, along with
the importance of the industry in Canada, has attracted the attention of Canadian policy-makers
working to assure that the nation continues to provide good manufacturing jobs for its citizens
and maintains its positive balance of trade. This paper is intended to support this process.
The concept of “global value chains” (GVCs) provides us with our framework for
analysis (see www.globalvaluechains.org for more detail on this approach). 5 The scope of the
GVC framework includes the full value-added chain of activities in a given industry, from
product conception through production, distribution, and end use by consumers. The focus is on
which firms wield power within global industries, and how and why power might be shifting.
We also consider the location of value chain activities, and how these activities are linked.
GVC analysis identifies five ways that firms ‘govern’ the linkages between value chain
activities: 1) simple market linkages, governed by price; 2) modular linkages, where complex
information is codified, often digitized, and exchanged between firms according to industry
standard protocols; 3) relational linkages, where tacit information is exchanged between firms; 4)
captive linkages, where suppliers are provided with detailed instructions; and 5) linkages within
the same firm, governed by management hierarchy. Finally, the GVC framework takes into
account how institutions (unions, trade regulations, politics, etc.) help to shape an industry’s
geography. Taken together, these characteristics provide a comprehensive view of the forces
driving change in specific industries. The GVC approach can help to explain the locational
patterns of specific value chain activities by providing a forward-looking view of which
activities are firmly rooted in place, which activities can be easily relocated, and of the potential
for tight coordination of distant activities.
The GVC framework can be applied flexibly, depending on the characteristics that
prevail in specific industries. In examining the employment and economic development 4 It is expected that the profit margins of the three American producers will recover somewhat in the following years, see Conference Board of Canada (2006), but the market share losses are unlikely to be reversed in the short to medium term (details follow). 5 For a recent overview of this literature, see Gary Gereffi, John Humphrey, and Timothy Sturgeon, “The governance of global value chains,” Review of International Political Economy 12, 1 (February 2005): 78-104.
2

prospects of the automotive industry, we focus almost exclusively on the value chain activities of
design and production because these are elements of the chain that can be separated from end
markets. Employment in retail sales and after-sales service, though large (accounting for two-
thirds of auto sector employment in Canada in 2005, and three quarters in the United States), is
not mobile in this way, and can be more or less taken for granted in mature automotive markets.6
In addition, retailers (dealers) in the automotive value chain do not dictate the characteristics of
products or the activities of suppliers, as they do for some consumer goods. The key issues,
from a policy perspective, are if Canada can improve its position in automotive design and
production by capturing a larger share of global employment and shifting to higher value
activities in the chain.
For simplicity’s sake, GVC analysis commonly divides an industry into two broad types
of firms: ‘lead firms’ and ‘suppliers.’ Lead firms, at the very least, set product strategy, place
orders, and take financial responsibility for the goods and services that their supply chains churn
out. Lead firms can be ‘buyers,’ with no production of their own, or ‘producers.’ In the
automotive industry, lead firms, often referred to as ‘automakers’ or ‘OEMs’ (Original
Equipment Manufacturers), carry out most aspects of product design, the production of most
engines and transmissions, and nearly all vehicle assembly within their own facilities. As such
they are large employers and wield a huge amount of power in the chain. In GVC parlance,
value chains in the automotive are ‘driven’ by producers (Gereffi, 1994). Since the early 1990s,
however, the largest 20-30 suppliers in the industry have taken on a much larger role in the areas
of design, production, and foreign investment, shifting the balance of power in some small
measure away from lead firms toward suppliers.
Our paper is organized along the lines of this simplified value chain, with the analysis
divided between the assembly and parts sectors. Geographically, our analysis “drills down”
from the global level, to the level of the North American region, and finally to the level of
Canada. In Section 1 we describe the shifting geography of the global automotive industry, and
examine the ways that global, regional, national and local value chains are coming to be more
tightly integrated, and yet in other respects still remain separate. We then provide a series of
explanations for the strength of regional value chains in this industry. In Section 2, we develop a
detailed examination of the regional production system in North America. We highlight the
6 An exception is “after-market” parts production, which we include in our analysis of the automotive supply-base.
3

growing role that the U.S. South and Mexico are playing as a production platform for the region,
for both parts and final assembly. In section 3, we present evidence for the growing importance
of large suppliers and we illustrate how this relates to the changing geography of the industry. In
Section 4, we examine the roles that Canadian firms play in the North American automotive
industry in detail. Throughout the paper we highlight three trends that are raising the stakes for
Canada’s automotive industry: 1) the gradual shift of North American production to the U.S.
South and Mexico; 2) the shift of value added and employment from assemblers to parts
suppliers; and 3) the small but rapidly growing flow of automotive parts from China to North
America. We conclude by identifying a set of focus areas for policy-makers seeking to maintain
the historic strength of the Canadian automotive sector.
1) Global Value Chains in the Automotive Industry
There are several important features that automotive industry shares with other global
goods-producing industries, such as electronics, apparel, and consumer goods, and several other
features that set it apart. First, in all of these industries, including the automotive industry, trade
and foreign direct investment have accelerated dramatically since the late 1980s. Specifically, a
combination of real and potential market growth with a huge surplus of low-cost yet adequately
skilled labor in the largest countries in the developing world, such as China, India, and Brazil,
has attracted a great deal of investment, both to supply local markets and, in some industries, for
export back to developed economies. The rise of such “global sourcing” patterns has been
enabled and encouraged by the liberalization of trade and investment rules under an ascendant
World Trade Organization (WTO). The automotive industry is unusual, however, in the degree
that political sensitivities have kept final vehicle assembly, and by extension, parts production,
close to end markets.
Because of market saturation and high levels of “motorization,” this tendency for
automakers to “build where they sell” has meant that final assembly has become less
concentrated in North America and Western Europe, and now takes place in many more
countries than it did thirty years ago. As shown in Figure 1, global vehicle production has
doubled since 1975, from 33 million units to nearly 66 million units. In 1975, seven countries
accounted for about 80% of world production. By 2005, eleven countries accounted for this
share. The emergence of these new markets has helped to drive the pace of growth in the
4

automotive industry. As depicted in Figure 1, world vehicle production grew at an annual
average rate of 1.8% from 1975 through 1990, and 3.2% after 1990. Because of their low rates
of motorization and huge populations, there has been a great deal of new investment in China
and India, where market growth – and accordingly, production — is increasing very rapidly (see
Table 1). In this context, it is a sign of real success that Canada has been able to maintain its
share of global production at 4% over the last 30 years.
Figure 1. The Geographic Fragmentation of Vehicle Production, 1975 – 2005
50.5
65.8
33.0
59.7
42.339.838.5
1975 1980 1985 1990 1995 2000 2005
US18%
JAPAN16%
GERMANY9%CHINA
9%
OTHERS21%
RUSSIA2%
INDIA2%
BRAZIL4%
CANADA4%
FRANCE5%
KOREA6%
SPAIN4%
US27%
JAPAN21%
GERMANY10%
FRANCE9%
USSR6%
UK5%
CANADA4%
OTHERS18%
In 1975, 7 countries make up ~80% of total production
Total World Vehicle OutputMillion of Vehicles
In 2005, 11 countries make up ~80% of total production
Note: Includes Cars and trucks Source: Automotive News Market Data Books
5

Table 1. Motor Vehicle Production, Selected Countries, Thousands of Units, Ranked by 1996-2005 Average Annual Growth Rate 1996 1998 2000 2002 2004 2005 AAGR 96-05 China 1,240 1,628 2,009 3,251 5,071 5,708 18.5%India 541 535 867 892 1,511 1,642 13.1%South Korea 2,354 1,787 2,858 3,148 3,469 3,699 5.1%France 2,359 2,923 3,352 3,693 3,666 3,499 4.5%Brazil 1,813 1,547 1,671 1,793 2,210 2,528 3.8%Mexico 1,222 1,460 1,923 1,805 1,555 1,684 3.6%Russia 1,029 1,021 1,203 1,220 1,388 1,353 3.1%Germany 4,843 5,727 5,527 5,145 5,570 5,758 1.9%Spain 2,412 2,826 3,033 2,855 3,012 2,753 1.5%Canada 2,397 2,570 2,962 2,629 2,712 2,688 1.3%Japan 10,346 10,050 10,141 10,258 10,512 10,800 0.5%U.S. 11,832 12,003 12,774 12,280 11,988 11,977 0.1%United Kingdom 1,924 1,976 1,814 1,821 1,856 1,803 -0.7%Italy 1,545 1,693 1,738 1,427 1,142 1,038 -4.3%
Source: Ward's Automotive Yearbook, Wardsauto, from Industry Canada, http://strategis.ic.gc.ca/epic/site/auto-auto.nsf/en/am01934e.html. Note: the relative position of Russia and Canada are different than in Figure 1 because Table 1 includes large trucks and busus.
A second feature that the automotive industry shares with other global industries is
increased outsourcing and the bundling of more value chain activities in supplier firms. As a
result, suppliers based in advanced economies have increased their own involvement in foreign
investment and trade, and developing country suppliers have dramatically increased their
capabilities. The largest suppliers, almost without exception based in advanced economies, have
gained the capability to serve their customers globally (Sturgeon and Lester, 2004). These
‘global’ suppliers have become powerful actors in their respective industries, and provide
services to a wide range of lead firms. In the automotive industry, however, there are few
“generic” parts or subsystems that can used in a wide variety of end products without extensive
customization, like memory chips and microprocessors in the electronics industry and fabric and
thread in the apparel industry. Parts and sub-systems tend to be specific to vehicle models. This
lack of open, industry-wide standards undermines value chain modularity and ties suppliers
tightly to lead firms, limiting economies of scale in production and economies of scope in
design. Suppliers are often the sole source for specific parts. This creates the need for close
collaboration, raises the costs for suppliers that serve multiple customers, and concentrates most
design work into a few geographic clusters, typically near the headquarters of lead firms.
6

Because value chain modularity is limited, linkages between lead firms and suppliers tend to be
‘relational’ or ‘captive’ in character.
A third key difference between the automotive industry and other global consumer
goods-producing industries is the extremely concentrated structure of the industry, within which
a small number of giant companies exert an extraordinary amount of power over smaller firms.
Eleven lead firms from three countries -- Japan, Germany, and the United States -- dominate
sales in most markets. The global scope of both lead firms and the largest suppliers was
accelerated by a wave of mergers, acquisitions, and equity-based alliances in the 1990s. These
giant firms are increasingly building relationships with one another at the global level. This
concentrated structure creates high barriers to entry and limits the prospects for smaller firms to
improve their position in the industry. A new vehicle design typically requires more than 30,000
engineering hours, 3-5 years to complete, and several billion dollars of up-front investment.
Design requirements and specifications for parts come from the top-down. The small number of
lead firms allows each automaker to create its own world of standards and specifications, driving
up transaction costs for suppliers and making investments in information technology and
production equipment more customer-specific. Concentration at the level of lead firms and large
suppliers creates a top-heavy structure of innovation that leaves little room for smaller firms to
improve their prospects by seeking new customers or developing their own unique products and
technologies. In the electronics industry, by contrast, barriers to entry and value chain upgrading
are much lower. For example, in 1984 Cisco Systems was founded by a small group of
computer scientists from Stanford University to develop computer networking hardware. By the
end of 2006, Cisco had 51,480 employees, $28.4 billion in sales, and a market capitalization of
$110 billion.
From a geographic point of view, the world automotive industry, like many others, is in
the midst of a profound transition. Since the mid-1980s, it has been shifting from series of
discrete national industries to a more integrated global industry. Global integration embeds firms
in larger regional- and global-scale systems of production, consumption, innovation, sourcing,
command, and control. In the automotive industry, these global ties have been accompanied by
strong regional strcutures at the operational level. Market differences sometimes require
automakers to alter the design of their vehicles to fit the characteristics of specific markets (e.g.,
right vs. left hand drive, more rugged suspension and larger gas tanks for developing countries,
7

pick-up trucks for Thailand and Australia, etc.). As a result, while many vehicles are designed
with global markets in mind, an increasing number are developed with input from affiliated
regional design centers, where designers and engineers help to tailor vehicles to national and
regional markets.
On the production side, the dominant trend is regional integration, a pattern that has been
intensifying in the since the mid-1980s, for both political and technical reasons. As a result,
automakers and large suppliers are deeply engaged in multiple regional production systems. In
North America, South America, Europe, Southern Africa, and Asia, regional parts production
tends to feed final assembly plants that produce finished vehicles largely for regional markets.
Within regions, there is a gradual investment shift toward locations with lower operating costs:
the U.S. South and Mexico in North America; Spain and Eastern Europe in Europe; and South
East Asia and China in Asia.
The regional character of vehicle production stands in stark contrast to other important
high-volume, consumer-oriented manufacturing industries, especially apparel and electronics,
which have developed global-scale patterns of integration. The entire worldwide demand for
Apple’s iPod digital music player, for example, is satisfied from a few final assembly plants in
China owned and operated by the Taiwan-based contract manufacturer Hon Hai. These plants
receive components from manufacturers located in dozens of countries in North America,
Europe, and Asia. In the apparel industry, GVCs are becoming consolidated in five to ten low-
cost production locations, with China alone doubling its share of global apparel exports from
one-sixth to nearly one-third of the total between 2000 and 2006. Larger factories and integrated
supply-chain cities within developing economies are also becoming the norm, with footwear
companies like Nike and Reebok supplying global demand from giant plants that employ 70,000
or more workers (Gereffi, 2006: 33-37).
There are several factors that contribute to the importance of regional production in the
automotive industry. One of the most important is the political dimension. The high cost and
visibility of automotive products, especially passenger vehicles, among the general population
can create risks of political backlash in some markets if imported vehicles become too large a
share of total vehicles sold. This situation is heightened, of course, when local lead firms are
threatened by imports. More importantly, powerful lead firms and industry associations, large-
scale employment and relatively high rates of unionization increase the political clout of the
8

automotive industry in many countries. So even where import tariffs and local content rules are
not present or are scheduled to decline under WTO rules, assemblers have chosen to
“voluntarily” restrict exports and set up local production to forestall political backlash. This
explains why Japanese, German, and Korean automakers in North America have not
concentrated their production in Mexico and Canada, even though these countries have lower
operating costs and share a free trade agreement with the United States. Volkswagen is
exceptional in that it has concentrated all of its North American production in Mexico.
But there are other reasons, more technical and economic in nature, to keep production
close to final markets. First, motor vehicles, and many of their main parts, such as engines,
transmissions, and body panels, are large, heavy, and somewhat delicate, raising transportation
costs. Second, the industry-wide implementation of “lean” production techniques and increasing
product variety since the mid-1980s have kept parts production close to final assembly. Just-in-
time parts deliveries, which keep working inventories low and reveal defects quickly, are an
important element of lean production. But just-in-time parts deliveries do not always require
side-by-side co-location of parts and final assembly plants. Lean work-in-progress inventories
can be achieved within large continental regions with reliable road and rail systems, such as in
North America and Western Europe. Longer lead times and greater irregularities in trans-
continental oceanic shipping have so far limited truly global sourcing in this industry. Again, the
bulky character of many auto parts precludes the option of airfreight. In the electronics industry,
by comparison, the light weight of components enables greater implementation of lean
production at the global level. The tendency to build vehicle and major, heavy weight
subsystems close to end markets can be traced back to the earliest days of the automotive
industry (Sturgeon and Florida, 2000), but the trend has accelerated as new markets have
emerged and the industry has become more globally integrated. A top manager of an American
automaker, in an interview with one of the authors in 1998, stated:
The trend in drive trains, as in final assembly, is to build where you sell. We have been very aggressive about this.... Assembling cars were they are sold facilitates higher sales. We are trying to maintain a balance of trade for our company in each market where we sell. If trade balances are good, it is easier to hedge on currency fluctuations. Even if trade restrictions are taken away, governments will be embarrassed if their trade is out of balance with a major trading partner. Much of this concern stems from the fear of losing jobs. Engine plants are not linked to specific assembly plants, but they are organized to serve the regions where they
9

are located. For example European assembly plants are almost entirely supplied by European engine plants. This is true of North America as well.7
Despite intensifying regional integration, automotive the industry retains several strong
national and local elements. Consumer tastes and purchasing power, driving conditions, labor
markets, and vehicle regulatory requirements can vary widely by country (and even within
countries), and in several large economies the bulk of national demand, especially of finished
vehicles, is met by domestic production. Automotive parts, of course, are more heavily traded
within and between regions. Within countries, automotive production (and employment) is
typically clustered in one or a few industrial regions. In some cases these clusters specialize in
specific aspects of the business, such as vehicle design, final assembly, or the manufacture of
parts that share a common characteristic, such as electronic content or labor intensity. Because
of deep investments in capital equipment and skills, and the tight linkages between value chain
activities mentioned earlier, the geography of automotive clusters tend to be very long-lived.
To sum up the complex economic geography of the automotive industry, we can say that
global integration has proceeded at the level of design as global firms have sought to leverage
design effort across products sold in multiple end markets. Nevertheless, the work of vehicle
design and development tends to be concentrated in or near the headquarters of lead firms, and as
suppliers have taken on a larger role in design, they in turn have established their own design
centers close to their major customers to facilitate collaboration. Because centrally designed
vehicles are tailored to local markets and parts are manufactured in multiple regions to the
degree possible, design activities and buyer-supplier relationships typically span multiple
production regions. As a result, local, national, and regional value chains in the automotive
industry are “nested” within the global organizational structures and business relationships of the
largest firms, as depicted in Figure 2.
7 The information in this, and the other quotations presented in this paper were collected during the course of several research projects, including the Globalization and Jobs in the Motor Vehicle Industry Project, with field research was conducted in 1997 and 1998 (see: http://web.mit.edu/ipc/publications/papers.html for the final report) and the Industrial Performance Center Globalization Study, with field research conducted between 2000 and 2004 (see http://ipc-lis.mit.edu/globalization/ and Berger et al, 2005 for a summary of results). This qualitative data was collected on a confidential basis; the companies and individual managers cannot be named. The statements represent the opinion of the individual respondent and are included for illustrative purposes only. For more on the role of observational methods in economic research, see Helper (2000).
10

Figure 2. The Nested Geographic and Organizational Structure of the Automotive Industry
Regional production systems: Intra-regional finished vehicle and
parts flows are the dominant operational pattern in this industry.
A global industry: Automakers and global suppliers form buyer-supplier relationships on a global scale. Inter-regional
vehicle and parts trade is substantial, but capped by political
and operational considerations
Local clusters: Activities tend to be
concentrated within clusters of specialized activity, such as
design and assembly
National production systems: Domestic production is still very strong in
this industry, and still dominates many national markets.
2) The North American Automotive Production System
Because of market growth outside of North America, and the propensity to produce in or
near end markets, North America’s share of world vehicle production has fallen steadily from
33% in 1975 to 25% in 2005, as shown in Figure 3. Of the three major vehicle-producing
regions, North America, Europe, and East Asia, regional integration is the most pronounced in
North America. In 2004, 75.1% of automotive industry trade was intra-regional, in contrast to
71.2% for Western Europe, 23% for Asia, and 13.2% for Latin America (Dicken, 2006, p. 305).
The North American industry is focused on supplying the United States, which is the world’s
largest single national market, by far. The integration of Canada into the North American
production system began in 1965 with the U.S.-Canada Auto Pact, which reduced tariffs on
many vehicles entering the United States. Mexico’s integration came with the NAFTA
11

agreement in 1994. The result of these agreements was an increase in vehicle production in
Canada and Mexico directly following their implementation.
In 2005, 95.2% of Canada and Mexico’s combined vehicle and parts exports were
destined for the U.S. market (UN Comtrade). Figure 4 reveals the integration of Canada and
Mexico into the North American production system, as well as the concentration of vehicle
assembly into fewer, larger plants. In 1985 there were 93 plants manufacturing cars and light
trucks in North America: four in Mexico, 14 in Canada, and 75 in the United States. By 2010,
we estimate that the total number of assembly plants will have shrunk to 76. At the same time,
the share of plants owned by Asian automakers will have increased to 28%.
Figure 3. North America’s Falling Relative Importance in Global Vehicle Production
Tot utMillion of Vehicles
al World Vehicle Outp 65.8
1975 1980 1985 1990 1995 2000 2005
US CANADA MEXICO NON-NAFTA
33% of vehicles produced in
North America in 1975
59.7
50.5
42.339.838.5
33.0
25% of vehicles produced in
North America in 2005
Note: Includes Cars and trucks Source: Automotive News Market Data Books
12

Figure 4. North American Vehicle Assembly Plants – By Location and National Ownership
Mexico Canada
76
141311
121213
14 4
93
82 83
Number of Plants
505858
75
United States Location
1985 1995 2005 2010 e
80%
12%
92%
2%
73%
21%
65%
28%
Ownership United States
s
Note: Includes Cars and Trucks; Chrysler plants included under US ownershperiod. Sources: North American OEM Database, based on Automotive Newvarious news reports.
Trends in the integration of the North American automotive in
more comprehensive manner through an examination of the sources of
region’s largest national market, the United States. According to War
combined car and light truck sales totaled 17.4 million unites in 2005.
between 1989 and 1996 the share of apparent U.S. demand (the numbe
the United States, plus net imports) met by regional production increas
percent to 92.7 percent. After 1996, the share began to fall, reaching a
2002, and then increasingly slightly to 82 percent in 2005. Most of th
for by reductions in production in the U.S. by the Big 3 American auto
imports from outside of the region, mostly from Japan and South Kore
Honda, and Hyundai increased their share of the U.S. market. Mexico
13
Japan/Korea Joint-Venture
Europeip throughout the 1985-2010 s; Companies’ websites;
dustry can be revealed in a
vehicles supplied to the
d’s Automotive Yearbook,
As shown in Table 2,
r of vehicles produced in
ed steadily, from 80.3
low of 81.2 percent in
is change was accounted
makers, and an increase in
a as firms such as Toyota,
and Canada’s combined

share of total apparent U.S. demand continued to rise until 2000, when it reached a peak of 14.4
percent; it has fallen slightly since, to 12.1 percent in 2005. The central story, then, lies in the
fact that vehicle imports from outside NAFTA, after falling steadily from 19.7 percent in 1989
to a low of 7.3 percent in 1996, have since surged back to about 18 percent in 2004-2005,
largely at the expense of U.S. production.
Table 2. Share of Apparent U.S. Demand met by U.S. Production, NAFTA Imports, and Imports from the Rest of the World, 1989 - 2005
Year US Production Net NAFTA Imports Net ROW Imports US plus NAFTA 1989 73.1% 7.2% 19.7% 80.3%1990 72.2% 9.2% 18.6% 81.4%1991 72.4% 9.8% 17.7% 82.3%1992 76.0% 11.0% 13.0% 87.0%1993 77.1% 11.9% 11.0% 89.0%1994 78.9% 10.8% 10.3% 89.7%1995 78.7% 12.9% 8.4% 91.6%1996 78.9% 13.8% 7.3% 92.7%1997 78.4% 12.5% 9.1% 90.9%1998 76.5% 12.7% 10.7% 89.3%1999 72.7% 13.8% 13.5% 86.5%2000 69.8% 14.4% 15.8% 84.2%2001 68.4% 13.9% 17.7% 82.3%2002 68.9% 12.3% 18.8% 81.2%2003 69.8% 12.0% 18.2% 81.8%2004 68.8% 12.6% 18.5% 81.5%2005 69.9% 12.1% 18.0% 82.0%
Sources: US Production: Ward’s Automotive Yearbook; Trade: UN Comtrade.
This same trade data, shown in graphic form in Figure 5, illustrates both the dramatic
decline in vehicle imports from countries outside of NAFTA from 1989 through 1996, and the
equally dramatic increase thereafter. Imports from Canada and Mexico increased through the
1989-2000 period, and have fallen slightly since, reflecting the declining market share of the Big
3 automakers, whose plants dominate production in these countries. However, it is likely that a
spate of new North American assembly plants planned by Japanese and Korean firms will largely
offset this recent increase in imports of nearly two million vehicles. A new Hyundai plant with a
capacity to produce 300,000 vehicles per year opened in Hope Hull, Alabama in May 2005.
Toyota will open a new plant in Woodstock, Ontario in 2008 to produce up to 150,000 RAV4
SUV’s per year. Honda is slated to open a new assembly plant in Indiana in late 2008 with an
annual capacity of 200,000 vehicles. Kia has announced the construction of a new assembly
14

plant scheduled to open in in Troup County, GA in 2009 with a capacity to produce 300,000
vehicles per year (see Table 5).8 A recent news report stated that Toyota may build up to five
more vehicle assembly plants in North America in the next 10 years (Reuters, 2007).9
If all of these plants are built, and the average production capacity is a conservative
200,000 vehicles per year, the recent increases in imports to North America will be replaced by
regional production. Because of the high cost and large scale of vehicle assembly plants, this
sort of cyclic variation in the share of regional production can be expected in the future if market
share continues to shift in favor of foreign firms. Assembly plants will only be added when these
firms are confident that market share gains in North America will be long-standing. In particular,
firms want to make sure that their plants in locations with the highest operating costs, usually
those in the home base, will continue to work as close to full capacity as possible.
Figure 5. Net Vehicle Imports to the United States from Mexico, Canada, and Countries Outside of North America, 1989 - 2005
-
500,000
1,000,000
1,500,000
2,000,000
2,500,000
3,000,000
3,500,000
4,000,000
1989
1990
1991
1992
1993
1994
1995
1996
1997
1998
1999
2000
2001
2002
2003
2004
2005
Net Import from Mexico
Net Imports From Canada
Net Imports from Outside NAFTA
Source: UN Comtrade.
8 Since then, the announcement was reversed, partly due to a corruption scandal at the company. 9 Furthermore, Economic Development Minister Joe Cordiano and Ontario Premier Dalton McGuinty started to lobby Nissan for a first investment in the province of Ontario, traveling to Japan in the summer of 2006. The company has signaled it would consider building an assembly plant in Canada when its share of the market hits 10%, which could happen by 2010. (Globe and Mail, May 18, 2006)
15

A Shift to the South?
The geographic footprint of automotive manufacturing activity in North America is
gradually shifting from its heartland in the American Midwest and Ontario to the southern
United States and to a lesser degree, Mexico. As Table 5 shows, nine of the twelve new
assembly plants established or planned to open between 1990 and 2009 are or will be located in
the American South or in Mexico. Because of the political considerations mentioned earlier, the
United States has received the lion’s share of new investment as Asian automakers have
increased production in the region. Planned investments are likewise concentrated in the United
States. A large-scale shift of vehicle assembly to Mexico cannot be discerned. Mexico’s vehicle
production rose quickly between 1985 to 1990, almost doubling from 433,212 to 801,137, but it
took 15 years to double again, reaching 1.86 million units in 2005. While Mexico’s share of
North America’s vehicle output was tiny in 1985, at only 3.2%, it was still below Canada’s in
2000, at 10.9%. In the last five years, Mexico’s share even declined modestly to 10.3% (Ward’s
Automotive Yearbook). More importantly, give their rising share of vehicle sales in North
America, the share of Mexico’s production accounted for by Asian automakers increased only
slightly, from 22.0% in 1985 to 25.4% in 2005.
As shown in Table 3, Asian automakers production share is approximately 25% in all
three North American countries. Even without taking additional Big 3 plant closures in Table 4
into account, the scheduled plant additions in Canada and the United States summarized in Table
5 will increase the Asian company share of vehicle assembly in these countries to more than 35%
by 2010. The distribution of production among the three countries will likely be quite stable
between 2005 and 2010, with a slight increase in the United States relative to Mexico and
Canada. However, as we will discuss in the following section, parts production has increased
quite dramatically in Mexico. This shift to the South, then, will largely occur within the United
States. It is being driven by shifts in market share, away from the Big 3 automakers and toward
Asian automakers. The Big 3’s loss of market share has been most severe in passenger cars.
16

Table 3. Light Vehicle Production by Country and Automaker Home Region, 2005 and 2010 projection 2005 2010 Mexico Canada USA Mexico Canada USA Big 3 895,532 1,741,426 7,666,095 1,329,000 1,412,000 6,966,000 Asian 396,387 691,457 2,947,778 473,000 1,030,000 4,146,000 JV 0 189,997 690,001 0 200,000 190,000 European 313,929 0 220,376 330,000 0 243,000 Total 1,605,848 2,622,880 11,524,250 2,132,000 2,642,000 11,545,000 Share 10.2% 16.7% 73.2% 13.1% 16.2% 70.7% Big 3 55.8% 66.4% 66.5% 62.3% 53.4% 60.3% Asian 24.7% 26.4% 25.6% 22.2% 39.0% 35.9% JV 0.0% 7.2% 6.0% 0.0% 7.6% 1.6% European 19.5% 0.0% 1.9% 15.5% 0.0% 2.1% Total 100.0% 100.0% 100.0% 100.0% 100.0% 100.0%
Source: Industry Canada, and CSM forecasting 2006 Note: In 2010, the NUMMI plant is not split out from the rest of Toyota anymore and included with “Asian”, while it was under “JV” in 2005.
Figure 6 shows the dramatic fall in Big 3 passenger car market share within North
America, from 94 percent in 1985 to 48 percent in 2005. In recent years, the bright light for U.S.
automakers was vans and light trucks, which steadily increased their share of the North
American market from 13.8 percent in 1955 to 60 percent in 2005. But rising fuel prices and
recent success by Asian automakers in the markets for full size pick-up trucks and sport utility
vehicles (SUVs) have begun to undermine even this advantage. According to JD Power, the Big
3 American automakers are expected to continue to gradually lose their share of the U.S. market
to “international” automakers, that is, automakers from Europe and Asia. The market share of
the Big 3 stood at 71.7% in 1995, and stands at 55.9% today. By 2011, JD Power expects this
figure to fall to 51.8% (cited in McAlinden, 2006). Declining market share has motivated the
Big 3 U.S. automakers to retool and expand older plants in Mexico, established in the 1950s,
1960s, and 1970s to supply the local market, for export to the United States. Of the foreign
assemblers, only Volkswagen and Nissan have made large-scale, export oriented investments in
Mexico, both by upgrading older, low-volume plants for export. Asian automakers, for the most
part, have chosen to invest heavily in the United States, both in the Midwest and Ontario and
most recently in the U.S. South.
17

Figure 6. North American Passenger Car Production, 1985 – 2005, millions of vehicles
1985 1995 2000 2005
AMVOLVOBMWVWCAMINUMMIA. ALLIANCEMITSUBISHISUBARUHUYNDAINISSANTOYOTAHONDACHRYSLERFORDGM
9.4
8.78.1
6.7
48% 62%69%94%
JV share: 11%
Asian Transplant share: 37%
Big Three
share
Note: Does not include light trucks (minivans, SUVs, etc.) Source: Automotive News Market Data Books.
In response to reduced demand for large passenger vehicles and falling market share, the
Big 3 American automakers have cut production in the United States. As Table 4 shows, the Big
3 automakers, in an effort to bring capacity in line with demand, have announced plans to cut
more than 28,000 assembly jobs between 2006 and 2009, and more such announcements are
being made regularly. So far, job cuts from these full and partial plant closures are distributed
evenly across the Northern (including Ontario) and Southern United States.
Nevertheless, it is unlikely that fundamental geographic patterns in the North American
automotive industry will change quickly. The sunk capital, accumulated labor force skills, and
especially the broad and deep supply-bases that exist in the American Midwest and Ontario make
18

rapid or complete locational shifts highly unlikely, especially given the widespread adoption of
JIT delivery and closer design collaboration between automakers and suppliers. Not only are
capital investments, skilled labor forces, and deep supply-bases highly immobile, but they
continue to exert a strong attractive force on new investment. As a result, the Midwest’s share of
U.S. transportation sector employment remained steady between 1990 and 2005 at about 40%,
while employment in the South increased from 10% to just over 17% (McAlinden, 2006). Most
of this increase has come at the expense of the northeastern and western regions of the United
States, where the Big 3 American automakers had expanded production during their heydays in
the 1950s, 1960s, and 1970s.
Table 4. Recently Announced Big 3 Assembly Plant Employment Cuts in North America 2005
Employment*
Company
Location
Hourly Salaried
Full or Partial
Closure?
Estimated # of Job Cuts**
Date of Job Cuts
Chrysler Newark, DE 1,681 168 full 2,100 2009 Chrysler St. Louis, MO 2,735 242 partial 1,300 2008
Ford Twin Cities, MN 1,738 129 full 1,800 2008 General Motors Doraville, GA 2,422 199 full 3,100 2008 General Motors Oshawa, ON (2) 2,141 161 full 2,750 2008
Chrysler Warren, MI 3,774 282 partial 1,000 2007 Ford Norfolk, VA 2,346 161 full 2,400 2007 Ford St. Thomas, ON 2,247 167 partial 1,200 2007 Ford Wixom, MI 1,453 128 full 1,500 2007 Ford Atlanta, GA 1,801 141 full 2,028 2006 Ford St. Louis, MO 1,220 105 full 2,433 2006
General Motors Lansing, MI 398** 60** full 400 2006 General Motors Moraine, OH 3,331 249 partial 1,300 2006 General Motors Oklahoma City 1,842 178 full 2,400 2006 General Motors Oshawa, ON (1) 3,147 225 partial 1,000 2006 General Motors Spring Hill, TN 2,570 183 partial 1,500 2006 Northern US and
Ontario 22,184 1,748 14,683
Southern US 12,662 1,030 13,528 Note: Green rows are located in the Southern U.S. * Source: 2006 Harbour Report ** Source: http://www.freep.com/assets/static/pdf/gmfacilities11222005.pdf.
As Table 5 shows, the earliest Japanese transplants established in North America were
located on the outer boundaries of the traditional cluster, in Ohio and Ontario.10 These plants,
because they are older, tend to be larger than newer plants. And, they have developed a dense
network of surrounding suppliers. Toyota’s huge production complex in Georgetown Kentucky,
10 An exception was Nissan in Mexico, but that production was predominantly for the local Mexican market.
19

which is labeled a “southern” plant in, is within a day’s drive of the industry’s Midwest
heartland. In addition, large-scale investment in new assembly capacity continues to be made in
the American Mid-West and Ontario by the most successful Asian Automakers (Honda and
Toyota), even as more Big 3 assembly plants close and investment by these and other Asian
automakers in the American South accelerates.
Table 5. Recent Foreign Assembly Plant Investment in the North America Company Location Employment
(as of 2004 or planned)
Investment($M,
through 2005 or
planned)
Capacity (2005 or
planned)
Opening Date (first
major expansion)
Kia Troup County, GA 2,500 1,200 300,000 2009Honda Greensburg, IN 2,000 550 200,000 2008Toyota Woodstock, ON 2,000 950 150,000 2008Toyota San Antonio, TX 2,000 850 200,000 2006Hyundai Hope Hull, AL 2,000 1,100 300,000 2005Toyota Tecate, MX 460 140 50,000 2005Nissan Canton, MS 4,100 1,430 400,000 2003Honda Lincoln, AL 4,300 1,200 300,000 2001Volkswagen Puebla, MX 15,000 380,000 1966 (1998)Daimler-Benz Vance, AL 4,000 2,200 160,000 1997Toyota Princeton, IN 4,659 2,600 300,000 1996BMW Spartenburg, SC 4,600 2,200 200,000 1994GM Spring Hill, TN 5,500 300,000 1990GM/Suzuki Ingersoll, ON 2,775 500 250,000 1989Honda East Liberty, OH 2,230 920 240,000 1989Subaru Lafayette, IN 1,315 1,350 262,000 1989Toyota Georgetown, KY 6,934 5,310 500,000 1988Mitsubishi Normal, IL 1,900 850 240,000 1988Toyota Cambridge, ON 4,342 2,400 250,000 1988Honda Alliston, ON 4,375 1,500 250,000 1987GM/Toyota Fremont, CA 5,715 1,300 370,000 1984Nissan Smyrna, TN 6,700 1,600 550,000 1983Honda Marysville, OH 4,315 3,200 440,000 1982Nissan Aguascalientes, Mx 200,000 1966 (1982) Northern US and
Ontario 35,626 16,120 3,152,000 Southern US and
Mexico 58,094* 17,230** 3,640,000 Note: Green rows are located in the Southern U.S. and Mexico. *Missing employment from Nissan, Aguascalientes. **Missing investment in Volkswagen, Puebla, Nissan, Aguascalientes, and GM, Spring Hill plants. Sources: Compiled from Automotive News, Ward’s Automotive, McAlinden (2006), and company websites.
20

Several authors have discussed the motives behind the changing geography of the
automobile industry in North America.11 A number of factors are mentioned repeatedly. Perhaps
foremost is the growing number of models that are produced in North America. While it used to
be the case that high volume models were assembled in several plants close by population
centers, nowadays almost all vehicles are only assembled in a single location. Given the much
lower transportation costs for parts than for finished vehicles, firms had increased incentives to
locate their plants in the U.S. interior. However, the importance of investment incentives, the
topic of countless books and research papers, is undeniable. Over the last decades, several
politically attuned Governors of Southern states have not hesitated to spend lavishly to attract
Big-3, but also foreign, assembly plant investments. While most of the money was spent on
training programs to build up a qualified workforce, infrastructure subsidies and even land grants
were not uncommon. An additional motivation for the firms was the different labour legislation
in Right-to-Work states, where makes it harder to organize a plant, potentially leading to lower
operating costs (wages and benefits), but also to greater flexibility in the operation of the plant.
Finally, the rising population in the South and West (especially in relative terms) and greater car-
ownership in Mexico (with even more potential growth) is also moving the midpoint of the
consumer market further South).
Nevertheless, important new investments have been announced for Ontario as well. The
new Woodstock assembly plant by Toyota and the engine plant in Alliston by Honda will result
in the direct creation of at least 2,500 jobs. The number of jobs created indirectly, in parts
suppliers that co-locate, will be a multiple of that number, but the correct multiplier is a topic of
considerable debate. Equally important are the re-investments announced by Ford (flexible
assembly plant in Oakville), GM (Beacon project), and DaimlerChrysler ($768 million worth of
investments in its Brampton and Windsor facilities were announced in November 2005).12
Among the many advantages of producing cars in Ontario, four are listed most
frequently. First, the Canadian plants are highly productive. Van Biesebroeck (2006a) illustrates,
using data from the Harbour report, that Canadian plants require between 1.3 and 1.7 fewer hours
to assemble a car than U.S. plants, after controlling for a host of other factors explaining
11 Our discussion draws in particular on Rubenstein (1992), Klier and Rubenstein (2006), and Molot (2005). 12 The emergence of fully flexible plants that can produce a wide range of vehicles is likely to have important repercussions on the industry. We refer the interested reader to Van Biesebroeck (2007) which analyzes the costs and benefits of flexibility.
21

productivity differences (see results in Table 5). The difference with Mexico averages almost 11
hours. Similar comparisons by J.D. Power and Charles River Associates (2001) also point to
productivity advantages by Canadian plants.
Second, the government-funded nature of the Canadian health care system lowers the
benefit costs substantially for Canadian producers compared to U.S. plants. The CAPC estimated
the costs of indirect benefits at 20% of payroll in Canada versus 29% in U.S.13 Third, combined
investment subsidies of the Federal and Provincial (Ontario) government totalled $1 billion
(USD). Additional funds have been earmarked to transportation bottlenecks, in particular the
border crossings with the U.S. Details on these funding packages can be found in Van
Biesebroeck (2005). The Conference Board of Canada (2006) highlights the importance of
investments in the border infrastructure.
3) The Growing Importance of Large Suppliers
The automotive industry underwent a dramatic wave of outsourcing, beginning in the
mid-1980s, and accelerating though the 1990s. This trend was most pronounced among
suppliers headquartered in the United States. Figure 7, which traces the history of parts and
assembly employment in the United States from 1958 through 2002, clearly shows this structural
shift. Until 1985, parts and assembly employment were equally divided. After 1985,
employment shifted into the supply base as automakers closed ‘feeder’ lines making sub-
assemblies such as cockpit assemblies, rolling chassis, seats, radios, etc., and began to purchase
these built-up modules and sub-assemblies from outside suppliers. This drove rapid growth
among the largest automotive parts suppliers as well as consolidation, as firms engaged in
mergers and acquisitions in order to gain the capability to make larger and more complex sub-
systems and modules.
The concentrated structure of the automotive industry makes it important to study large
firms in detail. As large suppliers have captured an increasing share of the employment in the
sector, they have also gained control over their own upstream suppliers. Over time, the industry
organized itself into several tiers. First-tier suppliers sell directly to the OEMs, which assemble
13 These numbers are quoted in “A Call for Action, A Canadian Auto Strategy,” October 2004, which can be found on the CAPC website: http://www.capcinfo.ca
22

the final product. Second-tier suppliers sell to the first tier, etc. up the chain. As lead firms have
delegated design tasks to their suppliers and started to source entire modules instead of
individual parts, first tier suppliers have gained a lot of control over the value chain.14
Figure 7. Outsourcing in the U.S. Automotive Industry, Assembly and Parts Employment, 1958-2002
0
100
200
300
400
500
600
1958
1960
1962
1964
1966
1968
1970
1972
1974
1976
1978
1980
1982
1984
1986
1988
1990
1992
1994
1996
1998
2000
2002
PartsAssembly
Note: Assembly includes SIC 3711 (Motor Vehicles and Car Bodies) and Parts includes SIC 3714 (Motor Vehicle Parts and Accessories). Source: Employment, Hours, and Earnings from the Current Employment Statistics survey (National, SIC basis).
A comprehensive overview of the large firms supplying original equipment makers
(OEMs) in the automotive industry is published annually by the principle trade journal for the
industry, Automotive News. Each year, a list is compiled of the top 150 OEM parts suppliers in
North America, the top 30 in Europe, and the 100 largest suppliers worldwide. The rank, address
of headquarters, areas of specialization, and sales are reported for each company. The list for
North America was first published in 1992 and with the exception of 1994 it has appeared each
14 For a brief introduction to the modern organization of the industry, contrasting the Japanese roots with the North American legacy, see Milgrom and Roberts (1997), “Johnson Control: Georgetown, Kentucky.” Stanford University Graduate School of Business, Case study.
23

year since.15 The European and worldwide lists have been published since 1999. Looking at the
changing composition of the list gives a glimpse into this process.
A first trend that can be illustrated is the rising importance of suppliers, relative to lead
firms. The only output measure we observe for the firms on the list is total sales, but it is useful
to keep in mind that the price per vehicle (controlling for quality) has remained almost flat over
the last 15 years.16 While the total number of vehicles produced in North America grew by 40%
between 1991 and 2005 – from 11.6 million to 16.3 million – the combined sales of the largest
150 suppliers in North America almost tripled over the same time period (indicated by the two
orange lines at the bottom of Figure 8).
Figure 8. Increasing importance of suppliers
1000
0020
0000
3000
0040
0000
5000
00
1990 1995 2000 2005year
Sales of top 100 suppliers (world) Vehicle production (world)Sales of top 150 suppliers (NA) Vehicle production (NA)
Source: Information for the top suppliers is taken from Automotive News (various years). Information on vehicle production is from Ward’s Automotive Yearbook (2006). Notes: The scale on the left is for the sales numbers in millions of current U.S. dollars. The vehicle production series has been scaled to coincide with the relevant sales number in the initial year.
15 In 1992, the list was limited to the top 50 OEM suppliers for North America which was expanded to the top 100 suppliers in 1993. (The top 25 suppliers to the Mexican industry was listed separately). In 1995, the current format was introduced. 16 The CPI index for new vehicles saw a cumulative increase from 1992 to 2005 of 4.3%; between 1997 and 2005 it even recorded a decline of 5.5%.
24

At the global level, vehicle production increased by 18.4% from 1999 to 2005, while
supplier sales has grown at more than twice that pace (indicated by the blue lines at the top of
Figure 8). Consolidation at the worldwide level has not progressed as far as in North America,
but it has picked up speed in recent years with the formation of new global OEM firms and
groups: DaimlerChrysler in 1999, Nissan-Renault in 1998, Hyundai-Kia in 1999, and GM’s and
Ford’s purchase of several smaller companies.
Value chain linkages in the automotive industry
Linkages between lead firms and suppliers in the automotive industry require tight
coordination. Since there are few standardized parts, specifications must be developed for each
part of each vehicle model. Lead firms have been trying to decrease the design effort required for
vehicle development by sharing vehicle “platforms” across a family of vehicle models.
Platforms generally include rolling chassis, and sometimes braking systems, suspension parts,
engines and transmissions. But there are limits to the degree that parts can be shared. First,
platforms are generally shared only across the brands owned by a specific lead firm. For
example, some Ford and Jaguar (which is owned by Ford) models share a basic platform.
Second, to avoid product homogenization and to achieve performance goals, most parts that are
visible to consumers, and many that are not, remain model-specific. Vehicle performance
characteristics such as noise, vibration, and handing (NVH) are deeply interrelated and it is
difficult to quantify their interactions in advance. As a result, it has so far proved impossible for
vehicle designers to achieve specific performance goals using standardized parts, and both
design and value chain modularity have limited application in the automotive industry.
There are two ways to manage this need for tight coordination. Specifications can either
be developed jointly, in a co-design process, or suppliers must be provided with full instructions
on what to produce. In the first approach, designer engineers from lead firms and suppliers work
closely together to develop parts that will work in the context of the overall vehicle design. In
GVC parlance, we refer to such buyer-supplier linkages as “relational.” In the second, lead firm
engineers develop all vehicle parts in-house, and then put the part out for bid, creating a classic
“market” linkage with suppliers. It is important to note that market linkages allow for the easy
switching of suppliers, while relational linkages give more power to suppliers and make
replacing them with new suppliers more difficult.
25

Historically, American and European lead firms have developed market linkages with
suppliers. However, the acceleration of outsourcing in the 1990s bundled more value chain
functions in supplier firms, increasing the need for co-design. As Herrigel and Wittke (2005)
have shown, this has created deep tensions in the automotive industry, especially in the
relationship between the Big 2 lead firms (General Motors and Ford) and their largest suppliers.
The Big 2 have a long history of extremely aggressive buying practices, pitting suppliers against
each other to achieve lower input costs and switching suppliers with little advance notice. The
U.S. managers of a non-U.S. supplier described the situation this way in an interview with an
author conducted in 1998:
Big 2 buyers don’t care about anything but cost. Ford is sometimes worse than GM. They feed their buyers raw meat and train them to kill. They have no ethics; they cheat and lie. The Big 2 add a mandatory 5% annual price reduction into their contracts. These are long-term agreements to buy assemblies that often contain parts (e.g. steel) that “pass-through” the supplier. We are responsible for purchasing and holding inventories of the parts, but are not allowed to mark-up the part’s cost. When prices rise on the pass-through part, the Big 2 are unwilling to pay for the increase. The Big 2 also steal our designs. They ask us to perform quick engineering fixes, buy the part for a year, and then turn the improved design over to one of our competitors willing to make it at a lower price. If they need to shut their plant down because of defective parts, the contract states that they can charge us $1,000 per minute. There is no discussion about these actions and we have no recourse. What are we going to do, sue them? If we threaten them, we will get no new business. The automakers are now dealing with larger suppliers that can absorb some risk, but still suppliers have no leverage because they cannot afford to alienate their customers.
While these practices have not changed, they have become much more problematic as
linkages with suppliers have become more relational. Switching the sourcing of a part, or a
module or sub-system consisting of many parts, from a supplier that engaged in co-design to a
supplier that did not, is possible once the specifications have been fully developed and have
stabilized in the context of high volume production, but much of trust and cooperative
relationships that may have built up is shattered. Especially relevant here is the fact that
suppliers are often not fully paid for their design services, but are expected to provide them as
part of winning the initial contract. The result is an oscillation between relational linkages,
driven by the engineering requirements of vehicle development in the context of increased
outsourcing, and market linkages, which are reverted to when lead firms put co-developed parts,
26

modules, and sub-systems out for open re-bid after a year or so of production in an effort to
lower input costs. For large suppliers, the costs of these purchasing practices are extremely high.
In fact, the high cost of design, and the lack of compensation for the design services they
provide, along with the aggressive and noncooperative purchasing practices of the Big 2, has
been one of the factors driving a recent spate of bankruptcies among large automotive suppliers
(see Figure 9).
Japanese firms generally pursue a different approach. While co-design with suppliers has
been very limited in scope, Japanese lead firms have tended to form long-term, paternalistic
relationships with suppliers. This has often involved equity ties between automakers and
suppliers, which respond by dedicating themselves to serving their largest customer. Supplier
switching without notice, exclusively to reap a short-term gain, is almost unheard of, and long-
term trust-based relationships are allowed to develop. It is notable that no Japanese suppliers are
shown in Figure 9. The different approaches that automakers from different home countries take
toward supplier relationships was described by the managers of a U.S.-based supplier in an
interview with Industrial Performance Center researchers in 2000 as follows:
There is some truth to the idea of that some assemblers are more loyal to their suppliers than others—Japanese assemblers are the most loyal, followed by Europeans. Americans are the least loyal. The Japanese transplants set high hurdles, but the expectation is for long-term business and that problems will be fixed. Regardless of how supplier relationships are managed, lead firms have a huge amount of
power in the chain. This has increased with lead firm consolidation. As a manager at one
supplier put it during an interview with Industrial Performance Center researchers in 2000:
With consolidation, vehicle makers will have volumes of 2 to 5 million vehicles. This gives them huge purchasing power—contracts today are for $200 million in work, rather than $20 million as in the past. When they are awarding $200 million contracts, suppliers can’t tell assemblers to go to hell.
27

Figure 9. Major Automotive Supplier Bankruptcies, 1999 - 2006
Source: Kim Korth, IRN presentation to OESA, Nashville Regional meeting, drawn from McAlinden (2006).
The new global supply base
Globalization has expanded the field of customers for suppliers. Most of the top
suppliers now serve American, European, and Japanese lead firms, and have had to adapt to the
different approaches these firms take to vehicle development and to forming and maintaining
supplier linkages. Lead firm globalization has also meant globalization for suppliers, as
demands for local production are now often part of winning contracts. Manager from three
different suppliers put it as follows during interviews with Industrial Performance Center
researchers in 2000 and 2002:
The industry began to change 5-10 years ago. Today it is a requirement to serve platforms – it is part of the bid. If a supplier doesn’t have a global strategy, it can’t bid. New projects are no longer seen as an opportunity to expand globally—instead, a supplier must have a global base in place to even make a bid. This forces suppliers to have a global supply system in place.
Suppliers must support assemblers as a sole source for global products lines to support commonalization. We must supply the same part, with the same quality and price, in every location. If [the automaker] says to go to Argentina, we must
28

go or lose existing, not just potential, business. Logistics are becoming a key competitive advantage; we must have the ability to move production to where customer's facilities are.
We want our plants to be present where vehicles are produced. Sometimes customers ask us to locate near offshore assembly plants to provide local content. . . . We will follow our customer's strategy by establishing local engineering operations in large emerging markets only, such as Korea, Mexico and Brazil.
Nevertheless, full production is not required at each location. Suppliers with a global
presence can concentrate volume production of specific components in one or a few locations
and ship them to plants close to their customer’s final assembly plants where modules and sub-
systems are built up and sent to the final assembly line as needed. During an interview
conducted in 2000 with Industrial Performance Center researchers, the U.S. managers of a
European supplier made this point as follows:
“Being there” [having a presence close to assembly plants] does not necessarily require suppliers to manufacture everything at a particular site. Instead, a supplier can import parts and then do final assembly at all sites — e.g., Brazil, South Africa. The production location for particular parts is determined by the necessary volumes and available capacity at each site. There is “no pattern” regarding what gets imported at sites—production for a part will be concentrated at the most cost-effective site which, in turn, will export to other sites. In Asia, for example, different plants tend to concentrate on certain products—there is “very little complete manufacturing” -- i.e., manufacturing of the full range of products, at any site. We spread our capacity across countries and then have plants specialize in a limited number of products. This allows us to meet local content requirements and achieve economies of scale.
Globalization has created two classes of suppliers, global and local. In the past, lead
firms either exported parts to offshore assembly plants or relied on local suppliers in each
production location. Today, a new class of supplier has been added, the global supplier
(Sturgeon and Lester, 2004). Whether these firms supply modules and sub-systems or discrete
parts, they have responded to automaker demands to supply “the same part anywhere in the
world.” When elaborating on the criteria that his firm uses in selecting suppliers that are invited
to submit a bid on a new contract, the head of the seat purchasing division of a major Japanese
OEM stated that it boils down to only three items:17
• World-class productivity and quality 17 Interview in Tokyo, June 2006
29

• World-class design capabilities
• World-wide manufacturing reach.
Any firm that was not able to supply parts to its plants in Asia, Europe, and North America was
ineligible to submit a bid. Suppliers with only a regional focus have responded by submitting
bids as part of a consortia. This emphasis on global reach has been accelerated by the sharing of
vehicle platforms worldwide. Similarly, another Japanese OEM has been actively pushing
several of its suppliers to merge in order to obtain global reach.18 This has consolidated its
supply base in brakes and exhausts.
An example of a small Japanese firm that has set up a global operational footprint is F-
Tech, a Honda supplier headquartered in Saitama Prefecture, north of Tokyo. The company
began supplying Honda in 1956, and in 1967 established the first of several plants in Kameyama,
a few minutes away from Honda’s assembly complex in Suzuka. The company produces engine
and rear suspension parts, engine supports, rear axles, pedal and clutch assemblies, and bumper
beams. As many Japanese suppliers have, F-tech has broadened its customer base beyond its lead
customer. F-Tech began serving Nissan in 1995, Isuzu in 1997, Dihatsu in 1999, and Suzuki in
2001. Nevertheless, Honda accounts for most of F-Tech’s output, especially the offshore plants,
which typically are 100% dedicated to Honda. Honda and F & P (The name of its North
American operations) engage in a classic “captive” value chain relationship. Honda provides
close guidance in terms of planning, purchasing, and production methods.
The tight linkages between F-tech and Honda, especially outside of Japan, is revealed by
the close proximity of F&P’s facilities to Honda’s offshore assembly plants. In 1986, F-Tech
began to follow Honda offshore, establishing the subsidiary F & P Mfg., Inc. in Tottenham,
Ontario, less than ten miles from Honda’s Alliston assembly plant, which was opened the same
year. In 1993, the company opened F&P America in Troy, Ohio, less than an hour’s drive from
Honda’s East Liberty assembly complex. A technical center and North American headquarters
followed in 2001. In 1997, a second Canadian subsidiary was established in Stratford, Ontario,
about an hour’s drive from Alliston. In 2000, a subsidiary was established in Georgia, just
across the border from Honda’s assembly plant in Lincoln, AL, which opened the same year.
The company also established a plant in Queretaro state, Mexico in 2001, several hundred miles
from Honda’s assembly plant in Jaliso State. In 2002, F-Tech established a manufacturing
18 Interview at Tochigi, Japan, August 2006.
30

facility in Guangdong Province, China, close to Honda’s assembly plant in Guangzhou, which
opened in 1999. But not all of F-tech offshore investments are linked to Honda’s assembly
plants. The company has several plants in low cost locations including a plant in Laguna State,
the Philippines, established in 1996; a plant in Wuhan, China, near Shanghai, established in
2004; and a plant in Ayutthaya, Thailand, that was opened in 2006.
Canadian firms receive similar demands from their North American customers. The
evidence from a survey of the Canadian parts association (APMA) (see Table 10 below)
indicates that 64% of customers requested Canadian firms to expand overseas. Not surprisingly,
Canadian firms have been very responsive to their customers requests. While on average only
0.3% of the firms’ production was taking place in Asia in 2004, full 28% of all greenfield
investments over the past 5 years were made there. While this responsiveness bodes well for the
Canadian supply base, and is testament to the entrepreneurship and flexibility in the industry, it
is of course worrying from a Canadian employment standpoint.
In addition, several suppliers mention that they view expansion in Asia as a first step in
securing business from Asian automakers back in Canada. With the construction of an engine
plant by Honda in Alliston and the new Toyota plant in Woodstock, it is anticipated that local
sourcing by these Japanese firms will increase over time.
Trends in parts production: the rise of Mexico and China
At the same time that large suppliers have set up global operations, production in the
automotive industry remains to a large extent organized at a regional level. The dashed lines in
Figure 10 depict the share of sales that is concentrated in the firms’ home region or the top 100
suppliers worldwide. The average declined from approximately 68% in 1999 to 62% in 2005.
The decline was much more pronounced in North America than in the other two regions. The
fraction sold regionally even increased for large European suppliers, and for Japanese firms the
initial decline was reversed after 2003. Another factor contributing to the lower fraction of home
market sales is the growing importance of European and Japanese firms in the top 100 of
worldwide suppliers. Almost half of all large firms hailed from North America as recently as
1999 (blue solid line on left scale), but this declined to just over a third by 2005. Historically,
North American firms have been especially focused on their home market and European firms
the least, but by 2005 the relative ranking had been entirely reversed. Nevertheless, given that the
31

three regions are about equally important in vehicle production, selling two thirds of output in a
market that accounts for only one third of final demand is surprising for an industry that is
assumed to operate globally.
Mexico has become a much more important export platform for automotive parts within
North America. In 1990, Mexico ranked third as an exporter of automotive parts to the United
States ($5.2B), well behind Japan ($10.2B) and Canada ($8.4B). By 2005, Mexico occupied to
top position, with exports to the United States reaching $18.5B (see Table 7). Production of auto
parts, especially electronics and other labor-intensive parts, began in the border region of Mexico
well before NAFTA, with investments and sourcing driven by American firms seeking to cut
costs. But after NAFTA, investments surged in the interior. Except for investments to support
Nissan’s presence in Aguascalientes (see Table 6), the only high volume Japanese-owned
assembly plant in Mexico, Japanese parts suppliers have announced only a few sizable
investments in Mexico, such as Ahresty’s $66M foundry in Zacatecas and Bridgestone’s $81M
lampblack plant in Tamaulipas. Because they are so tightly tied to assembly plant investments,
most investments by Japanese auto parts companies have so far been concentrated in the United
States and Canada.
Table 6. Examples of Japanese Parts Supplier Investments Near Nissan’s Assembly Plant in Aguascalientes, Mexico Company Start Year Products Investment (US $M) Kantus Mexicana 1991 Instrument panels and plastic 25.0 Industria de Asientos Superior 1992 Seat for vehicles 26.2 Sanoh Industrial de México 1992 Tubes and connectors 2.9 Nabco Mexicana 1993 Brake system components 9.5 Yorozu Mexicana 1994 Suspension for vehicles 42.0 Yamakawa Manufacturing 1995 Stampings 33.5 Nicometal Mexicana 1995 Various steel sheets; slitting 7.4 A.T.C. Mexicana 1995 Polypropylene parts 1.6 Sistemas y Arneses K&S de Mé i
1996 Wiring and harnesses 9.0 Aisin Announced Door frames 6.0 Jatco Announced Expansion of production capacity
f “CVT” i i200
Kiriu Corporation Announced Purchase of Nissan’s foundry and unavailable bl k d i f ili dSources: Historical: Enríquez; Announced: JETRO Mexico, www.jetro.go.jp/mexico/economicas/inversion.
32

Figure 10. Regional organization of the automotive supply-base
.55
.6.6
5.7
010
2030
4050
1998 2000 2002 2004 2006year...
No. of firms (NA) Share of home market (NA)No. of firms (EU) Share of home market (EU)No. of firms (AS) Share of home market (AS)
Source: Automotive News top supplier list (various years).
As the relative weight of the automotive industry is shifting to Asia, the supplier industry
is adjusting as well. The ratio of sales by the top 100 firms carried out in Asia relative to North
American sales – across all suppliers – has increased markedly from 15 percent to 50 percent in
only 6 years. The red series in Figure 10 even suggests that the rising importance of Asian
production is accelerating after a lull following the Asian financial crisis in 1999. This relocation
of sales can be met through exports from North America or Europe or by relocating production,
which obviously has very different implications for employment.
A strong production base for parts in Asia is decreasing North American export potential
as lead firms can now source local parts for their Asian assembly plants. In addition, despite the
strength of regional production in North America, automotive parts imports from low-wage
Asian countries, especially China, are growing rapidly. Automotive parts exports from China to
the United States increased at a rate of 27% each year from 1990 to 2005.
33

Table 7. Automotive Parts Exports to the United States, $M, 1990 - 2005 Exporter 1990 1995 2000 2005 CAGR Mexico 5,154 8,945 14,570 18,535 9% Canada 8,413 7,930 13,046 16,303 5% Japan 10,189 12,166 11,913 13,504 2% Europe 4,334 4,294 6,312 9,366 5% China 114 595 1,558 4,311 27% Other Asia 1,149 1,939 2,759 3,837 8% South Korea 586 378 690 1,724 7% Other Latin America 552 593 1,178 1,601 7% Other 8,627 8,145 13,580 17,106 5% World 30,705 37,055 52,561 69,984 6%
Notes: Europe includes countries in East Europe and Scandinavia. Includes parts for aftermarket sales and repair. Source: UN Comtrade, SITC Rev 3 codes 66481, 69915, 7132, 7621, 77313, 77831/1 and 77834/5, 7842, 78431, 78432, 78433, 78434, 78435, 78436, 78439, 82112, 88571
The effect can be also illustrated indirectly, by contrasting the relative fortunes of
suppliers in North America with different product specializations. For each of the firms listed in
the top 150 OEM suppliers in North America, spanning the 1992-2005 period, we created a
dummy variable indicating large exposure to Chinese imports. This variable was given a value of
one if the firm specialized in automotive components for which Chinese import share into the
U.S. was more than twice the overall Chinese automotive import share (just under 5% in 2005).
This was the case for the following products: wheels, clocks, accumulators, radiators, windshield
wipers, lighting/visual signaling, wiring harnesses, horns, and braking systems. To err on the side
of caution, we only switched on the dummy if at least half of the products listed in Automotive
News were important Chinese imports.
We then regressed sales growth on a full set of year dummies and the year dummies
interacted with the exposure dummy. The dashed blue series reported in Figure 11 depicts the
annual interaction effects. While they are very close to zero initially and at the height of the
Asian financial crises, they become negative and large in absolute value after 2000. For the last 6
years, sales growth has been 10-15% below average for firms with a product mix that gave them
a large exposure to Chinese imports (see also Van Biesebroeck, 2005). It is impossible to know
whether the effect is manifested mainly through prices or quantities, but it was particularly large
in the years following China’s entry into the WTO.
34

Figure 11. Rising importance of imports from low-wage (Asian) countries
Source: Automotive News top supplier list (various years) Note: The bottom line plots the coefficient estimates on the interaction effects between the “at risk dummy” and year dummies in a regression with sales growth as dependent variable.
As Table 8 shows, United States imports of auto parts nearly doubled between 1995 and
2005, from just under $35 billion to $68.5 billion. During this period, Canada’s share of United
States parts imports remained constant at about 24 percent while China’s share increased from
one to five percent and Mexico’s increased from 18.5 percent to 28.3 percent. It is worth noting,
however, that the parts in which the share of Chain and Mexico increased the most dramatically,
such as electronics, brakes, and seats, were by and large the same segments in which Canada’s
share fell the most dramatically. While this suggests that Canadian firms and plants are making
a transition from labor-intensive products (e.g., seats) to more technology and capital-intensive
products (e.g., gearboxes and engine parts), these data provide very little information from a
GVC perspective. They do not reveal how the strategies lead firms and suppliers are contributing
to trade flow shifts, if multinational firms are shifting production within their own organizations,
or how they are affecting Canadian firms. In addition, they do not reveal what, exactly, is
35

included in the several very large categories described as “other.” While a thorough GVC
analysis of the global automotive parts industry could be a critical input to Canadian industrial
policy, it would require substantial original research and so remains outside the scope of this
paper.
Table 8. China, Canada, and Mexico’s Share of U.S. Imports in 1995 and 2005, by Part, Ranked by China’s share in 2005
Share of US Imports
China Canada Mexico
Total US Imports (in US
$Millions) Part 1995 2005 1995 2005 1995 2005 1995 2005 Radio-broadcast receivers for motor vehicles 6.7% 17.0% 0.1% 0.3% 19.7% 49.6% 2,074 2,577
Instrument panel and clocks for motor vehicles 0.3% 16.9% 66.9% 4.9% 0.8% 8.1% 16 14
Brakes and servo-brakes and parts 2.1% 12.1% 39.7% 24.7% 12.5% 21.3% 2,034 4,010
Non-driving axles, and parts 0.2% 8.9% 37.7% 5.5% 9.7% 27.0% 388 632
Parts for electrical ignition or starting equipment 0.4% 8.5% 8.5% 6.8% 5.6% 11.5% 259 459
Other parts and accessories 1.3% 7.6% 39.4% 26.7% 8.9% 17.6% 9,805 23,262
Seats for motor vehicles 0.1% 6.1% 87.7% 49.3% 2.3% 21.1% 239 130
Electrical lighting or signaling, etc. 1.3% 4.8% 18.5% 9.8% 9.0% 51.6% 359 1,233
Electrical ignition or starting equipment 0.7% 4.7% 3.0% 3.0% 9.4% 31.3% 713 2,009 Other parts and accessories of bodies (including cabs) 0.2% 2.6% 29.9% 38.6% 22.7% 37.8% 4,107 9,307
Parts for electrical lighting or signaling 0.2% 2.4% 16.5% 3.8% 27.0% 54.5% 312 803
Drive-axles with differential 0.0% 2.4% 36.2% 2.7% 3.3% 23.1% 519 633
Bumpers, and parts thereof 0.6% 2.4% 65.4% 55.1% 2.1% 7.8% 491 849
Ignition wiring sets 0.0% 2.0% 2.2% 1.4% 79.0% 84.8% 2,498 5,887
Rear-view mirrors for vehicles 0.2% 1.7% 3.0% 2.2% 7.0% 30.8% 72 162 Other mountings, fittings and articles suitable for motor vehicles 0.5% 0.6% 44.6% 60.7% 3.5% 16.6% 275 755
Gearboxes 0.0% 0.3% 1.4% 16.4% 0.3% 5.1% 3,835 5,972
Bodies (including cabs), for motor vehicles 0.0% 0.0% 62.7% 47.4% 21.2% 1.2% 215 823
Internal combustion piston engines for propelling vehicles 0.0% 0.0% 15.2% 32.3% 25.2% 22.4% 6,584 8,939
Total auto parts 1.0% 5.0% 23.9% 24.0% 18.5% 28.3% 34,795 68,456 Source: United Nations Commodity Trade Statistics Database (COMTRADE) http://comtrade.un.org/db/dqQuickQuery.aspx . SITC Rev3.
36

4) Canadian automotive firms: location, size, and specialization
Because there are no Canadian lead firms in the automotive industry, and because the
composition of the assembly sector is much more straightforward and much better known, we
devote a section to focus on the composition of the Canadian automotive supplier industry. The
Canadian parts industry is comprised of a varied group of firms and plants. The Auto Statistics
Flyer for 2006 indicates that in 2005 914 establishments were active in the sector, producing
original equipment and aftermarket auto parts, components and systems.19 Total employment in
2005 was 97,282 and shipments totaled $30.9 billion. In this section, we first revisit the three
main trends in the industry that were described at the end of the introduction. Then we take a
closer look at three characteristics of the Canadian plants and firms in particular: location, size
distribution, and specialization.
Three trends
The three trends that have shaped and are still affecting the automotive industry over the
last three decades can also be discerned in the evolution of the Canadian supplier industry. We
discuss in turn: (i) the increased importance of parts suppliers` relative to final assembly; (ii) the
regional integration of the industry; and (iii) the increased importance of imports from and
production in low-wage Asian countries.
The first data set that provides us with some useful statistics is the aggregated
information in the Canadian and U.S. census of manufacturers. The information for the
automotive sector is conveniently compiled each year in the DesRosiers Automotive Yearbook,
but complete statistics can also be obtained from Statistics Canada or the U.S. Bureau of the
Census. Information on production, value added, employment, salaries, material and fuel costs,
and number of active enterprises is available and broken down to 5-digit NAICS industries.
Probably the most straightforward way to gauge the rising importance of the parts sector relative
to final assembly, the first trend, is to look at total employment in the two sectors.
In Figure 12, the employment statistics are plotted for the parts sector (in solid lines with
solid markers) and for the assembly sector (in dashed lines with open markers). Canadian
19 This document is published annually by Industry Canada and can be consulted online at http://strategis.ic.gc.ca/epic/site/auto-auto.nsf/en/h_am01661e.html
37

statistics are in red (square markers) and should be read on the left scale; U.S. statistics in blue
(circles, right scale). While employment in parts has increased notably over time in both
countries, assembly employment is at best flat and even shows a slight decline in both countries
– later in Canada than in the United States.20
Figure 12. Rising importance of parts versus assembly in Canada and the United States
0
20000
40000
60000
80000
100000
1981 1986 1991 1996 2001
Tota
l em
ploy
men
t (C
anad
a)
0
200000
400000
600000
800000
1000000
Tota
l em
ploy
men
t (U
.S.)
Canada: assembly Canada: parts
USA: assembly USA: parts
Source: Statistics Canada and U.S. Bureau of the Census.
The statistics for the United States differs somewhat from those in Figure 7, in particular
parts employment is much larger here. The earlier graph used statistics from the U.S. Bureau of
Labor Statistics and limited parts to SIC 3714, “Motor Vehicle Parts and accessories,” which
excludes big ticket items such as engines or transmissions. Both graphs yield the same pattern: in
both countries, the relative weight of employment in the parts sector has increased substantially.
The same data source can be used to illustrate the second trend as well, the strong
regional focus of the industry. Table 9 contains the correlations statistics over time between each
of the four industries that are depicted in Figure 12. We find that employment in the Canadian
20 One difficulty is the introduction of the NAICS industry code in both countries, replacing the Canadian and U.S. SIC. As the earlier classification was slightly different for automotive parts in the two countries, the comparison should be done cautiously across the 1994 breakpoint.
38

assembly sector is positively correlated with all three other sectors, but the correlation with the
U.S. parts sector is greater than with its Canadian counterpart, – 0.12 versus 0.08. The U.S.
assembly sector, on the other hand, has a negative correlation over time with the Canadian parts
sector, but the negative correlation with its own domestic parts sector is almost equally large, -
0.43 versus -0.36.
Table 9. Correlation between different sectors of the North American automotive industry
Canada –assembly
Canada – parts
U.S. – assembly
U.S. - parts
Canada – assembly 1 Canada – parts 0.08 1 U.S. – assembly 0.28 -0.43 1 U.S. – parts 0.12 0.89 -0.36 1 Source: Authors’ calculations based on information from Statistics Canada and U.S. Bureau of the Census.
Within one segment of the industry, the assembly sectors in both countries display a
positive correlation of 0.28. This is not surprising as they both produce vehicles for the same
group of North American consumers, and vehicles produced in a Canadian plant are as likely to
be sold to U.S. customers as vehicles produced in a U.S. plant. The comparable correlation for
the parts sector is remarkably high at 0.89. Employment changes in the two countries are closely
synchronized in the parts sector.
Finally, a glimpse of the third trend – increased imports from or production in low-wage
(Asian) countries – can be distilled from a recent survey by the Canadian Auto Parts
Manufacturers (APMA). The results were published in 2005 by the Asia Pacific Foundation of
Canada under the title, “The East Asian Automobile Industry: Opportunity or Threat?” The main
conclusion was that the opening to the East provided both opportunities and threats, but that
Canadian firms perceived a lot of pressure to compete harder domestically and/or to establish
manufacturing facilities overseas.
A number of facts illustrate the changing geographical activities of Canadian supplier
firms and are worth highlighting. In Table 10, we have grouped the answers to five questions that
probe the surveyed firms about their own production activities, sourcing, investments, and
customer demands.
Comparing the geographical distribution of three activities – production, sourcing, and
investment – a clear trend appears away from Canada and towards Asia. While almost 70% of
39
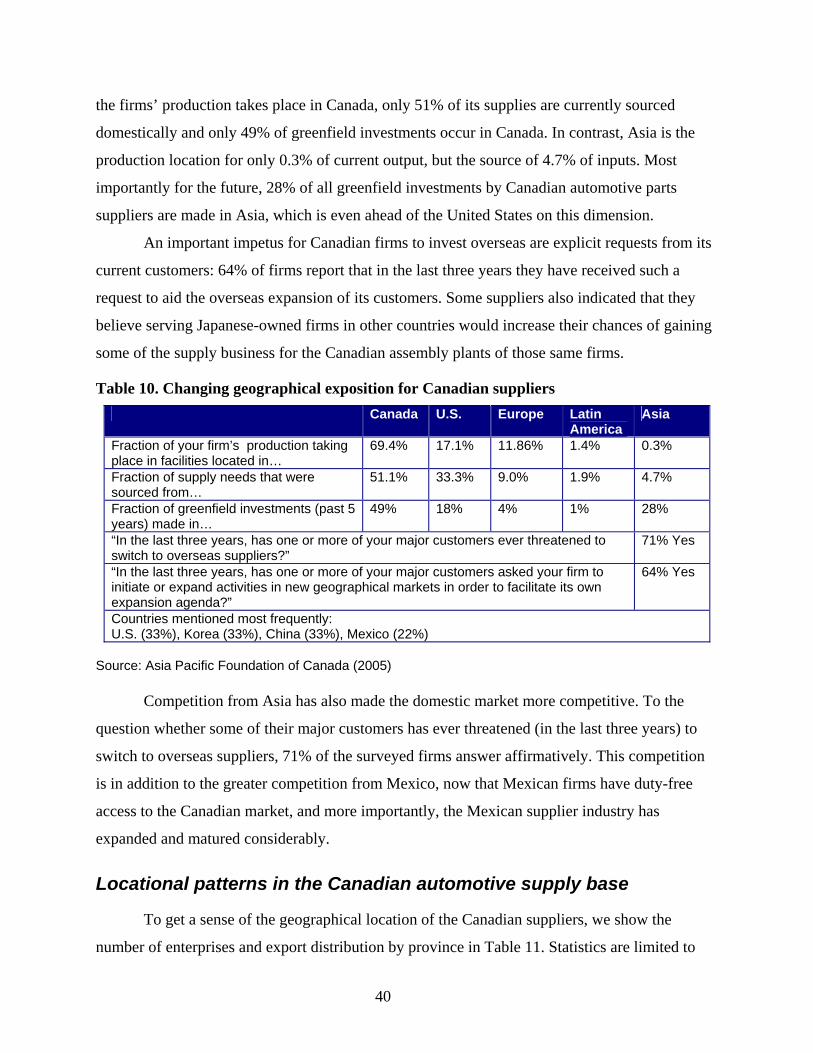
the firms’ production takes place in Canada, only 51% of its supplies are currently sourced
domestically and only 49% of greenfield investments occur in Canada. In contrast, Asia is the
production location for only 0.3% of current output, but the source of 4.7% of inputs. Most
importantly for the future, 28% of all greenfield investments by Canadian automotive parts
suppliers are made in Asia, which is even ahead of the United States on this dimension.
An important impetus for Canadian firms to invest overseas are explicit requests from its
current customers: 64% of firms report that in the last three years they have received such a
request to aid the overseas expansion of its customers. Some suppliers also indicated that they
believe serving Japanese-owned firms in other countries would increase their chances of gaining
some of the supply business for the Canadian assembly plants of those same firms.
Table 10. Changing geographical exposition for Canadian suppliers Canada U.S. Europe Latin
America Asia
Fraction of your firm’s production taking place in facilities located in…
69.4% 17.1% 11.86% 1.4% 0.3%
Fraction of supply needs that were sourced from…
51.1% 33.3% 9.0% 1.9% 4.7%
Fraction of greenfield investments (past 5 years) made in…
49% 18% 4% 1% 28%
“In the last three years, has one or more of your major customers ever threatened to switch to overseas suppliers?”
71% Yes
“In the last three years, has one or more of your major customers asked your firm to initiate or expand activities in new geographical markets in order to facilitate its own expansion agenda?”
64% Yes
Countries mentioned most frequently: U.S. (33%), Korea (33%), China (33%), Mexico (22%)
Source: Asia Pacific Foundation of Canada (2005)
Competition from Asia has also made the domestic market more competitive. To the
question whether some of their major customers has ever threatened (in the last three years) to
switch to overseas suppliers, 71% of the surveyed firms answer affirmatively. This competition
is in addition to the greater competition from Mexico, now that Mexican firms have duty-free
access to the Canadian market, and more importantly, the Mexican supplier industry has
expanded and matured considerably.
Locational patterns in the Canadian automotive supply base
To get a sense of the geographical location of the Canadian suppliers, we show the
number of enterprises and export distribution by province in Table 11. Statistics are limited to
40

the automotive parts industry, including plastics and tires. The data reveals from the 1764 firms
in the Business Registry, 1007 or 57.1% of the total are located in Ontario, followed by 350
(19.8%) in Quebec, 144 (8.2%) in British Columbia, and 108 (6.1%) in Alberta. All other
provinces host less than 5% of firms. The sector as a whole is very export oriented, selling more
than $21b worth of goods abroad in 2006. Exports are even more concentrated by province thatn
the firm distribution. Ontario by itself is responsible for 87.3% of Canadian automotive parts
exports. As is well-known in the literature, the propensity to export is positively related to firm
size. Ontario in particular has a large number of firms that employ more than 100 workers:
25.4% of all its parts suppliers. Even more striking, 78.7% of all the large parts suppliers in
Canada can be found in Ontario. The concentration of larger firms in provinces with many firms
means that the provincial concentration of total parts production is even more concentrated than
the breakdown based on the number of firms would suggest.
Table 11. Provincial distribution of Canadian suppliers
Enterprises Exports (2006)
Number Share of Canadian total
Fraction 100+ employees
current CAD (million)
share of Canadian total
Ontario 1007 57.1% 25.4% $19,126 87.3%Quebec 350 19.8% 6.7% $1,369 6.2%Nova Scotia 20 1.1% 17.6% $846 3.9%British Columbia 144 8.2% 4.9% $286 1.3%Manitoba 53 3.0% 11.4% $1646 0.7%Alberta 108 6.1% 6.7% $1016 0.5%Saskatchewan 35 2.0% 9.4% $186 0.1%New Brunswick 30 1.7% 0.0% $6.69 0.0%PEI 3 0.2% 0.0% $0.89 0.0%NL & L 14 0.8% 0.0% $0.68 0.0%Canada 1764 100.0% 16.0% $21,919 100.0%Sources: Information on the number of enterprises comes from the Business Registry database and refers to NAICS industries 3363 "Motor Vehicle Parts Manufacturing", 316293 Motor Vehicle Plastic Parts Manufacturing, and 326210 "Tire Manufacturing". Export information is from the Industry Canada web site and refers to the same industries: http://strategis.ic.gc.ca/sc_mrkti/tdst/engdoc/tr_homep.html
More detailed information on the provincial breakdown of employment is provided in
Table 12. Those statistics underscore the importance of Ontario, which employs 125,298 of the
41

total 165,737 workers in the industry.21 Approximately 75,000 of these workers are in the parts
sector. Overall, 1.35% of the Canadian workforce works in the production side of the automotive
industry and this rises even to 2.51% for Ontario.
Table 12 The Concentration of Production in Automotive Clusters
Province Cluster Wages Employment Patents
name rank total share in
region per 10,000 employees
total
Canada $43,022 165737 1.35% 12.8 212 Ontario $47,021 125298 2.51% 10.0 125 Toronto 1 $44,949 37188 1.70% 13.6 51 Windsor 2 $56,009 19521 13.24% 4.3 8 Oshawa 3 $59,405 15634 11.16% 2.0 3 Kitchener 4 $47,795 9955 4.99% 3.6 4 London 6 $49,629 7259 3.98% 7.1 5 St. Catharines 7 $50,837 5076 3.20% 3.5 2 Hamilton 9 $43,148 3950 1.28% 18.3 7 Ottawa 15 $31,825 753 0.17% 91.0 7Quebec $43,247 22355 0.77% 13.6 30 Montreal 5 $33,159 9576 0.65% 17.9 17 Quebec City 13 $30,513 1291 0.50% 25.0 3 Sherbrooke 14 $29,199 928 1.41% 19.2 2Alberta $35,417 6001 0.46% 39.1 23 Edmonton 11 $35,949 2949 0.71% Calgary 12 $36,728 1702 0.35% 38.7 7British Columbia $35,933 5947 0.40% 32.0 19 Vancouver 10 $37,045 3942 0.46% 36.6 14Manitoba $31,701 5336 1.22% 11.6 6 Winnipeg 8 $32,606 4598 1.55% 8.7 4Nova Scotia $28,705 1322 0.39% 15.5 2Saskatchewan $29,393 1231 0.37% 25.9 3New Brunswick $28,447 1049 0.38% 9.7 1Newfoundland $23,808 269 0.17% 38.0 1P. E. I. $18,363 100 0.21% 10.9 0
Source: The information is compiled by the Institute for Competitiveness and Prosperity and can be accessed at http://www.competeprosper.ca/clusters/
The fifteen most important automotive clusters are included in the table, organized by
province. Eight of the fifteen clusters are in Ontario and in some areas they make up a very
important share of the employment of the region. In the Windsor area, which is dominated by
21 In this table, the definition of the automotive industry includes parts production and final assembly. The inclusion of the final assembly sector makes it more difficult to compare salary levels in Ontario with other provinces, due to the higher pay in final assembly plants.
42

parts producers, and in the Oshawa area, the Canadian home of GM, more than 10% of the
workforce is employed directly by the automotive industry.
Looking across the different clusters, the average salary tends to decline with the size of
the cluster. It is also striking how large the salary differences are within this narrowly defined
industry, ranging from an average of $59,405 in Oshawa to $18,363 in P.E.I: a ratio of more than
3 to 1. Clearly, not each automotive job is the same. The last two columns of Table 12 give
information on the average rate of patenting activity in the different clusters. The amount of
innovative activity per employee is particularly high in Ottawa, Vancouver, and Calgary, but the
moderate size of the industry in those clusters limits the average annual number of patents in
those three clusters to 28. In contrast, the amount of innovation generated per employee in
Ontario is slightly below the country average, but the mere size of the industry in that province
still guarantees that almost 60% of Canadian automotive patents are generated in Ontario.
While the information in Table 11 and Table 12 gives some idea about the geographical
distribution of the current industry, locational choices are made on a continuing basis. One very
illuminating window on location decisions of suppliers in North America is provided by the
work of Thomas Klier at the Federal Reserve Board of Chicago. A proprietary data set from a
private company, ELM International, was supplemented with information from the state
manufacturing directories and from supplier companies directly. This information allows him to
paint a comprehensive picture of the location of automotive supplier plants at several points in
time and study the location decisions of new plants. Almost 3,800 plants are observed in the
United States and Canada combined in 2003.
In the recent past, locations of U.S. supplier plants were particularly concentrated. Each
black circle on the left map of Figure 13 represents a plant and the size of the circle is
proportional to employment size. In 1980, firms are concentrated in the Detroit area, on the east
coast of Lake Huron in Michigan and around Chicago.22 The large presence of supplier plants in
Indiana and Ohio is also clearly visible. In Ontario, plants are concentrated near the U.S. border
in Windsor and St. Catharines, around assembly plants in Southern Ontario, but also the Greater
Toronto metropolitan area (GTA) attracted a lot of industrial activity.
22 The econometric evidence indicates that plants farther from Detroit tend to be bigger, as are plants owned by foreign firms or Tier 1 suppliers.
43

Over the last 24 years, the geographic concentration has diminished in the United States
as plant entry between 1980 and 2003 was particularly important in southern states. While
Kentucky and Tennessee already had a solid supplier base prior to 1980, the establishment of
several new assembly plants there attracted many more new supplier plants as well. Moreover,
entry was also important in northern Alabama and Georgia and in the western parts of the
Carolinas and even Virginia. In these states, the number of suppliers almost doubled, which
increased their importance relative to the Midwestern states. Prior to 1980, 69% of all new plant
openings were in the Midwest, compared to 59% post 1980. In contrast, the share of plants
entering the U.S. South jumped from 19% to 34% over the same time period.
Figure 13. Changing geography of auto parts suppliers, by plant density
Source: Klier and Rubenstein (2006)
44

Entry in the United States after 1980 was dominated by foreign plants everywhere, but
this was particularly pronounced in the South. On the right map of Figure 2.2, blue dots (which
represent entry by a foreign-owned plant) outnumber grey dots (representing new plants by U.S.
or Canadian firms) and this becomes more pronounced towards the South.
The Canadian experience differs from the United States in a number of respects. New
entrants have settled by and large in the same locations as existing plants. The Canadian dots in
the right map of Figure 2.2 cover about the same area as on the left map. The only established
automotive area that seems to have attracted very few new investments is the area east of
Toronto, close to the GM plants in Oshawa, but farthest from the U.S. market. Moreover, grey
dots (North American firms) are at least as common as blue dots (foreign firms). This is
especially surprising as the importance of Japanese assembly plants in Ontario (including the
CAMI joint venture) has increased greatly between 1980 and 2003.
For Ontario, detailed information is available through the work of Fitzgibbon, Holmes,
and Rutherford (2004), which study the cluster of tool, die, and mould makers in Windsor-Essex
country. In an earlier paper with Kumar (Fitzgibbon, Holmes, Rutherford, and Kumar, 2004),
they give a descriptive overview of the automotive parts industry in Ontario. Important
geographic clusters in Ontario are: (i) Greater Toronto Area; (ii) Windsor; (iii) Oshawa; and (iv)
a string of communities in central Southern Ontario, comprised of Kitchener, Waterloo,
Cambridge, Guelph, Stratford, Brantford, and London.
Table 13 lists the automotive suppliers in the Windsor area by specialization. The
researchers estimate that there are approximately 250 establishments in the area engaged in tool
and die, fixture, and industrial mould-making, the vast majority of which are linked to the
automotive industry. They interviewed a large number of participants in the industry, focusing in
particular on the modes of innovation. An important observation that the authors make is that:
“Despite the emergence of a small core of globally competitive and innovative Canadian-based auto components suppliers, […]it is estimated that only two per cent of Canadian auto parts firms have a strategy based on proprietary product technology, and overall research and development expenditures in the auto sector are less than half of the Canadian manufacturing average (Industry Canada, 1998). Furthermore, while the absolute performance has improved, Canadian-owned automotive parts plants continue to lag behind foreign-owned plants in terms of productivity and wages. The general lack of automotive R&D activity in Canada is in part a legacy of the integration of the Canadian and US industries in
45

the post-Auto Pact period when the Big Three automakers centralized R&D and design to the United States, particularly to Michigan and California“ (Fitzgibbon, Holmes, and Rutherford, 2004, p. 9).
The authors’ interviews support the view that there is not a strong knowledge-based
innovation strategy amongst Canadian auto parts producers in general. On the other hand,
there is strong evidence of a focus on incremental process innovation. While the University of
Windsor has established several research centers to foster collaborative R&D with the
automotive industry, it has by and large focused on the OEMs and only a few of the largest
suppliers.
Table 13. Automotive industry related establishments: Windsor-Essex County (2003)
Employment Category1 No. of plants2
Percent of total Total2 Mean
Average date of establishment
Total 504 48605 753 1980 Final assembly 1 0.2% 11500 1925 ‘Core’ Auto Parts Subassembly of Parts 27 5.5% 9240 342 1976 Auto parts – metal 30 6.0% 10899 363 1971 Auto parts – plastic 25 5.0% 3768 151 1984 Stampings 35 6.5% 4072 120 1972 Other auto parts 22 4.6% 4811 209 1975
Machinery, Tool, Die and Industrial Moulds Tool and die 127 25.2% 4429 36 1981 Fixtures 67 13.3% 2610 39 1982 Moulds 124 24.6% 6129 51 1983 Production automation, etc. 57 11.3% 2739 49 1983 Engraving/polishing/detailing 26 5.2% 461 18 1981 Design/prototypes/testing 97 19.2% 5277 56 1981 Other production goods 105 20.8% 3539 34 1980 Metal Processing Other metal fabrications 99 19.6% 4346 45 1980 Metal treatment 17 3.4% 848 50 1980 Other Production Services Sequencing/packaging/recycle 10 2.0% 798 80 1965 Production consumables 14 2.8% 445 33 1979
Source: Fitzgibbon, Holmes, and Rutherford (2004)
Notes: 1 Subassembly includes everything from welding of several parts together to complete vehicle subsystems. Other auto parts is comprised mainly of producers of electrical parts and producers who did not specify which parts they produced. Production consumables include oils, fluids, cleaners, abrasives, chemicals and paints. Other production goods include complete production machines and goods which did not fit into other categories. 2
Subcategories do not sum to total because plants were coded in all categories that applied. 3 The average employment for all plants is calculated without the Daimler-Chrysler Windsor Assembly Plant.
46

The last topic we discuss in this section on location is the importance of several
difficulties, as perceived by the automotive industry in Canada. While this is clearly not a
defining characteristic for the Canadian firms, we discuss it here because the leading concern is
trade infrastructure, especially border crossings, and this certainly influences firms’ location
decisions. The information in Table 14 is taken from the work of the Canadian Automotive
Partnership Council (CAPC), the main forum for government-industry consultation on issues of
importance to the Canadian automotive industry. Its members meet annually to discuss progress
towards objective and launch new initiatives. At these meetings, each of eight working groups
report the status on topics that fall under its mandate, ranking them as “immediate action
required (red),” “attention required (yellow),” or “addressed (green).”
Table 14. Priority areas indicated by the Canadian Automotive Partnership Council (statistics indicate urgency of required action on a 0-10 scale) Working group Main issues Oct. 2006
status Overall
Trade Infrastructure Border Emergency and security issues Rail/alternative vessels
7.5 10.0 5.0
8.0
Sustainability Vehicle emissions & fuel standards Feebates Energy Consumer program World leader in manufacturing
6.3 5.0
10.0 8.8 5.0
7.2
International Trade Canadian dollar FTA with Korea Strategic trade/investment WTO round Trade with emerging economies
10.0 10.0 5.0 5.0 5.0
7.0
Regulatory Harmonization
Formal policy Fuel efficiency and emissions Recognition of self-certification Specific regulations
5.0 5.0
10.0 6.7
6.3
Innovation Financial support Consumer support Private-Public capacity Light materials - SME
4.5 8.8 5.0 5 .0
5.5
Fiscal & Investment Investment subsidies Taxation Lessor liability
2.5 5.5 2.5
4.7
Human Resources Development
Analysis & strategy Training initiatives Cooperative and LT projects
0.0 1.7 2.5
1.4
Source: CAPC web site at http://www.capcinfo.caNote: The overall status is calculated by taking a simple average over all topics listed using 0 (green), 5 (yellow), 10 (red), which yields a score from 0-10 with higher numbers indicating greater need for immediate action.
47
At the top of the industry’s agenda are trade infrastructure issues, especially emergency
and security plans and border crossings. International trade issues are also sources of concern,
especially the appreciation of the dollar and the currently negotiated Free Trade Agreement
(FTA) with South Korea. Issues of sustainability and regulatory harmonization, which are
receiving increasing policy attention, are also perceived as areas where action is required. In
contrast, issues that were priorities in the past two decades, such as adjusting the fiscal policies
and investment subsidies and especially human resource development, are no longer seen as
requiring action. It should be noted that the concerns of this group are much more representative
of the opinions of the large firms in the industry, dominated by the OEMs and Magna. The
APMA survey mentioned earlier clearly indicated that smaller firms find investment subsidies
the most important government policy—with border infrastructure also mentioned prominently
there (see Van Biesebroeck, 2006b).
The size distribution of Canadian automotive suppliers
Information collected by the OECD allows us to compare the size distribution of firms
across countries. We can also compare the contribution of different size classes in employment
and total remuneration. Unfortunately, the information is relatively aggregated, covering the
motor vehicle industry in the United States and Japan and the transportation equipment industry
in Canada and Mexico. In addition, the last year for which we have data is 1994 (1993 for
Mexico), although it is unlikely that the size distribution will change quickly over time.
In the United States and Canada, the distribution is clearly weighted towards smaller
firms in Canada (see Table 10). Half of all enterprises in Canada employ fewer than 5
employees, but these account for less than 1% of employment in the industry. In contrast, U.S.
firms of more than 500 employees are more than twice as prevalent as in Canada, and account
for 83.4% of U.S. employment in the industry. The size distribution of establishments (plants) in
Japan and Mexico suggests that the United States is more of an outlier than Canada. Both of
these countries also contain many fewer large plants and the fraction of their employment in
large plants is similar to Canada.
One reason for the importance of large firms is that they tend to pay higher salaries.
Dividing the remuneration and employment statistics, we find that the U.S. salary per worker is
similar to Canada’s in the first four employment classes – in the 100-499 employees class,
48

average pay is even higher in Canada than in the United States: $39,520 versus $38,242 (both
figures in CAD). However, U.S. employees and especially Japanese employees earn much more
than Canadians in the large-firm class: $51,744 (Canada), $62,147 (U.S.), and $79,919 (Japan).
Coupled with a higher fraction of the automotive workforce employed at large firms in the
United States, the average salary per worker (in 1994) was 17.8% lower in Canada than in the
U.S. and the gap with Japanese earnings was even larger, at 31.8%.
Another indication of the relatively small size of Canadian suppliers is their relative
absence from the stock market. Very few automotive suppliers are sufficiently large to tap the
capital markets as a public company. We went over all firms listed in a number of relevant
industry groups at the Toronto Stock Exchange (TSX) and we found only 25 firms that list the
automotive sector as an important area of their activities.
Table 15. Distribution of firms, plants, employment, and remuneration by employee size class (1994)
Employment class 0-4 5-19 20-49 50-99 100-499 500+
Number of enterprises U.S. 30.7% 31.7% 21.2% 9.6% 6.9% Canada 49.4% 23.0% 11.0% 5.4% 8.5% 2.6% Number of establishments U.S. 25.9% 26.8% 18.4% 9.7% 19.1% Japan / 63.0% 18.6% 7.8% 8.2% 2.4% Mexico 65.2% 20.9% 5.8% 8.1% Employment U.S. 0.3% 1.8% 5.1% 9.4% 83.4% Canada 0.8% 2.4% 3.4% 3.8% 18.4% 71.3% Japan / 7.2% 7.5% 7.2% 22.3% 55.9% Mexico 2.8% 7.4% 8.3% 81.5% Remuneration U.S. 0.3% 0.9% 3.0% 6.1% 89.7% Canada 0.5% 1.6% 2.3% 2.7% 15.3% 77.6% Japan / 4.5% 5.4% 5.6% 20.3% 64.2% Notes: Japanese firms are only included if they employ at least 4 employees. The Mexican size classes are slightly different: 1-15, 16-100, 100-250, 250+. Source: OECD (unpublished statistics)
In Table 16, this group of 25 companies is broken down by industry group and asset size
class. Of the three firms with assets above $1 billion, only Magna International truly specializes
49

in automotive products; the other two are Ballard Power Systems and Alcan. At an earlier point,
Magna had listed several of its subsidiaries (Decoma, Intier, and Tesma), but by 2004 they had
been consolidated again in a single listing for Magna International. On the U.S. stock exchanges,
more than 60 companies are listed in the restrictively defined “Auto Parts” sector – slightly more
narrow than the Canadian industry group “industrial products – autos and parts,” which counted
only 7 listings in the 2004-2006 period. Only one firm, Magna, is co-listed in the United States
and Canada.23 Some of the largest Canadian firms active as automotive suppliers are privately
held, in particular Woodbridge Group, Multimatic, the ABC Group, AGS Automotive Systems,
and Meridian Technologies. The last two were taken private in 2003 and 1998.
Table 16. Public companies with a substantial automotive specialization listed on the Toronto Stock Exchange (2004-2006)
Industry group No. Size (assets) No. industrial products - autos and parts 7 > $1b 3 consumer products - autos and parts 6 $500m – 1b 7 industrial products - fabrication and engineering
7 $100-500m 4
Industrial products - technology 2 $25-100m 6 industrial products - transportation equipment
1 $5-25m 2
Junior industrial 1 < $5m 3 Other 1 Total 25 Total 25 Source: Information on all Canadian listed companies is available at http://www.sedar.com.
Specialization in the Canadian automotive supply base
The last topic we discuss is the specialization of the Canadian parts industry, and we use
the information from the Census of Manufacturers again. For Canada, the parts industry is
broken down into eight 5-digit sectors and we aggregate the U.S. information slightly to cover
the same classification. Employment or value added information can be used to discern which
sectors Canadian firms are specializing in relative to the U.S.
The breakdown looks somewhat different if we decompose employment, an input
measure, or value added, and output measure. Both are shown in Figure 14 and Figure 15. The
largest Canadian sub-sector is “other automotive parts,” using either measure: 27.0% of
Canadian parts workers are employed in that sector, compared to 23.8% in the U.S. By far the
23 Ballard and Alcan are listed on NASDAQ and NYSE, respectively, but not classified under “Auto Parts”.
50

second largest sector in Canada is “metal stampings,” employing a further 17.2% of workers. In
the United States, the “metal stampings” sector is also the second largest employer, but in terms
of value added, three other sectors are more important. In order, these are “power trains and
transmissions,” “engines and engine parts,” and “electrical and electronic parts.” These three
sectors are the three highest value-added-per-worker sectors of the parts industry and the
combined employment share in the United States (40.1%) is substantially higher than in Canada
(31.7%). The difference is largest for the third sector, which is not only the highest value added
in the industry, but it is also the most rapidly expanding. The sector where the Canadian
employment share is most above the United States is “seating and interior,” one of the strongest
areas of Magna International. Unfortunately, this is also the value chain segment with the lowest
value added per worker of all sectors, although the gap with the average is much larger in the
United States than in Canada.
Figure 14. Breakdown of the automotive parts sector by employment shares (2003)
U.S. Canada
11.9%
7.7%
4.8%
6.9%
12.4%
12.1%
17.2%
27.0%
engine & parts electrical & electronic
steering & suspension brake system
transmission & powertrain seating & interior
metal stamping other
13.0%
13.8%
5.9%
6.1%
13.3%8.2%
15.9%
23.8%
Source: Authors’ calculations based on information from Statistics Canada and U.S. Bureau of the Census.
51

Figure 15. Breakdown of the automotive parts sector by value added shares (2003)
U.S. Canada
16.5%
5.8%
5.4%
6.1%
12.4%
11.7%
17.0%
25.1%
engine & parts electrical & electronic
steering & suspension brake system
transmission & powertrain seating & interior
metal stamping other
15.0%
14.9%
5.9%
5.6%
15.9%
6.7%
14.7%
21.3%
Source: Authors’ calculations based on information from Statistics Canada and U.S. Bureau of the Census.
We can look at the specialization of the Canadian parts sector in a different way. In
Figure 16, we plot a number of relative measures, each indicating the position of the Canadian
industry relative to its U.S. counterpart, always normalized by the total automotive parts sector.
The first series (in yellow) indicates the relative employment share of the Canadian sector. For
the parts sector as a whole, 11.7% of all employees in the United States and Canada combined
are in Canada, while this fraction is slightly lower in the “engine & engine parts” (10.8%) and
slightly higher in the “brake system” sector (12.9%). Normalized by 11.7%, this gives the values
in the figure of 0.92 and 1.10, respectively. The orange bars denote similar statistics, but using
value added share.
The red bars compare labor productivity in Canada to the United States, again normalized
by the sectoral total. On average, a Canadian employee in the parts sector generated $121,000 in
2003, which was 31% the value added per worker in the U.S. industry – $176,000 (in Canadian
dollar) in the same year. The relative Canadian labor productivity clearly varies across sectors,
but it is never as high as in the United States. The best (relative) Canadian performance is in
52

“engines & engine parts”, where the 1.20 statistic on the graph indicate that the gap with the U.S.
labor productivity is only 17%, or 20% better than the average gap.
It is clear from the graph that in most cases relative employment and value added shares
go together with the labor productivity numbers. For example, in the “electrical and electronic
parts” sub-sector, the share of Canadian employment and value added in the North American
total is much below the average for the parts sector, and its productivity level is also more than
30% below the average. In contrast, in “seating & interior,” Canada has a disproportionate share,
but also a relatively high labor productivity.
The final statistics to point out are the white bars that indicate in an absolute sense how
labor productivity compares across the different sub-sectors (taking a weighted average of
Canada and the United States). For example, “steering and suspension” had a value added per
employee of $171,709, almost identical to the average for the entire parts sector across the two
countries, which was $171,462. Clearly, the two sectors that Canada is specializing in the least –
its share is low and its productivity gap with the United States is highest – are two of the highest
value added per worker sub-sectors in the industry: “electrical & electronic” and “transmission
and power train”. The only high-value-added industry that Canada is well-represented in is
“engines & engine parts,” but here value added per worker has plunged from $224,000 in 1997
to $168,000 in 2003, while value added per worker has risen by 50% in the United States over
the same period. Quite starkly, the four sectors where the Canadian employment share exceeds
the part sector average (“brakes,” “seating,” “stamping,” and “other”) are the four sectors with
the lowest value added per worker.
53
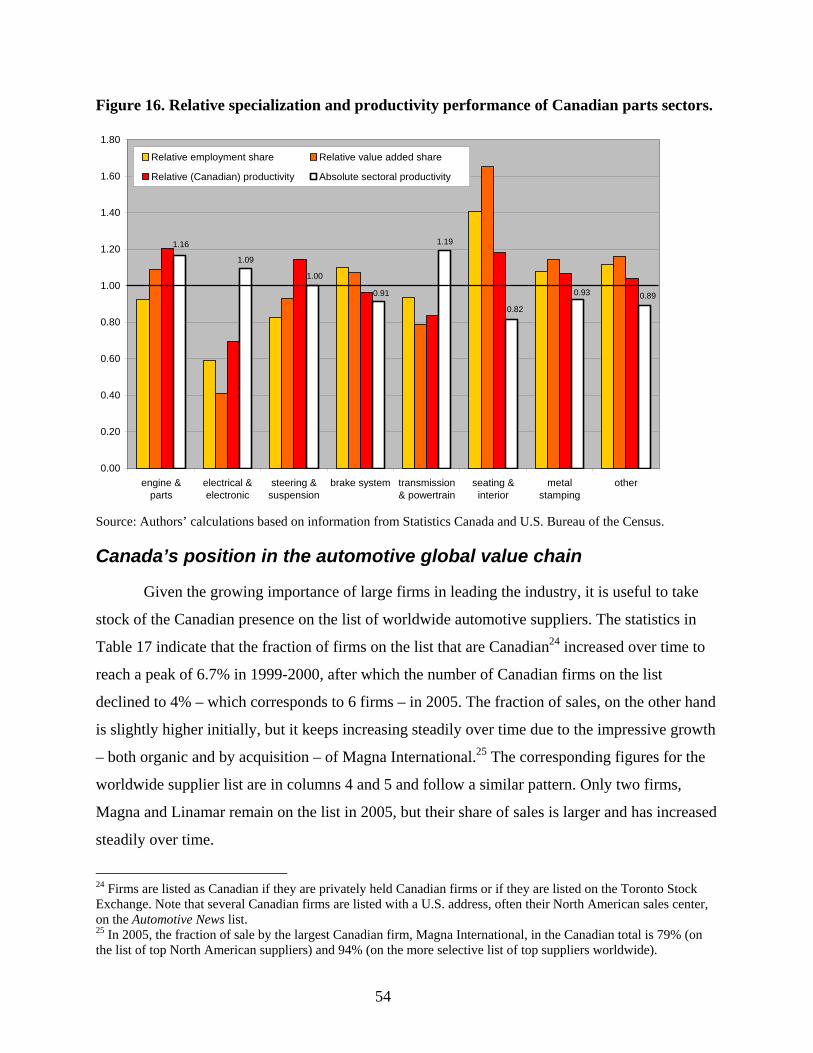
Figure 16. Relative specialization and productivity performance of Canadian parts sectors.
1.09
1.19
0.890.93
0.82
0.91
1.16
1.00
0.00
0.20
0.40
0.60
0.80
1.00
1.20
1.40
1.60
1.80
engine &parts
electrical &electronic
steering &suspension
brake system transmission& powertrain
seating &interior
metalstamping
other
Relative employment share Relative value added share
Relative (Canadian) productivity Absolute sectoral productivity
Source: Authors’ calculations based on information from Statistics Canada and U.S. Bureau of the Census.
Canada’s position in the automotive global value chain
Given the growing importance of large firms in leading the industry, it is useful to take
stock of the Canadian presence on the list of worldwide automotive suppliers. The statistics in
Table 17 indicate that the fraction of firms on the list that are Canadian24 increased over time to
reach a peak of 6.7% in 1999-2000, after which the number of Canadian firms on the list
declined to 4% – which corresponds to 6 firms – in 2005. The fraction of sales, on the other hand
is slightly higher initially, but it keeps increasing steadily over time due to the impressive growth
– both organic and by acquisition – of Magna International.25 The corresponding figures for the
worldwide supplier list are in columns 4 and 5 and follow a similar pattern. Only two firms,
Magna and Linamar remain on the list in 2005, but their share of sales is larger and has increased
steadily over time.
24 Firms are listed as Canadian if they are privately held Canadian firms or if they are listed on the Toronto Stock Exchange. Note that several Canadian firms are listed with a U.S. address, often their North American sales center, on the Automotive News list. 25 In 2005, the fraction of sale by the largest Canadian firm, Magna International, in the Canadian total is 79% (on the list of top North American suppliers) and 94% (on the more selective list of top suppliers worldwide).
54

As a benchmark, we have also indicated the fraction of vehicle production in North
America and worldwide that takes place in Canadian assembly plants. In the former case, that
fraction was initially 5 times higher than the fraction of sales, but only twice as high in 2005. The
worldwide sales of Canadian suppliers even exceeds the Canadian share in worldwide vehicle
production – 4.8% versus 4.1%.
Table 17. Canadian presence on the list of the world’s largest automotive parts suppliers
North America Worldwide
Fraction of firms (on list)
Fraction of sales (on list)
Fraction of vehicle production
Fraction of firms (on list)
Fraction of sales (on list)
Fraction of vehicle production
1992 3.0% 3.1% 15.4% 1993 3.0% 3.6% 15.8% 1994 5.0% 3.2% 14.8% 1995 5.3% 3.3% 15.7% 1996 5.3% 4.0% 15.5% 1997 4.7% 4.0% 16.0% 1998 6.0% 4.5% 16.0% 1999 6.7% 5.2% 17.4% 4% 3.3% 5.5% 2000 6.7% 5.8% 16.8% 3% 3.3% 5.2% 2001 5.3% 5.9% 16.0% 4% 3.8% 4.5% 2002 4.7% 5.8% 15.7% 3% 3.8% 4.5% 2003 5.3% 6.6% 16.2% 2% 4.1% 4.4% 2004 5.3% 6.8% 16.7% 3% 4.7% 4.2% 2005 4.0% 7.9% 15.4% 2% 4.8% 4.1% Source: Authors’ calculations based on information from the Automotive News top supplier lists (various years) and Ward’s Automotive Yearbook (production statistics).
The initial wave of mergers among component suppliers in the 1990s propelled several
Canadian firms into the top 150, but the continuation of the mergers lead to several foreign
takeovers. Another way “Canadian” firms have left the list is by the closing or relocation of
regional headquarters.26 Some foreign-owned firms with important Canadian operations have
folded their Canadian headquarters with office staff and much of research into the main
headquarters of their parent. While these firms were never really Canadian to begin with, their
regional headquarters often had design or engineering centers that provide a more stable and
permanent range of activities to complement manufacturing. Table 18 (and the notes below it)
26 Examples are the last and third last firms in Table 18.
55

provide a comprehensive overview of the experiences of the universe of Canadian firms that ever
made the top 150 list.
Table 18. Canadian firms in top 150 OEM suppliers for North America 1993
(top 100) 1995 1997 1999 2001 2003 2005
Magna International 7 11 7 6 5 4 2 Woodbridge Group1 29 41 62 60 65 63 83 Fabricated Steel Products2 71 91 150 (12) Linamar Corp.3 (?) 66 63 54 61 55 44 AG. Simpson Automotive4 (60) 50 91 122 133 142 Multimatic 107 116 107 103 105 94 ABC Group 82 105 110 90 79 70 Meridian Technologies 119 117 134 128 138 Alcan Automotive5 (?) (79) (?) (?) 62 135 Ventra Group6 102 134 102 131 (40) Tesma International7 (108) FAG Automotive8 143 Bernard Faure NA9 150 64 (44) Decoma Int. 10 80 (5) F&P Mfg11 125 (102) Source: Automotive News top supplier list (various years) Notes: 1 Automotive HQ is in the USA (MI). 2 Purchased by Krupp and renamed Krupp FABCO Inc. in 1997; Ranked independently 144 in 1998; Included with Budd Co. & Krupp Hoesch Automotive of America & Thyssen into ThyssenKrupp Automotive AG for 1999. 3 Not on list yet, although it should have been given its sales at the time. 4 Renamed A.G.S. Automotive Systems in 2003. Appeared on the list in 1996 although they report $500m sales in 1995, which would have put them at #60. 5 Alcan Automotive: formed after 2000 merger between Alcan and Alusuisse Group; HQ in USA (MI). Spun-off in 2005 to create Novelis, HQ in Atlanta, GA and NA HQ in Cleveland, OH, still a Canadian corporation (listed on TSX and NYSE). Alcan should be on the list in other years as well, but it is only listed in 1996 “Alcan Corp., Mayfield Heights, OH”. 6 Automotive HQ moved to Rochester Hills, MI in 1998. Acquired by Flex-N-Gate in 2002. 7 They are only listed in 2000 at #83. The sales number they report for 1999 should have placed them at #108. After a brief spell as a public company they were merged back into Magna International. 8 FAG Automotive has their North American headquarters in the location of FAG Bearings Limited, in Stratford ON. The product design and export sales departments are located there. The plant was started as a subsidiary in 1954. 9 Bertrand Faure NA: had regional NA HQ in Mississauga, ON; merged into Faurecia in 1999. Currently it has 3 plants in Canada, but 12 in the U.S.; its 3 NA design and development centers are in the U.S. 10 Decoma International: Started in 1979 as joint venture between Magna and Uniroyal, which dissolved in 1983. Became a separate public company in 1998 with regional HQ in Concord, ON. Moved HQ to USA (MI) in 2000, but re-absorbed into Magna afterwards. 11 F&P Manufacturing: Parent company is Ftech, Inc. (Japan). They had NA regional HQ in Tottenham, ON; moved HQ to USA (OH) in 2001. Established F.Tech North America Inc. and F.Tech R&D North America Inc. in 2003, also in OH.
56

Moreover, the increased integration between assemblers and suppliers has motivated a lot
of suppliers to make sure they are located close to the headquarters of vehicle assemblers or the
largest tier 1 suppliers, which for North America are concentrated in the Detroit area. While the
fraction of U.S. firms on the top 150 list has been declining steadily over the last decade (see
Figure 17), it does not show up on the list of offices that report directly to Automotive News,
which will include regional headquarters. In terms of ownership, the main trend is for a decline
of U.S. companies and rising importance of European and Japanese firms. Canadian and
Mexican firms featured slightly more prominently in 2000, but by 2005 they had returned to the
same fraction of top suppliers as in 1995.
In contrast, the geographic dispersion of the offices of all top 150 suppliers in North
America is documented in detail in Figure 18. The series at the top are limited to the 50 largest
firms and the series at the bottom are for firms ranked 51-100 (light bars are for 1995 and dark
bars for 2005). The importance of Detroit, home of GM, Ford, and DaimlerChrysler, is striking.
The vast majority of the very large suppliers are located there and half of the next group of firms
as well. The tiered supplier system is motivating many firms to locate close to their biggest
clients, which in turn provides incentives for their suppliers, and so forth.
The concentration has even increased over time, with the rest of Michigan and the other
midwestern states especially, losing headquarters. Even the South, which has attracted several
new assembly plants in the last decade, has lost headquarters. For the second group of firms
(ranked 51-150), the concentration around Detroit is not as pronounced, but also increasing over
time. The Northeast, in particular, has lost almost all its suppliers. The total number of firms that
report a Canadian address has been unchanged over time.
While location of headquarters is only one aspect of the operation of firms, it does
determine where the decision makers in the firms are located and it is bound to influence its
sourcing strategy. While Canada has some influence in the industry (through Magna and a few
other large suppliers), most decisions that affect the Canadian industry are taken in Detroit.
While Canada shares this position with all other U.S. jurisdictions, it is noteworthy that no
foreign supplier has chosen to keep its North American headquarters in Canada.
57

Figure 17. Nationality composition of top North American suppliers (nationality of parent)
0
10
20
30
40
50
60
70
80
USA Canadian Mexican European Japanese
Perc
enta
ge o
f firm
s
1995 2000 2005
Note: First Korean firm entered the list of top 150 NA suppliers in 2005 Source: Automotive News top supplier list (various years)
Figure 18. Location of supplier headquarters
(50)
(30)
(10)
10
30
50
70
DetroitMSA
Michigan Midwest North-East South West Canada Mexico Overseas
Perc
enta
ge o
f firm
s
Fraction of top 50 firms (1995)
Fraction of top 50 firms (2005)
Fraction of top 51-150 firms (1995)
Fraction of top 51-150 firms (2005)
Notes: Detroit MSA are all towns and cities within 30 miles of Detroit downtown. The state groupings follows the U.S. Census “region” classification: Midwest comprises: IN, IL, OH, WI, MN; North East is NH, NJ, NY, PA; South is FL, KY, MO, MS, NC, SC, TN, TX, VA; and West is CA, CO, UT Source: Automotive News top supplier list (various years)
58

5) Conclusions and Recommendations
Key findings:
1) The auto industry in Ontario has been around for a long time and it is still a strong
industrial center, but the supporting supply base within and outside Canada is
shifting in composition and location.
2) The shift of the industry to the South within North America is real but gradual,
and mostly within the United States.
3) Lead firms bring a lot of primary and secondary investment with them.
4) Japanese lead firms will continue to invest in Canada, which is likely to trigger
further investments by Japanese suppliers.
5) Most design work is concentrated near lead firm headquarters; none of these are
located in Canada.
6) Canadian firms are suppliers, not assemblers (lead firms). Most are small and not
technologically advanced. Only Magna International, and to a lesser extent
Linamar, have a truly global footprint although many firms operate
internationally.
7) Parts imports from low-wage countries in Asia, especially China, are small but
increasing rapidly.
8) Parts exports from Mexico to the United States are increasing rapidly.
We conclude that the Canadian automotive industry, while not currently in crisis, faces
the possibility of gradual marginalization within automotive global value chains over the long
term. The Canadian automotive industry is part of a global industry with strong regional
elements nested within it. At the global level, the industry is shifting investment toward large
developing countries, such as China, India, and Brazil, where markets are growing rapidly. At
the regional level, Canada’s ties to the U.S. market have been the lifeblood of the industry, so the
continued viability of regional production, at a time when other industries are rapidly shifting
production to China, might seem to be good news.
But a gradual and seemingly inexorable shift of production within North America, to the
U.S. South (for final assembly and parts) and Mexico (for parts), and the eroding market share of
the Big 3 American automakers, is slowly undermining Canada’s position. Another vulnerability,
59

for Canada, as well as the North American automotive supply-base as a whole, comes from
rising parts imports from outside North America, especially China. For Canada, all of these
vulnerabilities stem from the importance of the automotive parts sector, and the confinement of
Canadian firms to the supplier role in automotive global value chains.
These conclusions suggest that Canadian policy-makers need to focus on two main areas
for maintaining and upgrading the position of the Canadian industry within automotive global
value chains.
• The first is to enhance Canada’s ability to attract new investment in final assembly,
especially by automakers that are currently increasing their share of the North American
market, such as Toyota and Honda. As their market share has increased, a larger share of
U.S. demand has been met though imports from Japan. These firms are responding to this
growing imbalance by planning a new wave of assembly plant investment in North America.
However, judging from recent investment patterns and company statements, the southern
United States appears to be the primary target for this new investment. Since the automotive
industry tends to operate in clusters, with suppliers often serving several nearby assembly
plants, the urgent question for Canadian policy-makers is how they can attract a substantial
share of this new investment.
• The second policy area is support for upgrading the Canadian supply-base. The dominant
firms in the industry are all based in countries other than Canada. Canada is headquarters to
only one of the top 100 suppliers to the automotive industry and only a handful of the top 150
North American suppliers. Domestic firms tend to be small and focused on low-value added
segments. Labor productivity is extremely low in these small firms, and they tend to
specialize in the least technology-intensive areas of the industry, such as plastics, metal
stampings, and interior parts (the only parts segments where Canada has a positive balance of
trade). Few Canadian suppliers, with the exception of a handful of the largest firms listed in
Table 17, have the capability to support their customers outside of North America. Canadian
parts suppliers, like automotive suppliers everywhere, need to improve their ability to work
for multiple customers, both within and outside of the automotive industry. This has become
even more critical in an era when U.S. assemblers are announcing new plant closures and
employment cutbacks in North America virtually every month.
60

Being tied too closely to the Big 3 has its obvious problems, but market share in the
automotive industry can change unpredictably, and being tied too closely to even the most
successful firm can create problems for suppliers as conditions change. However, there are
historical, structural, and technical reasons why it is difficult for suppliers to develop profitable
relationships with multiple customers in the automotive industry, and it is difficult to know how
government policy can change these long standing conditions. For example, extremely high
barriers to entry mean that Canadian firms are unable to develop new products and influence the
trajectory of market development on their own terms. As a result, most innovative work in the
industry will continue to take place outside of Canada. It will be difficult for Canada to generate
new economic development through innovation because firms tend to keep the industry’s most
innovative work closely tied to the main research and development facilities of lead firms.
Given the many ways in which central and provincial government policy in Canada
already supports the automotive industry, either directly through incentives for new investments
in final assembly, or indirectly through infrastructure improvements, skill development, and
R&D credits for local firms, it is important to develop fresh thinking about how government
policy can improve the position of Canada within automotive global value chains. The good
news is that changes in the automotive industry tend to unfold relatively gradually. This gives
Canadian policymakers a window of opportunity to help Canadian firms scale up to meet the
new lead firm requirements for global investment and production, or, failing that, to diversify
and gradually shift away from heavy dependence on the automotive industry.
Key recommendations:
1) Work to attract new assembly plant investment, especially by Japanese firms,
which are gaining market share in North America and treat their suppliers better.
2) Help domestic suppliers scale up and set up facilities outside Canada.
3) Help suppliers serve multiple customers, including automotive and non-
automotive customers.
4) Reduce border bottlenecks to allow Canadian suppliers to serve U.S. plants.
5) Help suppliers develop export opportunities to take advantage of growing
assembly operations in emerging economies and to diversify sales.
61

Bibliography
APMA. 2003. “APMA’s Strategic Vision for the Canadian Automotive Original Equipment Supply Industry,” Automotive Parts Manufacturers’ Association Policy Paper.
Asia Pacific Foundation of Canada. 2005. “The East Asian Automobile Industry: Opportunity or Threat? Results of a Survey of Canadian Auto Parts Manufacturers,” Working paper 2005-2, January.
Automotive News (annual). “Top 150 North American Suppliers.”
Berger, Suzanne, and the MIT Industrial Performance Center. 2005. How We Compete. New York: Doubleday.
Charles River Associates, 2001. “Competitiveness Factors for Attracting and Maintaining Automotive Investment: Comparison between Canada and Mexico.” Report prepared for Industry Canada and The Ontario Ministry of Economic Development.
Conference Board of Canada, 2006, “Canadian Industrial Outlook: Canada’s Auto and Auto Parts Industry,” Autumn.
DesRosiers Automotive Consultants (annual). “DesRosiers Automotive Yearbook.”
Dicken, Peter. 2006. Global Shift: Reshaping the Global Economic Map in the 21st Century, 5th ed. London: Sage Publications.
Enríquez, Manuel Francisco Román, 2004. “Programa Fundamental para el Desarrollo Económico del Estado de México hacia el 2005 y de Competitividad Visión 2020.” ITESM.
Fitzgibbon, J., T. Holmes, and S. Rutherford. 2004. “Innovation in the automotive parts industry: a case study of the Windsor-Essex region,” Working paper.
Fitzgibbon, S., J. Holmes, T. Rutherford and P. Kumar. 2004 “Shifting Gears: Restructuring and Innovation in the Ontario Automotive Parts Industry,” in D. Wolfe and M. Lucas (eds.) Clusters in a Cold Climate. Kingston: School of Policy Studies, Queen’s University and McGill-Queen’s University Press.
Gereffi, Gary. 1994. “The organization of buyer-driven global commodity chains: How U.S. retailers shape overseas production networks.” In Gereffi, G. and Korzeniewicz, M. (Eds.), Commodity Chains and Global Capitalism, Westport, CT: Praeger, pp. 95-122
Gereffi, Gary. 2001. “Shifting governance structures in global commodity chains, with special reference to the Internet.” American Behavioral Scientist 44, 10 (June): 1616-1637.
Gereffi, Gary. 2006. The New Offshoring of Jobs and Global Development. Geneva: International Institute for Labor Studies.
Gereffi, Gary, John Humphrey, and Timothy Sturgeon. 2005. “The governance of global value chains.” Review of International Political Economy 12, 1 (February): 78-104.
Head, Keith, John Reis and Barabara Spencer. 2004. “Vertical Networks and U.S. Auto Part Exports: Is Japan Different?” Journal of Economics and Management Strategy, Vol. 13, No. 1 (Spring): 37-67.
62

Helper, Susan. 2000. “Economists and Field Research: You Can Observe a Lot Just by Watching" The American Economic Review, 90: 2, Papers and Proceedings of the One Hundred Twelfth Annual Meeting of the American Economic Association, pp. 228-232.
Helper, Susan, and Surendra Khambete. 2005. “Off-shoring, interfaces, and collaboration across the supply chain: A case study in automotive product development.” Cleveland, OH: Case Western Reserve University, preliminary draft, February 21.
Herrigel, Gary. 2004. “Emerging strategies and forms of governance in high-wage component manufacturing regions.” Industry and Innovation 11, 1/2 (March/June): 45-79.
Humphrey, John, and Olga Memodovic. 2003. “The global automotive industry value chain: What prospects for upgrading by developing countries?” Sectoral Studies Series. Vienna: United Nations Industrial Development Organization.
Industry Canada. 1998. “The Automotive Competitiveness Review: Industry Identified Issues.” http://strategis.ic.gc.ca/epic/internet/inauto-auto.nsf/en/am01165e.html
Japanese Automotive Manufacturing Association. 2007. “Japanese Automotive-Related Investment and Joint Ventures in Canada; Auto Parts, Machine Tools, Materials.” Accessed at: http://www.jama.ca/industry/manufacturing/parts/index.asp.
Klier and Rubenstein (2006), “The U.S. auto supplier industry in transition,” Chicago Fed Letter, May, No. 226.
McAlinden, Sean P. 2006. “There’s No Place Like Home; the Geography of Automotive Employment.” Presentation at the Chicago Federal Reserve Conference on “The New Geography of Auto Production.” April 19, Detroit, MI.
Molot, Maureen Appel 2005. “Location Incentives and Inter-state Competition for FDI: Bidding Wars in the Automotive Industry,” in Eden, Lorainne and Wendy Dobson (eds.), Governance, Multinationals and Growth, Edward Elgar}.
Reuters. 2007. “Toyota may add 5 N. America car plants: report.” Thursday, January 11, 2007, dateline: Tokyo.
Rubenstein, James, 1992. The Changing U.S. Auto Industry: A Geographical Analysis, New York: Routledge.
Sako, Mari. 2003. “Modularity and outsourcing: The nature of coevolution of product architecture and organisation architecture in the global automotive industry.” In A. Prencipe, A. Davies, and M. Hobday (eds.), The Business of Systems Integration. Oxford: Oxford University Press.
Sturgeon, Timothy. 2002. “Modular production networks. A new American model of industrial organization.” Industrial and Corporate Change 11, 3: 451-496.
Sturgeon, Timothy, and Richard Florida. 2000. “Globalization and Jobs in the Automotive Industry.” Final Report to the Alfred P. Sloan Foundation. International Motor Vehicle Program, Center for Technology, Policy, and Industrial Development, Massachusetts Institute of Technology, Cambridge, MA. See: http://web.mit.edu/ipc/publications/papers.html.
Sturgeon, Timothy J., and Richard K. Lester. 2004. “The new global supply-base: New challenges for local suppliers in East Asia.” Pp. 35-87 in Shahid Yusuf, M. Anjum Altaf, and
63

Kaoru Nabeshima (eds.), Global Production Networking and Technological Change in East Asia. Washington, DC: The World Bank and Oxford University Press.
Van Biesebroeck, Johannes. 2005. “Trends and complementarities in the Canadian automobile industry.” Forthcoming in Chen, Z. and M. Duhamel (eds.), Industrial Economics and Performance in Canada. Ottawa: Industry Canada.
__________. 2006a. “Complementarities in automobile production.” NBER Working Paper No. W12131, April <http://papers.ssrn.com/sol3/papers.cfm?abstract_id=896205>.
__________. 2006b. “The Canadian Automotive Market” Report prepared for International Trade Canada, <http://www.dfait-maeci.gc.ca/tna-nac/documents/JVB-en.pdf>.
__________. 2007. “The Cost of Flexibility,” Assembly Automation, Vol. 27, No. 1, March, pp. 55-64.
Ward’s Automotive Yearbook. Various years. Southfield, MI: Ward’s Communications, Inc.
64