Prospects for Campaign Finance Reform: The Role of Policy ...
31
University of Texas Rio Grande Valley University of Texas Rio Grande Valley ScholarWorks @ UTRGV ScholarWorks @ UTRGV Political Science Faculty Publications and Presentations College of Liberal Arts 2015 Prospects for Campaign Finance Reform: The Role of Policy Prospects for Campaign Finance Reform: The Role of Policy Narratives, Cultural Predispositions, and Political Knowledge in Narratives, Cultural Predispositions, and Political Knowledge in Collective Policy Preference Formation Collective Policy Preference Formation Paul D. Jorgensen The University of Texas Rio Grande Valley Michael D. Jones Geoboo Song Follow this and additional works at: https://scholarworks.utrgv.edu/pol_fac Part of the Political Science Commons Recommended Citation Recommended Citation Jorgensen, Paul and Jones, Michael and Song, Geoboo, Prospects for Campaign Finance Reform: The Role of Policy Narratives, Cultural Predispositions, and Political Knowledge in Collective Policy Preference Formation (September 25, 2015). Available at SSRN: https://ssrn.com/abstract=2665538 or http://dx.doi.org/10.2139/ssrn.2665538 This Article is brought to you for free and open access by the College of Liberal Arts at ScholarWorks @ UTRGV. It has been accepted for inclusion in Political Science Faculty Publications and Presentations by an authorized administrator of ScholarWorks @ UTRGV. For more information, please contact [email protected], william.fl[email protected].
Transcript of Prospects for Campaign Finance Reform: The Role of Policy ...

University of Texas Rio Grande Valley University of Texas Rio Grande Valley
ScholarWorks @ UTRGV ScholarWorks @ UTRGV
Political Science Faculty Publications and Presentations College of Liberal Arts
2015
Prospects for Campaign Finance Reform: The Role of Policy Prospects for Campaign Finance Reform: The Role of Policy
Narratives, Cultural Predispositions, and Political Knowledge in Narratives, Cultural Predispositions, and Political Knowledge in
Collective Policy Preference Formation Collective Policy Preference Formation
Paul D. Jorgensen The University of Texas Rio Grande Valley
Michael D. Jones
Geoboo Song
Follow this and additional works at: https://scholarworks.utrgv.edu/pol_fac
Part of the Political Science Commons
Recommended Citation Recommended Citation Jorgensen, Paul and Jones, Michael and Song, Geoboo, Prospects for Campaign Finance Reform: The Role of Policy Narratives, Cultural Predispositions, and Political Knowledge in Collective Policy Preference Formation (September 25, 2015). Available at SSRN: https://ssrn.com/abstract=2665538 or http://dx.doi.org/10.2139/ssrn.2665538
This Article is brought to you for free and open access by the College of Liberal Arts at ScholarWorks @ UTRGV. It has been accepted for inclusion in Political Science Faculty Publications and Presentations by an authorized administrator of ScholarWorks @ UTRGV. For more information, please contact [email protected], [email protected].

Electronic copy available at: http://ssrn.com/abstract=2665538
Prospects for Campaign Finance Reform: The Role of Policy Narratives, Cultural Predispositions, and Political Knowledge in Collective Policy Preference Formation*
Paul D. Jorgensen Department of Political Science
University of Texas – Rio Grande Valley
Michael D. Jones School of Public Policy Oregon State University
Geoboo Song Department of Political Science
J. William Fulbright College of Arts and Sciences University of Arkansas
*Direct all correspondence to Paul D. Jorgensen, Department of Political Science, University of Texas – Rio Grande Valley, College of Liberal Arts, Room 227, 1201 West University Drive, Edinburg, TX 78539-2999 ([email protected])

Electronic copy available at: http://ssrn.com/abstract=2665538
2
Prospects for Campaign Finance Reform: The Role of Policy Narratives, Cultural
Predispositions, and Political Knowledge in Collective Policy Preference Formation
Abstract
Objective: Although campaign finance is a growing concern, pollsters rarely ask the public about
reform. We use the variation in public support for campaign finance reform to determine factors
important to collective policy preference formation. Methods: Using a national survey, we factor
analyze the latent dimensions of various reforms, and rely on an experimental design to explain the
role cultural theory, policy narratives, and political knowledge plays in preference formation. Results:
The reform debate groups along two dimensions: adding or removing limitations, or ending the
dependence on money altogether. We show policy narratives are most influential, and cultural theory
has more explanatory value, among those with higher levels of political knowledge, and policy
narratives tend to increase support among those who already support reform, and mitigate the
opposition from other cultural types. Conclusion: If it were up to the public, prospects for campaign
finance reform, even public financing, would be high.
Keywords: Campaign finance reform, narrative policy framework, cultural theory, political
knowledge, public opinion

3
For you will not abandon my soul to Hades, or let your Holy One see corruption.
~Acts 2:27~1
Campaign Finance Reform for Whom?
The current conservative majority on the Supreme Court has created regulatory purgatory in
election policy. Steadfast assertions that money equals speech, and that corruption is nothing more
than quid pro quo, have marked this era of deregulation in campaign finance. Coupled with declines in
voter turnout, the warning signs of the Citizens United Era are quite dire. Walter Dean Burnham
(2010: 26) was an early voice calling our attention to these trends: “In the domain of money in
elections, of buying America, Citizens United is not the first step, but the last. Welcome to 1895
everybody!” Finding a majoritarian voice on this subject will prove difficult, but collective judgment
remains.
By January of 2012, large donors could not stay away from national television. Foster Friess,
trained as a skillful money manager, gave one million dollars to the pro-Santorum Super PAC, the
Red White and Blue Fund, between early November 2011 and the end of January 2012. Ted Koppel
commented:
You talk to most Americans out there and say meet my friend Foster here and he just gave a
million or more dollars to Rick Santorum and he says he doesn’t expect anything back in
return, and they’re going to look at each other and say ‘yeah sure’ and roll their eyes.
Foster Friess replied, “No, I expect a lot in return.”2 Putting aside Friess’s flirtations with quid pro
quo corruption, Koppel’s perception of the American public is telling. Could it be that most
Americans know something that only a select group of political scientists are willing to admit? 1 English Standard Version translation
2 Not even Brian Williams could fabricate this story. It appeared on Rock Center with Brian Williams,
16 January 2012.

4
Studies identifying the influence of moneyed interests in policy formulation are not as rare as
some in the profession would like to believe (Baumgartner and Leech, 1998: 45). Using over two
centuries of data, scholars find that coalitions of political elites, operating within institutions, do the
bidding of wealthy individuals and groups (e.g., Beard, 1935; Ferguson, 1995; Ferguson, Jorgensen,
and Chen, 2013; Ferguson and Rogers, 1986; Winters and Page, 2009). The U.S. public has shown
the capacity to operate outside electoral and party processes to propel action (Piven, 2006). Occupy
Wall Street, and to a much lesser extent, the Tea Party, drew attention to the need of working
outside existing institutions to change policy, and it may be a sign of things to come. Alas, campaign
finance does not appear on the radar of most public opinion pollsters.
Using a national survey focused solely on campaign finance reform, we seek answers to the
following questions: (1) what is the range, and dimensions, of public support for various campaign
finance proposals, and (2) what policy narratives are more persuasive and why? Using exploratory
factor analysis, we show the two conceptual dimensions of reform proposals are restriction and
dependence. Some proposals simply limit or expand the use of private money in campaigns, while
others seek to end the dependence on private money altogether. With advocacy on this second
dimension increasing in this Citizens United era (e.g., Lessig, 2011), we use an experimental design to
determine if this advocacy can place robust campaign finance reform on the public agenda.
In this experimental design, we combine the Narrative Policy Framework of agenda setting
(Jones, McBeth, and Shanahan, 2014; Stone, 1989) with cultural theory (Thompson, Ellis, and
Wildavsky, 1990) and political knowledge to understand the nuance of collective preference
formation. One of the drawbacks of the agenda setting literature is that it rarely accounts for the
predispositions of the audience to accept one policy narrative over the other (e.g., Stone, 1989: 293).
Utilizing Ordinary Least Squares regressions and Bayesian posterior simulations, we show (1) policy
narratives are most influential, and cultural theory has more explanatory value, among those with

5
higher levels of political knowledge, and (2) policy narratives tend to increase support among those
cultural types who already support reform, and mitigate the opposition from other cultural types.
The mood in the U.S. is to prevent the decay and corruption of its laws, but the future of our
campaign finance laws is unknown.
Data: Asking the Public about Campaign Finance Reform
Reports on the public opinion on campaign finance are rare. To help fill this void, one of us
working with the Cultural Cognition Project at Yale University, with funding from the Edmond J.
Safra Center for Ethics at Harvard University, wrote and administered a nationally representative
survey (census balanced) of 2,450 respondents focused exclusively on campaign finance reform. It
was fielded between March 30 and April 9, 2012. YouGov, a commonly subcontracted data
procurer for social science research of this nature, collected the responses, and like many other
Internet survey companies (e.g., Survey Sampling Inc., Harris Interactive), maintains a large pool of
Internet respondents from which to draw. This pool is sufficiently diverse and numerous that census
balanced is achieved based upon random draws filtered by census-based demographics (e.g., race,
gender, income, etc.) (for a discussion of the appropriateness of this type of sample, please see Best
et al., 2001 and Berrens et al., 2003).
In this article, we analyze part of the survey’s experimental design. We measured each
respondent’s answers to cultural-type questions, then subjected some of them to different
treatments, or policy narratives, about the harm caused by our campaign finance system. After these
treatments, each respondent registered their level of support on fourteen different campaign finance
reform proposals. In the following two sections, we discuss how we constructed our dependent
variable and independent variables. Our dependent variable is the variation in support for an index
of reform proposals seeking to end the dependence on private money in campaigns. Our
independent variables of interest are individuals’ cultural orientations (e.g., individualism,
6
egalitarianism, and hierarchism) and levels of political knowledge, both measured from a battery of
questions. Among other independent variables of our primary concern is policy narrative on
campaign finance reform, which was embedded into “narrative” experimental design. We will
discuss these variables and measures in more detail in the following sections.
Constructing the Dependent Variable: The Dimensions of Campaign Finance Reform
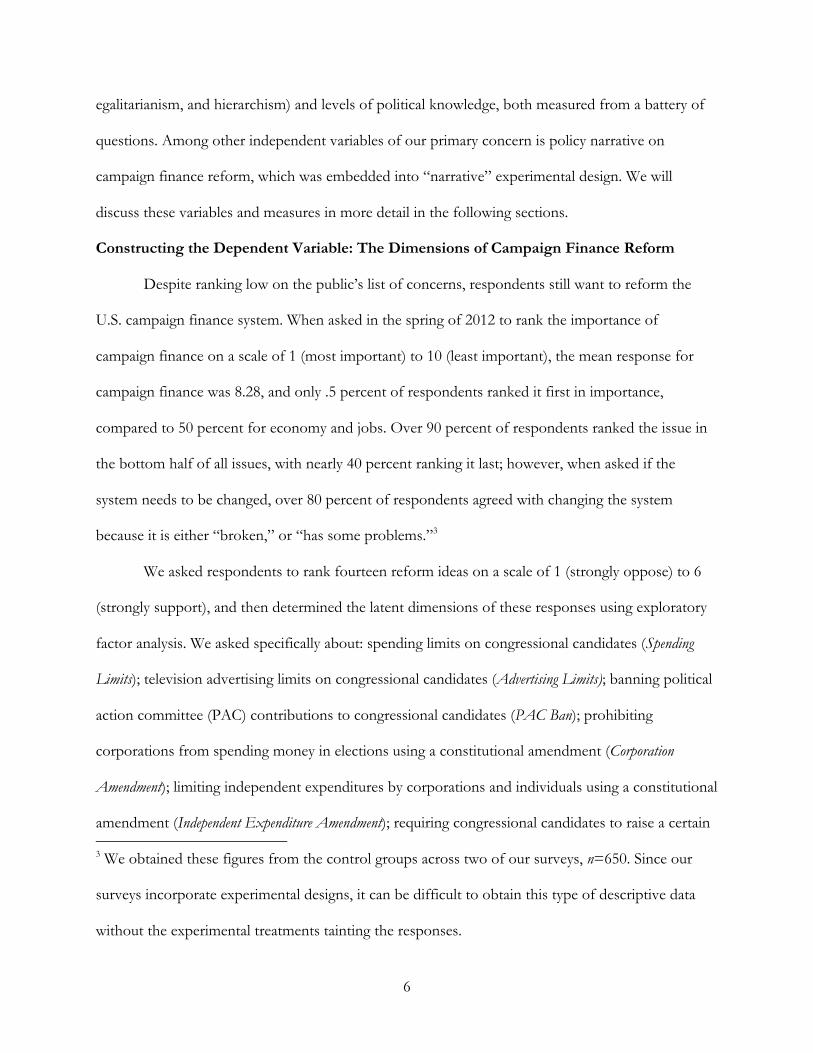
Despite ranking low on the public’s list of concerns, respondents still want to reform the
U.S. campaign finance system. When asked in the spring of 2012 to rank the importance of
campaign finance on a scale of 1 (most important) to 10 (least important), the mean response for
campaign finance was 8.28, and only .5 percent of respondents ranked it first in importance,
compared to 50 percent for economy and jobs. Over 90 percent of respondents ranked the issue in
the bottom half of all issues, with nearly 40 percent ranking it last; however, when asked if the
system needs to be changed, over 80 percent of respondents agreed with changing the system
because it is either “broken,” or “has some problems.”3
We asked respondents to rank fourteen reform ideas on a scale of 1 (strongly oppose) to 6
(strongly support), and then determined the latent dimensions of these responses using exploratory
factor analysis. We asked specifically about: spending limits on congressional candidates (Spending
Limits); television advertising limits on congressional candidates (Advertising Limits); banning political
action committee (PAC) contributions to congressional candidates (PAC Ban); prohibiting
corporations from spending money in elections using a constitutional amendment (Corporation
Amendment); limiting independent expenditures by corporations and individuals using a constitutional
amendment (Independent Expenditure Amendment); requiring congressional candidates to raise a certain 3 We obtained these figures from the control groups across two of our surveys, n=650. Since our
surveys incorporate experimental designs, it can be difficult to obtain this type of descriptive data
without the experimental treatments tainting the responses.

7
percentage of funds from their own states (Raise Money in Home State); banning foreign corporations
from spending money in U.S. elections (Ban Foreign Corporate Contributions); requiring shareholder
approval before corporations can spend money in elections (Shareholder Approval); raising limits for
individuals (Raise Limits for Individuals); removing all limits for all individuals, corporations, and
unions (Remove Limits); raising limits for political parties (Raise Limits for Parties); providing public
funding for congressional candidates (public funding); providing free media time and free postage to
candidates (Free Media Time); and providing public matching funds for candidates (Matching Funds).
In order to understand the underlying dimensionality of the campaign finance reform
debate, we used exploratory factor analysis to obtain the shared variance among our respondents’
level of support for reforms. Since some of these items have a non-normal distribution and the
underlying factors might be highly correlated, we performed combinations of principal axis and
maximum likelihood extractions with oblique and orthogonal rotations. We report our two-factor
solution using the maximum likelihood extraction with an orthogonal rotation because the principal
axis extraction produced no substantial differences to our factor solution reported here, and the
correlation between these two factors is minimal. Our analytical results meet the basic specifications
for a “clean” factor solution: no double-loaders and no loadings below .3 on both dimensions.
TABLE 1 ABOUT HERE
In Table 1, Factor 1 represents the restriction dimension of campaign finance reform. The
positive loadings represent more limitations on spending (e.g., advertising limits, banning PACs,
banning corporate money), while the negative loadings represent increasing the amount of money in
politics and easing existing restrictions (e.g., removing all limits). While an exploratory factor analysis
can force these negative loadings into its own factor, the underlying dimensionality is the same as
the positive loaders. Factor 2 represents the dependence dimension. Reforming the system to include

8
public funding, free media time, or a matching funds system would reduce the dependency on
private money, not just limiting the amount.
We construct our dependent variable from the dependence dimension for the analyses that
follow, which we name the Campaign Finance Reform (CFR) Policy Preference Index (Cronbach’s
α=0.72), for two reasons. First, it is timely. More campaign finance reform advocates prefer these
types of solutions in the Citizens United era (e.g., Lessig, 2011). Second, it is theoretically interesting.
It represents the most difficult case to show the influence of policy narratives, cultural theory, and
political knowledge. In our analysis, based on the mean response, respondents ranked free media
time and public funding in the bottom three of all reform ideas, only above removing all limits.4 Our
index has a mean of 2.67 (on a scale ranging from 1 to 6), but does exhibit a fair amount of
variation, with a standard deviation of 1.34. Can policy narratives increase support to end the
dependence on money in politics? If so, who can or cannot be convinced? Does the influence of
policy narratives and cultural theory require political knowledge?
Experimental Design: Cultural Theory, Policy Narratives, and Political Knowledge
We construct a model of collective policy preference formation from two sets of variables,
one endogenous to the individual and the other exogenous. Missing from much of the analysis on
agenda setting is the cultural predispositions of those who political actors are trying to influence
(Stone 1989: 293). Culture is widely recognized as an important input in helping individuals
understand and make sense of the world around them (e.g., Thompson, Ellis, and Wildavsky, 1990).
For largely practical reasons (as opposed to taking a philosophical stance on the appropriateness of
quantifying culture), we use the Cultural Theory (CT) of Mary Douglas and Aaron Wildavsky to
operationalize culture (see Mamadouh, 1999 and Swedlow, 2011 for an overview of this material),
which understands an individual’s cultural orientation to fall along two conceptual dimensions of
4 Based on our control group analysis across two surveys (n=650), see footnote 4.

9
sociality. The first dimension – group – captures the extent to which individuals prefer operating
and living within groups. The second dimension – grid – captures the extent to which groups
prescribe and/or constrain individual behavior. Intersected, the two dimensions produce four
prototypical cultural types: Individualists, egalitarians, hierarchs and fatalists. In our survey, we
operationalize these categories using survey questions designed by the Cultural Cognition Project at
Yale University, asking a series of randomly ordered questions on a 6-point agreement scale.
Individualists have low group and low grid and thus prefer to operate in environments and
social systems where exchange, competition, markets and the like are the norm. Strong individualists
score high in agreement to the following questions: the government interferes far too much in our
everyday lives; it is not the government’s business to try to protect people from themselves; the
government should stop telling people how to live their lives.
Egalitarians have low grid, but high group. These individuals prefer a world devoid of
hierarchies and seek to minimize differences, commonly defining themselves in reference to
outsiders (usually the other cultural types). Strong egalitarians score high in agreement to the
following questions: our society would be better off if the distribution of wealth was more equal; we
need to dramatically reduce inequalities between the rich and the poor, whites and people of color,
and men and women; discrimination against minorities is still a very serious problem in our society.
Hierarchs have high grid and high group. They prefer a world where people submit to their
proper roles, defined in a myriad of ways from expertise, social class, profession, etc. Strong
hierarchs score high in agreement to the following questions: sometimes government needs to make
laws that keep people from hurting themselves; the government should do more to advance society’s
goals, even if that means limiting the freedom and choices of individuals; government should put
limits on the choices individuals can make so they do not get in the way of what is good for society.

10
Using the data from these nine CT items, we conducted a factor analysis from which three
latent dimensions were extracted. The rotated factor structure matrix (generated using an orthogonal
rotation) showed that the three relevant CT survey items were loaded high (greater than .5) on each
related cultural orientation dimension while loaded low (less than .5) on the remaining two unrelated
dimensions. We use this factor score as an index for the corresponding cultural orientation:
individualism (Cronbach’s α=0.84), egalitarianism (Cronbach’s α=0.86), and hierarchism
(Cronbach’s α=0.76). We expect strong individualists to favor removing limits to campaign finance
contributions and spending, while we expect strong egalitarians and hierarchs to support restrictions
on campaign finance, and perhaps support ending the dependence on money altogether. These CT
measures have proven a staple in helping explain individual policy preferences across a host of
policy issues ranging from climate change (Jones, 2014) to childhood vaccinations (Song, 2014).5
Our second set of variables of interest relates to exogenous influences on individual
preference formation and change – or how information is communicated or delivered. Recent
scholarship and research within public policy has shown narrative communication to be an
important explanatory variable for policy preferences6 (e.g., Jones and Song, 2014). Consequently,
we focus here on how narrative communications about campaign finance reform might influence
how individuals process campaign finance information. To operationalize narrative, we rely on the
Narrative Policy Framework (NPF) (McBeth et al., 2014 for an overview of the NPF).
5 Fatalists have low group but high grid. These individuals are subjected to hierarchies (high grid),
but have little ability or mobility within (hence the low group). For the fatalist, life is often seen as
random, they view most situations as out of their control, and consequently engage in a strategy of
survival and withdrawal. We do not try to identify these individuals in this survey.
6 See Jones et al. (2014) for an overview of this literature.

11
The NPF is a structural take on narrative communication that disaggregates narratives into
subcomponents amenable to quantification and the design of experimental treatments such as the
one presented here (Jones and McBeth, 2010). The NPF identifies four policy narrative elements: 1)
setting, 2) characters (hero, villain, victim), 3) plot and, 4) a moral of the story (i.e., policy solution).
Several studies have shown that subcomponents are helpful in explaining individual policy
preferences. For example, Jones (2014) finds that individual affect for a story’s protagonist or hero is
positively associated with policy solutions depicted in policy stories about climate change; similarly,
Shanahan et al., (2014) finds that plots where a villain is shown to act intentionally to do harm is
more powerful in persuading than when a villain is portrayed as inadvertently causing harm. The
research presented here focuses on this plot dimension examining intentional villains (where blame
can be directly attributed to a clear individual or group) versus systematic villains (where a large
inhuman and abstract system is to blame for harm) (for further discussion of these mechanisms see
Stone, 1989).
We use two different narratives as treatments (n=700), and compare the effect of those
treatments to a control group (n=350). The control group saw an info-graphic, see Figure 1, with
facts about U.S. campaign finance. The treatment groups, in addition to viewing the info-graphic,
were exposed randomly to one of two narratives that situate the campaign finance system into a
larger narrative about harm as a consequence of this system.
FIGURE 1 ABOUT HERE
Our narrative treatments begin with the same first clause: “Why do most members of Congress
refuse to engage in behavior that would fix the economy, lower the budget deficit, and provide jobs
for everyday Americans? Not because normal Americans aren’t still out of work and desperately in
need of such fixes.” The Generic Mechanical (GM) narrative treatment follows the first clause with,
but because the system is broken and members of Congress must spend the majority of their time begging for money that

12
they need to get reelected. The Generic Intentional (GI) narrative treatment follows the first clause with,
but because special interests contribute billions to their campaigns to make sure their self-interested needs are met at the
expense of the rest of us.
To examine the effect of general political knowledge, we create a knowledge index and then
perform a subgroup analysis on the influences of cultural predispositions and policy narratives on
individuals’ preferences toward campaign finance reform for respondents with low levels (below the
index mean) and high levels (above the index mean) of political knowledge. For that end, we asked
the following five multiple-choice questions: which party currently has the most members in the
House of Representatives; what public office is now held by Joe Biden; how much of a majority is
required for the U.S. Senate and House to override a presidential veto; whose responsibility is it to
nominate judges to the federal courts; which party would you say is more conservative than the
other at the national level? We generated a knowledge index (0 to 5), essentially the number of
correct answers, with a mean of 4.01.
We include age, education, income, sex, and race as control variables. Race is a dichotomous
measure, coded 1 for non-Hispanic Whites and 0 for non-White (including Hispanic). Gender is also
a nominal scale measure, coded 1 for male and 0 for female. Age is measured as age in years.
Education indicates individual’s level of education and was measured on a 6-point scale ranging
from 1 (=Did not graduate from high school) to 6 (=Postgraduate degree (MA, MBA, MD, JD,
PhD, etc.) with higher scores indicating a higher level of education held by an individual. Finally,
income (i.e., estimated annual family income) is measured on a 12-point scale ranging from 1 (=Less
than $10,000) to 12 (=$150,000 or more). On average, survey respondents were approximately 50
years old with a median annual family income of between $40,000 and $50,000. Out of 2,450 survey
participants, 73% were non-Hispanic Whites and 48% were male, while 59% held at least a college
degree (or greater).

13
Empirical Findings: The Power of Policy Narratives and Political Knowledge
We run six models using Ordinary Least Square (OLS) regression7. Table 2 presents the first
three models using the GM treatment group, and Table 3 presents the last three models using the
GI treatment group. In Model 1 of Table 2, those who display strong egalitarianism (+0.392,
p<0.01) and strong hierarchism (+0.399, p<0.01) tend to support CFR policy, while strong
individualists oppose CFR policy (–0.371, p<0.01). In addition, there is a fair degree of treatment
effect of the generic mechanical CFR narrative on the formation of mass opinion regarding CFR
policy. Those who were exposed to the GM narrative treatment are more supportive of CFR policy
by a sizable margin when compared to those who were in the control group and exposed only to the
info-graphic (+0.179, p<0.1). However, when we examine the exact same relationships (between
variables) among those who possess low levels of political knowledge in Model 2, such relationships
are not as strong or become statistically insignificant. The GM treatment has no effect within the
low political knowledge group and the overall explanatory power of the model decreases
significantly (from adjusted R2 of 0.190 in Model 1 to adjusted R2 of 0.082 in Model 2). Contrastingly,
when we investigate the same relationships between variables of our primary concern among those
7 One could argue that double-sided tobit regression is a more appropriate approach in data
analysis of this sort where the measure of the dependent variable can be thought of as being
censored on both sides (i.e., left and right sides). Accordingly, while utilizing maximum
likelihood estimation, we implemented the tobit regression analysis using the exact same model
specifications employed for the OLS regression discussed here, and found that the results are
consistent with those from the OLS regression (See Appendices 1 and 2 for more detailed results
from tobit regression). Mainly due to the simplicity of interpretation, our discussion that follows
will focus on the results from OLS regression.

14
who possess high levels of political knowledge in Model 3, we found that such relationships become
much stronger in comparison with Model 1 or Model 2, with overall explanatory power of the
model increased significantly (from adjusted R2 of 0.190 in Model 1 or adjusted R2 of 0.082 in Model 2
to adjusted R2 of 0.342 in Model 3).
TABLE 2 ABOUT HERE
Turning to Table 3, the specification of Models 4, 5, and 6 are similar to those in Table 2,
but Table 3 reports the findings of the GI narrative treatment. Ceteris paribus, individuals’ cultural
predispositions contribute to the formation of their preference for CFR policy. Strong egalitarians
(+0.379, p<0.01) and strong hierarchs (+0.394, p<0.01) are more supportive of CFR policy, while
strong individualists are less supportive of CFR policy (–0.383, p<0.01). However, we found no
discernable treatment effect of the GI narrative on the dependent variable. When we estimate the
exact same regression model among those who are less knowledgeable about politics (Model 5), the
associations between variables we found in Model 4 become blurry or weakened; the regression
coefficient for individualism is not statistically significant, and the adjusted R2 of 0.140 is significantly
smaller than the adjusted R2 of 0.210 in Model 4. One notable finding is that even though there was
no direct significant treatment effect of the GI narrative treatment on CFR policy preferences, such
narrative treatment mediates the relationship between low-knowledge hierarchs and the dependent
variable. That is, as mentioned earlier, hierarchism is positively associated with the dependent
variable and this positive relationship grows stronger among members of the GI narrative treatment
group in comparison with those in the control group (+0.230, p<0.1). When we estimated the same
model among politically sophisticated individuals in Model 6, we found that the estimated
relationships of our primary concern becomes much stronger in comparison with Model 4 or Model
5, along with a significant increase of adjusted R2 of 0.340 from that of 0.210 in Model 4 or 0.140 in
Model 5. It is also noteworthy that though there is no statistically significant direct treatment effect

15
of the GI narrative treatment, the GI treatment mediates the relationship between individualism and
CFR policy preference among members of the high political knowledge group; the negative
relationship between individualism and CFR policy preference is weaker among those who were
exposed to the GI narrative treatment when compared to those in the control group (+0.327,
p<0.05).
TABLE 3 ABOUT HERE
We end our analysis with a Bayesian posterior simulation to approximate the distributions of
the predicted CFR policy preference by prototypical cultural type, narrative treatment, and political
knowledge (e.g., King, Tomz, and Wittenberg, 2000; Moyer and Song, 2015; Ripberger, Jenkins-
Smith and Herron, 2011; Song, Silva, and Jenkins-Smith, 2014). First, we ran simplified (no controls
of race, gender, education, income) OLS regressions similar to those Tables 2 and 3. Second, using
the estimated parameters of the aforementioned models and the related variance-covariance
matrices, we conducted 1,000 iterative simulations (Gelman and Hill, 2007), which resulted in 1,000
different vectors of simulated coefficients for each model discussed in the first step of analytical
procedure. Third, we constructed prototypical cultural types of “hypothetical” individuals as those
to be assumed to score one standard deviation above the mean of a particular cultural orientation
index and one standard deviation below the mean of the remaining two cultural orientation indices
(e.g., Moyer and Song, 2015; Kester and Song, 2015; Ripberger, Jenkins-Smith and Herron, 2011;
Song, Silva, and Jenkins-Smith, 2014). Finally, in each of the two sets of 1,000 different simulated
regression equations fitted for the low and high political knowledge groups obtained from the
second step of this analytical procedure, we imputed the combination of cultural theory index scores
characterizing three prototypical cultural types and appropriate values representing the membership
of experimental groups (i.e., control group (=0) vs. GM treatment group (=1) or control group (=0)
vs. GI treatment group (=1)) for remaining terms on the right side of the simulated regression

16
equations. From this procedure, we acquired distributions of predicted CFR policy preference by
three distinctive cultural types and three CFR narrative treatment groups (including control group)
in two different subsets of the original sample (i.e., low political knowledge group vs. high political
knowledge group).
Figures 2 and 3 illustrate the distributions of predicted CFR policy preference by cultural
type (i.e., egalitarian, hierarch, and individualist) and CFR narrative experimental treatment group
(i.e., Control group, GM treatment group, and GI treatment group) obtained from this simulation
analysis. The horizontal axis represents predicted CFR policy preference ranging from 1 to 6 with
higher scores indicating greater support, while the vertical axis indicates the probability density
function of distribution of such preference with high scores meaning greater predicted frequency.
Blue, gray, and red represent egalitarian, hierarch, and individualist, respectively, while histograms
filled with each of these colors show the distributions for treatment groups, whereas empty
histograms outlined with those colors represent distributions for the control group.
FIGURE 2 ABOUT HERE
Figure 2 displays the distributions of predicted CFR policy preference by cultural type and
GM narrative treatment. When examining such distributions among those who hold a low level of
political knowledge (i.e., panel (a)), overall, individualists tend to oppose CFR policy, followed by
egalitarians and hierarchs, while the effects of GM narrative treatment is not particularly discernable.
When evaluating the same distributions among those who hold a high level of political knowledge
(i.e., panel (b)), the overall distributional pattern of a cultural divide on the CFR policy issue is
sustained; egalitarians are the strongest supporters for CFR policy followed by hierarchs, but
individualists remain against such policies. However, it is noteworthy that this attitudinal divide on
CFR policy between different cultural types is much deeper among politically sophisticated people
when compared to politically less sophisticated people. Another interesting finding is that within this

17
high political knowledge group, the GM narrative treatment holds sizable effects in strengthening
individuals’ support for CFR policy across different cultural types.
FIGURE 3 ABOUT HERE
Figure 3 visualizes the distributions of predicted CFR policy preference by cultural type and
GI narrative treatment. In general, the distributional patterns are quite similar with the results shown
in Figure 2. Regardless of levels of political knowledge, individualists hold the strongest opposition
to CFR policy in relation to egalitarians and hierarchs, even though the high political knowledge
group (i.e., panel (b)) exhibits more of a gap in terms of CFR policy preference between different
cultural types when compared to the low political knowledge group (i.e., panel (a)), especially when
the gaps between individualists and egalitarians are concerned. Pertaining to the effect of GI
narrative treatment on CFR policy preference, it is clear that such effects exist to a certain degree
only among those who are highly knowledgeable about general politics, with the exception of
hierarchs.
Implications: Prospects for Campaign Finance Reform
In June 2013, Gallup released a poll showing 50 percent of all respondents favored a public
financing system for federal elections (41 percent of Republicans), and 79 percent of all respondents
would favor raising and spending limits (78 percent of Republicans). While we do not show quite
that level of support for a publicly financed system, we do show how the support could build into an
agenda item. Targeted attempts to push an intentional policy narrative of organized interests
benefitting at the cost of the public would likely mitigate opposition among politically
knowledgeable individualists. Mass appeals using a mechanical policy narrative of congressional
members working within a flawed system would likely increase support for public finance among
politically knowledgeable egalitarians and hierarchs, while curbing dissent among knowledgeable

18
individualists. The continued use of these policy narratives, along with skyrocketing campaign
spending numbers, will likely increase support for reform. If it were up to the public, prospects for
campaign finance reform, even public financing, would be high.

19
References
Baumgartner, Frank R., and Beth Leech. 1998. Basic Interests: The Importance of Groups in Politics and in
Political Science. Princeton: Princeton University Press.
Beard, Charles A. 1935. An Economic Interpretation of the Constitution of the United States. New York: Free
Press.
Berrens, Robert P., Alok K. Bohara, Hank Jenkins-Smith, Carol Silva, and David L. Weimer. 2003.
“The Advent of Internet Surveys for Political Research: A Comparison of Telephone and
Internet Samples.” Political Analysis 11:1–22.
Best, Samuel J., Brian Krueger, Clark Hubbard, and Andrew Smith. 2001. “An Assessment of the
Generalizability of Internet Surveys.” Social Science Computer Review 19:131–45.
Burnham, Walter Dean. 2010. “Democracy in Peril: The American Turnout Problem and the Path
to Plutocracy.” Roosevelt Institute Working Paper No. 5: 1 – 32.
Ferguson, Thomas. 1995. Golden Rule: The Investment Theory of Party Competition and the Logic of Money
Driven Political Systems. Chicago: University of Chicago Press.
Ferguson, Thomas, Paul D. Jorgensen, and Jie Chen. 2013. “Party Competition and Industrial
Structure in the 2012 Elections: Who’s Really Driving the Taxi to the Dark Side?”
International Journal of Political Economy 42 (2): 3-41.
Ferguson, Thomas, Paul D. Jorgensen, and Jie Chen. 2015. “How Money Drives U.S. Congressional
Elections: More Evidence.” Paper Presented at the Institute for New Economic Thinking
Annual Conference, April.
Ferguson, Thomas, and Joel Rogers. 1986. Right Turn: The Decline of the Democrats and the Future of
American Politics. Macmillan.
Gelman, A., & Hill, J. 2006. Data analysis using regression and multilevel/hierarchical models. Cambridge
University Press.

20
Jones, Michael D. 2014. “Cultural Characters and Climate Change: How Heroes Shape our
Perceptions of Climate Science.” Social Science Quarterly, 95 (1): 1-39.
Jones, Michael D. Mark K. McBeth and Elizabeth A. Shanahan. 2014. “Introducing the Narrative
Policy Framework,” in The Science of Stories: Applications of the Narrative Policy Framework in Public
Policy Analysis, (ed.) Michael D. Jones, Elizabeth A. Shanahan, and Mark K. McBeth. New
York, New York: Palgrave Macmillan.
Jones, Michael D., and Mark K. McBeth. 2010. “A Narrative Policy Framework: Clear Enough to be
Wrong?” Policy Studies Journal, 38 (2): 329-353.
Jones, Michael D., and Geoboo Song. 2014. “Making Sense of Climate Change: How Story Frame
Shaper Cognition” Political Psychology, 35(4): 447-476.
Kester, John and Geoboo Song. 2014. “Disentangling Local Policy Elites’ Decision-making on
Sustainable Energy Policies: An Arkansas Perspective” Paper presented at the 110th annual
meeting of the American Political Science Association (APSA). Washington, D.C., August.
King, G., Tomz, M., & Wittenberg, J. 2000. “Making the most of statistical analyses: Improving
interpretation and presentation.” American journal of political science, 347-361.
Lessig, Lawrence. 2011. Republic, Lost: How Money Corrupts Congress--and a Plan to Stop It. New York:
Twelve, Hachette Book Group.
Mamadouh, Virginie. 1999. “Grid-Group Cultural Theory: An Introduction.” GeoJournal 47: 395-409.
McBeth, Mark, Michael D. Jones, and Elizabeth Shanahan. 2014. “The Narrative Policy
Framework”, in Theories of the Policy Process, 3rd Edition, Chris Weible & Paul Sabatier (ed).
Westview Press: pp. 225-266.
Moyer, Rachael. M., & Geoboo Song. 2014. “Understanding Local Policy Elites’ Perceptions on the
Benefits and Risks Associated with High Voltage Power Line Installations in the State of
21
Arkansas.” Paper Presented at the the 36th annual meeting of the Association for Public
Policy Analysis and Management (APPAM), November.
Piven, Frances Fox. 2006. Challenging Authority: How Ordinary People Change America. Lanham: Roman
& Littlefield Publishers.
Ripberger, Joe, Geoboo Song, Matthew Nowlin, Michael D. Jones and Hank C. Jenkins-Smith.
2012. “Cultural Theory and Cognitive Sophistication: When Does What you Know
Influence How you Think?” Social Science Quarterly 93 (3): 713-731.
Ripberger, J. T., Jenkins-Smith, H. C., & Herron, K. G. 2011. “How Cultural Orientations Create
Shifting National Security Coalitions on Nuclear Weapons and Terrorist Threats in the
American Public. PS: Political Science & Politics, 44(04): 715-719.
Shanahan, Elizabeth A., Stephanie M. Adams, Michael D. Jones, and Mark K. McBeth. 2014. “The
Blame Game: Narrative Persuasiveness of the Intentional Causal Mechanism,” in The Science
of Stories: Applications of the Narrative Policy Framework in Public Policy Analysis, (ed.) Michael D.
Jones, Elizabeth A. Shanahan, and Mark K. McBeth. New York, New York: Palgrave
Macmillan.
Song, Geoboo. 2014. “Understanding Public Perceptions of Benefits and Risks of Childhood
Vaccinations in the United States.” Risk Analysis 34(3): 541-555.
Song, G., Silva, C. L., & Jenkins‐Smith, H. C. 2014. “Cultural Worldview and Preference for
Childhood Vaccination Policy.” Policy Studies Journal 42(4): 528-554.
Stone, Deborah. 1989. “Causal Stories and the Formation of Policy Agendas.” Political Science
Quarterly 104 (2): 281-300.
Swedlow, Brendon. 2011. “A Cultural Theory of Politics,” PS: Political Science & Politics, 44,4.
Thompson, Michael, Richard J. Ellis, and Aaron Wildavsky. 1990. Cultural Theory. Boulder, CO:
Westview Press.

22
Winters, Jeffrey A., and Benjamin I. Page. 2009. “Oligarchy in the United States?” Perspectives on
Politics 7(4): 731-751.

23
Table 1: Two-Factor Solution of Campaign Finance Reform Proposals* Reform Proposal Factor 1 Factor 2 Spending Limits .745 Advertising Limits .656 PAC Ban .656 Corporation Amendment .731 Independent Expenditure Amendment .708 Raise Money in Home State .428 Ban Foreign Corporate Contributions .435 Shareholder Approval .523 Raise Limits for Individuals -.428 Remove Limits -.595 Raise Limits for Parties -.439 Public Funding .681 Free Media Time .610 Matching Funds .722 *Results are the Rotated Factor Matrix, from a Maximum Likelihood Estimation and Varimax
Rotation; n=2264; factor loadings of below .3 in absolute value are suppressed; Raise Limits for
Individuals, Raise Limits for Parties, Raise Money in Home State, Ban Foreign Corporate
Contributions, and Shareholder Approval all had extracted communalities less than .300.

24
Table 2: OLS Regression Results for GM Treatment
Dependent variable: CFR Policy Preference Index
All (1)
Low political knowledge group
(2)
High political knowledge group
(3)
Egalitarianism 0.392*** 0.239* 0.422*** (0.077) (0.123) (0.115)
Individualism -0.371*** -0.091 -0.620*** (0.077) (0.117) (0.123)
Hierarchism 0.399*** 0.277** 0.482*** (0.076) (0.108) (0.119)
Treatment 0.179* 0.007 0.327** (1=GM treatment) (0.103) (0.152) (0.161)
Egalitarianism×Treatment -0.027 -0.017 0.051
(0.102) (0.161) (0.151)
Individualism×Treatment 0.051 -0.064 0.158 (0.103) (0.150) (0.165)
Hierarchism×Treatment -0.057 0.119 -0.161 (0.106) (0.145) (0.172)
Race (1=White) 0.101 -0.175 0.359* (0.121) (0.171) (0.198)
Gender (1=Male) 0.203* -0.034 0.209 (0.107) (0.157) (0.165)
Age 0.003 0.002 0.008 (0.004) (0.005) (0.005)
Education 0.057 0.079 0.015 (0.039) (0.060) (0.057)
Income -0.007 -0.012 -0.017 (0.019) (0.029) (0.026)
(Constant) 2.145*** 2.441*** 1.947*** (0.238) (0.353) (0.388)
Adjusted R2 0.190 0.082 0.342 F statistic 12.34*** 3.14*** 11.51***
n 583 290 244 Note: *p<0.1; **p<0.05; ***p<0.01

25
Table 3: OLS Regression Results for GI Treatment
Dependent variable: CFR Policy Preference Index
All (4)
Low political knowledge group
(5)
High political knowledge group
(6)
Egalitarianism 0.379*** 0.211* 0.426*** (0.073) (0.112) (0.113)
Individualism -0.383*** -0.090 -0.637*** (0.073) (0.107) (0.121)
Hierarchism 0.394*** 0.253** 0.477*** (0.072) (0.098) (0.117)
Treatment -0.076 -0.152 0.094 (1=GI treatment) (0.098) (0.139) (0.158)
Egalitarianism×Treatment -0.023 -0.057 0.208
(0.100) (0.147) (0.157)
Individualism×Treatment 0.091 0.006 0.327** (0.102) (0.147) (0.163)
Hierarchism×Treatment -0.021 0.230* -0.266 (0.100) (0.137) (0.163)
Race (1=White) -0.170 -0.360** -0.012 (0.116) (0.163) (0.186)
Gender (1=Male) 0.339*** 0.134 0.402** (0.102) (0.147) (0.159)
Age 0.006* 0.001 0.010** (0.003) (0.005) (0.005)
Education 0.044 0.085 -0.018 (0.036) (0.055) (0.054)
Income -0.025 -0.062** -0.019 (0.017) (0.026) (0.025)
(Constant) 2.287*** 2.776*** 2.151*** (0.225) (0.308) (0.419)
Adjusted R2 0.210 0.140 0.340 F Statistic 13.81*** 4.87*** 11.51***
n 580 287 246 Note: *p<0.1; **p<0.05; ***p<0.01

26
Figure 1: Info-Graphic about U.S. Campaign Finance
Where%the%$3.6%Billion%Spent%by%Poli0cians%to%get%elected%in%2010%Came%From...%
Ques0on:%From%whom%do%poli0cians%get%the%money%they%use%to%get%elected?%

27
GM treatment group
Control
GM treatment group
Control
Figure 2: Predicting CFR Policy Preference by Cultural Type and GM Narrative Treatment
(a) Low political knowledge group
Predicted CFR policy preference
Density
1 2 3 4 5 6
0.0
0.5
1.0
1.5
2.0
2.5
(b) High political knowledge group
Predicted CFR policy preference
Density
1 2 3 4 5 6
0.0
0.5
1.0
1.5
2.0
2.5
Individualist Hierarch Egalitarian

28
GI treatment group
Control
GI treatment group
Control
Figure 3: Predicted CFR Policy Preference by Cultural Type and GI Narrative Treatment
(a) Low political knowledge group
Predicted CFR policy preference
Density
1 2 3 4 5 6
0.0
0.5
1.0
1.5
2.0
2.5
(b) High political knowledge group
Predicted CFR policy preference
Density
1 2 3 4 5 6
0.0
0.5
1.0
1.5
2.0
2.5
Individualist Hierarch Egalitarian

29
Appendix 1: Tobit Regression Results for GM Treatment
Dependent variable: CFR Policy Preference Index
All (1)
Low political knowledge group
(2)
High political knowledge group
(3) Egalitarianism 0.495*** 0.231 0.609***
(0.097) (0.149) (0.143)
Individualism -0.460*** -0.130 -0.717*** (0.097) (0.142) (0.152)
Hierarchism 0.510*** 0.327** 0.651*** (0.095) (0.130) (0.148)
Treatment 0.219* -0.073 0.429** (1=GM treatment) (0.130) (0.187) (0.199)
Egalitarianism×Treatment -0.054 0.050 -0.031
(0.128) (0.197) (0.188)
Individualism×Treatment 0.071 -0.067 0.177 (0.129) (0.183) (0.204)
Hierarchism×Treatment -0.073 0.209 -0.277 (0.132) (0.176) (0.211)
Race (1=White) 0.136 -0.160 0.450* (0.151) (0.208) (0.247)
Gender (1=Male) 0.250* -0.046 0.264 (0.134) (0.192) (0.207)
Age 0.004 0.002 0.010 (0.004) (0.001) (0.006)
Education 0.058 0.081 0.018 (0.049) (0.073) (0.070)
Income -0.007 -0.015 -0.015 (0.023) (0.035) (0.033)
Log-likelihood -959.56 -479.47 -384.18 Wald-statistic 138.7*** 36.9*** 127.2***
n 583 290 244 Note: *p<0.1; **p<0.05; ***p<0.01

30
Appendix 2: Tobit Regression Results for GI Treatment
Dependent variable: CFR Policy Preference Index
All (4)
Low political knowledge group
(5)
High political knowledge group
(6) Egalitarianism 0.472*** 0.203 0.603***
(0.093) (0.137) (0.145)
Individualism -0.475*** -0.124 -0.747*** (0.092) (0.130) (0.154)
Hierarchism 0.496*** 0.294** 0.650*** (0.091) (0.119) (0.151)
Treatment -0.121 -0.271 0.125 (1=GI treatment) (0.125) (0.171) (0.200)
Egalitarianism×Treatment -0.042 0.006 0.169
(0.128) (0.181) (0.199)
Individualism×Treatment 0.086 -0.049 0.389* (0.128) (0.180) (0.206)
Hierarchism×Treatment -0.014 0.326* -0.397* (0.127) (0.169) (0.163)
Race (1=White) -0.199 -0.405* 0.013 (0.146) (0.199) (0.235)
Gender (1=Male) 0.447*** 0.210 0.509** (0.129) (0.180) (0.205)
Age 0.006 0.001 0.012* (0.004) (0.006) (0.007)
Education 0.037 0.089 -0.035 (0.046) (0.067) (0.069)
Income -0.035 -0.073** -0.033 (0.022) (0.032) (0.031)
Log-likelihood -923.92 -451.69 -382.29 Wald-statistic 155.5*** 57.18*** 123.3***
n 580 287 246 Note: *p<0.1; **p<0.05; ***p<0.01