Pros & Cons of Outsourcing Bus Operations
36
Pros & Cons of Outsourcing Bus Operations Sanjiv N. Sahai i i &C O S d Managing Director & CEO, DIMTS Ltd Urban Mobility Conference Technical Session IV ‐ PPP in Urban Bus Operations and Maintenance Strategies
Transcript of Pros & Cons of Outsourcing Bus Operations

Pros & Cons of Outsourcing Bus Operations
Sanjiv N. Sahai
i i & C O S dManaging Director & CEO, DIMTS Ltd
Urban Mobility Conference Technical Session IV ‐ PPP in Urban Bus Operations and Maintenance Strategies

Structure of the Presentation
• Introduction
• Various Models for Procurement of Bus OperationVarious Models for Procurement of Bus Operation
• Appraisal of Different Models
• Discussion on Gross Cost
2

Trends in the Delhi Bus Market
Modal Split ‐ % of Person Trips (excluding walk trips) in Delhi*(Figures in Percent)
59.8%
41.5%
2000‐01
2007‐08
10.3%
17.2%
5 3% 3 6%
13.9%
21.5%
3 6% 4 1%6.8% 7.9%
3.1%0.0% 0.7%
5.3% 3.6%3.6% 4.1%0.7%
Car Two Wheelers Auto Rickshaw Bus Metro Train (IR) Bicycle Cycle Rickshaws
* Walk‐only trips account for 35% of trips Walk only trips account for 35% of trips
Source: RITES Delhi Traffic and Forecast Study (2008)
3
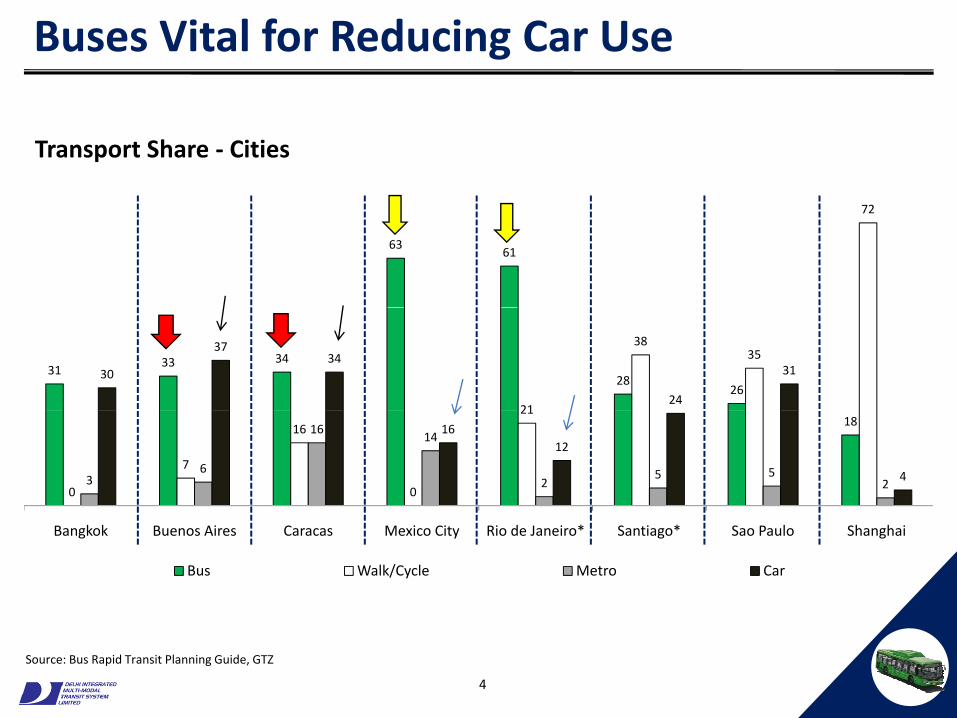
Buses Vital for Reducing Car Use
72
Transport Share ‐ Cities
6361
72
3133 34
2826
21
3835
30
3734
24
31
18
0
7
16
0
21
36
1614
25 5
2
1612
4
Bangkok Buenos Aires Caracas Mexico City Rio de Janeiro* Santiago* Sao Paulo Shanghai
Bus Walk/Cycle Metro Car
4
Source: Bus Rapid Transit Planning Guide, GTZ

Buses in Delhi
Private Stage Carriage ‐ BluelinesDelhi Transport Corporation
• Privately owned
• Fares set by Government
• Reliant on Fare box Revenue
• State owned
• Fares set by Government
• Get Gap‐funding from the Govt Reliant on Fare box Revenue
• 77% of owners have one vehicle
Get Gap funding from the Govt.
• No performance monitoring

Characteristics of Bus Network in Delhi
• Public Operator (Delhi TransportBus Fleets Size in Delhi – By Operators
• Public Operator (Delhi Transport Corporation) carried approx. 2.2 million passengers on an average per day in 2008.
• Private Operators carried approx. 2 ti th2 times more passengers than Public Operator.
Source: 1.STA as of February 2009
l ( b )2.DTC Operational Statistics (October 2009);3.Delhi Metro – Feeder Service (http://www.delhimetrorail.com/commuters/feeder_bus.html)
6

Public Sector Model ‐ Advantages• Closer authority control over services and fares• Closer authority control over services and fares
• Social and community objectives can be easier to achieve
Off i f t f d fi ht t– Offering free passes to freedom fighters etc.
• More accessible in terms of:
– Geography: serving unremunerative and rural routes
– Time: operating service in early morning & late night
– Fare: offering concessionary passes to students, old persons etc.
• Easy to acquire assets such as new fleet and depot space
• Better paid and trained manpower including drivers etc. permits adequate rest and recuperation
7

Issues with Public Sector Model
P l i i i d i d i k• Poorly incentivized management ‐ perceived risk
• Over staffing and at the same time absenteeism
• No incentive to adhere to performance management system
• Not responsive to customer demand
• Lack of innovation and adaption to changing environment
• Little incentive to control costs as subsidies provided ex‐post with no link to achieving policy objectives
DFID Global Review of Bus Performance “could not find any example where a pure public monopoly
offers a superior alternative to the best designed i i ”
8Source: Halcrow Fox for DfID, May 2000
competitive arrangement”

Productivity Gap
Parameters Particulars Nos.
Average Fleet 3,028 (Nos.)
Buses Average buses on road (Daily) 2,458 (Nos.)
Fleet Utilization (%) 81.18%
Scheduled Trips (Daily) 22 447
TripsScheduled Trips (Daily) 22,447
Operated (Daily) 17,265
Trip Efficiency (%) 76.91%
KmsScheduled Kms (Daily – in Lakhs) 164.31
Actual Kms (Daily – in Lakhs) 125.85
Kms Efficiency (%) 76.59%
9
Source: DTC Operational Statistics (June 2009)

Private Stage Carriage Model ‐ Advantages • No subsidy burden on the govt exchequer• No subsidy burden on the govt. exchequer
• Cost control and higher levels of bus patronage occupancy as payment made per passengerpayment made per passenger
10

Characteristics of Private Bus Operation
O hi
Distribution of Blueline Fleet Size by Size of Operator
Ownership Pattern
76.3%
eet
e of
Bus
Fle
14.4%
4.1% 1.8% 1.3% 0.9% 0.2% 0.2% 0.3% 0.5%
Shar
e
1 2 3 4 5 6 8 9 10 18
Size of Operator (No. of Buses)
11
Source: STA, Delhi (October 2007)
Characteristics of Private Bus Operation
l i
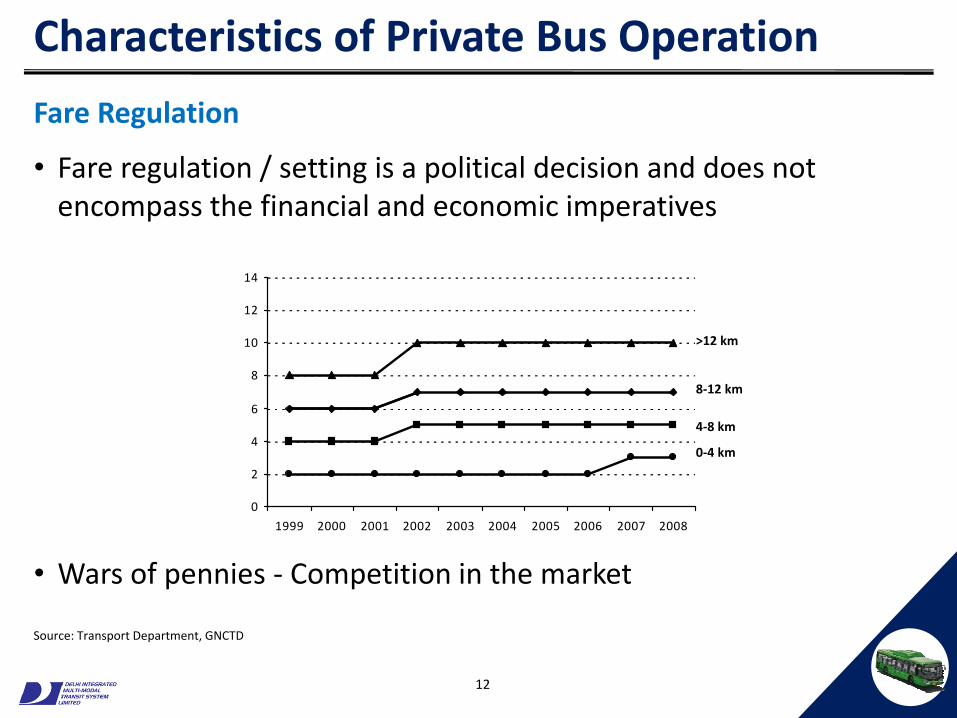
• Fare regulation / setting is a political decision and does not encompass the financial and economic imperatives
Fare Regulation
encompass the financial and economic imperatives
12
14
6
8
10
12
8‐12 km
>12 km
0
2
4
6
0‐4 km
4‐8 km
• Wars of pennies ‐ Competition in the market
1999 2000 2001 2002 2003 2004 2005 2006 2007 2008
12
Source: Transport Department, GNCTD

Issues in Private Bus Operation
• 49% of bus routes are non‐operational
• Lack of network benefits
• Undesirable driving practices
– Accidents and traffic violations
– Predation by incumbents or cartelizationPredation by incumbents or cartelization
• Unreliable bus service ‐ absence of bus route/schedule informationroute/schedule information
• Under investment
13

Regulatory Burden ‐ Permit Conditions
• There are more than 51 permit conditions which private operator needs to comply The cost of compliance is high so violation isneeds to comply. The cost of compliance is high so violation is likely
• In case of violation of permit condition, buses are moved off theIn case of violation of permit condition, buses are moved off the road by the authority
– The operators face 100% revenue risk as most of the operators are single bus owners
– Passengers also faced inconvenience due to withdrawal of iservices
14

Strategic Objectives
Wh ki d f b i d d?What kind of bus service do we need?
• Effective, economic, efficient and safeA hi h lit ff d bl bli t t i– A high quality, affordable public transport service
– Mitigate safety risk – competition for the market, not in the market – Minimum scale required to ensure appropriate management skills– Clear contractual obligations and responsibilities– Maintain service levels on existing routes, extend coverage– Provide comfortable and clean environmentProvide comfortable and clean environment
• Ensure flexibility for the future– Current route network is not rationalised or optimisedCurrent route network is not rationalised or optimised– Need scope to redeploy resources to respond to shifts in demand– Ability to respond to demographic changes and economic growth
C bili d h i l li ( f )– Capability to accommodate changes in regulatory policy (e.g. fares)
15

Risk Allocation
• Appropriate allocation of risk
– High cost associated with attempts to transfer uncontrolled riskg p
– Where does control lie?
– Recognise information gaps and asymmetry
• Sponsor’s dilemma . . .
the greater the extent of attempted risk transfer
the fewer the likely bidders
the greater the potential costs
16

Contract Types
Net Cost
– Full transfer of revenue risk?
Sh d i k?
Gross Cost
– Resource contract
No transfer of revenue risk– or Shared risk?
– Or Minimum revenue guarantee?
– No transfer of revenue risk
– Revenue paid to Government
Revenue
Profit
Revenue
Profit
Cost
Funding Support
Govt Operator
Cost
Revenue
Funding
Support
Govt OperatorGovt Operator Govt Operator
17

Contract Types
Production (Cost) risk borne by
Authority Operator
Gross CostManagement
Contract
born
e by
AuthorityGross CostContract
(cost plus)Gross Cost
with passengervolume/revenue
venu
e ri
sk volume/revenue
incentive
Net Costwith shared
i k
Rev
Operator Net Cost
revenue risk
18
Net Cost – Full Revenue Risk
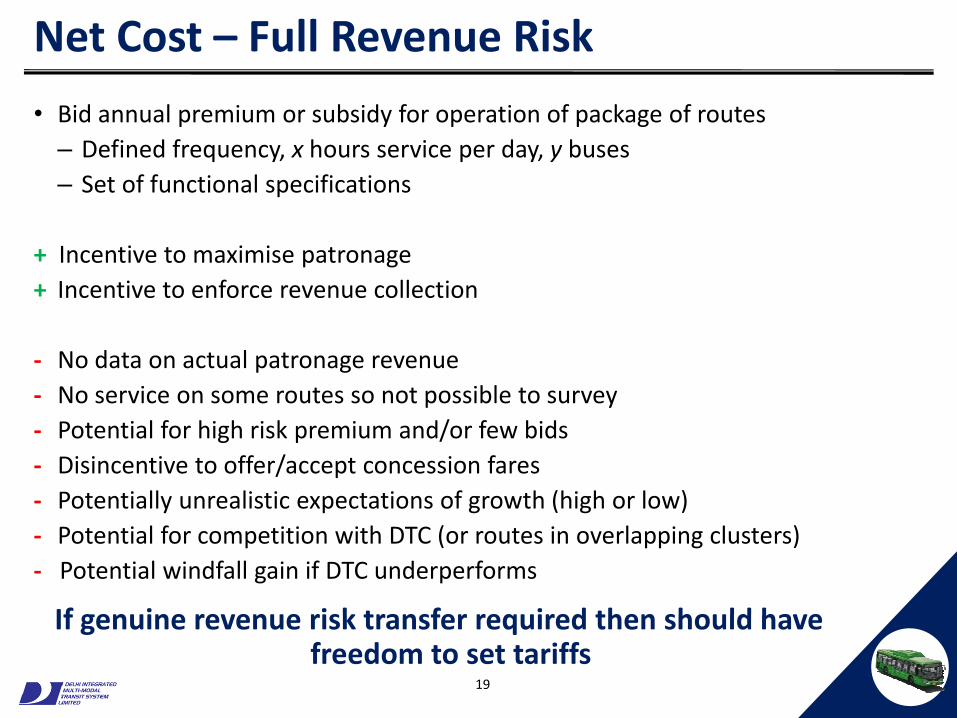
• Bid annual premium or subsidy for operation of package of routes – Defined frequency, x hours service per day, y buses– Set of functional specifications
+ Incentive to maximise patronage+ Incentive to enforce revenue collection
‐ No data on actual patronage revenue ‐ No service on some routes so not possible to survey‐ Potential for high risk premium and/or few bids ‐ Disincentive to offer/accept concession fares‐ Potentially unrealistic expectations of growth (high or low)y p g ( g )‐ Potential for competition with DTC (or routes in overlapping clusters)‐ Potential windfall gain if DTC underperforms
If genuine revenue risk transfer required then should haveIf genuine revenue risk transfer required then should have freedom to set tariffs
19

Net Cost 2 – SRR and MRG
• Bid annual premium or subsidy for operation of package of routes• Define expected revenues each year
• Shared Revenue Risk (SRR)– Any shortfall in revenue partially compensated by Government
A id i h d i h G– Any upside revenue gain shared with Government
• Minimum Revenue Guarantee (MRG)– All shortfall compensated by Government– All upside to operator
• Similar pros/cons to Net Cost with full revenue risk except:+ Reduces potential risk premium in bid+ Reduces incentive for competition with DTC
20

Gross Cost – No revenue risk
• Resource contract with fare collection on behalf of Government
• Tender for defined package of service schedules and functional specifications
• Define costs by type of bus for base bid
• Defined rates for marginal service increments
• Fare collection and revenue protection separately outsourced
+ Flexibility to add routes, change frequency, redeploy resources
+ Fares and ticketing policy revised at will
/+ Full acceptance of all ticket types including concession fares/passes
+ Payments related to type of bus (quality of service) provided
+ Reduced cost of finance due to secure income stream (from Government)
‐ No incentive to maximise patronage (or pick up)
‐ No incentive for revenue protectionNo incentive for revenue protection
21

Government Contractual Obligations
Gross Cost
• Guaranteed on time paymentsp y
• Provide for inflation indexation on quarterly or annual basis
• Provision of depots
and for Net Cost
• DTC to run in accordance with unified timetable
22

Bid Parameters
• Cost to operate a defined schedule for a set of services = base bid
• Specified outputs:
– Bus‐kmsb b t}– Bus hours
– Minimum peak buses in service
by bus type}
23
Guiding Principles for Gross Cost Contracts
• Deliverability
– Define organisational structure and responsibilities / accountability
E id f i l i d– Evidence of managerial experience and competence
– Evidence of contractual commitments including timescales
– Realistic timetable for roll out with key milestonesRealistic timetable for roll out with key milestones
• Sustainability
– Minimise risk of financial failure (hard/expensive to restore confidence)
– Require breakdown of costs – compare against realistic range (benchmark indicators)indicators)
– Indexation for key cost elements (eg labour, fuel)
24

Comparator Models
• The value for money can be assessed by comparing the various
bids with a public sector comparator (PSC) or ideally an “efficientbids with a public sector comparator (PSC) or ideally an efficient
operator” model
• DIMTS has relevant data for DTC and hypothetical private operator.
25
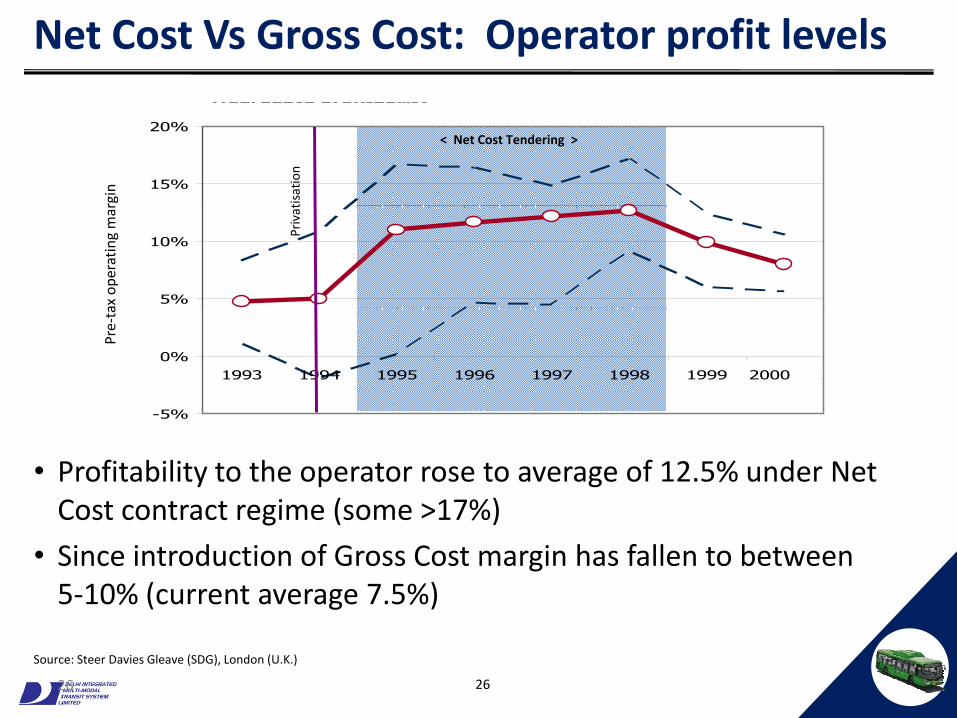
Net Cost Vs Gross Cost: Operator profit levelsAggregate profitabilityAggregate profitability (weighted by Contracted Peak Vehicles)
15%
20%
tisat
ion
< Net Cost Tendering >
rgin
5%
10%
Priv
at
ax o
pera
ting
mar
5%
0%1993 1994 1995 1996 1997 1998 1999 2000 est
Pre‐
ta
-5%
• Profitability to the operator rose to average of 12.5% under Net Cost contract regime (some >17%)Cost contract regime (some >17%)
• Since introduction of Gross Cost margin has fallen to between 5‐10% (current average 7.5%)
26 26
Source: Steer Davies Gleave (SDG), London (U.K.)

Approaches in Other Cities
City Contract Type
London UK Gross cost Route based
Copenhagen DK Gross cost Area basedCopenhagen DK Gross cost Area based
Stockholm SE Gross cost Area based
Adelaide AU Gross cost Area based
Bogota CO Gross cost Corridor based
Santiago CL Gross cost Area based
27
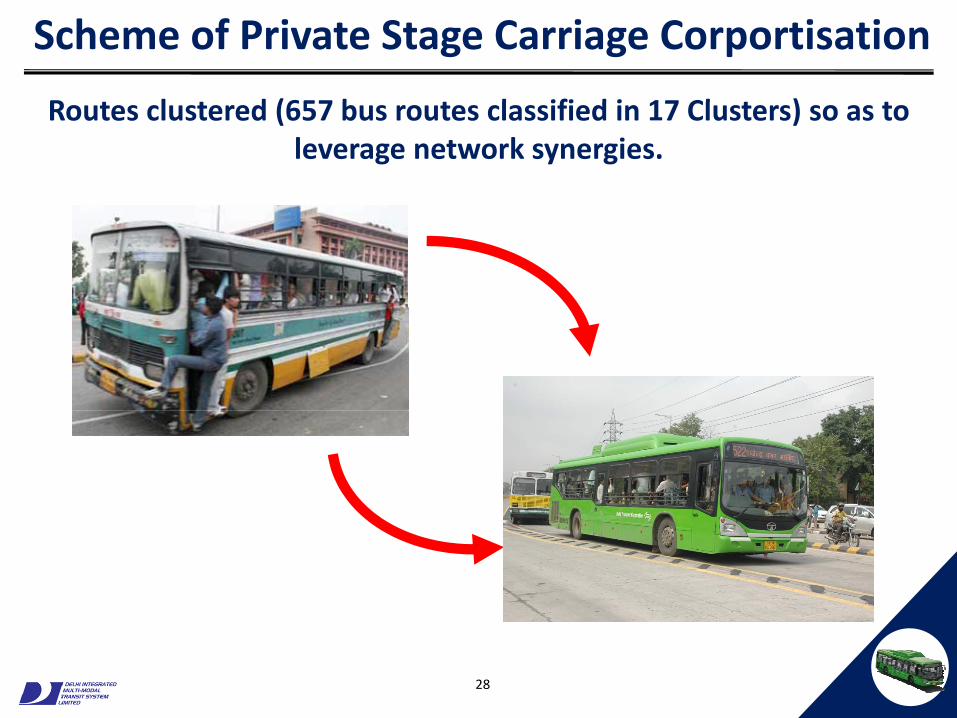
Scheme of Private Stage Carriage Corportisation
R t l t d (657 b t l ifi d i 17 Cl t ) tRoutes clustered (657 bus routes classified in 17 Clusters) so as to leverage network synergies.
28

Role of Integrated Mechanism – DIMTS
• Monitor compliance of the Performance Standards by bus
operators
• Process and impose performance adjustment (PA) for
non‐performance on bus operatorsp p
• Enforcement and monitoring of Unified Time Tables (UTT)
• Monitoring aspects that impact customer service
• Data collection, analysis and monitoring of cluster‐wise operation,Data collection, analysis and monitoring of cluster wise operation,
along with route rationalization
29

Performance Management System
A performance incentive system will be implemented to reward or
penalize the operator on the basis of the quality of service
delivered
• Reliability and Frequency
delivered.
• Reliability and Frequency
• Safety
• Quality such as cleanliness etcQuality such as cleanliness etc.
30

Role of Technology in Performance Monitoring
There is a strong reliance upon modern location technology and
intelligent transport systems to monitor operator performance.
• Automatic Vehicle Location Tracking System (AVLTS)
• Operating Control Centre (OCC) with ITS capability• Operating Control Centre (OCC) with ITS capability
• Automatic Fare Collection System (AFCS)
Application & Map rendering Server (4)
Multiple Cellular (GSM) Networks (2)
Device in the bus
GPS Satellites
HTTP
Communication Hub Gateway Server (3)
PIS A li ti
Database Servers
Map Database
Firewall
PIS Application Server (6)
PIS App Database
(5)
(7)
(1)
Bus Prediction display at stop (8)(7) stop (8)
31
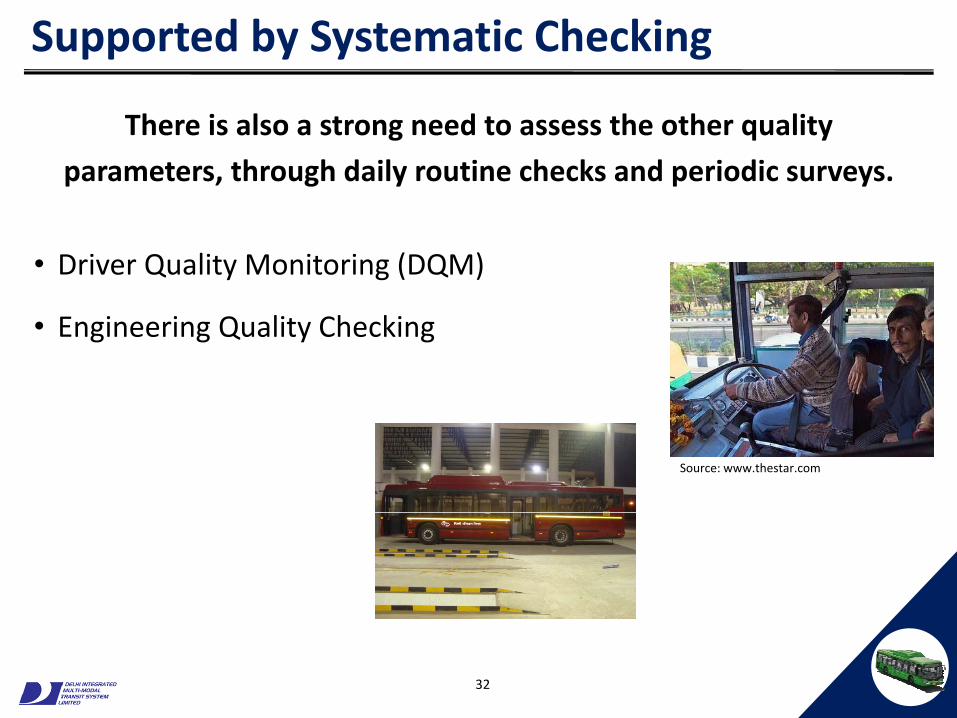
Supported by Systematic Checking
There is also a strong need to assess the other quality
parameters, through daily routine checks and periodic surveys.
• Driver Quality Monitoring (DQM)
• Engineering Quality Checking
Source: www.thestar.com
32
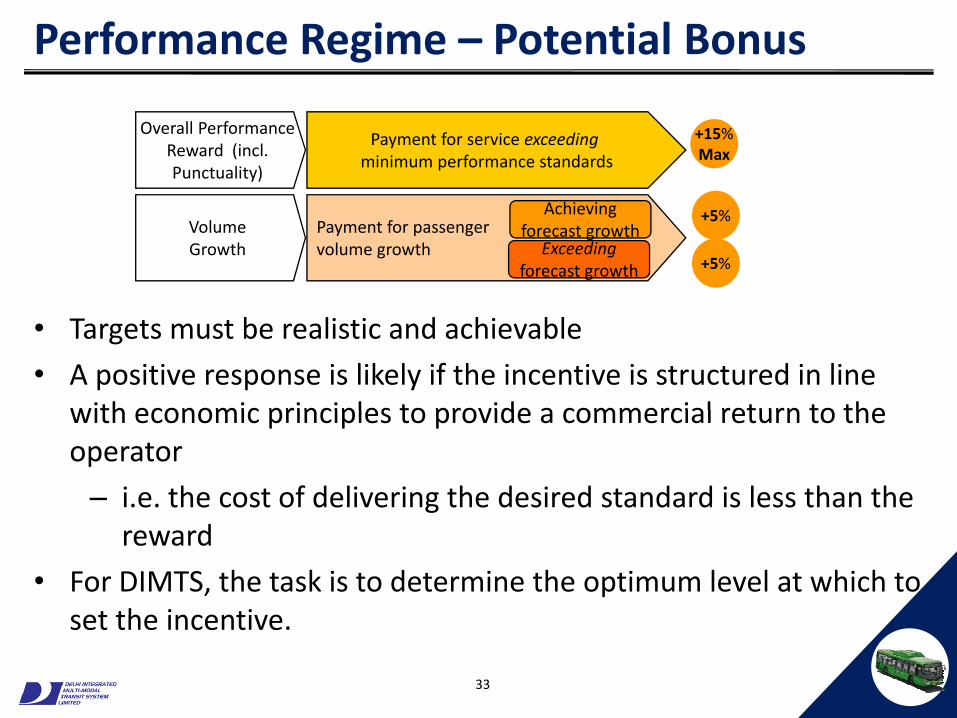
Performance Regime – Potential Bonus
Payment for service exceedingminimum performance standards
Overall Performance Reward (incl. Punctuality)
+15%Max
A hi iPayment for passenger volume growth
VolumeGrowth
Achievingforecast growth
Exceedingforecast growth
+5%
+5%
• Targets must be realistic and achievable
• A positive response is likely if the incentive is structured in line with economic principles to provide a commercial return to thewith economic principles to provide a commercial return to the operator
– i.e. the cost of delivering the desired standard is less than the greward
• For DIMTS, the task is to determine the optimum level at which to set the incentive
33
set the incentive.
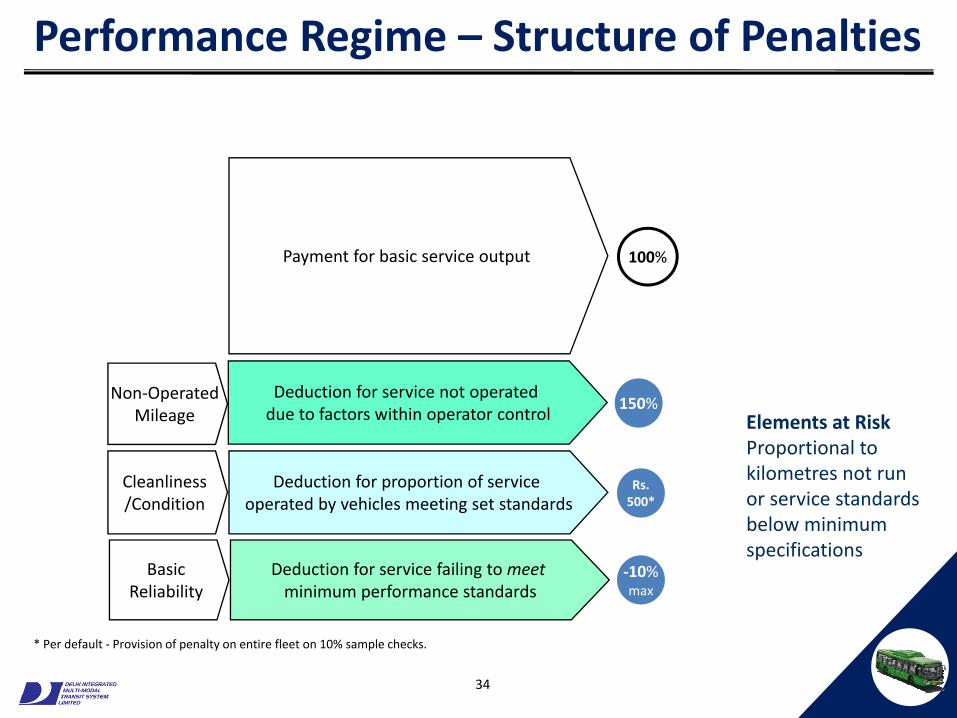
Performance Regime – Structure of Penalties
Payment for basic service output 100%
Non‐OperatedMil
Deduction for service not operated d t f t ithi t t l
150%
Deduction for proportion of service operated by vehicles meeting set standards
Cleanliness/Condition
Mileage
Rs.500*
Elements at RiskProportional to kilometres not run or service standards
due to factors within operator control
p y g
Deduction for service failing to meet minimum performance standards
BasicReliability
‐10%max
below minimum specifications
34
* Per default ‐ Provision of penalty on entire fleet on 10% sample checks.

Challenges
• Political will to ‘stay the course’ of reform
• Institutional capability to plan, monitor and manage
• Data collection and sophisticated information management to maintain consistent quality
• Subsidy dependent y p
• Reliant on technology to reduce revenue leakage
35

Thank youThank you
36


![The Pros and Cons of Hiring IT Outsourcing Services [Infographic]](https://static.fdocuments.in/doc/165x107/58cf8d671a28ab65538b47f5/the-pros-and-cons-of-hiring-it-outsourcing-services-infographic.jpg)