
Proposed Modification to Method for Determining Reasonable In-Season Demand for the Surface Water...
16
Proposed Modification to Method for Determining Reasonable In-Season Demand for the Surface Water Coalition: Use of the USDA Crop Data Layer Presented to the SWC Methodology Technical Working Group by Matt Anders February 11, 2015 Settlement Document Subject to I.R.E. 408
-
Upload
scarlett-armstrong -
Category
Documents
-
view
214 -
download
0
Transcript of Proposed Modification to Method for Determining Reasonable In-Season Demand for the Surface Water...

Proposed Modification to Method for Determining Reasonable In-Season Demand for the Surface Water Coalition:
Use of the USDA Crop Data Layer
Presented to the SWC Methodology Technical Working Group by Matt Anders
February 11, 2015
Settlement Document Subject to I.R.E. 408

What is Cropping Pattern?
• Acreage of each crop type grown by SWC members.
• Used in the Methodology for calculating Reasonable In-Season Demand (RISD):
∑(% Crop x Irr. Acres x ET Crop) / Project Efficiency = RISD

Current Method
• Data Source: USDA National Agricultural Statistics Service (NASS).
• Download tabular crop acreages by county.
• Calculate crop type averages for 1990-2010 by county.
• Assign crop type percentages to each SWC member based on land area in each county.
Drawbacks
• NASS tabular data are adjusted to protect farmer privacy.
• Incomplete data since 2005.
• 1990-2010 average does not reflect current cropping patterns.
• Uncertain if county-wide cropping patterns represent SWC member cropping patterns.
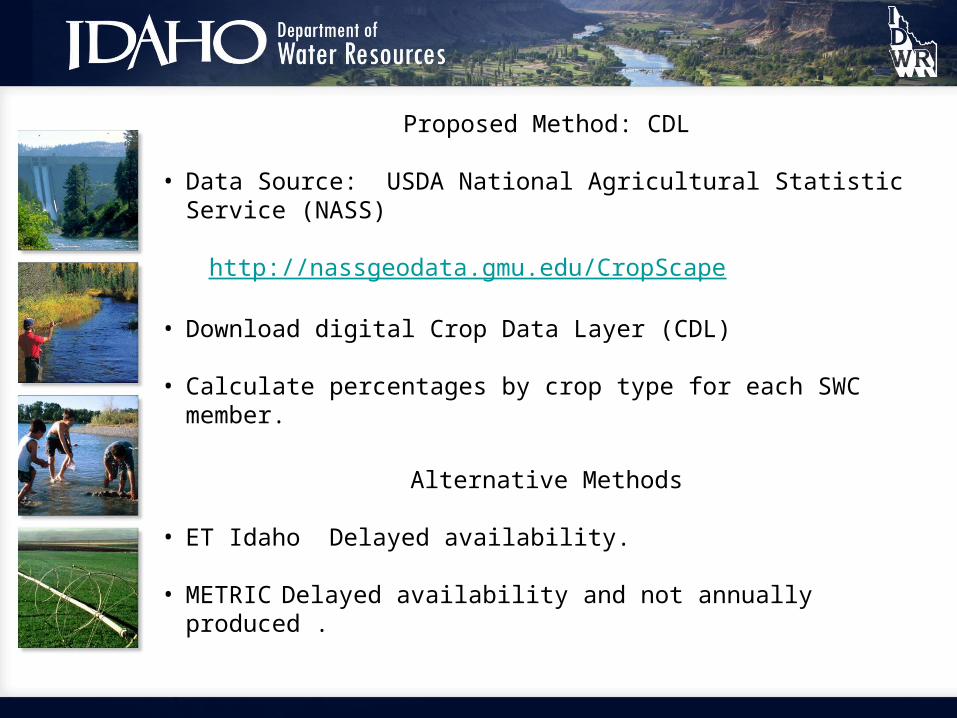
Proposed Method: CDL
• Data Source: USDA National Agricultural Statistic Service (NASS)
http://nassgeodata.gmu.edu/CropScape
• Download digital Crop Data Layer (CDL)
• Calculate percentages by crop type for each SWC member.
Alternative Methods
• ET Idaho Delayed availability.
• METRIC Delayed availability and not annually produced .

Processing CDL
• Downloaded digital Crop Data Layer (CDL) for 2007-2013
• Data Speckling

Processing CDL
• Data Smoothing Options
• Filter
• 3 by 3 pixel filter.
• Each pixel in the dataset is assigned a value based on values of neighboring pixels.
• Zonal Statistics
• A polygon dataset determines zones.
• The majority value within each zone is assigned to all pixels in the zone.
• Based on testing decided to use Zonal Statistics.

Processing CDL
• Smoothed CDL with Zonal Statistics
• Overlaid IDWR Irrigated Lands dataset.
• Assigned the majority crop within each irrigated land polygon to all pixels that fall within the polygon.
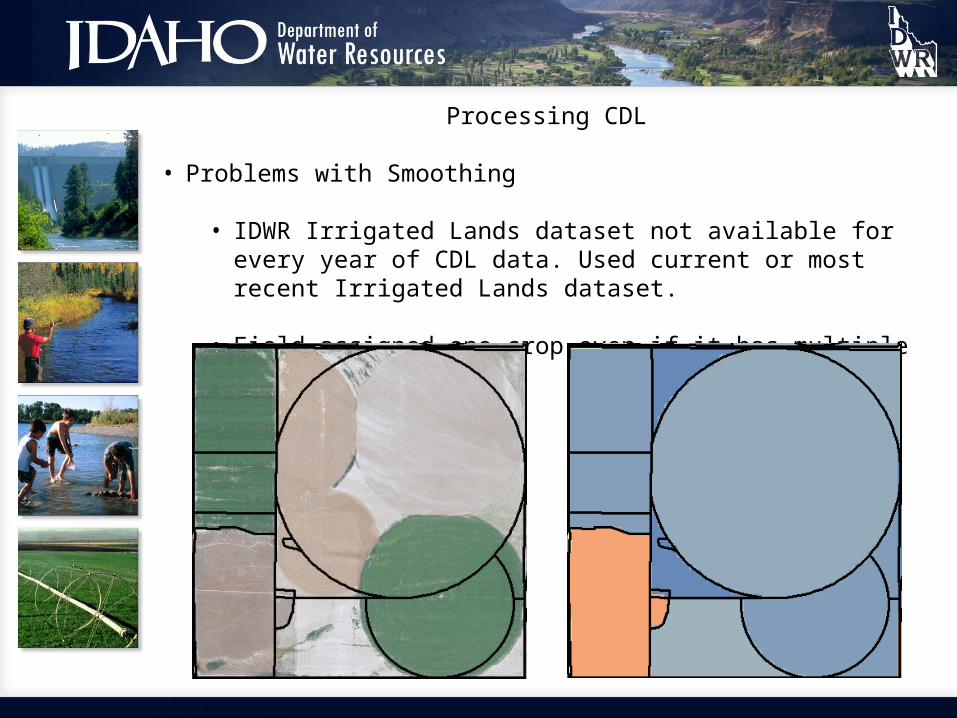
Processing CDL
• Problems with Smoothing
• IDWR Irrigated Lands dataset not available for every year of CDL data. Used current or most recent Irrigated Lands dataset.
• Field assigned one crop even if it has multiple crops
SWC Member Irrigated Lands
• Dataset created by SWC Member
• Burley• Minidoka• TFCC
• Dataset created by IDWR based on water right permissible place of use (PPU)
• A&B• AFRD2• Milner• NSCC

Acres for Each SWC Member
• Processed in ArcGIS with a geoprocessing model
• CDL_Processing” script in the “CDL_Toolbox.tbx
• Step 1: Clip CDL with SWC Irrigated Lands Dataset

Acres for Each SWC Member
• Step 2: Group by Raster Value
• CDL Attribute Description: generic_cdl_attributes.dbf
RISD Group Name Raster Value Raster Value Description
Alfalfa 36 Alfalfa
Barley 21 Barley
Corn 1 Corn
Developed - Semi Irr 121122
Developed/Open SpaceDeveloped/Low Intensity
Dry Beans 42 Dry Beans
Oats 28 Oats
Pasture/Hay 3762176181
Other Hay/Non Alfalfa--- Historical value no longer usedGrass/Pasture--- Historical value no longer used
Peas 53 Peas
Potatoes 43 Potatoes
Spring Wheat 23 Spring Wheat
Sugarbeets 41 Sugarbeets
Winter Wheat 24 Winter Wheat
z_Non-Crop 6163111112131141142143152171190195
Fallow/Idle CroplandForestOpen WaterPerennial Ice/SnowBarrenDeciduous ForestEvergreen ForestMixed ForestShrubland--- Historical value no longer usedWoody WetlandsHerbaceous Wetlands
z_Developed - No Irr 123124
Developed/Med IntensityDeveloped/High Intensity
z_Other All other values

Acres for Each SWC Member
• Step 3: Calculate Acres by RISD Group (acres.xls)
• Step 4: Compute 3-Year Average (CDL_summary.xlsx)
• Discussion:
• Average data to reduce influence of a single year while still being representative of the current cropping pattern.
• 7 years of data did not indicate a clear relation between cropping pattern and water supply (CDL_summary_SWSI.xlsx), so decided to use a shorter average.
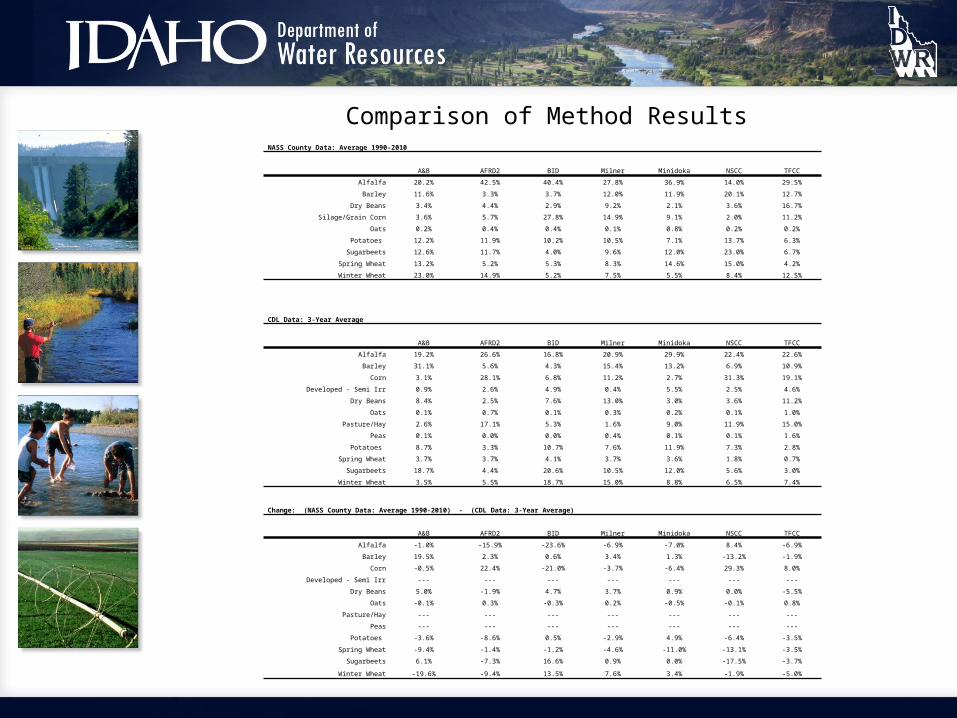
Comparison of Method ResultsNASS County Data: Average 1990-2010
A&B AFRD2 BID Milner Minidoka NSCC TFCC
Alfalfa 20.2% 42.5% 40.4% 27.8% 36.9% 14.0% 29.5%
Barley 11.6% 3.3% 3.7% 12.0% 11.9% 20.1% 12.7%
Dry Beans 3.4% 4.4% 2.9% 9.2% 2.1% 3.6% 16.7%
Silage/Grain Corn 3.6% 5.7% 27.8% 14.9% 9.1% 2.0% 11.2%
Oats 0.2% 0.4% 0.4% 0.1% 0.8% 0.2% 0.2%
Potatoes 12.2% 11.9% 10.2% 10.5% 7.1% 13.7% 6.3%
Sugarbeets 12.6% 11.7% 4.0% 9.6% 12.0% 23.0% 6.7%
Spring Wheat 13.2% 5.2% 5.3% 8.3% 14.6% 15.0% 4.2%
Winter Wheat 23.0% 14.9% 5.2% 7.5% 5.5% 8.4% 12.5%
CDL Data: 3-Year Average
A&B AFRD2 BID Milner Minidoka NSCC TFCC
Alfalfa 19.2% 26.6% 16.8% 20.9% 29.9% 22.4% 22.6%
Barley 31.1% 5.6% 4.3% 15.4% 13.2% 6.9% 10.9%
Corn 3.1% 28.1% 6.8% 11.2% 2.7% 31.3% 19.1%
Developed - Semi Irr 0.9% 2.6% 4.9% 0.4% 5.5% 2.5% 4.6%
Dry Beans 8.4% 2.5% 7.6% 13.0% 3.0% 3.6% 11.2%
Oats 0.1% 0.7% 0.1% 0.3% 0.2% 0.1% 1.0%
Pasture/Hay 2.6% 17.1% 5.3% 1.6% 9.0% 11.9% 15.0%
Peas 0.1% 0.0% 0.0% 0.4% 0.1% 0.1% 1.6%
Potatoes 8.7% 3.3% 10.7% 7.6% 11.9% 7.3% 2.8%
Spring Wheat 3.7% 3.7% 4.1% 3.7% 3.6% 1.8% 0.7%
Sugarbeets 18.7% 4.4% 20.6% 10.5% 12.0% 5.6% 3.0%
Winter Wheat 3.5% 5.5% 18.7% 15.0% 8.8% 6.5% 7.4%
Change: (NASS County Data: Average 1990-2010) - (CDL Data: 3-Year Average)
A&B AFRD2 BID Milner Minidoka NSCC TFCC
Alfalfa -1.0% -15.9% -23.6% -6.9% -7.0% 8.4% -6.9%
Barley 19.5% 2.3% 0.6% 3.4% 1.3% -13.2% -1.9%
Corn -0.5% 22.4% -21.0% -3.7% -6.4% 29.3% 8.0%
Developed - Semi Irr --- --- --- --- --- --- ---
Dry Beans 5.0% -1.9% 4.7% 3.7% 0.9% 0.0% -5.5%
Oats -0.1% 0.3% -0.3% 0.2% -0.5% -0.1% 0.8%
Pasture/Hay --- --- --- --- --- --- ---
Peas --- --- --- --- --- --- ---
Potatoes -3.6% -8.6% 0.5% -2.9% 4.9% -6.4% -3.5%
Spring Wheat -9.4% -1.4% -1.2% -4.6% -11.0% -13.1% -3.5%
Sugarbeets 6.1% -7.3% 16.6% 0.9% 0.0% -17.5% -3.7%
Winter Wheat -19.6% -9.4% 13.5% 7.6% 3.4% -1.9% -5.0%

Information on Website
http://idwr.idaho.gov/News/WaterCalls/Surface%20Coalition%20Call/
• CDL folder
• Input CDL Datasets
CDL_swc_2007_30m_zs.tif (re-sampled from 56 m pixels to 30 m)CDL_swc_2008_30m_zs.tif (re-sampled from 56 m pixels to 30 m)CDL_swc_2009_30m_zs.tif (re-sampled from 56 m pixels to 30 m)CDL_swc_2010_zs.tifCDL_swc_2011_zs.tifCDL_swc_2012_zs.tifCDL_swc_2013_zs.tif
• Processing Output
• Output by company and year from the geoprocessing script.
• GIS Folder
• Geoprocessing Script: CDL_Toolbox.tbx• ArcMap Project: CDL-SWC-TWG.mxd• CDL Attribute Key: generic_cdl_attributes.dbf• Geoprocessing Script Grouping Calculation: CDL_Toolbox.tbx

Information on Website
http://idwr.idaho.gov/News/WaterCalls/Surface%20Coalition%20Call/
• Irrigated Acres folder
• Shapefiles of the irrigated acres used for each SWC member
• Burley BID_POU_2013.shp• Minidoka minidoka acres 3-13.shp• TFCC TFCC_2013.shp• A&B AB_SW_clip_IDWR_Irr2010.shp• AFRD2 AFRD2_snake_clip_IDWR_Irr2010.shp• Milner milner_clip_IDWR_Irr2010.shp• NSCC northside_clip_IDWR_Irr2010.shp
• Loose files
• CDL Method Comparison Results (Slide 12): CDL_Comparison_Method_Results.docx• This PowerPoint: CDL_Cropping_Pattern.pptx