Proposed Las Cruces to El Paso Passenger Rail Service...
31
Las Cruces – El Paso Passenger Rail Feasibility Study, Executive Summary, April 26, 2017 Page 1 Proposed Las Cruces to El Paso Passenger Rail Service Feasibility Study Executive Summary The following summary document is prepared specifically for purposes of a discussion with members of the Board of Directors of the South Central Regional Transit District on April 26, 2017, regarding the feasibility study for the proposed Las Cruces – El Paso passenger rail service. It consists or a one-page abstract that concisely states key findings and recommendations of the study, followed by pages that expand briefly on each of these findings with illustrative maps and tables. David Chandler Director Economic Development Center for Neighborhood Technology [email protected] Office: 773-269-4023; Mobile: 312-909-9928
Transcript of Proposed Las Cruces to El Paso Passenger Rail Service...

Las Cruces – El Paso Passenger Rail Feasibility Study, Executive Summary, April 26, 2017 Page 1
Proposed Las Cruces to El Paso
Passenger Rail Service Feasibility Study
Executive Summary
The following summary document is prepared specifically for purposes of a discussion with members of
the Board of Directors of the South Central Regional Transit District on April 26, 2017, regarding the
feasibility study for the proposed Las Cruces – El Paso passenger rail service. It consists or a one-page
abstract that concisely states key findings and recommendations of the study, followed by pages that
expand briefly on each of these findings with illustrative maps and tables.
David Chandler
Director Economic Development
Center for Neighborhood Technology
Office: 773-269-4023; Mobile: 312-909-9928

Las Cruces – El Paso Passenger Rail Feasibility Study, Executive Summary, April 26, 2017 Page 2
Table of Contents Abstract ......................................................................................................................................................... 3
Study Area ..................................................................................................................................................... 4
Population & Economy of the Study Area .................................................................................................... 5
Use of Existing Transit Services ..................................................................................................................... 8
Projected Ridership and Station Area Development .................................................................................. 10
Proposed Service Plan ................................................................................................................................. 13
Rolling Stock Costs ...................................................................................................................................... 17
Operating Costs ........................................................................................................................................... 22
Negotiation with BNSF ................................................................................................................................ 28
State and Federal Support for the Proposed Rail Investment .................................................................... 30
Strategic Recommendations ....................................................................................................................... 31

Las Cruces – El Paso Passenger Rail Feasibility Study, Executive Summary, April 26, 2017 Page 3
Abstract The primary study area for this project is a seven-mile buffer on either side of the BNSF rail line
between terminal stations in Las Cruces and El Paso.
The Las Cruces – El Paso corridor has a sufficient population and economy to support and benefit
from a commuter rail service, and substantial public support exists for the establishment of the
proposed rail service in Dona Ana County.
To date bus-based transit services in the region do not have sufficient patronage to indicate a
market for commuter rail. Current transit ridership indicates needs to: differentiate rail from bus
service, improve transit connectivity, and undertake extensive transit-oriented development (TOD)
around rail stations if commuter rail is to be feasible.
Analyses based on an applicable sketch model to which local data are applied and 10 comparable
commuter rail services project daily ridership for the proposed passenger rail line between 5,500
and 9,200 passengers on an average working day.
A schedule that would serve and encourage the projected ridership would require 8 to 10 round trip
train movements per day, with average headways of 30 to 45 minutes during morning and evening
rush hours and headways of 120 minutes during midday.
The rolling stock required to serve this schedule, for the higher ridership estimate consists of 4 train
sets, each of which includes a locomotive and 3 passenger cars. The capital investment to acquire
this rolling stock is approximately $76.8 million for new equipment and $13.86 for used equipment.
Analyses based on 12 comparable rail services estimate the costs to operate the proposed service,
once established, at $15.61 to $18.68 per one-way trip, $26.87 to 27.46 per service mile.
Establishment of the passenger rail service will require successful negotiations with BNSF re (a)
Costs for rights of use or for acquisition of the rail line and (b) Costs to upgrade the rail
infrastructure to passenger standards (c) Terms of joint use.
Re public support to fund the proposed rail service: (a) The State of NM is currently disinclined to
make further investments in railroad ownership or operations. (b) Federal programs to support
passenger rail service are in flux.
Strategic recommendations: (a) Develop a partnership with authorities of metropolitan El Paso for
rail service funding, BNSF negotiations, and operations. (b) Recruit a short line railroad as the service
operator and a negotiating partner. (c) With El Paso authorities, create an action plan for improved
transit connections and TOD around terminal rail stations.

Las Cruces – El Paso Passenger Rail Feasibility Study, Executive Summary, April 26, 2017 Page 4
Study Area
The primary study area for this project is a seven-mile buffer on either side of the BNSF rail line
between terminal stations in Las Cruces and El Paso. However, for some purposes all of Dona Ana
County or the entire metropolitan areas of Las Cruces or El Paso are considered. The track of the
proposed passenger rail line is the 42-mile existing BNSF railroad connecting El Paso Union Station
to Las Cruces, running parallel to I-25. The rail links major activity centers – El Paso and Las Cruces,
providing service to Sunland Park, Montoya, Canutillo, Anthony, Berino and Vado.
Figure 1: Proposed Line

Las Cruces – El Paso Passenger Rail Feasibility Study, Executive Summary, April 26, 2017 Page 5
Population & Economy of the Study Area
The Las Cruces – El Paso corridor has a sufficient population and economy to support and benefit
from a commuter rail service. Communities along the corridor are growing – since 2000 population
increased by 20 percent and is expected to add another 20 percent by 2030. Population and job
density is the highest along I-10 & I-25 and in particular within the city limits of El Paso, Las Cruces
and Anthony.
Table 1: Population Growth
2000 Census 2014 ACS Population Change
El Paso 563,662 669,771 18.8%
Sunland Park 13,309 14,794 11.2%
Canutillo 5,129 6,091 18.8%
Anthony 7,904 9,462 19.7%
Vado 3,003 2,781 -7.4%
Berino No data 1,674 -
Mesilla Park 2,180 2,364 8.4%
Las Cruces 74,267 100,360 35.1%
Total 669,454 807,297 20.6%
In Dona Ana County, two large contributors to this increase have been the growing retiree
population (expected to rise by 141% between 1995 and 2025) and the presence of Doña Ana
Community College and New Mexico State University, which have a combined enrollment of
approximately 25,000 students. El Paso also has a rapidly growing senior population and the
University of Texas at El Paso with a 2016 enrollment of over 23,000 students. Between 2015 and
2020 jobs in the Las Cruces region are projected to increase from 75,450 to 84,830 (12.4%), making
it one of the fastest growing employment centers in New Mexico. By 2030, the El Paso MPO has
projected that the region will gain approximately 138,000 new jobs, thereby expanding the job base
by 47 percent. In keeping with concentrations of seniors and students in the regional population,
“Education and Health” services is the employment category with the largest number of workers in
both Dona Ana County and metropolitan El Paso. The universities in Las Cruces and El Paso are each
cultivating centers of high-tech manufacturing linked to their engineering and research
departments. Seniors, college students, and millennials who are the typical employees of
knowledge-based firms all tend to be users of transit services in higher percentages than the general
US population.
Approximately 11,800 Dona Anna residents (5.7% of the County population) commute to the El Paso
region, while over 6,500 El Paso residents work in Dona Ana County, demonstrating the two regions’
Las Cruces – El Paso Passenger Rail Feasibility Study, Executive Summary, April 26, 2017 Page 6
interdependence. It is also notable that 9.7% of Dona Ana workers and 12.0% of El Paso region
workers, indicating a readiness to commute through a workable means other than driving alone.
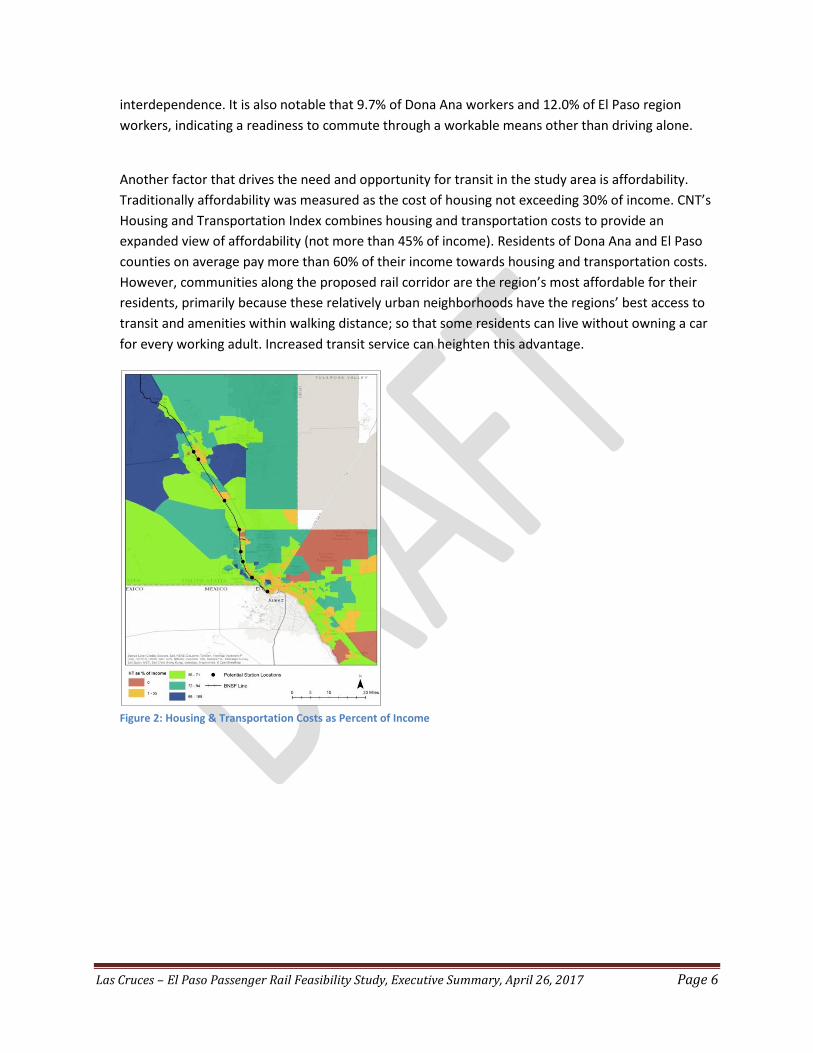
Another factor that drives the need and opportunity for transit in the study area is affordability.
Traditionally affordability was measured as the cost of housing not exceeding 30% of income. CNT’s
Housing and Transportation Index combines housing and transportation costs to provide an
expanded view of affordability (not more than 45% of income). Residents of Dona Ana and El Paso
counties on average pay more than 60% of their income towards housing and transportation costs.
However, communities along the proposed rail corridor are the region’s most affordable for their
residents, primarily because these relatively urban neighborhoods have the regions’ best access to
transit and amenities within walking distance; so that some residents can live without owning a car
for every working adult. Increased transit service can heighten this advantage.
Figure 2: Housing & Transportation Costs as Percent of Income

Las Cruces – El Paso Passenger Rail Feasibility Study, Executive Summary, April 26, 2017 Page 7
Substantial public support exists for the establishment of the proposed rail service in Dona Ana
County. In conjunction with public meetings held to gather public opinion regarding the proposed
passenger rail service, Ngage New Mexico conducted a survey of Dona Ana County residents regarding
their thoughts about how they might use the service and how they would like to see it operated.
Although this survey was not randomized nor sought to produce a statistically significant finding, more
than 1,000 residents completed the survey, demonstrating substantial public interest in the proposed
service. Over 87% of survey respondents said that they would use the rail transit service at least
occasionally. Of the 305 respondents who said they would use the rail service daily, 61.6% would
commute to work, 35.5% would reach a college campus, and 3.9% would go to medical or other
professional service appointments.

Las Cruces – El Paso Passenger Rail Feasibility Study, Executive Summary, April 26, 2017 Page 8
Use of Existing Transit Services To date bus-based transit services in the region do not have sufficient patronage to indicate a market
for commuter rail.
The BNSF track and proposed passenger rail line parallels a segment of the I-10 Expressway that
connects Las Cruces and El Paso. By 2035, traffic volumes on I-10 are projected to double and could
result in congestion if proper planning is not done. However, in 2016 the highway capacity (the ratio of
traffic volume to the capacity of the roadway) on this segment of I-10 was between 23% and 34%
representing reasonably free flow conditions. Speeds on the interstate might help explain the high
number of crashes in Dona Ana County, which had the second highest numbers of crashes among New
Mexico counties during 2014 (3,779). During public meetings, several Dona Ana County residents
pointed to unsafe conditions on I-10 as a reason to support passenger rail. But in general, the proposed
passenger rail service will be offering an alternative to an expressway connection that is not currently
congested.
The I-10 infrastructure is used by the New Mexico Park & Ride service’s Gold Route, which began
operations in 2009. The Gold Route provides 6 round trips and 2 one way trips between El Paso and Las
Cruces a day. It picks up passengers from the Intermodal Terminal in Las Cruces and makes stops at
New Mexico State University and Anthony, Texas before proceeding to the West Side and Downtown
Transit Centers in El Paso, Texas. Both termini are served by local transit buses – RoadRunner and Sun
Metro. The Gold Route service is only available on weekdays and does not operate on 10 national
holidays. Ridership on this service has been flat and has attracted only a small fraction of the passenger
counts needed to support passenger rail service.
NMDOT Ridership
Average Daily Boardings
Days of Operation* Annual Ridership Trips
2013 244.6 250 61,150 10 round trips
2014 246.9 250 61,725 6 round trip & 2 one-way
2015 241.4 250 60,350 6 round trip & 2 one-way
*Operates on weekdays only; plus 10 holidays
Intra-city bus transit services in Las Cruces and El Paso provide connectivity from transit centers to major
locations within their cities and carry significant numbers of passengers – 13,450,000 for Sun Metro in El
Paso and 794,000 for RoadRunner in Las Cruces. However, ridership gains have alternated with declines
in recent years.
The South Central Regional Transit District (SCRTD), which connects towns in Dona Ana, Otero, and
Sierra counties, is growing aggressively from a small base, through its development of multiple routes
and sharp marketing characterized by its new web site. SCRTD can provide an important connecting
function for a new passenger rail service, particularly for its intermediate stations, but its ridership --
estimated at 26,000 passengers in 2017 -- is still small compared to the thousands of daily riders needed
to support passenger rail.

Las Cruces – El Paso Passenger Rail Feasibility Study, Executive Summary, April 26, 2017 Page 9
In light of recent and current levels of transit service in the Las Cruces – El Paso corridor, it should be
recognized that the region has lacked intercity public transit in recent decades and that during the last
two generations the region has grown around an infrastructure designed for automobile traffic. The
region’s keen interest and latent market for quality transit service stems from an awareness of the
success of transit-oriented development (TOD) in other US metropolitan areas and recognition that rail
transit is an amenity desired seniors and millennial knowledge workers – growing elements of the
region’s population – among others. However, if passenger rail is to succeed in the corridor’s current
environment, several strategic considerations will need to be built into the region’s long-range
transportation and economic development plans:
Passenger rail is and should be differentiated as a transportation amenity that is unlike and in some
respects more desirable than bus transportation.
As a fixed guideway mode of transportation, passenger rail can act as a magnet for employment
center, commercial, and residential development around transit stations; and, as amply
demonstrated, will do so when long-range development planning is integrated with planning for
passenger rail.

Las Cruces – El Paso Passenger Rail Feasibility Study, Executive Summary, April 26, 2017 Page 10
Projected Ridership and Station Area Development
Analyses based on an applicable sketch model to which local data are applied and 10 comparable
commuter rail services project daily ridership for the proposed passenger rail line between 5,500 and
9,200 passengers on an average working day.
In order to project ridership for the Las Cruces – El Paso service, CNT applied one of the few sketch
models available in the professional literature for the specific purpose of estimating ridership for
commuter rail service, as opposed to intra-city transit lines. This model incorporates some 10 local
factors, among which significant inputs are whether or not the terminal station of the service is a transit
center – meaning minimally that it is served by four or more connecting bus routes – as well as the
number of residents within a two-mile radius of the station and the number of jobs within a half-mile
radius.
Whether or not the terminal stations for the proposed rail service in Las Cruces and El Paso are terminal
stations is a matter or judgement. Neither station is the primary interline bus terminal for its region;
however, in both cities, the primary bus interline center is less than a mile from the terminal train
station, and 4 or more bus routes could readily be connected to the train station. Currently, neither of
the terminal station areas is well developed with housing or jobs. However, both stations are within a
mile of the central business district of their respective cities, and ambitious plans for transit-oriented
development (TOD) in each station area have been developed. So CNT has projected ridership based on
the possibility that the terminal stations are or are not transit centers, and considered several other
factors in the sketch model to estimate six possible level of ridership, per the following table.
Table 1: Average Daily Ridership
Station
Option 1A - Not a Transit Center, 2014
Option 1B - Transit Center, 2014
Option 2A - Not a Transit Center, 2030
Option 2B - Transit Center, 2030
Option 3A - Not a Transit Center, 2040
Option 3B - Transit Center, 2040
El Paso Union Depot 1871 3115 2313 3851 2628 4376
Sunland Park 600 600 647 647 671 671
Montoya 787 787 843 843 869 869
Canutillo - - - - - -
Anthony 911 911 980 980 1007 1007
Berino/Vado - - - - - -
Mesilla Park 457 457 492 492 505 505
Las Cruces 938 1562 1045 1741 1096 1825
Total 5565 7434 6320 8554 6777 9254
20% Contingency 4452 5947 5056 6843 5422 7403

Las Cruces – El Paso Passenger Rail Feasibility Study, Executive Summary, April 26, 2017 Page 11
In its ridership estimates CNT looked to comparable commuter rail systems around the nation and
selected ten operating services that are similar to the Las Cruces – El Paso Corridor in several respects:
length of the commuter rail line, a pairing of the connected cities that includes a substantial “suburban”
terminal city with a major city or moderate size, avoidance of the nation’s largest cities that have
massive transit systems and multiple, long-established commuter rail lines. Key figures for these
comparable systems are summarized in the following table.
Table 2: Comparable Commuter Rail Lines
Name Santa Cruz-Watsonville
Boston- Manchester, NH, by Lowell project
Denton County A-Train (Dallas to Trinity Hills by Denton )
FrontRunner (Salt Lake City)
Altamont Corridor Express (ACE) Stockton - San Jose
Denver to Denver Airport A-line commuter rail line
Capital Metro Greater Austin
Coaster NCTD San Diego- Oceanside
Northstar Northwern suburbs to Minneapolis
Music City Star Nashville
Year Study of 2015 Scenario G
Project, construction in 2017
Opened 2011
Northern Part: 2008 Southern Part: 2012
Opened in 1998
Opened April 22, 2016
Opened 2010
Opened 1995
Opened 2009
Opened 2006
Distance 22 miles 40min
37 miles 28 miles Northern Part: 50 miles from Ogden to SLC
Southern Part: 80 miles from SLC to Provo
86 miles 22 miles 37min other projects in process Gold-line ;11.2 miles, expected summer 2016 Westminster line: 6.2-miles, expected fall 2016
32miles 41 miles 40 miles 32 miles
Population SC: 270, 000 WL 50,000
B:655,000 M: 110,000
Denton: 123,099 Dallas: 1,258,000
SLC: 200,000 Ogden: 83,000 Provo: 112,000
SJ: 1,000,000 Stockton: 300,000
D: 650,000 Airport: 54 million passengers in 2015 (18th busiest airport in the world)
Austin : 850,000 Northern suburbs: fastest growth in the US
San Diego: 1,350, 000 Oceanside: 170,800
Minneapolis: 400,000 Big Lake: 10,000
Nashville: 650,000 Lebanon (Tennessee) 23,000
Ridership 5,500 per weekday
650,000 per year
1,900 per day
16,800 per day (5,000 for the Northern Part in 2012)
3,700 per day
37,900 – estimated average daily ridership
2,900 per day
5,600 per day
3,100 per day
1,225 per day
Frequency 60 weekday trains
16 train per day
26 train per day
30mn (peak) 60mn (off-peak)
Every Hour 4 round trip per
15minues 30min (peak) 60min (off-peak)
Mostly
SB am –
approx. 40
min
Only:
5-7.30am
SB- approx.
30min
60min

Las Cruces – El Paso Passenger Rail Feasibility Study, Executive Summary, April 26, 2017 Page 12
day NB pm –
approx.
40min
4-6.30pm
NB- approx.
30min
Comparison with these systems shows that the ridership for Las Cruces – El Paso projected by sketch
modeling falls well within the range of ridership for comparable commuter rail systems. However,
projected ridership for our service is within the upper third for comparable systems. In light of this
comparison and our region’s current record of low transit ridership, CNT has thought it prudent to also
consider a range of ridership estimates that is 20% lower than the range of ridership projected by the
sketch model.

Las Cruces – El Paso Passenger Rail Feasibility Study, Executive Summary, April 26, 2017 Page 13
Proposed Service Plan
A schedule that would serve and encourage the projected ridership would require 8 to 10 round trip
train movements per day, with average headways of 30 to 45 minutes during morning and evening rush
hours and headways of 120 minutes during midday.These schedules consider several factors, namely
ideal service frequency, minimizing the number of train sets, allocation of express and all-station trips,
and intermodal riders.
The allocation of express and all-station trips has also been considered. Since the rail should serve those
wishing to commute from terminal and non-terminal stations, it is important that morning and evening
peak service include both express and all-station options. Accordingly, all proposed schedules include at
least one of each service type from both terminal stations.
These schedules also recognize that commuters using a subsequent mode of transit need to arrive well
in advance of business hours. Accordingly, the schedules provide that peak morning trains arrive in El
Paso and Las Cruces before 8:30 a.m. and in most cases before 8:00 a.m.
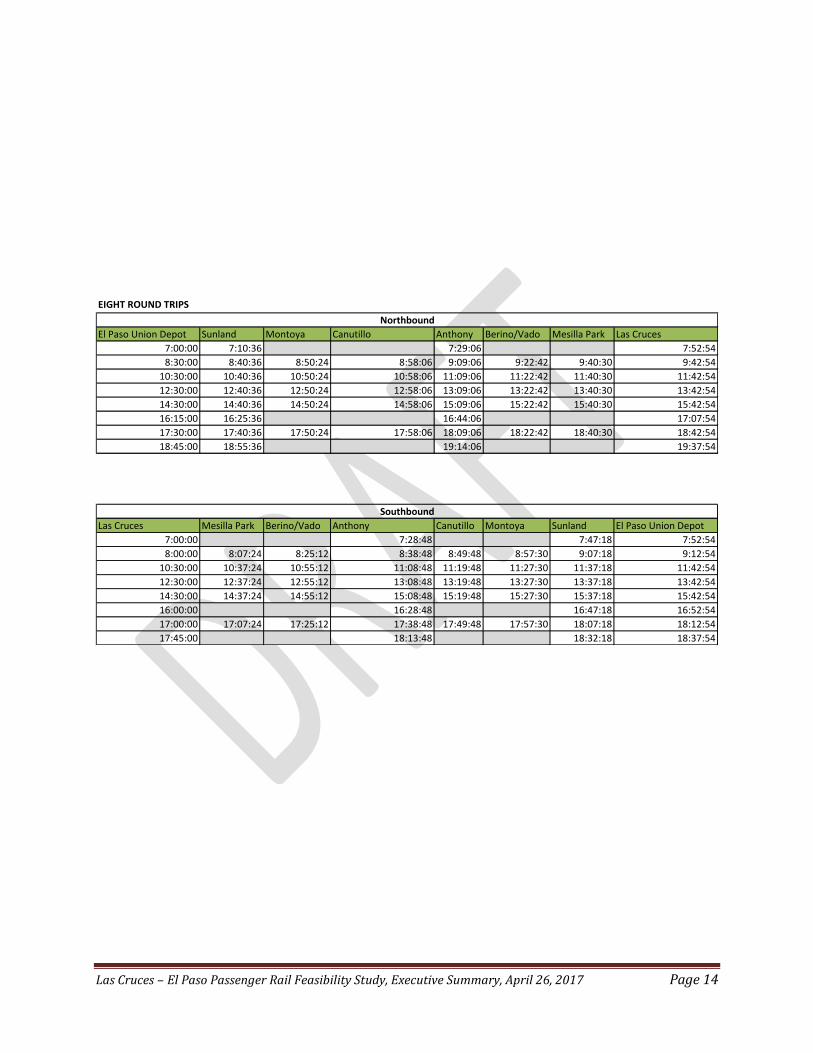
Las Cruces – El Paso Passenger Rail Feasibility Study, Executive Summary, April 26, 2017 Page 14
EIGHT ROUND TRIPS
El Paso Union Depot Sunland Montoya Canutillo Anthony Berino/Vado Mesilla Park Las Cruces
7:00:00 7:10:36 7:29:06 7:52:54
8:30:00 8:40:36 8:50:24 8:58:06 9:09:06 9:22:42 9:40:30 9:42:54
10:30:00 10:40:36 10:50:24 10:58:06 11:09:06 11:22:42 11:40:30 11:42:54
12:30:00 12:40:36 12:50:24 12:58:06 13:09:06 13:22:42 13:40:30 13:42:54
14:30:00 14:40:36 14:50:24 14:58:06 15:09:06 15:22:42 15:40:30 15:42:54
16:15:00 16:25:36 16:44:06 17:07:54
17:30:00 17:40:36 17:50:24 17:58:06 18:09:06 18:22:42 18:40:30 18:42:54
18:45:00 18:55:36 19:14:06 19:37:54
Northbound
Las Cruces Mesilla Park Berino/Vado Anthony Canutillo Montoya Sunland El Paso Union Depot
7:00:00 7:28:48 7:47:18 7:52:54
8:00:00 8:07:24 8:25:12 8:38:48 8:49:48 8:57:30 9:07:18 9:12:54
10:30:00 10:37:24 10:55:12 11:08:48 11:19:48 11:27:30 11:37:18 11:42:54
12:30:00 12:37:24 12:55:12 13:08:48 13:19:48 13:27:30 13:37:18 13:42:54
14:30:00 14:37:24 14:55:12 15:08:48 15:19:48 15:27:30 15:37:18 15:42:54
16:00:00 16:28:48 16:47:18 16:52:54
17:00:00 17:07:24 17:25:12 17:38:48 17:49:48 17:57:30 18:07:18 18:12:54
17:45:00 18:13:48 18:32:18 18:37:54
Southbound

Las Cruces – El Paso Passenger Rail Feasibility Study, Executive Summary, April 26, 2017 Page 15
NINE ROUND TRIPS
El Paso Union Depot Sunland Montoya Canutillo Anthony Berino/Vado Mesilla Park Las Cruces
6:30:00 6:40:36 6:50:24 6:58:06 7:09:06 7:22:42 7:40:30 7:42:54
7:45:00 7:55:36 8:14:06 8:37:54
9:30:00 9:40:36 9:50:24 9:58:06 10:09:06 10:22:42 10:40:30 10:42:54
10:30:00 10:40:36 10:50:24 10:58:06 11:09:06 11:22:42 11:40:30 11:42:54
12:30:00 12:40:36 12:50:24 12:58:06 13:09:06 13:22:42 13:40:30 13:42:54
14:30:00 14:40:36 14:50:24 14:58:06 15:09:06 15:22:42 15:40:30 15:42:54
16:15:00 16:25:36 16:44:06 17:07:54
17:30:00 17:40:36 17:50:24 17:58:06 18:09:06 18:22:42 18:40:30 18:42:54
19:10:00 19:20:36 19:39:06 20:02:54
Northbound
Las Cruces Mesilla Park Berino/Vado Anthony Canutillo Montoya Sunland El Paso Union Depot
6:00:00 6:07:24 6:25:12 6:38:48 6:49:48 6:57:30 7:07:18 7:12:54
7:00:00 7:28:48 7:47:18 7:52:54
8:30:00 8:37:24 8:55:12 9:08:48 9:19:48 9:27:30 9:37:18 9:42:54
10:30:00 10:37:24 10:55:12 11:08:48 11:19:48 11:27:30 11:37:18 11:42:54
12:30:00 12:37:24 12:55:12 13:08:48 13:19:48 13:27:30 13:37:18 13:42:54
14:30:00 14:37:24 14:55:12 15:08:48 15:19:48 15:27:30 15:37:18 15:42:54
16:00:00 16:28:48 16:47:18 16:52:54
17:15:00 17:22:24 17:40:12 17:53:48 18:04:48 18:12:30 18:22:18 18:27:54
17:45:00 18:13:48 18:32:18 18:37:54
Southbound

Las Cruces – El Paso Passenger Rail Feasibility Study, Executive Summary, April 26, 2017 Page 16
TEN ROUND TRIPS
El Paso Union Depot Sunland Montoya Canutillo Anthony Berino/Vado Mesilla Park Las Cruces
6:15:00 6:25:36 6:35:24 6:43:06 6:54:06 7:07:42 7:25:30 7:27:54
7:00:00 7:10:36 7:29:06 7:52:54
8:30:00 8:40:36 8:50:24 8:58:06 9:09:06 9:22:42 9:40:30 9:42:54
9:45:00 9:55:36 10:14:06 10:37:54
11:15:00 11:25:36 11:35:24 11:43:06 11:54:06 12:07:42 12:25:30 12:27:54
13:15:00 13:25:36 13:35:24 13:43:06 13:54:06 14:07:42 14:25:30 14:27:54
15:15:00 15:25:36 15:44:06 16:07:54
17:15:00 17:25:36 17:35:24 17:43:06 17:54:06 18:07:42 18:25:30 18:27:54
18:00:00 18:10:36 18:29:06 18:52:54
19:00:00 19:10:36 19:20:24 19:28:06 19:39:06 19:52:42 20:10:30 20:12:54
Northbound
Las Cruces Mesilla Park Berino/Vado Anthony Canutillo Montoya Sunland El Paso Union Depot
6:30:00 6:37:24 6:55:12 7:08:48 7:19:48 7:27:30 7:37:18 7:42:54
7:00:00 7:28:48 7:47:18 7:52:54
8:00:00 8:07:24 8:25:12 8:38:48 8:49:48 8:57:30 9:07:18 9:12:54
9:00:00 9:28:48 9:47:18 9:52:54
10:30:00 10:37:24 10:55:12 11:08:48 11:19:48 11:27:30 11:37:18 11:42:54
12:30:00 12:58:48 13:17:18 13:22:54
14:30:00 14:37:24 14:55:12 15:08:48 15:19:48 15:27:30 15:37:18 15:42:54
16:15:00 16:22:24 16:40:12 16:53:48 17:04:48 17:12:30 17:22:18 17:27:54
17:30:00 17:58:48 18:17:18 18:22:54
19:00:00 19:07:24 19:25:12 19:38:48 19:49:48 19:57:30 20:07:18 20:12:54
Southbound

Las Cruces – El Paso Passenger Rail Feasibility Study, Executive Summary, April 26, 2017 Page 17
Rolling Stock Costs
The rolling stock required to serve the proposed schedule, for the higher ridership estimate consists of
4 train sets, each of which includes a locomotive and 3 passenger cars. The capital investment to
acquire this rolling stock is approximately $76.8 Million for new equipment and $13.9 Million for used
equipment.
The chart below compares data that could impact the type of vehicle [Diesel Multiple Unit (DMU) or
locomotive (LMV)] used by 13 operational or proposed commuter lines in the United States. This data
includes commuter line distance, population, weekday ridership, average passengers per ride, and an
estimated peak capacity per ride. Generally, commuter lines that cover mid to long distances (between
40 and 90 miles) tend to use locomotives and passenger cars, while commuter lines that run across
shorter distances (20 to 35 miles) use DMU vehicles.
Based on the Las Cruces-El Paso Corridor’s population, the projected ridership, and the proposed
distance of the commuter line, the Las Cruces-El Paso commuter line would be most similar to the San
Diego-Oceanside Coaster and the Minneapolis Northstar. The Coaster covers 41 miles, makes 30 trips
per day, has an average daily ridership of 5,600 per day, and has an average passenger rate per trip of
255. The Northstar covers 40 miles, makes 12 trips per day, has a daily ridership of 3,100 per day, and
has an average passenger per trip rate of 258. For comparison, the proposed Las Cruces-El Paso
commuter line is projected to cover at least 43 miles, make 16-20 trips per day, have an average daily
ridership between 4,452 and 7,404 passengers, and average between 361 and 481 passengers per ride
during peak hours and 278 and 370 passengers per ride during non-peak hours. Both the Coaster and
the Northstar use diesel electric locomotive engines and Bombardier bi-level coaches. The bi-level
coaches have a greater capacity for seated passengers (between 136 and 162) compared to the DMU
vehicles (between 91 and 108), which may be advantageous for commuter lines with passengers
travelling longer distances.
Given the information provided in the following table, it seems that distance traveled and population
size have large impacts on the daily ridership and average ridership per ride for commuter rail lines.
Commuter lines that use locomotives generally have higher ridership; they also travel greater distances
and access larger populations.

Las Cruces – El Paso Passenger Rail Feasibility Study, Executive Summary, April 26, 2017 Page 18
Table 2: Commuter Line Equipment & Ridership Comparison Chart
Name Santa Cruz-Watsonville
Boston- Manchester, NH, by Lowell project
Denton County A-Train (Dallas, to Trinity Hills by Denton)
Front Runner (Salt Lake City)
Altamont Corridor Express (ACE) Stockton - San Jose
Denver to Denver Airport A-line commuter rail line
Capital Metro Greater Austin
Coaster NCTD San Diego- Oceanside
Northstar Northern suburbs to Minneapolis
Music City Star Nashville
Fort Worth and Dallas TRE (Trinity Railway Express)
New London and New Haven Shoreline East
Las Cruces- El Paso Commuter Rail Estimates
Locomotive (LMV) or Multiple Unit (DMU)?*
DMU (maybe FRA compliant)
LMV DMU LMV LMV EMU DMU LMV LMV LMV LMV LMV LMV
Type of Locomotive (LMV) /DMU
Diesel-electric multiple unit studied
Diesel-electric locomotive engine studied
Diesel-electric multiple unit engine
Diesel-electric locomotive engine
Diesel-electric locomotive engine
Electric multiple unit
Diesel-electric multiple unit engine
Diesel-electric LMV engine
Diesel-electric LMV engine
Diesel-electric LMV engine
Diesel- LMV engine and Diesel electric multiple units
Diesel-electric LMV engine
Diesel LMV Engine recommended
Carriage Car Manufacturer/Fleet Size
(11) Stadler GTW (motor and carriage in same vehicle)
(22) bi-level Bombardier coaches (25) refurbished ex-New Jersey Comet Is (16) locomotives
(30) bi-level Bombardier coaches (5) F40PH-2C engines (1) F40PH-3C engine
(37) Hyundai-Rotem EMU (motor and carriage in same vehicle)
(6) Stadler GTW (motor and carriage in same vehicle)
(28) Bombardier bi-level coaches (7) locomotives
(17) Bombardier bi-level coaches (6) locomotives
(7) former Metra bi-level gallery cars (likely Nippon Sharyo) (4) locomotives
(7) EMD F59PH IV and (2) EMDF59PHI Locomotives. (13) DMU: Budd Rail Diesel (15) Bombardier Transportation bi-level cabs, (10) Hawker-Siddeley bi-level
(6) GH40-2H and (12) GE-P40DC Locomotives (10) Bombardier Transportation bi-level cabs, (33) Mafersa Coaches
Likely 4 locomotives, 8-12 passenger cars recommended
Car-locomotive cost
DMU: $8-10M Locomotives & trailer cars: $3M (used); $12-16M (new)
$23.3 million est. for purchase of rolling stock
$7.5 million each vehicle
Bombardier coaches: $2.2 M each
Bombardier coaches: ~$2.2 M each
$36.04 M total (~$6M each vehicle)
$3.465M (used); $14.2-$19.2M (new)
Car-locomotive (LMV) train configuration
DMU: Married pair LMV: one loc. + two trailers
One LMV + four coaches
One LMV + six-seven passenger cars
DMU Married pair
Likely DMU married pair
One LMV, three or four cars
One LMV, two cars
One LMV, three cars
One LMV, four cabs
One LMV, two-three cars recommended

Las Cruces – El Paso Passenger Rail Feasibility Study, Executive Summary, April 26, 2017 Page 19
Carriage Car Capacity
200 passengers each, 108 seated and 92 standing
Bombardier cars: 136-162 seated; up to 360 total with standing Comet Is: N/A
Bombardier cars: 136-162 seated; up to 360 total with standing
91 seated passengers and 78 standing; will be in “married pair” configuration
200 passengers each, 108 seated and 92 standing
Bombardier cars: 136-162 seated; up to 360 total with standing
Bombardier cars: ~140 seated; up to 355 with standing
Gallery cars: 155-169 passengers
Bombardier cars: 136-162 seated; up to 360 total with standing, Budd RDC's: 96 seated
Bombardier cars: 136-162 seated; up to 360 total with standing, Mafersa cabs: 100 seated
Rail Distance 32 miles proposed
53-46 miles proposed
21 miles 88 miles 85 miles 23.5 miles 32 miles 41 miles 40 miles 32 miles 34 miles 45 miles (est.) 43-48 miles proposed
Population SC: 270, 000 WL 50,000
B:655,000 M: 110,000
Denton: 123,099 Dallas: 1,258,000
SLC: 200,000 Ogden: 83,000 Provo: 112,000
SJ: 1,000,000 Stockton: 300,000
D: 650,000 Airport: 54 million passengers in 2015 (18th busiest airport in the world)
Austin : 850,000 Northern suburbs: fastest growth in the US
San Diego: 1,350, 000 Oceanside: 170,800
Minneapolis: 400,000 Big Lake: 10,000
Nashville: 650,000 Lebanon (Tennessee) 23,000
Dallas: 1,258,000 Fort Worth: 792,727
New London: 27,545 New Haven: 130,660
Las Cruces-El Paso Corridor: 456,885
Number of Daily Trips
Scenario G :60 trips daily - 30 round trip
50 trips daily -25 roundtrip (Manchester commuter plan); 16 trips daily (Nashua plan)
60 trips daily – 30 roundtrip
56 trips daily – 28 roundtrip
8 trips daily
144 trips daily 38 trips daily 22 trips daily – 11 roundtrip
12 trips daily 12 trips daily – 6 roundtrip
70 trips daily - 35 round trips)
42 trips- 21 round trip
16 to 20 trips daily – 8 to 10 roundtrip proposed
Fares (one way)
N/A N/A $1.50 $2.50 $4.50-$13.75 $2.60-$9 $2.75 $4-$5.50 $3-$6 $5.25 $4.15 $2.89 TBD
Ridership 5,500 per weekday estimated
3,230 (Manchester); 1,170 (Nashua)
1,900 per day
16,800 per day (5,000 for the Northern Part in 2012)
3,700 per day 37,900 – estimated average daily ridership
2,900 per day 5,600 per day 3,100 per day 1,225 per day 6900 per day 2,200 per day 4,452 (low estimate with 20% contingency) – 7404 (high estimate with 20% contingency) per day*
Average Passengers per Trip (ridership divided by number of daily trips)
92 65 (Manchester) 73 (Nashua)
31 300 463 263 76 255 258 102 95
52 278-370
Estimated Peak Capacity per Trip (130% of Avg. rounded)
120 85 (Manchester) 95 (Nashua)
40 390 602 342 99 332 335 133 128 68 361-481

Las Cruces – El Paso Passenger Rail Feasibility Study, Executive Summary, April 26, 2017 Page 20
Rolling Stock Capital Costs
1. Locomotive engines
This report will make its recommendations for vehicle purchases based on the assumption that the Las Cruces-El Paso commuter line will use locomotive
vehicles rather than DMU units.
2. Number of locomotives
Based on the proposed schedules in the Estimated Ridership and Proposed Service Plan, the Las Cruces-El Paso line will make between eight and ten round
trips per day. The number of locomotives needed to operate during peak hours is three train sets. A fourth train set is required to allow for repairs and
emergencies.
3. Number of passenger cars
The locomotive based commuter rail lines analyzed in this study each use one locomotive to pull between two and seven passenger cars, depending on the
capacity needed. The majority of the locomotive based lines use bombardier bi-level cars, which can seat up to 162 people per car and accommodate nearly
360 passengers including those standing. As the Estimated Ridership and Proposed Service Plan assumes that most passengers on the Las Cruces-El Paso line
will be riding for the majority of the distance, this report will use the seated number to estimate the Las Cruces-El Paso line’s passenger carriage needs.
Average ridership on the proposed Las Cruces-El Paso line is currently estimated at 278-370 passengers per trip, which leads to an estimate of 361-481
passengers at peak capacity. As an initial recommendation, this report suggests that the need for passenger cars be based on the projected peak levels for
Relation of Capacity to type of vehicle
Short distance Mid-sized population DMU - fewer seats
Mid distance Mid-sized commuter population Locomotive (other commuter lines out of Boston also use locomotive)
Short distance Small commuter population DMU - seems to run too many trains per day for ridership
Long distance Large commuter population Locomotive - UTA owns most of track but shares right of way with UP for a portion
Long Distance Mid-sized commuter population Locomotive with limited service more passengers per trip
Short Distance Large commuter population DMU with frequent service and high ridership
Short distance Small-midsized population DMU better ridership than Denton, perhaps still too frequent
Mid distance Midsized commuter population Locomotive with decent daily ridership
Mid distance Midsized commuter population Locomotive with good daily ridership
Short distance Small commuter population Locomotive – frequency of trips seem appropriate to ridership
Short distance Large population. High frequency trips with large seating ability
Mid distance Small commuter population Locomotive with low daily ridership
Mid distance Midsized commuter population Most similar to San Diego-Oceanside and Minneapolis

Las Cruces – El Paso Passenger Rail Feasibility Study, Executive Summary, April 26, 2017 Page 21
passengers per ride. Three cars per train will allow each train to seat all passengers even during peak hours.1 Thus, in order to support eight to ten round trips
per day with three passenger cars per train, the Las Cruces-El Paso line will need 9-12 passenger cars, assuming the purchase of a spare trainset.
4. Cost to purchase locomotives and passenger cars
Based on the experience comparable railroads, the following chart, shows cost estimates based on the amount of equipment needed to meet the estimated
ridership and service schedule needs of the Las Cruces – El Paso service.
Table 3: Las Cruces-El Paso Commuter Line Equipment Summary Chart - Locomotive
Estimated Number Passengers per trip during Peak Hours
# of locomotives
Total # of Passenger Cars (3 per train set)
Estimated Cost, New Equipment per unit (train set)
Estimated Cost, Used Equipment per unit (train set)
Estimated Cost, New Equipment total (unit cost multiplied by # train sets)
Estimated Cost, Used Equipment total (unit cost multiplied by # train sets)
361-481 3-4 9-12 $14.2-$19.2M $3.465M $42.6M (min)-$76.8M (max) $10.39M (min)-$13.86M (max)
As a cautionary note, while the difference between the costs of new and used rolling stock is very large, reliability is essential to rail operations,
and some smaller passenger rail operations have faced repeated difficulties from relying on second hand equipment.
1 It should be noted that adding a third car to accommodate for peak hours would likely increase fuel costs. If feasible, one advantage of using DMU vehicles
would be that cars can be added as needed during service, thereby resolving this problem and reducing energy costs. https://sccrtc.org/wp-
content/uploads/2016/02/RailTransitStudy_FullDoc.pdf

Las Cruces – El Paso Passenger Rail Feasibility Study, Executive Summary, April 26, 2017 Page 22
Operating Costs
Analyses based on 12 comparable rail services estimate the costs to operate the proposed service, once established, at $15.61 to $18.68 per
one-way trip, $26.87 to 27.46 per service mile.
1. Operating and Maintenance Data from Comparable Commuter Services
CNT used data on the same comparable commuter rail services that it compared in regard to capital costs to estimate the El Paso – Las Cruces
line’s operating and maintenance expenses, drawing data on these services from the National Transit Database and the American Public
Transportation Association (APTA) Data Handbook. The most recent data available from the National Transit Database is from 2015. This data is
summarized in the following tables.
Table 4: Operating Costs for Comparable Commuter Rail Lines
Name Denton County A-Train
FrontRunner Salt Lake City
Altamont Corridor Express
Denver Airport A-line
Capital Metro Greater Austin
Coaster NCTD San Diego- Oceanside
Northstar Minneapolis
Music City Star Nashville
Fort Worth-Dallas Trinity Railway Express
New London and New Haven Shoreline east
Wages & Salaries $357K $12.65M $2.1M $33M $1.7M $1.8M $2.9M $1.7M
Fuel $2K $4.58M $1.48M $127K $0 $2.1M $993K $708K
Service Costs $1.3M $1.27M $34.8M $3.4M $3.4M $2.1M $888K $2.25M $2.11M
Materials & Supplies
$122K $846K $10.28M $482K $150K $669K $25K $94K $1.8K
Total Annual Operating Expense
$13.2M $39.3M $16.67M $111M $14.79M $19.7M $15.7M $4.68M $24M $33.9M

Las Cruces – El Paso Passenger Rail Feasibility Study, Executive Summary, April 26, 2017 Page 23
Table 5: Operating Statistics for Comparable Rail Lines
Name Denton County A-Train
FrontRunner Salt Lake City
Altamont Corridor Express
Capital Metro Greater Austin
Coaster NCTD San Diego- Oceanside
Northstar Minneapolis
Music City Star Nashville
Fort Worth-Dallas Trinity Railway Express
New London and New Haven Shoreline east
Commuter Rail NTD Annual Average
Locomotive or Multiple Unit?
DMU Locomotive Locomotive DMU Locomotive Locomotive Locomotive Locomotive Locomotive
Annual Commuter Rail Capital Costs
Operating Expenses $13.4M $39.3M $16.7M $14.8M $19.7M $15.7M $4.7M $24M $30.9M
Annual Ridership 494K 4.6M 1.3M 728K 1.2M 650K 200K 2.1M 520K
Annual Unlinked Passenger Trips
555,423 4,645,307 1,209,755 833,195 1,641,525 722,637 265,527 2,283,895 889,598
Operating Cost per Unlinked Passenger Trip
$24.18
$8.47
$13.78
$17.76
$12.03
$21.74
$17.63
$11.04
$34.80
$11.12
Operating Cost per Vehicle Revenue Mile
$21.51 $7.38 $17.54 $52.89 $14.15 $29.71 $ 23.42 $20.84 $16.56
Fare Revenue $806K $7.1M $8M $2.5M $7.4M $2.5M $786K $9.4M $2.6M
Farebox Recovery 6% 18% 47.9% 16.9% 37.6% 15.9% 16.7% 39% 8% 50.8%

Las Cruces – El Paso Passenger Rail Feasibility Study, Executive Summary, April 26, 2017 Page 24
2. Operating Cost Estimate from Cost per Unlinked Passenger Trip
This item may be determined by dividing “[Annual] Operating Expenses” by the number of ‘Unlinked Passenger Trips”, as in the middle rows of
the preceding Table. When the “Operating Cost per Unlinked Passenger Trip” items are graphed against trip volume, as in Figure 1 below, they
show a pattern: generally the higher the trip volume the lower the operating cost per trip becomes. This is intuitively reasonable, because higher
trip volumes will make better use of “sunk” operating and maintenance expenses such as infrastructure maintenance and the labor and fuel
required to run trains, not to mention capital investments. This relationship may be graphed, as in Figure 1 below, and the slope of this graph
may be calculated, as factor “y”.
Figure 1: Operating & Maintenance Costs Per Ride for Comparable Commuter Railroads
y = -4E-06x + 23.309 R² = 0.3757
0
5
10
15
20
25
30
35
40
0 1000000 2000000 3000000 4000000 5000000
Op
era
tin
g co
st p
er
pas
sen
ger
bo
ard
ing
Annual unlinked passenger trips
O & M Cost per unlinked passenger boarding

Las Cruces – El Paso Passenger Rail Feasibility Study, Executive Summary, April 26, 2017 Page 25
From this study’s Estimated Ridership and Proposed Service Plan, CNT has estimated the ridership under several basic assumptions and service
plans. These figures of estimated ridership may be combined with the slope of the O & M cost per ride data pattern to yield cost-per-ride
estimates. By multiplying these cost-per-ride estimates times the projected number of rides, we can arrive at an estimate of the overall annual
cost of operating the rail service. As shown in the following table, these estimated costs fall within a range of $16.9 M to $22.2M, depending on
the selected basic ridership assumptions and service plan alternative.
Table 6: Operating Costs Estimated from Ridership and Cost per Ride
Av Daily Ridership Annual Ridership O & M Cost\Ride Annual O & M Cost
El Paso - Las Cruces Low 4452 1,157,520 $18.68 $16,935,610
El Paso - Las Cruces Median 5056 1,314,560 $18.05 $18,012,229
El Paso - Las Cruces High 7404 1,925,040 $15.61 $22,197,497
3. Operating Cost Estimate from Costs per Vehicle Service Mile
Data from comparable operating railroads provides an alternative method of estimating the El Paso – Las Cruces Line’s operating and
maintenance costs. This data, as summarized in Table 6 above, includes a record of the cost per vehicle service mile for each of the comparable
commuter rail lines. When the “Operating Cost per Vehicle Revenue Mile” items are graphed against “Annual Vehicle Revenue Miles”, they show
a pattern. As in the preceding comparison ridership levels, rail cost per vehicle revenue mile decreases as vehicle revenue miles grow.

Las Cruces – El Paso Passenger Rail Feasibility Study, Executive Summary, April 26, 2017 Page 26
Figure 2: Operating & Maintenance Costs per Revenue Mile for Comparable Commuter Railroads
*Using the 2014 data about Vehicle Service miles from the National Transit Database agency snapshots, (https://www.transit.dot.gov/ntd/transit-agency-
profiles)
y = -5E-06x + 29.738 R² = 0.3789
$0.00
$10.00
$20.00
$30.00
$40.00
$50.00
$60.00
0 1,000,000 2,000,000 3,000,000 4,000,000 5,000,000 6,000,000
Op
era
tin
g C
ost
Pe
r V
eh
icle
Re
ven
ue
Mile
Annual Vehicle Revenue Miles
O & M Cost per Vehicle Revenue Mile
Las Cruces – El Paso Passenger Rail Feasibility Study, Executive Summary, April 26, 2017 Page 27
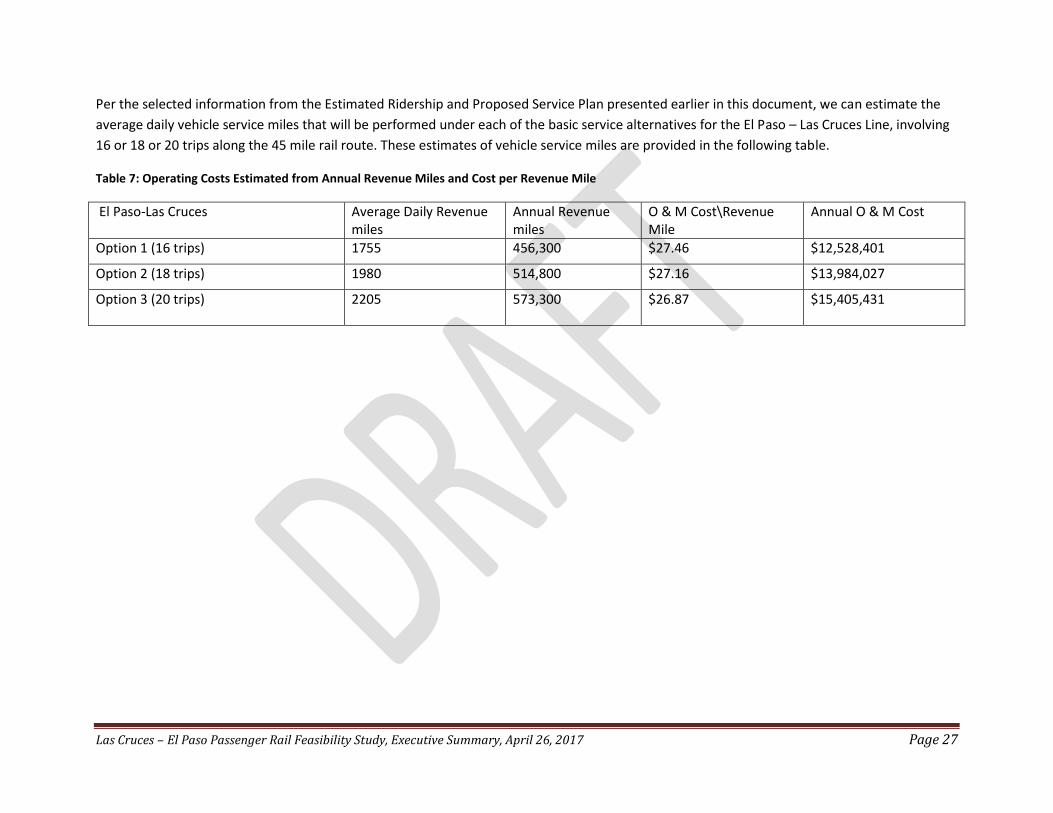
Per the selected information from the Estimated Ridership and Proposed Service Plan presented earlier in this document, we can estimate the
average daily vehicle service miles that will be performed under each of the basic service alternatives for the El Paso – Las Cruces Line, involving
16 or 18 or 20 trips along the 45 mile rail route. These estimates of vehicle service miles are provided in the following table.
Table 7: Operating Costs Estimated from Annual Revenue Miles and Cost per Revenue Mile
El Paso-Las Cruces Average Daily Revenue miles
Annual Revenue miles
O & M Cost\Revenue Mile
Annual O & M Cost
Option 1 (16 trips) 1755 456,300 $27.46 $12,528,401
Option 2 (18 trips) 1980 514,800 $27.16 $13,984,027
Option 3 (20 trips) 2205 573,300 $26.87 $15,405,431

Las Cruces – El Paso Passenger Rail Feasibility Study, Executive Summary, April 26, 2017 Page 28
Negotiation with BNSF
Establishment of the passenger rail service will require successful negotiations with BNSF re (a) Costs for rights of use or for acquisition of the
rail line and (b) Costs to upgrade the rail infrastructure to passenger standards (c) Terms of joint use.
While CNT has informed BNSF that this study is in progress, discussions with the railroad regarding issues that affect their costs of cooperation
will require determination of a negotiating position by the SCRTD Board and its potential partners. CNT will be pleased to contribute to the
development of this position and offers the following points of information to trigger the discussion:
The El Paso – Las Cruces segment of the BNSF system (known to BNSF as the El Paso Division) is not heavily served for industrial
customers today.
This rail segment does, however, include the only Mexican border rail crossing owned by BNSF and may have strategic value for this
reason.
A high level viewing of selected points on the line by rail experts working with CNT in June 2016, indicated that the rail line has received
recent track maintenance.

Las Cruces – El Paso Passenger Rail Feasibility Study, Executive Summary, April 26, 2017 Page 29
Las Cruces – El Paso Passenger Rail Feasibility Study, Executive Summary, April 26, 2017 Page 30
State and Federal Support for the Proposed Rail Investment
Re public support to fund the proposed rail service: (a) The State of NM is currently disinclined to make further investments in railroad
ownership or operations. (b) Federal programs to support passenger rail service are in flux.
The State of New Mexico’s Rail Plan describes several railroad ownership investments and operating responsibilities that the NMDOT has
assumed in recent years and includes a statement that NMDOT is not contemplating further railroad investments.
Under the previous federal administration, applications to several competitive programs would have been appropriate sources of matching
funds for establishing the proposed rail service. Currently, it is unlikely that any new announcements of funding opportunities for these
programs will be forthcoming. The position of the current administration toward continued transit development funding has not been
announced, but is not expected to be favorable.

Las Cruces – El Paso Passenger Rail Feasibility Study, Executive Summary, April 26, 2017 Page 31
Strategic Recommendations
In light of anticipated difficulties in BNSF negotiations and in securing state and federal investment support: (a) Develop a partnership with
authorities of metropolitan El Paso for rail service funding, BNSF negotiations, and operations. (b) Recruit a short line railroad as the service
operator and a negotiating partner. (c) With El Paso authorities, create an action plan for improved transit connections and TOD around
terminal rail stations.