Unwelcome Guests. Iran’s Violation of Afghan Refugee and Migrant Rights

PROPOSED 2019 OPERATING BUDGET TWO-YEAR FINANCIAL PLAN AND
FIVE-YEAR CAPITAL PROGRAM
MOVING YOU
2019
Northeastern IllinoisNovember 2018

Kirk Dillard Chairman Anthony K. Anderson Director William R. Coulson Director Patrick J. Durante Director John V. Frega Director Phil Fuentes Director
Christopher Groven Director Ryan S. Higgins Director Thomas J. Kotel Director Michael W. Lewis Director Dwight A. Magalis Director Christopher C. Melvin, Jr. Director
Sarah Pang Director J.D. Ross Director Brian Sager Director Douglas M. Troiani Director Leanne P. Redden Executive Director
TABLE OF CONTENTS
Letter from the Executive Director ................................... 1
Environmental Outlook .................................................... 2
RTA Region ........................................................................ 3
CTA .................................................................................. 15
Metra .............................................................................. 21
Pace Suburban Service ................................................... 27
Pace Regional ADA Paratransit ....................................... 33
RTA Agency ..................................................................... 37
RTA Board of Directors

2019 PROPOSED OPERATING BUDGET & CAPITAL PROGRAM
RTAChicago.org
Letter from the RTA Executive Director I’ll begin with the good news. In an environment of limited financial resources, the RTA and Service Boards (CTA, Metra and Pace) have again developed a responsible and balanced operating budget, totaling $3.082 billion, focused on cost discipline and efficiency. The CTA and Metra expect to maintain existing service levels in 2019, while, in a bit of unwelcome news for some customers, Pace plans to reduce service on twelve poor‐performing routes in order to focus efforts on successful express bus services. Pace will also introduce its innovative Pulse arterial rapid transit (ART) service along Milwaukee Avenue in 2019. However, while this year’s operating budget is balanced, the region’s proposed 2019 capital program is significantly underfunded with available projected capital revenue far below the annual capital investment needed to ensure that the system is maintained in its current condition. Unfortunately, this year’s underinvestment in our regional transit system is not an isolated event. We have seen a continuous underfunding of our region’s transit infrastructure for many years. The RTA’s 2018‐2023 Regional Transit Strategic Plan, “Invest in Transit,” highlights $30 billion of projects that are needed to maintain and modernize the region’s transit network. This year’s $841 million capital program comes nowhere near the level of funding required to meet the capital infrastructure needs of the region. Additionally, the lack of sufficient capital funding projected to be available in fiscal year 2019 will serve to increase the region’s overall capital backlog of replacement and maintenance projects. One particular aspect of the 2019 regional capital program that cannot be ignored is that it is comprised almost entirely of federal funding and revenue from future Service Board bond issuances. Once again, as has been the case since fiscal year 2015, there are no state capital funds programmed in the region’s five year capital program. In recent years, the Service Boards have been almost entirely reliant on federal funding to maintain capital assets. Despite the lack of sufficient capital funding, the Service Boards are planning for important projects within the five‐year capital program that will improve the transit experience for our customers. CTA will continue to invest in rail line and station improvements including the Red‐Purple Modernization (RPM) and Your New Blue initiatives, and will move forward with planning efforts for the south Red Line extension. Metra’s investments will prioritize the purchase of new railcars and locomotives, the targeted rehabilitation of Metra’s existing fleet, and upgrades to track, bridges, and rail yards. Pace plans to replace older buses, paratransit vehicles, and vanpool vans in addition to constructing a new Northwest Cook bus garage. The RTA, CTA, Metra, and Pace are focused on effectively serving the 8.5 million residents of northeastern Illinois. I am thankful for our many loyal riders, up to 2 million each day, who use the network and recognize the fundamental benefits of public transportation: time savings, access to jobs, reduced road congestion, cleaner air, and affordable mobility for individuals with disabilities and those who cannot or choose not to drive. A safe, reliable, and efficient transit system is critical to the Chicago metropolitan area’s ability to attract and retain world‐class employers and a dynamic local workforce. Let’s invest in the future prosperity of our region. Let’s Invest in Transit. Sincerely,
Leanne P. Redden Executive Director
1

2019 PROPOSED OPERATING BUDGET & CAPITAL PROGRAM
RTAChicago.org
Environmental OutlookRidership
Regional ridership for 2018 is estimated to end the
year at 578.0 million, 2.6% lower than 2017.
Ridership has declined each year since it peaked in
2012 at 666.1 million. Ridership losses in 2018 were
again driven by low gas prices, the popularity of
ride‐sharing services like Uber and Lyft, changing
consumer habits, and fare increases. Ridership is
expected to end the year 3% below year 2000
levels, as shown in the chart below.
Regional Economy
Labor force participation in the RTA region
increased in 2017, as regional employment grew
around 10,000 jobs and unemployment fell to 5.0%.
Regional employment has dropped slightly in 2018
but the labor force has also contracted. As of
September the unemployment rate was 3.8%.
The chart in the next column illustrates that
regional jobs have been steadily increasing since
2010 and the number of available jobs in the
Chicago region has recovered to year 2000 levels.
Gasoline
Gas prices impact transit ridership. Gas prices were
at an all‐time high in 2008 when regional ridership
also had a peak. Now, after more than three years
of consistently low gas prices, system ridership
continues to decline. Gas prices bottomed out at
$1.81 per gallon in February 2016 and remained
below $3.00 per gallon until May 2018. Prices
continue to track just above $3.00 per gallon, which
is considered a critical level with respect to transit
usage, and it remains to be seen if ridership will
rebound in response. In the meantime, the Service
Boards are reporting increased fuel expenses as a
result of higher diesel prices.
‐5%
0%
5%
10%
15%
CHANGE IN RTA SYSTEM RIDERSHIP RELATIVE TO 2000
‐10%
‐5%
0%
5%
CHANGE IN REGIONAL JOBSRELATIVE TO 2000
$0.00
$1.00
$2.00
$3.00
$4.00
$5.00
GASOLINE PRICES SINCE 2000
2

2019 PROPOSED OPERATING BUDGET & CAPITAL PROGRAM
RTAChicago.org
RTA Region
The budgets summarized in this report represent the
proposed Service Board operating budgets and
capital programs, as released for public hearing,
subject to review and approval by the RTA Board.
Overview
The 2018 budgets of the Service Boards were
impacted by a $68 million reduction in State support
for transit operations, resulting in fare increases at
each transit agency and some service reductions.
Actual 2018 operating revenues have generally
lagged budget due to a shortfall in the level of State
funding for reduced fare and free rides. However,
the Service Boards have thus far effectively
controlled operating costs and reported favorable to
budget expense performance through September.
The RTA system is currently forecast to end fiscal
year 2018 within budgeted levels.
State cuts to transit funding have also impacted the
2019 budget year, but by a lesser amount of $30
million, provided that PTF and reduced fare funding
are restored to traditional levels in the SFY 2020
budget. The Service Boards have responded to the
reality of lower funding by proposing balanced 2019
operating budgets which focus on cost containment.
No additional fare increases are included in the
proposed budgets. CTA and Metra plan to maintain
existing service levels, while Pace Suburban Service
has proposed the reduction or elimination of 12
poor‐performing routes. Pace will also strengthen its
successful express bus routes and initiate Pulse
arterial rapid transit (ART) service along Milwaukee
Avenue between Niles and Jefferson Park in Chicago.
Ridership RTA system ridership is projected to finish 2018 at
578.0 million, a 2.6% decrease from 2017. Regional
transit ridership in 2019 is budgeted at 571.6 million
rides, a further decrease of 1.1%. Each Service Board
projects a ridership loss, consistent with recent
national trends, although ADA Paratransit ridership
is expected to increase by 1.0%. CTA, which
continues to provide over 80% of the region’s rides,
forecasts a 1.3% ridership decrease, with both rail
and bus ridership projected to decline, while Metra
and Pace Suburban Service both anticipate a
ridership decrease of 0.4%.
Ridership
(in millions)
2018
Estimate
2019
Budget Change
CTA 467.3 461.3 ‐1.3%
Metra 75.9 75.6 ‐0.4%
Pace 30.5 30.4 ‐0.4%
ADA Paratransit 4.3 4.3 +1.0%
Region 578.0 571.6 ‐1.1%
Operating Revenue
In 2019, the Service Boards are projected to produce
$1.192 billion of operating revenue, an increase of
$22.9 million, or 2.0%, despite the expected
ridership decrease. Operating revenue consists of
system‐generated revenue such as passenger fares,
lease revenue, and advertising, and also includes the
State reduced fare reimbursement (RFR), which
partially compensates the Service Boards for free
and reduced fare programs. The RFR is assumed to
OPERATING OVERVIEW
3

2019 PROPOSED OPERATING BUDGET & CAPITAL PROGRAM
RTAChicago.org
be restored to the traditional level of $34 million for
2019, driving the overall operating revenue increase.
While the majority of operating revenue comes from
passenger fares, each Service Board has budgeted
for an increase in ancillary operating revenue for
2019.
Public Funding
Overall public funding in 2019 is projected at $1.891
billion, an increase of 4.9% over the 2018 estimate,
but this funding level is only 1% higher than in the
original 2017 budget, prior to the recent State cuts.
Over 40% of the region’s revenue for operations
comes from a regional sales tax imposed at 1.25% in
Cook County and 0.5% in the collar counties. RTA
sales tax receipts are expected to finish 2018 about
1% below budgeted levels, even though the State
surcharge on RTA sales tax was reduced from 2.0%
to 1.5% in April. While gross sales tax is expected to
grow by 3.8% in 2019, net RTA sales tax receipts are
projected to increase by 3.9% to a total of $1.270
billion, aided by the surcharge reduction.
The State Public Transportation Fund (PTF), based on
a 30% match of sales tax and Real Estate Transfer Tax
(RETT) receipts, is projected to provide $396.7
million for 2019 operations. The PTF level reflects a
known 5% funding cut during State FY 2019, with no
cut assumed for State FY 2020. RETT receipts are
expected to be unchanged in 2019 at $66.6 million.
State Financial Assistance (ASA/AFA) of $130.3
million for reimbursement of debt service on RTA
Strategic Capital Improvement Program (SCIP) bonds
is budgeted for 2019, as is $8.4 million of State
funding for Pace ADA Paratransit service. Other
revenue sources, comprising less than 1% of total
revenue, are expected to grow by about $7 million
due to an increase in federal grants. When public
funding is combined with operating revenue,
resulting total revenue of $3.083 billion is projected
to be available for 2019 RTA system operations.
Expenses
Service Board 2019 operating expenses, which
comprise about 91% of RTA system expenses, are
projected to grow by 4.6% over the 2018 estimate,
to $2.798 billion. However, much of the indicated
growth is due to favorable expense performance in
2018, and the Service Board expense growth relative
to their 2018 budgets is a more modest 2.8%.
Expense growth of 2.7% and 2.5% is projected in
2020 and 2021, respectively.
CTA projects a 4.2% increase in operating expenses
for 2019, driven primarily by labor, energy, and other
expenses. Metra operating costs are expected to
grow by 5.1% from the 2018 estimate as labor,
materials, and fuel expenses increase. Pace
Suburban Service anticipates 4.2% growth in
operating expenses due to net service additions and
increases in labor, fuel, and insurance. ADA
Paratransit expenses are projected to increase by
6.9% due to ridership growth coupled with
contractor price increases.
Service Board
Operating Revenue38.7%
Sales Tax41.2%PTF
12.9%
RETT2.2%
ASA / AFA4.2%
Other0.9%
2019 REVENUES: $3.083 BILLION
CTA50.4%
Metra26.7%
Pace 7.7%
ADA Paratransit
6.1%
Debt Service7.7%
RTA Agency and
Regional Programs1.4%
JSIF and Other0.2%
2019 EXPENSES: $3.082 BILLION
4

2019 PROPOSED OPERATING BUDGET & CAPITAL PROGRAM
RTAChicago.org
While funding from RTA sales tax for the Agency is
projected to increase by 3.0%, RTA Agency and
Regional Programs expenses are budgeted to
increase by 22.6% in 2019 to $41.9 million, driven
primarily by grant‐funded program expense as
federal grant revenue increases sharply from 2018.
The RTA Agency budget represents about 1.4% of
RTA system expenses. Other regional expenses,
which include debt service on bonds issued for
Service Board capital funding and Joint Self Insurance
Fund (JSIF) premiums, comprise the remaining 7.9%
of system expenses. The RTA debt service total of
$236.8 million for 2019 includes principal and
interest expense on existing long‐term bonds and on
short‐term borrowing to manage delays in payments
from the State.
When RTA and regional expenses are combined with
Service Board operating expenses, total 2019
expenses for the RTA system are projected at $3.082
billion, an increase of 4.6% over the 2018 estimate,
but a lesser increase of 3.0% from the 2018 budget.
Total regional operating expenses are subsequently
projected to increase by 2.1% and 2.2% in 2020 and
2021, respectively.
ICE Funding and Proposed Projects
Innovation, Coordination, and Enhancement (ICE)
funding of $12.9 million to $13.5 million was
allocated to the Service Boards in the adopted 2019‐
2021 funding amounts, contingent upon RTA Board
approval of proposed uses. Table 1 summarizes the
2019‐2021 amounts and proposed uses of these ICE
funds by the Service Boards. Only the 2019 proposed
uses are currently subject to approval by the RTA
Board. CTA and Pace intend to use ICE funding for
operating projects, and Metra for a capital project.
The proposed uses have been reviewed for ICE
suitability by RTA Planning staff.
TABLE 1: PROPOSED USES OF ICE FUNDING (DOLLARS IN THOUSANDS)
2019 2020 2021
CTA
Operating:
South Side Bus Service Improvements 6,205
Projects To Be Determined 6,330 6,456
CTA Total $6,205 $6,330 $6,456
Metra
Capital:
GPS Train Tracking and Passenger Counting System 5,042
Projects To Be Determined 5,143 5,246
Metra Total $5,042 $5,143 $5,246
Pace
Operating:
Pulse Arterial Rapid Transit ‐ Milwaukee Ave 1,681 1,714 1,749
Pace Total $1,681 $1,714 $1,749
Total ICE Funding $12,928 $13,187 $13,450
5

2019 PROPOSED OPERATING BUDGET & CAPITAL PROGRAM
RTAChicago.org
Net Result and Recovery Ratios
As shown in Table 2 on the following page, the
regional operating budget and financial plan is
balanced in 2019, 2020, and 2021, with a system‐
level net result of zero after accounting for transfers
to the capital program; in addition to ICE funding for
approved capital projects, the proposed Metra
budget continues to include fare revenue which is
programmed for capital expenditure.
The RTA Act requires the RTA Board to set a system‐
generated revenue recovery ratio for each Service
Board, as well as requiring that the combined
revenues from RTA operations cover at least 50% of
system operating expenses, with approved
adjustments. This requirement excludes ADA
Paratransit service, for which the Act mandates a
10% recovery ratio.
The CTA, Metra, and Pace Suburban Service
proposed 2019 operating budgets meet or exceed
their individual RTA‐specified recovery ratios of
54.75%, 52.5%, and 30.3%, respectively. As a result,
the RTA regional recovery ratio for 2019 is projected
at 50.6%, in compliance with the RTA Act. The ADA
Paratransit budget also meets its required recovery
ratio of 10%.
Primary RTA Public Funding Sources
RTA Sales Tax Part I: The original RTA sales tax, levied at 1.0% in Cook County and 0.25% in the collar counties of DuPage, Kane, Lake, McHenry, and Will. 85% of Sales Tax I receipts are distributed to the Service Boards according to a statutory formula. The remaining 15% of Sales Tax I is initially retained by the RTA to fund regional and agency expenses before being allocated at the direction of the RTA Board. RTA Sales Tax Part II: Authorized by the 2008 funding reform, an additional sales tax of 0.25% in all six counties of the RTA region. Sales Tax II is distributed to the Service Boards according to a statutory formula after deducting funds for ADA Paratransit, Pace Suburban Community Mobility (SCMF), and RTA Innovation, Coordination, and Enhancement (ICE). After these deductions, CTA receives 48%, Metra 39%, and Pace Suburban Service 13%. Real Estate Transfer Tax (RETT): The 2008 funding reform also increased the City of Chicago RETT by $1.50 per $500 of property transferred, and dedicated this additional tax revenue to directly fund CTA operating expenses. Public Transportation Fund (PTF) Part I: PTF Part I is State‐provided funding comprised of a 25% match of Sales Tax I receipts. 100% of PTF I is retained by the RTA and combined with 15% of Sales Tax I to form the basis for funding to be allocated at the direction of the RTA Board. Public Transportation Fund (PTF) Part II: PTF Part II, authorized by the 2008 funding reform, is State‐provided funding equal to a 5% match of Sales Tax I receipts and a 30% match of Sales Tax II receipts and RETT receipts. After allocating 5/6 of the PTF on RETT receipts to CTA, the remaining PTF II is distributed to the Service Boards by the same statutory formula used to allocate Sales Tax II. State Financial Assistance: State‐provided assistance to reimburse the RTA’s debt service on Strategic Capital Improvement Program (SCIP) bonds. It consists of two components; Additional State Assistance (ASA) and Additional Financial Assistance (AFA). State Reduced Fare Reimbursement: State‐provided reimbursement to the Service Boards, via the RTA, to partially offset the cost of providing reduced fare and free ride programs mandated by law, including those for seniors and disabled persons.
6

2019 PROPOSED OPERATING BUDGET & CAPITAL PROGRAM
RTAChicago.org
TABLE 2: STATEMENT OF REGIONAL REVENUES AND EXPENSES (DOLLARS IN THOUSANDS)
2017 2018 2019 2020 2021
Actual Estimate Budget Plan Plan
Revenues
Service Board Revenues 1
CTA 649,878 688,616 707,747 719,941 734,397
Metra 396,625 410,537 411,688 442,878 461,818
Pace 54,431 56,391 58,729 63,712 62,843
ADA Paratransit 13,053 13,978 14,215 14,449 14,676
Total Operating Revenues $1,113,987 $1,169,522 $1,192,379 $1,240,980 $1,273,735
Public Funding
RTA Sales Tax 1,185,987 1,222,216 1,270,272 1,295,678 1,321,591
Public Transportation Fund (PTF) 362,647 363,258 396,702 415,212 423,722
Real Estate Transfer Tax (RETT) 62,021 66,631 66,631 68,630 70,689
State Financial Assistance (ASA/AFA) 130,222 130,283 130,300 130,300 130,300
State Funding for ADA Paratransit 3,825 7,975 8,395 8,500 8,500
Federal Funds 10,965 6,180 6,439 6,650 6,666
RTA ADA Paratransit Reserve 2
5,328 ‐ ‐ ‐ ‐
RTA Capital Project Reserves 500 250 250 ‐ ‐
JSIF Reserves 2,500 2,500 2,500 ‐ ‐
ICE Carryover (2015) 3
2,400 ‐ ‐ ‐ ‐
Other RTA Revenue 4
14,666 2,460 9,187 5,726 5,852
Total Public Funding $1,781,062 $1,801,753 $1,890,677 $1,930,695 $1,967,320
Total Revenues $2,895,049 $2,971,275 $3,083,057 $3,171,676 $3,241,055
Expenses
Service Board Expenses
CTA 1,450,840 1,490,170 1,552,114 1,587,511 1,620,097
Metra 761,593 782,600 822,215 845,900 873,100
Pace 226,466 226,488 236,037 244,519 247,009
ADA Paratransit 174,292 175,211 187,241 196,284 204,793
Total Service Board Expenses $2,613,191 $2,674,469 $2,797,607 $2,874,214 $2,944,999
Region/Agency Expenses
Debt Service 225,214 231,519 236,798 227,151 224,181
RTA Agency and Regional Programs 43,554 34,150 41,873 39,437 40,620
RTA Agency Regional Capital Program 500 250 250 ‐ ‐
Joint Self‐Insurance Fund (JSIF) 6,556 5,499 5,664 5,834 6,009
Total Region/Agency Expenses $275,824 $271,418 $284,585 $272,423 $270,810
Total Expenses $2,889,015 $2,945,887 $3,082,192 $3,146,636 $3,215,809
ICE funding not used for operations ‐ transfer to capital 5
(6,568) (6,468) (5,042) (5,143) (5,246)
Other transfers 6
(37,140) (17,296) 4,178 (19,897) (20,002)
Net Result ($37,674) $1,624 $0 $0 $0
Regional Recovery Ratio 51.2% 51.9% 50.6% 51.0% 51.1%
1 Service Board operating revenues include State reduced fare reimbursement funding.
2 Use of ADA Paratransit reserve in 2017 to offset State ADA Paratransit funding reductions was authorized by RTA Ordinance 2017‐36.
3 Metra carried forward $2.4 million of 2015 ICE funding for approved Mobile Ticketing project completed in 2017.
4 Includes income from financial transactions and investments, sales tax interest, and revenues from RTA programs and projects.
5 As authorized by RTA Ordinance 2018‐44, ICE amounts not required for operating funding may be redesignated for capital projects.
6 Includes Metra farebox capital program and transfers to and from RTA reserves.
7

2019 PROPOSED OPERATING BUDGET & CAPITAL PROGRAM
RTAChicago.org
The RTA Act requires that the capital expenditures of
the CTA, Metra and Pace be subjected to continual
review so that the RTA may budget and expend funds
available to the region with maximum efficiency. The
RTA Board must adopt a five‐year capital program
every year which describes the nature, location,
budget, and funding source by project and by fiscal
year of all anticipated Service Board and RTA capital
improvements. The capital program is amended on a
quarterly basis as appropriate. Prior to formal RTA
Board approval of the five‐year capital program,
public hearings are held in each county of the
northeastern Illinois region to inform the public and
government officials of the RTA’s regional capital
development plans.
The RTA emphasizes the need to preserve and
enhance the RTA system’s valuable infrastructure,
which includes bringing the system’s $162 billion in
assets (as measured in terms of replacement value
and including subway tunnels valued at $100 billion)
into a State of Good Repair (SGR) and extending or
expanding service when demand is justified and
funding available. To maintain and preserve the
existing system in a SGR, as well as address the
backlog of deferred SGR projects, requires a capital
investment of $2 billion to $3 billion per year.
Source of Funds 2019‐2023
On August 23, 2018, the RTA Board adopted
preliminary capital funding amounts for 2019‐2023.
The funding sources for the capital program include
the U.S. Department of Transportation’s federal
formula and discretionary funds, the RTA, and the
Service Boards. Last year, CTA introduced a new
funding mechanism, the Ground Transportation Tax
(GTT) Bond program. It uses a portion of the City of
Chicago’s new tax on ride‐hailing services to support
debt service on new bond issuances. For the 2019‐
2023 program, CTA reprogrammed from 2018 the
GTT proceeds and bonds for the Red Purple
Modernization (RPM) project. The reprogramming
reflects a delay in previously planned bond issuance.
For the fifth consecutive year, the capital program
does not include any new source of state funds.
Federal funds of $3.323 billion account for 76.6% of
the estimated $4.339 billion of capital funding
sources for 2019‐2023. After debt service on
previously issued CTA bonds, an estimated amount
of $3.608 billion is available for 2019‐2023, as shown
in Table 3 on the next page.
CAPITAL OVERVIEW
8

2019 PROPOSED OPERATING BUDGET & CAPITAL PROGRAM
RTAChicago.org
TABLE 3: 2019‐2023 CAPITAL PROGRAM FUNDING (DOLLARS IN THOUSANDS)
CTA Metra Pace RTA Total % of Total
Funding Sources
Federal Funds 2,163,552 932,684 226,419 ‐ 3,322,656 76.6%
State Funds ‐ ‐ ‐ ‐ ‐ 0.0%
RTA Funds ‐ ‐ ‐ 250 250 0.0%
RTA Innovation, Coordination, & Enhancement (ICE) ‐ 15,430 ‐ ‐ 15,430 0.4%
Service Board and Other Local Funds 2,317 87,000 1,850 ‐ 91,167 2.1%
Total New Capital Funding $2,165,869 $1,035,114 $228,269 $250 $3,429,503 79.0%
RTA Bond Proceeds 144,000 129,500 14,400 ‐ 287,900 6.6%
CTA Bond Proceeds 184,546 ‐ ‐ ‐ 184,546 4.3%
Reprogrammed CTA Bond Proceeds 390,249 ‐ ‐ ‐ 390,249 9.0%
Pace Bond Proceeds ‐ ‐ 46,800 ‐ 46,800 1.1%
Sub‐Total Bond Funds $718,796 $129,500 $61,200 ‐ $909,496 21.0%
Total Capital Funding $2,884,665 $1,164,614 $289,469 $250 $4,338,998 100.0%
Debt Service (730,540) ‐ ‐ ‐ (730,540)
Total Capital Funding Available $2,154,125 $1,164,614 $289,469 $250 $3,608,459
2019 Funding
As shown in Table 4, the total estimated funding for
capital projects in 2019 is $840.7 million. Federal
funds account for $633.7 million or 75.4%; CTA bond
proceeds – both newly issued bonds and
reprogrammed bonds account for $146.0 million or
17.3%; Pace bond proceeds account for $46.8 million
or 5.6%; Service Board funds account for $8.9 million
or 1.1%; and RTA ICE funds account for $5.0 million
or 0.6%.
After deducting $150.4 million of CTA debt service on
previously issued bonds, an estimated amount of
$690.2 million is available for 2019.
Federal Funds76.6%
Reprogrammed CTA Bond Proceeds
9.0%
RTA Bond Proceeds6.6%
CTA Bond Proceeds4.3%
Service Board & Other Local Funds
2.1%
Pace Bond Proceeds1.1%
RTA ICE Funds0.4%
2019‐2023 CAPITAL FUNDING: $4.339 BILLION
9

2019 PROPOSED OPERATING BUDGET & CAPITAL PROGRAM
RTAChicago.org
The absence of any new State of Illinois funding
represents a critical missing component in the
regional capital program that impedes progress
toward achieving a system‐wide SGR.
TABLE 4: 2019 CAPITAL PROGRAM FUNDING (DOLLARS IN THOUSANDS) CTA Metra Pace RTA Total % of Total
Funding Sources
Federal Funds 411,761 173,586 48,365 ‐ 633,711 75.4%
State Funds ‐ ‐ ‐ ‐ ‐ 0.0%
RTA Funds ‐ ‐ ‐ 250 250 0.0%
RTA Innovation, Coordination, & Enhancement (ICE) ‐ 5,042 ‐ ‐ 5,042 0.6%
Service Board 1,095 7,000 850 ‐ 8,945 1.1%
Total New Capital Funding $412,856 $185,628 $49,215 $250 $647,948 77.1%
RTA Bond Proceeds ‐ ‐ ‐ ‐ ‐ 0.0%
CTA Bond Proceeds 26,329 ‐ ‐ ‐ 26,329 3.1%
Reprogrammed CTA Bond Proceeds 119,625 ‐ ‐ ‐ 119,625 14.2%
Pace Bond Proceeds ‐ ‐ 46,800 ‐ 46,800 5.6%
Sub‐Total Bond Funds $145,954 ‐ $46,800 ‐ $192,754 22.9%
Total Capital Funding $558,810 $185,628 $96,015 $250 $840,702 100.0%
Debt Service (150,429) ‐ ‐ ‐ (150,429)
Total Capital Funding Available $408,381 $185,628 $96,015 $250 $690,273
Use of Funds 2019‐2023
The primary emphasis of the 2019‐2023 Capital
Program is to continue efforts to bring the system’s
assets to a SGR and increase capacity in markets with
growing ridership. The 2019‐2023 Capital Program
totals $4.339 billion, and a majority of the
expenditures are allocated to capital projects that
Federal Funds75.4%
Reprogrammed CTA Bond Proceeds14.2%
Pace Bond Proceeds5.6%
CTA Bond Proceeds3.1%
Service Board Funds1.1%
RTA ICE Funds0.6%
2019 CAPITAL FUNDING: $840.7 MILLION
10

2019 PROPOSED OPERATING BUDGET & CAPITAL PROGRAM
RTAChicago.org
maintain and improve existing rolling stock and
infrastructure. The CTA’s Red Purple Modernization
(RPM) Program allocates a significant amount of
funding, $827.7 million, to modernizing the CTA
system.
In order to provide reporting consistency among the
Service Boards, the proposed capital investments
have been broken down by a set of asset categories
as shown in Table 5. This table shows program
expenditures of $1.390 billion or 32.0% on rolling
stock, $868.3 million or 20.0% on CTA rail and bus
modernization initiatives, $442.0 million or 10.2% on
track and structure, $423.0 million or 9.7% on
support facilities and equipment, $163.7 million or
3.8% on electric, signal and communications,
including funding for Metra’s Positive Train Control
system, $114.3 million or 2.6% on stations and
passenger facilities, $40.3 million or 0.9% for CTA’s
planning and preliminary engineering for the Red
Line extension project, and $166.5 million or 3.8% on
miscellaneous and contingencies. In addition, $730.5
million or 16.8% will be expended on existing CTA
debt service.
TABLE 5: 2019‐2023 CAPITAL PROGRAM USES (DOLLARS IN THOUSANDS)
CTA Metra Pace RTA Total % of Total
Asset Category
Rolling Stock 706,619 577,731 106,086 ‐ 1,390,436 32.0%
Track & Structure 186,413 255,628 ‐ ‐ 442,042 10.2%
Electrical, Signal, & Communications 46,978 116,688 ‐ ‐ 163,666 3.8%
Support Facilities & Equipment 190,829 89,269 142,884 ‐ 422,982 9.7%
Stations & Passenger Facilities 25,698 49,112 39,250 250 114,310 2.6%
Miscellaneous 30,376 56,084 1,250 ‐ 87,710 2.0%
Extensions 40,247 ‐ ‐ ‐ 40,247 0.9%
Modernization 868,279 ‐ ‐ ‐ 868,279 20.0%
Contingencies & Administration 58,685 20,102 ‐ ‐ 78,787 1.8%
Total Capital Funding Available $2,154,125 $1,164,614 $289,469 $250 $3,608,459 83.2%
Debt Service 730,540 ‐ ‐ ‐ 730,540 16.8%
Total Capital Funding $2,884,665 $1,164,614 $289,469 $250 $4,338,998 100.0%
Rolling Stock32.0%
Modernization20.0%
Debt Service16.8%
Track & Structure10.2%
Support Facilities & Equipment
9.7%
Electrical, Signal, & Communications
3.8%
Stations & Passenger Facilities2.6%
Miscellaneous2.0%
Contingencies & Administration
1.8%Extensions
0.9%
2019‐2023 CAPITAL PROGRAM USES
11

2019 PROPOSED OPERATING BUDGET & CAPITAL PROGRAM
RTAChicago.org
Use of Funds 2019 The 2019 Capital Program can also be viewed by the
same asset categories. The largest capital
investment in 2019, $173.1 million, is the CTA’s RPM
project. Table 6 shows that of the $840.7 million of
proposed capital funding, $182.3 million or 21.7% of
the program is allocated to CTA bus and rail
modernization initiatives, $177.2 million or 21.1% is
allocated to rolling stock, $128.5 million or 15.3% on
support facilities and equipment, $104.6 million or
12.4% on track and structure, $41.3 million or 4.9%
on electric, signal, and communications, $26.3
million or 3.1% on stations and passenger facilities,
and $30.1 million or 3.6% on miscellaneous and
contingencies. In addition, $150.4 million or 17.9% is
programmed for existing CTA debt service.
TABLE 6: 2019 CAPITAL PROGRAM USES (DOLLARS IN THOUSANDS)
CTA Metra Pace RTA Total % of Total
Asset Category
Rolling Stock 110,572 40,300 26,352 ‐ 177,224 21.1%
Track & Structure 50,016 54,548 ‐ ‐ 104,564 12.4%
Electrical, Signal, & Communications 9,501 31,838 ‐ ‐ 41,339 4.9%
Support Facilities & Equipment 36,610 32,559 59,313 ‐ 128,481 15.3%
Stations & Passenger Facilities 2,924 13,030 10,100 250 26,304 3.1%
Miscellaneous 6,347 9,850 250 ‐ 16,447 2.0%
Modernization 182,294 ‐ ‐ ‐ 182,294 21.7%
Extensions ‐ ‐ ‐ ‐ ‐ 0.0%
Contingencies & Administration 10,117 3,502 ‐ ‐ 13,619 1.6%
Total Capital Funding Available $408,381 $185,627 $96,015 $250 $690,273 82.1%
Debt Service 150,429 ‐ ‐ ‐ 150,429 17.9%
Total Capital Funding $558,810 $185,627 $96,015 $250 $840,702 100.0%
Modernization21.7%
Rolling Stock21.1%
Debt Service17.9%
Support Facilities & Equipment
15.3%
Track & Structure12.4%
Electrical, Signal, & Communications
4.9%
Stations & Passenger Facilities3.1%
Miscellaneous2.0%
Contingencies & Administration
1.6%
2019 CAPITAL PROGRAM USES
12

2019 PROPOSED OPERATING BUDGET & CAPITAL PROGRAM
RTAChicago.org
Ten‐Year Unfunded Capital Priorities: 2019‐2028
In the 2018‐2023 Regional Transit Strategic Plan
adopted by the RTA Board in January 2018, Invest in
Transit, the RTA and the Service Boards presented a
list of priority projects that the Service Boards would
advance over the next ten years if additional funding
became available. These priority projects are key
initiatives that the Service Boards cannot complete
at current capital funding levels but are advancing as
additional capital funding is provided. A portion of
the funding necessary to advance some of these
projects was included in the 2018‐2022 capital
program and some progress was made in 2018.
Unfortunately, sufficient funding has not been made
available to fully fund any of these projects during
2018. These projects continue to be high priority
projects but remain underfunded or unfunded in the
2019‐2023 capital program. Funding these important
projects will move the Service Boards closer toward
achieving a SGR, address growing markets, and
modernize and enhance the region’s transit system.
The total funding need is $31.257 billion over the
ten‐year period.
The proposed 5‐Year Capital Improvement Program
identifies $4 billion in available funding for these
priority projects, meeting only 13% of the need.
Table 7 below summarizes the priority projects for
each Service Board by asset category.
The track and structure asset category represents
the largest funding need at $9.128 billion or 29.2% of
total priorities. Projects in this category include:
CTA – track rehabilitation and structural renewal
improvements to the Red, Blue, Brown and
Green Lines.
Metra – bridge replacements and repairs, 75th
Street Corridor Project, track improvements
system‐wide and A‐2 Interlocking replacement.
The modernization asset category represents the
second largest funding need at $8.721 billion or
27.9%. This category is comprised of CTA’s
remaining Phase I and Phase II of the Red Purple
Modernization project including project planning to
determine construction phasing, environmental
analysis, and preliminary engineering.
The third largest category is rolling stock at $5.142
billion or 16.5%. Projects in this category include:
CTA – purchase of additional new 7000‐Series
rail cars, overhaul of the 5000‐Series rail cars,
purchase of additional replacement buses,
completion of the life‐extending overhauls for
the 1000‐Series buses, and mid‐life overhaul of
the 4300‐Series buses.
Metra – purchase of new locomotives and rail
cars, along with continued rehabilitation of
commuter cars and locomotives as part of their
fleet modernization plan.
Pace – purchase of new fixed‐route buses,
paratransit, community / On‐Demand vehicles,
and vanpool vehicles
Other significant projects include the construction of
the CTA’s Red Line extension from 95th to 130th
streets, signal, electrical and communication
improvement to Metra’s rail system including the
completion of the federally mandated Positive Train
Control System, Pace’s construction of support
facilities for Bus‐on‐Shoulder express bus services
and infrastructure improvements for expanded Pulse
ART service.
Pace’s $187.0 million in project cost priorities is
based on changing the current ADA program delivery
business model, which utilizes private contracts to
provide vehicles and service. Pace’s plan is to
purchase fleet and facilities and bid out only the
operational services to private contractors. This plan
will reduce the costs associated with contracts and
increase competition from private contractors
because bidding will be for operational hourly
service rates only.
13

2019 PROPOSED OPERATING BUDGET & CAPITAL PROGRAM
RTAChicago.org
TABLE 7: 2019‐2028 CAPITAL PRIORITIES (DOLLARS IN THOUSANDS)
CTA Metra Pace Pace ADA Total % of Total
Asset Category
Rolling Stock 2,408,725 2,140,000 463,394 130,000 5,142,119 16.5%
Track & Structure 3,266,557 5,861,000 ‐ ‐ 9,127,557 29.2%
Electric, Signal, & Communications 234,900 1,566,000 21,054 6,000 1,827,954 5.8%
Support Facilities & Equipment 1,120,432 1,353,000 242,525 48,000 2,763,957 8.8%
Stations & Passenger Facilities 600,000 664,000 132,529 3,000 1,399,529 4.5%
Extensions 2,274,847 ‐ ‐ ‐ 2,274,847 7.3%
Modernization 8,721,000 ‐ ‐ ‐ 8,721,000 27.9%
Total Unfunded Capital Priorities $18,626,461 $11,584,000 $859,502 $187,000 $31,256,963 100.0%
Track & Structure29.2%
Modernization 27.9%
Rolling Stock16.5%
Support Facilities & Equipment
8.8%
Extensions7.3%
Electrical, Signal, & Communications
5.8%
Stations & Passenger Facilities4.5%
2019‐2028 CAPITAL PRIORITIES: $31.3 BILLION
14

2019 PROPOSED OPERATING BUDGET & CAPITAL PROGRAM
RTAChicago.org
CTA Ridership
CTA’s 2018 ridership is projected to end the year
2.5% below 2017 levels, with both bus and rail
ridership decreasing compared to prior year. Total
ridership is budgeted to decrease again in 2019,
falling by 1.3% from the 2018 estimate to 461.3
million passenger trips. Both bus and rail ridership
are expected to decline, by 1.9% and 0.7%,
respectively. Steady ridership loss is expected to
continue in the financial planning years, driven by
lower bus ridership.
Fares
There are no fare increases in the proposed CTA
2019 budget. CTA’s average fare is projected to be
$1.25 in 2018, a significant increase from 2017 due
to the fare increase in January. The average fare is
expected to grow to $1.27 in 2019 and continue to
increase in 2020 and 2021 as more riders are
expected to shift from pay‐per‐use to pass products,
and as the share of rail ridership increases.
Service Levels
Vehicle revenue miles (VRM), a measure of the total
miles CTA bus and rail vehicles travel while in
revenue service, did not change in 2018. CTA has no
plans to change service levels in 2019, or the
financial planning years, so VRM are budgeted to
remain flat.
Service effectiveness, as measured by passenger
trips per vehicle revenue mile, is expected to
decrease each year as ridership also declines. Service
479.4 467.3 461.3
453.4 447.8
400
450
500
2017 2018 2019 2020 2021
RIDERSHIP (IN MILLIONS)
$1.17 $1.25 $1.27 $1.33 $1.37
$0.00
$1.00
$2.00
2017 2018 2019 2020 2021
AVERAGE FARE
3.813.71 3.66
3.59 3.55
3.00
3.25
3.50
3.75
4.00
2017 2018 2019 2020 2021
PASSENGER TRIPS PER VRM
OPERATING BUDGET
15
2019 PROPOSED OPERATING BUDGET & CAPITAL PROGRAM
RTAChicago.org
levels are not budgeted to change so overall service
effectiveness will drop in 2019 and the planning
years due to fewer riders with the same service level.
Operating Revenue
Total operating revenue is on track to increase by
6.0% in 2018 to $688.6 million as a result of the fare
increase. Operating revenue is expected to grow to a
lesser degree in 2019, 2020, and 2021, as no fare
increases are anticipated. Passenger revenue is
estimated to increase by 0.7% in 2019, 2.2% in 2020,
and 2.3% in 2021, as ridership declines, but more
riders use passes and rail. CTA’s share of the State
reduced fare reimbursement subsidy is restored to
$28.3 million in its 2019 budget, subject to
appropriation by the legislature. CTA’s two‐year
plan assumes that this subsidy will be reduced over
time. CTA’s Other Revenue category is expected to
grow in 2019, 2020, and 2021 as advertising revenue
is on an upward trend, interest rate increases are
driving up investment income, and the City of
Chicago’s ride hailing fee, instituted in 2018, is
generating additional income for CTA.
Public Funding
Total public funding for CTA operations in 2019 is
projected at $844.4 million, 5.3% higher than the
2018 estimate. CTA’s public funding assumptions
match the RTA Board adopted marks for sales tax,
Public Transportation Funds, RTA non‐statutory
funding, and ICE funding. Public funding is projected
at $867.6 million in 2020 and $885.7 million in 2021,
increases of 2.7% and 2.1%, respectively. These
amounts include Chicago Real Estate Transfer Tax
(RETT) funding projected at $66.6 million in 2019,
$68.6 million in 2020, and $70.7 million in 2021. ICE
funding for 2019 totals $6.2 million and is budgeted
to be used for operations, with proposed uses shown
in Table 1 of the RTA Region section.
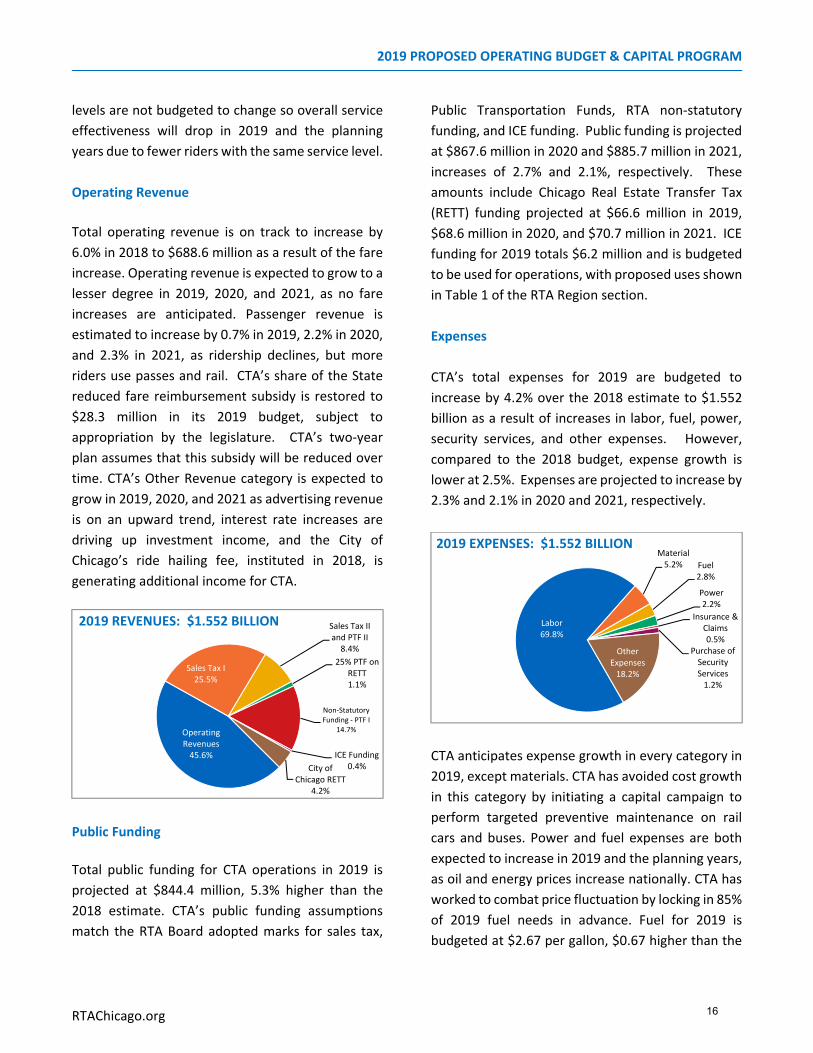
Expenses
CTA’s total expenses for 2019 are budgeted to
increase by 4.2% over the 2018 estimate to $1.552
billion as a result of increases in labor, fuel, power,
security services, and other expenses. However,
compared to the 2018 budget, expense growth is
lower at 2.5%. Expenses are projected to increase by
2.3% and 2.1% in 2020 and 2021, respectively.
CTA anticipates expense growth in every category in
2019, except materials. CTA has avoided cost growth
in this category by initiating a capital campaign to
perform targeted preventive maintenance on rail
cars and buses. Power and fuel expenses are both
expected to increase in 2019 and the planning years,
as oil and energy prices increase nationally. CTA has
worked to combat price fluctuation by locking in 85%
of 2019 fuel needs in advance. Fuel for 2019 is
budgeted at $2.67 per gallon, $0.67 higher than the
Operating Revenues45.6%
Sales Tax I25.5%
Sales Tax II and PTF II8.4%
25% PTF on RETT1.1%
Non‐Statutory Funding ‐ PTF I
14.7%
ICE Funding0.4%City of
Chicago RETT 4.2%
2019 REVENUES: $1.552 BILLION Labor69.8%
Material5.2% Fuel
2.8%
Power2.2%
Insurance & Claims0.5%
Purchase of Security Services1.2%
Other Expenses18.2%
2019 EXPENSES: $1.552 BILLION
16

2019 PROPOSED OPERATING BUDGET & CAPITAL PROGRAM
RTAChicago.org
2018 estimate. CTA anticipates its advance
purchasing strategy will save $3.3 million in 2019
compared to market prices. For 2020 and 2021,
CTA’s projected average prices for fuel are $2.88 and
$2.82 per gallon, respectively.
Cost efficiency is shown next by the measure cost per
vehicle revenue mile, which is projected to increase
by 3.9% in 2019 as expenses increase while service
levels remain the same. Cost effectiveness is also
shown, as cost per passenger trip, which is projected
to increase by 5.4% in 2019 to $3.36 as ridership
decreases and expenses increase.
Net Result and Recovery Ratio
As shown in Table 8, CTA’s proposed operating
budget is balanced in 2019, with revenues covering
expenses and producing a net result of zero. CTA also
anticipates a balanced budget in 2020 and 2021.
CTA’s 2019 recovery ratio of 55.6%, calculated by
dividing total operating revenue by total operating
expenditures, with approved adjustments, exceeds
the RTA Board adopted requirement of 54.75%.
$1.79$2.00
$2.67$2.88 $2.82
$1.50
$2.00
$2.50
$3.00
2017 2018 2019 2020 2021
FUEL PRICE PER GALLON
$3.03 $3.19 $3.36 $3.50 $3.62
$11.52 $11.84 $12.30 $12.58 $12.84
$0.00
$5.00
$10.00
$15.00
2017 2018 2019 2020 2021
COST EFFICIENCY AND EFFECTIVENESS
Cost per Passenger Trip Cost per Vehicle Revenue Mile
17

2019 PROPOSED OPERATING BUDGET & CAPITAL PROGRAM
RTAChicago.org
TABLE 8: CTA 2019 BUDGET AND 2020‐2021 FINANCIAL PLAN (DOLLARS IN THOUSANDS)
2017 2018 2019 2020 2021
Actual Estimate Budget Plan Plan
Revenues
Operating Revenues
Passenger Revenue 559,495 584,037 588,012 601,014 614,847
State Reduced Fare Reimbursement ¹ 14,606 13,876 28,322 21,464 14,606
Other Revenue 75,777 90,702 91,413 97,463 104,944
Total Operating Revenues $649,878 $688,616 $707,747 $719,941 $734,397
Public Funding
Sales Tax I 364,280 380,431 395,620 403,532 411,603
Sales Tax II and PTF II 121,928 123,402 131,039 133,135 133,503
25% PTF on RETT 15,083 16,658 16,658 17,158 17,672
Non‐Statutory Funding ‐ PTF I 208,391 208,462 228,213 238,745 243,520
Non‐Statutory Funding ‐ ST I 630 ‐ ‐ 39 2,256
Innovation, Coordination, and Enhancement Funding2
6,129 5,971 6,205 6,330 6,456
City of Chicago RETT 62,021 66,631 66,631 68,630 70,689
Total Public Funding $778,462 $801,554 $844,366 $867,569 $885,700
Total Revenues $1,428,340 $1,490,170 $1,552,114 $1,587,511 $1,620,097
Expenses
Labor 1,044,859 1,068,296 1,084,100 1,100,362 1,116,867
Material 83,783 84,325 80,064 83,241 87,350
Fuel 28,757 33,482 44,084 47,543 46,457
Power 27,373 30,660 34,372 34,965 35,545
Insurance & Claims 3,167 5,000 7,500 8,500 10,000
Purchase of Security Services 17,041 17,804 19,307 19,693 20,087
Other Expenses 245,860 250,603 282,685 293,208 303,791
Total Expenses $1,450,840 $1,490,170 $1,552,114 $1,587,511 $1,620,097
ICE funding not used for operations ‐ transfer to capital ³ ‐ ‐ ‐ ‐ ‐
Net Result4
($22,500) $0 $0 $0 $0
Recovery Ratio 55.5% 56.7% 55.6% 55.1% 54.8%
1 Amount for 2019 contingent upon restoration of reduced fare funding to $34.070 million in State FY19‐20 budgets.
2 ICE funding contingent upon RTA Board approval of ICE‐funded projects as proposed in Service Board budgets and/or capital programs.
3 As authorized by RTA Ordinance 2018‐44, ICE amounts not required for operating funding may be redesignated for capital projects.
4 CTA addressed the unfavorable net result in 2017 by issuing short‐term debt to cover the additional expenses. CTA retired this debt in 2018.
18

2019 PROPOSED OPERATING BUDGET & CAPITAL PROGRAM
RTAChicago.org
CTA’s five‐year capital plan budgets $2.885 billion for capital expenditures in the 2019‐2023 program. CTA’s capital projects are largely focused on moving the system towards a state of good repair. Major projects include repairs and replacement of rolling stock, modernization and upgrades to the rail system, upgrades to stations and other system‐wide projects that support the system. The plan has over 50% of funds allocated to rail projects.
CTA plans to invest $899.7 million on rail modernization and extensions. The Red Purple Modernization (RPM) project has $827.7 million budgeted, which includes $0.4 million for Core Capacity studies, while the Red Line Extension (RLE) project has $40.2 million of funds allocated, and $31.8 million for the Your New Blue (YNB) project on the O’Hare Branch.
The plan includes a $430.7 million investment in rail rolling stock improvements, including $238.7 million for performing quarter life overhauls on the 5000 series rail cars and other rail car maintenance. CTA allocated $192.0 million to purchase the 7000 series rail cars, which will replace the older 2600 series cars.
CTA assigned $219.1 million of funds for track and structure as well as traction power
improvements, which include upgrades and replacement of older signal systems and other track and structural components for the following branches: Green Line South, Green and Pink Lines West, Red and Blue Subways, Brown Line, and the Blue Line Congress Branch.
The projected 5‐year investment of $276.0 million is dedicated bus maintenance and overhaul activities, and for the purchase of diesel and electric buses.
Improving facilities, (station, passenger and support facilities and equipment) is another important goal for CTA with an investment of $216.5 million. The plan includes replacing the 61st Street Rail Shop, ADA and security improvements to stations, and other upgrades and rehabilitations around the system.
Other projects represent $842.6 million in funding and include Ashland Transit Signal Priority, IT upgrades, security and communications upgrades, planning studies, support services, with bond repayment representing the largest portion at $730.5 million.
CAPITAL PROGRAM
Modernization30.1%
Debt Service25.3%
Rolling Stock24.5%
Support Facilities & Equipment
6.6%
Track & Structure6.5%
Contingencies & Admin2.0%
Electric, Signal, & Communications
1.6%
Extensions1.4%Miscellaneous 1.1%
Stations & Passenger Facilities
0.9%
CTA 2019‐2023 CAPITAL PROGRAM USES: $2.885 BILLION
19

2019 PROPOSED OPERATING BUDGET & CAPITAL PROGRAM
RTAChicago.org
Project & Title 2019 2020 2021 2022 2023 TOTALRolling Stock ‐ Bus
Perform Bus Maintenance Activities 40,000 2,300 2,300 2,300 2,200 49,100
Perform Mid‐Life/Life‐Extending Bus Overhaul 0 19,108 21,339 15,815 16,098 72,360
Purchase Replacement Buses 15,454 39,560 7,890 19,140 72,450 154,494
Subtotal Rolling Stock 55,454 60,968 31,529 37,255 90,748 275,954
Modernization ‐ Bus
Ashland Avenue Transit Signal Priority 8,806 0 0 0 0 8,806
Subtotal Modernization 8,806 0 0 0 0 8,806
Bus Total 64,261 60,968 31,529 37,255 90,748 284,760
Rolling Stock ‐ Rail
Perform Quarter‐Life Rail Car Overhaul (5000 Series) 14,317 54,507 38,791 0 74,251 181,866
Perform Rail Car Maintenance Activities 40,801 9,408 2,200 2,200 2,200 56,808
Purchase Replacement Rail Cars (7000 Series) 0 66,753 53,114 72,124 0 191,991
Subtotal Rolling Stock 55,118 130,668 94,105 74,324 76,451 430,666
Track & Structure ‐ Rail
Green Line South Track Improvements 9,866 22,463 5,872 1,866 0 40,066
Green and Pink Lines West Track Improvements 4,982 11,343 2,965 942 0 20,232
Red and Blue Line Subway Track Improvements 5,238 11,925 3,117 990 0 21,271
Brown Line Track Improvements 4,143 9,432 2,466 783 0 16,824
Blue Line Track Improvements ‐ Congress Branch 975 2,219 580 184 0 3,958
Elevated Track and Structure 24,813 14,813 14,813 14,813 14,813 84,063
Subtotal Track & Structure 50,016 72,195 29,812 19,578 14,813 186,413
Electrical, Signal, & Communications ‐ Rail
Traction Power 5,994 17,844 7,764 1,133 0 32,736
Subtotal Electrical, Signal & Communications 5,994 17,844 7,764 1,133 0 32,736
Support Facilities & Equipment ‐ Rail
Replace 61st Street Rail Shop 0 29,625 9,875 0 26,625 66,125
Rail Facilities 3,579 14,275 3,950 3,950 3,950 29,705
Subtotal Support Facilities & Equipment 3,579 43,900 13,825 3,950 30,575 95,830
Stations & Passenger Facilities
Rehabil itate Rail Stations 0 1,975 5,925 5,925 0 13,825
Station Security Enhancements 2,924 6,657 1,740 553 0 11,873
Subtotal Stations & Passenger Facilities 2,924 8,632 7,665 6,478 0 25,698
Extensions ‐ Rail 0
Red Line Extension 0 8,049 32,198 0 0 40,247
Subtotal Extensions 0 8,049 32,198 0 0 40,247
Modernization ‐ Rail
North Main Line ‐ RPM 173,488 307,173 146,993 100,000 100,000 827,654
Blue Line O'Hare Branch ‐ YNB 0 20,488 11,331 0 0 31,819
Subtotal Modernization 173,488 327,662 158,324 100,000 100,000 859,473
Miscellaneous ‐ Rail
Blue Line Core Capacity Study 404 324 0 0 0 728
Subtotal Miscellaneous 404 324 0 0 0 728
Contingencies & Administration ‐ Rail
Support Services ‐ Fast Tracks Program 361 865 313 100 0 1,639
Subtotal Contingencies & Administration 361 865 313 100 0 1,639
Rail Total 291,883 610,140 344,005 205,563 221,838 1,673,430
Electrical, Signal & Communications ‐ System
Security Camera Improvements 3,507 7,985 2,087 663 0 14,242
Subtotal Electrical, Signal & Communications 3,507 7,985 2,087 663 0 14,242
Support Facilities & Equipment ‐ System
Upgrade Computer, Asset Management and IT Systems 495 2,170 1,700 1,700 1,700 7,766
Improve Facil ities 26,348 10,337 7,900 7,900 0 52,485
Improve Office Building 6,187 6,190 6,190 6,186 6,189 30,943
Purchase Equipment and Non‐Revenue Vehicles 0 473 3,333 0 0 3,806
Subtotal Support Facilities & Equipment 33,031 19,170 19,123 15,786 7,889 95,000
Miscellaneous
Implement Security Projects 5,943 5,940 5,917 5,917 5,931 29,648
Subtotal Miscellaneous 5,943 5,940 5,917 5,917 5,931 29,648
Contingencies & Administration ‐ System
Provide for Support Services 3,217 4,720 5,358 4,308 4,377 21,981
Provide for Program Development 525 525 525 525 525 2,625
Provide for Program Management 6,014 6,606 6,606 6,606 6,606 32,439
Subtotal Contingencies & Administration 9,756 11,851 12,490 11,440 11,509 57,046
System Total 52,237 44,946 39,617 33,807 25,329 195,935
CTA Total 408,381 716,054 415,151 276,625 337,915 2,154,125
CTA Debt Service 150,429 150,156 143,370 143,323 143,261 730,540
CTA Total with Debt Service 558,810 866,210 558,521 419,948 481,176 2,884,665
TABLE 9: CTA FIVE‐YEAR CAPITAL PROGRAM (DOLLARS IN THOUSANDS)
20

2019 PROPOSED OPERATING BUDGET & CAPITAL PROGRAM
RTAChicago.org
Metra Ridership
Metra’s 2018 ridership is projected to end the year
down 3.5% from 2017. Ridership decreases can be
attributed to an extended period of low gas prices,
growth of Transportation Network Companies
(TNCs), changing consumer habits, and the 2018 fare
increase. Metra’s 2019 budget anticipates ridership
of 75.6 million, a further decrease of 0.4% from 2018,
followed by no change in 2020 and 2021.
Fares
There are no fare changes proposed for 2019. As
part of a fare structure study, the following initiatives
were introduced in 2018 as a one‐year pilot: 1)
consolidating Zones K through M into Zone J, and 2)
reassigning some stations to different zones to
adjust perceived inconsistencies between rail lines
where nearby stations are in different zones. In
2019, a third pilot program “Round Trip Plus” will be
introduced. This pilot offers a one‐day pass for
unlimited travel between any two zones. The Round
Trip Plus ticket will be priced at twice the price of a
comparable one‐way ticket and will only be available
through the Ventra app. Metra’s average fare is
budgeted at $4.91 in 2019, essentially unchanged
from 2018.
Service Levels No service reductions are planned for 2019. In
January 2019, Metra will start a two‐year pilot
program to increase reverse commute service on the
Milwaukee District North Line. This pilot will add
service in the morning and afternoon between Union
Station and Lake Forest. As a result, Metra
anticipates a 0.1% increase in vehicle revenue miles
(VRM) in 2019, followed by a 0.6% increase in 2020,
and a 0.3% decrease in 2021.
78.6 75.9 75.6 75.6 75.6
50
100
2017 2018 2019 2020 2021
RIDERSHIP (IN MILLIONS)
$4.52$4.90 $4.91
$5.32$5.57
$3.00
$4.00
$5.00
$6.00
2017 2018 2019 2020 2021
AVERAGE FARE
OPERATING BUDGET
21

2019 PROPOSED OPERATING BUDGET & CAPITAL PROGRAM
RTAChicago.org
Service effectiveness can be shown as the ratio of
ridership to service provided and is illustrated below.
Operating Revenue
Metra projects that total operating revenues will
increase by 0.3% in 2019 to $411.7 million, followed
by increases of 7.6% in 2020 and 4.3% in 2021.
Passenger revenue is estimated to decrease by 0.3%
in 2019, consistent with the projected ridership
decline. Metra’s share of the State reduced fare
reimbursement is assumed to be restored to $3.1
million for 2019, subject to appropriation by the
legislature. Other revenue is projected to increase
by 1.5% in 2019 to $37.6 million, reflecting an
anticipated increase in new and updated leases, and
revenue for track crossing project work done on
behalf of the State.
Public Funding
Total public funding for Metra operations in 2019 is
$422.6 million, 4.5% higher than the 2018 estimate,
due to assumed 3.8% sales tax growth and reduced
state funding cuts. Metra public funding
assumptions match the RTA Board adopted marks
for sales tax, Public Transportation Funds (PTF), RTA
non‐statutory funding, and ICE funding. Public
funding is projected at $428.1 million in 2020 and
$436.5 million in 2021.
Metra’s 2019‐2021 ICE funding is programmed to be
used entirely for capital purposes, with proposed
uses shown in Table 1 of the RTA Region section.
Metra also anticipates a Homeland Security Grant of
$1.5 million annually in 2019 through 2021. When
public funding is combined with operating revenue,
total revenue of $834.3 million is projected to be
available for 2019 operations.
Expenses
Metra projects that 2019 total expenses will increase
by 5.1% over the 2018 estimate, but by a lesser
amount of 3.1% over the 2018 budget, to $822.2
million. Metra’s expense growth reflects projected
increases in each operating category.
Transportation, Maintenance of Way, and
Maintenance of Equipment expenses are projected
to increase by 4.0%, 9.3%, and 3.3%, respectively,
reflecting the steadily increasing costs of safely
operating and maintaining aging equipment and
infrastructure, as well as operating the Positive Train
Control (PTC) system. Administration expenses are
projected to increase by 5.1% from the 2018
estimate. The Downtown Stations operating
category has been incorporated into the
Transportation category effective with the 2019
budget.
1.80 1.74 1.73 1.72 1.73
1.50
2.00
2.50
2017 2018 2019 2020 2021
PASSENGER TRIPS PER VRM
Operating Revenues49.3%
Sales Tax I36.5%
Sales Tax II and PTF II12.8%
ICE Funding0.6%
JSIF Reserve0.3%
Homeland Security Grant0.2%
2019 REVENUES: $834.3 MILLION
22

2019 PROPOSED OPERATING BUDGET & CAPITAL PROGRAM
RTAChicago.org
Diesel fuel expenditures, comprising 7.6% of Metra’s
total operating expenses, are expected to increase
by 4.1% to $62.5 million due to projected price
increases. Fuel price is budgeted at $2.30 per gallon,
representing a nine cent increase from the 2018
estimate. Metra has not advance purchased any of
its 2019 fuel requirements.
Electricity expense for the Metra Electric District line
is budgeted to increase by 6.7%, to $5.5 million, due
to expected growth in energy prices.
Cost efficiency is shown by the measure cost per
vehicle revenue mile, which is projected to increase
by 5.0% in 2019 due to higher expenses, followed by
increases of 2.3% in 2020 and 3.6% in 2021, as
expense growth continues and service levels remain
largely unchanged. Cost effectiveness is shown by
cost per passenger trip, which is projected to
increase by 5.5% in 2019, 2.9% in 2020, and 3.2% in
2021, as ridership remains flat and expenses steadily
increase.
Net Result and Recovery Ratio
As shown in Table 10, Metra’s operating budget is
balanced in 2019‐2021, with a net result of zero after
transfer of ICE funding and fare revenue to the
capital program. In 2019, Metra reduced the
transfer of operating revenue to capital to $7 million
in order to balance the operating budget. In 2020
and 2021, Metra anticipates restoration of the
Farebox Capital Program to around $20 million per
year.
Metra’s 2019 recovery ratio of 53.1%, calculated by
dividing total operating revenue by total operating
expenditures, with approved adjustments, exceeds
the RTA Board adopted requirement of 52.5%.
Transportation34.5%
Maintenance of Way19.1%
Maintenance of Equipment
23.2%
Claims & Insurance
1.9%
Administration13.0%
Diesel Fuel7.6%
Electricity0.7%
2019 EXPENSES: $822.2 MILLION
$1.76
$2.21$2.30
$2.37$2.45
$1.50
$2.00
$2.50
2017 2018 2019 2020 2021
FUEL PRICE PER GALLON
$9.69 $10.32 $10.88 $11.19 $11.55
$17.43 $17.96 $18.86 $19.30 $19.98
$0.00
$10.00
$20.00
$30.00
2017 2018 2019 2020 2021
COST EFFICIENCY AND EFFECTIVENESS
Cost per Passenger Trip Cost per Vehicle Revenue Mile
23

2019 PROPOSED OPERATING BUDGET & CAPITAL PROGRAM
RTAChicago.org
TABLE 10: METRA 2019 BUDGET AND 2020‐2021 FINANCIAL PLAN (DOLLARS IN THOUSANDS)
2017 2018 2019 2020 2021
Actual Estimate Budget Plan Plan
Revenues
Operating Revenues
Passenger Revenue 355,260 372,000 371,000 402,000 421,000
State Reduced Fare Reimbursement 1
1,483 1,537 3,138 2,378 1,618
Other Revenue 39,881 37,000 37,550 38,500 39,200
Total Operating Revenues $396,625 $410,537 $411,688 $442,878 $461,818
Public Funding
Sales Tax I 290,406 295,284 307,073 313,215 319,479
Sales Tax II and PTF II 99,066 100,264 106,469 108,172 108,471
Non‐Statutory Funding ‐ PTF I ‐ ‐ ‐ ‐ ‐
Non‐Statutory Funding ‐ ST I 512 ‐ ‐ 32 1,833
Innovation, Coordination, and Enhancement Funding2,3
7,380 4,851 5,042 5,143 5,246
Joint Self Insurance Fund (JSIF) Reserve 2,500 2,500 2,500 ‐ ‐
Homeland Security Grant 2,400 1,500 1,500 1,500 1,500
Total Public Funding $402,265 $404,399 $422,585 $428,062 $436,529
Total Revenues $798,889 $814,937 $834,273 $870,940 $898,347
Expenses
Transportation 249,483 272,900 283,800 292,100 301,600
Maintenance of Way (Engineering) 149,819 143,900 157,336 162,000 167,500
Maintenance of Equipment (Mechanical) 174,260 184,200 190,351 196,000 202,500
Claims & Insurance 25,370 14,500 15,607 15,600 15,600
Administration 98,838 101,900 107,093 110,000 113,500
Downtown Stations 4
14,337 ‐ ‐ ‐ ‐
Diesel Fuel 45,321 60,000 62,480 64,500 66,500
Electricity 4,166 5,200 5,549 5,700 5,900
Total Expenses $761,593 $782,600 $822,215 $845,900 $873,100
ICE funding not used for operations ‐ transfer to capital 5
(4,980) (4,851) (5,042) (5,143) (5,246)
Farebox capital program (32,400) (27,485) (7,015) (19,897) (20,002)
Net Result ($84) $0 $0 $0 $0
Recovery Ratio 55.5% 55.7% 53.1% 55.5% 56.0%
1 Amount for 2019 contingent upon restoration of reduced fare funding to $34.070 million in State FY19‐20 budgets.
2 ICE funding contingent upon RTA Board approval of ICE‐funded projects as proposed in Service Board budgets and/or capital programs.
3 2017 ICE amount includes carryover of $2.4 million of 2015 ICE funding for mobile application development.
4 Effective with the 2019 budget, and in the 2018 estimate, the Downtown Stations category has been incorporated into Transportation.
5 As authorized by RTA Ordinance 2018‐44, ICE amounts not required for operating funding may be redesignated for capital projects.
24

2019 PROPOSED OPERATING BUDGET & CAPITAL PROGRAM
RTAChicago.org
Metra has budgeted $1.165 billion to its 2019‐2023 capital program. Metra continues to concentrate its capital budget on working towards a state of good repair. Major projects are centered on rolling stock, track and structure repairs, signal, electrical and communications, support facilities and equipment, stations and parking, and support activities.
Over the next 5 years, Metra plans to invest $577.7 million, or nearly 50% of its capital program funds, to improve its fleet. In‐house rebuilding program of current rolling stock is estimated at $201.7 million, improving current locomotive and purchasing new locomotives at $200.4 million, and purchasing new rail cars at $175.7 million all encompass the investment.
Metra has a goal to maintain track and structures in a state of good repair. The five‐year plan includes an allocation $255.6 million for these projects. Major projects include $115.5 million allocated to rebuilding bridges and improving structures associated with the rail system, replacing rail ties and other rail renewal with an investment of $110.6 million, and improving rail crossings with $29.5 million.
Metra has budgeted $116.7 million for
improvements and state of good repair projects for electrical, signal and communications systems. The plan has $100.7 million budgeted
for signal upgrades, improvements to interlockers and switches, and electrical upgrades all of which are expected to lead to improvements in system reliability. Another $16.0 million is budgeted for PTC in 2019 with the project expected to be complete by the end of the year.
The plan allocates $89.3 million in support facilities and equipment. Projects include $38.9 million for rail yard improvements, $34.7 million for new equipment and non‐revenue vehicles, $12.7 million to fund a new financial system, and $3.0 million for building improvements. These projects support the backbone of the system and allow Metra operations to run efficiently.
Metra planned for $49.1 million allocated to improve station facilities and parking as well as ADA accessibility improvements. Station improvements, funded at $34.1 million, are planned at Hubbard Woods, Elmhurst, New Lenox, West Chicago, 147th Street, and other station improvements systemwide. In addition, $15.0 million is budgeted to provide ADA enhancements around the system.
Finally, $76.2 million is programmed for support activities around the system that include infrastructure engineering, project administration, and contingencies.
CAPITAL PROGRAM
Rolling Stock49.6%
Track & Structure21.9%
Electric, Signal, & Communications
10.0%
Support Facilities & Equipment
7.7%
Miscellaneous4.8%
Stations & Passenger Facilities
4.2%Contingencies &
Admin1.7%
METRA 2019‐2023 CAPITAL PROGRAM USES: $1.165 BILLION
25

2019 PROPOSED OPERATING BUDGET & CAPITAL PROGRAM
RTAChicago.org
Project & Title 2019 2020 2021 2022 2023 TOTAL
Rolling Stock
Locomotive Rehabiltation 8,000 10,150 7,635 5,050 0 30,835
Rehabilitate Rail Cars 12,100 43,539 29,788 32,500 37,850 155,777
Purchase New Cars 2,700 34,000 36,500 20,600 81,900 175,700
Purchase New Locomotives 8,000 21,000 56,000 49,139 35,380 169,519
Fleet Components 9,500 9,500 9,300 8,800 8,800 45,900
Subtotal Rolling Stock 40,300 118,189 139,223 116,089 163,930 577,731
Track & Structure ‐ Rail
Provide for Ties, Ballast & Surfacing 11,500 7,750 8,750 7,750 8,750 44,500
Upgrade Crossings (Road and Track) 4,750 5,750 6,000 6,500 6,500 29,500
Provide for Rail Renewal 8,298 23,928 15,265 9,211 9,417 66,119
Rehabilitate or Replace Bridges 26,650 38,050 9,650 11,650 18,659 104,659
Retaining Wall Rehabilitation 2,500 1,000 1,000 1,000 1,000 6,500
Provide for Structural Improvements 850 950 850 850 850 4,350
Subtotal Track & Structure 54,548 77,428 41,515 36,961 45,176 255,628
Electrical, Signal, & Communications
Upgrade Signal System 350 2,500 5,650 5,350 5,500 19,350
Upgrade Interlockers and Crossovers 8,600 17,100 18,300 4,300 7,000 55,300
Improve Electrical Equipment and Systems 6,910 4,460 5,040 4,890 4,760 26,060
Install Positive Train Control (PTC) System 15,978 0 0 0 0 15,978
Subtotal Electrical, Signal & Communications 31,838 24,060 28,990 14,540 17,260 116,688
Support Facilities & Equipment
Improve Yards, Shops and Facil ities 16,000 5,000 5,500 6,300 6,100 38,900
Upgrade Buildings 2,070 200 250 250 250 3,020
Purchase Equipment and Vehicles 12,639 11,214 3,775 3,275 3,775 34,678
Replace Financial System 1,850 3,100 1,823 2,900 2,998 12,671
Subtotal Support Facilities & Equipment 32,559 19,514 11,348 12,725 13,123 89,269
Stations & Passenger Facilities
Improve Stations and Parking 10,030 15,200 3,132 2,500 3,250 34,112
ADA Improvements 3,000 3,000 3,000 3,000 3,000 15,000
Subtotal Stations & Passenger Facilities 13,030 18,200 6,132 5,500 6,250 49,112
Miscellaneous
Infrastructure Engineering 9,250 9,000 10,000 9,000 9,500 46,750
ICE Projects ‐ TBD 0 0 5,246 0 0 5,246
Provide for Unanticipated Capital 600 888 1,000 800 800 4,088
Subtotal Miscellaneous 9,850 9,888 16,246 9,800 10,300 56,084
Contingencies & Administration
Provide for Contingencies 1,900 1,559 2,632 1,865 1,915 9,872
Provide for Locally Funded Projects/Match 602 1,234 759 1,000 1,035 4,630
Provide for Project Administration 1,000 1,600 1,000 1,000 1,000 5,600
Subtotal Contingencies & Administration 3,502 4,393 4,391 3,865 3,950 20,102
Metra Total 185,627 271,672 247,845 199,480 259,990 1,164,614
TABLE 11: METRA FIVE‐YEAR CAPITAL PROGRAM (DOLLARS IN THOUSANDS)
26

2019 PROPOSED OPERATING BUDGET & CAPITAL PROGRAM
RTAChicago.org
Pace Suburban Service
Ridership
Pace ridership in 2018 is estimated to decrease by
2.8% as customers have adjusted to Pace’s January
2018 base fare increase. Combined ridership for
Pace’s three Suburban Service modes is budgeted to
decline by 0.4% in 2019 to 30.4 million. The decrease
is anticipated to be entirely in fixed‐route route bus
ridership, as vanpool and demand‐response (Dial‐a‐
Ride) ridership are expected to be unchanged from
2018. Pace’s assumptions reflect the recent general
trend of ridership loss, partially offset by new
ridership from planned service additions. Pace is
forecasting flat Suburban Service ridership of 30.4
million for 2020 and 2021.
Fares
Pace’s 2019 budget does not contain any proposed
fare adjustments. Pace last implemented a general
fare increase in January 2018. After rising by 9 cents
in 2018, Pace’s average fare across all fare and pass
types is projected to remain flat at $1.25 through
2021.
Service Levels
Overall Pace service levels, as measured by vehicle
revenue mi les (VRM), are projected to i ncrease by
0.5% in 2019 due to the start‐up of Milwaukee
Avenue Pulse Arterial Rapid Transit (ART) service.
Pace is also proposing elimination of Saturday
service on five routes and the complete elimination
of seven poor‐performing routes.
Service effectiveness, as measured by passenger
trips per vehicle revenue mile (VRM), is constant at
0.79 in 2019‐2021, indicating that service is being
added at an appropriate rate.
31.4 30.5 30.4 30.4 30.4
0
25
50
2017 2018 2019 2020 2021
RIDERSHIP (IN MILLIONS)
$1.16 $1.25 $1.25 $1.25 $1.25
$0.00
$1.00
$2.00
2017 2018 2019 2020 2021
AVERAGE FARE
0.81 0.80 0.79 0.79 0.79
0.50
1.00
1.50
2017 2018 2019 2020 2021
PASSENGER TRIPS PER VRM
OPERATING BUDGET
27

2019 PROPOSED OPERATING BUDGET & CAPITAL PROGRAM
RTAChicago.org
Operating Revenue
Pace projects that total 2019 operating revenues will
increase by 4.1% to $58.7 million. Passenger fare
revenue is estimated to decrease by 0.2%, consistent
with the projected ridership assumption. Pace’s
share of the State reduced fare reimbursement is
assumed to be restored to $2.6 million in 2019,
subject to appropriation by the legislature. Other
revenue is projected to increase by 6.2% to $18.2
million, driven by higher advertising revenue and
increased local government contributions for
specific services. Operating revenue comprises
about 25% of Pace’s total revenue for operations,
with the balance provided by public funding sources.
Public Funding
Pace’s total 2019 public funding will increase by 4.4%
from the 2018 estimate to $177.3 million, driven by
assumed sales tax growth of 3.8% and less severe
State cuts in funding for transit contained in the SFY
19 budget. While higher than 2018, this funding
level is slightly lower than the original 2017 budget.
Pace’s public funding assumptions match the RTA
Board adopted marks for sales tax, Public
Transportation Funds, Suburban Community
Mobility Funds, South Suburban Job Access Funds,
RTA non‐statutory funding, and ICE funding. Pace’s
share of 2019‐2021 ICE funding is programmed to be
used entirely for operating purposes, with proposed
uses shown in Table 1 of the RTA Region section. In
addition to RTA funding, Pace expects $4.9 million of
federal funding for operations in 2019.
Expenses
Pace projects that 2019 total expenditures will
increase from the 2018 estimate by 4.2% to $236.0
million. It should be noted that Pace’s proposed
2019 expenditures are only 1.7% higher than Pace’s
2018 operating budget. Expense growth is being
driven by increased service levels, fuel, insurance
costs, and additional debt service. Labor, Pace’s
largest expense category, is expected to increase by
4.9% to $140.1 million.
Pace’s fuel expense is projected to grow by 6.2% as
consumption increases with service levels and Pace’s
fuel price assumption rises to $1.95 per gallon.
Operating Revenues24.9%
Sales Tax I41.2%
Sales Tax II and PTF II15.0%
SCMF and SSJA14.1%
Non‐Statutory Funding ‐ PTF I
2.0%
ICE Funding0.7%
Federal Funds2.1%
2019 REVENUES: $236.0 MILLION
Labor/Fringes59.4%
Health Insurance11.1%
Parts/Supplies3.2%
Purchased Transportation
10.7%
Fuel6.2%
Utilities1.0%
Insurance4.5%
Other Expenses4.0%
2019 EXPENSES: $236.0 MILLION
$1.50
$1.83$1.95
$2.26$2.42
$1.00
$1.50
$2.00
$2.50
2017 2018 2019 2020 2021
FUEL PRICE PER GALLON
28

2019 PROPOSED OPERATING BUDGET & CAPITAL PROGRAM
RTAChicago.org
Cost efficiency is shown below by the measure cost
per vehicle revenue mile, which is projected to
increase by an average of 2.5% per year. Cost
effectiveness is shown as cost per passenger trip,
which is projected to increase by 3.0% per year as
ridership is expected to grow more slowly than
operating expenses.
Net Result and Recovery Ratio
As shown in Table 12, Pace’s operating budget is
balanced in 2019, with revenues equal to
expenditures, producing a net result of zero.
However, the 2020 and 2021 expense levels include
reductions of $3.5 million and $12.0 million,
respectively, identified by Pace as required budget
balancing actions.
Pace’s 2019 through 2021 recovery ratios, calculated
by dividing total operating revenue by total
operating expenditures, with approved adjustments,
exactly meet the RTA Board adopted requirement of
30.3%, contingent upon implementation of the
budget balancing actions in 2020 and 2021.
$7.22 $7.43 $7.77 $8.05 $8.13
$5.81 $5.91 $6.12 $6.34 $6.41
$0.00
$5.00
$10.00
2017 2018 2019 2020 2021
COST EFFICIENCY AND EFFECTIVENESS
Cost per Passenger Trip Cost per Vehicle Revenue Mile
29

2019 PROPOSED OPERATING BUDGET & CAPITAL PROGRAM
RTAChicago.org
TABLE 12: PACE SUBURBAN SERVICE 2019 BUDGET AND 2020‐2021 FINANCIAL PLAN (DOLLARS IN THOUSANDS)
2017 2018 2019 2020 2021
Actual Estimate Budget Plan Plan
Revenues
Operating Revenues
Passenger Revenue 36,541 38,008 37,950 37,950 37,950
State Reduced Fare Reimbursement 1
1,346 1,279 2,610 1,978 1,346
Other Revenue 2
16,544 17,104 18,169 23,784 23,547
Total Operating Revenues $54,431 $56,391 $58,729 $63,712 $62,843
Public Funding
Sales Tax I 92,119 93,454 97,185 99,129 101,112
Sales Tax II and PTF II 33,022 33,421 35,490 36,057 36,157
Suburban Community Mobility Fund 24,141 24,878 25,856 26,373 26,901
South Suburban Job Access Fund 7,500 7,500 7,500 7,500 7,500
Non‐Statutory Funding ‐ PTF I 4,253 4,254 4,657 4,872 4,970
Non‐Statutory Funding ‐ ST I 171 ‐ ‐ 11 611
Innovation, Coordination, and Enhancement Funding3
1,660 1,617 1,681 1,714 1,749
CMAQ / JARC / New Freedom 8,565 4,680 4,939 5,150 5,166
Total Public Funding $171,431 $169,805 $177,308 $180,807 $184,165
Total Revenues $225,862 $226,196 $236,037 $244,519 $247,008
Expenses
Labor/Fringes 125,021 133,601 140,093 143,963 147,941
Health Insurance 23,979 25,768 26,092 28,754 31,198
Parts/Supplies 7,676 7,490 7,662 8,196 8,766
Purchased Transportation 24,039 16,275 25,176 25,874 26,598
Fuel 11,901 13,747 14,606 16,892 18,110
Util ities 2,016 2,171 2,264 2,392 2,526
Insurance 12,602 9,300 10,733 11,482 12,285
Other Expenses 19,232 18,136 9,411 10,492 11,556
Budget Balancing Actions 4
‐ ‐ ‐ (3,526) (11,971)
Total Expenses $226,466 $226,488 $236,037 $244,519 $247,009
ICE funding not used for operations ‐ transfer to capital5
(1,587) (1,617) ‐ ‐ ‐
Net Result ($2,191) ($1,909) $0 $0 $0
Recovery Ratio 28.9% 30.3% 30.3% 30.3% 30.3%
1 Amount for 2019 contingent upon restoration of reduced fare funding to $34.070 million in State FY19‐20 budgets.
2 In 2020 and 2021, includes $5.5 million of additional revenue required for budget balancing, potentially in the form of a fare increase.
3 ICE funding contingent upon RTA Board approval of ICE‐funded projects as proposed in Service Board budgets and/or capital programs.
4 TBD but may include service and/or other expense reductions.
5 As authorized by RTA Ordinance 2018‐44, ICE amounts not required for operating funding may be redesignated for approved capital projects.
30

2019 PROPOSED OPERATING BUDGET & CAPITAL PROGRAM
RTAChicago.org
Pace’s 2019‐2023 Capital Program totals $289.5
million. The majority of funding will be used for state
of good repair projects that focus on acquiring new
rolling stock, updating and improving support
facilities and equipment, and renovating and
improving the passenger experience at stations and
facilities.
Pace budgeted $142.9 million for support
facilities and equipment, with the largest
investment of $46.8 million going to a new
Northwest Division garage that will be more
environmentally friendly by utilizing compressed
natural gas buses, which will save an estimated
$1.3 million in annual fuel cost. $30.7 million is
dedicated to preventive maintenance, and the
remaining funds are dedicated to IT projects,
farebox equipment, non‐revenue vehicles, and
other associated capital.
Pace’s plan includes investing $106.1 million in
rolling stock. This includes $98.1 million for the
purchase of new buses, paratransit vehicles, and
vanpool vans. Over the five year plan, Pace
projects to acquire 159 new buses, including
special buses for the new Pace Pulse route on
Milwaukee Avenue, 305 new paratransit
vehicles, 69 community vehicles, and 187
vanpool vans. The remaining $8.0 million in
rolling stock investment is for engine and
transmission retrofits during midlife bus
overhauls.
Pace’s plan includes new stations, passenger
facilities, and improvements to existing transit
facilities. Overall funding for these projects is
$39.3 million, of which $23.2 million will fund
renovations at Homewood, Gurnee Mills, the
Harvey Transportation Center, and the second
Pace Pulse line facilities on Dempster Avenue. A
new bus station will be created at the Joliet
Gateway Transportation Center for $7.5 million,
and at the Orland Square Mall for $0.6 million.
The remaining $8.0 million will be used for
additional passenger improvements including
bus stop signs and shelters, bus tracker
installation, and conversion to posted stops
along the Pace bus network.
The final $1.3 million is allocated for
unanticipated capital needs for the system.
CAPITAL PROGRAM
Support Facilities & Equipment
49.4%
Rolling Stock36.6%
Stations & Passenger Facilities13.6%
Miscellaneous0.4%
PACE 2019‐2023 CAPITAL PROGRAM USES: $289.5 MILLION
31

2019 PROPOSED OPERATING BUDGET & CAPITAL PROGRAM
RTAChicago.org
Project & Title 2019 2020 2021 2022 2023 TOTALRolling Stock
Purchase 30' Fixed Route Accessible Buses – Systemwide 14,000 13,200 11,200 8,000 10,000 56,400
Purchase 40' Fixed Route Accessible Buses – Systemwide 0 0 0 9,000 0 9,000
Purchase Replacement Paratransit Vehicles – Systemwide 4,832 4,160 4,225 3,380 3,250 19,847
Purchase Community Vehicles – Systemwide 0 1,690 0 1,779 1,825 5,293
Purchase Replacement and Expansion Vanpool Vans – Systemwide 7,520 0 0 0 0 7,520
Provide for Engine/Transmission Retrofit – Systemwide 0 2,003 2,002 2,019 2,002 8,026
Provide for Associated Capital Items – Systemwide 0
Subtotal Rolling Stock 26,352 21,053 17,427 24,177 17,077 106,086
Support Facilities & Equipment ‐ Bus
Construct Bus Garage – Northwest Cook County 46,800 0 0 0 0 46,800
Associated Capital 6,000 4,000 3,000 0 5,000 18,000
Improve Facilities – Systemwide 2,063 7,900 2,000 0 6,500 18,463
Purchase Replacement Farebox System – Systemwide 250 5,000 5,000 5,000 2,500 17,750
Purchase Computer Hardware and Software Systems – Systemwide 500 1,000 1,000 1,000 1,000 4,500
Purchase Maintenance/Support Equipment and Vehicles – Systemwide 600 1,000 1,000 1,000 1,000 4,600
Purchase Office Equipment – Systemwide 100 500 500 500 500 2,100
Preventive Maintenance 3,000 7,250 6,980 6,808 6,633 30,671
Subtotal Support Facilities & Equipment 59,313 26,650 19,480 14,308 23,133 142,884
Stations & Passenger Facilities ‐ Bus
Passenger Facilities Mid‐Life Renovation – Systemwide 0 0 13,400 2,250 7,500 23,150
Joliet Transit Center 7,500 0 0 0 0 7,500
Orland Square Mall Passenger Facil ity 600 0 0 0 0 600
Posted Stops Only Conversion – Systemwide 750 500 500 500 500 2,750
Install Shelters/Signs/Passenger Amenities – Systemwide 750 1,000 1,000 1,000 1,000 4,750
Bus Tracker Sign Development 500 0 0 0 0 500
Subtotal Stations & Passenger Facilities 10,100 1,500 14,900 3,750 9,000 39,250
Miscellaneous ‐ Bus
Provide for Unanticipated Capital – Systemwide 250 250 250 250 250 1,250
Subtotal Miscellaneous 250 250 250 250 250 1,250
Pace Total 96,015 49,453 52,057 42,485 49,460 289,469
TABLE 13: PACE FIVE‐YEAR CAPITAL PROGRAM (DOLLARS IN THOUSANDS)
32

2019 PROPOSED OPERATING BUDGET & CAPITAL PROGRAM
RTAChicago.org
Pace ADA Paratransit Ridership
Pace’s budget projects that ADA Paratransit
ridership will increase by 1.0% in 2019 to 4.335
million, maintaining essentially the same growth
that is now estimated by Pace for 2018. Ridership
in the suburban service area and City of Chicago
service area is expected to grow by 1.3% and 0.8%,
respectively, while Taxi Access Program (TAP)
ridership is forecast to increase by 5.1% as
customers continue to respond positively to the
changes made to TAP in 2017. In the planning years
of 2019 and 2020, region‐wide ADA Paratransit
ridership is expected to grow by 1.1% annually.
Fares
No fare increase has been proposed by Pace for
2019, so the base ADA Paratransit fare will remain
at $3.25. The TAP fare was reduced from $5.00 to
$3.00 in 2017 and will also be unchanged for 2019.
Because personal care attendants of ADA
Paratransit riders are included in ridership totals but
do not pay a separate fare, the average fare across
all riders is less than the base fare, and is projected
to remain constant at $2.79 through 2021 after
rising with the 25 cent fare increase of in 2018.
Service Levels
ADA Paratransit service levels are driven by
customer demand. Pace projects that ADA
Paratransit vehicle revenue miles will increase by
1.1% in 2019, in line with projected ridership
growth. As a result, service effectiveness, as
measured by passenger trips per vehicle revenue
mile, tends to be flat over time since service is being
added at the same rate as ridership.
4.256 4.290 4.335 4.381 4.428
0
5
10
2017 2018 2019 2020 2021
RIDERSHIP (IN MILLIONS)
$2.57 $2.79 $2.79 $2.79 $2.79
$0.00
$1.00
$2.00
$3.00
$4.00
2017 2018 2019 2020 2021
AVERAGE FARE
0.15 0.15 0.15 0.16 0.16
0.00
0.10
0.20
2017 2018 2019 2020 2021
PASSENGER TRIPS PER VRM
OPERATING BUDGET
33

2019 PROPOSED OPERATING BUDGET & CAPITAL PROGRAM
RTAChicago.org
Operating Revenue
Pace projects that 2019 ADA Paratransit operating
revenues will increase by 1.7% to $14.2 million.
Fare revenue is expected to increase by 1.0%,
consistent with ridership growth, while Other
revenue, consisting of payments for RTA
certification trips and a small amount of investment
income, is projected to grow by 5.6% to $2.1
million. Operating revenue comprises about 8% of
Pace’s total revenue for operations, with the
balance provided by public funding sources.
Public Funding
The RTA Act was amended in 2011 to ensure that
ADA Paratransit operations are fully funded each
year. Pace expects ADA Paratransit to finish 2018
with a surplus of approximately $3.5 million, to be
retained by the RTA in a reserve fund for future
ADA Paratransit use.
For the 2019 budget, Pace projects an ADA
Paratransit funding need of $173.0 million, satisfied
by Sales Tax II and PTF II funds of $164.6 million and
additional state funding of $8.4 million. Pace’s two‐
year financial plan indicates that adopted RTA
funding levels should also be sufficient for 2020 and
2021, provided that ridership growth remains in the
1% to 2% range and State funding for ADA
Paratransit continues at $8.5 million per year.
Expenses
Pace projects that 2019 operating expenditures for
ADA Paratransit will increase by 6.9% to $187.2
million, balanced with revenue, followed by
increases of 4.8% and 4.3% in 2020 and 2021,
respectively. Purchased transportation, which
accounts for almost 90% of total ADA Paratransit
expenses, is projected to increase by 5.7% in 2019
due to ridership growth and contractual rate
increases. The regional ADA support allocation,
which accounts for work done by other Pace
departments in support of ADA Paratransit, is
projected to increase by 18.2% to $9.1 million.
Pace purchases fuel only for the contractors that
provide ADA Paratransit service using Pace‐owned
vehicles in the suburban service area. These fuel
expenses are projected to grow by 8.5% to $2.8
million in 2019 due to growth in service and an
assumed increase in fuel price to $2.42 per gallon.
Operating Revenues7.6%
Sales Tax II and PTF II87.9%
Additional State
Funding4.5%
2019 REVENUES: $187.2 MILLION
Labor/Fringes2.3%
Health Insurance
0.5%
Admin Expenses2.2%
Fuel1.5%
Insurance0.2%RTA
Certification Trips1.0%
Purchased Transportation
87.5%
Regional ADA Support Allocation
4.9%
2019 EXPENSES: $187.2 MILLION
$1.88$2.26 $2.42
$2.83$3.07
$1.00
$2.00
$3.00
$4.00
2017 2018 2019 2020 2021
FUEL PRICE PER GALLON
34

2019 PROPOSED OPERATING BUDGET & CAPITAL PROGRAM
RTAChicago.org
Cost efficiency is shown below by the measure cost
per vehicle revenue mile, which is projected to
increase by an average of 4.6% per year from 2017
to 2021 as contractor price increases occur on top
of growth in service to meet demand. Cost
effectiveness, shown below as cost per passenger
trip, is projected to increase by an average of 3.1%
per year as expenses grow faster than ridership.
Net Result and Recovery Ratio
As shown in Table 14, the Regional ADA Paratransit
operating budget is balanced in 2019, 2020, and
2021, with revenues equal to expenditures,
producing a net result of zero in each year.
Pace’s 2019 through 2021 recovery ratios,
calculated by dividing total operating revenue by
total operating expenditures, with approved
adjustments, meet the statutory requirement of
10%. Pace’s capital cost of contracting expense
exclusion of $45.1 million in 2019 recognizes that a
portion of Pace’s purchased transportation expense
represents payment to ADA Paratransit contractors
for their capital investments, rather than operating
expenses.
$40.95 $40.84 $43.19 $44.80 $46.25
$6.08 $6.32 $6.68 $6.99 $7.27
$0$10$20$30$40$50
2017 2018 2019 2020 2021
COST EFFICIENCY AND EFFECTIVENESS
Cost Per Passenger Trip Cost Per Vehicle Revenue Mile
35

2019 PROPOSED OPERATING BUDGET & CAPITAL PROGRAM
RTAChicago.org
TABLE 14: PACE REGIONAL ADA PARATRANSIT 2019 BUDGET AND 2020‐2021 FINANCIAL PLAN (DOLLARS IN THOUSANDS)
2017 2018 2019 2020 2021
Actual Estimate Budget Plan Plan
Revenues
Operating Revenues
Passenger Revenue 10,933 11,984 12,109 12,235 12,364
Other Revenue 1
2,120 1,994 2,106 2,214 2,312
Total Operating Revenues $13,053 $13,978 $14,215 $14,449 $14,676
Public Funding
Sales Tax II and PTF II 152,086 156,791 164,631 173,335 181,617
RTA ADA Paratransit Reserve 5,328 ‐ ‐ ‐ ‐
Additional State Funding 3,825 7,975 8,395 8,500 8,500
Total Public Funding $161,239 $164,766 $173,026 $181,835 $190,117
Total Revenues $174,292 $178,744 $187,241 $196,284 $204,793
Expenses
Labor/Fringes 3,546 3,931 4,251 4,378 4,508
Health Insurance 572 846 889 934 982
Admin Expenses 2,674 3,175 4,190 3,496 3,582
Fuel 2,177 2,543 2,759 3,262 3,580
Insurance 195 267 350 358 367
RTA Certification Trips 1,740 1,688 1,790 1,889 1,979
Purchased Transportation 156,680 155,075 163,927 172,609 180,156
Regional ADA Support Allocation 2
6,708 7,686 9,085 9,358 9,639
Total Expenses $174,292 $175,211 $187,241 $196,284 $204,793
Net Result $0 $3,533 $0 $0 $0
Recovery Ratio 10.0% 10.0% 10.0% 10.0% 10.0%
1 Includes investment income and reimbursements for RTA certification trips.
2 Accounts for work done by other Pace departments in support of ADA Paratransit activities.
36

2019 PROPOSED OPERATING BUDGET & CAPITAL PROGRAM
RTAChicago.org
RTA Agency Overview The Regional Transportation Authority (RTA) is the
oversight, funding and regional planning agency for
the three Service Boards: Chicago Transit Authority
(CTA) bus and rail, Metra Commuter Rail, and Pace
Suburban Service and Regional ADA Paratransit.
The RTA’s primary source of operating funding is a
regional sales tax which is matched by the State of
Illinois via the Public Transportation Fund (PTF).
Most of the RTA sales tax collections and PTF pass
directly through the RTA to the CTA, Metra, and Pace
according to pre‐determined, statutory formulas.
The remainder of the sales tax and PTF is distributed
at the direction of the RTA Board. A portion of this
funding covers the RTA agency administrative costs,
regional services and programs, and regional debt
service expense.
The 2019 Agency operating budget was developed in
two parts in order to continue the RTA’s support of
regional programs and services. First is the RTA
Agency Administration Budget, which includes the
core agency expenses for staff, facilities, information
technology, office services, and professional services
to support the funding, planning, and oversight
mission of the RTA.
Second is the RTA Regional Programs Budget, which
includes Regional Services provided directly to the
public by the RTA, such as ADA Certification, Mobility
Management Services, Travel Information, Customer
Service, and the Reduced Fare and Transit Benefit
Programs. The Regional Programs Budget also
includes all of the RTA’s grant‐funded projects, RTA‐
funded regional studies and initiatives, and regional
capital programs.
RTA Agency Administration Budget
In 2019, total Agency Administration operating
expenses of $17.7 million are 6.4% higher than the
2018 estimate due mostly to an information
technology infrastructure upgrade.
The 2019 Administration Budget of $17.7 million
accounts for 42.2% of RTA Agency expenses and is
32.8% below the 2019 administrative expense cap of
$26.3 million set by the RTA Act. Administration
expenses are expected to grow by 3.0% in both 2020
and 2021.
RTA Regional Programs Budget
In 2019, total Regional Programs revenue of $7.4
million is comprised of Regional Services Operating
Revenue of $0.8 million and federal grants for
Regional Projects totaling $6.7 million. The revenue
for Regional Projects is $6.5 million higher than the
2018 estimate because new Section 5310 federal
projects are funded and programmed in 2019.
Total Regional Programs expenses, the sum of the
Regional Services Operating Expense and the Grant
and RTA Funded Project Expenses, of $24.2 million
OPERATING OVERVIEW
37

2019 PROPOSED OPERATING BUDGET & CAPITAL PROGRAM
RTAChicago.org
comprise the remaining 57.8% of total RTA Agency
expenses. This amount is $6.7 million, or 37.9%,
higher than the 2018 estimate due to new Section
5310 projects. Within the Regional Programs budget,
Regional Services (customer‐focused operations)
expenses will increase by $0.7 million or 4.3% over
the 2018 estimate due to increased Purchased
Service expense of the mostly outsourced Mobility
Management Program.
The overall RTA Agency operating expense of $41.9
million is projected to be 22.6% higher than the 2018
estimate, primarily due to an increase in grant‐
funded program expense. In 2020 and 2021, Agency
Administrative and Regional Services expenses are
projected to grow by 3.0% in each year.
Public Funding
As shown in Table 15, the combination of operating
revenue of $1.0 million, grants of $6.7 million, and
regional public funding of $34.2 million comprise
total Agency revenue and together balance the
overall RTA Agency operating budget expenses of
$41.9 million. In 2019, the total budgeted public
funding from regional sales tax is $34.2 million, 3.0%
higher than the 2018 forecast. Regional public
funding in 2019 represents 81.6% of total Agency
funding.
Sales Tax I81.6%
Agency Operating Revenue2.5%Federal
Grants15.9%
2019 REVENUES: $41.9 MILLIONAdmin42.2%
Regional Services40.7%
Grant and RTA Funded Projects
17.2%
2019 EXPENSES: $41.9 MILLION
38

2019 PROPOSED OPERATING BUDGET & CAPITAL PROGRAM
RTAChicago.org
TABLE 15: RTA AGENCY 2019 BUDGET AND 2020‐2021 FINANCIAL PLAN (DOLLARS IN THOUSANDS)
2017 2018 2019 2020 2021
Actual Estimate Budget Plan Plan
Revenues
Operating Revenue
Administrative Operating Revenue 1
4,700 ‐ 260 ‐ ‐
Regional Services Operating Revenue 853 760 778 801 825
Total Operating Revenue $5,553 $760 $1,038 $801 $825
Public Funding
Federal Grants 4,933 200 6,650 3,425 3,527
Sales Tax I 33,068 33,190 34,186 35,212 36,268
Total Public Funding $38,001 $33,390 $40,836 $38,636 $39,795
Total Revenues $43,554 $34,150 $41,873 $39,437 $40,620
Expenses
Administrative Operating Expenses 2
19,964 16,596 17,657 18,187 18,733
Regional Services Operating Expenses 17,120 16,325 17,029 17,540 18,066
Grant and RTA Funded Multi Year Project Expenses 6,470 1,230 7,187 3,710 3,822
Total Expenses $43,554 $34,150 $41,873 $39,437 $40,620
Net Result $0 $0 $0 $0 $0
1 2017 includes settlement fee from the sales tax litigation.
2 2017 includes additional amounts that were set aside for pension contributions.
39

2019 PROPOSED OPERATING BUDGET & CAPITAL PROGRAM
RTAChicago.org
The RTA’s portion of the proposed 2019‐2023 Capital
Program totals $250 thousand and includes the
following initiative to renew the system and improve
service:
In 2019 RTA Planning staff will continue to
oversee the Access to Transit Program. RTA
funding of $250 thousand will support small
pedestrian and bicycle infrastructure
improvement projects such as sidewalks and
crosswalks. RTA funding will leverage
federal CMAQ funding.
Project & Title 2019 2020 2021 2022 2023 TOTALStations & Passenger Facilities
Access to Transit Program 250 0 0 0 0 250
Subtotal Stations & Passenger Facilities 250 0 0 0 0 250
RTA Total 250 0 0 0 0 250
TABLE 16: RTA AGENCY FIVE‐YEAR CAPITAL PROGRAM (DOLLARS IN THOUSANDS)
CAPITAL PROGRAM
40


175 West Jackson Boulevard, Suite 1650 Chicago, Illinois 60604
Phone: 312-913-3200
RTAChicago.org
Follow us on
Chicago Transit Authority567 W. Lake St.Chicago, IL 60661888-968-7282www.transitchicago.com
Metra547 W. Jackson Blvd.Chicago, IL 60661312-322-6777www.metrarail.com
Pace550 W. Algonquin Rd.Arlington Heights, IL 60005847-364-7223www.pacebus.com