Proposal to Measure Hadron Scattering with a Gaseous High ... · SPSC-P-355 25/09/2017 Proposal to...
21
CERN-SPSC-2017-030 / SPSC-P-355 25/09/2017 Proposal to Measure Hadron Scattering with a Gaseous High Pressure TPC for Neutrino Oscillation Measurements C. Andreopoulos 25 , G. Barker 30 , S. Bolognesi 10 , S. Bordoni 1 , S. Boyd 30 , D. Brailsford 13 , S. Brice 3 , G. Catanesi 8 , Z. Chen-Wishart 16 , P. Denner 30 , P. Dunne 4 , C. Giganti 12 , D. Gonzalez Diaz 6 , J. Haigh 30 , P. Hamacher-Baumann 17 , S.-P. Hallsjö 24 , Y. Hayato 28 , A. Ichikawa 11 , I. Irastorza 33 , B. Jamieson 31 , P. Jonsson 4 , A. Kaboth 16 , A. Korzenev 22 , Yu. Kudenko 9 , M. Leyton 18 , R.P. Litchfield 4 , K.-B. Luk 20 , W. Ma 4 , K.B.M. Mahn 14 , M. Martini 2 , N. McCauley 25 , P. Mermod 22 , J. Monroe (P.I.) 16 , U. Mosel 23 , R. Nichol 21 , J. Nieves 5 , T. Nonnenmacher 4 , J. Nowak 13 , W. Parker 16 , J.L. Raaf 3 , J. Rademacker 19 , T. Radermacher 17 , E. Radicioni 8 , E. Rondio 15 , S. Roth 17 , R. Saakyan 21 , F. Sanchez 18 , D. Sgalaberna 22 , Y. Shitov 4 , J. Sobczyk 32 , F.J.P. Soler 24 , A. Sztuc 4 , C. Touramanis 25 , Y. Uchida 4 , S. Valder 30 , J. Walding 16 , M. Ward 16 , M.O. Wascko 4 , A. Weber 26 , C.V.C. Wret 4 , M. Yokoyama 27 , A. Zalewska 7 , M. Ziembicki 34 , and M. Zito 10 1 CERN, European Organization for Nuclear Research, Switzerland 2 ESNT, CEA, IRFU, Université de Paris-Saclay, France 3 Fermi National Accelerator Laboratory, USA 4 Imperial College London, UK 5 Instituto de Fisica Corpuscular, Univ. Valencia - C.S.I.C, Spain 6 IFGAE, University of Santiago de Compostela, Spain 7 IFJ PAN, Krakow, Poland 8 INFN Bari, Italy 9 Institute for Nuclear Research (INR), Russia 10 IRFU, CEA Saclay, France 11 Kyoto University, Japan 12 LPNHE, Paris, France 13 Lancaster University, UK 14 Michigan State University, USA 15 NCBJ, Warsaw, Poland 16 Royal Holloway, University of London, UK 17 RWTH, Aachen, Germany 18 Universitat Autonoma de Barcelona Institut de Fisica d’Altes Energies, Spain 19 University of Bristol, UK 20 University of California, Berkeley, USA 21 University College London, UK 22 University of Geneva, Switzerland 23 University of Giessen, Germany 24 University of Glasgow, UK 25 University of Liverpool,UK 26 University of Oxford, UK 27 University of Tokyo, Japan 28 University of Tokyo Institute for Cosmic Ray Research, Japan 29 University of Warsaw, Poland 30 University of Warwick, UK 31 University of Winnipeg, Canada 1
Transcript of Proposal to Measure Hadron Scattering with a Gaseous High ... · SPSC-P-355 25/09/2017 Proposal to...
CER
N-S
PSC
-201
7-03
0/
SPSC
-P-3
5525
/09/
2017
Proposal to Measure Hadron Scattering with a GaseousHigh Pressure TPC for Neutrino Oscillation Measurements
C.Andreopoulos25, G. Barker30, S. Bolognesi10, S. Bordoni1, S. Boyd30,D. Brailsford13, S. Brice3, G.Catanesi8, Z. Chen-Wishart16, P.Denner30, P.Dunne4,
C.Giganti12, D.Gonzalez Diaz6, J. Haigh30, P.Hamacher-Baumann17,S.-P.Hallsjö24, Y.Hayato28, A. Ichikawa11, I. Irastorza33, B. Jamieson31, P. Jonsson4,
A.Kaboth16, A.Korzenev22, Yu.Kudenko9, M. Leyton18, R.P. Litchfield4,K.-B. Luk20, W.Ma4, K.B.M.Mahn14, M.Martini2, N.McCauley25, P.Mermod22,
J.Monroe (P.I.)16, U.Mosel23, R.Nichol21, J. Nieves5, T.Nonnenmacher4,J. Nowak13, W.Parker16, J.L.Raaf3, J. Rademacker19, T.Radermacher17,
E.Radicioni8, E. Rondio15, S. Roth17, R. Saakyan21, F. Sanchez18, D. Sgalaberna22,Y. Shitov4, J. Sobczyk32, F.J.P. Soler24, A. Sztuc4, C. Touramanis25, Y.Uchida4,S. Valder30, J.Walding16, M.Ward16, M.O.Wascko4, A.Weber26, C.V.C.Wret4,
M.Yokoyama27, A. Zalewska7, M. Ziembicki34, and M. Zito10
1CERN, European Organization for Nuclear Research, Switzerland2ESNT, CEA, IRFU, Université de Paris-Saclay, France
3Fermi National Accelerator Laboratory, USA4Imperial College London, UK
5Instituto de Fisica Corpuscular, Univ. Valencia - C.S.I.C, Spain6IFGAE, University of Santiago de Compostela, Spain
7IFJ PAN, Krakow, Poland8INFN Bari, Italy
9Institute for Nuclear Research (INR), Russia10IRFU, CEA Saclay, France11Kyoto University, Japan12LPNHE, Paris, France
13Lancaster University, UK14Michigan State University, USA
15NCBJ, Warsaw, Poland16Royal Holloway, University of London, UK
17RWTH, Aachen, Germany18Universitat Autonoma de Barcelona Institut de Fisica d’Altes Energies, Spain
19University of Bristol, UK20University of California, Berkeley, USA
21University College London, UK22University of Geneva, Switzerland23University of Giessen, Germany
24University of Glasgow, UK25University of Liverpool,UK26University of Oxford, UK27University of Tokyo, Japan
28University of Tokyo Institute for Cosmic Ray Research, Japan29University of Warsaw, Poland30University of Warwick, UK
31University of Winnipeg, Canada
1

32University of Wroclaw, Poland33University of Zaragoza, Spain
34Warsaw University of Technology, Poland
September 20, 2017
2
1 Executive SummaryWe propose to perform new measurements of proton and pion scattering on Ar using a prototypeHigh Pressure gas Time Projection Chamber (HPTPC) detector, and by doing so to develop thephysics case for, and the technological readiness of, an HPTPC as a neutrino detector for ac-celerator neutrino oscillation searches. The motivation for this work is to improve knowledge offinal state interactions, in order to ultimately achieve 1-2% systematic error on neutrino-nucleusscattering for oscillation measurements at 0.6 GeV and 2.5 GeV neutrino energy, as required forthe Charge-Parity (CP) violation sensitivity projections by the Hyper-Kamiokande experiment(Hyper-K) and the Deep Underground Neutrino Experiment (DUNE). The final state interactionuncertainties in neutrino-nucleus interactions dominate cross-section systematic errors, currently5–10% at these energies, and therefore R&D is needed to explore new approaches to achieve thissubstantial improvement. The proponents of this proposal are a consortium of detector develop-ment specialists and neutrino physicists collaborating on DUNE and Hyper-K. Many are authorsof the Neutrino EOI submitted to the SPSC in early 2017 (SPSC-EOI-015); HPTPC developmentis a work package (WP9) within that framework.
Objectives
The motivation of this proposal is to develop the physics case, and begin conceptual design, for aneutrino detector that can achieve the unprecedentedly low neutrino-nucleus scattering systematicuncertainties needed for the search for CP violation in neutrinos. The specific objectives are to:
1. characterize the performance of an HPTPC prototype, with respect to track-finding, mo-mentum threshold, angular and momentum resolution, proton vs. pion separation, andinteraction multiplicity measurements;
2. measure proton-argon and pion-argon scattering cross-sections in the range of energies rele-vant for neutrino-nucleus interactions in DUNE and Hyper-K; and,
3. tune the NEUT and GENIE neutrino generators with new p-Ar data, and new π-Ar data, andthen perform neutrino oscillation studies to assess the feasibility of achieving 2% systematicuncertainties.
Scientific Context
HPTPC detectors are an area of growing international interest. Both Hyper-K and DUNE haveworking groups on HPTPC detectors, the Tokai-to-Kamioka experiment (T2K) is exploring anHPTPC as a near detector upgrade, and European groups have held a series of workshops onHPTPC development over the last five years. In particular, two workshops in the past year hostedat CERN have featured HPTPC working group sessions. Given the recent indication of non-zeroCP violation in the T2K data [1], it is timely to quantify the potential impact of HPTPC neutrinodetector technology on mitigation of the dominant neutrino-interaction cross-section uncertaintiesfor the future Long-BaseLine (LBL) programme.
HPTPCs will open a new window in neutrino scattering physics because this technique lowersthe energy threshold for particle detection by an order of magnitude over current liquid argon andwater Cherenkov detectors. This low energy region has the greatest sensitivity to resolve finalstate interaction model discrepancies, and therefore an HPTPC has unique capability to addressthe driving systematic uncertainty in neutrino cross-sections. At the end of this project the teamwill be in a position to quantitatively assess the physics potential of an HPTPC as a LBL neutrinooscillation near detector to achieve the neutrino interaction systematic uncertainty goals. This ishighly relevant for both DUNE and Hyper-K: the Co-Invesigators on this proposal collaborate onboth projects.
Beam Time Request
We request 28 days of beam time in 2018 in the East Area, preferably in T10 but also possiblyin T9. We base this beam request on commissioning measurements of the low-momentum fluxesin T9 and T10 made in 2016, summarized in Section 3, implemented into a GEANT4 simulationof the HPTPC prototype detector, described in Section 4. The beam time request estimate isjustified in Section 5.1.
3

Proton Kinetic Energy (MeV)50 100 150 200 250R
eact
ion
Cro
ss S
ectio
n (m
b)
0
200
400
600
800
1000 ArgonNeonFluorineOxygenCarbonHelium-4
ArgonNeonFluorineOxygenCarbonHelium-4
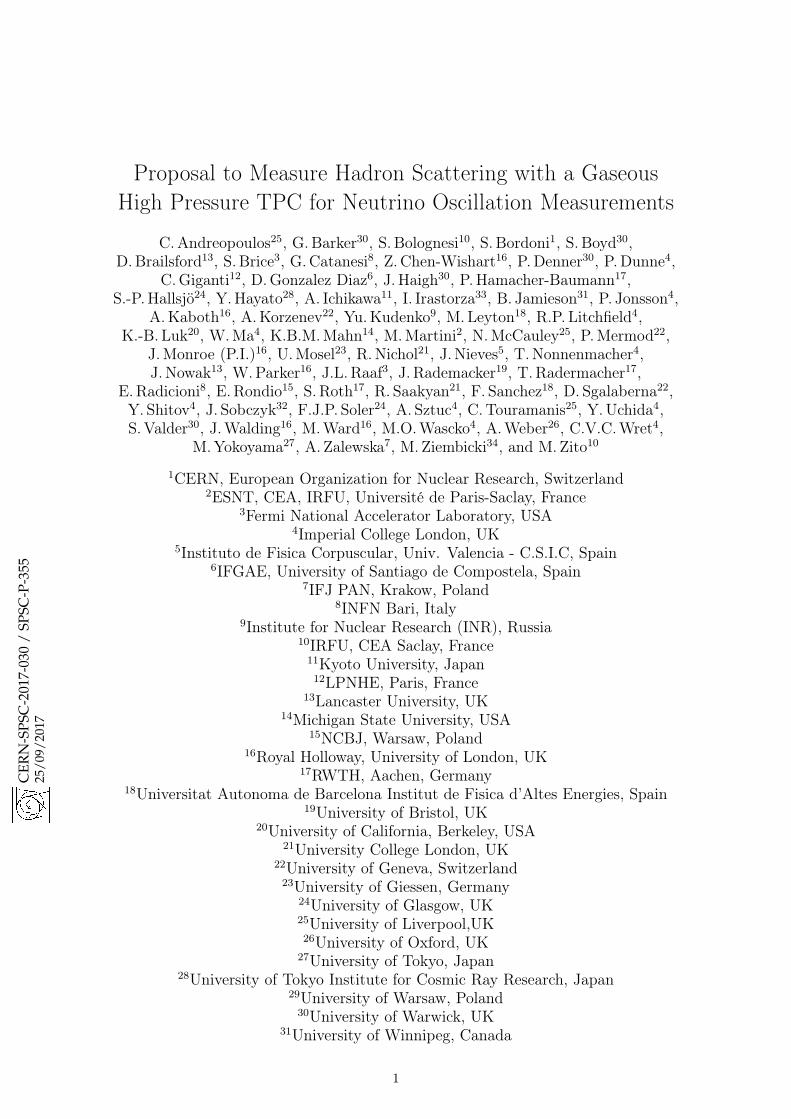
Figure 1: Total reaction cross-sections for protons on argon, neon, fluorine, oxygen, carbon, andhelium-4. Data is shown against a semi-empirical model from Wellisch and Axen [2].
2 ContextThe physics motivation for the R&D we propose is the search for CP violation and determinationof the pattern of neutrino masses (mass hierarchy). These are among the most fundamental openquestions in physics today.
2.1 Physics Motivation—The Search for CP Violation in NeutrinosThe major global effort in neutrino physics aims to understand why we live in a matter-dominateduniverse. CP symmetry violation in the neutrino sector is one of the few remaining possibilitiesto be explored experimentally. CP violation searches compare the rates of νµ → νe and ν̄µ → ν̄eoscillation, which, in the absence of CP violation, should be equal. To convert the measured rateof interactions to a level of CP violation, experiments must accurately know the cross-section forthe interaction with the detector of both neutrinos and antineutrinos. Therefore, systematic un-certainties on cross-sections are a key input to such CP violation searches. These cross-sections aredependent on theoretical models because the target nucleon resides in a complicated nucleus, andthe nuclear model has dramatic effects on the measured final-state particle kinematic distributions.
The current world’s best accelerator neutrino oscillation experiment, T2K, reports neutrino in-teraction systematic uncertainties at the 5-7% level [3]. The future DUNE and Hyper-K projectsassume systematic errors at the 1-2% level to achieve their physics goals, but will be in the sameposition as current experiments if the nuclear-model uncertainties are not reduced. The key toreducing these uncertainties is to measure precisely the multiplicity and momentum distribution offinal-state particles [4]. These kinematic distributions are shaped by Final State Interactions (FSI)of the recoiling secondary particles as they leave the target nucleus. The most commonly usedneutrino generator Monte Carlos, NEUT and GENIE, simulate FSI with cascade models that aretuned with external hadron-nucleus scattering measurements. However, as shown in Fig. 1, theseproton-nucleus (and pion-nucleus) scattering measurements are extremely sparse and in manycases do not exist in the relevant momentum region and/or on the relevant nuclei. Thereforesemi-empirical parameterisations are used to extrapolate in momentum and atomic mass. Theseparametrisations are different between NEUT and GENIE, and yield order-of-magnitude scale dif-ferences in the predicted multiplicity and kinematics of final state protons. The proton final statemodeling is key for neutrino oscillation measurements because it affects the event selection andneutrino energy reconstruction. For these reasons, FSI effects represent a dominant contributionto the total neutrino interaction systematic uncertainty [3].
Gas TPCs are ideal for precisely characterizing FSI effects because of their high track recon-
4
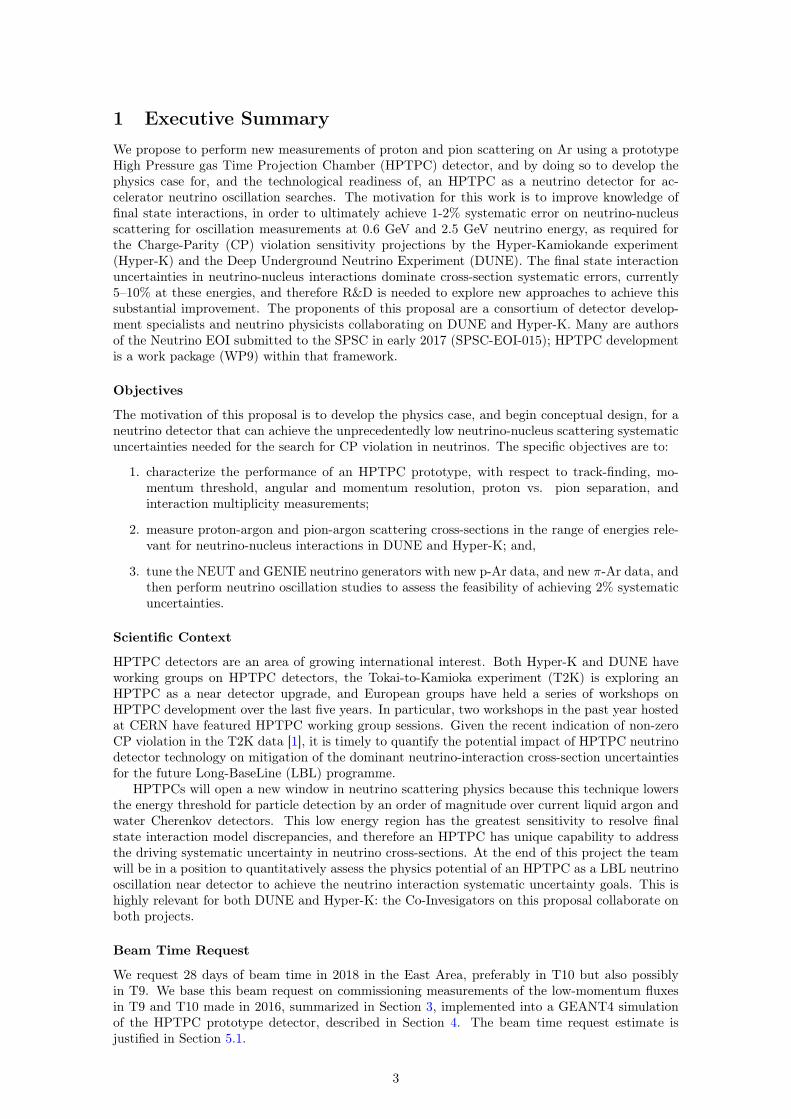
(a) Proton multiplicity. (b) Momentum of protons exiting the nucleus.
Figure 2: Predictions from the NEUT (blue) and GENIE (orange) neutrino interaction generatorsof νµ CC interactions on argon in the T2K beam.
struction efficiency, low momentum threshold and 4π angular coverage of final state particles, whichare all key to distinguishing between models. Fig. 2 shows the proton multiplicity and momentumdistributions for νµ Charged Current (CC) interactions on argon calculated by the NEUT andGENIE neutrino generators. These distributions are highly discrepant, particularly in the fractionof events with few ejected protons, and at low proton momentum, below 250 MeV/c. This is belowthe proton detection threshold in water Cherenkov detectors (1100 MeV/c) and below that of liquidargon TPCs, around 400 MeV/c [5].
In the HPTPC we propose to prototype, the threshold for a well-reconstructed proton in argonat 5 (10) bar is 53 MeV/c (68 MeV/c) (Section 4.1), and therefore such a detector could probe thediscrepant low-momentum region of parameter space in addition to covering the momentum rangeabove 310 MeV/c (50 MeV kinetic energy) where no measurements exist (Fig. 1). This measure-ment range is highly complementary to what can be learned from the liquid argon ProtoDUNEbeam tests.
2.2 Current State of Proton Scattering MeasurementsThe current state of proton-nucleus cross-sections is described in [6, 7], with data from protons inthe range of 10 MeV–20 GeV on a broad range of nuclei interesting for neutrino interactions. Themeasurements on argon are shown in Fig. 1. The extant data comprise five points in the protonkinetic energy range of 23–47 MeV, with approximately 7% measurement uncertainty. Thesemeasurements were made using a thin gas target in a beam at the University of Manitoba [8]. Thelimited range of data available to constrain FSI models is a major contributor to the discrepancybetween model predictions, shown in Fig. 2.
This lack of data is a promising opening for even a small prototype HPTPC to make competitiveand useful measurements of proton-nucleus scattering in order to demonstrate the potential forHPTPC near detectors. We have built a prototype HPTPC, and propose to deploy it in T10 tomeasure the proton-Ar total scattering cross-section and, statistics permitting, differential cross-section in final state proton momentum. As discussed in Section 2.1, the small prototype we havebuilt can populate a region with no existing measurements of protons on argon (between 50 MeVand 1 GeV). This is particularly interesting given the importance of argon to the future neutrinoprogram and the significant disagreement between the argon data in Fig. 1 with models, discussedin [7].
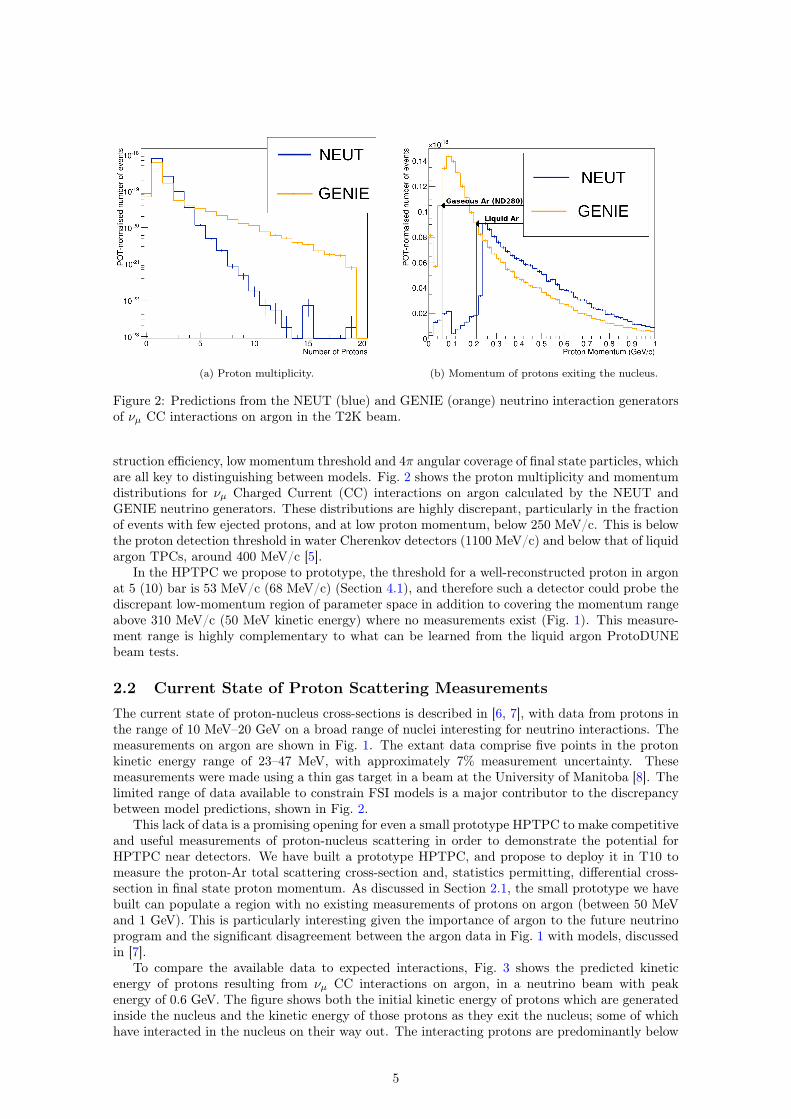
To compare the available data to expected interactions, Fig. 3 shows the predicted kineticenergy of protons resulting from νµ CC interactions on argon, in a neutrino beam with peakenergy of 0.6 GeV. The figure shows both the initial kinetic energy of protons which are generatedinside the nucleus and the kinetic energy of those protons as they exit the nucleus; some of whichhave interacted in the nucleus on their way out. The interacting protons are predominantly below
5
Figure 3: Predicted proton kinetic energy distributions from GENIE for 600 MeV νµ CC interac-tions on argon before (blue) and after (red) final state interactions (FSI).
0.2 GeV kinetic energy, but with a long tail that stretches beyond 1 GeV kinetic energy.In the beam test with the prototype HPTPC, we propose to measure initial proton momenta
between 0.2-1 GeV/c (or 0.02-0.4 GeV kinetic energy, sampling the peak of the blue curve in Fig. 3).There is also a need for measurements on other nuclear targets. Fig. 1 shows the total reaction
cross-section data on other elements, including helium, fluorine, and oxygen. There is only onemeasurement for each nucleus, over a limited energy range (above 20 MeV kinetic energy forprotons, or 195 MeV/c). These nuclei are of interest as they are appropriate TPC gases for studyingthe A-scaling of neutrino interactions, used for e.g. extrapolating near detector measurements onargon to predict interaction rates on Oxygen in a far detector, as at T2K.
We propose to measure proton and pion cross-sections on argon in a 28 day run, and if timeor parasitic running permit we would like to take an additional 2 weeks of data on Ne and CF4,in order to span a range of targets from light (which is well studied, in particular for carbon) torelatively heavy (argon). We also choose these targets in order to have a calibration point relativeto previous measurements. Given the readout electronics sampling rate and drift velocities, theprototype detector can measure final state particles in these target species by replacing the targetgas, without changing the TPC internals or the readout.
As discussed in Section 2.1, the proton measurement is of primary importance however the piondata are also very interesting—the extant measurements for pion-nucleus scattering are similarlysparse as for protons [9], although the LARIAT experiment is currently making measurements withpions in this range. We propose a run plan tuned for measuring the proton cross-sections, but thepion measurement data will be collected simultaneously with the proton measurements.
3 Low Momentum Beam Flux in T9 and T10To assess the feasibility of studying proton scattering in the range of interest for neutrino oscillationexperiments (Fig. 3), measurements of the beam flux below 1 GeV/c were made in Summer 2016on the T9 and T10 beamlines.
3.1 Time of Flight MeasurementThe apparatus deployed to measure the flux is based on the Time Of Flight (TOF) system developedfor the T2K experiment sub-detector commissioning runs in T9 in 2009. The system consists of twostations positioned at separated locations in the path of the beam. Fig. 4a shows the upstreamTOF paddle in position in the T9 beamline. Each station has a small bar of fast scintillator,
6

(a) Upstream TOF station in T9.
TDC chan600 700 800 900 1000 1100 1200 1300 1400
Counts
0
50
100
150
200
250
300
350
TDC spectrum
intensity ratio =0.22 (4948 / 22257)+πp/
0.16 (FWHM = 8.55 %)± = 26.10 σ +π
0.35 (FWHM = 6.50 %)± = 27.96 σp
ratio = 0.76 σ +πp/
0.18± peak position = 821.87 +π
0.44±p peak position = 1115.40
(b) Example of TOF spectra accumulated during a single run.
Figure 4: Components of the TOF measurement system, each station consisting of a cuboidal blockof plastic scintillator coupled to PMT whose endcap is held in place with a tripod. Resulting TOFspectra in panel (b) show background-subtracted, fully separated peaks of pions/muons (left) andprotons (right), fitted with Gaussian functions to estimate the yield in each peak.
connected to a fast PhotoMultiplier Tube (PMT) by a short light guide. A new DAQ system wasdeveloped to read out the PMTs, comprising a simple trigger/veto system implemented using NIMmodules, a FAST ComTec 7072T TADC (used as a Time to Digital Converter), and a NationalInstruments PXIe unit running a LabView-based DAQ program and containing a Digital I/Omodule for communication with the TDC.
A raw measured TOF spectrum in the T10 beam is shown in Fig. 4b. Although the DAQsystem was capable of sub-ns resolution, the system performance was limited by PMT timing toaround 25 ns, which is still sufficient for proton and pion peaks to be well-separated at the momentastudied.
3.1.1 Analysis Procedure
Approximately 150 data runs were collected with an accumulated beam exposure of ∼30 hours.Run exposures varied between 240 and 3600 seconds depending on the experimental conditions,e.g. beam momentum, collimator setting, etc.
The raw data files contain the TOF digitized spectra. At beam momenta ≤ 1 GeV/c, the peaksof the protons and pions are completely separated. The intensities of the pion and proton particlepeaks is calculated from the raw TDC spectra at the first stage of data processing. The peakintensity estimate is then refined after background subtraction; an example spectrum is shown inFig. 4b. The background level was determined from the TOF spectrum outside the peak regions.
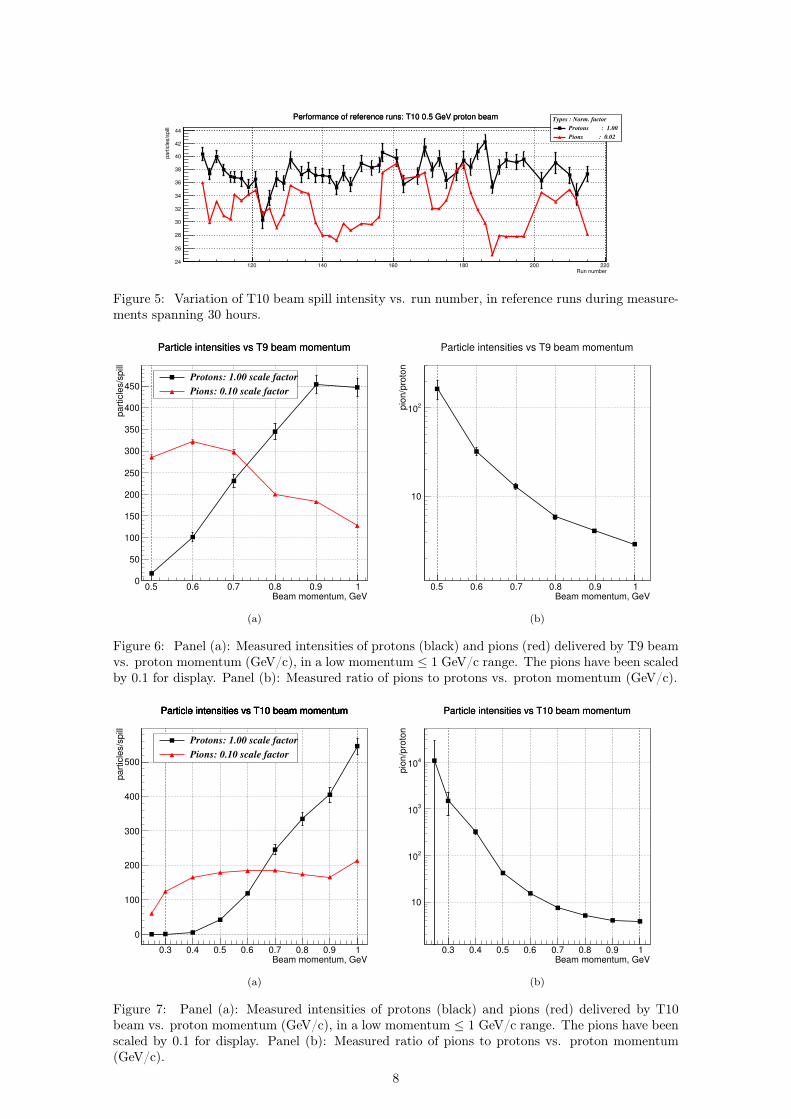
The intensity of protons varies from spill to spill. To measure this effect, beam set at 0.5 GeVwith the standard collimator settings (14 mm× 14 mm) was designated as the reference run, anddata were taken in this configuration before the start of each data run. The reference runs are usedto calibrate for variations vs. time in the number of particles delivered per spill, shown in Fig. 5.
The intensity of protons also varies within each spill, and so we measure the deadtime of theTOF system DAQ as a function of time since start-of-spill. A 1-5% correction is applied for thetime-dependent deadtime within each spill. We measured the deadtime vs. spill time at severalpoints throughout the total data run and found minimal variation, and therefore one correction isderived and applied to all spills.
3.1.2 Results
The yield of protons and pions was measured in a set of runs with beammomenta in the [0.25,1.0] GeV/crange. The number of particles per spill for pions and protons, after spill intensity variation, back-ground subtraction and deadtime corrections, are shown for T9 and T10 in Figs. 6 and Fig. 7respectively.
7
Run number120 140 160 180 200 220
pa
rtic
les/s
pill
24
26
28
30
32
34
36
38
40
42
44
Performance of reference runs: T10 0.5 GeV proton beamPerformance of reference runs: T10 0.5 GeV proton beam Types : Norm. factor
Protons : 1.00
Pions : 0.02
Figure 5: Variation of T10 beam spill intensity vs. run number, in reference runs during measure-ments spanning 30 hours.
0.5 0.6 0.7 0.8 0.9 1 Beam momentum, GeV
0
50
100
150
200
250
300
350
400
450
pa
rtic
les/s
pill
Particle intensities vs T9 beam momentumParticle intensities vs T9 beam momentum
Protons: 1.00 scale factor
Pions: 0.10 scale factor
(a)
0.5 0.6 0.7 0.8 0.9 1 Beam momentum, GeV
10
210 p
ion
/pro
ton
Particle intensities vs T9 beam momentum
(b)
Figure 6: Panel (a): Measured intensities of protons (black) and pions (red) delivered by T9 beamvs. proton momentum (GeV/c), in a low momentum ≤ 1 GeV/c range. The pions have been scaledby 0.1 for display. Panel (b): Measured ratio of pions to protons vs. proton momentum (GeV/c).
0.3 0.4 0.5 0.6 0.7 0.8 0.9 1 Beam momentum, GeV
0
100
200
300
400
500
pa
rtic
les/s
pill
Particle intensities vs T10 beam momentumParticle intensities vs T10 beam momentumParticle intensities vs T10 beam momentumParticle intensities vs T10 beam momentum
Protons: 1.00 scale factor
Pions: 0.10 scale factor
(a)
0.3 0.4 0.5 0.6 0.7 0.8 0.9 1 Beam momentum, GeV
10
210
310
410
pio
n/p
roto
n
Particle intensities vs T10 beam momentumParticle intensities vs T10 beam momentum
(b)
Figure 7: Panel (a): Measured intensities of protons (black) and pions (red) delivered by T10beam vs. proton momentum (GeV/c), in a low momentum ≤ 1 GeV/c range. The pions have beenscaled by 0.1 for display. Panel (b): Measured ratio of pions to protons vs. proton momentum(GeV/c).
8
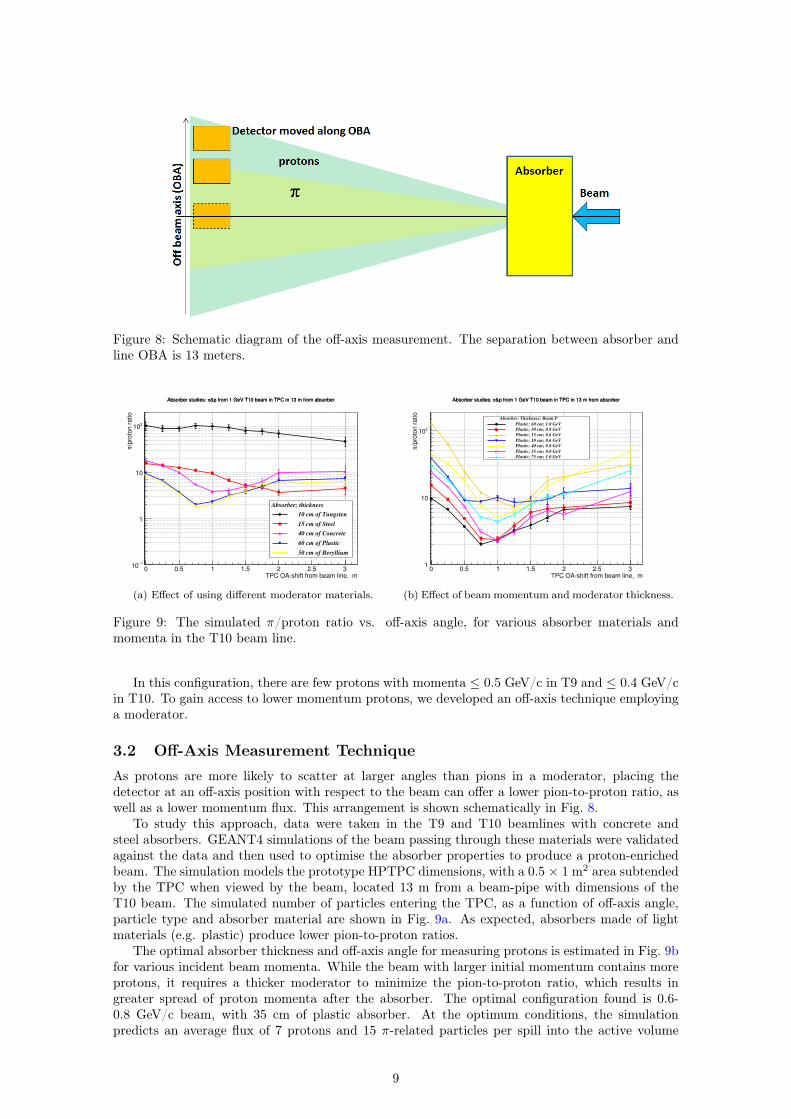
Figure 8: Schematic diagram of the off-axis measurement. The separation between absorber andline OBA is 13 meters.
TPC OAshift from beam line, m0 0.5 1 1.5 2 2.5 3
/pro
ton r
atio
π
1−10
1
10
210
&p from 1 GeV T10 beam in TPC in 13 m from absorberπAbsorber studies: &p from 1 GeV T10 beam in TPC in 13 m from absorberπAbsorber studies:
Absorber; thickness
10 cm of Tungsten
15 cm of Steel
40 cm of Concrete
60 cm of Plastic
50 cm of Beryllium
(a) Effect of using different moderator materials.
TPC OAshift from beam line, m0 0.5 1 1.5 2 2.5 3
/pro
ton r
atio
π
1
10
210
&p from 1 GeV T10 beam in TPC in 13 m from absorberπAbsorber studies: &p from 1 GeV T10 beam in TPC in 13 m from absorberπAbsorber studies:
Absorber; Thickness; Beam P
Plastic; 60 cm; 1.0 GeV
Plastic; 30 cm; 0.8 GeV
Plastic; 15 cm; 0.6 GeV
Plastic; 10 cm; 0.6 GeV
Plastic; 40 cm; 0.8 GeV
Plastic; 35 cm; 0.8 GeV
Plastic; 75 cm; 1.0 GeV
(b) Effect of beam momentum and moderator thickness.
Figure 9: The simulated π/proton ratio vs. off-axis angle, for various absorber materials andmomenta in the T10 beam line.
In this configuration, there are few protons with momenta ≤ 0.5 GeV/c in T9 and ≤ 0.4 GeV/cin T10. To gain access to lower momentum protons, we developed an off-axis technique employinga moderator.
3.2 Off-Axis Measurement TechniqueAs protons are more likely to scatter at larger angles than pions in a moderator, placing thedetector at an off-axis position with respect to the beam can offer a lower pion-to-proton ratio, aswell as a lower momentum flux. This arrangement is shown schematically in Fig. 8.
To study this approach, data were taken in the T9 and T10 beamlines with concrete andsteel absorbers. GEANT4 simulations of the beam passing through these materials were validatedagainst the data and then used to optimise the absorber properties to produce a proton-enrichedbeam. The simulation models the prototype HPTPC dimensions, with a 0.5 × 1 m2 area subtendedby the TPC when viewed by the beam, located 13 m from a beam-pipe with dimensions of theT10 beam. The simulated number of particles entering the TPC, as a function of off-axis angle,particle type and absorber material are shown in Fig. 9a. As expected, absorbers made of lightmaterials (e.g. plastic) produce lower pion-to-proton ratios.
The optimal absorber thickness and off-axis angle for measuring protons is estimated in Fig. 9bfor various incident beam momenta. While the beam with larger initial momentum contains moreprotons, it requires a thicker moderator to minimize the pion-to-proton ratio, which results ingreater spread of proton momenta after the absorber. The optimal configuration found is 0.6-0.8 GeV/c beam, with 35 cm of plastic absorber. At the optimum conditions, the simulationpredicts an average flux of 7 protons and 15 π-related particles per spill into the active volume
9
OffBeam TPC axis, cm25− 20− 15− 10− 5− 0 5 10 15 20 25
Rate
, per
spill
0
0.05
0.1
0.15
0.2
0.25
0.3
0.35
0.4
0.45
Particles
pions
protons
muons
Fluxes @ HP TPC, 0.8 GeV beam after 35 cm of PS
(a)
Particle momentum, GeV0 0.1 0.2 0.3 0.4 0.5 0.6 0.7 0.8 0.9 1
Rate
, per
spill
0
0.1
0.2
0.3
0.4
0.5
0.6
0.7
0.8
0.9 Particles
pions
protons
muons
Fluxes @ HP TPC, 0.8 GeV beam after 35 cm of PS
(b)
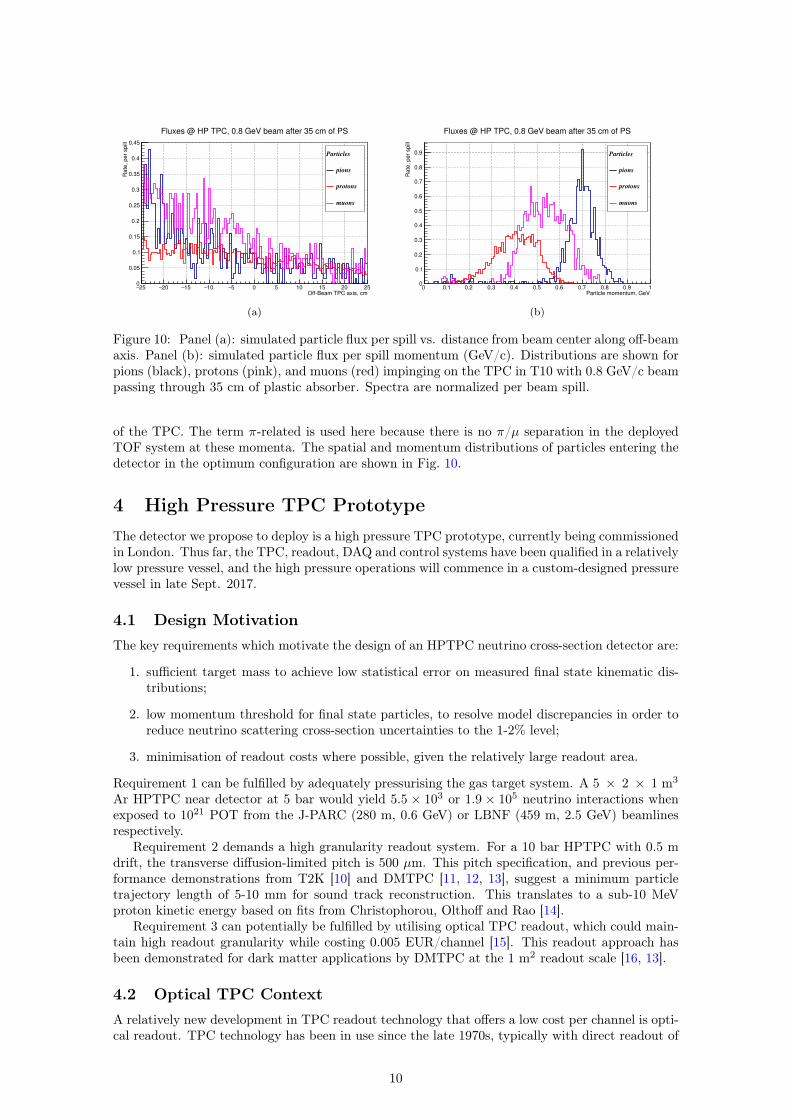
Figure 10: Panel (a): simulated particle flux per spill vs. distance from beam center along off-beamaxis. Panel (b): simulated particle flux per spill momentum (GeV/c). Distributions are shown forpions (black), protons (pink), and muons (red) impinging on the TPC in T10 with 0.8 GeV/c beampassing through 35 cm of plastic absorber. Spectra are normalized per beam spill.
of the TPC. The term π-related is used here because there is no π/µ separation in the deployedTOF system at these momenta. The spatial and momentum distributions of particles entering thedetector in the optimum configuration are shown in Fig. 10.
4 High Pressure TPC PrototypeThe detector we propose to deploy is a high pressure TPC prototype, currently being commissionedin London. Thus far, the TPC, readout, DAQ and control systems have been qualified in a relativelylow pressure vessel, and the high pressure operations will commence in a custom-designed pressurevessel in late Sept. 2017.
4.1 Design MotivationThe key requirements which motivate the design of an HPTPC neutrino cross-section detector are:
1. sufficient target mass to achieve low statistical error on measured final state kinematic dis-tributions;
2. low momentum threshold for final state particles, to resolve model discrepancies in order toreduce neutrino scattering cross-section uncertainties to the 1-2% level;
3. minimisation of readout costs where possible, given the relatively large readout area.
Requirement 1 can be fulfilled by adequately pressurising the gas target system. A 5 × 2 × 1 m3
Ar HPTPC near detector at 5 bar would yield 5.5 × 10³ or 1.9 × 10⁵ neutrino interactions whenexposed to 1021 POT from the J-PARC (280 m, 0.6 GeV) or LBNF (459 m, 2.5 GeV) beamlinesrespectively.
Requirement 2 demands a high granularity readout system. For a 10 bar HPTPC with 0.5 mdrift, the transverse diffusion-limited pitch is 500 µm. This pitch specification, and previous per-formance demonstrations from T2K [10] and DMTPC [11, 12, 13], suggest a minimum particletrajectory length of 5-10 mm for sound track reconstruction. This translates to a sub-10 MeVproton kinetic energy based on fits from Christophorou, Olthoff and Rao [14].
Requirement 3 can potentially be fulfilled by utilising optical TPC readout, which could main-tain high readout granularity while costing 0.005 EUR/channel [15]. This readout approach hasbeen demonstrated for dark matter applications by DMTPC at the 1 m2 readout scale [16, 13].
4.2 Optical TPC ContextA relatively new development in TPC readout technology that offers a low cost per channel is opti-cal readout. TPC technology has been in use since the late 1970s, typically with direct readout of
10

Figure 11: TPC schematic: a neutrino (dashed line) scatters a nuclear recoil that makes a trackof ionisation; liberated electrons (open circles) drift to the amplification region where avalanchesproduce scintillation photons.
the drifted charge. 2D optical readout of time projection chambers was first demonstrated in 1994and more recently has been developed by the DMTPC project for direction-sensitive dark mattersearches, by the O-TPC experiment for precision nuclear physics cross section measurements, andby the CERN gas detectors group for gamma detection. For a recent review, we refer the readerto [17].
An optical TPC is instrumented with a cathode, ground, and anode electrodes which define itssignal collection and amplification regions. Ionisation electrons from charged particles propagat-ing through the TPC move in the drift field to the amplification region where avalanche chargemultiplication and scintillation photon production occurs. In Ar gas with small (5%) admixture ofCF4, the scintillation photon yield in optical wavelengths is 0.1-0.3 per avalanche electron, and is aweak function of the reduced electric field. A schematic of how an optical TPC operates is shownin Fig. 11. The ground and anode electrodes can also be equipped with charge readout to providehigh resolution tracking in the drift direction. A CCD or CMOS camera views the amplificationplane through a lens from outside of the pressure vessel containing the TPC and target gas, col-lecting the scintillation light and subsequently providing tracking in the amplification plane. EachCCD pixel views an area of the amplification region which is larger than its pixel area, this opticalplate scale is defined by the object and image distances and the camera lens properties. The areaof the amplification plane which is viewed by a single physical pixel is called a vixel here, and thevixel size defines the detector’s readout pitch.
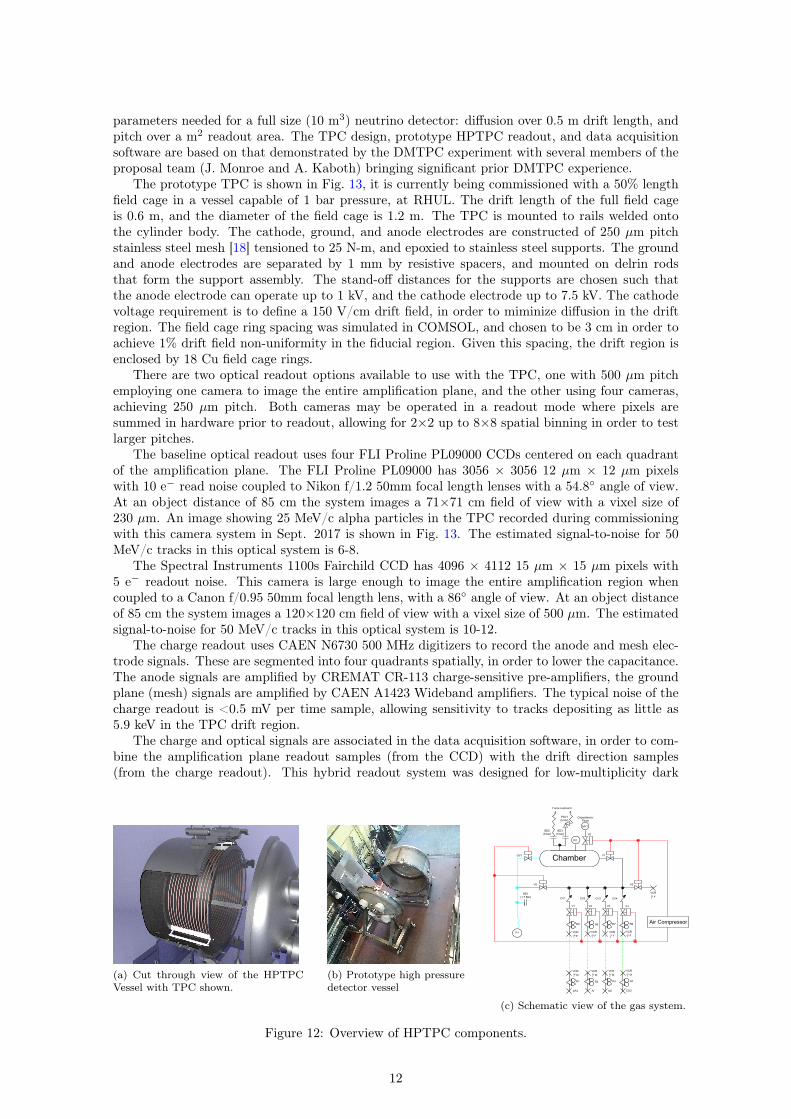
4.3 Prototype Detector SpecificationsThe prototype HPTPC pressure vessel is a 5 bar, CE code-stamped pressure vessel built by Cry-ovac, measuring approximately 0.7 m length × 1.3 m diameter. A schematic of the TPC inside thepressure vessel is shown in Fig. 12a. The vessel during construction is shown in Fig. 12b. Thesedimensions indicate the approximate footprint of the pressure vessel needed for the beam test. Thevessel is equipped with flanges for high voltage, gas and vacuum system connections, calibration,and optical and charge readout connections. The cylindrical section has ports for calibration anda specially constructed beam window flange with a small 2 mm thick Al window section.
The gas target handling system, shown schematically in Fig. 12a, is monitored by a Slow Con-trol (SC) computer via a pressure transducer. The SC controls bottle-to-vessel and pump-to-vesselsolenoid valves for pressure control. The SC system fills the pressure vessel from a gas bottle viaa mass flow controller up to 5 bar pressure. Prior to filling, the chamber can be evacuated to0.01 bar by a connected scroll pump in order to achieve required gas purity levels. There are twoindependent, redundant relief lines, each with a 5 bar burst disk.
We have built a prototype TPC with dimensions chosen to test the key track reconstruction
11
parameters needed for a full size (10 m3) neutrino detector: diffusion over 0.5 m drift length, andpitch over a m2 readout area. The TPC design, prototype HPTPC readout, and data acquisitionsoftware are based on that demonstrated by the DMTPC experiment with several members of theproposal team (J. Monroe and A. Kaboth) bringing significant prior DMTPC experience.
The prototype TPC is shown in Fig. 13, it is currently being commissioned with a 50% lengthfield cage in a vessel capable of 1 bar pressure, at RHUL. The drift length of the full field cageis 0.6 m, and the diameter of the field cage is 1.2 m. The TPC is mounted to rails welded ontothe cylinder body. The cathode, ground, and anode electrodes are constructed of 250 µm pitchstainless steel mesh [18] tensioned to 25 N-m, and epoxied to stainless steel supports. The groundand anode electrodes are separated by 1 mm by resistive spacers, and mounted on delrin rodsthat form the support assembly. The stand-off distances for the supports are chosen such thatthe anode electrode can operate up to 1 kV, and the cathode electrode up to 7.5 kV. The cathodevoltage requirement is to define a 150 V/cm drift field, in order to miminize diffusion in the driftregion. The field cage ring spacing was simulated in COMSOL, and chosen to be 3 cm in order toachieve 1% drift field non-uniformity in the fiducial region. Given this spacing, the drift region isenclosed by 18 Cu field cage rings.
There are two optical readout options available to use with the TPC, one with 500 µm pitchemploying one camera to image the entire amplification plane, and the other using four cameras,achieving 250 µm pitch. Both cameras may be operated in a readout mode where pixels aresummed in hardware prior to readout, allowing for 2×2 up to 8×8 spatial binning in order to testlarger pitches.
The baseline optical readout uses four FLI Proline PL09000 CCDs centered on each quadrantof the amplification plane. The FLI Proline PL09000 has 3056 × 3056 12 µm × 12 µm pixelswith 10 e− read noise coupled to Nikon f/1.2 50mm focal length lenses with a 54.8◦ angle of view.At an object distance of 85 cm the system images a 71×71 cm field of view with a vixel size of230 µm. An image showing 25 MeV/c alpha particles in the TPC recorded during commissioningwith this camera system in Sept. 2017 is shown in Fig. 13. The estimated signal-to-noise for 50MeV/c tracks in this optical system is 6-8.
The Spectral Instruments 1100s Fairchild CCD has 4096 × 4112 15 µm × 15 µm pixels with5 e− readout noise. This camera is large enough to image the entire amplification region whencoupled to a Canon f/0.95 50mm focal length lens, with a 86◦ angle of view. At an object distanceof 85 cm the system images a 120×120 cm field of view with a vixel size of 500 µm. The estimatedsignal-to-noise for 50 MeV/c tracks in this optical system is 10-12.
The charge readout uses CAEN N6730 500 MHz digitizers to record the anode and mesh elec-trode signals. These are segmented into four quadrants spatially, in order to lower the capacitance.The anode signals are amplified by CREMAT CR-113 charge-sensitive pre-amplifiers, the groundplane (mesh) signals are amplified by CAEN A1423 Wideband amplifiers. The typical noise of thecharge readout is <0.5 mV per time sample, allowing sensitivity to tracks depositing as little as5.9 keV in the TPC drift region.
The charge and optical signals are associated in the data acquisition software, in order to com-bine the amplification plane readout samples (from the CCD) with the drift direction samples(from the charge readout). This hybrid readout system was designed for low-multiplicity dark
(a) Cut through view of the HPTPCVessel with TPC shown.
(b) Prototype high pressuredetector vessel
(c) Schematic view of the gas system.
Figure 12: Overview of HPTPC components.
12
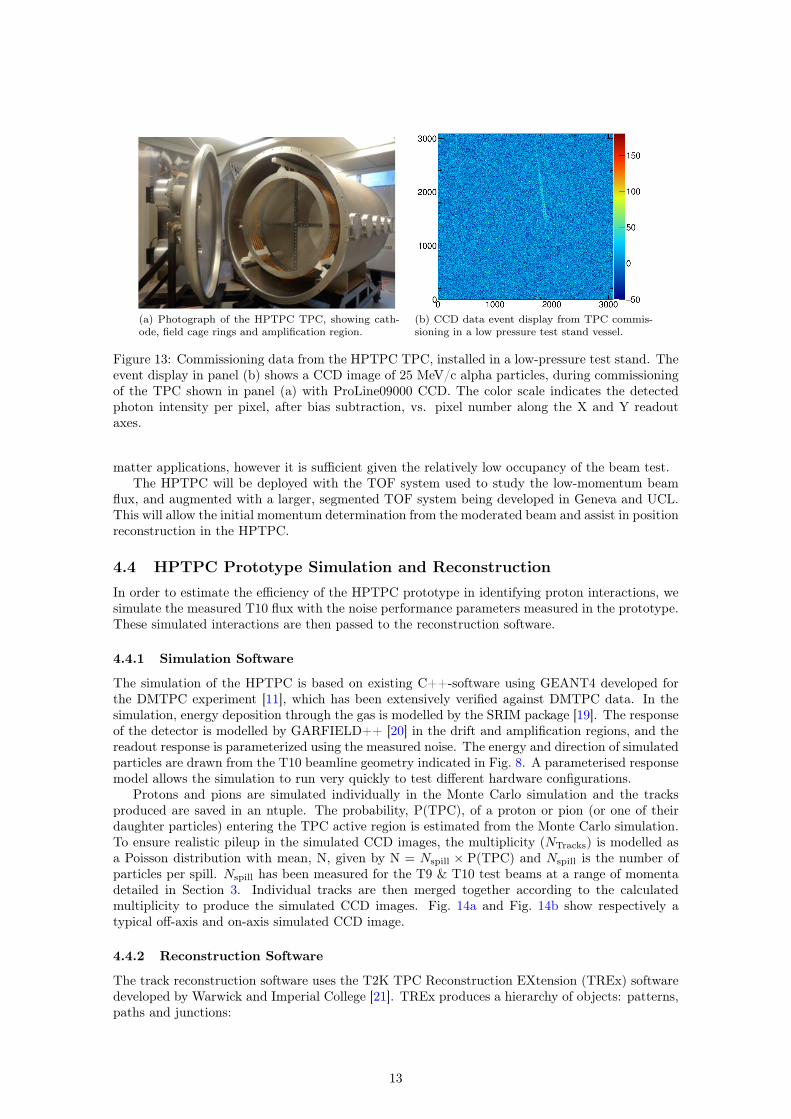
(a) Photograph of the HPTPC TPC, showing cath-ode, field cage rings and amplification region.
(b) CCD data event display from TPC commis-sioning in a low pressure test stand vessel.
Figure 13: Commissioning data from the HPTPC TPC, installed in a low-pressure test stand. Theevent display in panel (b) shows a CCD image of 25 MeV/c alpha particles, during commissioningof the TPC shown in panel (a) with ProLine09000 CCD. The color scale indicates the detectedphoton intensity per pixel, after bias subtraction, vs. pixel number along the X and Y readoutaxes.
matter applications, however it is sufficient given the relatively low occupancy of the beam test.The HPTPC will be deployed with the TOF system used to study the low-momentum beam
flux, and augmented with a larger, segmented TOF system being developed in Geneva and UCL.This will allow the initial momentum determination from the moderated beam and assist in positionreconstruction in the HPTPC.
4.4 HPTPC Prototype Simulation and ReconstructionIn order to estimate the efficiency of the HPTPC prototype in identifying proton interactions, wesimulate the measured T10 flux with the noise performance parameters measured in the prototype.These simulated interactions are then passed to the reconstruction software.
4.4.1 Simulation Software
The simulation of the HPTPC is based on existing C++-software using GEANT4 developed forthe DMTPC experiment [11], which has been extensively verified against DMTPC data. In thesimulation, energy deposition through the gas is modelled by the SRIM package [19]. The responseof the detector is modelled by GARFIELD++ [20] in the drift and amplification regions, and thereadout response is parameterized using the measured noise. The energy and direction of simulatedparticles are drawn from the T10 beamline geometry indicated in Fig. 8. A parameterised responsemodel allows the simulation to run very quickly to test different hardware configurations.
Protons and pions are simulated individually in the Monte Carlo simulation and the tracksproduced are saved in an ntuple. The probability, P(TPC), of a proton or pion (or one of theirdaughter particles) entering the TPC active region is estimated from the Monte Carlo simulation.To ensure realistic pileup in the simulated CCD images, the multiplicity (NTracks) is modelled asa Poisson distribution with mean, N, given by N = Nspill × P(TPC) and Nspill is the number ofparticles per spill. Nspill has been measured for the T9 & T10 test beams at a range of momentadetailed in Section 3. Individual tracks are then merged together according to the calculatedmultiplicity to produce the simulated CCD images. Fig. 14a and Fig. 14b show respectively atypical off-axis and on-axis simulated CCD image.
4.4.2 Reconstruction Software
The track reconstruction software uses the T2K TPC Reconstruction EXtension (TREx) softwaredeveloped by Warwick and Imperial College [21]. TREx produces a hierarchy of objects: patterns,paths and junctions:
13

(a) Typical simulated CCD output of an off-axis spill:0.8 GeV/c inital beam, Prototype HPTPC 3◦- 4◦ off-axis and 13 m downstream of a 30 cm thick plasticmoderator.
(b) Typical simulated CCD output of an on-axis spill:0.3 GeV/c beam aligned with 2 mm thick aluminumbeam window.
Figure 14: Simulated CCD event displays. The color scale indicates the detected photon intensityper pixel, without bias subtraction, vs. pixel position along the X and Y readout axes (mm).
1. Patterns are formed of any contiguous group of CCD hits connected together by the pathfind-ing. Patterns can contain an arbitrary combination of paths and junctions.
2. Paths are routes between points of interest. A single particle trajectory will ideally createonly a single path, but may break into multiple paths if it passes any points of interest beforeleaving the TPC (e.g. delta ray production). In addition to belonging to the pattern, hitsalong a path belong to that path.
3. Junctions are points at which two or more paths meet. Junctions can also be formed by e.g.hadronic interactions, such as the signal interactions in the CERN test beam data.
TREx uses the A* algorithm [22] to find paths between given points of interest. The path isbuilt up by stepping through discrete points in space (in this case, the CCD pixels), selecting thepoint that has the lowest cost. The cost at each step comprises two terms: the connection cost,representing the sum of point-to-point connections made to reach the current position, and theheuristic cost, representing the estimated cost of reaching the end point from the current position.
TREx identifies the points to be connected using a multi-stage approach:
1. First Pass Edge Detection: All CCD pixels at maxima and minima in Y or Z are selected toidentify the points of interest at which particles enter or leave the detector.
2. Junction Detection: If three or more points of interest emerge from the first two stages, thepathfinding now searches for junctions where these paths meet. These are identified by usingA* to navigate between the edge points, and finding the position at which the paths beginto diverge.
3. Kink-Finding : Vertices with only two outgoing particles will not yet have been found by theedge or junction detection. To identify these, the pathfinding looks for sharp kinks in thepath. This concludes the pattern recognition.
4. Tracking : A straight track fitting algorithm is used to further reconstruct a particle track fromthe clustered path hits. This allows the extrapolation of track states in order to match andmerge across junctions, using a likelihood method. Though originally developed to recovercontinuous tracks from paths that are broken due to δ-ray emission, this turns out to play animportant role in solving ambiguities that arise from the 2D nature of the amplification planereadout. We have not yet fully merged the charge readout information into the reconstructionalgorithm.
14
0 0.1 0.2 0.3 0.4 0.5 0.6 0.7 0.8 0.9 1
3−10×
dE/dx [MeV/mm]
0
0.02
0.04
0.06
0.08
0.1
0.12
310×
# of
Tra
cks
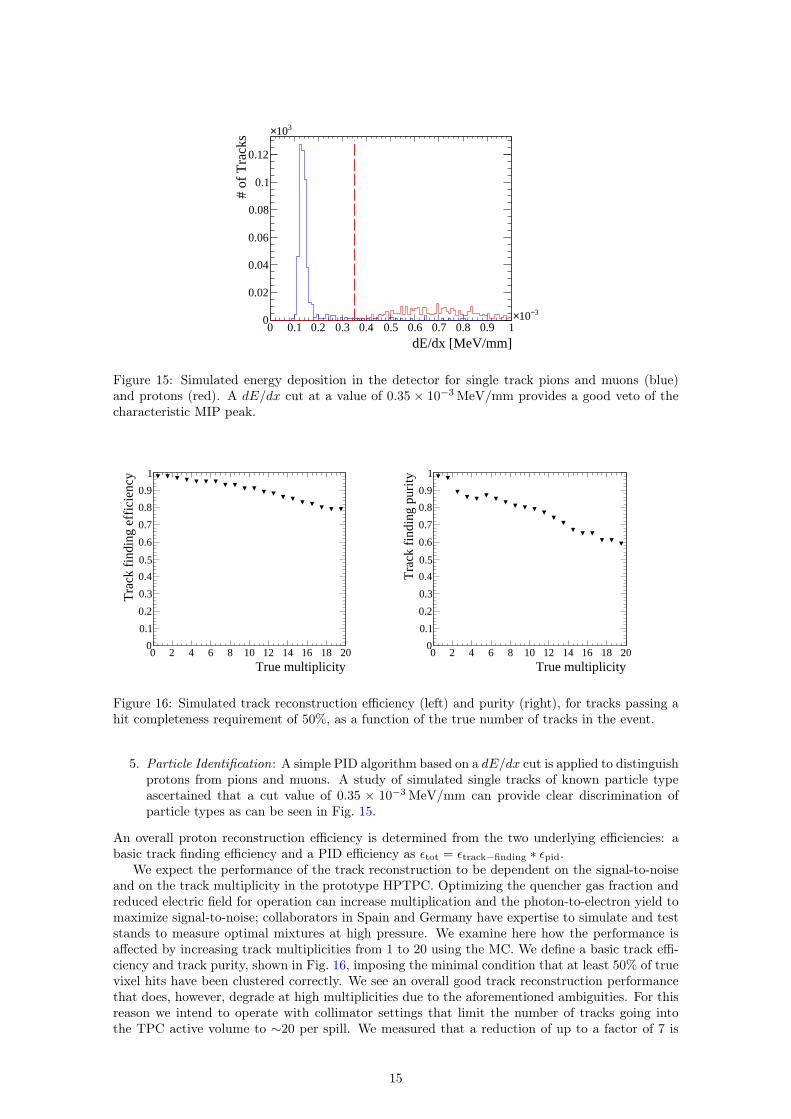
Figure 15: Simulated energy deposition in the detector for single track pions and muons (blue)and protons (red). A dE/dx cut at a value of 0.35 × 10⁻³ MeV/mm provides a good veto of thecharacteristic MIP peak.
0 2 4 6 8 10 12 14 16 18 20True multiplicity
0
0.1
0.2
0.3
0.4
0.5
0.6
0.7
0.8
0.9
1
Tra
ck f
indi
ng e
ffic
ienc
y
0 2 4 6 8 10 12 14 16 18 20True multiplicity
0
0.1
0.2
0.3
0.4
0.5
0.6
0.7
0.8
0.9
1
Tra
ck f
indi
ng p
urity
Figure 16: Simulated track reconstruction efficiency (left) and purity (right), for tracks passing ahit completeness requirement of 50%, as a function of the true number of tracks in the event.
5. Particle Identification: A simple PID algorithm based on a dE/dx cut is applied to distinguishprotons from pions and muons. A study of simulated single tracks of known particle typeascertained that a cut value of 0.35 × 10⁻³ MeV/mm can provide clear discrimination ofparticle types as can be seen in Fig. 15.
An overall proton reconstruction efficiency is determined from the two underlying efficiencies: abasic track finding efficiency and a PID efficiency as εtot = εtrack−finding ∗ εpid.
We expect the performance of the track reconstruction to be dependent on the signal-to-noiseand on the track multiplicity in the prototype HPTPC. Optimizing the quencher gas fraction andreduced electric field for operation can increase multiplication and the photon-to-electron yield tomaximize signal-to-noise; collaborators in Spain and Germany have expertise to simulate and teststands to measure optimal mixtures at high pressure. We examine here how the performance isaffected by increasing track multiplicities from 1 to 20 using the MC. We define a basic track effi-ciency and track purity, shown in Fig. 16, imposing the minimal condition that at least 50% of truevixel hits have been clustered correctly. We see an overall good track reconstruction performancethat does, however, degrade at high multiplicities due to the aforementioned ambiguities. For thisreason we intend to operate with collimator settings that limit the number of tracks going intothe TPC active volume to ∼20 per spill. We measured that a reduction of up to a factor of 7 is
15
feasible by reducing the horizontal and vertical collimator apertures in both the T9 ad T10 beams,relative to the reference run settings used in acquiring the low-momentum flux data reported inSection 3.
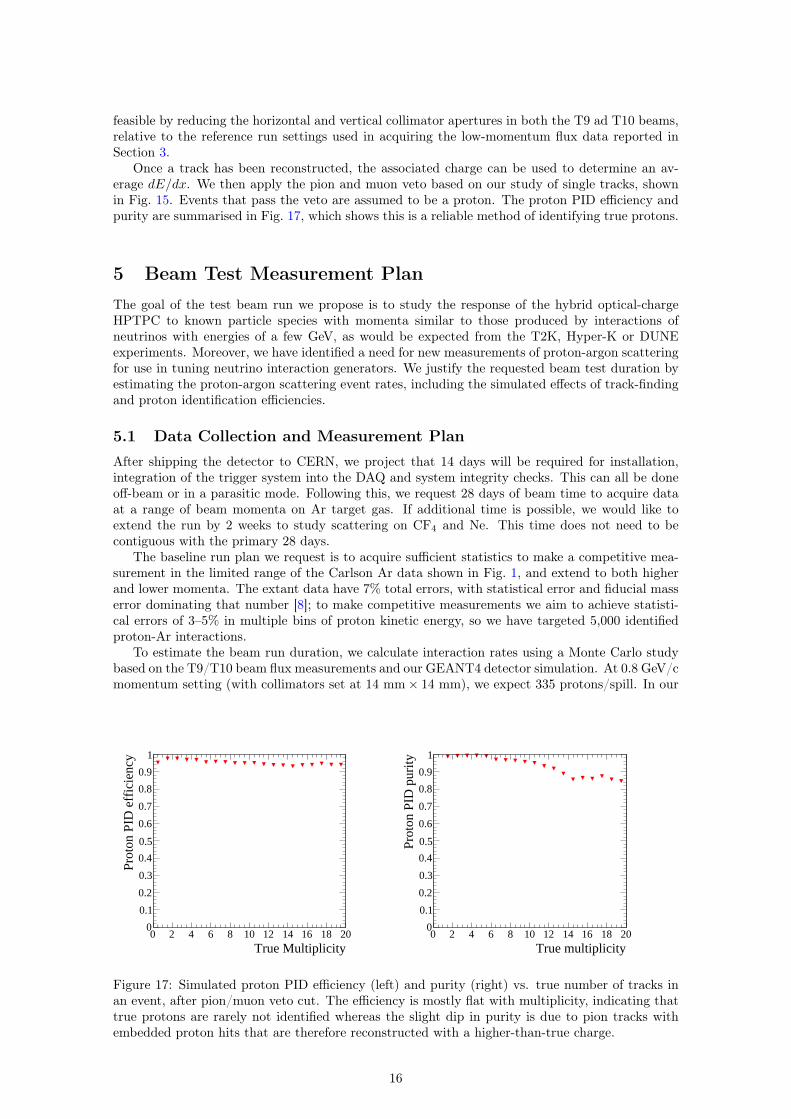
Once a track has been reconstructed, the associated charge can be used to determine an av-erage dE/dx. We then apply the pion and muon veto based on our study of single tracks, shownin Fig. 15. Events that pass the veto are assumed to be a proton. The proton PID efficiency andpurity are summarised in Fig. 17, which shows this is a reliable method of identifying true protons.
5 Beam Test Measurement PlanThe goal of the test beam run we propose is to study the response of the hybrid optical-chargeHPTPC to known particle species with momenta similar to those produced by interactions ofneutrinos with energies of a few GeV, as would be expected from the T2K, Hyper-K or DUNEexperiments. Moreover, we have identified a need for new measurements of proton-argon scatteringfor use in tuning neutrino interaction generators. We justify the requested beam test duration byestimating the proton-argon scattering event rates, including the simulated effects of track-findingand proton identification efficiencies.
5.1 Data Collection and Measurement PlanAfter shipping the detector to CERN, we project that 14 days will be required for installation,integration of the trigger system into the DAQ and system integrity checks. This can all be doneoff-beam or in a parasitic mode. Following this, we request 28 days of beam time to acquire dataat a range of beam momenta on Ar target gas. If additional time is possible, we would like toextend the run by 2 weeks to study scattering on CF4 and Ne. This time does not need to becontiguous with the primary 28 days.
The baseline run plan we request is to acquire sufficient statistics to make a competitive mea-surement in the limited range of the Carlson Ar data shown in Fig. 1, and extend to both higherand lower momenta. The extant data have 7% total errors, with statistical error and fiducial masserror dominating that number [8]; to make competitive measurements we aim to achieve statisti-cal errors of 3–5% in multiple bins of proton kinetic energy, so we have targeted 5,000 identifiedproton-Ar interactions.
To estimate the beam run duration, we calculate interaction rates using a Monte Carlo studybased on the T9/T10 beam flux measurements and our GEANT4 detector simulation. At 0.8 GeV/cmomentum setting (with collimators set at 14 mm× 14 mm), we expect 335 protons/spill. In our
0 2 4 6 8 10 12 14 16 18 20True Multiplicity
0
0.1
0.2
0.3
0.4
0.5
0.6
0.7
0.8
0.9
1
Prot
on P
ID e
ffic
ienc
y
ProtonEfficicency
0 2 4 6 8 10 12 14 16 18 20True multiplicity
0
0.1
0.2
0.3
0.4
0.5
0.6
0.7
0.8
0.9
1
Prot
on P
ID p
urity
ProtonPurity
Figure 17: Simulated proton PID efficiency (left) and purity (right) vs. true number of tracks inan event, after pion/muon veto cut. The efficiency is mostly flat with multiplicity, indicating thattrue protons are rarely not identified whereas the slight dip in purity is due to pion tracks withembedded proton hits that are therefore reconstructed with a higher-than-true charge.
16

Configuration P (GeV/c) Moderater Spills Duration (days)On-axis 1.0 None 5,000 1On-axis 0.3 None 5,000 1Off-axis 0.8 Plastic 80,000 26
Table 1: Baseline beam data run plan for CERN PS East Area Test Beam. The primary physicsrun is in the off-axis configuration, collecting enough spills for at least 5,000 cleanly reconstructedproton signal interactions. The duration estimate at each momentum assumes 1 cycle per PSsupercycle, and 50% duty factor.
off-axis position, ∼2% of those protons reach the TPC active volume, yielding approximately7 protons and 15 pions/muons per spill. The cumulative proton reconstruction efficiency fromsimulation is 70%, this is estimated as the product of 75% track reconstruction efficiency for amultiplicity of 20 tracks (Fig. 16) and 95% proton PID efficiency (from Fig. 17). With interactioncross-sections ranging from 500 to 1500 mb, the interaction probability is 0.5% to 1.5% in the TPCfiducial volume at 5 bar pressure of Ar. Thus, we estimate that 80,000 spills are needed to identifyand reconstruct 5,000 p-Ar interactions.
Given the PS 14 second super-cycle, and assuming 50% duty factor, 26 days of dedicated run-ning are required in off-axis configuration. The 50% duty factor is estimated as the product of 80%beam uptime, 80% detector uptime (to account for gas refills required to preserve gain stability),and 80% physics uptime (where the remainder is for calibration, reference runs, etc.) We will startwith two days of instrumental calibration runs on-axis, at 1 GeV/c and 300 MeV/c for calibrationof the TOF and detector PID. This request is outlined in Table 1.
5.2 Test Beam Data AnalysisThe cross-section measurement method is based on the sliced TPC approach developed by the LArTPC In A Test-beam experiment (LArIAT) [23]. The TPC active volume is treated as a series ofthin Ar slabs which are perpendicular to the beam direction. In the case of our HPTPC prototype,the CCD vixel columns define the minimum thickness of the Ar slabs. With such a treatment, thecross-section, σ, as a function of kinetic energy, E, can be approximated as
σ(E) ≈ 1
znAr
NI(E)
NIn(E), (1)
where nAr is the number density of each Argon Slab (ArS), z is the depth of each ArS, NIn is thenumber of particles incident on each ArS and NI(E) is the number of particles interacting in eachArS.
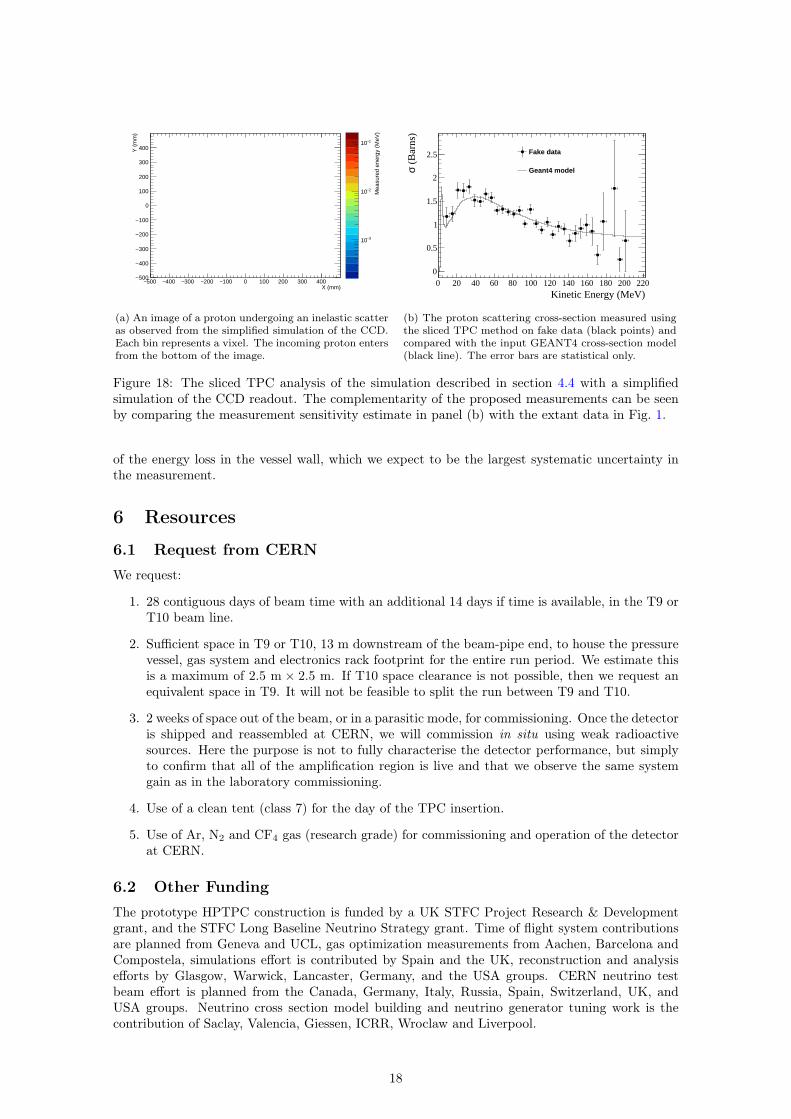
The full analysis will use TREx patterns as inputs but as a proof of concept of the method, theGEANT4 simulation described in section 4.4 has been used with a simplified model of the CCDand its readout for protons only, without the full diffusion, recombination, or impurity effects. Thekinetic energy of a proton as it passes the nth vixel column is
E = E0 −n∑i=0
Ei, (2)
where E0 is the energy of the proton as it enters the TPC active volume and Ei is the energydeposit measured by the ith vixel column. E0 is assumed to be known with perfect precision andaccuracy in this proof of concept analysis. For each slab, the proton is recorded in a distributionbinned in kinetic energy where each bin represents NIn(E). This process repeats until the protonundergoes an elastic or inelastic scatter (assuming 100% identification efficiency) or exits the TPCactive region. An example of an identified scatter is shown in Fig. 18a. For each slab, everyidentified scatter is recorded in a kinetic energy distribution, where the bin contents representNI(E). The bin-by-bin ratios of the two distributions are used in equation 1 to calculate thescattering cross-section binned in kinetic energy, which is shown in Fig. 18b. The statistical errorsshown here correspond to the beam test request, and are competitive with the extant measurementsin the limited range where these exist. To reduce statistical uncertainties we can of course choosea coarser binning for the differential measurement.
The final analysis will utilise the TOF in the estimation of E0, but must include an estimate
17
X (mm)500− 400− 300− 200− 100− 0 100 200 300 400
Y (
mm
)
500−
400−
300−
200−
100−
0
100
200
300
400
Mea
sure
d en
ergy
(M
eV)
3−10
2−10
1−10
(a) An image of a proton undergoing an inelastic scatteras observed from the simplified simulation of the CCD.Each bin represents a vixel. The incoming proton entersfrom the bottom of the image.
Kinetic Energy (MeV)0 20 40 60 80 100 120 140 160 180 200 220
(B
arns
)σ
0
0.5
1
1.5
2
2.5 Fake data
Geant4 model
(b) The proton scattering cross-section measured usingthe sliced TPC method on fake data (black points) andcompared with the input GEANT4 cross-section model(black line). The error bars are statistical only.
Figure 18: The sliced TPC analysis of the simulation described in section 4.4 with a simplifiedsimulation of the CCD readout. The complementarity of the proposed measurements can be seenby comparing the measurement sensitivity estimate in panel (b) with the extant data in Fig. 1.
of the energy loss in the vessel wall, which we expect to be the largest systematic uncertainty inthe measurement.
6 Resources
6.1 Request from CERNWe request:
1. 28 contiguous days of beam time with an additional 14 days if time is available, in the T9 orT10 beam line.
2. Sufficient space in T9 or T10, 13 m downstream of the beam-pipe end, to house the pressurevessel, gas system and electronics rack footprint for the entire run period. We estimate thisis a maximum of 2.5 m × 2.5 m. If T10 space clearance is not possible, then we request anequivalent space in T9. It will not be feasible to split the run between T9 and T10.
3. 2 weeks of space out of the beam, or in a parasitic mode, for commissioning. Once the detectoris shipped and reassembled at CERN, we will commission in situ using weak radioactivesources. Here the purpose is not to fully characterise the detector performance, but simplyto confirm that all of the amplification region is live and that we observe the same systemgain as in the laboratory commissioning.
4. Use of a clean tent (class 7) for the day of the TPC insertion.
5. Use of Ar, N2 and CF4 gas (research grade) for commissioning and operation of the detectorat CERN.
6.2 Other FundingThe prototype HPTPC construction is funded by a UK STFC Project Research & Developmentgrant, and the STFC Long Baseline Neutrino Strategy grant. Time of flight system contributionsare planned from Geneva and UCL, gas optimization measurements from Aachen, Barcelona andCompostela, simulations effort is contributed by Spain and the UK, reconstruction and analysisefforts by Glasgow, Warwick, Lancaster, Germany, and the USA groups. CERN neutrino testbeam effort is planned from the Canada, Germany, Italy, Russia, Spain, Switzerland, UK, andUSA groups. Neutrino cross section model building and neutrino generator tuning work is thecontribution of Saclay, Valencia, Giessen, ICRR, Wroclaw and Liverpool.
18

6.3 Track Record of ProponentsWe highlight here the track records of the UK Co-Investigators involved in the prototype HPTPCconstruction grant in the UK: Wascko currently serves as the International Co-Spokesperson of theT2K experiment. Kaboth is the DUNE Near Detector Coordination Manager and T2K convenerof the Beam and Near Detector Flux Fitting Working Group, and has extensive experience ofoptical TPCs. Nowak is the physics coordinator for ProtoDUNE-SP at CERN and an author ofthe neutrino interaction generator NuWro. Barker is a leading authority on track reconstructionin liquid argon detectors. Boyd has been involved in the measurement of neutrino interactioncross-sections and neutrino oscillation experiments for two decades; in the course of this work hehas been involved in two, and led one, testbeam effort at the CERN East Area in the contextof testing near detector prototypes for various neutrino experiments. Walding has deep expertiseon neutrino cross-section measurement from the SciBooNE and MINERνA experiments. Monroehas made many of the measurements establishing optical readout as a viable technique in directdark matter searches as leader of the DMTPC project, and serves on the Fermilab Long BaselineNeutrino Committee and the CERN SPS and PS Experiments Committee.
Since the UK funding (starting in 2015), the HPTPC development work has grown to engagethe European community more broadly, with a series of workshops and joint DUNE-Hyper-Kworking group meetings. The proponents of this research are strongly engaged in the internationalneutrino programme, which has been identified as one of the highest science priorities in Europe.This HPTPC development project is embedded within the Expression of Interest for TPC-BasedNear Detectors for Neutrino Long Baseline Experiments submitted to CERN in 2017 from 191authors at 38 institutes in 12 countries (SPSC-EOI-015, work package 9).
7 ConclusionsFor reducing neutrino oscillation systematic uncertainties in future experiments, a key measure-ment is proton-nucleus scattering. This process obfuscates the secondary particle multiplicity andkinematics, causing event migrations between data samples and introducing biases in neutrinoevent reconstruction. We propose to collect sufficient statistics in the HPTPC beam test for 3–5% statistical uncertainty on a proton-nucleus scattering cross-section measurement in binned inkinetic energy. Utilising the test beam’s pion component, we can also potentially measure pionscattering processes including charge exchange and absorption, leveraging the expertise of LARIATcollaborators, particularly the Fermilab group on this proposal.
Once complete, we aim to use the p-Ar cross-section measurements to tune the NEUT andGENIE neutrino interaction generator MC FSI simulations, both of which draw interaction proba-bilities at each particle step from models fit to hadronic scattering data, highlighting the criticalityof the broad measurement programme discussed in section 2.2. The authors of these generators arecollaborators on this proposal. The tuned generators will then be used in full end-to-end neutrinooscillation sensitivity studies. The goal is to use the full range of interaction models available,and demonstrate quantitatively what gain in sensitivity can be achieved with the improved phasespace acceptance of a gas HPTPC detector. Developing the framework for this work is underwayby T2K and DUNE collaborators on this proposal.
We highlight that one of the lessons learned by recent attempts to use neutrino interactionmeasurements in global fits to extract neutrino model parameters is the importance of having fullcovariance matrices between data sets [24, 25]. Thus the data we propose to collect potentiallyallow a unique improvement over past measurements with correlations between p-Ar and π-Armeasurements. We also aim eventually to analyze this data coherently with the higher-momentumProtoDUNE-SP measurements and lower-momentum LARIAT measurements, interfacing throughNowak, Brailsford and Raaf.
The measurements proposed here provide underpinning capability for future scientific projectsin LBL neutrino oscillation experiments. This work will produce new measurements, useful in theirown right, and provide ‘neutrino engineering’ input needed for the step-change precision requiredin neutrino cross sections for the DUNE and Hyper-K sensitivity goals. After the completion of theproposed work, we will be in a position to design a realistic-scale HPTPC neutrino near detectorsince we will have a reliable path from hardware specifications to full-size detector performance,benchmarked against these data.
19
References[1] M. H. for the T2K Collaboration, T2k neutrino oscillation results with data up to 2017
summer, https://www.t2k.org/docs/talk/282, 2017.
[2] H. Wellisch and D. Axen, Physical Review C 54, 1329 (1996).
[3] T2K, K. Abe et al., Phys. Rev. Lett. 118, 151801 (2017), 1701.00432.
[4] L. Alvarez-Ruso et al., (2017), 1706.03621.
[5] MicroBooNE-Collaboration, MICROBOONE PUBLIC NOTE 1024 (2017).
[6] R. Carlson, Atomic Data and Nuclear Data Tables 63, 93 (1996).
[7] H. P. Wellisch and D. Axen, Phys. Rev. C 54, 1329 (1996).
[8] R. F. Carlson et al., Nuclear Physics A 445, 57 (1985).
[9] LADS Collaboration, D. Rowntree et al., Phys. Rev. C 60, 054610 (1999).
[10] T2K ND280 TPC, N. Abgrall et al., Nucl. Instrum. Meth. A637, 25 (2011), 1012.0865.
[11] S. Ahlen et al., Physics Letters B 695, 124 (2011).
[12] C. Deaconu, Recent updates from the dark matter time projection chamber (dmtpc) collab-oration, TAUP, 2013.
[13] C. Deaconu et al., Phys. Rev. D95, 122002 (2017), 1705.05965.
[14] L. G. Christophorou, J. K. Olthoff, and M. V. V. S. Rao, Journal of Physical and ChemicalReference Data 25, 1341 (1996), http://dx.doi.org/10.1063/1.555986.
[15] I. Opticstar, Quotation, 2014.
[16] DMTPC, M. Leyton, J. Phys. Conf. Ser. 718, 042035 (2016).
[17] J. B. R. Battat et al., Phys. Rept. 662, 1 (2016), 1610.02396.
[18] D. Dujmic et al., Astropart. Phys. 30, 58 (2008), 0804.4827.
[19] J. F. Ziegler, M. Ziegler, and J. Biersack, Nuclear Instruments and Methods in PhysicsResearch Section B: Beam Interactions with Materials and Atoms 268, 1818 (2010), 19thInternational Conference on Ion Beam Analysis.
[20] R. Veenhof, Nucl. Instrum. Meth. A419, 726 (1998).
[21] P. Hamilton, Argon gas measurements in t2k tpc, NuInt UK Workshop, 2015.
[22] Hart, PE, Nilsson, BP, and Raphael, B, IEEE Transactions on Systems Science and Cyber-netics SSC4 4, 100 (1968).
[23] P. Hamilton, LArIAT: Worlds First Pion-Argon Cross-Section, in 18th International Workshopon Neutrino Factories and Future Neutrino Facilities Search (NuFact16) Quy Nhon, Vietnam,August 21-27, 2016, 2016, 1611.00821.
[24] P. A. Rodrigues, Tuning generator-based cross-section models, NuFact, 2012.
[25] P. A. Rodrigues, Comparison of mc and theoretical models to recent pion production data,NuInt, 2012.
20

A Risk Register
Ref. Risk description Impact Likelihood Mitigation
1. Loss of key stafffrom project
Delay to timetableand deliverables Medium
Ensure good intra-projectcommunication. Enforcegood documentationprotocol.
2. Problems with gassystem
Delay of pressurevessel and TPC Low
Design of system using bestpractice (UK PressureEquipment Directive) andautomated safety systems.
3. Insufficient TPCgain
Delay of pressurevessel and TPC Medium
Good communications withTPC experts. Extensivetesting before transport.
4. Damage in transport Delay of TPCdeployment Medium
Use professional transportcompany; insurance toprotect cost overruns.
5.
Testbeamcharacteristicsdifferent fromexpectation
Delay in data-taking Low Close liasion with CERN.
6.TOF systemperformanceinsufficient
PID performancebelow expectation;Increase insystematic errors
Medium
Early specification anddesign of system. Systemtests before transport toCERN.
7.Delay orrescheduling ofCERN testbeam slot
Delay to projectdeliverables Low
Early and frequent contactwith CERN testbeamorganisers.
8. Failure of beamduring operations
Delay to projectdeliverables Low Close contact with CERN
testbeam organisers.
9. Failure of TPCduring operations
Delay to projectdeliverables Low Ensure on-site expert
availability.
10.Failure of ancillarysystems duringoperations
Delay to projectdeliverables Low
Ensure on-site staffing byexperts; impose databackup and sparesavailability protocols.
11. Data loss
Extension todata-taking period;delay in delivery offinal results
Low Impose a data-backupprocedure during operation
21