Proposal to estimate vaquita abundance - SWFSC Abundance Estimation...1 Proposal to estimate vaquita...
22
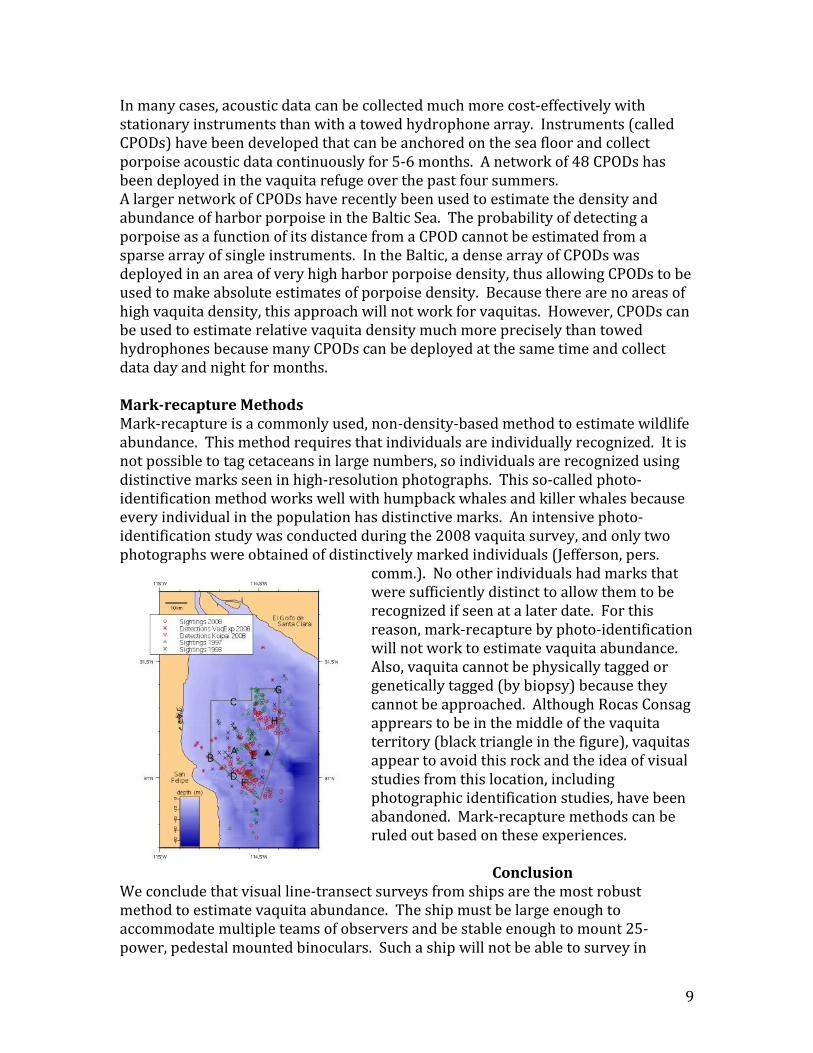
1 Proposal to estimate vaquita abundance Objective: To provide the Government of Mexico an accurate and precise estimate of current vaquita (Phocoena sinus) abundance as soon as possible. Estimating the abundance of the most endangered marine mammal in the world is not easy. Vaquitas are notoriously difficult to detect. A complete count (a census) of vaquitas is not possible, so any method of determining vaquita abundance will be based on statistics and will contain some degree of uncertainty. Fortunately there is a history of methods for estimating vaquita abundance, so it is known which methods work and which do not work (Appendix 1). The most accurate and precise estimate of 2015 vaquita abundance will require both visual and acoustic components covering the entire range of the vaquita in the northwestern Gulf of California. No form of aerial survey has been found to be suitable for estimating vaquita abundance, and mark-recapture methods with photo-identification are not feasible (Appendix 1). The visual component of the vaquita survey utilizes a large ship to conduct transects in waters deeper than about 10m (Appendix 2). The most effective method is to use high power (25x) binoculars at a height of at least 10m above the water. The powerful binoculars allow vaquitas to be detected up to 5km from the ship, which is important because vaquitas react to the ship at distances up to 1km. Accurate estimation of abundance requires detection before the animals react to the ship. For this reason, the visual part of the 2015 vaquita survey should utilize a ship that can support 25X binoculars on a covered observation deck 10m or more above the water (Appendix 3). The acoustic component of the survey is necessary because part of the vaquita population lives in shallow waters that cannot be visually surveyed by the large ship. The acoustic data will allow the estimate of vaquita density from the visual survey area to be extrapolated into shallow areas (Appendix 4). To increase the precision of the estimate in shallow water areas, we recommend using an array of autonomous acoustic recording devices (CPODs) instead of the single towed hydrophone that was used in 2008. This will require maintaining the grid of 45 CPODs in their current locations throughout the Vaquita Refuge and adding 68 CPODs located evenly throughout the shallow water area (Appendix -114.8 -114.6 -114.4 -114.2 30.6 30.8 31.0 31.2 31.4 31.6 Longitude Latitude San Felipe El Golfo de Santa Clara Colorado River Acoustic area Visual area Joint visual and acoustic area
Transcript of Proposal to estimate vaquita abundance - SWFSC Abundance Estimation...1 Proposal to estimate vaquita...
1
Proposal to estimate vaquita abundance
Objective: To provide the Government of Mexico an accurate and precise estimate of current vaquita (Phocoena sinus) abundance as soon as possible. Estimating the abundance of the most endangered marine mammal in the world is not easy. Vaquitas are notoriously difficult to detect. A complete count (a census) of vaquitas is not possible, so any method of determining vaquita abundance will be based on statistics and will contain some degree of uncertainty. Fortunately there is a history of methods for estimating vaquita abundance, so it is known which methods work and which do not work (Appendix 1). The most accurate and precise estimate of 2015 vaquita abundance will require both visual and acoustic components covering the entire range of the vaquita in the northwestern Gulf of California. No form of aerial survey has been found to be suitable for estimating vaquita abundance, and mark-recapture methods with photo-identification are not feasible (Appendix 1). The visual component of the vaquita survey utilizes a large ship to conduct transects in waters deeper than about 10m (Appendix 2). The most effective method is to use high power (25x) binoculars at a height of at least 10m above the water. The powerful binoculars allow vaquitas to be detected up to 5km from the ship, which is important because vaquitas react to the ship at distances up to 1km. Accurate estimation of abundance requires detection before the animals react to the ship. For this reason, the visual part of the 2015 vaquita survey should utilize a ship that can support 25X binoculars on a covered observation deck 10m or more above the water (Appendix 3).
The acoustic component of the survey is necessary because part of the vaquita population lives in shallow waters that cannot be visually surveyed by the large ship. The acoustic data will allow the estimate of vaquita density from the visual survey area to be extrapolated into shallow areas (Appendix 4). To increase the precision of the estimate in shallow water areas, we recommend using an array of autonomous acoustic recording devices (CPODs) instead of the single towed hydrophone that was used in 2008. This will require maintaining the grid of 45 CPODs in their current locations throughout the Vaquita Refuge and adding 68 CPODs located evenly throughout the shallow water area (Appendix
-114.8 -114.6 -114.4 -114.2
30.6
30.8
31.0
31.2
31.4
31.6
Longitude
Latit
ude
SanFelipe
El Golfo de Santa Clara
Colorado
River
Acoustic area
Visual area
Joint visualand acoustic area
2
4). To avoid loss of the CPODs, no fishing of any kind (including trawling) can occur during the research period. This may require extra enforcement. In addition to the staff required to deploy and retrieve this network of CPODs, we recommend hiring 2 additional experienced CPOD analysts from the European Union project on harbor porpoise to augment Mexico's two already experienced staff to analyze the data coming off the CPODs as the season progresses. The expected 7,200 days of acoustic data should greatly increase abundance precision for the shallow water area (including 4,350 days within the shallow water area), which was a large contributor to imprecision in past estimates. Another source of imprecision in past estimates was the estimate of the fraction of vaquitas missed on the trackline. Due to the turbid waters in the upper Gulf of California and the elusive behavior of vaquitas, a substantial fraction of vaquitas will not be detected even when they are close to the ship. An estimate of this fraction of animals missed is necessary for accurate estimation of abundance. The fraction is specific to the ship and specific to the sighting protocols (number of observers and type of binoculars used). For the Ocean Starr and the sighting protocols recommended in this proposal, the fraction missed was estimated to be 0.43. In other words, even with 3 observers searching with 25X binoculars and one observer with hand-held binoculars at a height of 10.2m above the water, only 57% of vaquitas are detected near the trackline. If sighting protocols are changed – for example, if hand-held binoculars or fewer observers are used – the fraction missed will be higher and unknown. If a ship other than the Ocean Starr is used, the fraction will be unknown and must be estimated. If the fraction of vaquitas missed is not taken into account, the abundance of vaquitas will be underestimated. Because knowing the fraction of animals missed is so important, it is recommended that, even if the Ocean Starr is used as the survey vessel, the 2015 vaquita cruise use 2 teams of observers. This will allow of the fraction missed to be estimated. The number of total observers needed is 12, because the 6 observers on watch at any one time need to be rotated regularly to prevent fatigue. It is also critically important that most of the observers have previous experience with vaquita or harbor porpoise. For this very important study, we should use only the most experienced porpoise observers possible. Observers must be able to differentiate between vaquita and bottlenose dolphins (also found in small groups in the area and easily confused with vaquitas). We can obtain enough experienced observers from past vaquita surveys, plus some observers from the EU porpoise efforts to staff the cruise. Two options for ships are presented. Option 1 uses the same ship (R/V Ocean Starr) as past surveys in 1993, 1997 and 2008, and requires 64 days in the study area to obtain at least 40 vaquita sightings with 95% probability (Appendix 5). Option 2 assumes that another ship (which still meets the requirements of Appendix 3) will be used. In this case, 85 days in the study area will be required to obtain 60 sightings (Appendix 5). Option 1 needs fewer sea days and fewer sightings because some of the ship-specific parameters to estimate abundance are already known for
3
Ocean Starr from past surveys. A new ship (Option 2) requires additional data (more days and more sightings) to estimate the key parameters reliably. In addition, the Ocean Starr and Ocean Rover (another ship owned by Stabbart Marine that has been used in many marine mammal surveys) have awning and metal plates to support the 25X binoculars. If another ship is used, an awning and some method of supporting the 25X binoculars will have to be installed. Because the ship survey will use standard software and analytical methods, results from the area surveyed by the ship is anticipated approximately six weeks following the surveys. With acoustic analysts working throughout the survey, it is anticipated that acoustic CPOD data should be processed within six weeks after the survey. Pooling the visual and acoustic data to make a total abundance estimate will take an additional six weeks such that abundance estimates should be ready 3 months after the conclusions of field operations. Finally, because this work affects the management of a critically endangered species which, in turn, affects the livelihood of thousands of people, it is strongly recommended that the survey design be reviewed by the best available experts in marine mammal visual and acoustic surveys. We propose to request such a review to both the Society for Marine Mammalogy (the international scientific society for the study of marine mammals) and the International Whaling Commission’s Scientific Committee, which developed standards for surveys of marine mammals. We anticipate that the review could be completed within a few weeks. The total estimated costs are: Option 1: $37,726,000 (MXN), Option 2: $52,743,000 (MXN). Details of the budget are given in Appendix 6. Survey proposal synopsis The bulleted list summarizes the information for 2 ship options (using Ocean Starr or not) together with pros and cons for each option. Option 1 is split into 2 parts (Option 1a and 1b) depending on the time of the survey. Overall, use of the Ocean Starr is strongly recommended because this ship offers the best chance of a reliable abundance estimate that can be compared to previous estimates. Because the Ocean Starr was the ship used in the past, an abundance estimate will be possible even with only a few vaquita sightings. If another ship is used, there is a risk that a low number of sightings could lead to a very uncertain estimate of vaquita abundance in 2015.
4
Key summary points for survey option decision: Option 1a: Ocean Starr February-April 2015 Cost: 52.7 Million pesos Pros:
• Greatest chance for success and high precision • Set-up easy • Analysis standard • Fastest option for obtaining new abundance estimate (August 1, 2015) • Lower cost than Option 2
Cons: • Vessel is not available from May-September 2015 • With 6 weeks remaining before the cruise starting in February will be
stressful • Funds must be readily available as the ship and observers will need initial
payments in January • All fishing must end before the start date of cruise in February including
commercial trawling • Given the totoaba issue, greatly increased enforcement will be needed
immediately to prevent loss of CPODs to illegal fishing Option 1b: Ocean Starr October-December Cost: 52.7 Million pesos Pros:
• Greatest chance for success and high precision • Set-up easy • Analysis standard • Lower cost than Option 2
Cons: • No fishing can be allowed (including commercial trawlers) during the shrimp
season • Development of markets for vaquita-friendly shrimp not possible • Economic analysis of compensation needed for small-type trawls not
possible because trawling cannot occur during the survey (though CPODs with visible buoys marking their position could allow some well controlled trawling)
• Slowest option for obtaining new abundance estimate (March 1, 2016)
Option 2: different ship (Ocean Rover?) timing unknown Cost: $52.71 Million pesos Pros:
• May allow use of summer season (lowest winds) • If the survey is in summer, it has the least impact on fishing • Later start time than Option 1a will allow for better/less stressful
preparation • Flexibility on timing may allow more time to prepare
1 Very rough estimate since costs will differ for different ships.
5
• Flexibility on timing may allow an abundance estimation time sooner than 1b Cons:
• Riskiest option with some potential for low precision • Set-up harder depending on the ship; any ship other than Ocean Rover or
Ocean Starr will require installation of awning and attachments for 25X binoculars on the observation deck
• Analysis more difficult with more factors needing estimation • Greatest uncertainty overall with unknown research timing • Higher cost than Option 1
In summary, the key recommendations for immediate action are: (1) decide which ship to use (2) decide when the survey will occur (3) have the survey design reviewed by experts in marine mammal visual and acoustic survey design. Other considerations: The survey in 2008 had an independent effort to obtain photographs of vaquita. These photographs have been very important for getting media coverage of the problem. There are several options for good vessels that could carry such an independent team and media to cover the efforts to save vaquita. Having the ship that can find the vaquita (but needs to keep surveying) and an independent vessel to photograph/video the vaquita worked very well. We can supply cost estimates for this option if desired.
6
Appendix 1: An Evaluation of Potential Abundance Estimation Methods for Vaquita
Executive Summary
A wide variety of methods have been developed and used to estimate the abundance of cetaceans (whales, dolphins and porpoises). Methods fall into three general categories: complete enumeration methods (census), density-based survey methods, and mark-recapture methods. Many of these methods have been tried for estimating vaquita abundance in the past. Here we review all available methods and evaluate their utility for estimating vaquita abundance in 2015. We conclude that ship-based visual density estimation complemented by acoustic surveys in shallow waters is the only practical method to obtain a precise estimate of vaquita abundance. Regardless of the method used, survey design and analysis methods should be reviewed by an international team of experts to ensure the credibility of the results. Pilot studies are recommended if new methods are used.
Survey Methods Complete Enumeration Methods (Census) The size of human populations in many countries is determined using a census or complete enumeration of all individuals. This works well for humans if the vast majority of individuals can be identified by a permanent address, but even in developed countries some individuals are missed. Outside of zoos and aquaria, the only cetacean population in the world that is censused by complete enumeration is southern resident killer whales in Puget Sound. That method works for them because all individuals are identifiable in a good photograph and because all individuals are seen and photographed every year. Complete enumeration methods will not work for vaquita because the vast majority of animals are not individually identifiable in a good photograph (see mark-recapture methods, below). All other abundance estimation methods are statistically based and are subject to random sampling variability. For vaquita, there is no method that can estimate abundance without some degree of statistical uncertainty. The best method is one that minimizes this uncertainty for a given survey budget. Density-based Survey Methods Density-based survey methods are based on estimating the density of individuals (number of individuals per square kilometer) and then extrapolating that density to a study area. Abundance is estimated as animal density times the size of the study area. This method does not require that all individuals be seen and it doesn’t matter if some individuals are seen more than once. Distance-sampling survey methods (Buckland et al, 2001) are a sub-set of density-based methods and require recording the distance between the survey platform (ship or plane) and the animals that are seen. Distance-sampling survey methods include line-transect surveys from boats, ships and aircraft and point-transect surveys from fixed locations. Strip and quadrat surveys are also density-based survey methods but are less efficient and are more typically used for plants and slowly moving animals. Three key requirements for all density-based survey methods are: 1) the survey must be random with respect to
7
the distribution of the animal within the study area, 2) the probability of detection must be estimated (as a function of distance from the survey platform for line- and point-transect surveys), and 3) animals must be detected before they move in reaction to the survey platform. Visual Line-transect Survey Methods from Boats & Ships Visual line-transect surveys have been used for many species of cetaceans in many populations around the world. The method has been used successfully on ship-based surveys for vaquita in 1993, 1997, and 2008 and has generated the most precise estimates of vaquita abundance (Barlow et al. 1997; Jaramillo et al. 1999; Gerrodette et al. 2011). Previously, vaquita abundance was crudely estimated from data collected from small boat surveys in 1986-1988 (Barlow et al. 1997), but those estimates were not rigorous because the data were not collected using line-transect methods and because detection probabilities were crudely estimated by guesswork and comparison to other surveys for a different species. The 1997 survey used two independent teams of visual observers on the same ship, and a comparison of data from these two teams showed that vaquita started avoiding the vessel at distances of greater than 1km. High-powered, pedestal-mounted binoculars are required in order to detect vaquita before they move away from the transect line in reaction to the ship. Fujinon 25X150 binoculars were used on each of the three ship-based vaquita surveys. This requirement means that the ship must be large enough (>50 meters length) and stable enough to allow use of such binoculars. The vessel must also be large enough to carry two teams of observers to allow estimation of the probability of detection at zero distance. One drawback of using a large ship for visual line-transect surveys of vaquita is the need to survey portions of the vaquita distribution that are too shallow to survey by large ship. During the 1997 survey the Mexican research ship BIP XI was used for the shallow water areas. This converted shrimp trawler did not have a configuration (height and stability) suitable for the 25x binoculars, so hand-held binoculars were used. Only 6 sightings were made on-effort in the shallow-water area when the estimated abundance was approximately 600 vaquitas. Because many fewer vaquitas were expected to remain in 2008 (because of ongoing unsustainable deaths in gillnets between 1997 and 2008) a different approach was used: a small sailing vessel towing a hydrophone array (see acoustic line-transect survey methods, below). This was reasonably successful, but again there was sparse sampling and few detections in shallow waters (see below). Because a significant portion of vaquita’s range extends into shallow waters, an alternative survey method would be needed to extend the survey into these shallow waters if a ship survey is done in 2015. Visual Line-transect Survey Methods from Aircraft Aerial surveys are commonly used to estimate the abundance of harbor porpoise in the U.S. and in Europe. An experimental aerial survey for vaquita was attempted in 1991 (Barlow et al. 1993). Less than two vaquitas were seen on this survey per 1000 km of transect line. Given the extreme turbidity of waters in the upper Gulf of California and the rapid changes in turbidity over short distances (Barlow et al. 1993), no method was found to effectively estimate the probability of detecting vaquitas on the transect line during an aerial survey. The same problem would exist
8
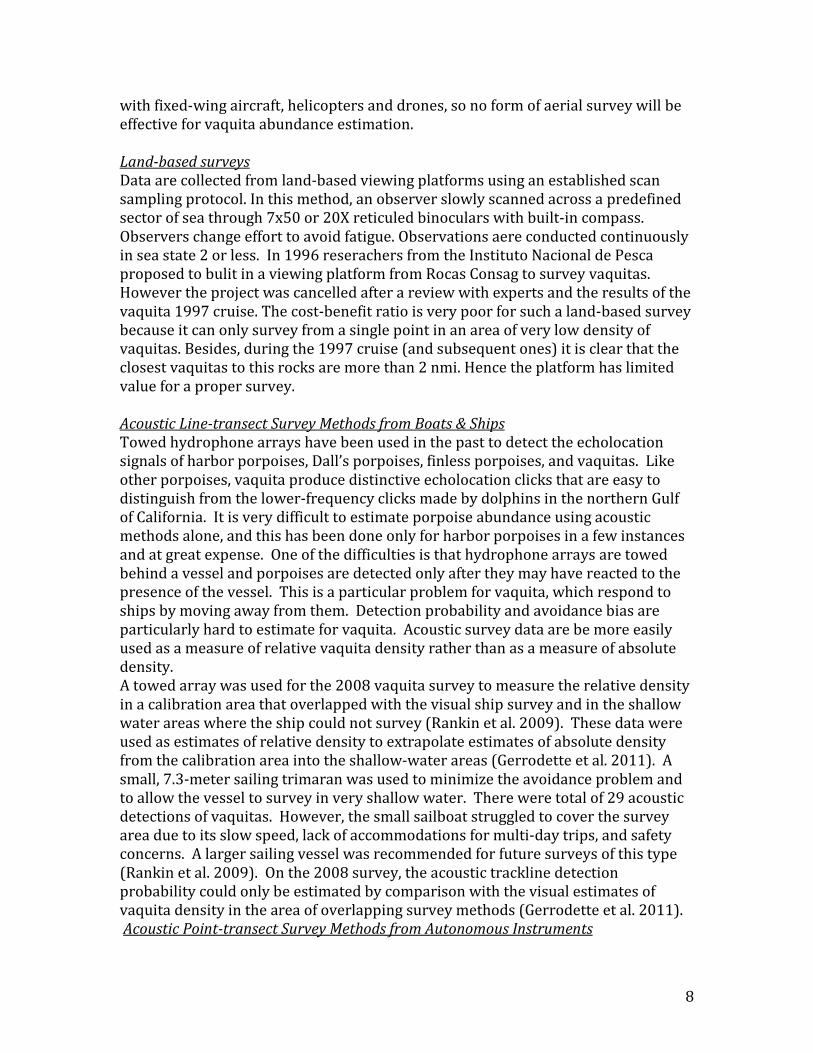
with fixed-wing aircraft, helicopters and drones, so no form of aerial survey will be effective for vaquita abundance estimation. Land-based surveys Data are collected from land-based viewing platforms using an established scan sampling protocol. In this method, an observer slowly scanned across a predefined sector of sea through 7x50 or 20X reticuled binoculars with built-in compass. Observers change effort to avoid fatigue. Observations aere conducted continuously in sea state 2 or less. In 1996 reserachers from the Instituto Nacional de Pesca proposed to bulit in a viewing platform from Rocas Consag to survey vaquitas. However the project was cancelled after a review with experts and the results of the vaquita 1997 cruise. The cost-benefit ratio is very poor for such a land-based survey because it can only survey from a single point in an area of very low density of vaquitas. Besides, during the 1997 cruise (and subsequent ones) it is clear that the closest vaquitas to this rocks are more than 2 nmi. Hence the platform has limited value for a proper survey. Acoustic Line-transect Survey Methods from Boats & Ships Towed hydrophone arrays have been used in the past to detect the echolocation signals of harbor porpoises, Dall’s porpoises, finless porpoises, and vaquitas. Like other porpoises, vaquita produce distinctive echolocation clicks that are easy to distinguish from the lower-frequency clicks made by dolphins in the northern Gulf of California. It is very difficult to estimate porpoise abundance using acoustic methods alone, and this has been done only for harbor porpoises in a few instances and at great expense. One of the difficulties is that hydrophone arrays are towed behind a vessel and porpoises are detected only after they may have reacted to the presence of the vessel. This is a particular problem for vaquita, which respond to ships by moving away from them. Detection probability and avoidance bias are particularly hard to estimate for vaquita. Acoustic survey data are be more easily used as a measure of relative vaquita density rather than as a measure of absolute density. A towed array was used for the 2008 vaquita survey to measure the relative density in a calibration area that overlapped with the visual ship survey and in the shallow water areas where the ship could not survey (Rankin et al. 2009). These data were used as estimates of relative density to extrapolate estimates of absolute density from the calibration area into the shallow-water areas (Gerrodette et al. 2011). A small, 7.3-meter sailing trimaran was used to minimize the avoidance problem and to allow the vessel to survey in very shallow water. There were total of 29 acoustic detections of vaquitas. However, the small sailboat struggled to cover the survey area due to its slow speed, lack of accommodations for multi-day trips, and safety concerns. A larger sailing vessel was recommended for future surveys of this type (Rankin et al. 2009). On the 2008 survey, the acoustic trackline detection probability could only be estimated by comparison with the visual estimates of vaquita density in the area of overlapping survey methods (Gerrodette et al. 2011). Acoustic Point-transect Survey Methods from Autonomous Instruments
9
In many cases, acoustic data can be collected much more cost-effectively with stationary instruments than with a towed hydrophone array. Instruments (called CPODs) have been developed that can be anchored on the sea floor and collect porpoise acoustic data continuously for 5-6 months. A network of 48 CPODs has been deployed in the vaquita refuge over the past four summers. A larger network of CPODs have recently been used to estimate the density and abundance of harbor porpoise in the Baltic Sea. The probability of detecting a porpoise as a function of its distance from a CPOD cannot be estimated from a sparse array of single instruments. In the Baltic, a dense array of CPODs was deployed in an area of very high harbor porpoise density, thus allowing CPODs to be used to make absolute estimates of porpoise density. Because there are no areas of high vaquita density, this approach will not work for vaquitas. However, CPODs can be used to estimate relative vaquita density much more precisely than towed hydrophones because many CPODs can be deployed at the same time and collect data day and night for months. Mark-recapture Methods Mark-recapture is a commonly used, non-density-based method to estimate wildlife abundance. This method requires that individuals are individually recognized. It is not possible to tag cetaceans in large numbers, so individuals are recognized using distinctive marks seen in high-resolution photographs. This so-called photo-identification method works well with humpback whales and killer whales because every individual in the population has distinctive marks. An intensive photo-identification study was conducted during the 2008 vaquita survey, and only two photographs were obtained of distinctively marked individuals (Jefferson, pers.
comm.). No other individuals had marks that were sufficiently distinct to allow them to be recognized if seen at a later date. For this reason, mark-recapture by photo-identification will not work to estimate vaquita abundance. Also, vaquita cannot be physically tagged or genetically tagged (by biopsy) because they cannot be approached. Although Rocas Consag apprears to be in the middle of the vaquita territory (black triangle in the figure), vaquitas appear to avoid this rock and the idea of visual studies from this location, including photographic identification studies, have been abandoned. Mark-recapture methods can be ruled out based on these experiences.
Conclusion We conclude that visual line-transect surveys from ships are the most robust method to estimate vaquita abundance. The ship must be large enough to accommodate multiple teams of observers and be stable enough to mount 25-power, pedestal mounted binoculars. Such a ship will not be able to survey in
10
shallow-water parts of the vaquita distribution. Acoustic surveys are a cost-effective method to measure relative vaquita density and thereby extrapolate density from the area surveyed by the ship to areas that are too shallow. Autonomous acoustic recorders (CPODs) are much more cost-effective than towed hydrophones for the acoustic component of such a survey.
Pilot Surveys The use of pilot surveys is strongly recommended whenever an inexperienced team first applies a survey method to estimate cetacean abundance (Dawson et al. 2008).
Expert Peer-review It is extraordinarily important for a survey plan to be reviewed by a team of experts. No survey plan is perfect and all plans benefit from the careful review by experienced experts in survey design, execution, and analysis. For credibility and transparency, reviews and responses should be in writing.
References Barlow, J., T. Gerrodette, and G. Silber. 1997. First estimates of vaquita abundance.
Mar. Mamm. Sci. 13(1): 44-58. Barlow, J., L. Fleischer, K. A. Forney, and O. Maravilla-Chavez. 1993. An
experimental aerial survey for vaquita (Phocoena sinus) in the northern Gulf of California, Mexico. Mar. Mamm. Sci. 9(1):89-94.
Buckland, S. T., D. R. Anderson, K. P. Burnham, J. L. Laake, D. L. Borchers, and L. Thomas. 2001. Introduction to Distance Sampling: Estimating abundance of biological populations. Oxford University Press, Oxford. 432pp.
Dawson, S., P. Wade, E. Slooten, and J. Barlow. 2008. Design and field methods for sighting surveys of cetaceans in coastal and riverine habitats. Mammal Review 38(1):19-49.
Gerrodette, T., Taylor, B. L., Swift, R., Rankin, S., Jaramillo‐Legorreta, A. M., & Rojas‐Bracho, L. 2011. A combined visual and acoustic estimate of 2008 abundance, and change in abundance since 1997, for the vaquita, Phocoena sinus. Marine Mammal Science, 27(2), E79-E100.
Jaramillo‐Legorreta, A. M., Rojas‐Bracho, L., & Gerrodette, T. 1999. A new abundance estimate for vaquitas: first step for recovery. Marine Mammal Science, 15(4), 957-973.
Rankin, S., Swift, R., Risch, D., Taylor, B., Rojas-Bracho, L., Jaramillo-Legorreta, A., & Kimura, S. 2009. Vaquita expedition 2008: Preliminary results from a towed hydrophone survey of the vaquita from the Vaquita Express in the upper Gulf of California.
11
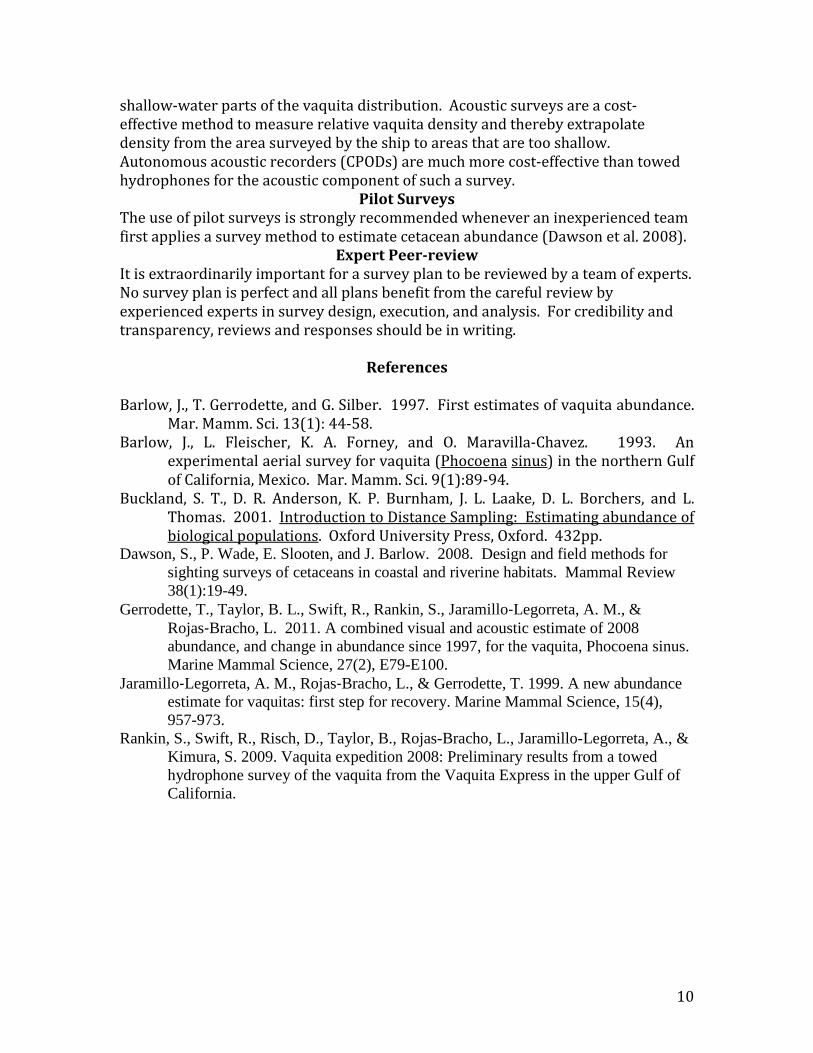
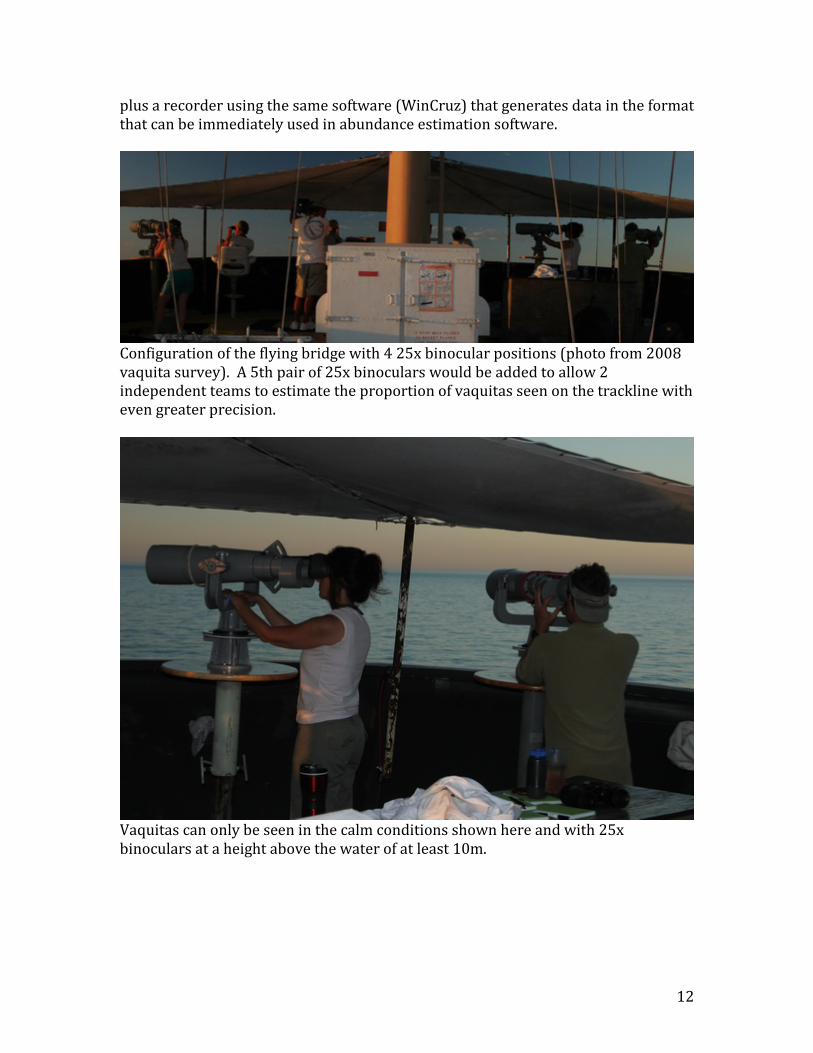
Appendix 2: Visual survey tracklines and physical setup. Tracklines would be repeated from the 1997 and 2008 surveys. Tracklines are oriented as in past surveys to be north-south to minimize glare
on the trackline. The configuration of the flying bridge would be similar to that shown below from the 2008 survey, which had 3 full-time 25x binocular observers
12
plus a recorder using the same software (WinCruz) that generates data in the format that can be immediately used in abundance estimation software.
Configuration of the flying bridge with 4 25x binocular positions (photo from 2008 vaquita survey). A 5th pair of 25x binoculars would be added to allow 2 independent teams to estimate the proportion of vaquitas seen on the trackline with even greater precision.
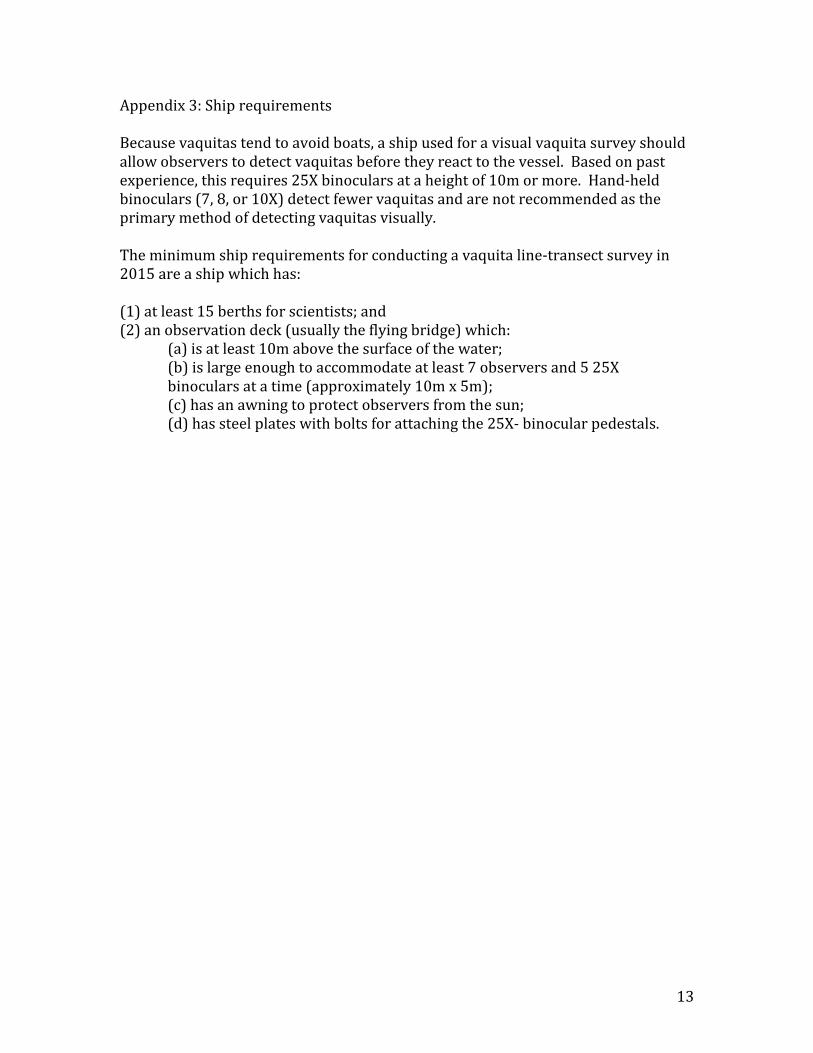
Vaquitas can only be seen in the calm conditions shown here and with 25x binoculars at a height above the water of at least 10m.
13
Appendix 3: Ship requirements Because vaquitas tend to avoid boats, a ship used for a visual vaquita survey should allow observers to detect vaquitas before they react to the vessel. Based on past experience, this requires 25X binoculars at a height of 10m or more. Hand-held binoculars (7, 8, or 10X) detect fewer vaquitas and are not recommended as the primary method of detecting vaquitas visually. The minimum ship requirements for conducting a vaquita line-transect survey in 2015 are a ship which has: (1) at least 15 berths for scientists; and (2) an observation deck (usually the flying bridge) which:
(a) is at least 10m above the surface of the water; (b) is large enough to accommodate at least 7 observers and 5 25X binoculars at a time (approximately 10m x 5m); (c) has an awning to protect observers from the sun; (d) has steel plates with bolts for attaching the 25X- binocular pedestals.

14
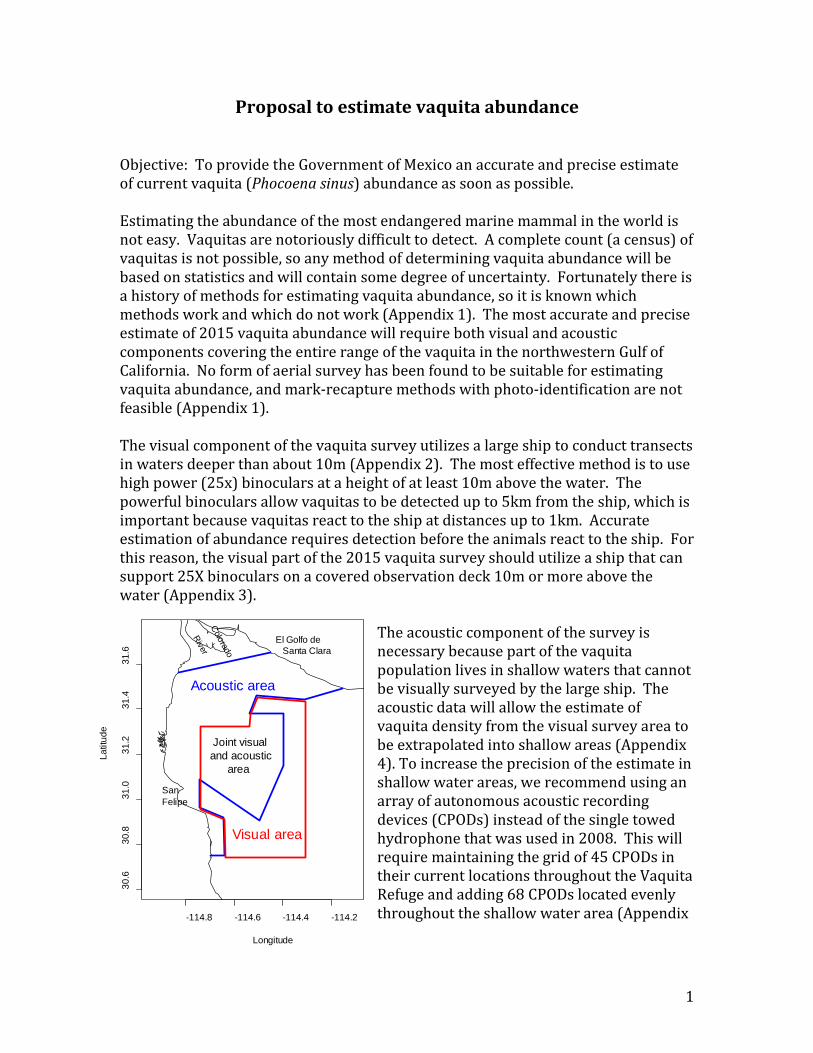
Appendix 4: Acoustic component Estimating the density of vaquitas in the shallow-water areas will depend on continued monitoring of the Vaquita Refuge in the grid shown below plus adding CPODs to the shallow water area.
-115.0 -114.5 -114.0 -113.530.5
31.0
31.5
32.0
Map showing the sampling grid of acoustic detectors used to estimate vaquita abundance in shallow waters. Black dots inside vaquita refuge will be used to calibrate acoustic data based on visual density estimate in this polygon. Blue and red dots are detectors used to estimate density in shallow water areas. Blue dots correspond to west stratum and red to north stratum after Gerrodette et al. (2011).
Vaquita population trend has been estimated using the acoustic grid inside vaquita refuge since 2011, including annual sampling periods (June to September) until 2014 (CICESE, 2010, 2011, 2012, 2014). The estimate using sampling periods from 2011 to 2013 resulted in an annual 18.5% decrease, which addressed to an estimate of abundance of less than 100 individuals (CIRVA, 2014). The grid inside vaquita refuge lies entirely in waters able to be surveyed by the boat applying visual techniques. Hence, we can use the past experience acoustically sampling this area to calibrate acoustic data to estimate density based on visual data that will be generated at the same time and area.
15
Inside refuge the density of sampling stations is about 36 sites per 1000 Km2. Given the absence of previous acoustic data in shallow waters, it is recommended to maintain at least the same density of acoustic sampling sites in this area as inside vaquita refuge. The last has an area of 1262.84 Km2. For the 1903.61 Km2 of the shallow area it is required to deploy 68 acoustic detectors (red and blue dots in figure above). With the 45 sites inside refuge, we could be sampling in 113 sites per day, which can result in about 7000 to 10000 days of data depending on the duration of the survey. It must be noted that as contrary to the 2008 abundance estimate, based on a sailboat to obtain acoustic data, the acoustic methods in this proposal will generate data continuously all along shallow area and calibration area all time. To accomplish this goal it will be required to assure that all acoustic detectors (C-PODs) are operational and with memory available all time. To meet this requirement it is planned to interchange equipment during the survey at least two times. It will allow downloading data, change memory cards and replace batteries. It also will allow having raw data to analyze as survey advance, instead to wait until the end of the whole survey. Retrieve the acoustic equipment is not a trivial task. Under the methods used inside vaquita refuge it is needed to move a panga to the sites and locate the mooring using a hook trawled behind the boat, as there are no sign of the moorings in surface in order to avoid theft or vandalism. Three methods can be used to retrieve equipment depending on the expectations of fishing activities in the area during the survey:
a) If it can be assured that no fishing will occur, every mooring can be marked in surface with a buoy, which would allow a very fast retrieval of equipment, reducing greatly funds needed to construct more complicated moorings, personnel and fuel.
b) If it is anticipated that fishing could occur, moorings could be deployed using longlines as in the fishing techniques. A boat like Unicap 16, equipped with a stern winch could be used to deploy and retrieve the lines. It could reduce retrieval times, as it will be needed to locate only one extreme of the longline per time.
c) If a boat with a reliable winch is not allocated, the traditional method of individual moorings would be applied, which would require the hiring of several field teams, every one composed out of a panga and three operators. Given past experience, it will be required to have at least 8 teams to assure effective deployment-retrieval operations, but 10 would be better.
Data analysis would occur as data become available after retrieval periods. It is planned to assemble a group of four analysts, composed of two experienced ones of the Mexican team working for the monitoring scheme inside refuge, and other two coming from SAMBAH program (monitoring of harbor porpoises in Baltic Sea, http://www.sambah.org/). As many days of data will be generated in a short time period, analyst will be focused into review a subset of data that can be compared in
16
performance with the GENENC algorithm. It is anticipated from past data that GENENC performs very alike to analysts (CIRVA 2014), which would reduce greatly analysis time and analysts required. It would be required to test GENENC performance over different acoustic conditions, in order to assure reliable analysis. In case GENENC do not perform well under some conditions, analysis will be completed by the analysis team. CICESE. 2010 (not published). Implementación de un Esquema de Monitorización
Acústica para la Vaquita. Reporte para el Instituto Nacional de Ecología, SEMARNAT. Centro de Investigación Científica y de Educación Superior de Ensenada. Ensenada, B.C. 16 de noviembre de 2010.
CICESE. 2011 (not published). Inicio de Operaciones y Calibración del Esquema de Monitorización Acústica para la Población de la Vaquita. Reporte para el Instituto Nacional de Ecología, SEMARNAT. Centro de Investigación Científica y de Educación Superior de Ensenada. Ensenada, B.C. 17 de octubre de 2011.
CICESE. 2012 (not published). Segunda Campaña del Esquema de Monitorización Acústica de la Población de Vaquita. Reporte para el Instituto Nacional de Ecología, SEMARNAT. Centro de Investigación Científica y Educación Superior de Ensenada. Ensenada, B.C., 8 de octubre de 2012.
CICESE. 2014 (not published). Cuarta Campaña de Monitorización Acústica de la Población de Vaquita Marina. Reporte para la Comisión Nacional de Áreas Naturales Protegidas, SEMARNAT. Centro de Investigación Científica y Educación Superior de Ensenada. Ensenada, B.C., 8 de diciembre de 2014.
CIRVA. 2014. Report of the Fifth Meeting of the ‘Comité Internacional para la Recuperación de la Vaquita’. Ensenada, B.C., México. July 8-10, 2014. 43 pp.
Gerrodette, T., B. L. Taylor, R. Swift, S. Rankin, A. Jaramillo L, and L. Rojas-Bracho. 2011. A combined visual and acoustic estimate of 2008 abundance, and change in abundance since 1997, for the vaquita, Phocoena sinus. Marine Mammal Science 27:E79-E100.
17
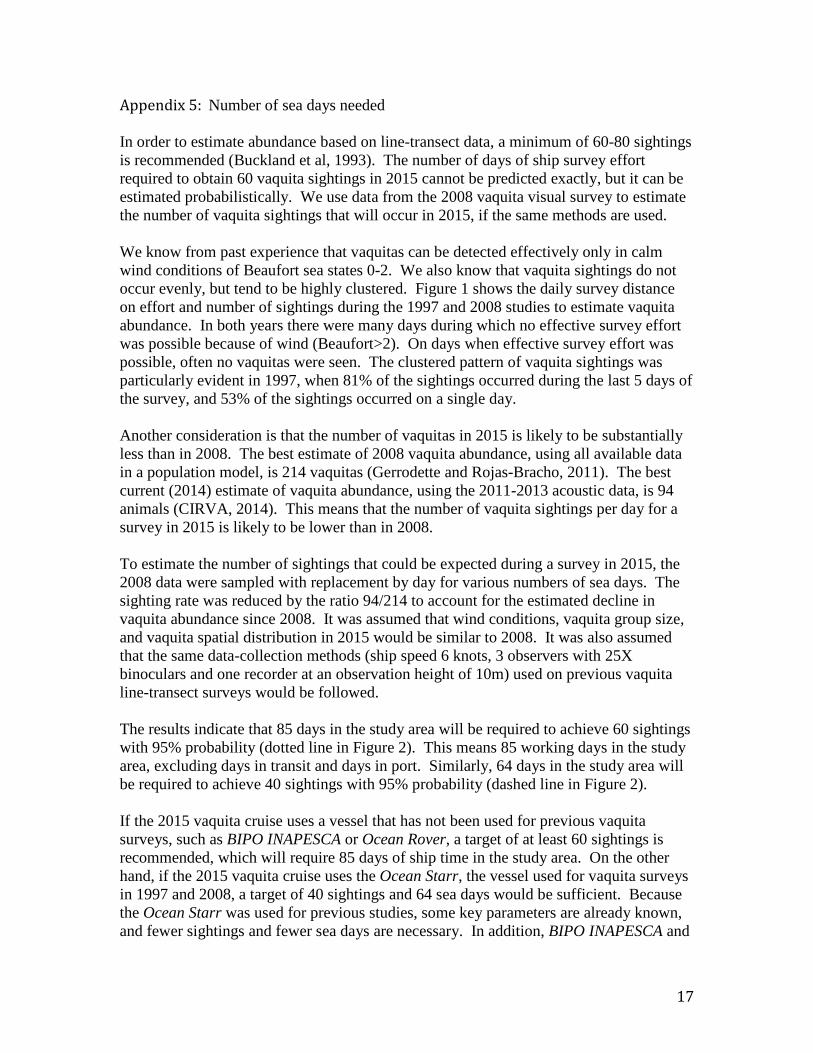
Appendix 5: Number of sea days needed In order to estimate abundance based on line-transect data, a minimum of 60-80 sightings is recommended (Buckland et al, 1993). The number of days of ship survey effort required to obtain 60 vaquita sightings in 2015 cannot be predicted exactly, but it can be estimated probabilistically. We use data from the 2008 vaquita visual survey to estimate the number of vaquita sightings that will occur in 2015, if the same methods are used. We know from past experience that vaquitas can be detected effectively only in calm wind conditions of Beaufort sea states 0-2. We also know that vaquita sightings do not occur evenly, but tend to be highly clustered. Figure 1 shows the daily survey distance on effort and number of sightings during the 1997 and 2008 studies to estimate vaquita abundance. In both years there were many days during which no effective survey effort was possible because of wind (Beaufort>2). On days when effective survey effort was possible, often no vaquitas were seen. The clustered pattern of vaquita sightings was particularly evident in 1997, when 81% of the sightings occurred during the last 5 days of the survey, and 53% of the sightings occurred on a single day. Another consideration is that the number of vaquitas in 2015 is likely to be substantially less than in 2008. The best estimate of 2008 vaquita abundance, using all available data in a population model, is 214 vaquitas (Gerrodette and Rojas-Bracho, 2011). The best current (2014) estimate of vaquita abundance, using the 2011-2013 acoustic data, is 94 animals (CIRVA, 2014). This means that the number of vaquita sightings per day for a survey in 2015 is likely to be lower than in 2008. To estimate the number of sightings that could be expected during a survey in 2015, the 2008 data were sampled with replacement by day for various numbers of sea days. The sighting rate was reduced by the ratio 94/214 to account for the estimated decline in vaquita abundance since 2008. It was assumed that wind conditions, vaquita group size, and vaquita spatial distribution in 2015 would be similar to 2008. It was also assumed that the same data-collection methods (ship speed 6 knots, 3 observers with 25X binoculars and one recorder at an observation height of 10m) used on previous vaquita line-transect surveys would be followed. The results indicate that 85 days in the study area will be required to achieve 60 sightings with 95% probability (dotted line in Figure 2). This means 85 working days in the study area, excluding days in transit and days in port. Similarly, 64 days in the study area will be required to achieve 40 sightings with 95% probability (dashed line in Figure 2). If the 2015 vaquita cruise uses a vessel that has not been used for previous vaquita surveys, such as BIPO INAPESCA or Ocean Rover, a target of at least 60 sightings is recommended, which will require 85 days of ship time in the study area. On the other hand, if the 2015 vaquita cruise uses the Ocean Starr, the vessel used for vaquita surveys in 1997 and 2008, a target of 40 sightings and 64 sea days would be sufficient. Because the Ocean Starr was used for previous studies, some key parameters are already known, and fewer sightings and fewer sea days are necessary. In addition, BIPO INAPESCA and
18
Ocean Rover are both larger than the Ocean Starr, and the draft is greater. In 2008, the Ocean Starr was able to carry out transects in 59% of the vaquita range (Gerrodette et al, 2011). The rest of the vaquita range was too shallow, and acoustic sampling from a catamaran was used. If a larger ship is used in 2015, it will be able to cover less than 59% of the vaquita’s range. This means that the 2015 vaquita abundance estimate is likely to have greater uncertainty if a larger ship is used. Buckland, S. T., D. R. Anderson, K. P. Burnham, and J. L. Laake. 1993. Distance
Sampling: Estimating Abundance of Biological Populations. Chapman & Hall, London.
CIRVA. 2014. Report of the Fifth Meeting of the ‘Comité Internacional para la Recuperación de la Vaquita’. Ensenada, B.C., México. July 8-10, 2014. 43 pp.
Gerrodette, T., B. L. Taylor, R. Swift, S. Rankin, A. Jaramillo L, and L. Rojas-Bracho. 2011. A combined visual and acoustic estimate of 2008 abundance, and change in abundance since 1997, for the vaquita, Phocoena sinus. Marine Mammal Science 27:E79-E100.
Gerrodette, T. and L. Rojas-Bracho. 2011. Estimating the success of protected areas for the vaquita, Phocoena sinus. Marine Mammal Science 27:E101-E125.
19
0
20
40
60
80
100
120
1997
Dis
tanc
e o
n e
ffort
(k
* ** ******** ** ***** * ******* *August September
_ o
o
ooo
o
o
0
10
20
30
40
Num
ber
of s
ight
ings
o
0
20
40
60
80
100
120
2008
Dis
tanc
e o
n e
ffort
(k
* * * * * *** * *October November
_
o
ooo
o
oo
o
o0
10
20
30
40
Num
ber
of s
ight
ings
o
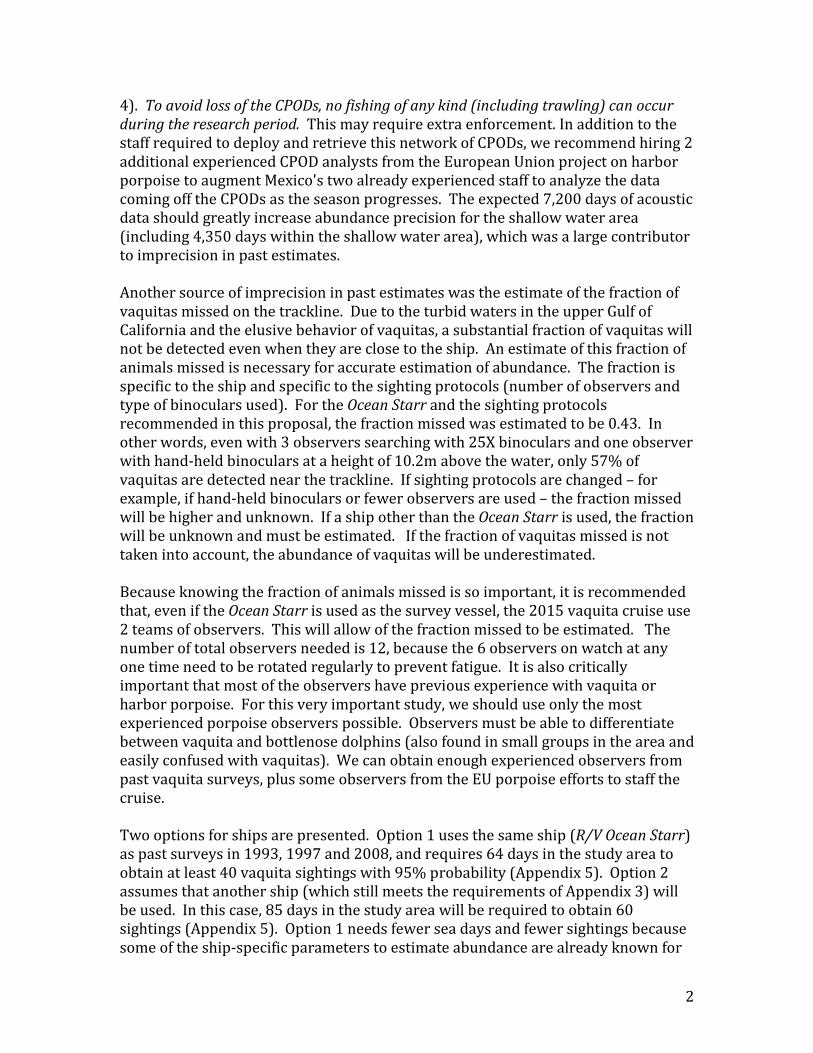
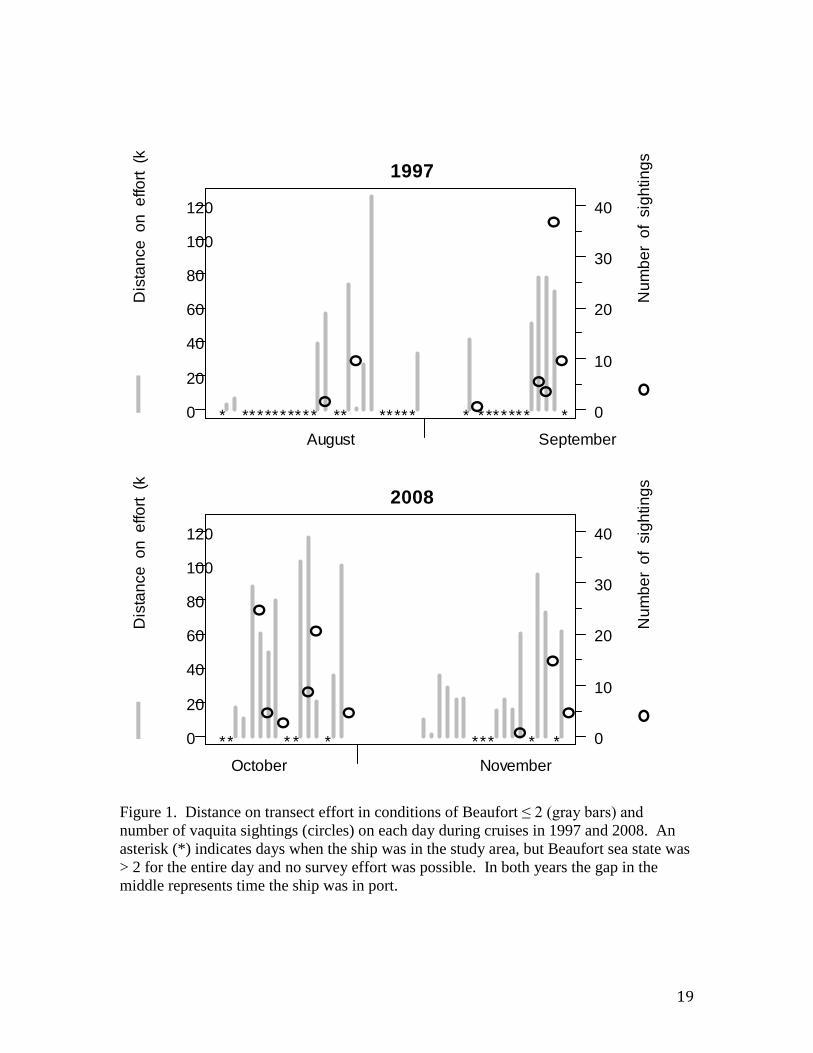
Figure 1. Distance on transect effort in conditions of Beaufort ≤ 2 (gray bars) and number of vaquita sightings (circles) on each day during cruises in 1997 and 2008. An asterisk (*) indicates days when the ship was in the study area, but Beaufort sea state was > 2 for the entire day and no survey effort was possible. In both years the gap in the middle represents time the ship was in port.
20
50 60 70 80 90
30
40
50
60
70
Number of sea days in study area
Num
ber
of v
aqui
ta s
ight
ings
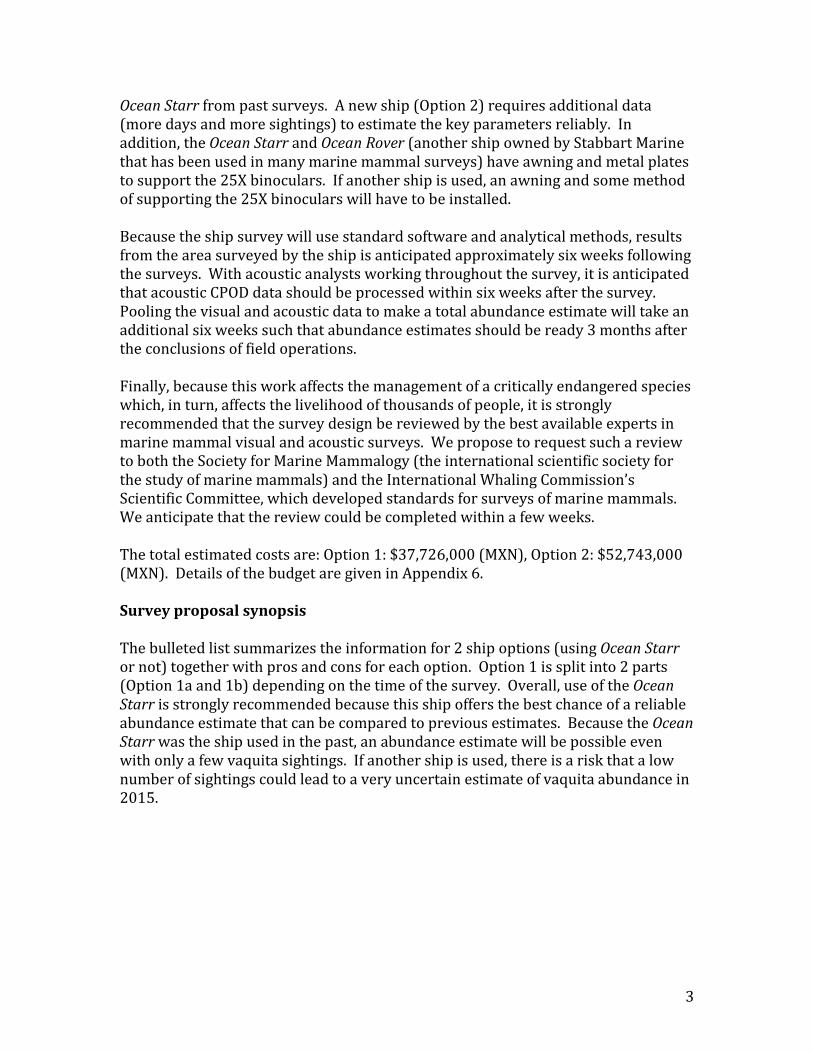
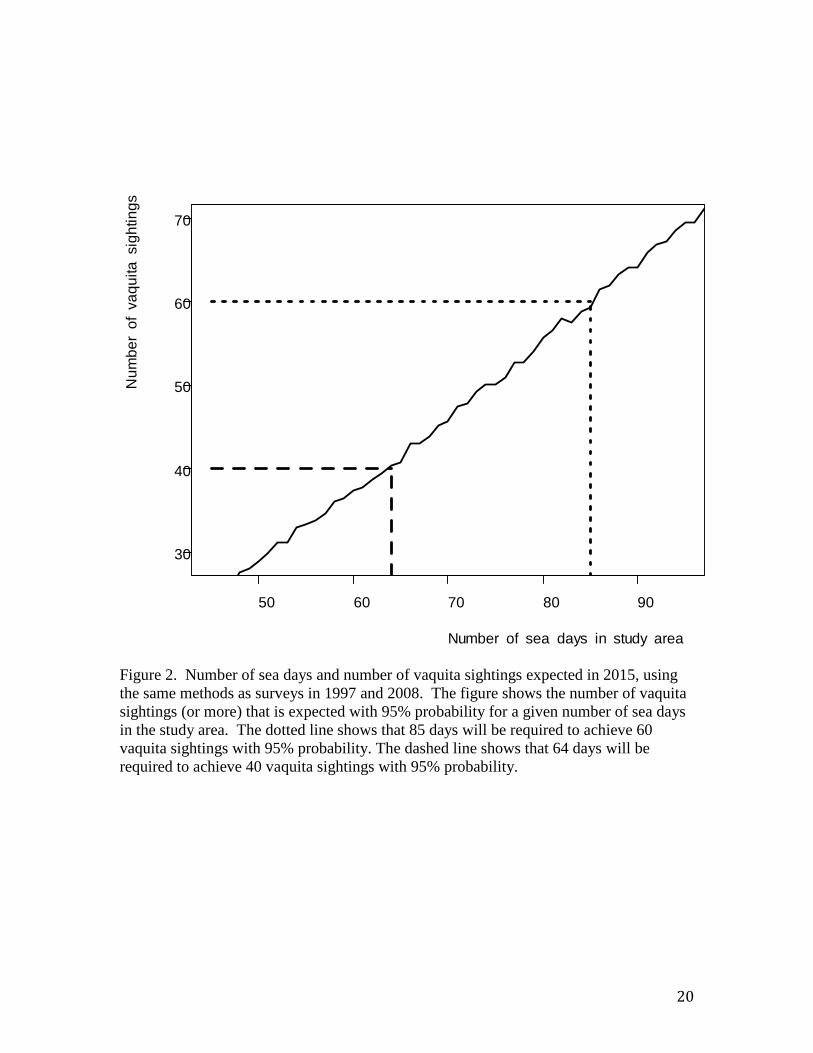
Figure 2. Number of sea days and number of vaquita sightings expected in 2015, using the same methods as surveys in 1997 and 2008. The figure shows the number of vaquita sightings (or more) that is expected with 95% probability for a given number of sea days in the study area. The dotted line shows that 85 days will be required to achieve 60 vaquita sightings with 95% probability. The dashed line shows that 64 days will be required to achieve 40 vaquita sightings with 95% probability.
21
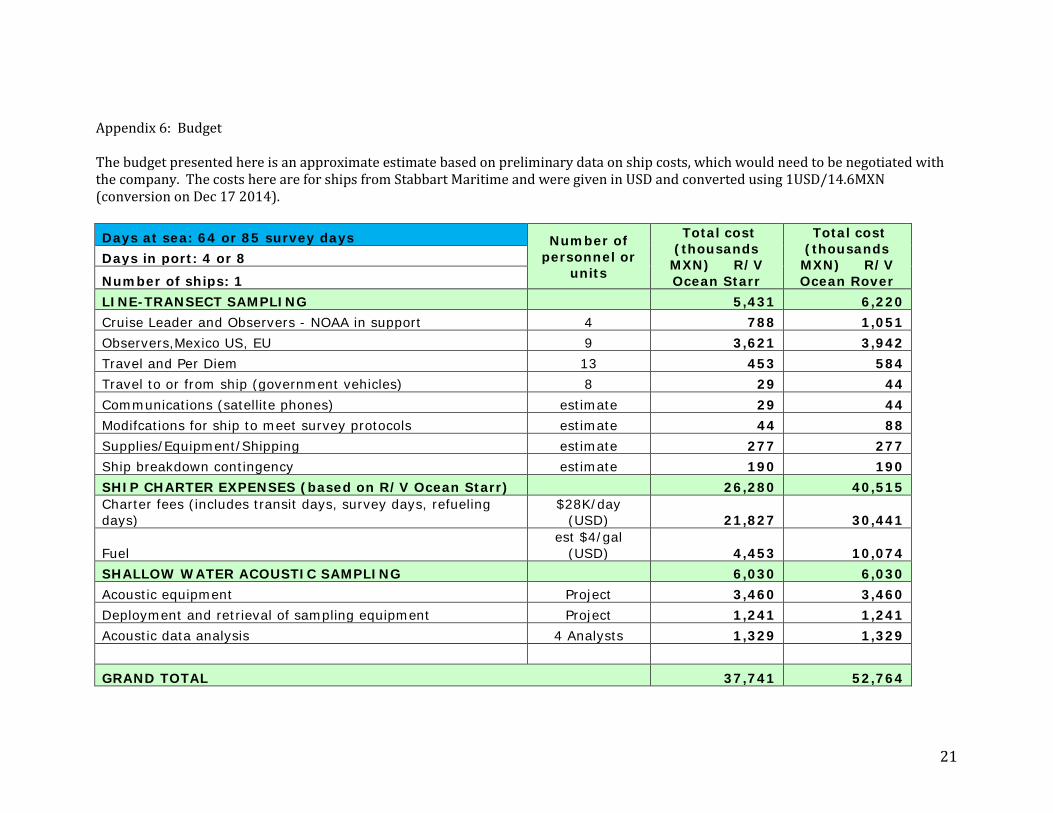
Appendix 6: Budget The budget presented here is an approximate estimate based on preliminary data on ship costs, which would need to be negotiated with the company. The costs here are for ships from Stabbart Maritime and were given in USD and converted using 1USD/14.6MXN (conversion on Dec 17 2014). Days at sea: 64 or 85 survey days Number of
personnel or units
Total cost (thousands MXN) R/V Ocean Starr
Total cost (thousands MXN) R/V Ocean Rover
Days in port: 4 or 8
Number of ships: 1 LINE-TRANSECT SAMPLING 5,431 6,220 Cruise Leader and Observers - NOAA in support 4 788 1,051 Observers,Mexico US, EU 9 3,621 3,942 Travel and Per Diem 13 453 584 Travel to or from ship (government vehicles) 8 29 44 Communications (satellite phones) estimate 29 44 Modifcations for ship to meet survey protocols estimate 44 88 Supplies/Equipment/Shipping estimate 277 277 Ship breakdown contingency estimate 190 190 SHIP CHARTER EXPENSES (based on R/V Ocean Starr) 26,280 40,515 Charter fees (includes transit days, survey days, refueling days)
$28K/day (USD) 21,827 30,441
Fuel est $4/gal
(USD) 4,453 10,074 SHALLOW WATER ACOUSTIC SAMPLING 6,030 6,030 Acoustic equipment Project 3,460 3,460 Deployment and retrieval of sampling equipment Project 1,241 1,241 Acoustic data analysis 4 Analysts 1,329 1,329
GRAND TOTAL 37,741 52,764
22
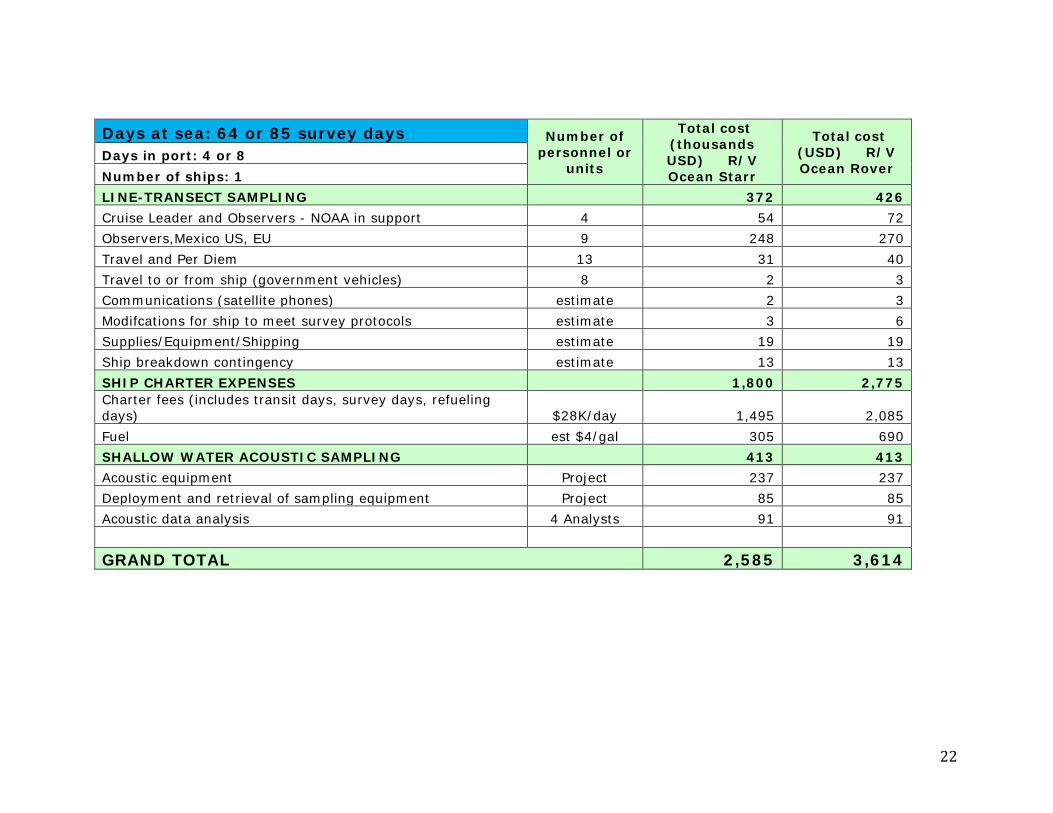
Days at sea: 64 or 85 survey days Number of personnel or
units
Total cost (thousands USD) R/V Ocean Starr
Total cost (USD) R/V Ocean Rover
Days in port: 4 or 8 Number of ships: 1 LINE-TRANSECT SAMPLING 372 426 Cruise Leader and Observers - NOAA in support 4 54 72 Observers,Mexico US, EU 9 248 270 Travel and Per Diem 13 31 40 Travel to or from ship (government vehicles) 8 2 3 Communications (satellite phones) estimate 2 3 Modifcations for ship to meet survey protocols estimate 3 6 Supplies/Equipment/Shipping estimate 19 19 Ship breakdown contingency estimate 13 13 SHIP CHARTER EXPENSES 1,800 2,775 Charter fees (includes transit days, survey days, refueling days) $28K/day 1,495 2,085 Fuel est $4/gal 305 690 SHALLOW WATER ACOUSTIC SAMPLING 413 413 Acoustic equipment Project 237 237 Deployment and retrieval of sampling equipment Project 85 85 Acoustic data analysis 4 Analysts 91 91
GRAND TOTAL 2,585 3,614