Proposal of Decision-making Model Using the DeLone and … · Keywords: Analytic Hierarchy Process,...
18
Acta Informatica Pragensia, 2015, 4(2): 122–139 DOI: 10.18267/j.aip.65 Peer-reviewed paper 122 ACTA INFORMATICA PRAGENSIA Volume 04 | Number 02 | 2015 Proposal of Decision-making Model Using the DeLone and McLean’s Information System Success Model Together with the AHP Radek Němec * , František Zapletal * Abstract The focus of the paper is to present an evaluation of a proposed decision-making model concept. The concept takes into account the quality of a currently used information system’s subsystem (the Business Intelligence subsystem in our case), as it is perceived by its current users. The Analytic Hierarchy Process (AHP) multi-criteria decision making method is used to support the concept with a hierarchical decision criteria structuring framework. A selected part of the DeLone and McLean’s (D&M) information system success assessment model is used for the determination of appropriate criteria (success factors). The D&M model is composed of information system quality assessment dimensions. These dimensions represent a solid base for surveying information system’s users accordi ng to their perception of key information system performance aspects. The presented model helps to combine opinions of the management and users successfully when carrying out important information system related decision. The results also illustrate the possibility of using the D&M model in a novel application together with the AHP method. Keywords: Analytic Hierarchy Process, DeLone & McLean’s model, success factors, multi - criteria decision-making, decision-making model, evaluation through case study. 1 Introduction Business Intelligence (BI) system is a key part of nearly every complex information system in many enterprises in the world. As a critical information system component it provides computerized decision-making process support for all levels of management. Every BI system is a subject to frequent changes in the systems’ architecture and data structures in order to maintain it in a state of full recency, see Turban et al. (2007). Responsible management of changes in the BI system requires rigorous analysis of changes impact by means of a specific evaluation framework that takes into account also the system performance. Such evaluation framework should acquire practically and also scientifically approved quality and economic metrics to be complex and enterprise-widely usable. From the user point of view, the quality of information system is usually characterized by flexibility, effectiveness, accessibility and timeliness of output metrics that are measured mainly on the system’s component level but also on the system level, see Stair and Reynolds (2010). Perception of these quality metrics by users indicates whether the system is designed according to users’ requirements. We can * Department of Systems Engineering, Faculty of Economics, Technical University of Ostrava, Sokolská tř. 33, 701 21, Ostrava 1, Czech Republic [email protected], [email protected]
Transcript of Proposal of Decision-making Model Using the DeLone and … · Keywords: Analytic Hierarchy Process,...
Acta Informatica Pragensia, 2015, 4(2): 122–139
DOI: 10.18267/j.aip.65
Peer-reviewed paper
122 ACTA INFORMATICA PRAGENSIA Volume 04 | Number 02 | 2015
Proposal of Decision-making Model Using the DeLone and McLean’s Information System Success Model Together with the AHP
Radek Němec*, František Zapletal*
Abstract
The focus of the paper is to present an evaluation of a proposed decision-making model concept. The concept takes into account the quality of a currently used information system’s subsystem (the Business Intelligence subsystem in our case), as it is perceived by its current users. The Analytic Hierarchy Process (AHP) multi-criteria decision making method is used to support the concept with a hierarchical decision criteria structuring framework. A selected part of the DeLone and McLean’s (D&M) information system success assessment model is used for the determination of appropriate criteria (success factors). The D&M model is composed of information system quality assessment dimensions. These dimensions represent a solid base for surveying information system’s users according to their perception of key information system performance aspects. The presented model helps to combine opinions of the management and users successfully when carrying out important information system related decision. The results also illustrate the possibility of using the D&M model in a novel application together with the AHP method.
Keywords: Analytic Hierarchy Process, DeLone & McLean’s model, success factors, multi-criteria decision-making, decision-making model, evaluation through case study.
1 Introduction
Business Intelligence (BI) system is a key part of nearly every complex information system in
many enterprises in the world. As a critical information system component it provides
computerized decision-making process support for all levels of management. Every BI system
is a subject to frequent changes in the systems’ architecture and data structures in order to
maintain it in a state of full recency, see Turban et al. (2007). Responsible management of
changes in the BI system requires rigorous analysis of changes impact by means of a specific
evaluation framework that takes into account also the system performance. Such evaluation
framework should acquire practically and also scientifically approved quality and economic
metrics to be complex and enterprise-widely usable. From the user point of view, the quality
of information system is usually characterized by flexibility, effectiveness, accessibility and
timeliness of output metrics that are measured mainly on the system’s component level but
also on the system level, see Stair and Reynolds (2010). Perception of these quality metrics by
users indicates whether the system is designed according to users’ requirements. We can
* Department of Systems Engineering, Faculty of Economics, Technical University of Ostrava,
Sokolská tř. 33, 701 21, Ostrava 1, Czech Republic
123 ACTA INFORMATICA PRAGENSIA Volume 04 | Number 02 | 2015
therefore assume that such perception can be used as a source for the definition of criteria in
making decisions about changes in the information system or a selected part. A level of
agreement of the user with these quality factors can then be a source of data for the evaluation
of possible options of eventual system improvement.
From a holistic point of view, the quality of information system affects also the performance
of business processes. This fact is emphasized by the fact that workflow task execution
commonly spans multiple departments and business roles, see Hočevar and Jaklič (2010).
A poorly and user unfriendly designed information system can degrade business process
workflow performance. The business value addition of tasks executed by employees that
usually need to use the information system’s interfaces to complete their tasks should not be
taken lightly, see Duggan and Reichgelt (2006). A degree of user requirement meeting failure
is also a crucial metric for the determination of whether the information system or its
component should be replaced, or significantly improved. The aforementioned perception of
its qualities (i.e. quality factors) by its users is therefore a vital source of information.
In this paper, we propose a decision-making model based on the application of the analytic
hierarchy process (AHP) method to determine a best possible option of whether to replace the
information system’s BI component, improve it or possibly leave the system in its current
state. The results may illustrate novel application of the DeLone and McLean’s model
together with the AHP decision-making method which should be in close accordance with the
hierarchical concept of the D&M model.
The evaluation of the decision-making model is carried out using data we gathered during
studying a specific decision-making situation in a certain Czech firm that wanted to assess
sources of low performance of their currently used BI system. The decision making criteria
hierarchy is chosen according to the structure of a selected part of the DeLone and McLean’s
information system success assessment model. The DeLone and McLean’s model served as a
framework for designing survey questions that focused on assessment of success factors
linked with specific characteristics of the BI system. The respondent’s answers were then
used to calculate preferences of each criterion and subcriteria.
The paper is divided into 4 chapters. Chapter 2 deals with the analysis of input data and
description of the methodology. In the chapter 3 there is the proposed decision making model
described and chapter 4 deals with the evaluation of the model through a case study. Chapter
5 concludes the results and indicates possible further research activities.
2 Paper methodology and input data
In the paper, there will be 2 methods used. Besides the AHP method that is a key method of
our decision-making model also the exploratory factor analysis (EFA) method is used. The
EFA method is used to reduce dimensionality of the original input variables’ set and to create
more coherent constructs that will be used for construction of criteria (according to the
Cronbach’s Alpha metric computation), see Costello and Osborne (2005).. The main reason
for using the AHP is to ensure the consistency of pairwise comparisons due to the higher
number of criteria included. Also the hierarchical concept of the AHP method corresponds
with the hierarchical concept of the D&M model.
To determine the criteria weights we used empirical data gathered during surveying 62 users
– mostly middle and operational managers, analysts and also several specialized
administrative workers. All surveyed persons were users of the BI system’s tools in a Czech
medium enterprise. Attitudes to and opinions on respective factors of 7 dimensions of BI
124 ACTA INFORMATICA PRAGENSIA Volume 04 | Number 02 | 2015
system success (according to the structure of the DeLone and McLean model) were gathered
and served as the core data sample. During the data gathering process, the respondents were
familiarized with the hierarchy of the model. Respondents evaluated each related success
factor on a 6 point Likert scale (where 1 presented lowest and 6 highest level of agreement
with, or preference of a respective success factor). The data we gathered in the survey was
therefore of a qualitative ordinal type.
Then we wanted to determine whether input variables (see table 13 in the Appendix) that are
supposed to represent each success dimension belong consistently to it. Our intention was to
ensure that there are no severe inconsistencies due to possible heterogeneity of respondents’
opinions (so that the evaluation of the model can be considered reliable). We utilized
computation of Cronbach’s Alpha coefficient (α) of the input data that measures the overall
correlation between variables that are meant to measure the same fact (i.e. the dimensions of
success, in terms of this paper’s focus), see Wixom and Todd (2005). The condition of
sufficient consistency in terms of the coefficient’s value is if α ≥ 0.7 (resulting computed
coefficient values are summed up later in the text). EFA and Cronbach’s Alpha coefficient
related computations were done using the IBM SPSS 20 software.
2.1 Brief description of the AHP method
Saaty (2005) describes the AHP as one of multi-criteria decision-making methods which are
based on layering a complex decision-making problem or planning situation into its
components or levels and their structuring into an ascending hierarchy. Components of one
level are connected to components of a lower level and hierarchy levels are herewith
integrated towards the decision-making goal. The method is especially helpful in a situation
where there is an explicit need to carry out a decision according to the opinions of a group of
decision-makers (i.e. it allows the use of group thinking).
Principally, the AHP method is based on assigning preferences to variants and criteria for the
assessment of variants. The preference of criteria is determined using pairwise comparison
using a specific numeric measurement on a prescribed scale, commonly using Saaty’s
matrices. Saaty’s matrices are constructed according to the fact that values should express the
importance towards a goal of the decision-making process, see Saaty and Vargas (2001). The
preferences of each variant are then determined based on its interaction with each criterion
(and the pairwise comparison of preferences for each alternative). Afterwards there are
weights of each criterion set and the total preference of each variant is then calculated
according to how they contribute to the fulfillment of the goal.
The AHP hierarchy based decision-making method found its various uses in many fields due
to its flexibility and universality, e.g. allocation of resources, benchmarking, quality
management, conflict solving or classification of buildings according to their historical
importance etc., see e.g. Forman and Saul (2001). For other original applications of the AHP
method in various situations and frameworks see e.g. Wei (2007), Karaarlsan and Gundogar
(2008), Razavi, Aliee and Badie (2010) or Ergu et al. (2011).
2.2 Description of the DeLone & McLean’s information system success assessment model
DeLone & McLean’s (D&M) information system success assessment model, as presented in
Delone and McLean (2003) is a theoretical concept of user satisfaction assessment using 7
success dimensions. Each dimension can be characterized by a set of success factors, although
DeLone and McLean do not specify by default which factors each of the dimensions should

125 ACTA INFORMATICA PRAGENSIA Volume 04 | Number 02 | 2015
contain. The actual user of the model is then free to fill the dimensions with respective
factors, according to the desired purpose of the model. The only constraint is that the factors
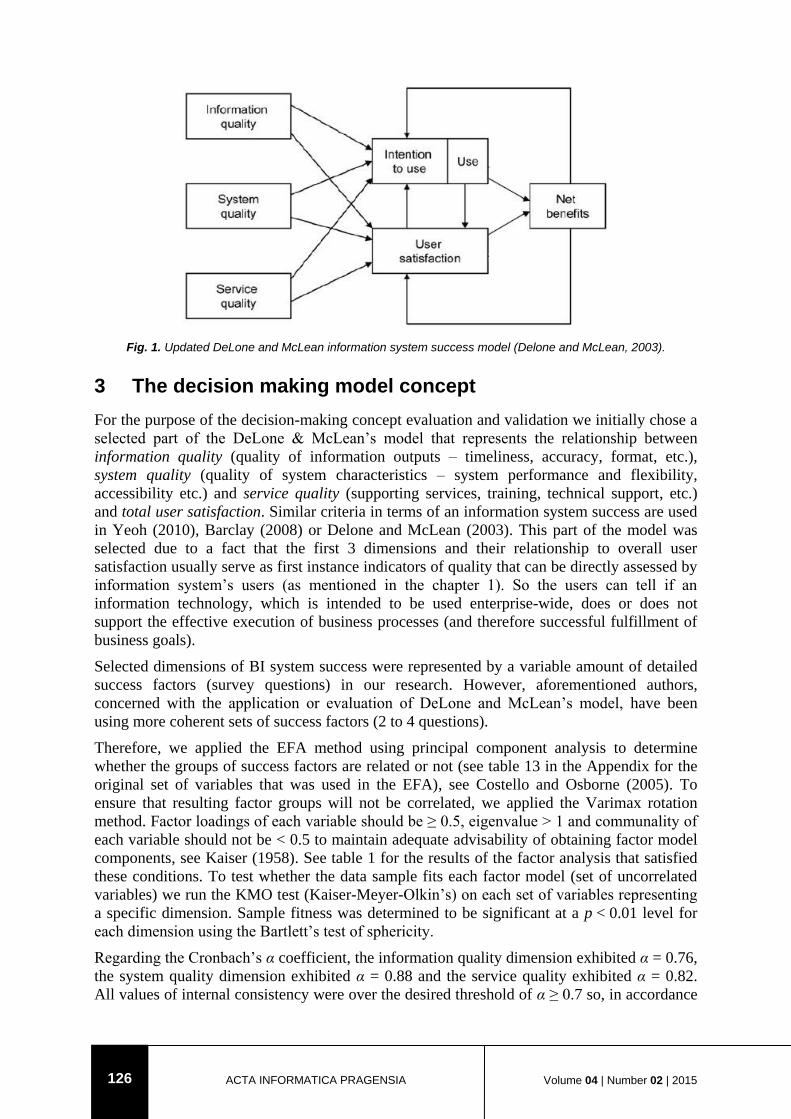
should correspond with the fundamental meaning of the dimension. Figure 1 shows the
structure of relations between all of the model dimensions. When considering what factors to
use to represent each dimension by its purpose, there are various assumptions and empirical
aspects to consider (as stated by the authors that already assessed the model theoretically and
practically).
The system quality dimension is, according to Delone and McLean (2003, 2004) and Chen
and Cheng (2009), intended to measure technical (functional) success – proposed factors are
commonly reliability, responsiveness, flexibility; Wixom and Todd (2005) also add
accessibility and integration to the list; Shin (2003) adds also system throughput.
The information quality dimension, according to Chen and Cheng (2009), Nelson, Todd and
Wixom (2005) and Delone and McLean (2003), measures certain semantic success – factors
commonly used are accuracy, currency, relevance, completeness and
consistency/understandability of information outputs.
The service quality dimension, in works Delone and McLean (2003, 2004) and Wu and
Wang (2006), reflects the importance of services and support in a successful information
system – therefore they mention factors as reliability of service, efficiency of service staff or
expertise of service staff and also whether the users were involved in the design and
implementation process.
Intention to use (which is seen as an attitude to use the system as it is) and use dimension
(which should measure to what extent the system is really used) are referred to as closely
interrelated dimensions that are to be considered carefully. The reason is because of different
attitudes of users to what the same system literally should really do and what it currently does
depending on the users’ job position, see Wu and Wang (2006).
The user satisfaction dimension measures if the user is satisfied with the system as a whole
and therefore it is determined by system, information and service quality, see Wu and Wang
(2006) or Chen and Cheng (2009).
The net benefits dimension, according to Delone and McLean (2003), previously featured
individual and organizational benefits (in a 1992 version of the D&M IS success model).
After revision of the model in 2003, the net benefits dimension is in fact intended to measure
overall effectiveness of the system usage. DeLone and McLean admit assessment using
common financial measures (e.g. Total Cost of Ownership or Return on Investments, etc.) but
Wu and Wang (2006) rather emphasize assessment of net benefits. The intention is to mainly
use this dimension as an abstract/qualitative measure (financial measures are too dependent
on the current situation when the model is applied). Particular factors proposed in Delone and
McLean (2003) for the net benefits dimension include:
perceived task productivity,
task innovation,
customer satisfaction and management control (expression of the extent to which the
application helps to regulate and support business processes and their performance).
126 ACTA INFORMATICA PRAGENSIA Volume 04 | Number 02 | 2015
Fig. 1. Updated DeLone and McLean information system success model (Delone and McLean, 2003).
3 The decision making model concept
For the purpose of the decision-making concept evaluation and validation we initially chose a
selected part of the DeLone & McLean’s model that represents the relationship between
information quality (quality of information outputs – timeliness, accuracy, format, etc.),
system quality (quality of system characteristics – system performance and flexibility,
accessibility etc.) and service quality (supporting services, training, technical support, etc.)
and total user satisfaction. Similar criteria in terms of an information system success are used
in Yeoh (2010), Barclay (2008) or Delone and McLean (2003). This part of the model was
selected due to a fact that the first 3 dimensions and their relationship to overall user
satisfaction usually serve as first instance indicators of quality that can be directly assessed by
information system’s users (as mentioned in the chapter 1). So the users can tell if an
information technology, which is intended to be used enterprise-wide, does or does not
support the effective execution of business processes (and therefore successful fulfillment of
business goals).
Selected dimensions of BI system success were represented by a variable amount of detailed
success factors (survey questions) in our research. However, aforementioned authors,
concerned with the application or evaluation of DeLone and McLean’s model, have been
using more coherent sets of success factors (2 to 4 questions).
Therefore, we applied the EFA method using principal component analysis to determine
whether the groups of success factors are related or not (see table 13 in the Appendix for the
original set of variables that was used in the EFA), see Costello and Osborne (2005). To
ensure that resulting factor groups will not be correlated, we applied the Varimax rotation
method. Factor loadings of each variable should be ≥ 0.5, eigenvalue > 1 and communality of
each variable should not be < 0.5 to maintain adequate advisability of obtaining factor model
components, see Kaiser (1958). See table 1 for the results of the factor analysis that satisfied
these conditions. To test whether the data sample fits each factor model (set of uncorrelated
variables) we run the KMO test (Kaiser-Meyer-Olkin’s) on each set of variables representing
a specific dimension. Sample fitness was determined to be significant at a p < 0.01 level for
each dimension using the Bartlett’s test of sphericity.
Regarding the Cronbach’s α coefficient, the information quality dimension exhibited α = 0.76,
the system quality dimension exhibited α = 0.88 and the service quality exhibited α = 0.82.
All values of internal consistency were over the desired threshold of α ≥ 0.7 so, in accordance

127 ACTA INFORMATICA PRAGENSIA Volume 04 | Number 02 | 2015
with the results of Wixom and Todd (2005), we cannot guarantee that the survey respondents
provided answers homogeneous enough. So there should be no severe inconsistencies in
terms of high inter-dimensional variable correlations.
4 Evaluation of the proposed decision-making model concept through a case study
The proposed concept’s evaluation will be illustrated on a decision-making situation when
a certain Czech company wanted to make a decision on what to do with their current BI
system. The system was not performing very well and the software provider no longer
existed. The management came up with several options and the project team was tasked to
carry out a survey among key users and then perform necessary analyses. The focus was
therefore to determine which of these variants will be more preferred if user and
management’s opinion is combined with the evaluation of available variants:
to build a new BI system in-house (NEW_IH),
to buy a new BI system from a new vendor (NEW_V),
to alter the current BI system using in-house capacities (ALTER),
to make no changes and continue to use the current system (NO_CH).
Dimension Success factor groups (obtained as factor model
components)
Factor
code
Information quality
(previously 7
variables)
KMO = 0.733
Relevance, accuracy a format InfQ1
Completeness and recency of outputs InfQ2
System quality
(previously 14
variables)
KMO = 0.842
Reliability, flexibility, system performance, data quality
and structure SysQ1
Security and existence of metadata SysQ2
Accessibility and portability SysQ3
Level of source data integration SysQ4
Service quality
(previously 11
variables)
KMO = 0.794
Reliability and transparency of services, skills of service
teams SerQ1
Quality of communication with service teams,
involvement of users during system changes SerQ2
Quality and effectiveness of training services SerQ3
Tab. 1. Dimensions and grouped success factors obtained from factor analysis. Source: Authors.
First, the structure and hierarchy of success factors (i.e. criteria) to use in the multi-criteria
decision-making process was necessary to be defined with respect to the use of the AHP
method (see Figure 2). Second, the subcriteria need to be put into Saaty’s matrices which are
used to describe the power of preferences among particular subcriteria.

128 ACTA INFORMATICA PRAGENSIA Volume 04 | Number 02 | 2015
4.1 Arrangement of Saaty’s matrices
The power of preference is expressed by integer values 1, 2,… , 9 (where 1 = equality, 3 =
week preference, 5 = strong preference, 7 = very strong preference, 9 = absolute preference;
the remaining values express inter-preferences). The scale that was used while gathering the
data established boundaries of a closed interval of means to <3,726; 4,645> (see table 2).
Fig. 2. Hierarchy of criteria and subcriteria (success factors) for the application of the AHP method (subcriteria codes correspond with factor codes in Tab. 1). Source: Authors.
The Saaty’s matrix is however originally designed to use a 9 points scale and the data
contained only 6 points scale answers, due to previous bad experience with wider scales in the
measurement of user preferences in the organization. The data had to be converted to the 9
point scale to be able to use the AHP method. The 9-point scale is beneficial also because of
the fact that it can more clearly emphasize differences between levels of preference (also the 9
point scale is generally recommended in Saaty (2005)). Initial data for Saaty’s matrices for
each criterion at the higher level and for each group of subcriteria was then calculated using
simple arithmetic mean.
The Saaty’s matrix is symmetric along the main diagonal. Entries on the main diagonal (𝑠𝑖,𝑖)
are equal to 1 and other elements are determined by equation 𝑠𝑖,𝑗 =1
𝑠𝑗,𝑖. The calculation of
preferences among particular subcriteria is done by ratio difference (see table 7 in the
Appendix; elements denoted as “neg” explain the negative value of the odd). Preferences are
then obtained by the differences between means from the table 2.
All mean differences lie in the interval <0; 0.919> (minimum mean value is 3.726, maximum
value is 4.645; value range is then 0.919 and the transformation interval threshold value is
then 0.102) and a maximum of the potential value difference from the interval of the mean is
shown in the table 2.
Transformation interval boundaries are shown in the table 3; the equidistant scaling is used
for transforming the values in order to keep the ratios between preference powers. This is
necessary for keeping the original difference ratios (without regard to the sample
distribution). Table 8 (see the Appendix) contains final Saaty’s matrices with calculated
inverse elements.

129 ACTA INFORMATICA PRAGENSIA Volume 04 | Number 02 | 2015
Ratios of particular success factors (criteria) are calculated according to equation 1:
,
N
i
i
ii
GA
GAw
(1)
which is based on the geometrical mean (equation 2):
,=GA
1
,i
NN
j
jis
(2)
where 𝑤𝑖 is the ratio of the i-th factor, N is the number of rows (even columns) of the matrix
and jis , is the element of the Saaty’s matrix. Final calculated ratios are shown in tables 9-12
(see the Appendix).
Subcriteria Means of
subcriteria
Means
of criteria
1.1.1 4.642 4.527
1.1.2 4.411
1.2.1 4.410
4.461 1.2.2 4.645
1.2.3 4.234
1.2.4 4.556
1.3.1 4.391
3.985 1.3.2 3.726
1.3.3 3.839
Tab. 2. Means of success factors (subcriteria). Source: Authors.
Interval Matrix value
0 0.102 1
0.103 0.204 2
0.205 0.306 3
0.307 0.408 4
0.409 0.511 5
0.512 0.613 6
0.614 0.715 7
0.716 0.817 8
0.818 0.919 9
Tab. 3. Intervals for the conversion of the original input data to the Saaty’s matrix values. Source: Authors.

130 ACTA INFORMATICA PRAGENSIA Volume 04 | Number 02 | 2015
The consistency of the Saaty’s matrix is a condition for the success factors evaluation
relevance. The matrix is consistent whether its consistency ratio (CR) is lower or equal to 0.1,
see Saaty and Vargas (2001) – this ratio is calculated by equation 3.
RI
CICR
(3)
The equation 4 expresses calculation of a consistency index (CI):
,1
max
n
nCI
(4)
where 𝜆𝑚𝑎𝑥 is the highest eigenvalue of the Saaty’s matrix (eigenvalue results from the
equation 𝑑𝑒𝑡(𝐴 − 𝜆𝐸) = 0). The random index (RI) is a tabular value which is determined by
the count of independent rows in the Saaty’s matrix. Consistency ratio values are presented in
tables 9-12 in the Appendix. All four mentioned tables indicate that all Saaty’s matrices
satisfy the consistency condition. This means that results will be relevant in terms of AHP
method’s constraints.
4.2 Determination of the order of variants
Local weights (wi) at each group are calculated in tables 9-12 (see the Appendix). It is
necessary to multiply the weight of n-th analyzed success factor by local weights of success
factors that are superordinate to this n-th success factor in the hierarchy1 to obtain global
weights (it means the evaluation from the perspective of the whole model structure). Results
are presented in table 4.
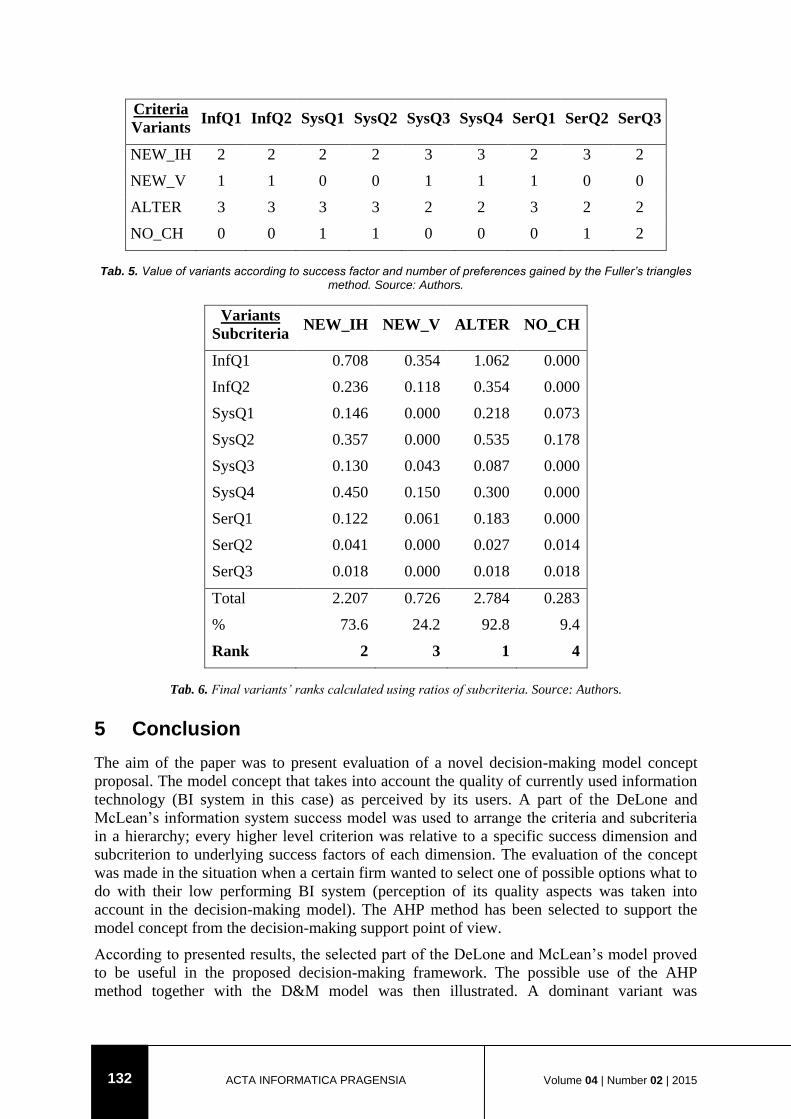
The respective management representatives provided also their opinion on all four possible
variants also from the same success factor point of view. The resulting preference opinions
were compared using simple pairwise Fuller’s triangles (as described also by Kampf, 2003) –
overall preference of each variant was gathered as a sum of the preferences of the variant
prior to any other within the scope of each success factor (table 5). Such data can then be
combined with results in previously calculated Saaty’s matrices. Values from table 5 were
then multiplied by local weights of the incident success factor to be able to evaluate variants
with regard to success factors weights (gained from Saaty’s tables).
The table 6 shows that it was possible to determine exact rank of each variant based on the
defined hierarchy of criteria and subcriteria (the proposed decision-making concept yields
meaningful results). A dominant variant can be clearly selected according to criteria weights
derived from the data. Values for subcriteria are the results of the multiplication of the global
weights (table 4) and appropriate numbers of preferences from the table 5. The selected part
of the DeLone and McLean’s model served as an appropriate and relevant framework for
deriving necessary success factors and solving the decision-making situation. Further research
and evaluation of the concept in the field of information system quality assessment is however
highly desirable. There are usually more success dimensions and measures of overall quality
of the information system (including also financial measures or business process performance
measures) which can largely enhance the concept – we see it as a next topic for our further
research.
1 Whether there are more super ordinate levels in the model, the n-th factor weight would be multiplied by all factor weights
from each of these levels.

131 ACTA INFORMATICA PRAGENSIA Volume 04 | Number 02 | 2015
Another possibility of further evaluation of the concept is to use it in a more volatile situation
where more advanced concepts like fuzzy AHP or the analytic network process (i.e. using
multi-way relationships between dimensions) could be more useful. More possibilities of
applying the decision-making model can then viable, like software requirements definition
and prioritization.
The Fuzzy AHP approach was studied in Ding (2013) in a logistic decision-making situation.
The results of the paper indicate that replacing crisp values with fuzzy alternatives yields
better results when dealing with user opinions. It also indicates that the fuzzy related approach
is a good choice to think about if the applicability of our approach is to be extended. A
theoretical results indicating advantage of the fuzzy AHP method over traditional discrete
variant were also presented in Bajaj and Arora (2013). Although the decision-making
situation was very narrow in the paper the results show that the overall volatility of human
opinion based data is better to be assessed using fuzzy-based method. Similar solutions are
covered by another AHP method variant – the incomplete AHP (IAHP).
Our approach is also closer to requirements prioritization since the success factors can be
translated easily into requirements and prioritized in an almost same way. Voola and Babu
(2013) presented a novel approach (Extensive Numeric Assignment) which is used to
prioritize requirements mainly in agile projects which uses a similar framework of criteria.
Authors of the mentioned paper compare their solution with results obtained using more
traditional methods (including the AHP method). Their approach yielded better results than
the AHP method so there is a possibility of replacing the AHP method with Voola and Babu’s
approach. We wish to evaluate also this solution and compare results in our further research.
# Criteria/sub criteria/goal Local
(%)
Global
(%)
1. Goal 100.00 -
1.1. Information quality 47.21 47.21
1.2. System quality 44.43 44.43
1.3. Service quality 8.36 8.36
1.1.1. Relevance, accuracy and format 75.00 35.41
1.1.2. Completeness and recency of outputs 25.00 11.80
1.2.1. Reliability, flexibility, system performance, data quality and
structure
16.38 7.28
1.2.2. Security and existence of metadata 40.13 17.83
1.2.3. Accessibility and portability 9.74 4.33
1.2.4. Level of source data integration 33.75 14.99
1.3.1. Reliability and transparency of services, skills of service
teams
72.86 6.09
1.3.2. Quality of communication with service teams, involvement
of users during system changes
16.26 1.36
1.3.3. Quality and effectiveness of training services 10.88 0.91
Tab. 4. Calculated local and global ratios of criteria. Source: Authors.
132 ACTA INFORMATICA PRAGENSIA Volume 04 | Number 02 | 2015
Criteria
Variants InfQ1 InfQ2 SysQ1 SysQ2 SysQ3 SysQ4 SerQ1 SerQ2 SerQ3
NEW_IH 2 2 2 2 3 3 2 3 2
NEW_V 1 1 0 0 1 1 1 0 0
ALTER 3 3 3 3 2 2 3 2 2
NO_CH 0 0 1 1 0 0 0 1 2
Tab. 5. Value of variants according to success factor and number of preferences gained by the Fuller’s triangles method. Source: Authors.
Variants
Subcriteria NEW_IH NEW_V ALTER NO_CH
InfQ1 0.708 0.354 1.062 0.000
InfQ2 0.236 0.118 0.354 0.000
SysQ1 0.146 0.000 0.218 0.073
SysQ2 0.357 0.000 0.535 0.178
SysQ3 0.130 0.043 0.087 0.000
SysQ4 0.450 0.150 0.300 0.000
SerQ1 0.122 0.061 0.183 0.000
SerQ2 0.041 0.000 0.027 0.014
SerQ3 0.018 0.000 0.018 0.018
Total 2.207 0.726 2.784 0.283
% 73.6 24.2 92.8 9.4
Rank 2 3 1 4
Tab. 6. Final variants’ ranks calculated using ratios of subcriteria. Source: Authors.
5 Conclusion
The aim of the paper was to present evaluation of a novel decision-making model concept
proposal. The model concept that takes into account the quality of currently used information
technology (BI system in this case) as perceived by its users. A part of the DeLone and
McLean’s information system success model was used to arrange the criteria and subcriteria
in a hierarchy; every higher level criterion was relative to a specific success dimension and
subcriterion to underlying success factors of each dimension. The evaluation of the concept
was made in the situation when a certain firm wanted to select one of possible options what to
do with their low performing BI system (perception of its quality aspects was taken into
account in the decision-making model). The AHP method has been selected to support the
model concept from the decision-making support point of view.
According to presented results, the selected part of the DeLone and McLean’s model proved
to be useful in the proposed decision-making framework. The possible use of the AHP
method together with the D&M model was then illustrated. A dominant variant was

133 ACTA INFORMATICA PRAGENSIA Volume 04 | Number 02 | 2015
successfully determined according to final ranks of each variant and based on the included
criteria and subcriteria. The proposed combination of the AHP method and the D&M model
can be assumed as theoretically as well as a practically applicable (in terms of the proposed
concept). Further evaluation, revision and enrichment of the concept is, however, viable. The
reason is that only deterministic, complete-information and have been assumed thus far in the
concept. Also, the use of other dimensions of the D&M model could be considered. That
would make the decision-making model concept more complete considering the purpose of
the whole D&M information system success model structure.
Acknowledgements
This paper was made with the financial support of the European Social Fund within the
project CZ.1.07/2.3.00/20.0296 and Student Grant Competition research project SP2012/184
“The analysis of data warehouse’s database schema modeling characteristics with a focus on
agile approach to Business Intelligence system development”.
References
Bajaj, P., & Arora, V. (2013) Multi-Person Decision-Making for Requirements Prioritization using Fuzzy AHP. ACM SIGSOFT Software Engineering Notes, 38(5), 1-6. doi: 10.1145/2507288.2507302
Barclay, C. (2008) Towards an integrated measurement of IS project performance: The project performance scorecard. Information Systems Frontiers, 10(3), 331-345. doi: 10.1007/s10796-008-9083-6
Costello, A. B., & Osborne, J. (2005). Best practices in exploratory factor analysis: four recommendations for getting the most from your analysis. Practical Assessment Research & Evaluation, 10(7). 1-9.
Chen, Ch.-D., & Cheng, CH.-J. (2009) Understanding consumer intention in online shopping: a respecification and validation of the DeLone and McLean model. Behaviour & Information Technology, 28(4), 335-345. doi: 10.1080/01449290701850111
DeLone, W. H., & McLean, E. R. (2004) Measuring Success: Applying the DeLone & McLean Information Systems Success Model. International Journal of Electronic Commerce, 9(1), 31-47.
DeLone, W. H., & McLean, E. R. (2003) The DeLone and McLean Model of Information System Success: A Ten-year Update. Journal of Management Information Systems, 19(4), 9-30. doi: 10.1080/07421222.2003
Ding, J.-F. (2013) Applying an Integrated Fuzzy MCDM Method to Select Hub Location for Global Shipping Carrier-based Logistics Service Providers. WSEAS Transactions on Information Science and Applications, 10(2), 47-57. doi: 10.1016/j.jclepro.2013.02.010
Duggan, E. W., & Reichgelt, H. (2006) Measuring information systems delivery quality. Hershey: Idea Group Publishing. doi: 10.2307/249419
Ergu, D., Kou, G., Peng, Y., Shi, Y., & Shi, Y. (2011) The analytic hierarchy process: task scheduling and resource allocation in cloud computing environment. The Journal of Supercomputing, 59(1), 1-14. doi: 10.1007/s11227-011-0625-1
Forman, E. H., & Saul, I. G. (2001) The Analytical Hierarchy Process - An Exposition. Operations Research, 49(4), 469-487.
Hočevar, B., & Jaklič, J. (2010) Assessing benefits of Business Intelligence systems – A case study. Management, 15(1), 87-119.
Kaiser, H. F. (1958) The Varimax Criterion for Analytic Rotation in Factor Analysis. Psychometrika, 23(3), 187-200. doi: 10.1007/BF02289233

134 ACTA INFORMATICA PRAGENSIA Volume 04 | Number 02 | 2015
Kampf, R. (2003) Estimation Methods for Weight Criteria. Scientific Papers of the University of Pardubice: Series B - The Jan Perner Transport Faculty, 9, 255-261.
Karaarslan, N., & Gundogar, E. (2008) An application for modular capability-based ERP software selection using AHP method. The International Journal of Advanced Manufacturing Technology, 42(9-10), 1025-1033. doi: 10.1007/s00170-008-1522-5
Nelson, R. R., Todd, P. A., & Wixom, B. H. (2005) Antecedents of Information and System Quality: An Empirical Examination within the Context of Data Warehousing. Journal of Management Information Systems, 21(4), 199-235. doi: 10.1080/07421222.2005.11045823
Razavi, M., Aliee, F. S., & Badie, K. (2010) An AHP-based approach toward enterprise architecture analysis based on enterprise architecture quality attributes. Knowledge and Information Systems, 28(2), 449-472. doi: 10.1007/s10115-010-0312-1
Saaty, T. L. (2005) Analytic Hierarchy Process. Encyclopedia of Biostatistics, 2nd ed. New Jersey: John Willey. doi: 10.1002/0470011815.b2a4a002
Saaty, T. L., & Vargas, L. G. (2001) The Seven Pillars of the Analytic Hierarchy Process. Models, Methods, Concepts & Applications of the Analytic Hierarchy Process, 34. doi: 10.1007/978-1-4614-3597-6_2
Saaty, T. L. (1990) How to make a decision: the analytic hierarchy process. European Journal of Operations Research, 48(1), 9-26. doi: 10.1016/0377-2217(90)90057-I
Shin, B. (2003) An Exploratory Investigation of System Success Factors in Data Warehousing. Journal of the Association for Information Systems, 4, 141-170. doi: 10.3233/978-1-61499-289-9-861
Stair, R. M., & Reynolds, G. W. (2010) Information Systems Essentials, 5th ed. Boston: Course Technology.
Turban, E., Aronson, J. E., Liang, T-P., & Sharda, R. (2007) Decision support and Business Intelligence systems, 8th ed. New Jersey: Pearson Prentice Hall.
Voola, P., & Babu, A. V. (2013) Comparison of Requirements Prioritization Techniques Employing Different Scales of Measurement. ACM SIGSOFT Software Engineering Notes, 38(4), 1-10. doi: 10.1145/2492248.2492278
Wei, C.-C. (2007) Evaluating the performance of an ERP system based on the knowledge of ERP implementation objectives. The International Journal of Advanced Manufacturing Technology, 39(1-2), 168-181. doi: 10.1007/s00170-007-1189-3
Wixom, B. H., & Todd, P. A. (2005) A theoretical integration of user satisfaction and technology acceptance. Information Systems Research, 16(1), 85-102. doi: 10.1287/isre.1050.0042
Wu, J.-H., & Wang, Y.-M. (2006) Measuring KMS Access: A Respecification of the DeLone and McLean’s Model. Information & Management, 43, 728-739. doi: 10.1016/j.im.2006.05.002
Yeoh, W. (2010) Critical Success Factors for Business Intelligence Systems – Case studies in Engineering Enterprises. Saarbrücken: VDM Verlag.

135 ACTA INFORMATICA PRAGENSIA Volume 04 | Number 02 | 2015
Appendix
Criteria Mean 1.1. 1.2. 1.3. 1.1.1. 1.1.2. 1.2.1. 1.2.2. 1.2.3. 1.2.4. 1.3.1. 1.3.2. 1.3.3.
1.1. 4.527 0 0.065 0.541
1.2. 4.461 neg 0 0.476
1.3. 3.985 neg neg 0
1.1.1. 4.642 0 0.231
1.1.2. 4.411 neg 0
1.2.1. 4.410 0 neg 0.176 neg
1.2.2. 4.645 0.235 0 0.411 0.089
1.2.3. 4.234 neg neg 0 neg
1.2.4. 4.556 0.146 neg 0.322 0
1.3.1. 4.391 0 0.612 0.508
1.3.2. 3.726 neg 0 neg
1.3.3. 3.839 neg 0.113 0
Tab. 7. The indication of factor preferences differences. Source: Authors.
Criteria 1. 1.1. 1.2. 1.3. 1.1.1. 1.1.2. 1.2.1. 1.2.2. 1.2.3. 1.2.4. 1.3.1. 1.3.2. 1.3.3.
1. 0 x x x x x x x x x x x x
1.1. x 1 1 6
1.2. x 1 1 5
1.3. x 1/6 1/5 1
1.1.1. x 1 3
1.1.2. x 1/3 1
1.2.1. x 1 1/3 2 1/2
1.2.2. x 3 1 4 1
1.2.3. x 1/2 1/4 1 1/3
1.2.4. x 2 1 3 1
1.3.1. x 1 6 5
1.3.2. x 1/6 1 1/2
1.3.3. x 1/5 2 1
Tab. 8. Calculated Saaty’s matrix. Source: Authors.

136 ACTA INFORMATICA PRAGENSIA Volume 04 | Number 02 | 2015
1.1. 1.2. 1.3. GA w(i)
1.1. 1 1 6 1.81712 0.47211
1.2. 1 1 5 1.70998 0.44427
1.3. 0.16667 0.2 1 0.32183 0.08362
λmax= 3.0037 ∑ 3.84893 1
CI = 0.00185 RI = 0.58
CR = 0.00318 N = 3
Tab. 9. Calculated Saaty’s matrix for the goal. Source: Authors.
1.1.1. 1.1.2. GA w(i)
1.1.1. 1 3 1.73205 0.75
1.1.2. 0.33333 1 0.57735 0.25
λmax = 2 ∑ 2.3094 1
CI = 0 RI = 0
CR = 0 N = 2
Tab. 10. Calculated Saaty’s matrix for the information quality dimension. Source: Authors.
1.2.1. 1.2.2. 1.2.3. 1.2.4. GA w(i)
1.2.1. 1 0.33333 2 0.5 0.75984 0.16383
1.2.2. 3 1 4 1 1.86121 0.40130
1.2.3. 0.5 0.25 1 0.33333 0.45180 0.09741
1.2.4. 2 1 3 1 1.56508 0.33745
λmax = 4.03098 ∑ 4.63793 1
CI = 0.01033 RI = 0.9
CR = 0.011474074 N = 4
Tab. 11. Calculated Saaty’s matrix for the system quality dimension. Source: Authors.
137 ACTA INFORMATICA PRAGENSIA Volume 04 | Number 02 | 2015
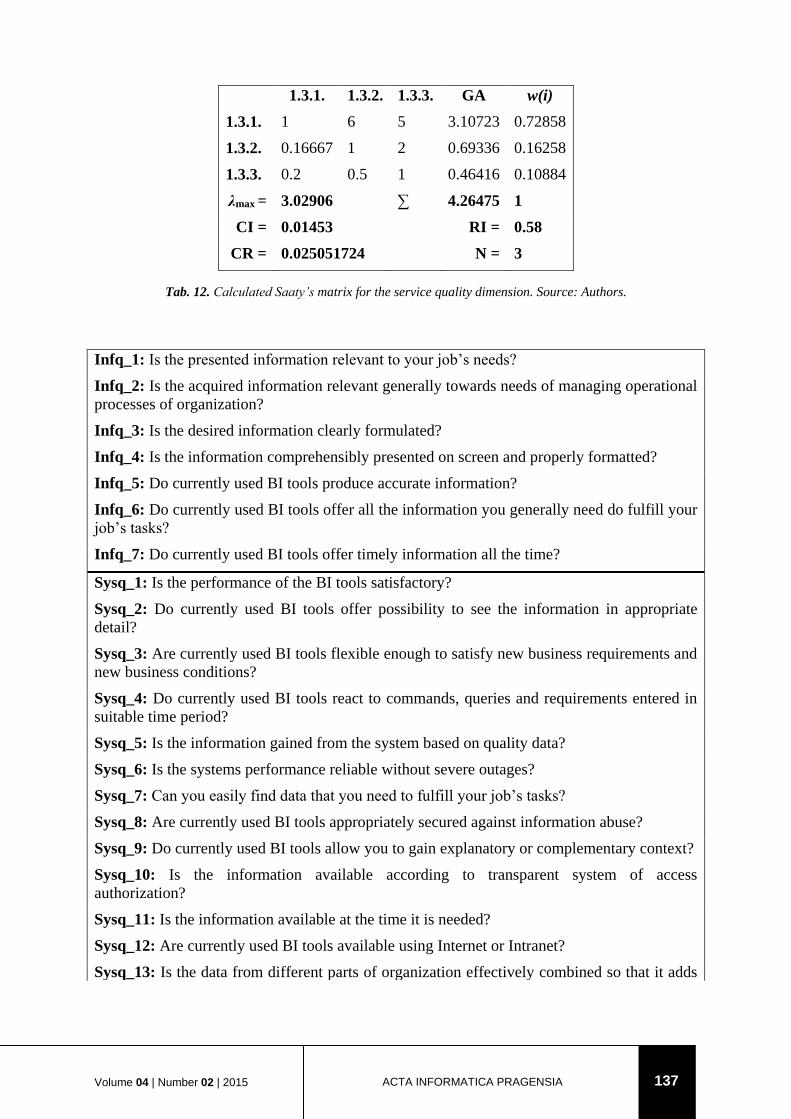
1.3.1. 1.3.2. 1.3.3. GA w(i)
1.3.1. 1 6 5 3.10723 0.72858
1.3.2. 0.16667 1 2 0.69336 0.16258
1.3.3. 0.2 0.5 1 0.46416 0.10884
λmax = 3.02906 ∑ 4.26475 1
CI = 0.01453 RI = 0.58
CR = 0.025051724 N = 3
Tab. 12. Calculated Saaty’s matrix for the service quality dimension. Source: Authors.
Infq_1: Is the presented information relevant to your job’s needs?
Infq_2: Is the acquired information relevant generally towards needs of managing operational
processes of organization?
Infq_3: Is the desired information clearly formulated?
Infq_4: Is the information comprehensibly presented on screen and properly formatted?
Infq_5: Do currently used BI tools produce accurate information?
Infq_6: Do currently used BI tools offer all the information you generally need do fulfill your
job’s tasks?
Infq_7: Do currently used BI tools offer timely information all the time?
Sysq_1: Is the performance of the BI tools satisfactory?
Sysq_2: Do currently used BI tools offer possibility to see the information in appropriate
detail?
Sysq_3: Are currently used BI tools flexible enough to satisfy new business requirements and
new business conditions?
Sysq_4: Do currently used BI tools react to commands, queries and requirements entered in
suitable time period?
Sysq_5: Is the information gained from the system based on quality data?
Sysq_6: Is the systems performance reliable without severe outages?
Sysq_7: Can you easily find data that you need to fulfill your job’s tasks?
Sysq_8: Are currently used BI tools appropriately secured against information abuse?
Sysq_9: Do currently used BI tools allow you to gain explanatory or complementary context?
Sysq_10: Is the information available according to transparent system of access
authorization?
Sysq_11: Is the information available at the time it is needed?
Sysq_12: Are currently used BI tools available using Internet or Intranet?
Sysq_13: Is the data from different parts of organization effectively combined so that it adds

138 ACTA INFORMATICA PRAGENSIA Volume 04 | Number 02 | 2015
value to your job’s tasks fulfillment?
Sysq_14: Do currently used BI tools contain information on parts of the organization that
were not easily accessible in earlier periods?
Serq_1: Are the services associated with the operation of BI tools provided quickly enough?
Serq_2: Are the services associated with the operation of BI tools provided in adequate
quality?
Serq_3: Are the services provided transparently?
Serq_4: Are service teams usually able to settle down problems associated with the operation
of BI tools?
Serq_5: Are you allowed to participate on changes in BI tools as a user?
Serq_6: Is your presence as a user required while making changes in BI tools?
Serq_7: Is the communication with the BI tools changes realization team effective enough?
Serq_8: Are the reason for changes explained sufficiently ahead of?
Serq_9: Are there BI tools usage training sessions arranged on a regular basis?
Serq_10: Do trainings include relevant and timely changes in BI tools?
Serq_11: Are trainings an asset to your everyday job’s tasks fulfillment?
Tab. 13. The description of original variables that are the source of data for the exploratory factor analysis.
Source: Authors.

139 ACTA INFORMATICA PRAGENSIA Volume 04 | Number 02 | 2015