Corporate income taxes, mining royalties and other mining taxes

Property Taxes for Agriculture Use-Value Assessment and Urbanization
across the United States
John E. Anderson, Seth H. Giertz, and Shafiun N. Shimul
August 2015
MERCATUS WORKING PAPER

John E. Anderson, Seth H. Giertz, and Shafiun N. Shimul. “Property Taxes for Agriculture: Use-Value Assessment and Urbanization across the United States.” Mercatus Working Paper, Mercatus Center at George Mason University, Arlington, VA, August 2015. Abstract We analyze the spread of use-value assessment (UVA) programs applied to agricultural and rural land for property tax purposes across the 50 states. Taxing such land on the basis of its current use in agriculture rather than its full market value can confer significant property tax reductions on owners of the land. Effects are often substantial for land near large urban areas. Using a time-to-event model, we find, as others have posited, that a driving force behind the spread of UVA has been the secular trend toward urbanization across all 50 states. We also find that models of collective action do a good job of explaining the spread of UVA. Urbanization and divergence of the values of agricultural and nonagricultural land are critical to the spread of UVA. However, other important factors include changes in average farm size and changes in agriculture’s share of state income. We find that in states where average farm sizes increased more rapidly, legislatures were quicker to adopt UVA. That finding is consistent with an increased concentration of agricultural interests. We also find that states where agriculture’s share of state income declined more rapidly also were quicker to adopt UVA. That finding, too, is consistent with models of collective action. As groups become smaller, the burden of subsidizing them also falls. Note that although the findings are consistent with models of interest group behavior, they are at odds with traditional voting models. JEL codes: H71, Q15, Q24, R14 Keywords: property tax, use-value assessment, policy diffusion, rural land, collective action Author Affiliation and Contact Information John E. Anderson Baird Family Professor University of Nebraska–Lincoln [email protected] Seth H. Giertz Associate Professor of Economics University of Texas at Dallas
Shafiun N. Shimul PhD student University of Nebraska–Lincoln
All studies in the Mercatus Working Paper series have followed a rigorous process of academic evaluation, including (except where otherwise noted) at least one double-blind peer review. Working Papers present an author’s provisional findings, which, upon further consideration and revision, are likely to be republished in an academic journal. The opinions expressed in Mercatus Working Papers are the authors’ and do not represent official positions of the Mercatus Center or George Mason University.

3
Property Taxes for Agriculture
Use-Value Assessment and Urbanization across the United States
John E. Anderson, Seth H. Giertz, and Shafiun N. Shimul
1. Introduction and Background
From 1960 to 1995, all 50 US states adopted some form of use-value assessment (UVA) for
agricultural land. UVA programs treat agricultural land preferentially for property tax purposes,
basing valuations only on prospective returns from agricultural activity, even when development
opportunities are lucrative or are expected to be so in the future. Although UVA programs
receive little attention, the programs are vast, encompassing more than 100 million acres of land
in California alone and more than 61 percent of all land in Ohio (Anderson and England 2014).1
Furthermore, the benefits that the programs confer can be substantial. Anderson and England
note that for a number of counties in Ohio, UVA results in assessed values that are more than 80
percent below market values. In a stark example, agricultural land in Bedford, Massachusetts, is
assessed at an average of $155 an acre, whereas some nonagricultural land in Bedford is assessed
at more than $10,000 per acre.2
Although the degree of the distortion is not known, such incentives certainly distort the
use of land toward less efficient uses. Even when the use of the land is not distorted, UVA
encourages rent-seeking: property owners lobby to maintain and expand benefits and undertake
socially wasteful measures to qualify land for UVA, when the land is only nominally used for
agriculture. At the federal level, agricultural interests have a strong track record in obtaining
1 The numbers in this paragraph are from Anderson and England (2014). 2 The agricultural and nonagricultural land being compared would not have identical market values absent UVA; however, Anderson and England show that UVA has a tremendous impact in Bedford, a city 15 miles outside Boston.
4
subsidies for their industry; thus, their success at the state level should not be surprising.
However, when compared with experiences at the federal level, the experiences of 50 different
states provide a better natural experiment for assessing the importance of factors that have
contributed to the success of agricultural interests.
In this paper, we model the spread of UVA statutes across the 50 states to understand
what factors were most important in determining the rate of UVA adoption. We estimate time-to-
event models for UVA policy adoption, relating our findings to the literature on policy diffusion.
Although we find evidence supporting some of the traditional mechanisms for policy diffusion
(see Shipan and Volden 2008), we also find a pattern consistent with models of interest group
behavior built on Mancur Olson’s (1965) Logic of Collective Action. The central theme in that
interest group literature is the idea of concentrated benefits and diffused costs. Other things being
equal, interests that are smaller and more concentrated (a) place a smaller burden on the rest of
society for providing a given level of subsidy to each beneficiary, (b) enjoy lower costs of
coordinating political activity, and (c) are less affected by the free-rider problem because the
support of large individual players could be critical to the interest group’s success. By contrast,
for taxpayers who finance such transfers, costs are diffused. The costs to each taxpayer may be
trivial, so the benefits to the taxpayer of becoming aware of such programs and working to
prevent them outweigh the costs. This observation is doubly true because the transaction or
coordination costs associated with organizing a large and disparate populace are likely immense.
We find, as others have posited, that a driving force behind the spread of UVA has been the
secular trend toward urbanization across all 50 states. However, urbanization and divergence
between the value of agricultural and nonagricultural land do not tell the full story. Other important
factors include changes in average farm size and changes to agriculture’s share of state income. We

5
find that in states where average farm sizes increased more rapidly, legislatures were quicker to
adopt UVA. That finding is consistent with an increased concentration of agricultural interests. We
also find that states where agriculture’s share of state income declined more rapidly were quicker
to adopt UVA. This pattern too is consistent with models of collective action. As groups become
smaller, the burden of subsidizing them also lessens. Note that although those findings are
consistent with models of interest group behavior, they are at odds with traditional voting models.
A number of researchers have focused on UVA programs; however, little systematic
analysis has examined the underlying factors that led those programs to spread to all 50 states.
Early research on UVA and its effects includes Carman (1977), which examines the adoption of
UVA in California; Conklin and Lesher (1977), which considers whether UVA can reduce
development at the urban fringe; and Coughlin, Berry, and Plaut (1978), which analyzes UVA as
a means of preserving open space. Ladd (1980) provides an early review of the efficiency and
equity aspects of preferential tax treatment of agricultural and rural land, including UVA and
other programs that tax such land uses at lower rates. England (2002) and England and Mohr
(2003) examine UVA programs specifically analyzing their withdrawal penalties if landowners
decide to develop their land. Morris (1998) and Liu and Lynch (2008) analyze whether
preferential tax treatment delays land development. Kashian and Skidmore (2002) estimate the
willingness to pay for land preservation with UVA or other approaches. Kashian (2004) provides
a comparative study of the characteristics of state UVA programs. He concludes that in the
absence of other complementary policies (such as income supplements) to preserve agricultural
land, UVA is “simply a strategy to time the market” (p. 10). Youngman (2005) gives advice to
policymakers on nonuniform property taxation. She argues that taxing farmland at a preferential
rate is not sufficient to prevent its ultimate development. However, Youngman notes that UVA

6
policies address a perceived unfairness that results from taxing land on the basis of its most
profitable use, a criticism that is leveled at all market-based assessments.
The next section provides an overview of UVA programs, including the underlying
theory of market value and current agricultural use value, the effect of reduced assessment ratios
on the effective rate of property taxation, the potential effects of that preferential taxation, and
the literature on UVA programs and their effects. Section 3 reviews the literature on policy
diffusion with an eye toward testing whether diffusion theories from the political science
literature help explain UVA policy diffusion. Section 4 presents our data and estimation
techniques. Section 5 presents our results, and section 6 provides concluding remarks.
2. Use-Value Assessment Programs
UVA for property taxation is the practice of valuing property in accordance with its current use
rather than at its market value. A property owner pays property tax to local units of government
on the basis of the assessed value of the property and the tax rates that are applied by each local
unit to that valuation. Market value that exceeds use value may reflect prospective development
opportunities that may yield greater returns than if the land were restricted to its current use.
Disparities between market and use value are common for agricultural land located near large
and growing cities. The gold standard in valuation for tax purposes is market value—or
property value taking into consideration the highest and best use of the property, independent of
current use (Wildasin 1982). By using such a value, the property tax system ensures the most
efficient and equitable outcomes possible (Wildasin 1982, Tideman 1982). Despite the negative
efficiency implications, policymakers may wish to reduce the tax liability for a certain class of
property (whose current use value may be less than market value) by adopting a state statute
that permits or directs local assessors to value that class of property using UVA techniques

7
rather than assessing at market value. Their motivation may be founded in political pressure
brought to bear by a powerful voting group—farmers—whose self-interest drives them to
pursue favorable tax treatment.
In the United States, the practice began in 1960, and the policy of applying UVA to
agricultural and rural land spread rapidly through the 1990s to the point at which all 50 states
adopted some form of UVA. Although UVA applies primarily to agricultural land use, it also
may apply to rural land of various types (e.g., open space, timberland, and wetlands), depending
on state law. Anderson and England (2014) review the historical context of UVA programs and
identify two primary reasons stated for early adoptions.3 First, policymakers expressed concern
over the demise of the small family farm as economic pressures forced farm sizes to increase.
Second, policymakers expressed concern that rapid urbanization was forcing farmland
surrounding cities to be developed for other uses. From 1950 to 1990, urban land in the United
States increased at 2.7 times the rate of urban population growth (O’Sullivan 2011, 181). In an
effort to save the family farm and slow farmland conversion at the urban fringe, policymakers
turned to UVA. Whether UVA was effective at combating either trend is debatable.
Nevertheless, the adoption of UVA statutes rapidly spread from state to state following the lead
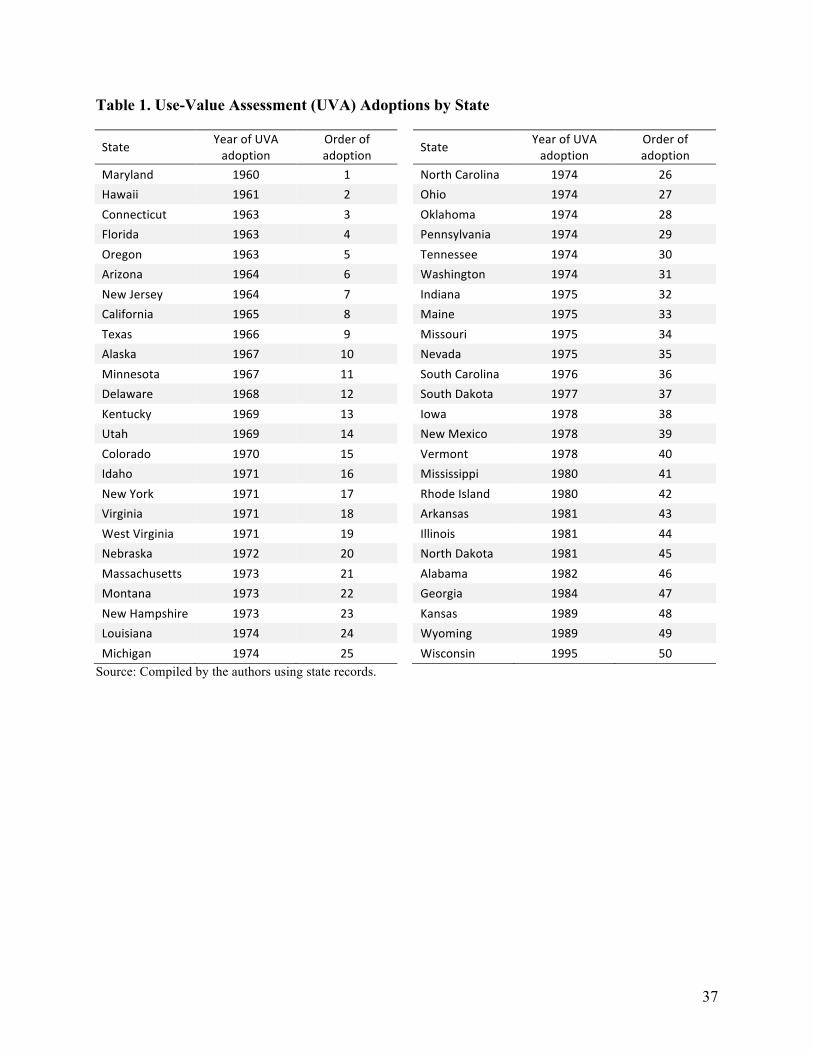
of Maryland in 1960. Table 1 (page 37) lists UVA adoptions by state and year of adoption.
Maryland was the first adopter, and Hawaii quickly followed. During the 1960s, the first decade
of adoptions, 14 states enacted UVA statutes. In the 1970s, the use of UVA exploded with
adoptions by 26 additional states. In the 1980s, another nine states adopted UVA laws. By 1995,
all 50 states had adopted some form of UVA policy.
3 Anderson and England note that before codified law, informal practices by assessors often afforded preferential assessments for agricultural land. UVA legislation emerged partly in response to restrictions on those informal practices.

8
This section proceeds with a theoretical background on how use value is determined and
how it relates to market value. Next is a brief description of how UVA works in practice,
including variations in program details across states. A discussion of tax expenditures and
effective tax rates resulting from UVA then illustrates both the potential economic distortions
from such programs and the benefits accruing to owners of agricultural land.
Market Value and Use Value
Fundamental to the examination of UVA programs is an understanding of the difference between
the market value and the use value of land. Very generally, use value ignores amenities and
represents the shadow price of farmland, which would equal the market price if the land’s most
efficient use would, in perpetuity, remain in agriculture. To understand why market and use
values may differ, consider the model presented by Capozza and Helsley (1989). They identify
four fundamental drivers of land value: (1) agricultural land value (assuming no prospective
alternative uses), (2) the cost of land conversion to developed use, (3) the value of accessibility,
and (4) the present value of the difference between expected future rents and expected future
rents from agriculture.
Capturing these four components, Capozza and Helsley (1989) write the price of
developed land at time 𝑡 and location 𝑧 in an urban area, 𝑃! 𝑡, 𝑧 , as
𝑃! 𝑡, 𝑧 = !!+ 𝐶 + !
!!!
𝑧 𝑡 − 𝑧 + (!!) 𝑅! 𝑢, 𝑧 𝑒!! !!! 𝑑𝑢
!! . (1)
The first term in equation 1, !!, is the capitalized value of the annual agricultural net rental stream,
which is assumed to continue in perpetuity. That component captures the pure agricultural value
of the land that is based solely on the capitalized net income stream 𝐴 that can be generated with
agricultural production, where the capitalization rate is 𝑖. The second term, 𝐶, represents capital

9
improvements or the cost of conversion of raw land to developed land use. The term can be
considered the capital investment made in converting raw land to developed land. Capozza and
Helsley assume that those first two components of land value are invariant to location 𝑧; hence,
they are drawn as horizontal lines in figure 1 (page 38). The third component of property value
reflects accessibility to the city center, given by the next term, !!
!!
𝑧 𝑡 − 𝑧 . That term
depends on transportation cost 𝑥 and the mean lot size 𝐿. Increases in transportation cost or
reductions in lot sizes result in an increase in this term. Both of those parameters are exogenous in
this model. Together, they determine the slope of the land bid-rent curve, which is the rate at
which land prices change with distance to the city center, where distance from the city center is
represented by 𝑧 − 𝑧 𝑡 .4 The symbol 𝑧 𝑡 represents the radius of the monocentric city; thus,
𝑧 𝑡 − 𝑧 equals zero at the edge of the developed city. The final term in equation 1,
(!!) 𝑅! 𝑢, 𝑧 𝑒!! !!! 𝑑𝑢
!! , captures the value of expected future rent increases caused by
population growth in the urban area. That component of value can be viewed as an expected
growth premium. Land rents and land values may rise in the future because of growth in the
urbanized area, reflected in a positive derivative 𝑅! 𝑡, 𝑧 . The final term in equation 1 can be
substantial in size within the urbanized area, but it declines in size beyond the developed area of
the city, as indicated in figure 1.
Figure 1 illustrates the value of land at any given distance z from the center of the city as
the sum of the four components of value, shown as the bold upper contour line. As distance 𝑧
increases, the value of accessibility declines. Land users who value proximity to the central
business district (CBD) are willing to pay a high price for land, but farther from the CBD, the
4 For example, all else being equal, willingness to pay for land does not increase in response to higher transportation costs, but higher transportation costs increase the premium for land close to the city center.

10
value of accessibility diminishes. Urban land within the ring circumscribed with radius 𝑧 also has
been developed with improvements such as water and sewer lines, streetlights, and other features
that distinguish it from undeveloped land.
The fourth component of land value is the present value of expected future returns to land
(e.g., increases to land rent in future years) arising from alternative uses, because expected rents
for use in agriculture (the perpetuity in the first term) are already incorporated in the first
component (i.e., agricultural land value). That portion of value exists because landowners expect
future urban growth to increase the value of their land within the urbanized zone of the city. The
stronger the expectation of future growth, the larger that component of value is. The first
component of urban land value is the pure agricultural land value. Even undeveloped urban land
has value based on its capacity to produce agricultural crops or pasture for animals. Beyond the
edge of the developed city, 𝑧, both the value of accessibility and the cost of conversion are zero,
and the value of future expected land rent declines spatially with additional distance. Farther
from the city edge, the market value of land declines and approaches its pure agricultural use
value. At sufficient distances from the edge of the city, virtually no difference between market
value and agricultural use value remains. Hence, taxing land on the basis of UVA rather than
market value in such locations should have virtually no effect on tax liability.
Near the urban fringe, however, market value may be well above use value. Capozza and
Helsley (1989, 295) state, “In rapidly growing cities, the growth premium may easily account for
half of the average price of land and may create a large gap between the price of land at the
boundary (minus conversion cost) and the value of agricultural land rent.” That spatial pattern of
property values has been confirmed with empirical data for properties around both Omaha and
Lincoln, Nebraska, in Anderson and Griffing (2000a, 2000b).

11
UVA in Practice
Just two components of land value are relevant for undeveloped agricultural land: its agricultural
use value and prospective increases in rental income from development. Thus, agricultural land
value is the combination of the pure agricultural value of land and the rent increases that may be
expected in the future, depending on spatial location. However, UVA statutes ignore expected
future rent increases that are due to growth and designate the agricultural land value as only the
capitalized net agricultural rent. Hence, in the simplest exposition of UVA, we can use the
familiar perpetuity formula where the agricultural land price at time 𝑡 is the annual net income
from current agricultural use 𝐴 divided by the discount rate of interest 𝑖:
𝑃! 𝑡 = !!. (2)
In the presence of a property tax system, the familiar perpetuity formula must also include the
effective property tax rate 𝜏! to account for the capitalization of the tax into the land price:
𝑃! 𝑡 = !(!!!!)
. (3)
As a perpetuity formula, that estimate of use value assumes a constant annual net rent
earned on the land and constant discount rate and effective property tax rate. In reality, all three
of those properties may change over time. Recognizing that situation, many states mandate that
UVA be applied by using moving averages of at least some of those properties. In that case, the
present value of land at time 𝑡 is based on a moving average of its previous agricultural land
rents earned over a period of time—say five years—discounted accordingly. Implicitly, that
average net rent is assumed to continue in perpetuity for the purpose of computed use value
today. But next year, the average net rent is updated on the basis of previous realizations of net
rent, and the average is again assumed to pertain in perpetuity.
12
States apply UVA statutes in varying ways as they provide specifics regarding
assessment procedures. In general, UVA statutes direct assessors to use an income capitalization
approach in estimating use value. That process is consistent with the early UVA
recommendations of Gloudemans (1974) and the guidelines of the International Association of
Assessing Officers. Anderson (2012) provides an overview of how states currently implement
UVA methods, estimating both the numerator and the denominator of equation 2, with case
studies drawn from several prominent states.
Details on UVA programs vary widely from state to state. First, UVA programs vary in
defining agricultural land. Some states apply narrow definitions that require active production
agricultural use with minimum acreage or income requirements. Other states have no particular
statutory definition of agricultural land and thereby apply UVA very broadly to undeveloped
land, perhaps including fallow land, wetlands, forests, and so on. Second, UVA programs may be
applied in a widespread manner, applying to all agricultural land in the entire state, for example,
or they may be more targeted and apply only to agricultural land surrounding major cities in a
state. Third, UVA programs may not require any particular commitment on the part of
landowners, or they may require specific enrollment for a fixed period of time and a withdrawal
penalty for premature sale for development. For specific state UVA program descriptions, see
Aiken (1989), Malme (1993), and Rodgers and Williams (1983), which provide the earliest
comprehensive reviews of UVA programs on a state-by-state basis. For the latest state-by-state
catalog of UVA programs, see Anderson and England (2014).
Whether UVA can theoretically alter the timing of land development depends on how the
land is taxed. Anderson (1986) and Skouras (1978) have developed theoretical models of land
development timing and show that property taxes can have a timing effect. Tideman (1982)
13
objects to that view and argues that a tax on land is neutral in its effect. The key difference
underlying the apparent contradictory results of those models is that Tideman (1982) models a
land tax that is unrelated to the current use of the land, whereas Anderson (1986) and Skouras
(1978) model the property tax as related to market value, which is presumed to reflect current
use. Anderson (1993) specifically models the tax based on UVA and demonstrates the potential
timing effects of a switch from market valuation to UVA.
Implications of UVA for Tax Expenditures and Effective Tax Rates
Use-value assessment reduces tax liability and thereby creates a tax expenditure—an expenditure
made by the local government in the form of forgone tax revenue that in many respects is
equivalent to a direct outlay. In adopting UVA, state and local governments are spending money
in an attempt to preserve open space or agricultural land, to give general assistance to owners of
farmland, or to accomplish whatever the stated objective of the UVA program may be. In
practice, UVA may be an example of the “Bootleggers and Baptists” principle (Yandle 1983),
which argues that regulations are often the result of alliances between groups with very different
motivations. In this case, environmental groups may make the moral case for UVA, whereas the
agriculture lobby works behind the scenes to influence the political process to gain a tax
preference.5 The outcome is a state policy on property assessment that has direct effect on local
government revenue. Local property owners wishing to have lower property taxes effectively
circumvent the usual property tax laws by successfully convincing the state to adopt an
alternative tax regime on their behalf. Local government agencies reliant on property tax
revenues—public schools in particular—feel the impact in the form of lower revenues. 5 In Yandle’s classic example, Baptists provide the moral case for prohibiting the sale of “demon rum” on the Sabbath, whereas bootleggers lobby for the same goal because it eliminates much of their competition, at least for one day a week.

14
The size of the UVA tax expenditure can be substantial in urbanized areas where the
difference between market value and use value is large. For example, Anderson and Griffing
(2000a, 2000b) estimate spatial patterns of market value and use value around both Omaha and
Lincoln, Nebraska, and find that the tax expenditure involved with UVA is quite substantial.
Their estimates indicate that the tax expenditure is approximately 36 percent of total revenue in
Lancaster County, Nebraska, home of the City of Lincoln, and 75 percent of total revenue in
Sarpy County, Nebraska, on the west side of the City of Omaha.
Whether that type of substantially reduced tax is sufficient to prevent farmland from
being developed or to alter the timing of development (slowing development) is questionable.
The tax reduction resulting from UVA is capitalized into land values, undoubtedly, although the
extent of that capitalization has not been studied. Whether the tax reduction is sufficient to retain
rural land in undeveloped use is an important question. If the UVA tax savings are swamped by
the potential gain from selling the land to a developer, then ultimately the policy will have no
appreciable effect on eventual development. However, there are examples of landowners who
blatantly work to have their land classified as agriculture solely for tax purposes but whose land
is, for all intents and purposes, used for nonagricultural activities.6
Assessment practices can result in differences between statutory (or nominal) and
effective property tax rates. The property tax liability 𝑇 for a given property is given by the
relationship
𝑇 = 𝜏AV, (4)
6 For example, Tax Analysts (2013) reports on an Indiana Tax Court case related to the Allisonville Development Company’s challenge to Hamilton County’s reassessment of its land based on the land use change from agriculture to undeveloped, usable commercial land. After the landowner succeeded in the assessment challenge, the county reassessed the land as agricultural rather than commercial, and the assessment was reduced from $2,237,300 to $15,684.

15
where 𝜏 is the nominal tax rate and AV is the assessed value of the property. Assessed value is
related to market value (MV) by the assessment ratio 𝑟:
AV = 𝑟MV. (5)
The effective tax rate denoted 𝜏! is given by the ratio of the tax liability to the market value of
the property:
𝜏! = !!"
= !"#!"
= !"!"!"
= 𝑟𝜏. (6)
Hence, the effective tax rate is the product of the assessment ratio and the nominal tax rate. For a
given nominal tax rate, the lower the assessment ratio is, the lower the effective tax rate will be.
UVA programs are designed to reduce the assessment ratio, thereby reducing the effective
property tax rate.
3. Policy Diffusion Mechanisms and the Logic of Collective Action
In a federalist system, many political decisions are left to the states or localities. However, across
jurisdictions, those policy decisions are often not independent from one another. One explanation
for those patterns is policy diffusion, which is defined by Shipan and Volden (2012, 788) as “one
government’s policy choices being influenced by the choices of other governments.” Beginning
with Walker (1969), researchers have sought to understand the factors, processes, and
interrelationships involved in policy adoption across states (or localities).
Our focus is on the spread of UVA policies across the 50 states. We consider policy
diffusion mechanisms that fit Shipan and Volden’s definition but also observe the role of secular
economic (rather than political) trends that traverse state boundaries. When examining those
secular trends, we apply ideas from interest group models used to explain the logic of collective
16
action. For example, what do the trends we observe suggest about the costs and benefits arising
from collective action?
The broad secular trend we examine is urbanization (including underlying trends that we
believe are driven by urbanization). Trends in urbanization do not fit within the policy diffusion
mold because urbanization within a state is, for the most part, not an explicit policy choice and
does not result from “the choices of other governments.” Nevertheless, the wave of urbanization
across states, when confronted by existing state political institutions, may lead states to
independently enact similar policies. The situation is analogous to a drought that affects multiple
jurisdictions and that results in the enactment of similar water conservation policies across the
affected jurisdictions. The reaction would not necessarily be an example of policy diffusion,
because the decisions of some governments may not have increased the likelihood that others
would act in a similar fashion. Often the effect of secular trends is a complementary explanation
for the spread of policies across states rather than a competing one.
As in the drought example, factors associated with urbanization may influence policy
changes independently of the actions of other states. However, it is also possible that the formation
or expansion of special-interest groups in one state could have spillover effects for other states. To
the extent that urbanization results in such spillover effects, it is no longer solely independent of
activities in other states and thus could also feed into a mechanism for policy diffusion.
Policy Diffusion Mechanisms
Shipan and Volden (2008) discuss four key mechanisms that drive policy diffusion: learning,
economic competition, imitation, and coercion.7 Learning and economic competition are both
7 Shipan and Volden (2012, 791) define coercion as “the use of force, threats, or incentives by one government to affect the policy decisions of another.” It is not germane to UVA adoption, so it is not discussed further here.

17
consistent with Tiebout (1956) models of local government formation and voters “voting with
their feet.” States can be viewed as laboratories; policies that are less successful may be
abandoned or avoided in favor of those in other states that are more effective. Moreover, at its
best, the act of individuals and businesses voting with their feet pressures states (and localities)
to adopt more desirable policies.
Imitation may be difficult to distinguish from learning. Shipan and Volden (2012) state
that learning focuses on the “action” and its consequence, whereas imitation focuses on the
“actors” and is independent of consequences. Imitation may be an example of herding behavior,
a popular concept in modern behavioral economics that dates at least to Veblen’s Theory of the
Leisure Class (1899). Recent state bans on capital punishment and acceptance of same-sex
marriage have likely emanated in part from imitation, for example. A number of other underlying
factors are surely at play, but the fact that other states have taken the lead may make the policy
seem less risky or radical, even if too little time has passed to “learn”—that is, to assess the
effect of the policies in other states.8
The Role of Interest Groups and Collective Action
The fountainhead that spawned extensive literature focusing on interest groups was Mancur
Olson’s (1965) Logic of Collective Action. Olson argues that the impediment to influencing
government policy is the collective action problem. In most cases, parties have an incentive to
free-ride because they can reap the rewards from policies whether or not they expend resources
to achieve the outcome. Interests that are more successful in achieving policy outcomes are those
that figure out ways to overcome the collective action problem. 8 In some cases, policy changes are made through state courts, in which case imitation may reflect the decisions of a handful of unelected judges. For example, that situation may have been the case with same-sex marriage in a centrist state such as Iowa, prior to the eventual Supreme Court decision on that issue.

18
Two key determinants of success for interest groups, again posited by Olson, are
situations in which the benefits of a policy are concentrated and in which the costs are dispersed.
Interests that are more concentrated have lower costs of coordination, and each party has a larger
stake in the outcome, thereby reducing the incentive to try to get a free ride. When the costs of
those who stand to lose are dispersed, costs of organizing will be great, whereas the per capita
loss to each individual is small. A classic example is US tariffs or import quotas on sugar. As a
result of such policies, consumers in the United States often pay two times the world price for
sugar. Perry (2013) estimates that for 2012 the policies resulted in a transfer of $3 billion to a
small number of large US sugar beet farmers while they cost more than 300 million to
consumers—most of whom are surely unaware of the policy—just by adding $0.17 per pound of
sugar. Subsidies for sugar also receive support from other agricultural interests, such as corn
growers, who benefit from the increased demand for corn syrup as producers substitute away
from sugar because of its artificially inflated price.
Much evidence suggests that agriculture fits Olson’s theory of collective action quite well.
Several studies show that in poorer countries, where agriculture represents a large share of the
economy, agriculture is treated less favorably than are other industries. By contrast, in developed
countries, agriculture is heavily subsidized. Van Bastelaer (1998, 43) finds that across 31 countries,
“the level of political pressure wielded by interest groups in food markets, and hence the level of
protection they receive, is an inverse function of the relative size of their constituencies.”
Many other mechanisms are used to overcome the collective action problem. In general,
it is argued that with time and stable institutions, parties often develop sophisticated techniques
for overcoming the collective action problem. That argument could help explain the political
strength of groups as large and seemingly diffuse as homeowners and senior citizens.
19
Mixon, Caudill, Ford, and Peng (1997) provide some evidence suggesting that organized
interest groups may play an important role in policy diffusion. Lobbying groups, having
undertaken substantial fixed costs to organize in one state, may be primed to use their influence
at a lower incremental cost in other states. Examples abound and include labor unions as well as
the agriculture and manufacturing lobbies, to name just a few.
The Spread of Inefficient Policies
Tiebout competition and the learning mechanism suggest greater diffusion of policies that
produce better economic outcomes or at least that are more desirable to a state’s citizens.
However, that outcome is not always the case with learning or with the other mechanisms. By
definition, the gains to society from efficiency-enhancing policies will be greater than the losses.
Thus, interests benefiting from efficient policies should have more resources available to push
for such policies. That conclusion is related to the common-law hypothesis developed by Richard
Posner (e.g., see Posner 1980) and others, which argues that the common law is biased toward
efficient policies even if judges themselves have no such inclination. Research on interest groups
and on the logic of collective action, however, suggests that other factors often tip the balance in
favor of policies that may be economically harmful.
Even in cases of learning and economic competition, economic competition can lead to a
“race to the bottom” with respect to welfare policy. Inferior policy decisions result if US citizens
favor welfare or income distribution but feel that they can get a free ride by providing only
minimal support in their own state in the expectation that individuals who would be eligible for
such benefits will locate to other states where benefits are more generous. For this reason,
research into fiscal federalism generally finds that redistributive policies are better left to the
federal government (Giertz and Tosun 2012).

20
Furthermore, voters and politicians may be systematically biased in evaluating lessons
from other states. The learning may take place among lobbying groups or the concentrated
interest benefiting from a policy rather than among the general populace. For example, cities
compete for professional sports teams by spending hundreds of millions of dollars on sports
stadiums. Casual empiricism suggests that such tax dollars are often well spent, but economic
research suggests that, in most cases, the costs of government-financed stadiums far exceed the
benefits. For example, Coates and Humphreys (2008, 311) note that “economists reach the nearly
unanimous conclusion that ‘tangible’ economic benefits generated by professional sports
facilities and franchises are very small; clearly far smaller than stadium advocates suggest and
smaller than the size of the subsidies.” Economists reach different conclusions from the general
public because the benefits from stadiums are concentrated and easy to see, whereas the costs are
disbursed and not easily seen.9
Examples from the Policy Diffusion Literature
A major focus in the policy diffusion literature is the spread of state lotteries (and casino
gambling) across states (e.g., see Berry and Berry 1990; Alm, McKee, and Skidmore 1993;
Erekson et al. 1999; Mixon et al. 1997). Other prominent work has focused on the spread of
antismoking laws (e.g., see Shipan and Volden 2008; Givel and Glantz 2001). Lobbying seems
to play an important role in the proliferation of antitobacco legislation both from the tobacco and
health lobbies. More recently, Geddes and Wagner (2013) examine the proliferation of laws
allowing for public-private partnerships.
9 The hidden costs are apparent if we consider that the federal government also plays an important role here. Because stadiums are often financed with tax-exempt bonds, a significant share of the construction costs are shifted to taxpayers in other parts of the country through the federal tax expenditure involved.

21
A few papers have examined the diffusion of tax policies, as we do in this paper. For
example, Berry and Berry (1992) examine factors that lead states to adopt new tax programs,
focusing particularly on state income and gas taxes during the 20th century. Those factors
include state economic development (Wagner’s Law, reflecting the pattern that as output and
income per capita rises, the demand for public services also rises); fiscal conditions; political
party dominance; and regional diffusion. Berry and Berry conclude that the likelihood that states
will enact a new tax falls the closer the state gets to its next election year. Fiscal stress is a good
predictor of new or increased taxes. Berry and Berry also conclude that regional diffusion plays a
role if the policy choices of neighboring states positively influence own-state policy. Omer and
Shelley (2004) also examine tax policy diffusion, focusing on tax competition and apportionment
formulas for state business income. Researchers have produced a large body of literature on tax
competition; although much of that literature is not focused directly on policy diffusion, it is
closely related.
4. Data and Estimation Techniques
In analyzing the adoption of UVA across states, we collected data on state UVA adoptions and
other economic, demographic, and political variables to test the urbanization and collective
action hypotheses. Using those data, we employ two modeling techniques to explain state UVA
program adoptions.
Data
Data used in this analysis are from several sources. Data on the year in which states enacted
UVA are from state revenue departments, annual reports, legislative documents, and personal

22
contacts with various state employees.10 The year of each state adoption is listed in table 1. As
discussed earlier, the first state to adopt UVA was Maryland in 1960; Wisconsin was the last
state to adopt it in 1995. After Maryland’s adoption, a number of other states followed suit in
rapid order so that by the end of the decade 14 states had enacted UVA legislation. Adoption
rates were by far the highest in the early to mid-1970s. By the end of the 1970s, an additional 26
states had adopted UVA, bringing the total to 40 states. Six more states adopted UVA between
1980 and 1982. The final four states adopted UVA between 1984 and 1995.
Figure 2 (page 39) shows Kaplan-Meier survival rates for UVA policy adoption for the
50 states overall and by four census regions. Kaplan-Meier is a nonparametric approach that
shows the relationship between time and the share of states that have yet to adopt the policy.
Survival (or duration) analysis examines the time to an event. In our case, the event is the
adoption of the UVA policy for property taxation of agricultural land. For a given period, states
that have not enacted the policy are deemed to have “survived,” whereas those that have enacted
the policy are categorized as having “failed.”11 Kaplan-Meier estimates are presented to show the
overall pattern of policy diffusion. In later sections, models are developed to estimate the
relationship between various factors and survival rates. A common issue in the policy diffusion
literature and with survival analysis more generally is censoring. That is, some observations may
have failed before the beginning of the sample, or some observations may survive through the
end of the sample. Our data is not censored, however. Because our dataset is not censored, we
10 We conducted a comprehensive study to collect UVA adoption dates and relied primarily on printed state documents for reported years of adoption. In some cases, we used personal contacts with state officials to verify adoption dates. 11 This language is not connotative but rather is borrowed from the biostatistics and epidemiological literature, where survival may have meant continuing to live and failure may have meant death or recurrence of disease.

23
are able to use statistical techniques that likely would not be sound were censoring prevalent.
That circumstance is discussed in a subsequent section.
Note, however, that the simple adoption–nonadoption dichotomy hides a number of
variations in UVA programs across the states. The extent of geographic coverage in UVA
application, methods of estimation of use value, withdrawal penalties or lack thereof, additional
forms of property tax preferences such as assessment caps, and a host of other factors vary in
state UVA programs.
Figure 2 shows that, initially, the West adopted UVA at a faster rate than did the other
three census regions. By 1970, for example, less than 30 percent of states had adopted UVA
compared with nearly 54 percent of western states. By 1970, the share of northeastern states that
had adopted UVA mirrored that of the nation as a whole. However, the rate of diffusion in the
Northeast rapidly increased in the early 1970s, and by 1980, the Northeast became the first
region to have 100 percent adoption of UVA. By that time, Wyoming was the one holdout in the
West, waiting until 1989 to adopt UVA.
In addition to data on UVA adoption, we have collected data from the US Census Bureau
that includes, for each state, the level of urbanization, metropolitan statistical area populations,
and census divisions.12 Those data are summarized in table 2 (page 40). In some cases, in which
variables are available only for select years (such as the decennial census), we interpolate by
assuming a linear trend over the intervening years. Data on agriculture’s share of state income,
land values for agriculture, average farm size, and property taxes on agricultural land are from
the US Department of Agriculture. Our political variables are from William Berry’s website13
12 The yearly metropolitan statistical area population is from the Real Estate Center, Texas A&M University, http://recenter.tamu.edu/data/pop/. 13 https://dataverse.harvard.edu/dataverse/wberry.

24
and are described by Berry, Fording, Ringquist, Hanson, and Klarner (2010). In terms of political
measures, we rely mainly on data about the balance between Democrats and Republicans in the
legislature.14
The Empirical Model
To analyze UVA adoption, we use the following empirical specification:
𝑦!" = 𝛼 + 𝑋!"𝛽! + 𝛽!𝑍!" + 𝜀!". (7)
We use two models that use the same data but differ in that they the dependent variable is
structured differently. In the first case, we use ordinary least squares (OLS) estimation, where 𝑦 is
the log of time to UVA adoption (in years). In the other model, we employ logit estimation, where
𝑦 is a dichotomous variable that equals 1 in the year a state adopts UVA and 0 otherwise. In the
case of the logit, we are estimating the likelihood of adoption, which is a latent variable expressed
as a log-odds ratio: ln !" !"#$%&#'!!!" !"#$%&#'
. In all instances, observations are not included for states in
the years after UVA adoption. In equation 7, 𝛼 is the intercept term; 𝛽! is a vector of coefficients
for the explanatory variables represented by the vector 𝑋!" (i.e., economic and political variables
associated with various diffusion mechanism variables); and 𝛽! is a vector of coefficients for
other controls represented by the vector 𝑍!". Also, 𝜀!" is an error term for state 𝑖 at time 𝑡.
Time until UVA adoption equals the number of years since 1959, the year before the first
adoption of UVA by Maryland. That is, our dataset begins the year before the first state’s
adoption of UVA. One could extend the dataset back earlier, however, at the expense of lower
data quality (and variable availability). We take the logarithm of time until UVA adoption and
14 Specifications that include information on the composition of state legislatures exclude Nebraska. Nebraska has a unicameral legislature and is officially nonpartisan, meaning individuals run for office without an official party designation.

25
most of our explanatory variables to produce estimated elasticities (in the OLS estimations)
because a constant rate of change is consistent with a linear path in log form. As emphasized by
Meyer, Viscusi, and Durbin (1995), and applicable to our analysis, the absence of censored
observations implies that OLS-based duration models have clear advantages over more complex
models because OLS does not require restrictive assumptions regarding the distribution of the
residual term.
The logit models represent a robustness check. Shipan and Volden (2008) also use logits
in examining the adoption of antismoking policies. Econometric models have been specifically
designed to handle issues such as censoring, which could bias the methods that we use. However,
those approaches are generally more restrictive in their distributional assumptions. In our case,
logit and OLS are both sound approaches because we are not faced with censoring.
5. Empirical Results
We present results from both logit and OLS-based duration models. The results from both
models suggest that a combination of factors helps explain the diffusion of use-value assessment
policies across the 50 states. Urbanization, a trend occurring at different rates across the 50
states, is a key factor. In most cases, urbanization is the driving force causing land values to
deviate from value in agricultural use. That deviation provides the economic incentive for
interest groups to pursue policies such as UVA.
Other factors, consistent with Olson’s model of collective action, also appear to be
prominent. In particular, agriculture’s decreasing share of state economies (in terms of state
income and employment) suggests diminished political power from median voter models but
increased influence from models of collective action. For example, as agriculture becomes
smaller (relative to the overall economy), the burden of transfers to that group declines. Thus, the

26
collective action costs for a diffuse public to stop such policies are likely greater than the burden
of going along with the implicit transfers. Another phenomenon, increasing average farm sizes,
works in the other direction, thereby making the problem of overcoming obstacles to collective
action more manageable for agriculture. An interesting aside is the question of what has caused
the increase in farm sizes over time. Clearly, technology with greater economies of scale has
played an important role. However, the increase might also be driven partly by political
advantages resulting from the lower costs of collective action.
OLS Estimates: Time to Adoption
Table 3 (page 41) reports estimates from OLS-based duration models. Estimates from six
specifications are reported, each employing alternative sets of explanatory variables. Because the
dependent variable is the log of the number of years until state adoption of UVA, a positive
estimated coefficient implies a delay in adoption, whereas a negative coefficient denotes earlier
adoption. Each specification includes a set of census division dummies. Those variables control
for unobserved time-invariant factors that are associated with the rate of UVA adoption and vary
by region. In some cases, estimated coefficients on these dummies vary greatly, suggesting that
some of the explanatory variables are correlated with those controls.
In column 1, we include only the log of the urban share of state population along with
census division dummies. As expected, urbanization shows a strong and large negative
correlation with adoption. A 1 percent increase in the level of urbanization is associated with a
2.1 percent reduction in the time until the adoption of UVA. That association suggests that,
rather than diffusion, a secular trend toward urbanization is occurring across all states but at
different rates. The trend toward urbanization is the key force that causes agriculture land values
to diverge from their value in use. Without urbanization, UVA would, for the most part, be

27
immaterial. Thus, urbanization may explain agriculture’s desire for UVA, but it does not explain
why agricultural property owners were successful in influencing the passage of UVA legislation
in every state.
By definition, urbanization signifies increased population density and increased demand
for land. However, the degree to which the increase in demand for land causes divergence
between value in use and market value also depends on the supply elasticity of land for urban
real estate uses. Thus, in markets with more inelastic supply of land for real estate, increasing
urbanization should be less of a driving force behind UVA adoption. In column 2, we examine
this assumption by adding to the model the log of agricultural land value per acre and the log
of the effective tax rate on farm real estate. Here, the coefficient on land value per acre has a t-
statistic of −5.8 and a coefficient estimate of −0.68. Meanwhile, the urbanization effect
vanishes, falling to just about zero (and not statistically different from zero). Somewhat
surprisingly, the estimated coefficient on the tax rate variable is positive (0.34) but not
statistically different from zero.
Endogeneity may help explain the lack of statistical significance for the tax rate variable.
As the date of UVA adoption approaches, expectations of such policies may become capitalized
into real estate values. Thus, although a high tax rate on farmland provides impetus for UVA,
capitalization from the imminence of UVA causes effective tax rates to fall before UVA is
implemented. This phenomenon could explain the lack of statistical significance and the positive
sign and would seem to be an issue with the land-value variable as well. However, with land
values, the direct effect appears to dominate other effects.
A second factor that could affect interpretations of coefficient estimates on the tax rate
variable is the tendency for effective property tax rates to rise as property values decline and to

28
fall as property values rise. That tendency is caused by a combination of factors, including
statutory changes and lags in reassessing property values, both of which act to lessen deficits and
surpluses by keeping tax revenues in line with projected spending (Follain and Giertz 2014).
In column 3, we drop urbanization and add the log of average farm size to the model. The
estimated coefficient on farm size is −0.43, implying that a 1 percent increase in farm size is
associated with a 0.43 percent reduction in time until UVA adoption. Again, although rising land
values suggest a motivation for UVA adoption, they do not explain the success of political
efforts to enact UVA. Average farm size may be a proxy for the cost of collective action. As
farm size increases, the costs of organizing become smaller. Moreover, an increase in farm sizes
implies that the benefits from preferential tax treatment per landowner rise at a faster rate than do
land values. Put another way, the direct return (to the landowner) from expending resources to
influence UVA policy increases with farm size, whereas the spillover benefits to third parties
fall. Thus, increasing farm size implies more concentrated benefits, a key component to
overcoming the collective action problem (Mueller 2003; Olson 1965, 1982). With respect to the
other explanatory variables, the addition of average farm size increases the estimated importance
of land value per acre, and the sign on the average tax rate for farm real estate turns negative but
is still statistically insignificant.
Next, we explore the addition of political variables constructed from data described by
Berry, Fording, Ringquist, Hanson, and Klarner (2010). In general, variables on state ideology
and the division of political power in the state have almost no effect on the model. An exception
is the inclusion of the Republican share of the legislature. In column 4, a 1 percent increase in
this variable is associated with a 1.5 percent reduction in the time-to-UVA adoption. Although
that variable appears to be important, its inclusion has almost no effect on the estimated
29
coefficient of the other explanatory variables. The exception is the geographic census division
dummies, whose estimated coefficients sometimes change substantially. The change suggests
that there is collinearity between party dominance and geographic region and that the measure of
party dominance is reflecting within-census-division variation in party dominance.
The relevance of party affiliation is difficult to assess over this time period. Over the span
of our data, the South transitioned from Democratic to Republican dominance. To a lesser extent,
the Northeast and West shifted toward the Democrats. Across regions, great differences existed
within the parties. For a period, Dixiecrats (or States’ Rights Democrats) were an important
political force among southern Democrats. That group differed greatly with Democrats in other
parts of the country and has little in common with either major party today.
In column 5, we drop state legislature party affiliation and add the share of state income
(in log form) attributed to agriculture. That change yields an estimated coefficient of 0.16 with a
t-statistic of 7.4. As with farm size, the result also supports Olson’s model of collective action.
As agriculture becomes a smaller share of the economy, the cost to taxpayers from subsidizing
the industry diminishes, making it more likely that the costs associated with preventing effective
subsidies such as UVA will outweigh the benefits. Costs could include lobbying and
organizational costs and even the cost of attention. Most owners of agricultural land likely are
well aware of UVA, but inattention prevails among most voters, who are unaware of UVA.
In column 6, a variable measuring the share of adjacent states that have adopted UVA is
added to the model (in levels, rather than logs). Policies from neighboring states are intended to
capture the imitation mechanism. The estimated coefficient on this variable is −0.32. Thus, a
state with four neighbors reduces its time to UVA adoption by 8 percent after one of its
neighbors adopts UVA (one-quarter of 0.32). That finding suggests that more is at play than just

30
issues related to collective action. Imitation may include herding effects, in which the policies of
neighboring states alter the way in which individuals in a state perceive the policy.
Of course, it is also possible that the concentrated interests in a state who would benefit
from UVA will be inspired by its passage in a neighboring state. Alternatively, learning could be
at play. Here it would not be a case of learning from the positive economic effects of the policy,
because UVA policies are at least moderately harmful to state economies. However, special
interests may learn from approaches used in the neighboring states to overcome the costs of
collective action. To the extent that the interests take advantage of their neighbors’ experiences,
that form of learning would further support Olson’s model of collective action.
Logit Estimates: UVA Time to Adoption
Table 4 (page 42) reports the results of estimates from a logit model using the same sets of
explanatory factors from our OLS analysis. For the logit, the dependent variable is dichotomous,
taking on the value 1 when at the year of state UVA adoption and 0 otherwise. Estimated
coefficients are expressed as odds ratios instead of log odds ratios. The coefficients can be
interpreted as the predicted change in the odds ratio, Pr 𝑎𝑑𝑜𝑝𝑡𝑖𝑜𝑛 /(1− Pr (𝑎𝑑𝑜𝑝𝑡𝑖𝑜𝑛),
associated with a one-unit increase in the covariate (or 1 percent increase for variables in log
form). More generally, a change in the covariate of size 𝛿 implies a change of 𝑜𝑑𝑑𝑠 𝑟𝑎𝑡𝚤𝑜!. An
odds ratio of less than one is directionally equivalent to a positive OLS coefficient because both
imply a delay in policy adoption. The logit estimation can be regarded as a robustness check of
our earlier results.
Results from the logit are qualitatively very similar to those from the OLS estimation,
both in the implications of the estimates on the rate of UVA adoption and in terms of statistical
significance. As with the OLS results, urbanization is a driving force, as seen in column 1 of

31
table 3, but its effect disappears when more proximate factors are added, such as when land value
per acre and effective tax rates are added in column 2. For example, a 1 percent increase in the
value of agricultural land per acre is associated with an odds ratio of 3.81. When adding average
farm size in column 3, that estimate jumps to 7.41. With respect to farm size, a 1 percent increase
in average farm size is associated with an odds ratio of 2.97.
In column 5, a 1 percent increase in agriculture’s share of GDP is associated with an odds
ratio of 0.61, or a diminished probability of UVA adoption. In column 6, a neighboring state’s
adopting UVA increases the probability of a state’s adoption, with an estimated odds ratio of
1.34, but that estimate is not statistically different from 1.
The logit estimation supports our findings from OLS that economic and geographic
variables are important in determining policy adoption. More generally, the results suggest that
interest group politics is a major factor behind the spread and timing of UVA enactment. The
role of interest groups and collective action does not refute the importance of mechanisms for
political diffusion overviewed by Shipan and Volden (2008). In fact, imitation appears to be
important. The learning mechanisms may well be an important component underlying the
effectiveness of interest groups.
6. Summary and Conclusions
Although much work has examined the role of interest groups in promoting policies favorable to
agriculture, most of that work has focused on national programs or on international comparisons.
For example, see Van Bastelaer (1998) and Krueger, Schiff, and Valdés (1991). Relatively little
work has explored factors driving state agricultural policy, where common institutions and
standards of living may help isolate factors that lead to the enactment of such policies. To further

32
understanding in this area, we explore the spread of UVA policies, which by 1995 had been
enacted in all 50 US states.
UVA policies apply to hundreds of millions of acres of mainly farmland in the United
States, providing incentives that may prevent land from achieving its most productive use, as
well as deteriorating the primary tax base for local governments. Our analysis suggests that the
initial impetus for UVA legislation was rapid urbanization in the second half of the 20th century.
However, after controlling for urbanization or rising land values, our analysis supports the role of
interest groups in the spread of UVA policies, suggesting that interest group behavior dominates
other explanations that use voting models to understand policy outcomes.
UVA policies appear to be an under-researched area in economics and political science.
With respect to the spread of UVA, future research could explore the degree that trends in
agriculture, such as toward larger farms, are owing to efficiency advantages from scale
economies versus advantages that such changes may have for influencing policy outcomes. In
terms of the effects of UVA, more research should be undertaken on the degree to which
distortions alter land use decisions and into the fiscal adjustments made by state and local
governments to those policies. For example, further research could examine the fiscal burdens
that UVA imposes on some local governments, the interaction of state aid formulas for education
with UVA policies, and the effect of UVA on statutory property tax rates and other forms of
fiscal adjustment, such as changes in government spending and in other types of taxes.

33
References
Aiken, David J. 1989. “State Farmland: Preferential Assessment Statutes.” Research Bulletin 310, Agricultural Research Division, Institute of Agriculture and Natural Resources, University of Nebraska–Lincoln.
Alm, James, Michael McKee, and Mark Skidmore. 1993. “Fiscal Pressure, Tax Competition, and the Introduction of State Lotteries.” National Tax Journal 46 (4): 463–76.
Anderson, John E. 1986. “Property Taxes and the Timing of Urban Land Development.” Regional Science and Urban Economics 16 (4): 483–92.
———. 1993. “Use-Value Property Tax Assessment: Effects on Land Development.” Land Economics 69 (3): 263–69.
———. 2012. “Agricultural Use-Value Property Tax Assessment: Estimation and Policy Issues.” Public Budgeting & Finance 32 (4): 71–94.
Anderson, John E., and Richard W. England. 2014. Use-Value Assessment of Rural Land in the United States. Cambridge, MA: Lincoln Institute of Land Policy.
Anderson, John E., and Marlon F. Griffing. 2000a. “Measuring Use-Value Assessment Tax Expenditures.” Assessment Journal 7 (1): 35–47.
———. 2000b. “Use-Value Assessment Tax Expenditures in Urban Areas.” Journal of Urban Economics 48 (3): 443–52.
Berry, Frances Stokes, and William D. Berry. 1990. “State Lottery Adoptions as Policy Innovations: An Event History Analysis.” American Political Science Review 84 (2): 395–415.
———. 1992. “Tax Innovation in the States: Capitalizing on Political Opportunity.” American Journal of Political Science 36 (3): 715–42.
Berry, William D., Richard C. Fording, Evan J. Ringquist, Russell L. Hanson, and Carl Klarner. 2010. “Measuring Citizen and Government Ideology in the American States: A Reappraisal.” State Politics and Policy Quarterly 10 (2): 117–35.
Capozza, Dennis R., and Robert W. Helsley. 1989. “The Fundamentals of Land Prices and Urban Growth.” Journal of Urban Economics 26 (3): 295–306.
Carman, Hoy F. 1977. “California Landowners’ Adoption of a Use-Value Assessment Program.” Land Economics 53 (3): 275–87.
Coates, Dennis, and Brad R. Humphreys. 2008. “Do Economists Reach a Conclusion on Subsidies for Sports Franchises, Stadiums, and Mega-Events?” Econ Journal Watch, 5 (3): 294–315.

34
Conklin, Howard E., and William G. Lesher. 1977. “Farm-Value Assessment as a Means for Reducing Premature and Excessive Agricultural Disinvestment in Urban Fringes.” American Journal of Agricultural Economics 59 (4): 755–59.
Coughlin, Robert E., David Berry, and Thomas Plaut. 1978. “Differential Assessment of Real Property as an Incentive to Open Space Preservation and Farmland Retention.” National Tax Journal 31 (2):1 65–79.
England, Richard W. 2002. “Current-Use Property Assessment and Land Development: A Theoretical and Empirical Review of Development Penalties.” Working Paper 02RE1, Lincoln Institute of Land Policy, Cambridge, MA.
England, Richard W., and Robert D. Mohr. 2003. “Land Development and Current Use Assessment: A Theoretical Note.” Agricultural and Resource Economics Review 32 (1): 46–52.
Erekson, O. Homer, Glenn Platt, Christopher Whistler, and Andrea L. Ziegert. 1999. “Factors Influencing the Adoption of State Lotteries.” Applied Economics 31 (7): 875–84.
Follain, James R., and Seth H. Giertz. 2014 “US House Price Bubbles and Busts: Implications for Property Taxation.” Public Finance Review, June 22.
Geddes, R. Richard, and Benjamin L. Wagner. 2013. “Why Do US States Adopt Public–Private Partnership Enabling Legislation?” Journal of Urban Economics 78: 30–41.
Giertz, Seth H., and Mehmet S. Tosun. 2012. “Migration Elasticities, Fiscal Federalism, and the Ability of States to Redistribute Income.” National Tax Journal 65 (4): 1069–92.
Givel, Michael S., and Stanton A. Glantz. 2001. “Tobacco Lobby Political Influence on US State Legislatures in the 1990s.” Tobacco Control 10 (2): 124–34.
Gloudemans, Robert J. 1974. Use-Value Farmland Assessments: Theory, Practice, and Impact. Chicago: International Association of Assessing Officers.
Kashian, Russell. 2004. “State Farmland Preferential Assessment: A Comparative Study.” Journal of Regional Analysis and Policy 34 (1): 1–12.
Kashian, Russell, and Mark Skidmore. 2002. “Preserving Agricultural Land via Property Assessment Policy and the Willingness to Pay for Land Preservation.” Economic Development Quarterly 16 (1): 75–87.
Krueger, Anne O., Maurice Schiff, and Alberto Valdés. 1991. The Political Economy of Agricultural Pricing Policy. Vol. 1–3. Baltimore: Johns Hopkins University Press.
Ladd, Helen F. 1980. “The Considerations Underlying Preferential Tax Treatment of Open Space and Agricultural Land.” In Property Tax Preferences for Agricultural Land, edited by Neal A. Roberts and H. James Brown, 15–42. Montclair, NJ: Allanheld, Osmun.

35
Liu, Xiangping, and Lori Lynch. 2008. “Do Agricultural Preservation Programs Affect Farmland Conversion? Evidence from a Propensity Score Matching Estimator.” Working Paper 06-08, Department of Agricultural and Resource Economics, University of Maryland, College Park.
Malme, Jane. 1993. “Preferential Property Tax Treatment of Land.” Working Paper 93JM1, Lincoln Institute of Land Policy, Cambridge, MA.
Meyer, Bruce, Kip Viscusi, and David Durbin. 1995. “Workers’ Compensation and Injury Duration: Evidence from a Natural Experiment.” American Economic Review 85 (3): 322–40.
Mixon, Franklin, Steven Caudill, Jon Ford, and Ter Chao Peng. 1997. “The Rise (or Fall) of Lottery Adoption within the Logic of Collective Action: Some Empirical Evidence.” Journal of Economics and Finance 21 (1): 43–49.
Morris, Adele C. 1998. “Property Tax Treatment of Farmland: Does Tax Relief Delay Land Development?” In Local Government Tax and Land Use Policies in the United States, edited by Helen F. Ladd, 144–67. Cheltenham, UK: Edward Elgar.
Mueller, Dennis. 2003. Public Choice III. Cambridge, UK: Cambridge University Press.
O’Sullivan, Arthur. 2011. Urban Economics. 8th ed. New York: McGraw-Hill/Irwin.
Olson, Mancur. 1965. The Logic of Collective Action. Cambridge, MA: Harvard University Press.
———. 1982. The Rise and Decline of Nations. New Haven, CT: Yale University Press.
Omer, Thomas, and Marjorie K. Shelley. 2004. “Competitive, Political, and Economic Factors Influencing State Tax Policy Changes.” Journal of the American Taxation Association 26 (suppl. 1): 103–26.
Perry, Mark J. 2013. “Protectionist Sugar Policy Cost Americans $3 billion in 2012.” Carpe Diem (blog), American Enterprise Institute, Washington, DC, February 14. https://www .aei.org/publication/protectionist-sugar-policy-cost-americans-3-billion-in-2012/.
Posner, Richard A. 1980. “The Ethical and Political Basis of the Efficiency Norm in Common Law Adjudication.” Hofstra Law Review 8 (3): 487–598.
Rodgers, Pamela H., and Gerry H. Williams. 1983. “A Survey of Use-Value Assessment Laws in the South.” SRDC Paper 53, Southern Rural Development Center, Mississippi State University, Mississippi State.
Shipan, Charles R., and Craig Volden. 2008. “The Mechanisms of Policy Diffusion.” American Journal of Political Science 52 (4): 840–57.
———. 2012. “Policy Diffusion: Seven Lessons for Scholars and Practitioners.” Public Administration Review 72 (6): 788–96.

36
Skouras, Athanassios. 1978. “The Non-neutrality of Land Taxation.” Public Finance 33 (1–2): 113–34.
Tax Analysts. 2013. “Indiana Tax Court: Developers’ Property Properly Assessed as Agricultural Land.” State Tax Today, April 16.
Tideman, T. Nicholaus. 1982. “A Tax on Land Is Neutral.” National Tax Journal 35: 109–11.
Tiebout, Charles. 1956. “A Pure Theory of Local Expenditures.” Journal of Political Economy 64 (5): 416–24.
Van Bastelaer, Thierry. 1998. “The Political Economy of Food Pricing: An Extended Empirical Test of the Interest Group Approach.” Public Choice 96 (1–2): 43–60.
Veblen, Thorstein. 1899. The Theory of the Leisure Class: An Economic Study of Institutions. New York: Macmillan. http://www.gutenberg.org/files/833/833-h/833-h.htm.
Walker, Jack L. 1969. “The Diffusion of Innovations among the American States.” American Political Science Review 63 (3): 880–99.
Wildasin, David E. 1982. “More on the Neutrality of Land Taxation.” National Tax Journal 35 (1): 105–8.
Yandle, Bruce. 1983. “Bootleggers and Baptists: The Education of a Regulatory Economist.” Regulation 7 (3): 12–16.
Youngman, Joan M. 2005. “Taxing and Untaxing Land: Current Use Assessment of Farmland.” State Tax Notes 37 (10): 727–38.
37
Table 1. Use-Value Assessment (UVA) Adoptions by State
State Year of UVA adoption
Order of adoption
State Year of UVA adoption
Order of adoption
Maryland 1960 1 North Carolina 1974 26 Hawaii 1961 2 Ohio 1974 27 Connecticut 1963 3 Oklahoma 1974 28 Florida 1963 4 Pennsylvania 1974 29 Oregon 1963 5 Tennessee 1974 30 Arizona 1964 6 Washington 1974 31 New Jersey 1964 7 Indiana 1975 32 California 1965 8 Maine 1975 33 Texas 1966 9 Missouri 1975 34 Alaska 1967 10 Nevada 1975 35 Minnesota 1967 11 South Carolina 1976 36 Delaware 1968 12 South Dakota 1977 37 Kentucky 1969 13 Iowa 1978 38 Utah 1969 14 New Mexico 1978 39 Colorado 1970 15 Vermont 1978 40 Idaho 1971 16 Mississippi 1980 41 New York 1971 17 Rhode Island 1980 42 Virginia 1971 18 Arkansas 1981 43 West Virginia 1971 19 Illinois 1981 44 Nebraska 1972 20 North Dakota 1981 45 Massachusetts 1973 21 Alabama 1982 46 Montana 1973 22 Georgia 1984 47 New Hampshire 1973 23 Kansas 1989 48 Louisiana 1974 24 Wyoming 1989 49 Michigan 1974 25 Wisconsin 1995 50
Source: Compiled by the authors using state records.

38
Figure 1. Land Value Fundamentals
Note: CBD = central business district; z = location of the land; 𝑧 = radius of the urban area.
0 Distance to CBD, z
$/acre
Agricultural land value
Value of accessibility
Cost of
conversion
Value of expected future rent increases
𝑧 ̅

39
Figure 2. Kaplan-Meier Survival Curves
0
0.1
0.2
0.3
0.4
0.5
0.6
0.7
0.8
0.9
1
1959 1964 1969 1974 1979 1984 1989 1994
Survival Rate
Overall Northeast Midwest South West

40
Table 2. Descriptive Statistics
Variable Mean Standard deviation Minimum Maximum Observations
Urbanization share (in terms of population)
overall 0.6214938 0.1372366 0.3212924 0.8887431 N = 725 between 0.1411265 0.3421796 0.8765899 n = 50 within 0.0199927 0.5400979 0.6874915 T-‐bar = 14.5
Land value per acre overall 1,091.769 798.1976 144 5,507.01 N = 699 between 719.1051 241.4845 3,362.811 n = 47 within 431.7166 −198.326 3,598.47 T-‐bar = 14.9
Farm real estate tax over $100 value
overall 0.9678336 0.5491451 0.1 2.42 N = 697 between 0.517651 0.22 2.119286 n = 47 within 0.182743 0.0940836 1.430691 T-‐bar = 14.8
Average farm size overall 823.7652 1,358.073 94 6,262 N = 132 between 1,508.255 98 6,262 n = 45 within 79.4022 318.2652 1,134.265 T-‐bar = 2.9
Republican share in government
overall 0.3837878 0.2308857 0.0 0.8630137 N = 712 between 0.2080335 0.0133345 0.6764468 n = 49 within 0.079539 0.0662971 0.6772906 T-‐bar = 14.5
Share of agriculture in state GDP
overall 0.0533537 0.0513789 0.0052327 0.3719346 N = 578 between 0.0455542 0.0065469 0.2123519 n = 48 within 0.0168443 −0.0709947 0.2314828 T-‐bar = 12.04
Share of neighboring states that adopted UVA
overall 0.2900723 0.3464418 0.0 1.0 N = 725 between 0.2025153 0.0 0.6190476 n = 50 within 0.27977 −0.3289754 1.102572 T-‐bar = 14.5

41
Table 3. Diffusion Mechanisms: OLS with Log of t until UVA Adopted as Dependent Variable
(1) (2) (3) (4) (5) (6)
Log of urbanization share −2.108*** (0.718)
−0.0170 (1.039)
Log of agricultural land value per acre
−0.676*** (0.117)
−0.882*** (0.127)
−0.889*** (0.0982)
−0.730*** (0.122)
−0.662*** (0.132)
Log of farm tax per $100 of value 0.337 (0.438)
−0.287 (0.476)
−0.339 (0.452)
−0.610 (0.473)
Log of average farm size −0.431*** −0.380** −0.325** −0.242 (0.154) (0.154) (0.158) (0.176)
Log of Republican share (total) −1.483** (0.559)
Log of agriculture share in state GDP
0.155*** (0.0210)
0.138*** (0.0230)
Share of neighboring states adopting UVA
−0.319* (0.183)
Census group
Middle Atlantic −0.062 −0.151 −0.236 −0.169 −0.261 −0.200 (0.227) (0.387) (0.298) (0.265) (0.297) (0.302)
East North Central 0.414* 0.678* 0.699** 0.712** 0.578* 0.555 (0.242) (0.348) (0.341) (0.269) (0.336) (0.359)
West North Central 0.091 0.107 0.372 0.561 0.034 −0.053 (0.211) (0.385) (0.374) (0.352) (0.376) (0.383)
South Atlantic −0.186 0.182 −0.177 −0.373 −0.279 −0.408 (0.224) (0.411) (0.443) (0.309) (0.448) (0.472)
East South Central −0.028 0.317 −0.125 −0.331 −0.276 −0.437 (0.198) (0.435) (0.469) (0.267) (0.456) (0.462)
West South Central −0.028 0.230 0.102 −0.230 −0.163 −0.324 (0.172) (0.464) (0.425) (0.300) (0.424) (0.443)
Mountain 0.073 −0.615 0.004 −0.002 −0.269 −0.421 (0.228) (0.431) (0.437) (0.377) (0.443) (0.457)
Pacific −0.456 −0.302 −0.046 −0.069 −0.314 −0.454 (0.307) (0.437) (0.389) (0.361) (0.384) (0.397)
Constant 2.94*** 6.28*** 10.54*** 10.61*** 9.52*** 8.89*** (0.318) (1.119) (1.744) (1.322) (1.669) (1.825)
Observations 725 697 695 684 694 694 R2 0.078 0.239 0.287 0.306 0.344 0.355
* p < .10, ** p < .05, *** p < .01. Note: Standard errors are in parentheses. New England Division is the base category for division.
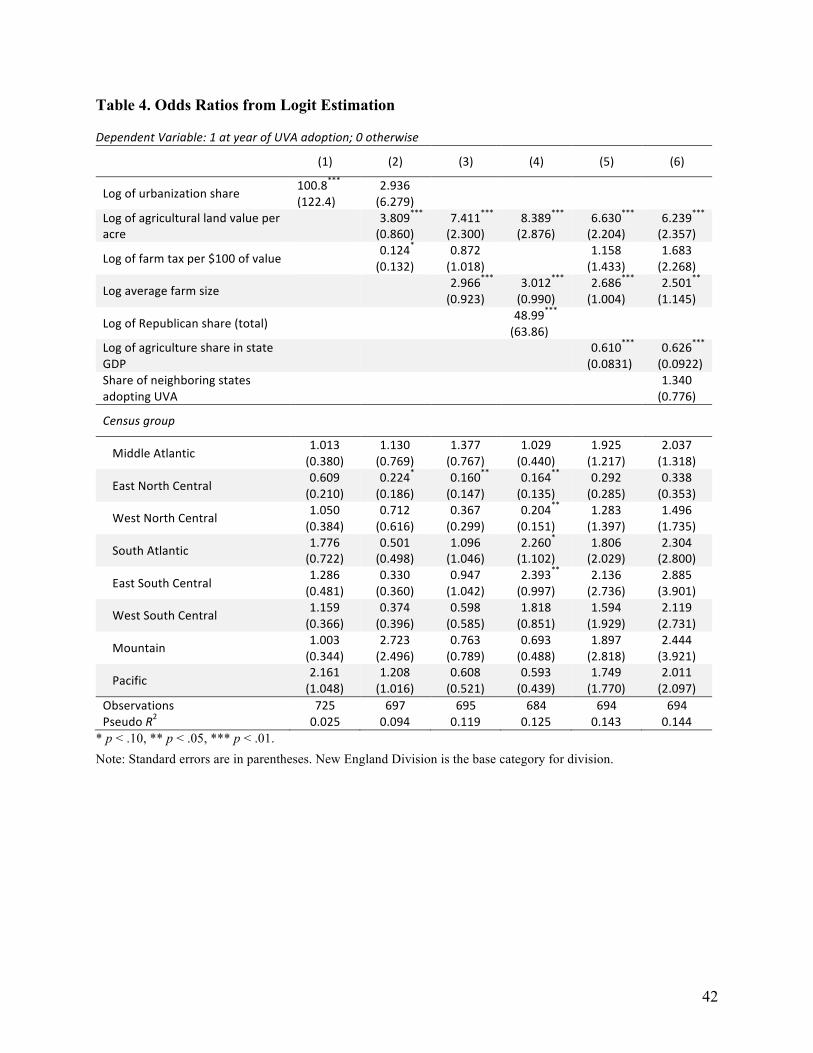
42
Table 4. Odds Ratios from Logit Estimation Dependent Variable: 1 at year of UVA adoption; 0 otherwise
(1) (2) (3) (4) (5) (6)
Log of urbanization share 100.8*** (122.4)
2.936 (6.279)
Log of agricultural land value per acre
3.809*** (0.860)
7.411*** (2.300)
8.389*** (2.876)
6.630*** (2.204)
6.239*** (2.357)
Log of farm tax per $100 of value
0.124* (0.132)
0.872 (1.018)
1.158 (1.433)
1.683 (2.268)
Log average farm size
2.966*** (0.923)
3.012*** (0.990)
2.686*** (1.004)
2.501** (1.145)
Log of Republican share (total)
48.99*** (63.86)
Log of agriculture share in state GDP
0.610*** (0.0831)
0.626*** (0.0922)
Share of neighboring states adopting UVA
1.340 (0.776)
Census group
Middle Atlantic 1.013 (0.380)
1.130 (0.769)
1.377 (0.767)
1.029 (0.440)
1.925 (1.217)
2.037 (1.318)
East North Central 0.609 (0.210)
0.224* (0.186)
0.160** (0.147)
0.164** (0.135)
0.292 (0.285)
0.338 (0.353)
West North Central 1.050 (0.384)
0.712 (0.616)
0.367 (0.299)
0.204** (0.151)
1.283 (1.397)
1.496 (1.735)
South Atlantic 1.776 (0.722)
0.501 (0.498)
1.096 (1.046)
2.260* (1.102)
1.806 (2.029)
2.304 (2.800)
East South Central 1.286 (0.481)
0.330 (0.360)
0.947 (1.042)
2.393** (0.997)
2.136 (2.736)
2.885 (3.901)
West South Central 1.159 (0.366)
0.374 (0.396)
0.598 (0.585)
1.818 (0.851)
1.594 (1.929)
2.119 (2.731)
Mountain 1.003 (0.344)
2.723 (2.496)
0.763 (0.789)
0.693 (0.488)
1.897 (2.818)
2.444 (3.921)
Pacific 2.161 (1.048)
1.208 (1.016)
0.608 (0.521)
0.593 (0.439)
1.749 (1.770)
2.011 (2.097)
Observations 725 697 695 684 694 694 Pseudo R2 0.025 0.094 0.119 0.125 0.143 0.144
* p < .10, ** p < .05, *** p < .01. Note: Standard errors are in parentheses. New England Division is the base category for division.