Property-based molecular design: where next? (12-Jun-2015)
26
Property-based molecular design: where next? Peter W Kenny http://fbdd-lit.blogspot.com | http://www.slideshare.net/pwkenny
-
Upload
peter-kenny -
Category
Health & Medicine
-
view
373 -
download
1
Transcript of Property-based molecular design: where next? (12-Jun-2015)
Property-based molecular design: where next?
Peter W Kenny http://fbdd-lit.blogspot.com | http://www.slideshare.net/pwkenny

Some things that make drug discovery difficult
• Having to exploit targets that are weakly-linked to
human disease
• Toxicity is poorly understood and unpredictable
• Can’t measure free (unbound) physiological
concentrations of drug for remote (e.g. intracellular)
targets in live humans
Dans la merde, FBDD & Molecular Design blog

Molecular Design
• Control of behavior of compounds and materials by
manipulation of molecular properties
• Hypothesis-driven or prediction-driven
• Sampling of chemical space
– For example, does fragment-based screening allow better
control of sampling resolution?
Kenny, Montanari, Propopczyk, Sala, Sartori (2013) JCAMD 27:655-664 DOI
Kenny JCIM 2009 49:1234-1244 DOI
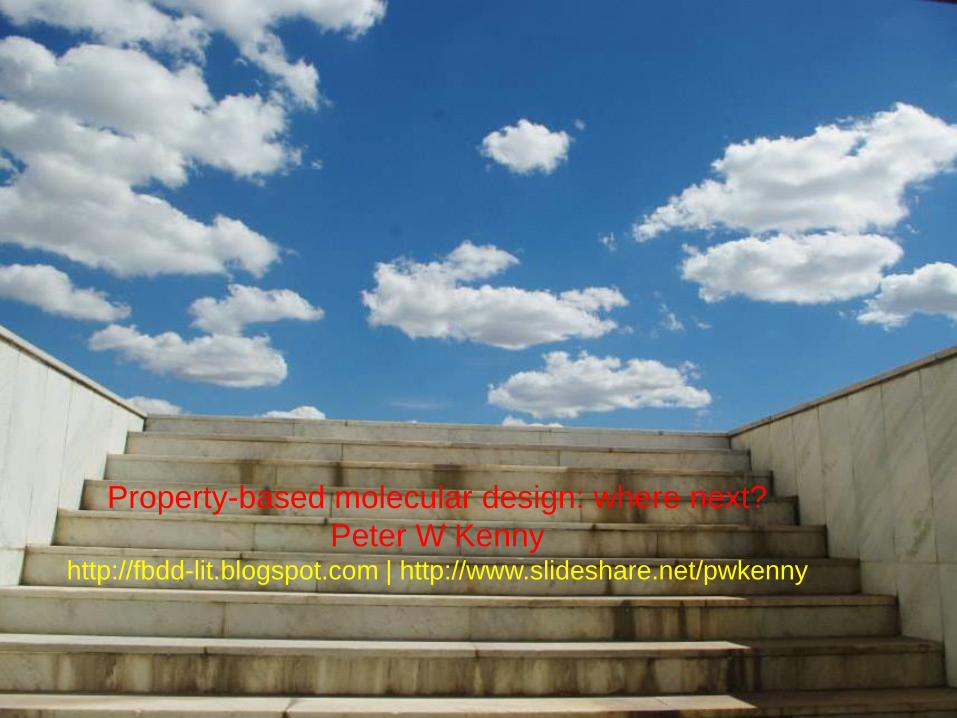
TEP = log10([𝐷𝑟𝑢𝑔 𝑿,𝑡 ]𝑓𝑟𝑒𝑒
𝐾𝑑)
Target engagement potential (TEP) (or why we can’t design drugs like we design planes link)
Design objectives• Low Kd for target(s)• High (hopefully undetectable) Kd for anti-targets• Ability to control [Drug(X,t)]free
Kenny, Leitão & Montanari JCAMD 2014 28:699-710 DOI

Property-based design as search for ‘sweet spot’
Green and red lines represent probability of achieving ‘satisfactory’ affinity and‘satisfactory’ ADMET characteristics respectively. The blue line shows the product ofthese probabilities and characterizes the ‘sweet spot’. This molecular design frameworkhas similarities with the molecular complexity model proposed by Hann et al.
Kenny & Montanari, JCAMD 2013 27:1-13 DOI

Data is getting bigger and more open but
this will not prove to be a panacea

Data-driven design decision-making
• Predictivity of a trend determined by its strength
rather than its significance
• Strength of a trend determines how rigidly design
guidelines based on that trend should be adhered to
• Search for strong local correlations rather than for
new ways to inflate weak global correlation

Preparation of synthetic data sets(Property-based design ‘experts’ don’t usually share their data)
Add Gaussian noise (SD=10) to Y
Kenny & Montanari (2013) JCAMD 27:1-13 DOI
An equal number of data points are placed at equally spaced intervals on the line of equality (Y = X) and Normally-distributed noise is added to the values of Y.

Correlation inflation by hiding variationFor examples see Hopkins, Mason & Overington (2006) Curr Opin Struct Biol 16:127-136 DOI | Leeson &
Springthorpe (2007) NRDD 6:881-890 DOI | Lovering, Bikker & Humblet (2009) JMC 52:6752-6756 DOI
Data is naturally binned (X is an integer) and mean value of Y is calculated for each value of X. In some studies, averaged data is only presented graphically and it is left to the reader to judge the strength of the correlation.
R = 0.34 R = 0.30 R = 0.31
R = 0.67 R = 0.93 R = 0.996
Kenny & Montanari (2013) JCAMD 27:1-13 DOI
N = 11 10 = 110 N = 11 100 = 1100 N = 11 1000 = 11000
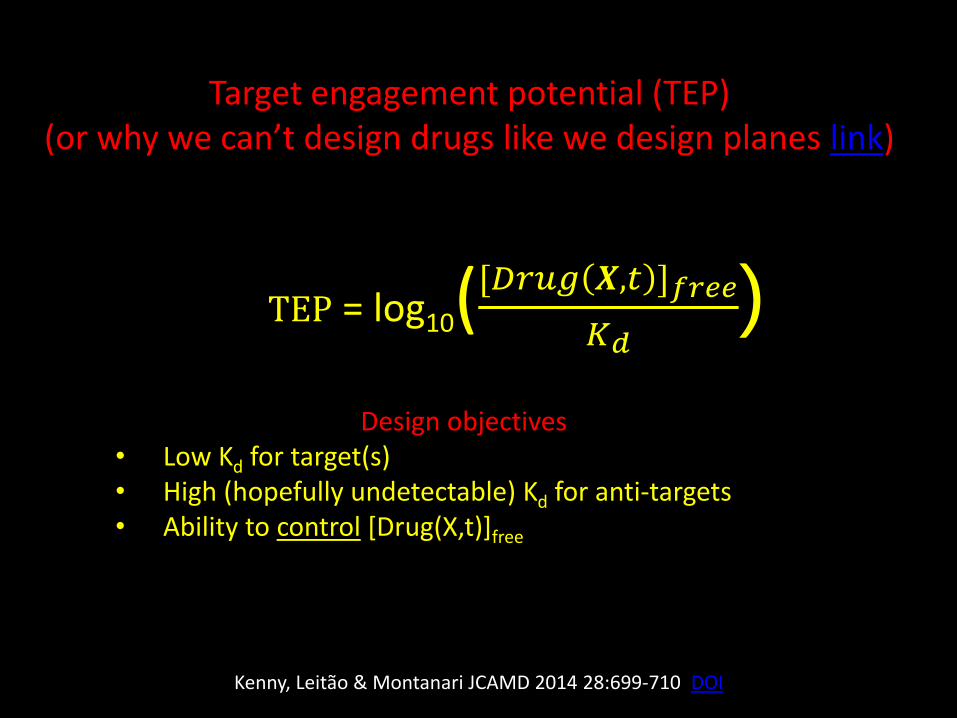
Ligand efficiency: nice concept, shame about the metrics
Kenny, Leitão & Montanari (2014) JCAMD 28:699-701 DOI
Can we accurately claim to have normalized Y with respect to X if
we have made no attempt to analyse data?
Green: line of fitPurple: constant LEBlue: constant LipE

Octanol/water is just one of a number of
partitioning systems
There is also the question of which of logP or logD is the more appropriatelipophilicity measure. If interested in how octanol/water came to be the partitioningsystem of choice then take a look at our ClogPalk article.
Kenny, Montanari & Propopczyk 2013 JCAMD 27:389-402 DOI
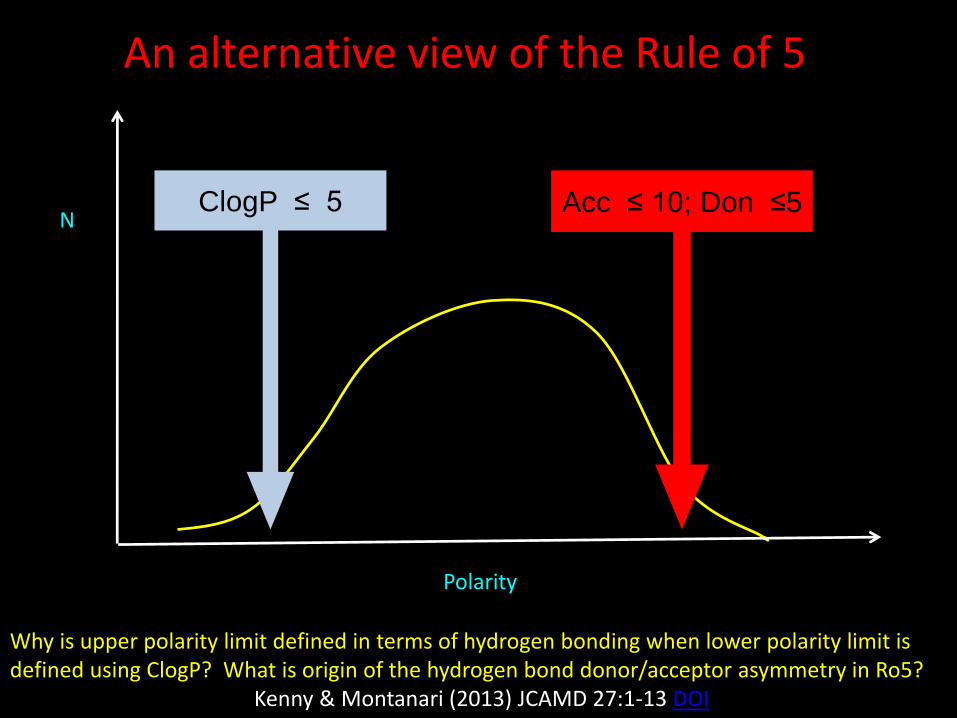
Polarity
NClogP ≤ 5 Acc ≤ 10; Don ≤5
An alternative view of the Rule of 5
Why is upper polarity limit defined in terms of hydrogen bonding when lower polarity limit is defined using ClogP? What is origin of the hydrogen bond donor/acceptor asymmetry in Ro5?
Kenny & Montanari (2013) JCAMD 27:1-13 DOI

Does octanol/water ‘see’ hydrogen bond donors?
--0.06 -0.23 -0.24
--1.01 -0.66--1.05
Kenny & Montanari (2013) JCAMD 27:1-13 DOI
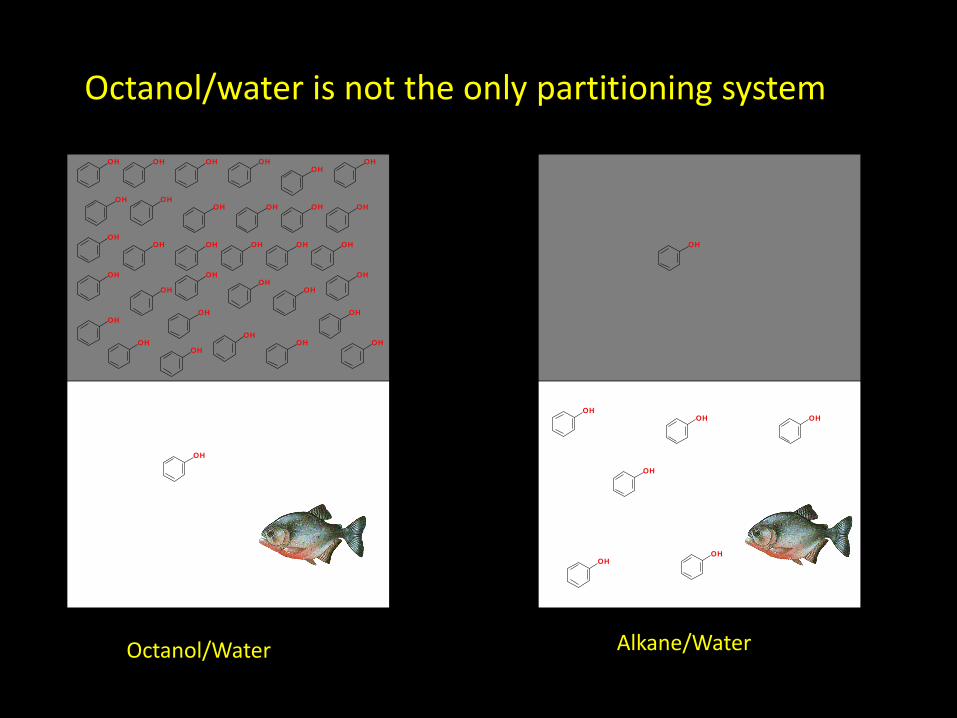
Octanol/Water Alkane/Water
Octanol/water is not the only partitioning system

logPoct = 2.1
logPalk = 1.9
DlogP = 0.2
logPoct = 1.5
logPalk = -0.8
DlogP = 2.3
logPoct = 2.5
logPalk = -1.8
DlogP = 4.3
Differences in octanol/water and alkane/water logP values reflect hydrogen bonding between solute and octanol
Toulmin et al (2008) J Med Chem 51:3720-3730 DOI
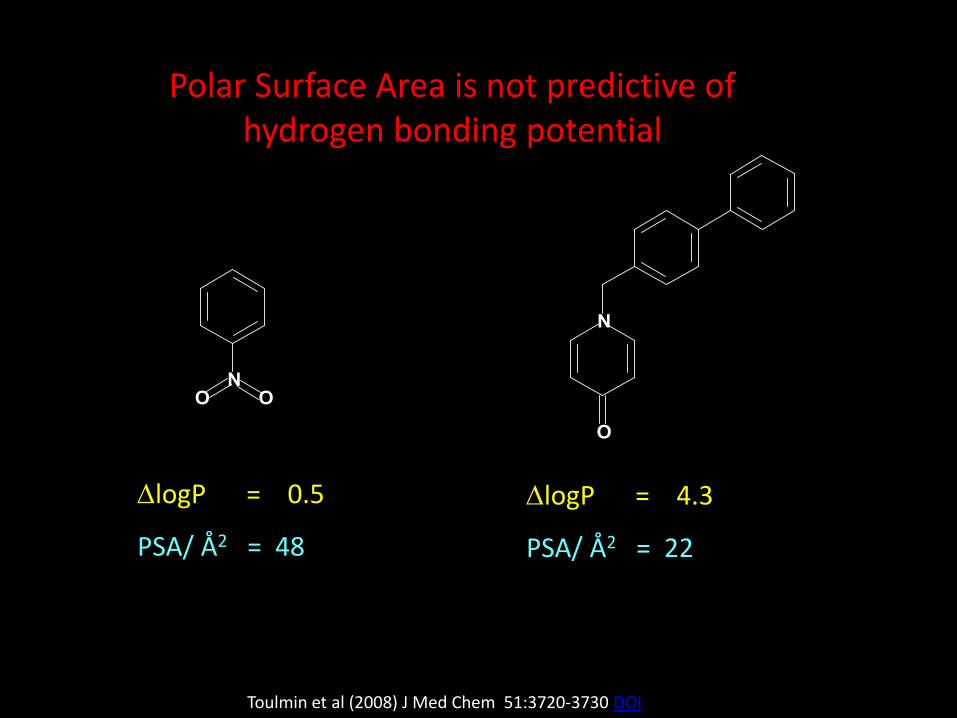
DlogP = 0.5
PSA/ Å2 = 48
Polar Surface Area is not predictive of hydrogen bonding potential
DlogP = 4.3
PSA/ Å2 = 22
Toulmin et al (2008) J Med Chem 51:3720-3730 DOI
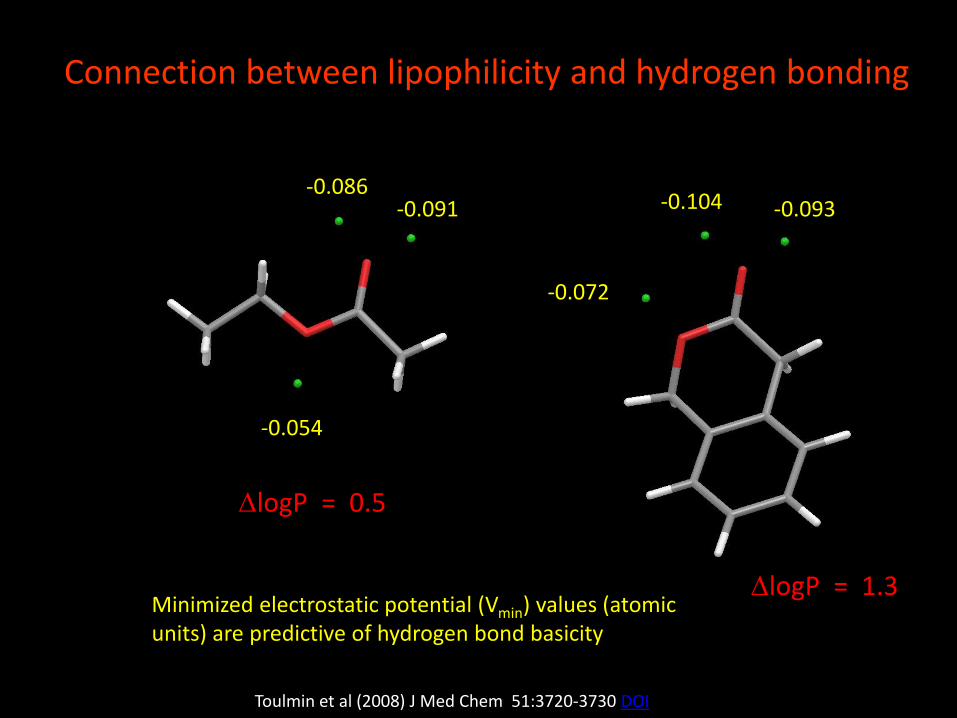
-0.054
-0.086-0.091
-0.072
-0.104 -0.093
Connection between lipophilicity and hydrogen bonding
Toulmin et al (2008) J Med Chem 51:3720-3730 DOI
DlogP = 0.5
DlogP = 1.3Minimized electrostatic potential (Vmin) values (atomic units) are predictive of hydrogen bond basicity
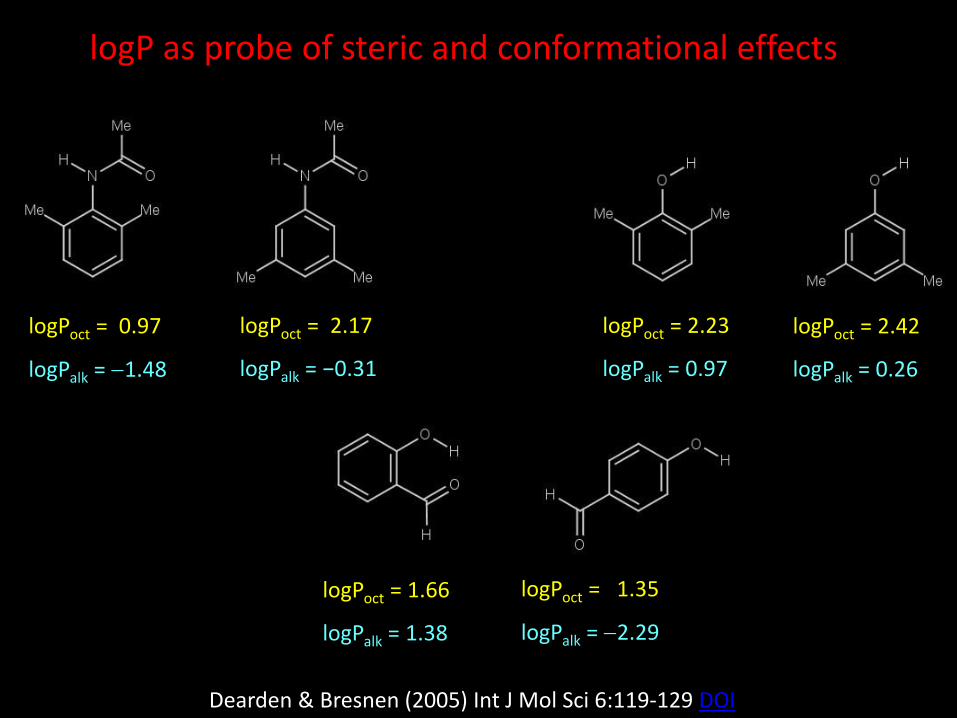
logPoct = 0.97
logPalk = 1.48
logPoct = 2.17
logPalk = −0.31
logPoct = 2.23
logPalk = 0.97
logPoct = 2.42
logPalk = 0.26
logPoct = 1.66
logPalk = 1.38
logPoct = 1.35
logPalk = 2.29
logP as probe of steric and conformational effects
Dearden & Bresnen (2005) Int J Mol Sci 6:119-129 DOI

Structural relationships between compounds as a framework for design
Hypothesis-driven molecular design, matched molecular pair analysis, neighborhood analysis, free energy perturbation…

Prediction-driven design (and descriptor-
based QSAR/QSPR)
• How valid is methodology (especially for validation) when distribution of compounds in training/test space is non-uniform?
• Are models predicting activity/properties or just locating neighbors?
• To what extent are ‘global’ models simply ensembles of local models?
• How should we account for number of degrees of freedom when comparing model performance?
• How should we account for sizes of descriptor pools when comparing model performance?
• How does sampling affect correlations between descriptors?
• How well do methods handle ‘activity cliffs’?

Examples of structural relationships between compounds
Tanimoto coefficient (foyfi) for structures is 0.90
Ester is methylated acid Amides are ‘reversed’

Glycogen Phosphorylase inhibitors:Series comparison analysis
DpIC50
DlogFu
DlogS
0.38 (0.06)-0.30 (0.06)-0.29 (0.13)
DpIC50
DlogFu
DlogS
0.21 (0.06)0.13 (0.04)0.20 (0.09)
DpIC50
DlogFu
DlogS
0.29 (0.07)-0.42 (0.08)-0.62 (0.13)
Standard errors in mean values in parenthesis; see Birch et al (2009) BMCL 19:850-853 DOI

Hypothesis-driven molecular design and relationships between structures as framework for analysing activity and properties
?
Date of Analysis N DlogFu SE SD %increase
2003 7 -0.64 0.09 0.23 0
2008 12 -0.60 0.06 0.20 0
Mining PPB database for carboxylate/tetrazole pairs suggested that bioisosteric replacement wouldlead to decrease in Fu . Tetrazoles were not synthesised even though their logP values are expected tobe 0.3 to 0.4 units lower than for corresponding carboxylic acids.
Birch et al (2009) BMCL19:850-853 DOI
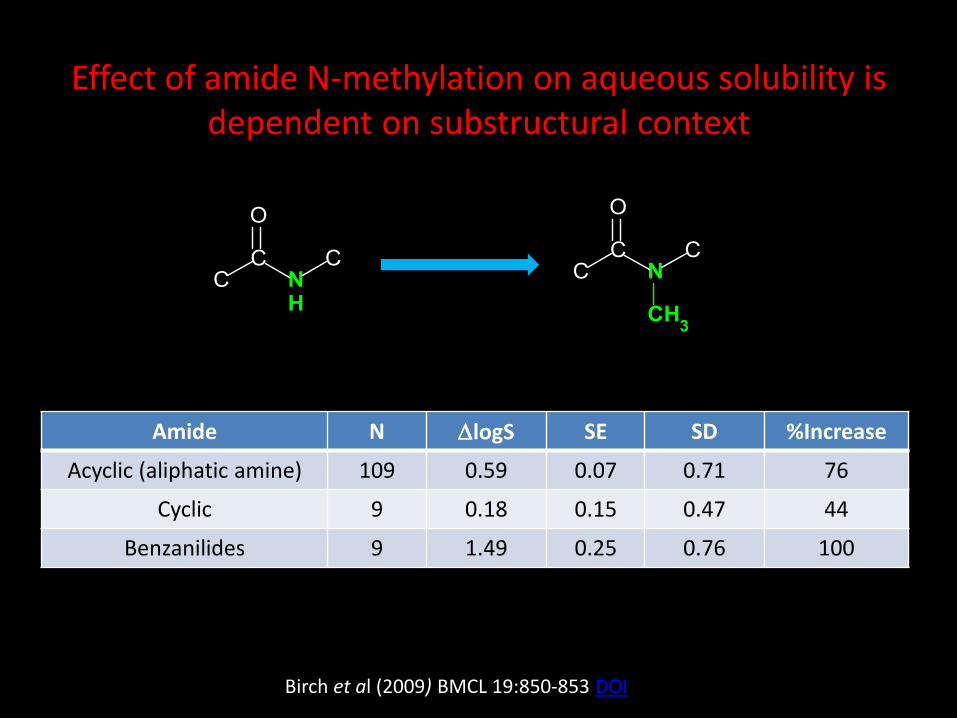
Amide N DlogS SE SD %Increase
Acyclic (aliphatic amine) 109 0.59 0.07 0.71 76
Cyclic 9 0.18 0.15 0.47 44
Benzanilides 9 1.49 0.25 0.76 100
Effect of amide N-methylation on aqueous solubility is dependent on substructural context
Birch et al (2009) BMCL 19:850-853 DOI

Structural relationships between compounds
Discover new
bioisosteres &
scaffolds
Prediction of activity &
properties
Recognise
extreme data
Direct
prediction
(e.g. look up
substituent
effects)
Indirect
prediction
(e.g. apply
correction to
existing model)
Bad
measurement
or interesting
effect?

• How can we make hypothesis-driven design more
systematic and more efficient?
• Data can be massaged and correlations can be
inflated but it won’t extract us from ‘la merde’
• There is life beyond octanol/water (and atom-
centered charges) if we choose to look for it
• Even molecules can have meaningful relationships
Stuff to think about