
Property based funding options for the NSW Fire Services … based funding... · Property based...
59
Insurance Council of Australia Property based funding options for the NSW Fire Services Levy 7 June 2011
Transcript of Property based funding options for the NSW Fire Services … based funding... · Property based...

Insurance Council of Australia Property based funding options for the NSW Fire Services Levy
7 June 2011

Liability limited by a scheme approved under Professional Standards Legislation.
Member of Deloitte Touche Tohmatsu Limited
Deloitte Touche Tohmatsu ABN 74 490 121 060 Grosvenor Place
2225 George Street Sydney NSW 2000 PO Box N250 Tel: +61 (0) 2 9322 7000 Fax: +61 (0) 2 0322 7001 www.deloitte.com.au
Alex Sanchez General Manager Policy, Economics & Taxation Directorate Insurance Council of Australia Level 3, 56 Pitt Street Sydney NSW 2000 14 June 2011
Dear Mr Sanchez Re: Impact of replacing an insurance based fire services funding model with a property based model for New South Wales I am pleased to present our final report on alternative approaches to funding the New South Wales’ fire services. Please feel free to contact me if you have any questions. Yours sincerely Yours sincerely Robert Southern Lead Partner – Economics and Infrastructure Advisory

Deloitte refers to one or more of Deloitte Touche Tohmatsu Limited, a UK private company limited by guarantee, and its network of member firms, each of which is a legally separate and independent entity. Please see www.deloitte.com/au/about for a detailed description of the legal structure of Deloitte Touche Tohmatsu Limited and its member firms.
Liability limited by a scheme approved under Professional Standards Legislation. 2
© 2011 Deloitte Touche Tohmatsu
Statement of Responsibility
This report was prepared for the Insurance Council of Australia for the purpose examining the impact of moving from an insurance based model to fund the New South Wales fire services to a property based tax. .
In preparing this report we have relied on the accuracy and completeness of the information provided to us by the Insurance Council of Australia. We have not audited or otherwise verified the accuracy or completeness of the information and, to that extent, the information contained in this report may not be accurate or reliable. This is normal practice when carrying out an engagement such as this, but contrasts with an audit.
No one else, apart from the Insurance Council of Australia is entitled to rely on this Report for any purpose. We do not accept or assume any responsibility to anyone in respect of our work or this Report should it be used by any other party or for any other purpose that has not been expressly agreed in writing by Deloitte.
About Deloitte
Deloitte provides audit, tax, consulting, and financial advisory services to public and private clients spanning multiple industries. With a globally connected network of member firms in more than 150 countries, Deloitte brings world-class capabilities and deep local expertise to help clients succeed wherever they operate. Deloitte's approximately 170,000 professionals are committed to becoming the standard of excellence.
Deloitte refers to one or more of Deloitte Touche Tohmatsu Limited, a UK private company limited by guarantee, and its network of member firms, each of which is a legally separate and independent entity. Please see www.deloitte.com/au/about for a detailed description of the legal structure of Deloitte Touche Tohmatsu Limited and its member firms.
About Deloitte Australia
In Australia, the member firm is the Australian partnership of Deloitte Touche Tohmatsu. As one of Australia’s leading professional services firms, Deloitte Touche Tohmatsu and its affiliates provide audit, tax, consulting, and financial advisory services through approximately 5,400 people across the country. Focused on the creation of value and growth, and known as an employer of choice for innovative human resources programs, we are dedicated to helping our clients and our people excel. For more information, please visit Deloitte’s web site at www.deloitte.com.au
Liability limited by a scheme approved under Professional Standards Legislation.
Member of Deloitte Touche Tohmatsu
© 2011 Deloitte Touche Tohmatsu

Deloitte refers to one or more of Deloitte Touche Tohmatsu Limited, a UK private company limited by guarantee, and its network of member firms, each of which is a legally separate and independent entity. Please see www.deloitte.com/au/about for a detailed description of the legal structure of Deloitte Touche Tohmatsu Limited and its member firms.
Liability limited by a scheme approved under Professional Standards Legislation. 3
© 2011 Deloitte Touche Tohmatsu
Contents
Executive Summary 4
1 Introduction 9
1.1 Introduction 9
1.2 Report structure 9
2 Background 10
2.1 Fire and related services in NSW 10
2.2 Current funding arrangements 10
2.3 Funding arrangements in other jurisdictions 11
2.4 NSW policy context 12
3 Methodology 14
3.1 Characteristics of a property based tax 14
3.2 Scenarios used for modelling 14
3.3 Preferred approach 15
3.4 Data sources used 16
3.5 Calculation of net savings 18
3.6 Limitations of the model 19
4 Results 20
4.1 The base case 20
4.2 Scenario 1 21
4.3 Scenario 2 27
4.4 Scenario 3 33
5 Conclusions 39
Appendix A 41
Appendix B 54

Executive Summary
Deloitte: Property based funding options for the NSW Fire Services Levy 4
Executive Summary
Background
This report outlines the findings of a model developed to examine the distributional impacts of
changing the system of funding for NSW’s fire services agencies so that it is based primarily on
property values rather than insurance premiums. The model was developed by the Insurance Council
of Australia (ICA) and Deloitte using data provided by the ICA and other publically available sources.
Fire services funding has been the subject of debate in NSW and across Australia and currently NSW
and Victoria are the only states that continues to fund its fire services through insurance contributions
(known as the Fire Services Levy or FSL), although Victoria is planning to implement a property
based charge, as recommended by the 2009 Victorian Bushfires Royal Commission.
The key impetus for shifting from an insurance based funding system to a property based funding
system is the problem posed by the uninsured and the underinsured. The owners of uninsured
properties make no direct contribution to the funding of fire services, and the owners of underinsured
properties pay less than the owners of fully insured properties when levies on the insurance industry
are the main mechanism for funding fire services. This raises horizontal equity concerns and provides
a disincentive for property owners to purchase adequate insurance coverage. This disincentive is
increased by the combined effect of insurance taxes and GST charged on insurance premiums.
In NSW there are three organisations responsible for the provision of fire and related emergency
services. They are Fire and Rescue NSW (FRNSW), the Department of Rural Fire Service (RFS) and
the State Emergency Service (SES). At present 73.7 per cent of the total FRNSW, RFS and SES
budgets are collected from insurance premiums, with the remainder coming from the NSW State
Government (14.6 per cent) and local governments (11.7 per cent). The total amount of funding for
these services in 2010-11 is $912 million, with $672 million contributed from insurance premiums.
Modelling
The preferred approach of Deloitte and the ICA was to comment on the distributional impact on
property owners for each of the scenarios identified below by matching the current amount of FSL
collected through insurance policies, for each property in NSW, and comparing this amount with the
amount that would be collected under a property based charge, based on the land value of those
properties.
Due to limitations with the data this approach was not possible and instead the approach adopted is
one that shows the outcomes for the average insured residential, commercial and rural property
owner, in each Local Government Area (LGA), comparing the amount of fire services contributions
they would pay for a range of property based scenarios with the amount of fire service contributions
they currently pay through their insurance contributions.1 This allows us to comment on the
distributional impacts for the average property in each LGA, but not on the distribution of impacts of
all properties within the LGAs. This should be considered when interpreting the results.
The ICA has asked Deloitte to model the distributional effects of three broad approaches to funding
the FSL through a property based charge, at a flat rate, a rate based on the service level in each LGA
and a rate based on the fire risk of each LGA:
• Scenario 1 – flat rate: This scenario involves replacing the insurance based system with the
application of a property based tax, based on land value and property type (residential,
commercial or rural), applied evenly across NSW
1 Deloitte and the ICA were not able to obtain land values for individual properties and could therefore only estimate results for the average property in each LGA. This is discussed in Sections 3.3 and 3.4.

Executive Summary
Deloitte: Property based funding options for the NSW Fire Services Levy 5
• Scenario 2 – service level: This scenario also involves replacing the insurance based system with
the application of a property based tax, based on land value and property type, but varying across
NSW so that LGAs continue to contribute the same proportion of FSL funding as they did in
2009-10. LGAs contribute a fixed proportion of fire services funding. Basing the rates on
property on the amount contributed by the LGAs is intended to reflect the cost of providing fire
services in each LGA as well as the level of service provision
• Scenario 3 – fire risk: This scenario also involves replacing the insurance based system with the
application of a property based tax, based on land value and property type, but varying across
NSW so that properties contribute based on the fire risk of their LGA, estimated from fire
incidence data provided by FRNSW.
For each scenario the ICA has asked Deloitte to model several iterations, varying the proportion of
fire services to be funded through a property based tax and allowing for the inclusion of a motor
vehicle tax, given the significant amount of resources that the fire services spend responding to motor
vehicle incidents:
• Part (a) – insurance contributions only are transferred to a new property based tax
• Part (b) – insurance contributions and the state contribution are transferred to a new property
based tax
• Part (c) – all contributions (insurance, state and local government) are transferred to a new
property based tax
• Part (d) – insurance contributions are transferred to a combination of a motor vehicle and
property based tax
• Part (e) – insurance contributions and the state contribution are transferred to a combination of a
motor vehicle and property based tax.
Results
Insurance based contributions to fire services
The table below is based on information provided by NSW insurance companies to the ICA. It shows
the average amount of FSL per property collected by insurance companies for the funding of fire
services. GST and state taxes are charged on top of this amount, which increases the cost of the FSL
to property owners.
Average FSL, including taxes for residential, commercial and rural properties
Residential Commercial Rural
Average FSL per property, charged by insurer $ 105 $ 666 $ 218
Taxes, including GST (10%) and state taxes (9%) $ 21 $ 132 $ 43
Total FSL cost per property $ 126 $ 798 $ 262
Property based contributions to fire services
For the scenarios modelled, on average there would be a saving to the average residential property
across LGAs in NSW. The magnitude of that saving is dependent on the amount of revenue to be
collected from a property based tax. Where a property based tax is used to collect the NSW State
Government or local government’s proportion of fire services funding, in addition to the insurance
contributions, the average savings are smaller.

Executive Summary
Deloitte: Property based funding options for the NSW Fire Services Levy 6
Outcomes for residential properties, Scenario 1
Part In
su
ran
ce
Sta
te G
ov.
Lo
cal G
ov.
Mo
tor
veh
icle
Number of LGAs where
average property has a
net saving
Number of LGAs where
average property has a
net cost
Per cent of LGAs where the average
property has a net saving
Average net saving for the
average property
a ���� - - - 120 28 81% $ 41
b ���� ���� - - 112 36 76% $ 26
c ���� ���� ���� - 103 45 70% $ 14
d ���� - - ���� 129 19 87% $ 54
e ���� ���� - ���� 120 28 81% $ 42
As the table above shows, residential results are almost the same for Part A, as they are for Part E.
This is because the inclusion of an additional $25 annual tax on all motor vehicles in NSW is roughly
equivalent to the current NSW State Government contribution, meaning that households would
experience roughly the same outcomes as for Part A.
For Scenario 1, savings tend to be greater for rural LGAs that are located inland, compared with those
located by the coast, and also for Sydney metropolitan LGAs that are located in the west of the
Sydney metropolitan area, relative to those in the north and the east.
Annual saving, residential properties, NSW, scenario 1a

Executive Summary
Deloitte: Property based funding options for the NSW Fire Services Levy 7
Annual saving, residential properties, Sydney, scenario 1a
By contrast the model shows that, the average commercial and rural property owner incurs a net cost
under the scenarios modelled. This is partly a function of the decision on what proportion of revenue
to collect from each of the three property types, as well as the other assumptions made in the model. It
should also be noted that, while the model can estimate the impact on the average property in each
LGA, there is significantly more variation in the value of commercial and rural properties and the
outcome for the average property in each LGA may not provide a good indication of the outcome for
most properties. The difference in the outcomes between the iterations of Scenario 1 is determined by
the total amount of revenue to be collected from the property based tax. The average net cost for
commercial and rural properties is lower for Parts A and E than for the other parts.
Outcomes for commercial and rural, Scenario 1
Part In
su
ran
ce
Sta
te G
ov.
Lo
cal G
ov.
Mo
tor
veh
icle
Commercial Rural
Per cent of LGAs where the average property has a net
saving
Net saving for the
average property
Per cent of LGAs where the average property has a net
saving
Net saving for the
average property
a ���� - - - 38% - $ 502 42% - $ 219
b ���� ���� - - 35% - $ 748 34% - $ 310
c ���� ���� ���� - 34% - $ 945 27% - $ 387
d ���� - - ���� 42% - $ 293 52% - $ 142
e ���� ���� - ���� 38% - $ 498 43% - $ 217
The magnitude of results for Scenarios 2 and 3 are similar to Scenario 1, with the main difference
being the distribution of LGAs where the average property has a net saving or net cost. In the case of
Scenario 2 it is the proportion of FSL currently being contributed by each LGA that influences this
distribution. For Scenario 3, the distribution of results is influenced by the distribution of fire events
recorded by FRNSW in 2009-10.
Although the average results for Scenarios 2 and 3 are similar to Scenario 1, these scenarios were
more likely to show a significant change in the amount of FSL being paid by the average property in

Executive Summary
Deloitte: Property based funding options for the NSW Fire Services Levy 8
each LGA (either a significant saving or a significant cost). A lack of property level data prevents us
from fully explaining the distribution of these results or from developing more complex scenarios
based on either service level or fire risk.
Conclusions
All of the scenarios modelled overcome the limitations associated with an insurance based fire
services funding scheme, however, none of the three scenarios modelled presents an obvious choice
for the future of a property based charge to fund fire services. In terms of equity there are advantages
and disadvantages associated with each.
Although the model has been able to provide a general indication of the distributional impacts on the
average property, by property type in each LGA, there is considerable variation in property values
within LGAs that has not been captured by this model. To further increase understanding of the
distributional impacts of replacing insurance based fire services funding with a property based tax it is
recommended that individual property from the NSW Valuer General be matched against comparable
insurance data to allow for a more detailed modelling exercise of the distributional impacts on a per-
property basis.
As well as providing a more detailed understanding of the distributional impacts, this type of
modelling would allow for the development of more detailed scenarios. This may include the use of
price caps and floors, fixed and variable components of the property and motor vehicle charges, or any
number of other strategies that might be used to mitigate perceived inequities created under the
scenarios modelled.
Introduction
Deloitte: Property based funding options for the NSW Fire Services Levy 9
1 Introduction
1.1 Introduction Fire services funding has been the subject of debate in NSW and across Australia. The majority of the
funding for NSW fire services is currently provided by insurance companies through levies placed on
insurance policies. Several other states (Queensland, South Australia, and Western Australia) have
moved away from insurance based systems towards systems which directly charge property owners
with reference to factors such as the value of property, the risk classification of the property, the
location of the property and the use of the property. In Victoria, the only state other than NSW to fund
fire services through insurance, the government has agreed to move to a property charge, following a
recommendation from the 2009 Victorian Bushfires Royal Commission. On the 14th of May 2011 the
Victorian Government announced that from 1 July 2013, FSL would be abolished from insurance
premiums. The Victorian Government announced that a position paper would be prepared by the end
of June 2011 on the implementation arrangements.
In each instance where a state has shifted from insurance-based funding to property-based funding,
this has been decision to redress equity, economic efficiency and consumer behaviour issues posed by
the uninsured and the underinsured. The owners of uninsured properties make no direct contribution
to the funding of fire services, and the owners of underinsured properties pay less than the owners of
fully insured properties when levies on the insurance industry are the main mechanism for funding fire
services. This raises horizontal equity concerns and provides a disincentive for property owners to
purchase adequate insurance coverage.
The basis of this report is a model developed by the Insurance Council of Australia (ICA) with
assistance from Deloitte. The model calculates an alternative system for funding NSW fire services
through the use of property based taxes. The report presents the results of the modelling and discusses
options for improving the modelling.
1.2 Report structure The remainder of the report is structured as follows:
Chapter 2 – provides background to the current funding system in NSW and other states
Chapter 3 – details the modelling assumptions and methodology used
Chapter 4 – presents the results of the modelling under the different scenarios developed
Chapter 5 – presents the conclusions of the analysis.
The report also contains two appendices:
Appendix A – contains some of the data used for the report
Appendix B – is a reference list.
Background
Deloitte: Property based funding options for the NSW Fire Services Levy 10
2 Background
2.1 Fire and related services in NSW In NSW there are three organisations responsible for the provision of fire and related emergency
services. They are Fire and Rescue NSW2 (FRNSW), the Department of Rural Fire Service (RFS) and
the State Emergency Service (SES). The responsibilities of these organisations are briefly outlined
below:
• FRNSW provides emergency risk management services from 338 stations across NSW. It
promotes fire safety, manages fires and protects the State from hazardous material incidents and
is the largest provider of non-fire rescue services in New South Wales. It provides direct fire
protection to more than 90 per cent of the State’s population, and has mutual aid arrangements
with other emergency services that extend its services beyond gazetted fire districts.
FRNSW also maintains a state-wide counter-terrorism consequence management emergency
capability and is responsible for the receipt of all 000 and automatic fire alarm calls for both the
FRNSW and the RFS. Its governing legislation is the Fire Brigades Act 1989
• The RFS provides a community-based fire service covering more than 95 per cent of New South
Wales. The Service relies on over 70,000 volunteers to provide most of its fire management and
fire protection services under the Rural Fires Act 1997
• The SES is a volunteer-based emergency management response and rescue agency established by the State Emergency Service Act 1989. The Service is the nominated agency responsible for providing assistance in floods, storms and tsunamis under the State Disaster Plan.
The Service also has responsibility for 90 accredited rescue units and for providing assistance to
the NSW Police Force, RFNSW, the RFS, the Ambulance Service of New South Wales and the
State Emergency Operations Controller.3
2.2 Current funding arrangements Budgets for FRNSW, the RFS and the SES are set by the Treasurer each year. They are funded
according to the same methodology, primarily by a levy on general insurance companies, which is
passed on to insurance policy holders. At present 73.7 per cent of the total FRNSW, RFS and SES
budgets are collected this way, with the remainder coming from NSW State Government (14.6 per
cent) and local government contributions (11.7 per cent).
Under the Fire Brigades Act 1989, the Rural Fires Act 1997and the State Emergency Service Act 1989
general insurance companies are required to provide to the commissioners of the respective
organisations an audited account of the amount of premiums received by the company for the previous
financial year. These premiums are then multiplied by fixed rates ranging from zero to 80 per cent to
determine the amount of premiums subject to contribution.4
The contribution by individual insurance companies is then determined in accordance with the
following formula:
2 Note that on 1 January 2011 NSW Fire Brigades changed its name to Fire and Rescue NSW 3 NSW Department of Treasury, Budget 2010-11 – Budget Paper 3, Police and Emergency Services 4 See Fire Brigades Act 1989, Schedule 1 – Proportion of premiums subject to contribution http://www.legislation.nsw.gov.au/maintop/view/inforce/act+192+1989+cd+0+N

Background
Deloitte: Property based funding options for the NSW Fire Services Levy 11
Box 2.1: FSL Contribution methodology
Contribution payable = � ��
�
Where: a is the total amount of premiums subject to contribution specified in the return made by the company b is the total amount of fire brigade contributions payable by all insurance companies c is the total amount of all premiums subject to contribution specified by all insurance companies
Insurance companies in NSW then make fire brigade, RFB and SES instalment payments into the
recurrent expenditure accounts of the respective funds according to their contribution payable.
Each year the ICA assists its members to collect their contribution payable, by providing its members
with estimates of the levy rates payable to certain classes of policies in order to produce the insurance
industry’s share of the FRSNW, RFS and SES budgets. The ICA does this by grossing up the
premiums subject to contribution to 100 per cent. It then recommends the levy that be applied to those
gross premiums. The percentages currently recommended are:
Table 2.1: Insurance Council of Australia advisory levy rates, June 2011
Policy type Percentage of gross premium
Fire / ISR / Consequential Loss 40 per cent
Householders / homeowners 23 per cent
Motor 1 per cent
Source: Information provided by the Insurance Council of Australia
Total funding for the three services in 2009-10 was $847 million. The chart below shows the
allocation of funding between the services.
Figure 2.1: FRNSW, RFS and SES budget estimates 2009-10
Source: NSW Department of Treasury, Budget 2010-11 – Budget Paper 3, Police and Emergency Services
2.3 Funding arrangements in other jurisdictions Fire service agencies are funded in several different ways across Australia’s states and territories.
Queensland, South Australia and Western Australia have moved away from insurance-based systems
towards property-based systems. Tasmania maintains a system which combines a levy on commercial
insurance with a property-based levy. Tasmania and South Australia also have a specific levy on
motor vehicles. Aside from New South Wales, the only state to maintain an insurance-based system
0
100
200
300
400
500
600
New South Wales Fire Brigades
Department of Rural Fire Service
State Emergency Service
20
09
-10
bu
dg
et
$ m
illio
n

Background
Deloitte: Property based funding options for the NSW Fire Services Levy 12
for both residential and commercial properties is Victoria. In Victoria the fire services levy was
subject to the 2009 Victorian Bushfires Royal Commission. In its final recommendations the
Commission recommended that the state replace the Victorian fire services levy with a property based
levy and introduce concessions for low income earners.5 The Victorian government accepted this
recommendation and began a consultation process for the implementation of such a scheme.
The table below summarises the fire services funding arrangements in other Australian jurisdictions.
Table 2.2: Funding systems in other Australian states and territories
State Funding system Vehicle
levy? Contribution details
Vic Currently insurance-based.
No Insurance companies currently fund 75 per cent of
Metropolitan services, with state and local
governments evenly sharing the remainder6
Insurance companies fund 77.5 per cent of rural fire
services, with the state government funding the
remainder7
Qld Property-based (replaced
insurance-based system in
1985)
No Residential properties are charged based on building
category and location. Commercial properties are
charged based on fire risk category8
SA Property-based (replaced
insurance-based system in
1999)
Yes Residential and commercial properties are charged
based on location and land use9
Tas Insurance/property hybrid
Yes Insurance companies charged on the basis of
commercial premiums. Local governments charged
on the basis of property value10
WA Property-based (replaced
insurance-based system in
2003)
No Residential and commercial properties are charged
based on property value and location11
NT & ACT Government funded No All funding is from consolidated revenue
2.4 NSW policy context The way in which fire services are funded in NSW has been the subject of several recent policy
discussions, including the Review of State Taxation, released in 2008 by the Independent Pricing and
Regulatory Tribunal (IPART) and Public Account Committee of NSW Review of Fire Services
Funding, tabled in the legislative assembly in 2004. The findings and recommendations of those
reports are summarised below.
5 Victorian Bushfire Royal Commission, Final Report Recommendations – Recommendation 64, July 2010 6 Metropolitan Fire Brigade Act 1958 (Vic) 7 Country Fire Authority Act 1958 (Vic) 8 Part 10, Fire and Rescue Service Act 1990 (Qld) 9 Emergency Services Funding Act 1998 (SA) 10 Section 77, Fire Services Act 1979 (Tas.) 11 Emergency Services Levy Act 2002 (WA) and Fire and Emergency Services Authority of Western Australia Act
1998 (WA)

Background
Deloitte: Property based funding options for the NSW Fire Services Levy 13
2.4.1 Review of Fire Services Funding (2004)
In 2003 the Public Account Committee of NSW (PAC)12 was given terms of reference to prepare a
report evaluating the current fire services funding arrangements and alternative funding arrangements.
The Committee found that the FSL is flawed because it is not universal and not all who benefit from
fire services contribute to funding them. Anyone can choose not to contribute to fire services by not
taking out insurance at prudent levels.13 In its recommendations, the Committee favoured retaining the
insurance based system, subject to a number of minor improvements, but made recommendations that
further work be undertaken to ascertain the impacts of introducing a property-based levy for funding
fire services for the commercial sector.14
The key recommendation, to retain an insurance based levy, was supported by government and the
government agreed to consider the Committee’s recommendations relating to the design of a property
based system “if it is decided at some point in the future to re-examine the merits of a property based
system.” 15
2.4.2 IPART Review of State Taxation
In October 2008 IPART released the final report of its review of state taxation in NSW. With
reference to the FSL IPART found that fire services funding contributions (along with insurance
duties) are the least efficient State taxes. Both these revenue sources penalise those who are prudent
enough to take out insurance, and so encourage underinsurance and non-insurance. In addition,
significant free-rider problems are associated with the fire services funding arrangements, where non-
contributors benefit from the provision of fire services without contributing to the cost through
insurance policies.16
IPART recommended that:
In the short term, the statutory contributions by insurance companies to fund fire services
should be replaced by an equivalent, transparent property-based levy collected by local
councils. The levy should be separately identified on rates notices, be phased in over time
and be excluded from the municipal rates cap. The State Government’s contribution to fire
services should increase by the amount that the State Government currently contributes to
the Fire Services Levy through insurance premiums.17
12 The Public Accounts Committee has responsibilities under Part 4 of the Public Finance and Audit Act 1983 to inquire into and report on activities of Government that are reported in the Total State Sector Accounts and the accounts of the State’s authorities 13 Parliament of NSW, Legislative Assembly, Public Accounts Committee – Review of Fire Services Funding, September 2004, p xxi 14 Ibid. p xxiii 15 Andrew Refshuage, (then) Treasurer, The Government’s response to the recommendations arising from the
final report of the Public Accounts Committee Review of Fire Services Funding, 2 September 2005 16 IPART, Review of State Taxation, Final Report October 2008, p 7 17 IPART, Review of State Taxation, Final Report October 2008, p 9 (Recommendation 10)
Methodology
Deloitte: Property based funding options for the NSW Fire Services Levy 14
3 Methodology
The purpose of this report is to present the results of a model developed by the Insurance Council of
Australia (ICA), with assistance from Deloitte. The model is designed to show the distributional
impact on property owners of shifting from an insurance based funding system for services to a
property based funding system. This chapter outlines the methodology adopted in developing the
model.
3.1 Characteristics of a property based tax A shift from an insurance-based funding system to a property-based funding system entails two
changes:
1. An increase in property rates charged by local governments on all property owners
2. A decrease in insurance premiums for insured property owners due to the removal of the FSL
charged by insurance companies.
As discussed in the previous chapter, not all properties are insured. This means that funding is spread
over a larger population under a property-based system than under an insurance-based system. For the
average property owner with insurance this means a net saving because the increase in property rates
is more than offset by the decrease in insurance premiums. However, because property values and
insurance premiums differ by the location and type of property not all insured property owners in all
areas are ensured positive net savings.
The model developed for this report estimates the net savings for insured property owners. Net
savings are the difference between the increase in property rates and the decrease in insurance
premiums. For the purposes of modelling, properties were divided into categories and charged
different rates according to the property type.
In terms of property type, properties were divided according to whether they are residential,
commercial or rural.18 The share of total funding to be paid by each was based on an estimate obtained
by the ICA of the proportion of total gross insurance premiums paid by each. It is assumed that this is
approximately equal to the current fire service levy collection shares under the insurance-based
system.
3.2 Scenarios used for modelling The ICA has asked Deloitte to model the distributional effects of three broad approaches to funding
the FSL through property based charge, a flat rate, a rate based on the service level in each LGA and a
rate based on the fire risk of each LGA:
• Scenario 1 – flat rate: This scenario involves replacing the insurance based system with the
application of a property based tax, based on land value and property type (residential,
commercial or rural), applied evenly across NSW
• Scenario 2 – service level: This scenario also involves replacing the insurance based system with
the application of a property based tax, based on land value and property type, but varying across
NSW so that LGAs continue to contribute the same proportion of FSL funding as they did in
2009-10. LGAs contribute a fixed proportion of fire services funding. Basing the rates on
18 This is based on the methodology used by Professional Financial Services in their report to the NSW Public Accounts Committee, For Quantitative Modelling of NSW FSL Funding Methods.
Methodology
Deloitte: Property based funding options for the NSW Fire Services Levy 15
property on the amount contributed by the LGAs is intended to reflect the cost of providing fire
services in each LGA as well as the level of service provision
• Scenario 3 – fire risk: This scenario also involves replacing the insurance based system with the
application of a property based tax, based on land value and property type, but varying across
NSW so that properties contribute based on the fire risk of their LGA, estimated from fire
incidence data provided by FRNSW.
For each scenario the ICA has asked Deloitte to model several iterations, varying the proportion of
fire services to be funded through a property based tax and allowing for the inclusion of a motor
vehicle tax:
• Part (a) – insurance contributions are transferred to a new property based tax
• Part (b) – insurance contributions and the state contribution are transferred to a new property
based tax
• Part (c) – all contributions (insurance, state and local government) are transferred to a new
property based tax
• Part (d) – insurance contributions are transferred to a combination of a motor vehicle and
property based tax
• Part (e) – insurance contributions and the state contribution are transferred to a combination of a
motor vehicle and property based tax.
3.3 Preferred approach The preferred approach was to comment on the distributional impact on property owners for each of
the scenarios identified above by matching the current amount of FSL collected through insurance
policies, for each property in NSW, and comparing this amount with the amount that would be
collected under a property based charge, based on the land value of those properties. This
methodology would involve:
• Obtaining insurance data from NSW insurers, including the amount of FSL collected for each
insured property in NSW, including the address of the property
• Obtaining land value data from the NSW Valuer General, for each rateable property in NSW,
including the address of the property
• Combining the two data sets by matching the addresses and removing properties that cannot be
matched
• Comparing the results on an individual property basis and commenting on the distribution of the
results.
This approach is similar to the approach that Deloitte and the ICA used to model similar scenarios for
Victorian fire services funding in 2010 and the approach used by Professional Financial Services to
model similar scenarios for the PAC Review of Fire Services Funding in 2004.
Unfortunately, Deloitte and the ICA were not able to obtain land values for individual properties from
the NSW Valuer General. Instead we were provided with aggregate land values, by Local Government
Area (LGA), from which we were able to estimate the average land value of properties by LGA.
Deloitte has compared this with aggregated data from insurers, showing the average FSL collected by
policy type, by postcode was available.
This limits the ability of the model to comment on the full distributional impact on property owners
under the scenarios tested, beyond the effect on the average property in each LGA. The sections below
discuss the data used for the modelling and the limitations of this approach.

Methodology
Deloitte: Property based funding options for the NSW Fire Services Levy 16
3.4 Data sources used The data used for the modelling has been collected from either the ICA, or from NSW Government
departments.
3.4.1 Insurance data
The ICA has provided Deloitte with postcode level data from major insurers in NSW, showing the
insured value of all buildings and contents, the total FSL collected and the number of policies. From
this data, the average FSL per postcode has been calculated for each of the property types (residential,
commercial and rural).
The data provided is a point in time estimate, collected in December 2010, the approximate mid-point
of the 2010-11 financial year.
3.4.2 Property data
The ICA provided Deloitte with aggregate land value data, purchased from the NSW Valuer General,
which shows the total land value in each LGA, by zoning types. For the purpose of the modelling
Deloitte has classified the zoning types as being either rateable or unrateable. Rateable land has then
been further classified as being predominantly residential, commercial or rural.
Based on the data provided, the total value of land in NSW is $957 billion, with 91 per cent of this
land, or $931 billion classified as rateable.
Figure 3.1: NSW land values
The total number of rateable properties could not be collected from the same source as land values, in
the absence of this data Deloitte has used the number of rateable properties provided by local
governments to the NSW Division of Local Government. This data is classifies properties as either
residential, business or farmland, which has been used as a proxy for our own property types of
residential, commercial and rural. Dividing the land value data by the number of rateable properties
data gives our estimate of average land value of each property type, for each LGA.
3.4.3 Fire services funding contributions
Level of funding
The fire services funding levels that are assumed to be transferred to a property based tax were
discussed under Section 2.2. This data was provided to Deloitte by the ICA. In 2010-11funding for
NSW fire services, including RFS and SES, grew by 11.6 per cent to $912 million. Contributions to
this funding are shown in the table below.
693.7
125.0 111.9
26.4
-
100.0
200.0
300.0
400.0
500.0
600.0
700.0
800.0
Residential Commercial Rural Unrateable
To
tal v
alu
e o
f N
SW
land
$ b
illio
ns

Methodology
Deloitte: Property based funding options for the NSW Fire Services Levy 17
Table 3.1: Fire services funding, 2010-11
Funding source FRNSW RFS SES Total
Insurance $ 438,663,137 $ 189,469,434 $ 43,820,546 $ 671,953,117
State Government $ 86,899,346 $ 37,533,972 $ 8,680,868 $ 133,114,186
Local Governments $ 69,638,517 $ 30,078,594 $ 6,956,586 $ 106,673,697
Total $ 595,201,000 $ 257,082,000 $ 59,458,000 $ 911,741,000
Source: Insurance Council of Australia
Insurance contribution to funding
The ICA make quarterly recommendations to insurers in NSW on the FSL charge (a percentage of
total premiums) to meet their statutory funding obligations. These ICA advisory rates are not
recognised in legislation and ultimately it is up to individual insurers to determine the FSL charges
required to meet their funding obligations. In practice most insurers do not charge FSL on motor
vehicle insurance.
Based on insurance data provided by the ICA the current level of contributions to the FSL from each
of the property types identified are:
• Residential – 45 per cent
• Commercial – 49 per cent
• Rural – 6 per cent.
These proportions are held constant in each of the scenarios modelled.
3.4.4 Motor vehicle data
For the scenarios that include the use of a motor vehicle charge (parts d and e) it is necessary to make
an estimate of the proportion of fire services costs that relate to motor vehicles. Callout information
has been collected from the annual reports of FRNSW, RFS and the SES that shows the proportion of
call-outs that relate to motor vehicle incidents (or, in the case of the SES the number of volunteer
hours spent on motor vehicle incidents). This information is summarised in the table below.
Table 3.2: Activity related to motor vehicle incidents 2009-10
FRNSW RFS SES*
Motor vehicle related call-outs 9,287 5,019 6,000
Total call-outs 62,397 20,146 387,520
Proportion of activity relating to motor vehicles 15% 25% 2%
* measured as total volunteer hours
Source: Deloitte analysis of 2009-10 annual reports for FRNSW, RFS and SES
As a simplifying assumption it has been assumed that the number of call-outs relating to motor vehicle
incidents is representative of the proportion of total costs of responding to these incidents. Based on
this assumption a weighted average of 16.8 per cent of the cost of fire services are incurred due to
motor vehicle incidents.

Methodology
Deloitte: Property based funding options for the NSW Fire Services Levy 18
The table below shows how this might be recovered from road users by the use of a flat charge on all
registered vehicles. Consideration could also be given to varying charges based on vehicle type, for
example requiring vehicles that have greater fire risk to pay more.
Table 3.3: Potential recovery of fire services costs from road users
Scenario
Amount to be recovered
from road users
Number of registered
vehicles
Amount to be recovered
per vehicle
Part (d) $ 113,170,681 5,498,972 $ 21
Part (e) $ 135,589,839 5,498,972 $ 25
Source: Deloitte analysis of RTA and other identified data sources
3.5 Calculation of net savings Using the data described above it is possible to calculate the net savings for the owners of the average
property, for each property type, in each LGA. The net saving is equal to the forgone FSL on
insurance premiums less the increased cost of higher property taxes.
The size of the net savings differs between the scenarios. Scenarios that involve transferring State
Government or State and local government contributions to a property based tax have lower net
savings to property owners than scenarios that only transfer insurance contributions. Similarly,
scenarios that include a motor vehicle charge have higher net savings to property owners. The
distribution of savings, by LGA, varies slightly between Scenario 1 and Scenario 2.
In calculating net savings, each observation of FSL provided by the ICA has been multiplied by 1.199,
to take into account the 10 per cent GST charged on insurance (including the FSL) and nine per cent
stamp duty charged in NSW.
It has also been assumed that the reduction in funding obligations is entirely passed onto policy
holders, not retained by insurers.
3.5.1 Sample calculation
The box below demonstrates how the data sources described above are brought together to estimate a
net saving for the average property in each LGA. The example uses the method applied in Scenario 1a
to calculate the net saving for the average residential property in the LGA of the City of Sydney as an
example.
Box 3.1: Example calculation – Scenario 1
1. Determine the average FSL currently paid by owners of that property type, in the LGA,
including taxes
From the data provided by the ICA the average FSL paid by residential properties owners in the
City of Sydney is $133, with the addition of GST and stamp duty this amount is increased to $160
2. Calculate the additional funding contribution to be paid by property owners
Under Scenario 1 the total revenue required for 2010-11, to replace insurance contributions to the
NSW FS, RFS and the SES is $672 million
3. Determine the total amount to be paid by owners of that property type
The property type is residential. Residential properties currently contribute an estimated 45 per
cent of the FSL, meaning that amount of revenue required from that property type, for this
scenario is $303 million

Methodology
Deloitte: Property based funding options for the NSW Fire Services Levy 19
4. Estimate the property rate increase per $1000 of land value
The total value of residential land in NSW is $694 billion. The rate of funding payable per $1000
of land value is equal to the funding figure determined in step 3, divided by this figure and
multiplied by $1000 i.e.
$��� ���
$��� ���� � $���� � $�. ��
5. Estimate the average value of that property type in the LGA
According to land and council data there are 82,110 residential properties, on land valued at $18.1
billion in the City of Sydney, meaning an average land value of $220,000 per property
6. Apply the rate of funding payable to the average property value
$�.��
$���� � $���, ��� � $��
7. Calculate net saving
The net saving is calculated as the difference between the amount identified in step 1 with the
amount identified in step 6, noting that there is not GST or additional state taxes applied to a
property based charge
$��� � $�� � $��
The net saving for the average residential property in the City of Sydney is therefore $64
3.6 Limitations of the model The modelling undertaken for this report is subject to a number of limitations that are worthy of
consideration when interpreting the results.
• Commenting on the distribution of net savings – to fully understand the distribution of net
savings on residential, commercial and rural property owners, data would need to be obtained at
the individual property level. Property level data was provided by insurers for use by Professional
Financial Services in their 2004 report to the NSW Public Accounts Committee. For privacy and
cost reasons only de-identified, post-code level data was available from insurers. Similarly land
value and rateable property data was only available on an LGA level, not by property as would
have been preferred. The data available allows us to comment on the net savings for the average
property in each LGA, which gives some indication of the distribution of savings across LGAs,
but it does not allow us to comment on the variation of outcomes within the LGAs.
• Difficulty in combining data from different sources – Three main data sources were used to
calculate net savings. These were, FSL data provided by insurers, land value data from the NSW
Valuer General and rateable property data from the NSW Division of Local Government. These
data sources were compiled at different times, according to slightly different methodologies. In
some cases there are examples where the combination of data from multiple sources produces an
unusual result. For example in some LGAs that report to have a very high rural land value, but
only a handful of properties, indicating an unusually high average property value. To limit the
effect of cases such as these, only LGA’s with at least 100 properties of a given property type are
included in the modelling.
• Potential misrepresentation of current fire services contributions by property owners – The
bundling of policies which could have residential policies included with commercial ones (as is a
typical practice for people using brokers to negotiate policies) could misrepresent the amount of
fire services contributions collected from the different property types. Note that in the case that
home and contents insurance for the same property are covered by separate policies the amount of
fire services contributions has been calculated to include both policies. This avoids understating
the amount of fire services contributions currently paid for by households.
Results
Deloitte: Property based funding options for the NSW Fire Services Levy 20
4 Results
This chapter presents the results of the modelling. For each scenario the results for ‘part A’ are
presented in aggregate form and by LGA. For parts B to E the results are presented in aggregate form
only. The results should be considered in light of the limitations raised in the previous chapter.
4.1 The base case
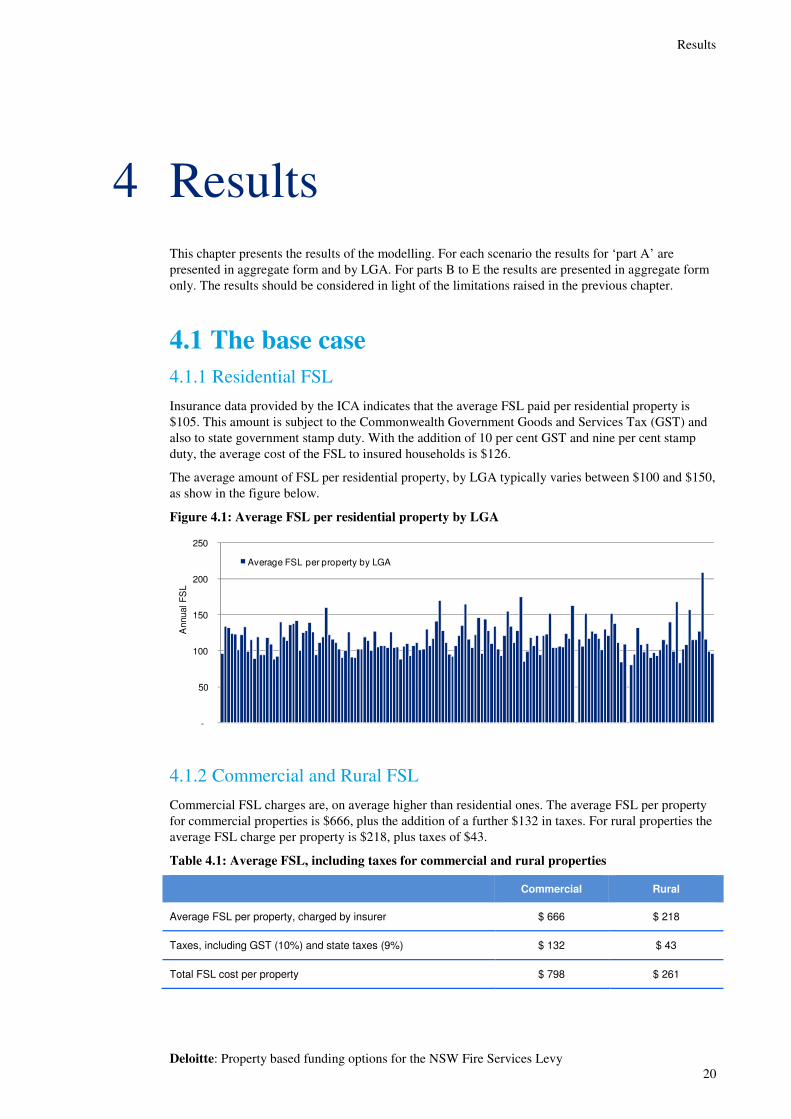
4.1.1 Residential FSL
Insurance data provided by the ICA indicates that the average FSL paid per residential property is
$105. This amount is subject to the Commonwealth Government Goods and Services Tax (GST) and
also to state government stamp duty. With the addition of 10 per cent GST and nine per cent stamp
duty, the average cost of the FSL to insured households is $126.
The average amount of FSL per residential property, by LGA typically varies between $100 and $150,
as show in the figure below.
Figure 4.1: Average FSL per residential property by LGA
4.1.2 Commercial and Rural FSL
Commercial FSL charges are, on average higher than residential ones. The average FSL per property
for commercial properties is $666, plus the addition of a further $132 in taxes. For rural properties the
average FSL charge per property is $218, plus taxes of $43.
Table 4.1: Average FSL, including taxes for commercial and rural properties
Commercial Rural
Average FSL per property, charged by insurer $ 666 $ 218
Taxes, including GST (10%) and state taxes (9%) $ 132 $ 43
Total FSL cost per property $ 798 $ 261
-
50
100
150
200
250
Annual F
SL
Average FSL per property by LGA

Results
Deloitte: Property based funding options for the NSW Fire Services Levy 21
4.2 Scenario 1 This section presents the results for Scenario 1. Scenario 1 involves replacing the insurance based
system with the application of a property based tax, based on land value and property type (residential,
commercial or rural), and applied evenly across NSW.
4.2.1 Part A results
Under Scenario 1- Part A $672 million is to be collected in the form of a property based tax, based on
land value and property type (residential, commercial or rural), and applied evenly across NSW. The
proportion to be collected from each property type and the resulting tax per $1000 land value is
outlined in the table below.
Table 4.2: Calculation of results
Residential Commercial Rural
Proportion of FSL contribution 45% 49% 6%
Amount of contribution required ($m) $ 303 $ 329 $ 40
Total state land value ($m) $ 693,652 $ 124,965 $ 111,935
Resulting rate per $1000 land value $ 0.44 $ 2.63 $ 0.36
Residential outcomes
Under this scenario there is a net saving to the average insured residential property in most LGAs
compared with what they currently pay in insurance based taxes. Overall, the average residential
property in 120 of the 148 LGAs, for which results could be obtained, have a net saving. The
distribution of outcomes for the average residential property in each LGA is shown in the figure
below.
Figure 4.2: Net saving for the average residential property, by LGA
On average, the average residential property in each LGA has a net saving of $41 per annum, although
this outcome varies between the LGAs.
The distribution of outcomes for the average residential property in each LGA, for NSW and the
Sydney metropolitan region, are shown in the figures below. The results highlight the impact that land
values have on the amount of FSL paid under this scenario. Although the average property has a net
saving for a majority of LGAs there are some LGAs, the impact tends to be greater for:
• Rural LGAs that are located inland, compared with those located by the coast
-350
-300
-250
-200
-150
-100
-50
-
50
100
150
Avera
ge a
nnual
savin
g
Average residential outcome by LGA

Results
Deloitte: Property based funding options for the NSW Fire Services Levy 22
• Sydney metropolitan LGAs that are located in the west of the Sydney metropolitan area, relative
to those in the north and the east.
Figure 4.3: Annual saving, residential properties, NSW, scenario 1a

Results
Deloitte: Property based funding options for the NSW Fire Services Levy 23
Figure 4.4: Annual saving, residential properties, Sydney, scenario 1a
Commercial outcomes
Overall, the average commercial property in 43 of the 113 LGAs, for which results could be obtained,
have a net saving. The distribution of outcomes for the average commercial property in each LGA is
shown in the figure below.
Figure 4.5: Net saving for the average commercial property, by LGA
On average, the average commercial property in each LGA incurs a net cost of $502 per annum,
although this outcome varies between the LGAs, reflecting the decision to continue to collect the same
proportion of FSL from commercial properties as is currently collected.
The distribution of outcomes is much more variable than for residential properties and a result was
obtained for fewer LGAs, however the geographic distribution is similar to residential properties, with
inland LGAs more likely to have a net saving compared to those in coastal areas, or near Sydney.
-6,000
-4,000
-2,000
-
2,000
4,000
6,000
Avera
ge a
nnual
savin
g
Average commercial outcome by LGA

Results
Deloitte: Property based funding options for the NSW Fire Services Levy 24
Figure 4.6: Annual saving, commercial properties, NSW, scenario 1a
Rural outcomes
Overall, the average rural property in 47 of the 112 LGAs, for which results could be obtained, have a
net saving. The distribution of outcomes for the average rural property in each LGA is shown in the
figure below.
Figure 4.7: Net saving for the average rural property, by LGA
On average, the average rural property in each LGA incurs a net cost of $219 per annum, although this
outcome varies between the LGAs, reflecting the decision to continue to collect the same proportion
of FSL from rural properties as is currently collected.
The distribution of outcomes for rural properties is similar to residential and commercial properties, in
that the average rural property in inland LGAs is more likely to have a net saving compared with the
average rural property in coastal LGAs. This is likely to be influenced by property values. Although
LGAs with fewer than 100 rural properties were excluded from the results, care should still be taken
-4,500
-4,000
-3,500
-3,000
-2,500
-2,000
-1,500
-1,000
-500
-
500
1,000
Avera
ge a
nnual
savin
g
Average rural outcome by LGA

Results
Deloitte: Property based funding options for the NSW Fire Services Levy 25
in interpreting the distribution of rural results because they typically had fewer observations with
which to estimate average outcomes per property.
Figure 4.8: Annual saving, rural properties, NSW, scenario 1a
4.2.2 Other results
For each iteration of Scenario 1, the distribution of the property based tax between the LGAs remains
the same. The key difference between Parts B, C, D and E of Scenario 1 compared to Part A is the
amount of revenue that needs to be raised from the property based tax.
• For Part B the property tax is used to recover the NSW State Government component of fire
services funding, in addition to insurance contributions
• For Part C the property tax is used to recover the NSW State Government and local government
components of fire services funding, in addition to insurance contributions.
Parts D and E incorporate a motor vehicle tax, to recover the estimated proportion of fire services
costs associated with responding to motor vehicle incidents. This amount is estimated to be 16.8 per
cent of the cost of fire services (see chapter 3).
• For Part D 16.8 per cent of the insurance contributions to fire services are transferred to a motor
vehicle tax, with the remaining proportion recovered through a property based tax
• For Part E 16.8 per cent of all contributions to fire services from insurance, NSW State
Government and local governments are transferred to a motor vehicle tax, with the remaining
proportion recovered through a property based tax.
Required revenue
The figure below shows the amount of revenue that would need to be collected from a property based
tax, for each part of Scenario 1. If the tax were used to fund all of the contributions to fires services in
NSW (Part C), then $911.7 million would need to be raised – 36 per cent more than is currently
collected from insurance contributions. If insurance contributions were replaced by a property based
tax, with a motor vehicle tax (Part D), $558.8 million would need to be collected from property taxes,
17 per cent less than is currently collected. A property based tax to replace all existing contributions to

Results
Deloitte: Property based funding options for the NSW Fire Services Levy 26
fire services from insurance, NSW State Government and local governments, with a motor vehicle tax
would be roughly equivalent to the amount currently collected from insurance.
Figure 4.9 Revenue required from a property based tax, by part
Property tax rates
Based on the revenue requirements outlined above a property based tax rate for residential,
commercial and rural properties has been calculated for each part of Scenario 1. Consistent with the
methodology outlined in the previous chapter the overall proportion of revenue collected from each
property type has been held constant. The rates are shown in the table below.
Table 4.3: Estimated rates of property tax per $1000 of rateable land, Scenario 1
In
su
ran
ce
Sta
te G
ov.
Lo
cal G
ov.
Mo
tor
veh
icle
Estimated rate of tax per $1000 of rateable land
Part Residential
Commercial
Rural
a ���� - - - $ 0.44 $ 2.63 $ 0.36
b ���� ���� - - $ 0.52 $ 3.15 $ 0.43
c ���� ���� ���� - $ 0.59 $ 3.57 $ 0.48
d ���� - - ���� $ 0.36 $ 2.19 $ 0.30
e ���� ���� - ���� $ 0.44 $ 2.62 $ 0.35
Effect on the average property, by LGA
The results for residential properties for Scenario 1 are shown in the table below. Like Part A, the
other parts of Scenario 1 show that the average residential property has a net saving in a majority of
LGAs. The average amount that the average property saves varies with the total amount of revenue to
be raised from the property based tax.
As the table above shows, residential results are almost the same for Part A, as they are for Part E.
This is because the inclusion of an additional $25 annual tax on all motor vehicles in NSW is roughly
equivalent to the current NSW State Government contribution, meaning that households would
experience roughly the same outcomes as for Part A.
$672.0
$805.1 $911.7
$558.8 $669.5
$-
$200.0
$400.0
$600.0
$800.0
$1,000.0
a b c d e
Revenue r
eq
uired
$ m
illio
ns
Scenario 1: Part

Results
Deloitte: Property based funding options for the NSW Fire Services Levy 27
Table 4.4: Outcomes for residential properties, Scenario 1
Part In
su
ran
ce
Sta
te G
ov.
Lo
cal G
ov.
Mo
tor
veh
icle
Number of LGAs where
average property has a
net saving
Number of LGAs where
average property has a
net cost
Per cent of LGAs where the average
property has a net saving
Average net saving for the
average property
a ���� - - - 120 28 81% $ 41
b ���� ���� - - 112 36 76% $ 26
c ���� ���� ���� - 103 45 70% $ 14
d ���� - - ���� 129 19 87% $ 54
e ���� ���� - ���� 120 28 81% $ 42
The outcomes for residential and rural properties under Scenario 1 are generally negative, reflecting
the decision to continue to collect the same proportion of FSL from rural properties as is currently
collected.
Table 4.5: Outcomes for commercial and rural, Scenario 1
Part In
su
ran
ce
Sta
te G
ov.
Lo
cal G
ov.
Mo
tor
veh
icle
Commercial Rural
Per cent of LGAs where the average property has a net saving
Average amount that the average
property has a net cost
Per cent of LGAs where the average
property has a net saving
Average amount that the average property has a
net cost
a ���� - - - 38% - $ 502 42% - $ 219
b ���� ���� - - 35% - $ 748 34% - $ 310
c ���� ���� ���� - 34% - $ 945 27% - $ 387
d ���� - - ���� 42% - $ 293 52% - $ 142
e ���� ���� - ���� 38% - $ 498 43% - $ 217
4.3 Scenario 2 This section presents the results for Scenario 2. Scenario 2 involves replacing the insurance based
system with the application of a property based tax, based on land value and property type, but
varying across NSW so that LGAs will continue to contribute the same proportion of FSL funding as
they did in 2009-10. To maintain these proportions the rate of FSL per $1000 of rateable land for
commercial properties is kept at approximately 6 times the rate for residential land. The rate of FSL
per $1000 of rateable land for rural properties is kept at approximately 80 percent of the rate for
residential land. These rates are then adjusted for each LGA to match the proportion of revenue
required from the LGA.
The two main factors influencing the average impact on properties in each LGA is therefore:
• The proportion of FSL currently being contributed by that LGA
• The value of properties in those LGAs
The proportion of FSL currently contributed, by each local government is shown in Appendix A.
There are several local governments that do not make a contribution to fire services. Deloitte and the

Results
Deloitte: Property based funding options for the NSW Fire Services Levy 28
ICA understand that often these local governments have an agreement with a neighbouring local
government to contribute to that LGA’s share of FSL. In Scenario 2, properties in LGAs that do not
contribute directly to fire services have been excluded from the results, so as not to inflate the cost
savings.
4.3.1 Part A results
Residential outcomes
Under this scenario there is a net saving to the average insured residential property in most LGAs
compared with what they currently pay in insurance based taxes. Overall, the average residential
property in 111 of the 144 LGAs, for which results could be obtained (there are 152 LGAs), has a net
saving. The distribution of outcomes for the average residential property in each LGA is shown in the
figure below.
Figure 4.10: Net saving for the average residential property, by LGA
On average, the average residential property in each LGA has a net saving of $33 per annum, although
this outcome varies between the LGAs.
The distribution of outcomes for the average residential property in each LGA, for NSW and the
Sydney metropolitan region, are shown in the figures below. The distribution of results is different to
Scenario 1a, in that there is not a noticeable difference in the outcomes for inland and coastal LGAs.
In this sense it is clear that the proportion of FSL has an impact on the results for Scenario 2.
Although the average property has a net saving in the majority of LGAs, noticeably, outcomes for the
average property in rural LGAs are better than for those in the Sydney metropolitan region. Outcomes
within the Sydney metropolitan region are similar to Scenario 1, in that they are typically better for
western suburbs LGAs than LGAs in other parts of Sydney.
-500
-400
-300
-200
-100
-
100
200
Avera
ge a
nnual
savin
g
Average residential outcome by LGA

Results
Deloitte: Property based funding options for the NSW Fire Services Levy 29
Figure 4.11: Annual saving, residential properties, NSW, scenario 2a
Figure 4.12: Annual saving, residential properties, Sydney, scenario 2a

Results
Deloitte: Property based funding options for the NSW Fire Services Levy 30
Commercial outcomes
Overall, the average commercial property in 57 of the 113 LGAs, for which results could be obtained,
has a net saving. The distribution of outcomes for the average commercial property in each LGA is
shown in the figure below.
Figure 4.13: Net saving for the average commercial property, by LGA
On average, the average commercial property in each LGA incurs a net cost of $479 per annum,
although this outcome varies between the LGAs, reflecting the decision to continue to collect the same
proportion of FSL from commercial properties as is currently collected.
The distribution of outcomes is much more variable than for residential properties and a result was
obtained for fewer LGAs, however the geographic distribution is similar to residential properties,
although there are a larger number of LGAs in and around the Sydney region with higher net cost
outcomes.
Figure 4.14: Annual saving, commercial properties, NSW, scenario 2a
-8,000
-6,000
-4,000
-2,000
-
2,000
4,000
6,000
Avera
ge a
nnual
savin
g
Average commercial outcome by LGA

Results
Deloitte: Property based funding options for the NSW Fire Services Levy 31
Rural outcomes
Overall, the average rural property in 57 of the 109 LGAs, for which results could be obtained, has a
net saving. The distribution of outcomes for the average rural property in each LGA is shown in the
figure below.
Figure 4.15: Net saving for the average rural property, by LGA
On average, the average rural property in each LGA incurs a net cost of $147 per annum, although this
outcome varies between the LGAs, reflecting the decision to continue to collect the same proportion
of FSL from rural properties as is currently collected.
It is hard to discern a relationship from the distribution of outcomes for rural properties. There are
large number of LGAs where the average properties show a significant increase or decrease in the
amount of FSL paid, that is, more than $100 net saving, or more than $100 net cost. It is clear that the
proportion of FSL paid by rural LGAs is influencing the result; however care should still be taken in
interpreting the distribution of rural results because they typically had fewer observations with which
to estimate average outcomes per property.
-2,500
-2,000
-1,500
-1,000
-500
-
500
Avera
ge a
nnual
savin
g
Average rural outcome by LGA

Results
Deloitte: Property based funding options for the NSW Fire Services Levy 32
Figure 4.16: Annual saving, rural properties, NSW, scenario 2a
4.3.2 Other results
For each iteration of Scenario 2, the distribution of the property based tax between the LGAs remains
the same. The key difference between Parts B, C, D and E of Scenario 2 compared to Part A is the
amount of revenue that needs to be raised from the property based tax.
Effect on the average property, by LGA
The results for residential properties for Scenario 2 are shown in the table below. Like Part A, the
other parts of Scenario 2 show that that the average residential property has a net saving in a majority
of LGAs. The average amount that the average property saves varies with the total amount of revenue
to be raised from the property based tax.
Figure 4.17: Outcomes for residential properties, Scenario 2
Part In
su
ran
ce
Sta
te G
ov.
Lo
cal G
ov.
Mo
tor
veh
icle
Number of LGAs where
average property has a
net saving
Number of LGAs where
average property has a
net cost
Per cent of LGAs where the average
property has a net saving
Average net saving for the
average property
a ���� - - - 111 33 77% $ 33
b ���� ���� - - 106 38 74% $ 16
c ���� ���� ���� - 103 41 72% $ 3
d ���� - - ���� 118 26 82% $ 47
e ���� ���� - ���� 111 33 77% $ 33

Results
Deloitte: Property based funding options for the NSW Fire Services Levy 33
The outcomes for residential and rural properties under Scenario 2 are generally negative, reflecting
the decision to continue to collect the same proportion of FSL from rural properties as is currently
collected.
Figure 4.18: Outcomes for commercial and rural, Scenario 2
Part In
su
ran
ce
Sta
te G
ov.
Lo
cal G
ov.
Mo
tor
veh
icle
Commercial Rural
Per cent of LGAs where the average property has a net
saving
Net saving for the
average property
Per cent of LGAs where the average property has a net
saving
Net saving for the
average property
a ���� - - - 50% -$ 479 52% -$ 147
b ���� ���� - - 46% -$ 720 47% -$ 224
c ���� ���� ���� - 46% -$ 931 41% -$ 285
d ���� - - ���� 53% -$ 274 66% -$ 88
e ���� ���� - ���� 50% -$4 74 53% -$ 146
4.4 Scenario 3 This section presents the results for Scenario 3. Scenario 3 involves replacing the insurance based
system with the application of a property based tax, based on the fire risk in each LGA, where fire risk
is measured by the number of fires in 2009-10. Like Scenario 2, the proportion of fire contributions
currently collected from residential, commercial and rural properties is held constant. To maintain
these proportions the rate of FSL per $1000 of rateable land for commercial properties is kept at
approximately 6 times the rate for residential land. The rate of FSL per $1000 of rateable land for
rural properties is kept at approximately 80 percent of the rate for residential land. These rates are then
adjusted for each LGA to match the proportion of revenue required from the LGA.
The two main factors influencing the average impact on properties in each LGA is therefore:
• The proportion of fires NSW fires that occurred in the LGA
• The value of properties in those LGAs
The number of fires in each LGA for 2009-10 is shown in Appendix A.
4.4.1 Part A results
Residential outcomes
Under this scenario there is a net saving to the average insured residential property in most LGAs
compared with what they currently pay in insurance based taxes. Overall, the average residential
property in 116 of the 147 LGAs, for which results could be obtained, has a net saving. The
distribution of outcomes for the average residential property in each LGA is shown in the figure
below.
Results
Deloitte: Property based funding options for the NSW Fire Services Levy 34
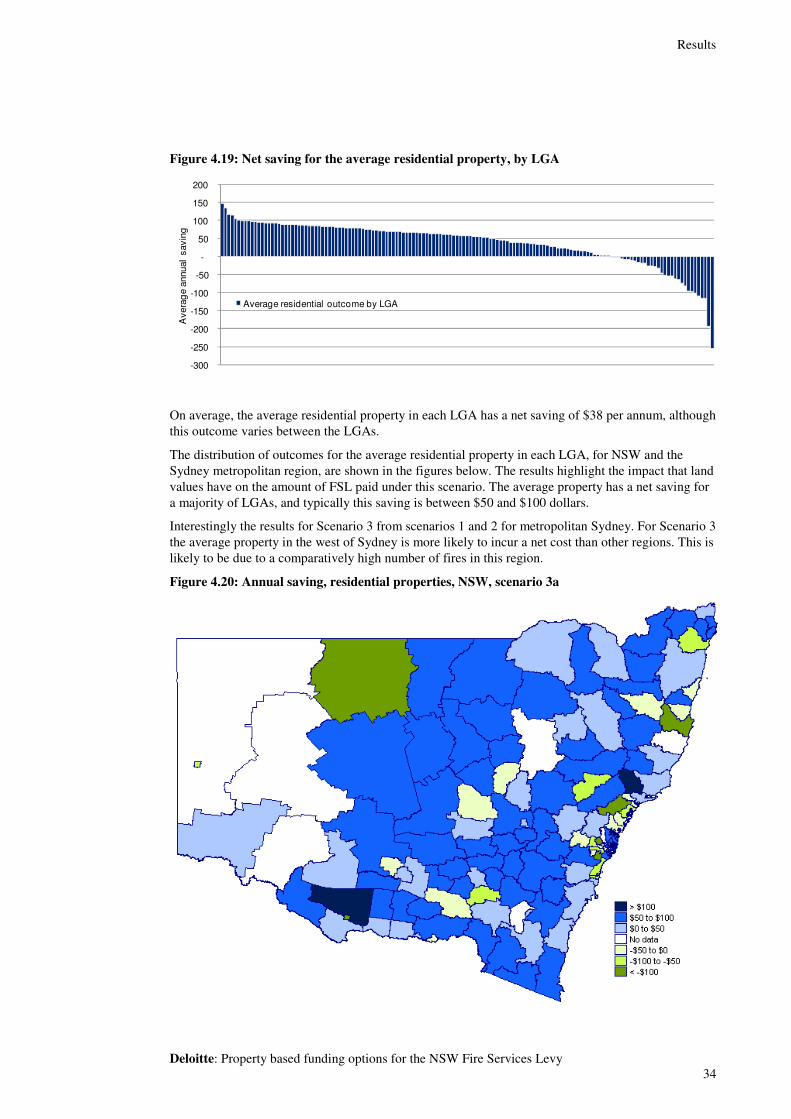
Figure 4.19: Net saving for the average residential property, by LGA
On average, the average residential property in each LGA has a net saving of $38 per annum, although
this outcome varies between the LGAs.
The distribution of outcomes for the average residential property in each LGA, for NSW and the
Sydney metropolitan region, are shown in the figures below. The results highlight the impact that land
values have on the amount of FSL paid under this scenario. The average property has a net saving for
a majority of LGAs, and typically this saving is between $50 and $100 dollars.
Interestingly the results for Scenario 3 from scenarios 1 and 2 for metropolitan Sydney. For Scenario 3
the average property in the west of Sydney is more likely to incur a net cost than other regions. This is
likely to be due to a comparatively high number of fires in this region.
Figure 4.20: Annual saving, residential properties, NSW, scenario 3a
-300
-250
-200
-150
-100
-50
-
50
100
150
200 A
vera
ge a
nnual
savin
g
Average residential outcome by LGA

Results
Deloitte: Property based funding options for the NSW Fire Services Levy 35
Figure 4.21: Annual saving, residential properties, Sydney, scenario 3a
Commercial outcomes
Overall, the average commercial property in 34 of the 113 LGAs, for which results could be obtained,
has a net saving. The distribution of outcomes for the average commercial property in each LGA is
shown in the figure below.
Figure 4.22 Net saving for the average commercial property, by LGA
On average, the average commercial property in each LGA incurs a net cost of $591 per annum,
although this outcome varies between the LGAs, reflecting the decision to continue to collect the same
proportion of FSL from commercial properties as is currently collected.
The distribution of outcomes is much more variable than for residential properties and a result was
obtained for fewer LGAs. It is difficult to identify a pattern in the results, although, like Scenario 2,
LGAs close to Sydney generally show high net cost outcomes for the average commercial property.
-8,000
-6,000
-4,000
-2,000
-
2,000
4,000
6,000
Avera
ge a
nnual
savin
g
Average commercial outcome by LGA

Results
Deloitte: Property based funding options for the NSW Fire Services Levy 36
Figure 4.23: Annual saving, commercial properties, NSW, scenario 3a
Rural outcomes
Overall, the average rural property in 22 of the 112 LGAs, for which results could be obtained, have
net saving. The distribution of outcomes for the average rural property in each LGA is shown in the
figure below.
Figure 4.24 Net saving for the average rural property, by LGA
On average, the average rural property in each LGA incurs a net cost of $676 per annum. This
outcome is skewed somewhat by several LGAs, where the average rural property has large negative
outcomes. In these LGAs it is possible that the outcome for average property is not a good
representation of the outcome for most properties. See Section 3.6 for more discussion on the
limitation of the model.
The figure below clearly shows that a greater number of rural LGAs incur a net cost than for Scenario
1 or 2. Although LGAs with fewer than 100 rural properties were excluded from the results, care
-5,000
-4,000
-3,000
-2,000
-1,000
-
1,000
Avera
ge a
nnual
savin
g
Average rural outcome by LGA

Results
Deloitte: Property based funding options for the NSW Fire Services Levy 37
should still be taken in interpreting the distribution of rural results because they typically had fewer
observations with which to estimate average outcomes per property.
It is also worth considering that the data collected from FRNSW to develop this scenario does not
indicate what type of land the fire occurred on. It may not be appropriate, for instance, to recover all
of the fire services costs from rural property owners if a majority of fires were occurring on public
land, such as national parks.
Figure 4.25 Annual saving, rural properties, NSW, scenario 3a
4.4.2 Other results
Effect on the average property, by LGA
The results for residential properties for Scenario 3 are shown in the table below. Like Part A, the
other parts of Scenario 3 show that that the average residential property has a net saving in a majority
of LGAs. The average amount that the average property saves varies with the total amount of revenue
to be raised from the property based tax.
Figure 4.26: Outcomes for residential properties, Scenario 3
Part In
su
ran
ce
Sta
te G
ov.
Lo
cal G
ov.
Mo
tor
veh
icle
Number of LGAs where
average property has a
net saving
Number of LGAs where
average property has a
net cost
Per cent of LGAs where the average
property has a net saving
Average net saving for the
average property
a ���� - - - 116 31 79% $ 38
b ���� ���� - - 108 39 73% $ 22
c ���� ���� ���� - 94 53 64% $ 9

Results
Deloitte: Property based funding options for the NSW Fire Services Levy 38
Part In
su
ran
ce
Sta
te G
ov.
Lo
cal G
ov.
Mo
tor
veh
icle
Number of LGAs where
average property has a
net saving
Number of LGAs where
average property has a
net cost
Per cent of LGAs where the average
property has a net saving
Average net saving for the
average property
d ���� - - ���� 127 20 86% $ 51
e ���� ���� - ���� 116 31 79% $ 38
The outcomes for residential and rural properties under Scenario 3 are generally negative, reflecting
the decision to continue to collect the same proportion of FSL from rural properties as is currently
collected.
Figure 4.27: Outcomes for commercial and rural, Scenario 3
Part In
su
ran
ce
Sta
te G
ov.
Lo
cal G
ov.
Mo
tor
veh
icle
Commercial Rural
Per cent of LGAs where the
average property has a net saving
Net saving for the average
property
Per cent of LGAs where the
average property has a net saving
Net saving for the average
property
a ���� - - - 30% -$ 591 20% -$ 476
b ���� ���� - - 27% -$ 854 15% -$ 857
c ���� ���� ���� - 25% -$ 1,065 13% -$ 1,002
d ���� - - ���� 37% -$ 367 23% -$ 522
e ���� ���� - ���� 30% -$ 586 20% -$ 673
Conclusions
Deloitte: Property based funding options for the NSW Fire Services Levy 39
5 Conclusions
This report has estimated the distributional impacts on owners of residential, commercial and rural
properties for a switch from an insurance based model of fire services funding to one using a property
based charge. The report has considered three broad approaches to estimating the determining the
amount of the property based charge:
• Scenario 1 – flat rate: This scenario involves replacing the insurance based system with the
application of a property based tax, based on land value and property type (residential,
commercial or rural), applied evenly across NSW
• Scenario 2 – service level: This scenario also involves replacing the insurance based system with
the application of a property based tax, based on land value and property type, but varying across
NSW so that LGAs continue to contribute the same proportion of FSL funding as they did in
2009-10. LGAs contribute a fixed proportion of fire services funding. Basing the rates on
property on the amount contributed by the LGAs is intended to reflect the cost of providing fire
services in each LGA as well as the level of service provision
• Scenario 3 – fire risk: This scenario also involves replacing the insurance based system with the
application of a property based tax, based on land value and property type, but varying across
NSW so that properties contribute based on the fire risk of their LGA, estimated from fire
incidence data provided by FRNSW.
For each scenario the ICA has asked Deloitte to model several iterations, varying the proportion of
fire services to be funded through a property based tax and allowing for the inclusion of a motor
vehicle tax.
Taking into account the assumptions made about the share of fire services funding to be collected
from residential, commercial and rural property owners, all scenarios suggest that, on average there
would be a saving to the average residential property in LGAs across NSW. The magnitude of that
saving is dependent on the amount of revenue to be collected from a property based tax. Where a
property based tax is used to collect the NSW State Government or local government’s proportion of
fire services funding, in addition to the insurance contributions, the average savings are smaller.
By contrast the model shows that, the average commercial and rural property owner incurs a net cost
under the scenarios modelled. This is partly a function of the decision on what proportion of revenue
to collect from each of the three property types. It should also be noted that, while the model can
estimate the impact on the average property in each LGA, there is significantly more variation in the
value of commercial and rural properties and the outcome for the average property in each LGA may
not provide a good indication of the outcome for most properties.
Uninsured property owners, whether residential, commercial or rural, increase their direct contribution
to fire services under any of the scenarios modelled. This is because they feel the full effect of
increased rates without any offsetting reduction in insurance premiums. However, the increased
contribution of uninsured property owners is less than the decreased contribution of insured property
owners. These insured property owners are currently charged GST and stamp duty on the FSL levied
by insurance companies. Therefore, not only would insured property owners receive savings due to
forgone FSL, they would also receive saving due to foregone GST and stamp duty.
Although the model has been able to provide a general indication of the distributional impacts on the
average property, by property type in each LGA there is considerable variation in property values
within LGAs that has not been captured by this model. Without more detailed modelling it is
premature to favour any one of the three scenarios over the others, as they all each have advantages
and disadvantages in terms of equity and efficiency.
Conclusions
Deloitte: Property based funding options for the NSW Fire Services Levy 40
To further increase understanding of the distributional impacts of replacing insurance based fire
services funding with a property based tax it is recommended that individual property data be obtained
from insurers and the NSW Valuer General and a more detailed modelling exercise of the
distributional impacts on a per-property basis be conducted.
As well as providing a more detailed understanding of the distributional impacts, this type of
modelling would allow for the development of more detailed scenarios. This may include the use of
price caps and floors, fixed and variable components of the property and motor vehicle charges, or any
number of other strategies that might be used to mitigate perceived inequities created under the
scenarios modelled.

Appendix A - data
Deloitte: Property based funding options for the NSW Fire Services Levy 41
jd|H:\ESA\CLIENTS\ICA\FSL - NSW\4 - ARCHIVED DRAFTS\ICA FINAL REPORT 07-06-11.DOCX
Appendix A - data
A1: Treatment of land zoning in modelling
ZONE MEANING
ZONE
REFERENCE
Included as
rateable
land?
Refined
property type Value
Residential A Yes Residential 597,655,202,313
Business B Yes Commercial 34,184,065,513
Neighbourhood Centre B1 No -
Local Centre B2 No -
Commercial Core B3 Yes Commercial 1,973,496,610
Mixed Use B4 Yes Commercial 3,053,551,853
Business Development B5 Yes Commercial 191,411,750
Enterprise Corridor B6 Yes Commercial 779,934,680
Business Park B7 Yes Commercial 879,926,750
Sydney Commercial / Business C Yes Commercial 12,519,296,430
Mixed Use Development D Yes Commercial 234,462,200
Employment E Yes Commercial 2,572,050,920
National Parks & Nature Reserves E1 No -
Environmental Conservation E2 No -
Environmental Management E3 No -
Environmental Living E4 No -
Industrial I Yes Commercial 33,000,817,000
General Industrial IN1 Yes Commercial 2,750,663,656
Light Industrial IN2 Yes Commercial 1,493,289,620
Heavy Industrial IN3 Yes Commercial 1,203,623,642
Working Waterfront IN4 Yes Commercial 28,250,000
Mixed Residential/Business M Yes Commercial 10,192,530,137
National Parks N No -
Open Space O No -
Protection P No -

Appendix A - data
Deloitte: Property based funding options for the NSW Fire Services Levy 42
jd|H:\ESA\CLIENTS\ICA\FSL - NSW\4 - ARCHIVED DRAFTS\ICA FINAL REPORT 07-06-11.DOCX
ZONE MEANING
ZONE
REFERENCE
Included as
rateable
land?
Refined
property type Value
Non Urban R Yes Rural 99,841,137,990
General Residential R1 Yes Residential 10,585,506,294
Low Density Residential R2 Yes Residential 61,271,299,547
Medium Density Residential R3 Yes Residential 8,115,667,240
High Density Residential R4 Yes Residential 4,069,719,070
Large Lot Residential R5 Yes Residential 2,710,017,220
Public Recreation RE1 No -
Private Recreation RE2 No -
Primary Production RU1 Yes Rural 6,361,501,391
Rural Landscape RU2 Yes Rural 2,339,232,830
Forestry RU3 Yes Rural 19,839,260
Rural Small Holdings RU4 Yes Rural 2,940,606,400
Village RU5 Yes Rural 405,551,561
Transition RU6 Yes Rural 26,768,400
Special Uses S Yes Commercial 16,507,616,918
Special Activities SP1 Yes Commercial 933,633,523
Infrastructure SP2 Yes Commercial 1,620,403,673
Tourist SP3 Yes Commercial 137,995,370
North Sydney Commercial / Business T Yes Commercial 708,146,642
Community Uses U No -
Comprehensive Centre V No -
Reserve Open Space W No -
Natural Waterways W1 No -
Recreational Waterways W2 No -
Working Waterways W3 No -
Reserved Roads X No -
Reserved Special Uses Y No -
Undetermined, or Village Z Yes Residential 9,244,163,975

Appendix A - data
Deloitte: Property based funding options for the NSW Fire Services Levy 43
jd|H:\ESA\CLIENTS\ICA\FSL - NSW\4 - ARCHIVED DRAFTS\ICA FINAL REPORT 07-06-11.DOCX
A2: Contribution of NSW LGAs to fire services 2009-10
LGA name Total FSL contributed in 2009-10
Share of FSL contributed in 2009-10
Albury $371,759 0.58%
Armidale Dumaresq $107,839 0.17%
Ashfield $451,709 0.71%
Auburn $643,108 1.01%
Ballina $46,085 0.07%
Balranald $12,058 0.02%
Bankstown $1,781,869 2.79%
Bathurst Regional $185,616 0.29%
Bega Valley $59,830 0.09%
Bellingen $41,119 0.06%
Berrigan $42,407 0.07%
Blacktown $1,770,763 2.77%
Bland $17,604 0.03%
Blayney $16,203 0.03%
Blue Mountains $622,896 0.97%
Bogan $16,391 0.03%
Bombala $19,766 0.03%
Boorowa $15,138 0.02%
Botany Bay $520,238 0.81%
Bourke $27,438 0.04%
Brewarrina $11,562 0.02%
Broken Hill $366,130 0.57%
Burwood $411,969 0.64%
Byron $70,845 0.11%
Cabonne $31,914 0.05%
Camden $321,331 0.50%
Campbelltown $954,330 1.49%
Canada Bay $1,171,404 1.83%
Canterbury $1,206,199 1.89%
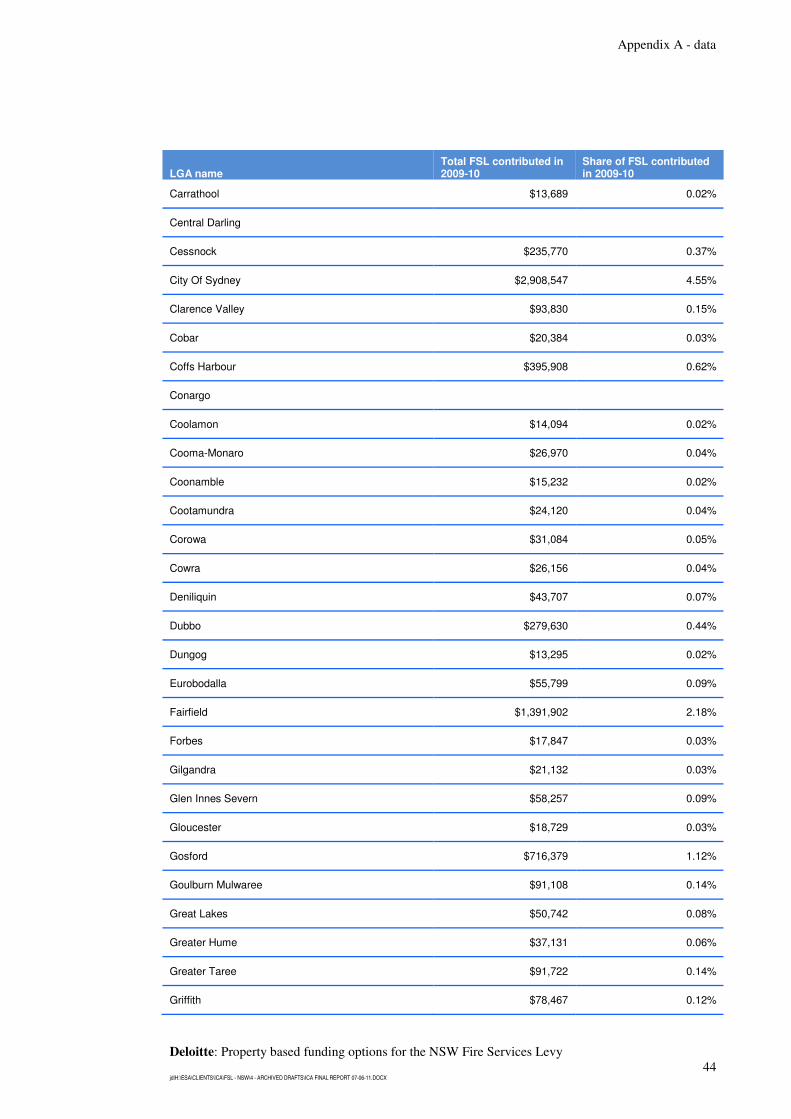
Appendix A - data
Deloitte: Property based funding options for the NSW Fire Services Levy 44
jd|H:\ESA\CLIENTS\ICA\FSL - NSW\4 - ARCHIVED DRAFTS\ICA FINAL REPORT 07-06-11.DOCX
LGA name Total FSL contributed in 2009-10
Share of FSL contributed in 2009-10
Carrathool $13,689 0.02%
Central Darling
Cessnock $235,770 0.37%
City Of Sydney $2,908,547 4.55%
Clarence Valley $93,830 0.15%
Cobar $20,384 0.03%
Coffs Harbour $395,908 0.62%
Conargo
Coolamon $14,094 0.02%
Cooma-Monaro $26,970 0.04%
Coonamble $15,232 0.02%
Cootamundra $24,120 0.04%
Corowa $31,084 0.05%
Cowra $26,156 0.04%
Deniliquin $43,707 0.07%
Dubbo $279,630 0.44%
Dungog $13,295 0.02%
Eurobodalla $55,799 0.09%
Fairfield $1,391,902 2.18%
Forbes $17,847 0.03%
Gilgandra $21,132 0.03%
Glen Innes Severn $58,257 0.09%
Gloucester $18,729 0.03%
Gosford $716,379 1.12%
Goulburn Mulwaree $91,108 0.14%
Great Lakes $50,742 0.08%
Greater Hume $37,131 0.06%
Greater Taree $91,722 0.14%
Griffith $78,467 0.12%

Appendix A - data
Deloitte: Property based funding options for the NSW Fire Services Levy 45
jd|H:\ESA\CLIENTS\ICA\FSL - NSW\4 - ARCHIVED DRAFTS\ICA FINAL REPORT 07-06-11.DOCX
LGA name Total FSL contributed in 2009-10
Share of FSL contributed in 2009-10
Gundagai $22,259 0.03%
Gunnedah $22,289 0.03%
Guyra $11,022 0.02%
Gwydir $24,411 0.04%
Harden $14,525 0.02%
Hawkesbury $126,605 0.20%
Hay $20,409 0.03%
Holroyd $870,328 1.36%
Hornsby $1,660,399 2.60%
Hunters Hill $352,512 0.55%
Hurstville $978,041 1.53%
Inverell $67,123 0.11%
Jerilderie $15,720 0.02%
Junee $17,061 0.03%
Kempsey $72,764 0.11%
Kiama $29,985 0.05%
Kogarah $832,039 1.30%
Ku-Ring-Gai $1,930,547 3.02%
Kyogle $16,726 0.03%
Lachlan $27,573 0.04%
Lake Macquarie $1,683,297 2.63%
Lane Cove $633,715 0.99%
Leeton $25,234 0.04%
Leichhardt $872,015 1.36%
Lismore $263,997 0.41%
Lithgow $111,601 0.17%
Liverpool $1,352,498 2.12%
Liverpool Plains $28,959 0.05%
Lockhart $14,441 0.02%
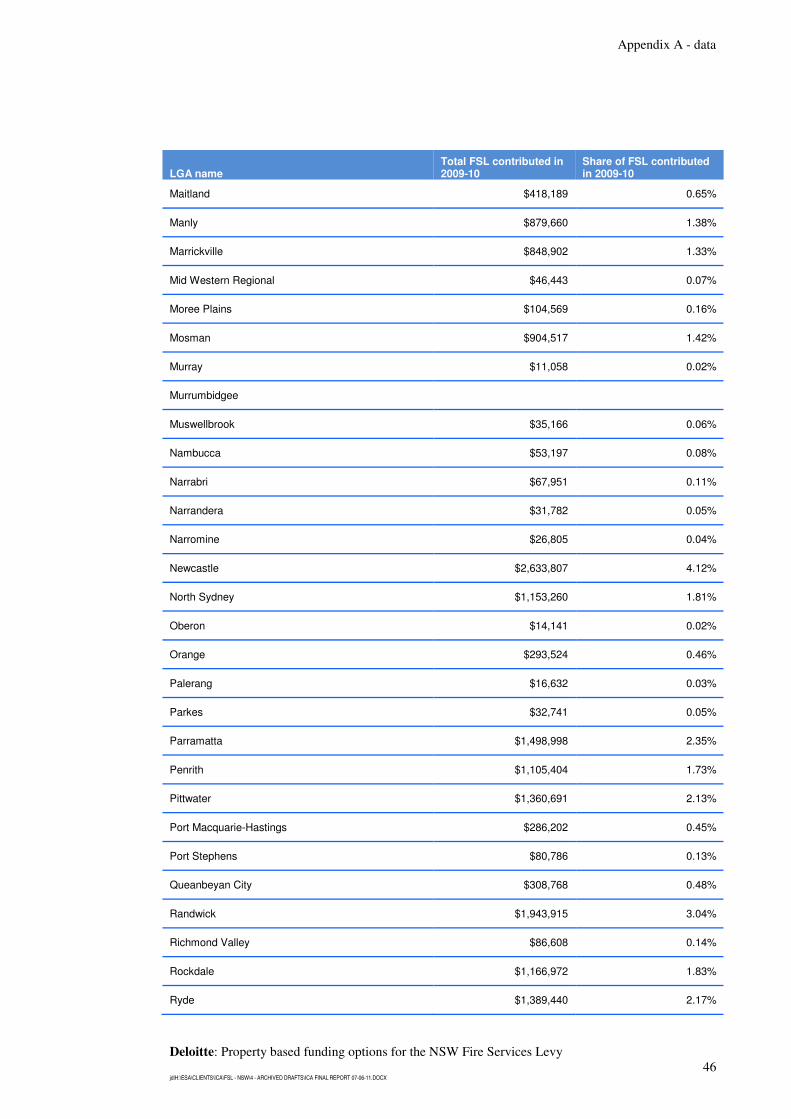
Appendix A - data
Deloitte: Property based funding options for the NSW Fire Services Levy 46
jd|H:\ESA\CLIENTS\ICA\FSL - NSW\4 - ARCHIVED DRAFTS\ICA FINAL REPORT 07-06-11.DOCX
LGA name Total FSL contributed in 2009-10
Share of FSL contributed in 2009-10
Maitland $418,189 0.65%
Manly $879,660 1.38%
Marrickville $848,902 1.33%
Mid Western Regional $46,443 0.07%
Moree Plains $104,569 0.16%
Mosman $904,517 1.42%
Murray $11,058 0.02%
Murrumbidgee
Muswellbrook $35,166 0.06%
Nambucca $53,197 0.08%
Narrabri $67,951 0.11%
Narrandera $31,782 0.05%
Narromine $26,805 0.04%
Newcastle $2,633,807 4.12%
North Sydney $1,153,260 1.81%
Oberon $14,141 0.02%
Orange $293,524 0.46%
Palerang $16,632 0.03%
Parkes $32,741 0.05%
Parramatta $1,498,998 2.35%
Penrith $1,105,404 1.73%
Pittwater $1,360,691 2.13%
Port Macquarie-Hastings $286,202 0.45%
Port Stephens $80,786 0.13%
Queanbeyan City $308,768 0.48%
Randwick $1,943,915 3.04%
Richmond Valley $86,608 0.14%
Rockdale $1,166,972 1.83%
Ryde $1,389,440 2.17%

Appendix A - data
Deloitte: Property based funding options for the NSW Fire Services Levy 47
jd|H:\ESA\CLIENTS\ICA\FSL - NSW\4 - ARCHIVED DRAFTS\ICA FINAL REPORT 07-06-11.DOCX
LGA name Total FSL contributed in 2009-10
Share of FSL contributed in 2009-10
Shellharbour $320,011 0.50%
Shoalhaven $205,015 0.32%
Singleton $50,371 0.08%
Snowy River $18,153 0.03%
Strathfield $490,493 0.77%
Sutherland $2,797,422 4.38%
Tamworth Regional $231,105 0.36%
Temora $28,505 0.04%
Tenterfield $21,099 0.03%
The Hills Shire $1,578,564 2.47%
Tumbarumba $14,709 0.02%
Tumut $30,443 0.05%
Tweed $326,652 0.51%
Upper Hunter $57,016 0.09%
Upper Lachlan $25,355 0.04%
Uralla $16,412 0.03%
Urana
Wagga Wagga $383,906 0.60%
Wakool $13,746 0.02%
Walcha $11,521 0.02%
Walgett $34,024 0.05%
Warren $17,255 0.03%
Warringah $1,977,846 3.10%
Warrumbungle $38,494 0.06%
Waverley $1,213,974 1.90%
Weddin $20,728 0.03%
Wellington $23,609 0.04%
Wentworth $19,330 0.03%
Willoughby $1,205,660 1.89%

Appendix A - data
Deloitte: Property based funding options for the NSW Fire Services Levy 48
jd|H:\ESA\CLIENTS\ICA\FSL - NSW\4 - ARCHIVED DRAFTS\ICA FINAL REPORT 07-06-11.DOCX
LGA name Total FSL contributed in 2009-10
Share of FSL contributed in 2009-10
Wingecarribee $104,637 0.16%
Wollondilly $40,456 0.06%
Wollongong $2,391,123 3.74%
Woollahra $2,053,452 3.21%
Wyong $1,083,081 1.70%
Yass Valley $34,007 0.05%
Young $28,106 0.04%
A3: Distributions of fires, by LGA 2009-10
LGA Name Fires in 2009-10 Share of fires
Albury 264 0.85%
Armidale Dumaresq 206 0.67%
Ashfield 97 0.31%
Auburn 282 0.91%
Ballina 85 0.27%
Balranald 6 0.02%
Bankstown 826 2.67%
Bathurst Regional 179 0.58%
Bega Valley 77 0.25%
Bellingen 36 0.12%
Berrigan 32 0.10%
Blacktown 2,488 8.04%
Bland 19 0.06%
Blayney 13 0.04%
Blue Mountains 309 1.00%
Bogan 19 0.06%
Bombala 7 0.02%
Boorowa 10 0.03%
Botany Bay 160 0.52%
Bourke 162 0.52%

Appendix A - data
Deloitte: Property based funding options for the NSW Fire Services Levy 49
jd|H:\ESA\CLIENTS\ICA\FSL - NSW\4 - ARCHIVED DRAFTS\ICA FINAL REPORT 07-06-11.DOCX
LGA Name Fires in 2009-10 Share of fires
Brewarrina 97 0.31%
Broken Hill 97 0.31%
Burwood 91 0.29%
Byron 119 0.38%
Cabonne 25 0.08%
Camden 223 0.72%
Campbelltown 1,727 5.58%
Canada Bay 115 0.37%
Canterbury 430 1.39%
Carrathool 9 0.03%
Central Darling - 0.00%
Cessnock 515 1.67%
City Of Sydney 887 2.87%
Clarence Valley 182 0.59%
Cobar 12 0.04%
Coffs Harbour 406 1.31%
Conargo 4 0.01%
Coolamon 2 0.01%
Cooma-Monaro 54 0.17%
Coonamble 56 0.18%
Cootamundra 38 0.12%
Corowa 41 0.13%
Cowra 63 0.20%
Deniliquin 41 0.13%
Dubbo 285 0.92%
Dungog 11 0.04%
Eurobodalla 119 0.38%
Fairfield 852 2.75%
Forbes 42 0.14%
Gilgandra 23 0.07%

Appendix A - data
Deloitte: Property based funding options for the NSW Fire Services Levy 50
jd|H:\ESA\CLIENTS\ICA\FSL - NSW\4 - ARCHIVED DRAFTS\ICA FINAL REPORT 07-06-11.DOCX
LGA Name Fires in 2009-10 Share of fires
Glen Innes Severn 50 0.16%
Gloucester 10 0.03%
Gosford 691 2.23%
Goulburn Mulwaree 81 0.26%
Great Lakes 110 0.36%
Greater Hume 36 0.12%
Greater Taree 219 0.71%
Griffith 201 0.65%
Gundagai 10 0.03%
Gunnedah 78 0.25%
Guyra 17 0.05%
Gwydir 33 0.11%
Harden 12 0.04%
Hawkesbury 289 0.93%
Hay 13 0.04%
Holroyd 399 1.29%
Hornsby 274 0.89%
Hunters Hill 42 0.14%
Hurstville 219 0.71%
Inverell 114 0.37%
Jerilderie 4 0.01%
Junee 18 0.06%
Kempsey 344 1.11%
Kiama 51 0.16%
Kogarah 132 0.43%
Ku-Ring-Gai 153 0.49%
Kyogle 26 0.08%
Lachlan 46 0.15%
Lake Macquarie 1,211 3.92%
Lane Cove 90 0.29%
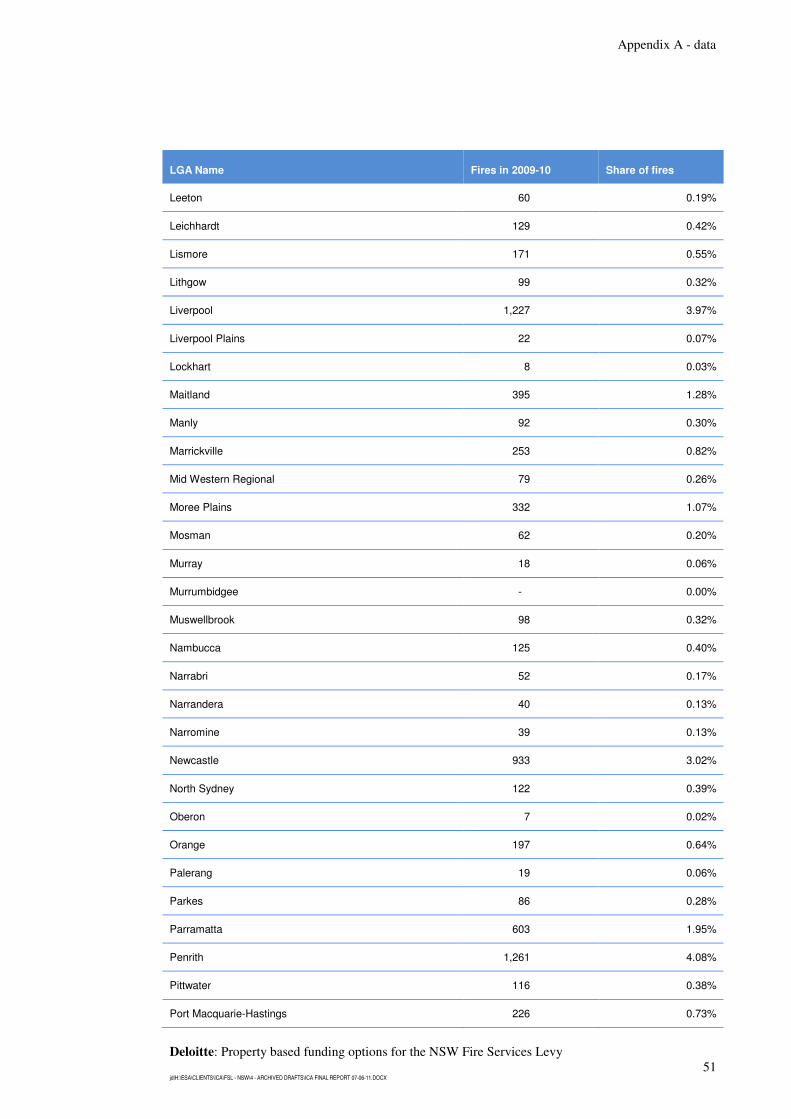
Appendix A - data
Deloitte: Property based funding options for the NSW Fire Services Levy 51
jd|H:\ESA\CLIENTS\ICA\FSL - NSW\4 - ARCHIVED DRAFTS\ICA FINAL REPORT 07-06-11.DOCX
LGA Name Fires in 2009-10 Share of fires
Leeton 60 0.19%
Leichhardt 129 0.42%
Lismore 171 0.55%
Lithgow 99 0.32%
Liverpool 1,227 3.97%
Liverpool Plains 22 0.07%
Lockhart 8 0.03%
Maitland 395 1.28%
Manly 92 0.30%
Marrickville 253 0.82%
Mid Western Regional 79 0.26%
Moree Plains 332 1.07%
Mosman 62 0.20%
Murray 18 0.06%
Murrumbidgee - 0.00%
Muswellbrook 98 0.32%
Nambucca 125 0.40%
Narrabri 52 0.17%
Narrandera 40 0.13%
Narromine 39 0.13%
Newcastle 933 3.02%
North Sydney 122 0.39%
Oberon 7 0.02%
Orange 197 0.64%
Palerang 19 0.06%
Parkes 86 0.28%
Parramatta 603 1.95%
Penrith 1,261 4.08%
Pittwater 116 0.38%
Port Macquarie-Hastings 226 0.73%

Appendix A - data
Deloitte: Property based funding options for the NSW Fire Services Levy 52
jd|H:\ESA\CLIENTS\ICA\FSL - NSW\4 - ARCHIVED DRAFTS\ICA FINAL REPORT 07-06-11.DOCX
LGA Name Fires in 2009-10 Share of fires
Port Stephens 209 0.68%
Queanbeyan City 117 0.38%
Randwick 281 0.91%
Richmond Valley 184 0.59%
Rockdale 191 0.62%
Ryde 194 0.63%
Shellharbour 303 0.98%
Shoalhaven 359 1.16%
Singleton 100 0.32%
Snowy River 24 0.08%
Strathfield 141 0.46%
Sutherland 415 1.34%
Tamworth Regional 307 0.99%
Temora 8 0.03%
Tenterfield 32 0.10%
The Hills Shire 374 1.21%
Tumbarumba 14 0.05%
Tumut 51 0.16%
Tweed 321 1.04%
Upper Hunter 44 0.14%
Upper Lachlan 8 0.03%
Uralla 16 0.05%
Urana 1 0.00%
Wagga Wagga 351 1.13%
Wakool 5 0.02%
Walcha 7 0.02%
Walgett 84 0.27%
Warren 15 0.05%
Warringah 294 0.95%
Warrumbungle 23 0.07%

Appendix A - data
Deloitte: Property based funding options for the NSW Fire Services Levy 53
jd|H:\ESA\CLIENTS\ICA\FSL - NSW\4 - ARCHIVED DRAFTS\ICA FINAL REPORT 07-06-11.DOCX
LGA Name Fires in 2009-10 Share of fires
Waverley 149 0.48%
Weddin 4 0.01%
Wellington 67 0.22%
Wentworth 27 0.09%
Willoughby 105 0.34%
Wingecarribee 163 0.53%
Wollondilly 87 0.28%
Wollongong 1,346 4.35%
Woollahra 96 0.31%
Wyong 648 2.10%
Yass Valley 18 0.06%
Young 57 0.18%
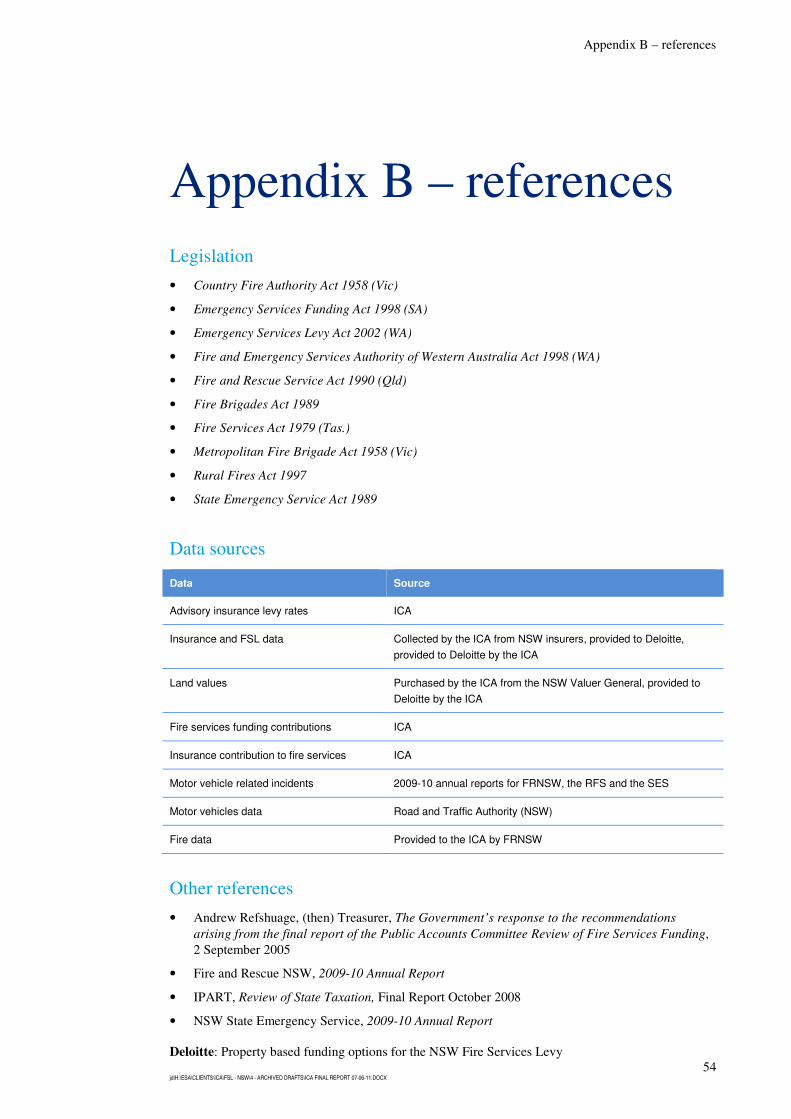
Appendix B – references
Deloitte: Property based funding options for the NSW Fire Services Levy 54
jd|H:\ESA\CLIENTS\ICA\FSL - NSW\4 - ARCHIVED DRAFTS\ICA FINAL REPORT 07-06-11.DOCX
Appendix B – references
Legislation
• Country Fire Authority Act 1958 (Vic)
• Emergency Services Funding Act 1998 (SA)
• Emergency Services Levy Act 2002 (WA)
• Fire and Emergency Services Authority of Western Australia Act 1998 (WA)
• Fire and Rescue Service Act 1990 (Qld)
• Fire Brigades Act 1989
• Fire Services Act 1979 (Tas.)
• Metropolitan Fire Brigade Act 1958 (Vic)
• Rural Fires Act 1997
• State Emergency Service Act 1989
Data sources
Data Source
Advisory insurance levy rates ICA
Insurance and FSL data Collected by the ICA from NSW insurers, provided to Deloitte,
provided to Deloitte by the ICA
Land values Purchased by the ICA from the NSW Valuer General, provided to
Deloitte by the ICA
Fire services funding contributions ICA
Insurance contribution to fire services ICA
Motor vehicle related incidents 2009-10 annual reports for FRNSW, the RFS and the SES
Motor vehicles data Road and Traffic Authority (NSW)
Fire data Provided to the ICA by FRNSW
Other references
• Andrew Refshuage, (then) Treasurer, The Government’s response to the recommendations
arising from the final report of the Public Accounts Committee Review of Fire Services Funding,
2 September 2005
• Fire and Rescue NSW, 2009-10 Annual Report
• IPART, Review of State Taxation, Final Report October 2008
• NSW State Emergency Service, 2009-10 Annual Report

Appendix B – references
Deloitte: Property based funding options for the NSW Fire Services Levy 55
jd|H:\ESA\CLIENTS\ICA\FSL - NSW\4 - ARCHIVED DRAFTS\ICA FINAL REPORT 07-06-11.DOCX
• NSW Department of Treasury, Budget 2010-11 – Budget Paper 3, Police and Emergency
Services
• NSW Rural Fire Services, 2009-10 Annual Report
• Parliament of NSW, Legislative Assembly, Public Accounts Committee – Review of Fire Services
Funding, September 2004
• Professional Financial Services, report to the NSW Public Accounts Committee, For
Quantitative Modelling of NSW FSL Funding Methods
• Victorian Bushfire Royal Commission, Final Report Recommendations – Recommendation 64,
July 2010
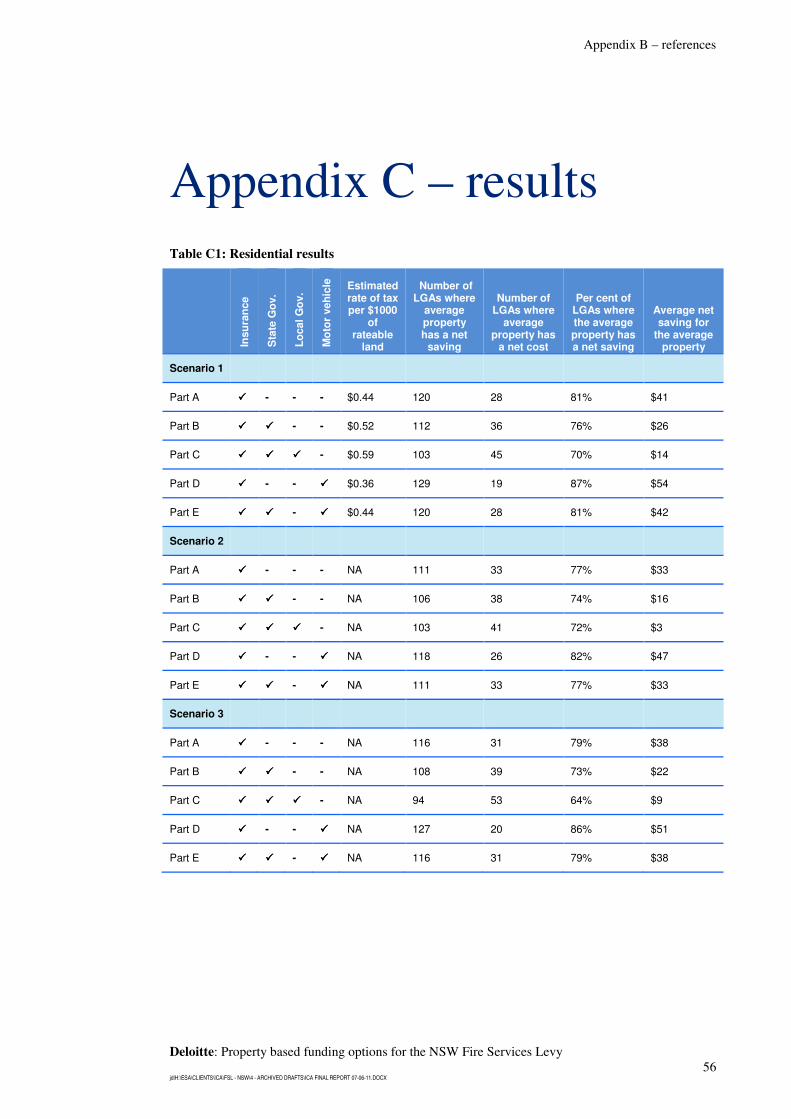
Appendix B – references
Deloitte: Property based funding options for the NSW Fire Services Levy 56
jd|H:\ESA\CLIENTS\ICA\FSL - NSW\4 - ARCHIVED DRAFTS\ICA FINAL REPORT 07-06-11.DOCX
Appendix C – results
Table C1: Residential results
In
su
ran
ce
S
tate
Go
v.
L
ocal
Go
v.
M
oto
r veh
icle
Estimated rate of tax per $1000
of rateable
land
Number of LGAs where
average property has a net
saving
Number of LGAs where
average property has
a net cost
Per cent of LGAs where the average property has a net saving
Average net saving for
the average property
Scenario 1 �
Part A ���� - - - $0.44 120 28 81% $41
Part B ���� ���� - - $0.52 112 36 76% $26
Part C ���� ���� ���� - $0.59 103 45 70% $14
Part D ���� - - ���� $0.36 129 19 87% $54
Part E ���� ���� - ���� $0.44 120 28 81% $42
Scenario 2
Part A ���� - - - NA 111 33 77% $33
Part B ���� ���� - - NA 106 38 74% $16
Part C ���� ���� ���� - NA 103 41 72% $3
Part D ���� - - ���� NA 118 26 82% $47
Part E ���� ���� - ���� NA 111 33 77% $33
Scenario 3
Part A ���� - - - NA 116 31 79% $38
Part B ���� ���� - - NA 108 39 73% $22
Part C ���� ���� ���� - NA 94 53 64% $9
Part D ���� - - ���� NA 127 20 86% $51
Part E ���� ���� - ���� NA 116 31 79% $38

Appendix B – references
Deloitte: Property based funding options for the NSW Fire Services Levy 57
jd|H:\ESA\CLIENTS\ICA\FSL - NSW\4 - ARCHIVED DRAFTS\ICA FINAL REPORT 07-06-11.DOCX
Table C2: Commercial results
In
su
ran
ce
S
tate
Go
v.
L
ocal
Go
v.
M
oto
r veh
icle
Estimated rate of tax per $1000
of rateable
land
Number of LGAs where
average property has a net
saving
Number of LGAs where
average property has
a net cost
Per cent of LGAs where the average property has a net saving
Average net saving for
the average property
Scenario 1
Part A ���� - - - $2.63 43 70 38% -$502
Part B ���� ���� - - $3.15 39 74 35% -$748
Part C ���� ���� ���� - $3.57 38 75 34% -$945
Part D ���� - - ���� $2.19 48 65 42% -$293
Part E ���� ���� - ���� $2.62 43 70 38% -$498
Scenario 2
Part A ���� - - - NA 57 56 50% -$479
Part B ���� ���� - - NA 52 61 46% -$720
Part C ���� ���� ���� - NA 52 61 46% -$931
Part D ���� - - ���� NA 60 53 53% -$274
Part E ���� ���� - ���� NA 57 56 50% -$474
Scenario 3
Part A ���� - - - NA 34 79 30% -$591
Part B ���� ���� - - NA 31 82 27% -$854
Part C ���� ���� ���� - NA 28 85 25% -$1,065
Part D ���� - - ���� NA 42 71 37% -$367
Part E ���� ���� - ���� NA 34 79 30% -$586

Appendix B – references
Deloitte: Property based funding options for the NSW Fire Services Levy 58
jd|H:\ESA\CLIENTS\ICA\FSL - NSW\4 - ARCHIVED DRAFTS\ICA FINAL REPORT 07-06-11.DOCX
Table C3: Rural results
In
su
ran
ce
S
tate
Go
v.
L
ocal
Go
v.
M
oto
r veh
icle
Estimated rate of tax per $1000
of rateable
land
Number of LGAs where
average property has a net
saving
Number of LGAs where
average property has
a net cost
Per cent of LGAs where the average property has a net saving
Average net saving for
the average property
Scenario 1
Part A ���� - - - $0.36 47 65 42% -$219
Part B ���� ���� - - $0.43 38 74 34% -$310
Part C ���� ���� ���� - $0.48 30 82 27% -$387
Part D ���� - - ���� $0.30 58 54 52% -$142
Part E ���� ���� - ���� $0.35 48 64 43% -$217
Scenario 2
Part A ���� - - - NA 57 52 52% -$147
Part B ���� ���� - - NA 51 58 47% -$224
Part C ���� ���� ���� - NA 45 64 41% -$285
Part D ���� - - ���� NA 72 37 66% -$88
Part E ���� ���� - ���� NA 58 51 53% -$146
Scenario 3
Part A ���� - - - NA 22 90 20% -$476
Part B ���� ���� - - NA 17 95 15% -$857
Part C ���� ���� ���� - NA 15 97 13% -$1,002
Part D ���� - - ���� NA 26 86 23% -$522
Part E ���� ���� - ���� NA 22 90 20% -$673


![Transport funding, financing and investment addressing the ... · NSW slide] The Restart NSW model is a good example of ... [PPP slide] Check against delivery ...](https://static.fdocuments.in/doc/165x107/5bef88f509d3f2112f8c7582/transport-funding-financing-and-investment-addressing-the-nsw-slide-the.jpg)


