
Properties of Low-Z solids at high pressureyclept.ucdavis.edu/Theses/Amy.thesis.pdf · Properties...
143
Properties of Low-Z solids at high pressure By AMY ELIZABETH LAZICKI B.S. (University of the Pacific, Stockton CA) 2002 DISSERTATION Submitted in partial satisfaction of the requirements for the degree of Doctor of Philosophy in Physics in the OFFICE OF GRADUATE STUDIES of the UNIVERSITY OF CALIFORNIA DAVIS Approved: Committee in Charge 2007 -i-
-
Upload
duongthien -
Category
Documents
-
view
217 -
download
1
Transcript of Properties of Low-Z solids at high pressureyclept.ucdavis.edu/Theses/Amy.thesis.pdf · Properties...

Properties of Low-Z solids at high pressure
By
AMY ELIZABETH LAZICKIB.S. (University of the Pacific, Stockton CA) 2002
DISSERTATION
Submitted in partial satisfaction of the requirements for the degree of
Doctor of Philosophy
in
Physics
in the
OFFICE OF GRADUATE STUDIES
of the
UNIVERSITY OF CALIFORNIA
DAVIS
Approved:
Committee in Charge
2007
- i -

Properties of Low-Z solids at high pressure
COPYRIGHT c© 2007
by
AMY ELIZABETH LAZICKI
- ii -

For God, for my father and mother Stephen and Doreen Lazicki, and for my sisters Suzanne,
Stephanie and Patricia.
- iii -

Acknowledgments
I would like to thank my advisor at Lawrence Livermore National Laboratory Choong-
Shik Yoo and my advisors at U. C. Davis Warren Pickett and Richard Scalettar who were unfailingly
helpful and encouraging. I acknowledge very beneficial mentorship from Andy McMahan and all
the unbelievably likeable and unselfish members of the high pressure physics group at Lawrence
Livermore Laboratory. The excellent beamline scientists I worked with at the Advanced Photon
Source, SPRing-8 and Advanced Light Source synchrotrons also played a large part in this research;
specifically Michael Hu, Maddoury Somayazulu, Paul Chow, Peter Liermann, Yasuo Ohishi, and
Martin Kunz. And I’d like to thank the rest of my friends and family who made this possible, espe-
cially Danielle Castro, Kat and Garrett Chun, Uyen Do, Liza Gilden, Vriana Graham, Zsolt Jenei,
Daniel Jung, Deepa Kasinathan, Mary Kay, Andras Libal, Brian Maddox, Aditya Puar, Benjamin
Saffold, Alfred Smith, my family at RPEC and ILBC, and many others.
I acknowledge financial support from the Student Employee Graduate Research Fellow-
ship Program at Lawrence Livermore National Laboratory and the Stewardship Science Academic
Alliance Program.
- iv -

Abstract
Properties of Low-Z solids at high pressure
by
Amy Elizabeth Lazicki
Doctor of Philosophy in Physics
UNIVERSITY OF CALIFORNIA, DAVIS
Professor Warren E. Pickett, Chair
The high pressure behavior of low-Z (lightweight, low atomic number) elements and com-
pounds is of great interest because of their abundance in the universe and their importance to geo-
physics and planetary physics (especially the hydrogen-containing dense ices which are predicted
to occur at the centers of the giant planets.) The general trend which seems to be emerging for the
lightweight molecular systems is that, at high pressure, they transform to extended nonmolecular
solid phases with an multitude of interesting and new properties which, in many cases, occur at pres-
sure regimes just out of our reach with conventional static high pressure experimental techniques.
Lithium is an electronic analog to hydrogen and at ambient pressure it forms compounds similar
to the dense ices, suggesting it as a good complimentary system whose behavior may provide new
insights into those important and difficult geophysics problems. The lithium compounds themselves
also have important potential technological applications ranging from battery materials to hydrogen
storage media, for which they merit a closer examination. Additionally, their simple physical and
electronic structures make them uniquely appropriate for testing computational electronic structure
models, particularly in the high density regime where material properties are less well-known. In
the studies presented here, we examine the high pressure behavior of a series of lithium compounds
in which we observe some new and interesting phenomena which may also have implications for
their analog systems. The combination of modern experimental methods and electronic structure
models here employed allow a better understanding of these materials and also of fundamental high
pressure materials physics.
X-ray diffraction and nitrogen k-edge X-Ray Raman Scattering (XRS) investigations of
the crystal and electronic structure of ionic compound Li3N (an analog for NH3) across two high
- v -

pressure phase transitions are conducted in a diamond anvil cell and results interpreted using density
functional theory. A transition to new (γ) phase is seen above 40(±5) GPa, accompanied by an 8%
volume collapse, which persists up to 200 GPa. First principles calculations predict a remarkable
stability of the N3− ion up to a six-fold volume reduction. A low-energy peak in the XRS spectrum
is observed in both low-pressure hexagonal phases of Li3N which is absent in the high pressure
cubic phase, resulting in a quadrupling of the band gap. this peak is found to originate from an
interlayer band similar to the important free-electronlike state present in the graphite and graphite
intercalate systems. XRS detection of the interlayer state is made possible because of its strong hy-
bridization with the nitrogen p-bands. An unusual pressure-induced increase in the band gap of the
high pressure cubic phase of Li3N is shown to originate from the differing pressure dependencies
of different quantum-number bands and, by comparison with related close-shelled ionic solids Li2O
and LiF, is revealed as the standard behavior for low-Z ionic materials. Metallization in this mate-
rial is predicted to occur at pressures exceeding 8 TPa, one of the highest metallization pressures
predicted for any solid. The high structural stability, wide band gap and simple electronic structure
make this N3− based system analogous to lower valency compounds (MgO, NaCl, Ne), suggesting
its use as an internal pressure standard.
Using synchrotron angle-dispersive x-ray diffraction (ADXD) and Raman spectroscopy
on samples of Li2O (an H2O analog) pressurized in a diamond anvil cell, we observed a reversible
phase change from the cubic antifluorite (α, Fm-3m) to orthorhombic anticotunnite (β, Pnma) phase
at 50(±5) GPa at ambient temperature. This transition is accompanied by a relatively large volume
collapse of 5.4 (±0.8) % and large hysteresis upon pressure reversal (Pdown at ∼25 GPa). Contrary
to a recent study, our data suggest that the high-pressure β-phase (Bo = 188±12 GPa) is substantially
stiffer than the low-pressure α-phase (Bo = 90±1 GPa). A relatively strong and pressure-dependent
preferred orientation in β-Li2O is observed. The present result is in accordance with the systematic
behavior of antifluorite-to-anticotunnite phase transitions occurring in other alkali-metal chalco-
genides. These systematics, along with similarities between ambient pressure cubic Li2O and a
predicted high pressure phase of H2O ice suggest that ice itself may exhibit similar behavior at high
density.
Diamond anvil cell experiments augmented by first principles calculations have been used
to investigate the behavior at high pressure of lithium borocarbide (LiBC), which is structurally and
electronically similar to the superconductor MgB2. It is found to remain stable up to 60 GPa with
no crystal structure change and without a previously reported lattice parameter anomaly. Large
anisotropy in the linear compressibility of the layered hexagonal structure is identified and related
- vi -

to the distinctly different bonding types within and between the hexagonal planes; a mixture of
covalent and ionic intralayer bonding and interlayer bonding consisting of van der Waals-type in-
teractions and weak (but increasing under pressure) covalency. Metallization is not found until a
calculated pressure of at least 345 GPa, and pressure removes the similarity in electronic structure
between LiBC and MgB2; reducing the cell volume causes an increase in the σ and π electronic
band gaps. Metallization is finally an indirect gap closure and the holes do not go into any sigma
bands, ruling out the possibility of a new MgB2-type high-pressure superconductor.
- vii -

Contents
List of Figures x
List of Tables xiv
1 Introduction 11.1 High Pressure Experimentation . . . . . . . . . . . . . . . . . . . . . . . . . . . . 11.2 Motivation . . . . . . . . . . . . . . . . . . . . . . . . . . . . . . . . . . . . . . . 3
1.2.1 Low-Z materials . . . . . . . . . . . . . . . . . . . . . . . . . . . . . . . 31.2.2 Hydrogen and lithium as analogs . . . . . . . . . . . . . . . . . . . . . . . 41.2.3 LiBC an example of an MgB2-like superconductor? . . . . . . . . . . . . . 61.2.4 Lithium compounds under pressure . . . . . . . . . . . . . . . . . . . . . 61.2.5 Dissertation outline . . . . . . . . . . . . . . . . . . . . . . . . . . . . . . 6
2 Experimental Methods 82.1 Introduction . . . . . . . . . . . . . . . . . . . . . . . . . . . . . . . . . . . . . . 82.2 The Diamond Anvil Cell . . . . . . . . . . . . . . . . . . . . . . . . . . . . . . . 8
2.2.1 Types . . . . . . . . . . . . . . . . . . . . . . . . . . . . . . . . . . . . . 82.2.2 Diamonds . . . . . . . . . . . . . . . . . . . . . . . . . . . . . . . . . . . 92.2.3 Gasket materials . . . . . . . . . . . . . . . . . . . . . . . . . . . . . . . 122.2.4 Loading Techniques . . . . . . . . . . . . . . . . . . . . . . . . . . . . . 132.2.5 Pressure Media . . . . . . . . . . . . . . . . . . . . . . . . . . . . . . . . 132.2.6 Pressure Standards . . . . . . . . . . . . . . . . . . . . . . . . . . . . . . 152.2.7 Electrical measurements in the DAC . . . . . . . . . . . . . . . . . . . . . 162.2.8 Resistive heating in the DAC . . . . . . . . . . . . . . . . . . . . . . . . . 17
2.3 Diagnostics . . . . . . . . . . . . . . . . . . . . . . . . . . . . . . . . . . . . . . 172.3.1 Synchrotron methods . . . . . . . . . . . . . . . . . . . . . . . . . . . . . 172.3.2 Optical Spectroscopy . . . . . . . . . . . . . . . . . . . . . . . . . . . . . 26
3 Computational Methods 303.1 Usefulness and relevance to high pressure physics . . . . . . . . . . . . . . . . . . 303.2 Basic principles . . . . . . . . . . . . . . . . . . . . . . . . . . . . . . . . . . . . 30
3.2.1 Density functional theory . . . . . . . . . . . . . . . . . . . . . . . . . . . 303.2.2 The Kohn-Sham Equation . . . . . . . . . . . . . . . . . . . . . . . . . . 313.2.3 Exchange correlation energy functional approximations . . . . . . . . . . 32
- viii -

3.2.4 Methods for solving the Kohn-Sham equations. . . . . . . . . . . . . . . . 323.3 Deriving physically relevant properties of materials . . . . . . . . . . . . . . . . . 36
3.3.1 Bandstructure . . . . . . . . . . . . . . . . . . . . . . . . . . . . . . . . . 363.3.2 Density of states and absorption spectra . . . . . . . . . . . . . . . . . . . 383.3.3 Equation of state and structural stability . . . . . . . . . . . . . . . . . . . 38
4 Structural and Electronic changes in Ionic Solid Lithium Nitride by Diffraction, Spec-troscopy and First-Principles DFT 414.1 Introduction . . . . . . . . . . . . . . . . . . . . . . . . . . . . . . . . . . . . . . 41
4.1.1 Chemical bonding . . . . . . . . . . . . . . . . . . . . . . . . . . . . . . 414.1.2 Superionic Conductivity . . . . . . . . . . . . . . . . . . . . . . . . . . . 434.1.3 Li3N Applications . . . . . . . . . . . . . . . . . . . . . . . . . . . . . . 444.1.4 Structural properties . . . . . . . . . . . . . . . . . . . . . . . . . . . . . 454.1.5 Electronic properties . . . . . . . . . . . . . . . . . . . . . . . . . . . . . 45
4.2 Experimental Details . . . . . . . . . . . . . . . . . . . . . . . . . . . . . . . . . 504.3 Computational Details . . . . . . . . . . . . . . . . . . . . . . . . . . . . . . . . 514.4 Results . . . . . . . . . . . . . . . . . . . . . . . . . . . . . . . . . . . . . . . . . 51
4.4.1 X-Ray Diffraction . . . . . . . . . . . . . . . . . . . . . . . . . . . . . . 514.4.2 X-Ray Raman Scattering . . . . . . . . . . . . . . . . . . . . . . . . . . . 56
4.5 Discussion . . . . . . . . . . . . . . . . . . . . . . . . . . . . . . . . . . . . . . . 584.6 Conclusion . . . . . . . . . . . . . . . . . . . . . . . . . . . . . . . . . . . . . . 674.7 Acknowledgements . . . . . . . . . . . . . . . . . . . . . . . . . . . . . . . . . . 69
5 Pressure-induced Antifluorite-to-Anticotunnite Phase Transition in Dense Ice AnalogLithium Oxide 705.1 Introduction . . . . . . . . . . . . . . . . . . . . . . . . . . . . . . . . . . . . . . 705.2 Experiment . . . . . . . . . . . . . . . . . . . . . . . . . . . . . . . . . . . . . . 735.3 X-Ray Diffraction . . . . . . . . . . . . . . . . . . . . . . . . . . . . . . . . . . . 775.4 Raman Spectroscopy . . . . . . . . . . . . . . . . . . . . . . . . . . . . . . . . . 825.5 Discussion . . . . . . . . . . . . . . . . . . . . . . . . . . . . . . . . . . . . . . . 835.6 Conclusion . . . . . . . . . . . . . . . . . . . . . . . . . . . . . . . . . . . . . . 885.7 Acknowledgments . . . . . . . . . . . . . . . . . . . . . . . . . . . . . . . . . . 88
6 Search for Superconductivity in Lithium Borocarbide at High Pressure 896.1 Introduction . . . . . . . . . . . . . . . . . . . . . . . . . . . . . . . . . . . . . . 896.2 High Pressure Experiments . . . . . . . . . . . . . . . . . . . . . . . . . . . . . . 916.3 Theoretical Calculations . . . . . . . . . . . . . . . . . . . . . . . . . . . . . . . 936.4 Experimental Results . . . . . . . . . . . . . . . . . . . . . . . . . . . . . . . . . 946.5 Discussion . . . . . . . . . . . . . . . . . . . . . . . . . . . . . . . . . . . . . . . 976.6 Conclusion . . . . . . . . . . . . . . . . . . . . . . . . . . . . . . . . . . . . . . 1026.7 Acknowledgements . . . . . . . . . . . . . . . . . . . . . . . . . . . . . . . . . . 103
A StructureSolution 104A.1 Indexing . . . . . . . . . . . . . . . . . . . . . . . . . . . . . . . . . . . . . . . . 104A.2 Whole profile fitting and Rietveld refinement . . . . . . . . . . . . . . . . . . . . 107
- ix -

List of Figures
1.1 Accessible pressures in a diamond anvil cell. [Jayaraman, 1984] . . . . . . . . . . 21.2 Carbon dioxide phase diagram showing high pressure extended solid phases similar
to phases of SiO2. Red and blue arrow represent experimental paths taken in theparticular study [Iota et al., 2007]. . . . . . . . . . . . . . . . . . . . . . . . . . . 5
1.3 Melting curves of column I elements under pressure [Gregoryanz et al., 2005]. . . . 5
2.1 Diamond Anvil Cell . . . . . . . . . . . . . . . . . . . . . . . . . . . . . . . . . . 92.2 (a) LLL cell (b) SAX cell . . . . . . . . . . . . . . . . . . . . . . . . . . . . . . . 102.3 Membrane Cell . . . . . . . . . . . . . . . . . . . . . . . . . . . . . . . . . . . . 102.4 (a) Flat culet (b) Beveled culet . . . . . . . . . . . . . . . . . . . . . . . . . . . . 112.5 X-ray transmission of diamond, Be and Re at the characteristic diamond and gasket
thickness of 2.5 mm. . . . . . . . . . . . . . . . . . . . . . . . . . . . . . . . . . 122.6 Cryogenic gas loader . . . . . . . . . . . . . . . . . . . . . . . . . . . . . . . . . 142.7 Shift of ruby R1 and R2 fluorescence lines for sample of Li2O without pressure
medium. . . . . . . . . . . . . . . . . . . . . . . . . . . . . . . . . . . . . . . . . 152.8 Advanced Photon Source (APS): third generation synchrotron source used for most
of the studies reported here. . . . . . . . . . . . . . . . . . . . . . . . . . . . . . . 182.9 APS sector 16 insertion device beamline optical train. . . . . . . . . . . . . . . . . 192.10 X-ray scattering off of a crystal lattice. . . . . . . . . . . . . . . . . . . . . . . . . 202.11 Powder x-ray diffraction rings with integrated 2-dimensional spectrum. . . . . . . 212.12 Setup for ADXD in the sector 16IDB experimental hutch at the APS. . . . . . . . . 222.13 Rietveld refined powder XRD pattern. . . . . . . . . . . . . . . . . . . . . . . . . 232.14 X-ray Raman Process compared to X-ray Absorption. . . . . . . . . . . . . . . . . 252.15 APS sector 16 (HPCAT) beamline IDD XRS experimental setup. . . . . . . . . . . 262.16 Raman process and resulting spectrum type. . . . . . . . . . . . . . . . . . . . . . 272.17 Raman spectrometer used in this study: optics and holographic bandpass filter de-
tail. The bandpass filter allows the laser beam to be directed down the axis of theDAC, and also partially filters out the Rayleigh scattering. [Maddox, 2006] . . . . 29
3.1 Muffin Tin approximation . . . . . . . . . . . . . . . . . . . . . . . . . . . . . . . 323.2 APW and LAPW wavefuntions across the muffin tin boundary (for p-like wave in
iron) [Schwarz et al., 2002] . . . . . . . . . . . . . . . . . . . . . . . . . . . . . . 333.3 Comparison between real and pseudo- potentials and wavefunctions. . . . . . . . 35
- x -

3.4 Electronic band structure for cubic Li3N and the corresponding density of states. . 373.5 Equation of state curves for two structural phases (of Li3N). The slope of the line
drawn tangent to both EOS curves gives the transition pressure. In the inset are theintersecting Gibb’s free energy curves for these phases. . . . . . . . . . . . . . . . 40
4.1 Illustration of an ionic bond (a), a polar covalent bond (b) and a nonpolar covalentbond (c) [McMurry and Fay, 2004]. . . . . . . . . . . . . . . . . . . . . . . . . . 42
4.2 a) sp3 and b) sp2 hybrid orbitals. [McMurry and Fay, 2004] . . . . . . . . . . . . . 464.3 bonding and antibonding combinations of atomic orbitals. . . . . . . . . . . . . . . 474.4 Band structure of primitive graphite [Boeri et al., 2007], highlighting the character
of the bands. Green corresponds to σ bands, red to π and blue to interlayer states. . 494.5 ADXD diagrams of Li3N at ambient pressure (a mixture of α and β hexagonal
phases), at ∼38 GPa (β phase, directly prior to the phase transition), at 43 GPa(γ phase, directly following the phase transition), and at 201 GPa (still γ phase,mixed with copper pressure indicator). Refined and difference patterns from theGSAS Rietveld refinement are shown, and hkl reflections from each phase shownin green (α), red (β), black (γ), and magenta (copper). The three crystal structuresare shown, with large atoms representing the highly negative nitrogen ions, smallrepresenting lithium. . . . . . . . . . . . . . . . . . . . . . . . . . . . . . . . . . 52
4.6 Experimental and calculated equation of state of β- and γ-Li3N. In the inset, thehigh pressure bulk modulus of γ-Li3N is compared to other common highly com-pressible materials. [Sata et al., 2002, Hemley et al., 1989] (NaCl, MgO and NeCurves are interpolated up to 200 GPa). . . . . . . . . . . . . . . . . . . . . . . . 53
4.7 Measured nitrogen k-edge XRS spectra from the three phases of Li3N (error barsestimated as the square root of the counts) compared with calculated Nitrogen pand Lithium s projected density of states and with the calculated x-ray absorptionspectrum. The calculated curves were offset by 394.2 eV (arbitrary) in every case,for the sake of qualitative comparison with the experimental results. . . . . . . . . 55
4.8 Calculated electronic band structure for the three phases of Li3N, with the interlayerband highlighted in orange in the two hexagonal phases. . . . . . . . . . . . . . . 57
4.9 Valence (a) and interlayer (b) α-Li3N charge densities perpendicular to the basalplane (left panels) and within the basal plane (right panels). Contours are labeled inunits of 0.01 e/A3 and separated by 0.05 e/A3 (a) and 0.01 e/A3 (b). . . . . . . . . 59
4.10 Valence (a) and interlayer (b) β-Li3N charge densities perpendicular to the basalplane (left panels) and within the basal plane (right panels). Contour lines are la-beled in units of 0.1 e/A3 and separated by 0.05 e/A3. . . . . . . . . . . . . . . . . 60
4.11 Total density of states of valence and low-lying conduction bands of β-Li3N be-tween 0 and 35 GPa. . . . . . . . . . . . . . . . . . . . . . . . . . . . . . . . . . 61
4.12 Sample image at ambient pressure (a) and at the β→γ phase transition near 40 GPa(b). The bright spot at 40 GPa is the ruby grain used for pressure calibration. . . . . 63
- xi -

4.13 Change in valence band energies relative to bottom of the conduction band in theγ phase from the phase transition to metallization. Energy gaps explained in thedensity of states plot (inset): open circles give the fundamental band gap, and theenergy separation between the bottom of the conduction band and the center of massof the valence band (open triangles) and the bottom of the valence band (closedtriangles) are also shown. V0 is the volume of α-Li3N at ambient pressure. . . . . . 64
4.14 Band gap increases as a function of volume reduction for related close-shelled cubicLi compounds. LiF and Li2O are cubic at ambient pressure and V0 refers to theambient pressure volume. Li3N V0 (in this instance alone) is taken as the volume atthe β → γ phase transition. . . . . . . . . . . . . . . . . . . . . . . . . . . . . . . 66
4.15 Phase transition sequence of alkali pnictides under pressure. The triangles show thehigh pressure limit of experiments performed on these materials [Leonova et al.,2003, Datchi et al., 2006]. . . . . . . . . . . . . . . . . . . . . . . . . . . . . . . . 68
5.1 Phase diagram of water from [Lin et al., 2006]. . . . . . . . . . . . . . . . . . . . 715.2 Crystal structure of Ice X [Lin et al., 2006]. . . . . . . . . . . . . . . . . . . . . . 715.3 (a) antifluorite α-Li2O structure. (b) anticotunnite β-Li2O structure showing the tri-
capped trigonal prismatic coordination. Large atoms represent oxygen and smallerrepresent lithium. . . . . . . . . . . . . . . . . . . . . . . . . . . . . . . . . . . . 74
5.4 Rietveld refined x-ray diffraction profile of α- and β-Li2O. For the diffraction pat-terns shown, the final refinement converged to R(F2) = 0.1054 for the α phase andR(F2) = 0.1197 for the β phase. In the high pressure phase, only the most intensereflections are labeled. Unit cell parameters for the phase were determined from thepositions of the most isolated and/or intense peaks: (002), (011), (111), (211), (013)and (020). . . . . . . . . . . . . . . . . . . . . . . . . . . . . . . . . . . . . . . . 75
5.5 Li2O ADXD patterns across the phase transition from cubic to orthorhombic, show-ing the large pressure range of two-phase coexistence. . . . . . . . . . . . . . . . 76
5.6 Powder diffraction rings of β-Li2O at 53 GPa (a) and 61 GPa (b), showing the pres-ence of texture in this phase, and the increase in preferred orientation with pressure.The three most prominent rings shown are the (011), (102)+(200), and (111) reflec-tions. . . . . . . . . . . . . . . . . . . . . . . . . . . . . . . . . . . . . . . . . . . 78
5.7 EOS for the two Li2O phases. In the main plot, solid curves are the Birch-MurnaghanEOS fits to the experimental data (shown as open circles) in this study. Solid squaresare the experimental data from Ref. [Kunc et al., 2005] and dotted curves are thetheoretically calculated EOS [Kunc et al., 2005] for both phases. Inset: trends in theevolution with pressure of the lattice parameters in the β phase. Empty circles aredata from this study (error bars shown when they exceed size of data points), andsolid squares are experimental data from Ref. [Kunc et al., 2005]. . . . . . . . . . 80
5.8 Raman spectra upon increasing (a) and decreasing (b) pressure. Cosmic radiationspikes were removed from two of the spectra. . . . . . . . . . . . . . . . . . . . . 82
- xii -

5.9 The shift in pressure of Li2O Raman bands. Solid lines are fits to the experimentaldata from this study. Red dotted lines represent the calculated theoretical pressuredependence of the Raman frequencies from Ref. [Kunc et al., 2005]. In the cubicphase, the theoretical curve lines up exactly with the experimental result from thisstudy. Vertical dashed lines approximate the phase transition pressure upon increas-ing and decreasing pressure. . . . . . . . . . . . . . . . . . . . . . . . . . . . . . 84
5.10 (a) α-Li2O along the (111) plane, showing the transition mechanism to β-Li2O (b).For the cubic structure shown in (a), all oxygen ions are coplanar, located midwaybetween planes of lithium ions which are separated by 1.032 A near 50 GPa. Forthe orthorhombic structure shown in (b), half the oxygen ions have moved into thelower plane of Li ions (shown as colored polyhedra) and half into the upper (empty),with the planes separated by 1.402 A near 50 GPa. . . . . . . . . . . . . . . . . . 85
5.11 Comparison of Li2O pressure behavior with that of the alkali-metal sulfides. H2Omay transition to a cubic antifluorite-type phase above 170 GPa, and, in the non-molecular form, may be expected to follow the same trends as the alkali metalchalcogenides. 5 represents the high pressure limit of experiments. . . . . . . . . 87
6.1 LiBC crystal structure. White, black and grey atoms represent lithium, carbon andboron, respectively. . . . . . . . . . . . . . . . . . . . . . . . . . . . . . . . . . . 91
6.2 MgB2 structure [Zweiacker]. . . . . . . . . . . . . . . . . . . . . . . . . . . . . . 926.3 Sample GSAS refined ADXD pattern for LiBC and Cu at ∼4.5 GPa. Major LiBC
peaks are labeled with their hkl indices. The small peak labeled with an ∗ near2Θ=21◦ does not originate from the sample. . . . . . . . . . . . . . . . . . . . . . 93
6.4 Equation of state of LiBC up to 60 GPa. The solid line is a third-order Birch-Murnaghan fit to the experimental data, and the dotted line represents the calculatedtheoretical equation of state. In the inset, results from this study are compared withthose of Kobayashi et al. [Kobayashi and Arai, 2003a,b] for the evolution of c/awith pressure. . . . . . . . . . . . . . . . . . . . . . . . . . . . . . . . . . . . . . 94
6.5 High pressure behavior of a and c lattice parameters (normalized to ambient-pressurea0 and c0), compared with MgB2 and similar layered hexagonal compounds [Gon-charov et al., 2001, Zhao and Spain, 1989, Solozhenko et al., 1995] as well as withdiamond [Occelli et al., 2003]. Curves shown are the first-order Murnaghan equa-tion (Equation 2) fits to experimental data (circles). Values for first order axialcompression coefficients (as described in the text) are shown in the inset for LiBCand related compounds [Goncharov et al., 1996, Zhao and Spain, 1989, Solozhenkoet al., 1995, Occelli et al., 2003]. β−1
0 is the linear compressibility at zero pressure. 966.6 Projected density of states at ambient pressure (a) and at metallization (b). . . . . . 986.7 Electron density in (a) the (0001) plane, (b) the (1010) plane and (c) contours along
the (1010) plane at ambient and (d) metallization pressure. Contour values are givenin units of e/A3. Subsequent contours differ by 0.2 e/A3. . . . . . . . . . . . . . . 99
6.8 Bandstructures at ambient pressure (top left), ∼60 GPa (top right), ∼325 GPa (bot-tom left) and ∼450 GPa (bottom right). . . . . . . . . . . . . . . . . . . . . . . . 100
6.9 MgB2 bandstructure [Kortus et al., 2001]. The fatter bands represent boron charac-ter with pz bands shown in red and px+py bands shown in black . . . . . . . . . . 101
- xiii -

List of Tables
4.1 Volume per formula unit Vo, bulk modulus Bo, its pressure derivative Bo’, volumechange at the β→γ transition and transition pressure as obtained in experimental(*)and theoretical work in present and other studies. Experimental errors are primarilya result of non-hydrostaticity in the DAC. The γ-phase predicted in reference [Hoet al., 1999] is space group P43m. . . . . . . . . . . . . . . . . . . . . . . . . . . 56
5.1 Lattice parameters (given by XRDA) and refined fractional coordinates for β-Li2Oat 61.9 GPa. Uncertainties reported are those output by GSAS for this refinement.However, the complexity of the structure and the quality of the data suggest that inreality these parameters are less certain. . . . . . . . . . . . . . . . . . . . . . . . 77
5.2 Birch-Murnaghan EOS fitting parameters. Volumes are given per formula unit. . . 815.3 Frequencies, pressure coefficients, and Gruneisen parameters (all calculated at 50
GPa), for the plotted Raman modes of Li2O. . . . . . . . . . . . . . . . . . . . . . 85
A.1 Lattice parameter and angle relationships for the seven crystal classes . . . . . . . 105
- xiv -

Science is not a collection of facts any more than an opera is a collection of notes. It’s...a method,
based on a single insight – that the degree to which an idea seems true has nothing to do with
whether it is true, and that the way to distinguish factual ideas from false ones is to test them by
experiment.
Timothy Ferris
What’s my view?
Well how am I supposed to know?
Write a review?
Well how objective can I be?
I like to wait to see how things turn out
If you Apply Some Pressure
What happens when you lose everything?
You just start again
You start all over again
I like to wait to see how things turn out
If you Apply Some Pressure
’Apply Some Pressure’
Maxımo Park
- xv -
1
Chapter 1
Introduction
1.1 High Pressure Experimentation
Pressure in our universe is perhaps the thermodynamic variable with the widest range
variation: from effectively 0 Pa (intergalactic space) to over 1030 Pa at the centers of neutron stars
[Jayaraman, 1984]. A large amount of the matter in the universe exists at high pressures which
are only just now beginning to be accessible to us experimentally. In the laboratory it is possible
vary pressures from a ∼10−11 Pa vacuum to now reported 10-100 TPa (1010 - 1011 Pa) in recent
laser shock experiments [Jeanloz et al., 2007]. The approximate range of pressures achievable in a
diamond anvil cell (the apparatus used in this study) is shown in Figure 1.1.
Pressure induced phenomena already seen in this relatively narrow experimental range
which is accessible to us include structural, electron and magnetic phase transitions such as insulator-
metal transitions [Bastea et al., 2001], superconductivity [Neaton and Ashcroft, 1999], volume col-
lapse transitions and Mott transitions [Yoo et al., 2005], electron delocalization [Maddox et al.,
2006], liquid-solid, solid-solid, and even liquid-liquid transitions [Katayama et al., 2000], amor-
phization [Santoro et al., 2006], molecular dissociation [Kenichi et al., 2003] and many others.
Some high pressure phases of matter can be quenched down to ambient conditions at
which they are metastable (diamond is a good example of such a phase.) The driving force behind
many high pressure studies is the hope of creating a new and exotic or useful phase of matter that can
brought to ambient conditions for practical applications. Some properties commonly searched for
include superhardness [Kaner et al., 2005], energetic behavior [Lipp et al., 2005], superconductivity
[Schilling, 2001], hydrogen storage capacity [Mao et al., 2002] and many others, with some success.
Additionally, the physical properties of materials that actually exist at high pressure in

2
� �
Figure 1.1: Accessible pressures in a diamond anvil cell. [Jayaraman, 1984]

3
practice, such as matter in the planetary interiors or the products of explosive detonation, are impor-
tant to understand.
The larger goal of high pressure work is to create a fully predictive model to describe
the behavior of matter as the atoms which compose it are pushed closer together. Particularly
challenging to characterize is the pressure regime in which localized electrons from neighboring
atoms begin to interact with one another, resulting in all sorts of interesting and unexpected physics.
The existing theoretical models require experimental data for confirmation and further refinement
of these models, and the experimentation is driven by the predictions of these models.
1.2 Motivation
1.2.1 Low-Z materials
Low-Z refers to the elements and compounds composed of elements from (approximately)
the first two rows of the periodic table (hydrogen through neon). Although they are only a small
percentage of all known elements, they are the predominant components of the universe (with hy-
drogen being far and away the most abundant). At ambient conditions their crystal and electronic
structures are rather simple and understandable, and so they provide a good basis for developing and
testing computational models. At high pressure (sometimes coupled with high temperature), how-
ever, we are seeing more and more new and unexpected phenomena. Several light elements have
recently been shown to transform to extremely complex low-symmetry crystal structures [Hemley
et al., 1989], and to exhibit such properties as superconductivity [Neaton and Ashcroft, 1999] or
superionic conductivity [Cavazzoni et al., 1999]. The low-Z molecular systems are being shown to
possess extremely rich phase diagrams, with phases ranging from the ambient molecular phases, to
fully extended solids and many intermediate phases in between [Iota et al., 2007].
There is a great amount of interest in the qualities of in particular hydrogen and hydro-
gen compounds at high pressure. They have been identified as the dominant components of the
giant planets and also they form the major detonation products of energetic materials. Hydrogen
itself has been predicted to exhibit all manner of exotic properties at high pressure, including met-
allization in nonmolecular [Wigner and Huntington, 1935, Mao and Hemley, 1989] and molecular
[Ramaker et al., 1975] phases, room temperature Tc superconductivity [Richardson and Ashcroft,
1997, Ashcroft, 1968] and metallic superfluidity [Bonev et al., 2004, Smorgrav et al., 2005] to name
a few.

4
1.2.2 Hydrogen and lithium as analogs
Hydrogen has been suggested to transform at high pressure to an ionic solid not unlike
lithium and, in further similarity, lithium becomes quite a good superconductor at high pressure
[Richardson and Ashcroft, 1997, Shimizu et al., 2002]. Alternatively, it has been suggested that
lithium may transform to a ’paired’ structure at high pressure which looks oddly like H2 [Neaton
and Ashcroft, 1999]. For hydrogen, the quantum effects that make it so unique have been shown
to decrease at high pressure [Stishov, 2001], enhancing its similarity to lithium. These provocative
similarities indicate that studies of these two elements may be very complimentary.
The focus of this dissertation is on the behavior of a series of low-Z lithium-containing
compounds at high pressure. The first two we will examine are lithium nitride (Li3N) and lithium
oxide (Li2O) with the primary motivation being their similarity to their hydrogen-containing coun-
terparts ammonia (NH3) and water (H2O) which are of great importance for geophysics and plan-
etary physics. H2O and NH3 exist in great abundance here on earth and, more importantly, in the
centers of the giant planets, where they are predicted to transform to nonmolecular solids which
bear some resemblance to Li2O and Li3N [Cavazzoni et al., 1999]. They not only possess the same
valence electronic configurations and similar crystal structures, but they are all predicted to exhibit
superionic conductivity (in which the positive ionic species is able to conduct unusually rapidly
through a fixed lattice of the negative ionic species - more details in chapter 4).
There appears to be a general trend in the low-Z molecular systems that high pressure
moves them towards non-molecular extended phases. CO2, for example, has been shown recently
to take on SiO2-like crystal structures at high pressures and temperatures [Iota et al., 2007] (Figure
1.3. CO2 and SiO2, although isovalent, appear in completely different forms at ambient condition.
But at high pressure, the systematic behavior of compounds within a single family is revealed. As
further evidence for this principle, recent work on the melting curves of the alkali elements un-
der pressure show unusual and systematic behavior [Gregoryanz et al., 2005], and this in materials
whose ambient states range from molecular gasses to metallic solids. There is evidently good prece-
dent for studying lithium and lithium compounds as analog systems to the hydrogen compounds.
Another reason it is desirable to study lithium in lieu of hydrogen is the difficulty of per-
forming hydrogen experiments, particularly at high pressure. The electron density on the hydrogen
atoms is so low that their positions cannot be detected with x-ray diffraction. Neutron scattering
can reveal this information, but the experiment requires large samples which are so far incompatible
with diamond anvil cell techniques.

5
� �
����������
����� ���
�������
Figure 1.2: Carbon dioxide phase diagram showing high pressure extended solid phases similar tophases of SiO2. Red and blue arrow represent experimental paths taken in the particular study [Iotaet al., 2007].
� �
Figure 1.3: Melting curves of column I elements under pressure [Gregoryanz et al., 2005].

6
1.2.3 LiBC an example of an MgB2-like superconductor?
The third material we will examine in this study, lithium borocarbide (LiBC) is also in-
teresting because of an important analog: magnesium diboride (MgB2). MgB2, a very simple in-
termetallic, becomes a superconductor with an unexpectedly high critical temperature of 39 K -
much closer to that of the complex perovskite and cuprate ceramics than the conventional super-
conductors. The mechanism for superconductivity in this material, as well as analog systems which
display similar behavior, have been much sought-after. LiBC is one such compound which has been
suggested to be promising.
1.2.4 Lithium compounds under pressure
This research is important because of the potential that the results will provide new in-
sights into the hydrogen systems or MgB2 superconductivity, but also we anticipated that the lithium
compounds would display new behavior under pressure which would be interesting in and of itself.
Li3N’s nitrogen ion is the most highly electronegative that we know of with a charge of 3-, and it
is far from obvious what to expect from it at high pressure, as these highly charged ions are pushed
closer and closer together. Lithium oxide was predicted to undergo a significant structural phase
transition, and LiBC to show an anomalous behavior of the c-axis lattice constant under pressure.
The lithium compounds themselves are also of technological interest; they have potential for hydro-
gen storage and as lithium battery materials, among other things.
We investigate all these predictions of interesting or anomalous behavior in this study
and discover some new properties in the process. Our primary experimental apparatus is the dia-
mond anvil cell, and we employ techniques of x-ray diffraction and spectroscopy performed at 3rd
generation synchrotron sources as well as laser spectroscopy. We perform first-principles density
functional theory calculations to explore the electronic changes occurring over the pressure range
investigated experimentally.
1.2.5 Dissertation outline
The remainder of the dissertation is arranged into five chapters and three appendices. In
chapters two and three, we give a basic introduction to high pressure experimental techniques, and
to the theoretical models used in these studies. Some more detailed analysis procedures will be
covered briefly in appendices. In chapters four, five and six we present work on Li3N, Li2O and
LiBC, respectively. A more extensive review of the literature concerning these materials will be

7
presented in the context of each chapter. This work has been published in the Physical Review
journals [Lazicki et al., 2005, 2006, 2007].

8
Chapter 2
Experimental Methods
2.1 Introduction
2.2 The Diamond Anvil Cell
Diamonds were first used to generate high pressures by Lawson and Tang [Lawson and
Tang, 1950] for x-ray diffraction studies, and the first diamond anvil cell (DAC) was made by Weir
et al. [Weir et al., 1959] for performing infrared spectroscopic measurements. Since then the DAC
has remained the only device for exerting ultra-high static high pressure. The advantages of this
technique are several; diamond is the strongest material we know of, and it is transparent to x-rays
and light so many kinds of measurements as well as laser heating become possible in situ. The
principle is very simple and has not changed, in essentials, since its invention. The DAC apparatus,
pictured in Figure 2.1, consists of a few basic components: a sample mounted between the parallel
faces of a pair of brilliant cut diamonds mounted in a cell made to transfer load to the diamonds, and
a metal gasket encapsulating the sample. Pressure is exerted when the opposing anvils are pushed
together.
2.2.1 Types
Many types of DACs are in existence but I will here describe only the types of cells used
for the experiments in these studies. These LLNL-designed cells are based on the DAC developed
by Mao and Bell [Mao and Bell, 1978] and consist of a piston-cylinder assembly made of hardened
steel. Diamonds are mounted and aligned in the cell on tapering cylindrical tungsten carbide seats.

9
� �
�����
�����
����
�����
� �����
Figure 2.1: Diamond Anvil Cell
In the LLL (for Lawrence Livermore Laboratory) and SAX (for Stress- and Angle-resolved X-
ray diffraction) cells (Figure 2.2), screws tighten the piston and cylinder together and the load is
transferred to the tips of the diamonds. The cells are designed with a wide conical opening such
that emitted x-rays can be collected at a large solid angle; the LLL cell is for experiments in which
emitted x-rays are collected through the back diamond, and the SAX cell for collection at 90◦ from
the incident beam, through an x-ray transparent gasket.
In the membrane DAC (Figure 2.3), a pressure membrane assembly is screwed onto the
DAC, replacing the manual pressure adjusting screws. A metered amount of inert gas is introduced
into a chamber, causing the membrane to expand and tightening the cell. This method is not only
very precise and systematic, but it also allows for remote pressure application. This is a major
advantage when performing synchrotron experiments where the sample must be enclosed inside a
hutch while being exposed to x-rays, and the method allows for much higher quantity and quality
of data than is possible with a manually adjustable cell.
2.2.2 Diamonds
The diamonds used in these experiments are of gem quality and brilliant cut, ranging
from 0.16 to 0.5 carat. Size and cut of the diamonds are very important in determining the pressures
which can be achieved. Since pressure applied to the sample is roughly defined by the relation

10
� �
���
���
�� ��
Figure 2.2: (a) LLL cell (b) SAX cell
� �
Figure 2.3: Membrane Cell

11
� �
�� ��
Figure 2.4: (a) Flat culet (b) Beveled culet
p =F
A, (2.1)
reducing the surface area of the culet will result in significantly higher achievable pressure. How-
ever, at ultra-high pressure, the stress concentration on the edges of the culet limits the amount you
can decrease the culet surface area before it becomes necessary to change the geometry. Mao and
Bell were the first to experiment with a beveled anvil face [Mao and Bell, 1977] (Figure 2.4), and
a finite element stress analysis by Bruno and Dunn [Bruno and Dunn, 1984] determined that the
optimum beveled angle to achieve minimum stress is near 15◦.
Diamond anvils with 500 µm flat culets can generate pressures up to near 35 GPa. 300
µm flats will generate up to ∼80 GPa and 200 µm flats to ∼100 GPa. To achieve higher pressures
beveled diamonds are necessary. Standard sizes are 25-100 µm central flats on a 300-500 µm culet.
The highest pressure one may reasonably expect to reach is 3 Mbar (300 GPa).

12
0 5 10 15 20
0.0
0.2
0.4
0.6
0.8
1.0
rhenium
beryllium
diamond
X-r
ay tr
ansm
issi
on (I
/I 0) at
2.5
mm
Incident energy (keV)
Figure 2.5: X-ray transmission of diamond, Be and Re at the characteristic diamond and gasketthickness of 2.5 mm.
2.2.3 Gasket materials
The gasket is prepared by precompressing a metal foil between the diamonds and drilling
a small hole through the center of the indentation created by the diamond culets. The gasket serves
two basic purposes: it contains the sample and supports the diamonds. Rhenium metal was used
for the gasket material in most of the experiments performed in this study. It is uniquely practical
because of its reasonably high yield strength (preventing the sample from becoming too thin at very
high pressure) and ductility (allowing it to plastically deform upon indentation with the diamonds),
as well as its stability (it maintains the same hexagonal close-packed crystal structure up to 215 GPa
[Vohra et al., 1987].
Re is opaque to x-rays due to its high absorption, and so it becomes inappropriate for
DAC experiments in which emitted x-rays must be measured at 90◦ from the incident x-ray beam or
when the incident or emitted x-rays are of an energy too low to penetrate through the diamond. In
such cases beryllium (which has a lower absorption than diamond - see Figure 2.5) was substituted
for Re in the experiments performed in this study.

13
2.2.4 Loading Techniques
The materials examined here were all in the form of a powder or polycrystalline solid.
In general, when loading a solid sample, it is necessary to place a small piece of the sample in
question into the sample chamber and then fill the remaining space with a pressure medium (a soft
and inert material) so that the bidirectional stress from the diamonds anvils is distributed relatively
homogeneously onto the sample. Inert gases are often used as pressure media, and there are a variety
of techniques that can be used to load these materials into the cell. One method involves loading
the gas by lowering the DAC and gas down to cryogenic temperatures and trapping the condensed
gas in the sample chamber. In this technique, the DAC is contained in an airtight bomb such as the
one shown in Figure 2.6. The cavities inside the bomb are filled with slightly pressurized gas, and
the entire bomb cooled down to the temperature at which the gas will condense by immersing it in
liquid N2 or Argon. The temperature is carefully monitored with a K-type thermocouple placed near
the sample. Wrenches used to open and shut the DAC by loosening and tightening the screws on
the cell are mounted into the bomb through teflon seals. A second loading technique is to pressurize
the inert gas up to near 25,000 psi in a high pressure gas loader and then introduce it into the sample
chamber.
2.2.5 Pressure Media
Choice of pressure medium in an experiment can have a significant effect on quantities
measured. Under non-hydrostatic conditions, a crystal structure may exhibit significantly different
behavior under pressure, to the point that a structural phase transition to an energetically more
stable material may not even occur, or the material may unexpectedly transform to a metastable
strained phase. In addition to inert gasses, other common pressure media include mineral oil or
silicon oil and various alcohol mixtures. Under pressure, all of these materials solidify and the
true hydrostatic limit (the limit under which the material supports no shear stress) is reached at
relatively low pressure. Angel et al. examined the true hydrostatic limit of a variety of commonly
used pressure media in [Angel et al., 2007]. Aside from hydrostaticity, a pressure medium is chosen
based on potential reactivity with the sample under examination, and the possibility of signal from
the pressure medium interfering with data being collected from the sample. In x-ray diffraction
experiments, for example, the pressure medium should not be a much stronger scatterer than the
sample, and the diffraction peaks from the medium should not overlap significantly with peaks
from the sample.

14
� �
������
���� ����
�������
�� ������ ���� ��
Figure 2.6: Cryogenic gas loader

15
690 695 700 705 710 715 720
61 GPa30 GPa0.7 GPa
Inte
nsity
(arb
itrar
y un
its)
Wavelength (nm)
Figure 2.7: Shift of ruby R1 and R2 fluorescence lines for sample of Li2O without pressure medium.
2.2.6 Pressure Standards
Nearly as revolutionary for the field of high pressure as the invention of the DAC itself
was the development of methods for accurately measuring pressure. The calibration by Piermarini
[Piermarini et al., 1975] of the pressure-induced shift in fluorescence lines of ruby (pioneered by
Mao et al. [Mao et al., 1986b]) was particularly significant. The pressure was calibrated from the
known equation of state of NaCl, which was calculated by Decker [Decker, 1965, 1966, 1971] based
on previous dynamic shock measurements.
Ruby is composed of a corundum (Al2O3) lattice with chromium (Cr3+) ions occupying
a percentage of the Al sites. The strong cubic (Oh) symmetry of the crystal splits the degenerate
valence 3d electrons on the chromium into t2g and eg eigenstates. Electronic degeneracies are
further lifted by trigonal distortions of the octahedral Al site, and spin-orbit coupling between the
Cr ion and its d electrons. With a laser one can excite Cr electrons from the ground state to a
higher energy band, from whence they decay nonradiatively to somewhat lower energy states (a
slow process which can be neglected). This is the process of populating states above the ground
state, which then decay radiatively to the ground state, emitting fluorescence which can be detected
with a spectrometer [Eggert et al., 1989]. The electric dipole transitions from the two lowest energy
excited (2E) states to the (4A2) ground state are denoted R1 and R2, and result in a pair of high
intensity fluorescence lines. These states are very sensitive to the separation distance between the

16
ions and thus vary predictably with pressure. The redshift with pressure of the R1 line can be fit to
the empirical formula:
P =A
B
[(λ
λ0
)B
− 1
](2.2)
where A = 1904 and B = 7.665. Sample ruby fluorescence spectra under pressure are shown in
Figure 2.7. The higher intensity peak is the R1 line. The ruby shown was under quasihydro-
static conditions (embedded in a soft solid), and at high pressure, the increasing non-hydrostaticity
broadens and weakens the R lines.
The ruby pressure marker has some problems above 100 GPa, however, as the signal
significantly broadens and weakens, and for high pressure diffraction studies it is preferred to cali-
brate pressure from the known equation of state of materials which may be included in the sample
chamber with the sample. Gold [Anderson et al., 1989] and copper [Nellis et al., 1988] are very
commonly used for this purpose, because of their simple and highly symmetric crystal structures
(leading to few and clearly defined sample peaks) and the stability of their phases up to very high
pressure. Care must be taken in selecting a pressure calibrant of this sort, that the calibrant diffrac-
tion peaks do not overlap the sample peaks too significantly, and that their intensity is not too high.
2.2.7 Electrical measurements in the DAC
Many augmentations to the basic DAC exist. One particularly useful measurement which
can now be performed in situ at high pressure is electrical conductivity. This measurement was first
performed by Mao [Mao and Bell, 1981], by means of carefully placing micron-thin wires or foils of
conducting metal into the sample chamber. This method has some difficulties, however, due to the
tendency for the foils to contact and short across the gasket, and also the impedance that develops in
the wires due to pinching between the diamond and the gasket can result in a faulty measurement.
A relatively recent alternative has been developed which involves embedding the electrical leads
into the diamond, effectively insulating them from the gasket and resolving any impedance issues.
First attempted in 2000 [?], the method involves patterning the leads directly onto the diamond
with standard deposition techniques, and then growing a layer of diamond over the leads using
microwave plasma chemical vapor deposition (CVD) methods [Yan et al., 2002]. The culet is then
polished so that the tips of the leads are exposed, allowing electrical contact with the sample in
question. A disadvantage of this technique is that it precludes the use of any pressure medium, due
to the fact that the sample must make good and firm physical contact with the electrical leads.

17
2.2.8 Resistive heating in the DAC
A further augmentation to the basic DAC setup is including resistive heating capabilities.
These will be here summarized very briefly, as they were not used in these experiments. Some of
the considerations when incorporating a heater into the cell include transference of heat from the
coil heater to the diamond, symmetric heating of the sample, insulation of the diamond from the
DAC seat, and temperature measurement capabilities. The heater itself is made of a wrapped coil of
platinum rhodium (or other metal with high melting temperature) wire, embedded in a ceramic ring,
and mounted so that its position relative to the sample is symmetric. A cylindrical copper ring or
layer of ceramic epoxy is fitted around the diamond which bridges the space between the diamond
and the ceramic heater so heat is transferred directly to the diamond. Thin sheets of mica insulate
the diamond seats from the rest of the cell, and a thermocouple is placed as near to the tip of the
diamond as possible. For higher temperatures and more stable heating, it is also possible to build
a smaller heater around the second diamond. The heating is performed inside a vacuum jacket to
prevent the diamond from oxidizing at high temperature. Temperatures up to 1000 K are relatively
easily achievable with this setup, and can be maintained stably for days.
2.3 Diagnostics
One of the primary advantages to the DAC is that the transparency of the diamonds makes
it possible to diagnose the changes which are occurring under pressure. Diffraction and various laser
and x-ray spectroscopies allow access to structural, electronic and vibrational information in situ.
2.3.1 Synchrotron methods
The first and most powerful experimental techniques we will discuss involve a synchrotron
light source, so we will first provide a brief summary of synchrotron radiation and how it is produced
and utilized for our purposes.
Synchrotron physics
Synchrotron radiation is defined as the light emitted by a charged particle following a
curved trajectory. This radiation was first observed being emitted from a particle accelerator called
a synchrotron in 1948: hence the name ’synchrotron radiation’. This is a natural phenomenon that
is observed by astronomers, and it is a byproduct of any particle accelerator. The technique for

18
� �
��������
Figure 2.8: Advanced Photon Source (APS): third generation synchrotron source used for most ofthe studies reported here.
producing synchrotron radiation involves generating electric charge, accelerating it by high voltage
alternating current fields to high energies and injecting it into a storage ring where charge is accu-
mulated and maintained in a fixed orbit at a particular (relativistic) speed by electromagnets (called
bending magnets). As the electrons change direction around the ring (a form of acceleration), they
emit high energy radiation in a direction tangent to their trajectory.
The first generation synchrotron sources were made for other research programs such as
high energy physics, and the radiation was parasitic. Second generation sources were designed
specifically to produce synchrotron radiation, but they had relatively low emittance. Third gener-
ation (currently state-of-the-art) facilities are designed to produce synchrotron radiation, and are
optimized for experiments by the addition of many insertion devices. These devices are inserted
into straight sections (between the bending magnets) along the storage ring for the purpose of pro-
ducing directional and very high intensity radiation. The device is made up of a series of magnets
of alternating polarity which produce a periodic magnetic field. The relativistic electrons moving
through this field experience transverse acceleration, causing them to emit radiation which is super-
imposed coherently or incoherently, and the resulting x-ray beam is much more intense than that
emitted from the bending magnets alone. Two types of insertion devices exist: the undulator and the
wiggler, of which the wiggler produces a wider range of energies and the undulator has much higher
brilliance (a measure of the number of photons per second in a narrow energy bandwidth per unit

19
� �
Figure 2.9: APS sector 16 insertion device beamline optical train.
solid angle). Other characteristics of synchrotron radiation include high collimation (small angular
divergence), low emittance (a measure of the parallelism of the beam in position-momentum space.)
and high polarization.
High pressure beamline overview
Some efforts are necessary to optimize a synchrotron beamline for high pressure experi-
ments. A very tight focus (in the range of 10x10 µm or smaller) of the x-ray beam onto the sample
is ideal because of the small sample sizes, because of the need to minimize the effects of pressure
gradients across the sample, and for the purpose of avoiding contamination from the gasket material
which lies close to the sample on all sides.
X-ray optics differ somewhat from beamline to beamline. At sector 16 of the APS (Figure

20
� �
����
Θ
2Θ
Figure 2.10: X-ray scattering off of a crystal lattice.
2.8, where most experiments in this study were performed), for example, the x-ray beam is first cut
down with a pair of slits and then passed through a diamond branching x-ray monochromator which
splits the incident undulator beam using two diamond crystals into a white beam and a parallel and
separate monochromatic beam. For x-ray diffraction, a Si (220) single crystal monochromator fur-
ther monochromates the beam and a pair of Kirkpatrick-Baez (KB) mirrors focus the 500x500 µm
monochromatic beam down to a (ideally) 5x7 µm spot size at the sample. A slit just upstream from
the sample cuts down tails on the x-ray beam which may contribute to unwanted scattering from the
gasket. (A schematic of the optical train at sector 16 is shown in Figure 2.9.) DAC experiments
require hard x-rays ( 10 keV) to penetrate through the diamond, unless the experimental geome-
try and gasket material chosen allow for the incident beam to pass through the gasket. Because of
the necessarily small sample size, a high photon flux (high brilliance) and very sensitive detection
system are imperative.
X-ray Diffraction
X-ray diffraction (XRD) experiments are conducted for the purpose of determining crystal
structure. X-ray radiation is scattered off of the atoms in a crystal because it has a wavelength range
that is of the same order of magnitude as the atomic spacing. The lattice planes of crystals reflect
x-ray beams at certain angles of incidence which were first described in 1913 by Bragg’s Law:

21
� �
�Θ
Figure 2.11: Powder x-ray diffraction rings with integrated 2-dimensional spectrum.
nλ = 2dsinΘ. (2.3)
λ is the wavelength of the incident x-ray beam, Θ is its angle of incidence, and d is the spacing
between atomic layers in the crystal (Figure 2.10). The law states that the x-ray beams reflected
from neighboring parallel crystal planes at a certain separation distance will emerge perfectly in
phase (their path length difference will be an integer number of wavelengths), resulting in a very
intense reflection at a certain angle. The intensity of that reflection will be related to the charge
density on the atoms which scattered it, described by this relation:
I(~q) ∝ |∫
d3rei~q·~rρ(~r)|2 (2.4)
where ρ is the charge density and ~q = ( ~kf − ~ki), (Figure 2.10). Therefore, the lattice
parameters of a particular structure are known from the angular position of the x-ray diffraction
peaks, and the atom positions within the crystal lattice can be determined from the relative intensities
of these peaks.
XRD can be performed on single-crystal or powder samples, and the method is slightly
different for each. In the case of a single-crystal, placing the sample in the x-ray beam at a certain
orientation will result in reflections from only a subset of the relevant crystal lattice planes. To
22
� �
��
��������
�� ���������
�����������
��������
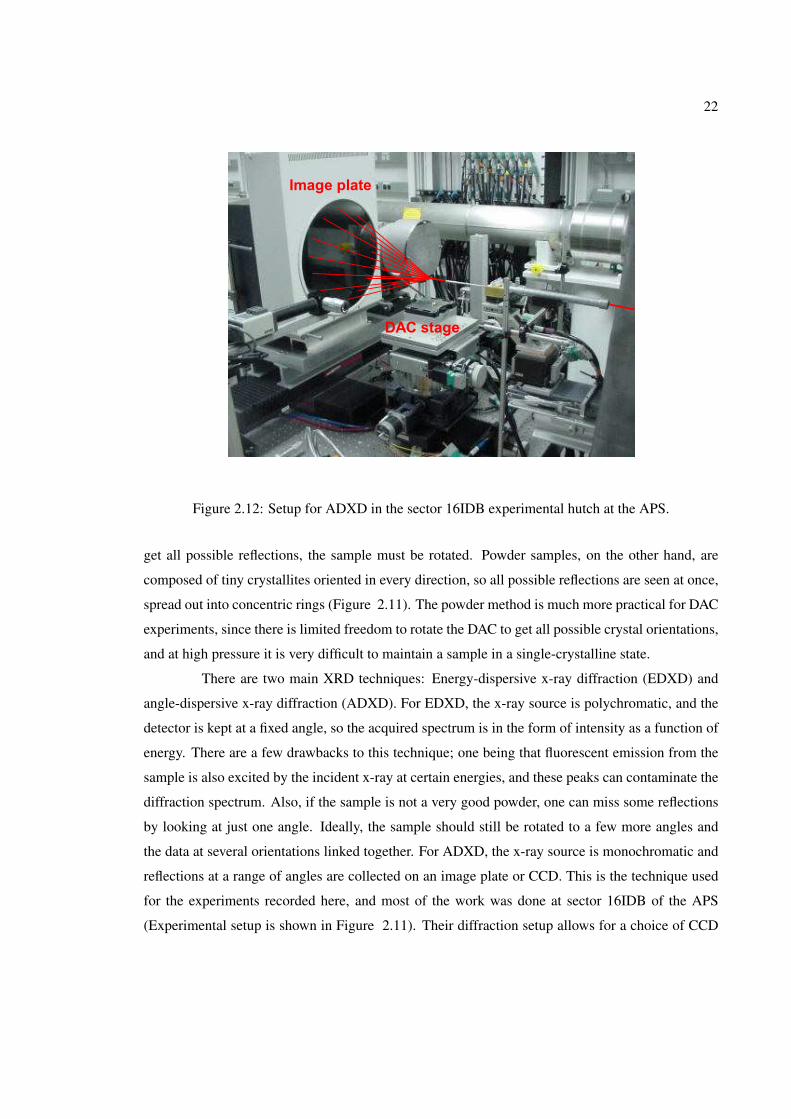
Figure 2.12: Setup for ADXD in the sector 16IDB experimental hutch at the APS.
get all possible reflections, the sample must be rotated. Powder samples, on the other hand, are
composed of tiny crystallites oriented in every direction, so all possible reflections are seen at once,
spread out into concentric rings (Figure 2.11). The powder method is much more practical for DAC
experiments, since there is limited freedom to rotate the DAC to get all possible crystal orientations,
and at high pressure it is very difficult to maintain a sample in a single-crystalline state.
There are two main XRD techniques: Energy-dispersive x-ray diffraction (EDXD) and
angle-dispersive x-ray diffraction (ADXD). For EDXD, the x-ray source is polychromatic, and the
detector is kept at a fixed angle, so the acquired spectrum is in the form of intensity as a function of
energy. There are a few drawbacks to this technique; one being that fluorescent emission from the
sample is also excited by the incident x-ray at certain energies, and these peaks can contaminate the
diffraction spectrum. Also, if the sample is not a very good powder, one can miss some reflections
by looking at just one angle. Ideally, the sample should still be rotated to a few more angles and
the data at several orientations linked together. For ADXD, the x-ray source is monochromatic and
reflections at a range of angles are collected on an image plate or CCD. This is the technique used
for the experiments recorded here, and most of the work was done at sector 16IDB of the APS
(Experimental setup is shown in Figure 2.11). Their diffraction setup allows for a choice of CCD

23
5 10 15 20
2
-Li3N measured
-Li3N calculated
difference
Figure 2.13: Rietveld refined powder XRD pattern.
(MAR165 - best for fast data collection because of rapid readout time of collected image) or image
plate (MAR345 - best for high resolution, and used in all the studies presented here). The MAR 345
collection and readout mechanism is proprietary, but the basic physics of an image plate involves
the ionization of ions (such as Eu2+→Eu3+) distributed spatially across the image plate by the
diffracted x-ray photon. The excited electron is then captured in an F center (a small vacancy defect
in an ionic crystal) manufactured intentionally into the image plate. The electron will remain in the
trap until the image plate is irradiated with a low-energy laser (a process called photon stimulated
luminescence). The recombination of the electron will cause a photon to be emitted, which is then
collected in a photomultiplier tube. The intensity of the emitted photon is directly proportional to
the intensity of diffracted x-rays.
If the structure is known, the ideal diffraction pattern can be calculated exactly. Deviations
in the experimental data from the exact pattern (relative intensities, peak shape, peak position) are
related to such effects as: beam characteristics, experimental setup, size and preferred orientation
of crystallites within the sample, small distortions or less-than full occupation of a particular atomic
site, or thermal effects. Rietveld first proposed in 1967 that, if it is possible to include these effects
in the calculation of the profile, one can optimize the fit between the measured and computed pattern
[Rietveld, 1967, 1969]. In this way, the crystal structure and additional effects can be determined
very well, even for profiles with strongly overlapping peaks. An x-ray diffraction pattern along with
its Rietveld-refined calculated spectrum and the difference between the two are shown in Figure
2.13, with hkl reflections originating from two separate phases labeled.

24
X-ray Spectroscopy
X-ray spectroscopy is the measurement of the interaction between x-ray radiation and
matter. It can be classified in terms of different interaction types: absorption, emission, and scat-
tering. In an absorption process, an incident x-ray with energy equal to the binding energy of some
core electron in a solid is absorbed, and the electron is excited to an unoccupied energy level (a
photoelectron is produced). Therefore, as an x-ray beam moves through a material, its intensity will
be reduced by absorption according to the Beer-Lambert Law:
ln(I0/I) ∝ µd (2.5)
where µ corresponds to the linear absorption coefficient unique to the material and d is the thickness
of the material penetrated by the x-ray. The absorption coefficient as a function of incident x-ray
energy is the quantity measured in the x-ray absorption experiment. At the energies corresponding
to an electronic transition to an unoccupied state, there will be a sharp increase in absorption. Also,
the photoelectron created in this absorption process backscatters off of surrounding atoms and the
resulting waves interfere constructively and destructively, giving a unique shape to the absorption
edge which is related to the local structure of the material. The measured quantity (as an alternative
to µ) can also be electron yield or fluorescence yield, which involves measuring the number of auger
electrons or photons ejected during the decay of the core hole created in the absorption process, as
a function of energy of incident beam. The absorption spectrum reveals features of the low-energy
conduction states which are involved in these transitions.
In an emission process, the incident x-ray excites a hole in an occupied energy level, and
an electron from a higher-energy occupied state decays to fill the hole, emitting photons of energy
corresponding to that transition. The emitted photons are collected, revealing the density of higher
energy occupied states (upper valence bands) involved in these transitions.
Scattering interactions are those in which the incoming x-ray beam is scattered off of the
atoms in the material and redirected, with or without loss of energy. The scattering process is much
quicker than absorption or emission. X-ray Diffraction, for example, is a purely elastic (no energy
loss) scattering process.
Spectroscopy inside the DAC has some more complications than the same procedure per-
formed in the conventional manner because of the containment of the sample. The incident and
collected radiation must have a high enough energy to penetrate either the diamond or the gasket
in order to reach the sample. In a conventional x-ray absorption experiment, for example, the in-

25
� �
��
��������
�� ���������
�������
�����
�������
�� �
�
�������
�������
��
���������� ���
���������
Figure 2.14: X-ray Raman Process compared to X-ray Absorption.
cident energy is scanned around the absorption edge which, for the K-edges (1s core excitation)
of the low-Z materials under examination in these experiments, is in the range of 200-600 eV. The
absorption of a material such as diamond increases as photon energy decreases and, at this energy,
the x-ray cannot penetrate through a 2.5 mm diamond, or even through a beryllium gasket (which
has a lower absorption than diamond). Therefore, other techniques must be developed to probe the
K-edges. One such method which is relatively new is called x-ray Raman spectroscopy (XRS). This
technique involves an excitation of the core electrons by very high energy x-rays (on the order of
10 keV, which can easily penetrate the beryllium gasket). The electron is excited into the contin-
uum and then decays to the low-lying conduction states, emitting a photon in the process which
has energy lower than the incident x-ray by exactly the binding energy of the 1s core electron. By
subtracting the energy of the emitted beam from that of the incident, one can probe the same states
probed with x-ray absorption (Figure 2.14). Because of the high energy of the incident beam, how-
ever, sometimes in the measured spectra one can see excitonic effects and transitions to states not
allowed under the dipole approximation, which are not evident in the x-ray absorption.
The XRS setup at sector 16 IDD of the APS (where the work shown in this study was
performed) is pictured in Figure 2.15. This experiment involves monochromatic incident x-rays
focused onto the sample (which is mounted such that incident and scattered x-rays go through the
gasket) by a pair of Kirkpatrick-Baez focusing mirrors.

26
� �
�����
������
�� �����������
Figure 2.15: APS sector 16 (HPCAT) beamline IDD XRS experimental setup.
The scattered x-ray raman signal is extremely weak and so the geometry and analyzers
must be optimized for high energy resolution and high sensitivity. Perfectly oriented crystals must
be used in place of conventional mirrors for almost 100% reflectivity. In the Rowland circle geom-
etry, the source, analyzers and detectors are all located along on a circle of radius R (shown in red
in Figure 2.15). The radius of this circle is specially chosen so that all wavelength x-rays will be
Bragg reflected off of the single-crystal analyzer back to a single point. All sources will be mapped
1:1 onto the detector, if the analyzers are spherically bent at radius R. Because of the extreme me-
chanical difficulty of bending single crystals, they are here made with radius 2R, which introduces
a small aberration (which, however, is smaller than the overall energy resolution of the system).
Our analyzers are made from Si(660) single crystals (each 50 mm in diameter), mounted on a 870
mm Rowland circle and collecting over an angle of 25◦. The detector is in a nearly back scattering
geometry (Bragg angle of 88.6◦. The overall system provides an energy resolution of ∼1 eV.
2.3.2 Optical Spectroscopy
Raman spectroscopy (first reported by C. V. Raman [Raman and Krishnan, 1928]) is an
inelastic scattering spectroscopy measurement for which the exciting radiation comes from a laser.

27
� �
��
��������
�� ���������
��������
����
�����
����������
����
������
�� ����� �������
����
���
�������
����
�� ��
∆ ������ � ��
∆ ���− |∆ ����
���
�����
Figure 2.16: Raman process and resulting spectrum type.
The energies of the incident beam are sufficient to excite vibrations or rotations of the atoms or
molecules in the solid around their equilibrium positions. Every periodic solid has a certain set
of possible vibrations or rotations that can be excited, which are related to the symmetry of the
crystal. Group theory analysis will reveal which movements are allowed within a particular space
group (see Appendix 1). Some subset of these will cause the molecule (or the electron cloud around
the atom) to change polarizability. Such vibrations or rotations will give rise to the Raman effect
(summarized in Figure 2.16). The incident photon (if it is not scattered elastically - Rayleigh
scattering) will excite the atom or molecule to a virtual energy state (which is lower in energy than
the lowest unoccupied electronic state), immediately followed by de-excitation and emission of a
photon. In the case of Stoke’s Raman, the emitted photon is of lower energy than the incident;
the energy difference being equal to the energy of the particular vibration or rotation excited in the
solid. If the atom or molecule is already in an excited vibrational state (thermally, for example),
Anti-Stokes Raman, where the emitted photon is of a higher energy than the incident, is possible.
The intensity of emitted photons is plotted as a function of wavelength shift from the
elastic line (corresponding to an energy shift), which is measured in units of wavenumber ν (cm−1):

28
ν =1
λincident− 1
λscattered(2.6)
The wavenumber of each observed peak gives the energy (∆E = hcν) of a particular vibration or
rotation, and the intensity is directly related to the degree of polarizability. It is relatively difficult
to positively identify the origin of a particular phonon mode if the sample is not an oriented single-
crystal, but changes in the phonon modes under pressure can give positive indication of a structural
phase transition occurring. Also the frequencies of the vibrational modes will change as a function
of pressure, and their shift can reveal information about the compressibility and stability of the
material.
In order to perform this experiment, a monochromatic light source is needed (a laser),
various optics for collimating and focusing the laser light onto the sample, and various post-sample
optics for filtering out the very strongly scattered Rayleigh line and for focusing the scattered signal
into the spectrometer. The spectrometer contains a diffraction grating, which separates the scattered
light spatially into a spectrum of wavelengths. This spectrum is then exposed on the chip of a ccd
camera. Photons build up on the pixels of the chip during collection time and are read in a plot of
intensity as a function of wavenumber.
The Raman setup used in this study is shown in Figure 2.17 [Maddox, 2006]. We utilize
an Argon-Ion laser which produces high intensity light of 488 and 514 nm wavelength (the wave-
length can be varied over a wide range of wavelength, however, with some loss of intensity). The
laser beam is expanded before it is focused onto the sample (in order to achieve a smaller focal
point), and scattered photons are collected at 180◦ backscattering. We use a holographic band pass
filter to direct the monochromatic laser light down the axis of the DAC, and it allows all scattered
light (of other wavelengths) to pass through. We collect raman shifted photons with an HR460 single
spectrometer (’single’ referring to the number of dispersive elements - in our case one holographic
grating blazed at 500 nm), and a liquid-N2 cooled ccd (Princeton Instruments).

29
� �
��������
Figure 2.17: Raman spectrometer used in this study: optics and holographic bandpass filter detail.The bandpass filter allows the laser beam to be directed down the axis of the DAC, and also partiallyfilters out the Rayleigh scattering. [Maddox, 2006]

30
Chapter 3
Computational Methods
3.1 Usefulness and relevance to high pressure physics
3.2 Basic principles
3.2.1 Density functional theory
The basic problem faced in attempting to model a solid for the purpose of predicting or
investigating its properties is how to solve the equations of motion for all the electrons and all the
ions in the solid. To apply standard equations of motion to each one would mean solving on the
order of 1023 simultaneous differential equations. And these electrons are not just isolated single
particles; they interact with one another in various ways, and with the ions in the crystal. Hartree was
one of the first to attempt to solve this problem - by modeling the wavefunction of the entire system
of electrons as a simple sum of noninteracting single-particle wavefunctions, each in an effective
potential [Hartree, 1928]. He then solved the Hamiltonian (many particle Schodinger equation)
self-consistently. This yielded relatively poor results because it neglected to take into account the
Pauli exclusion principle. Hartree and Fock [Fock, 1930] modified the single-particle wavefunctions
by making them all antisymmetric (thus taking into account Pauli exclusion) but still the results
were not good because the Coulomb interactions between electrons (electron correlations) were not
adequately addressed. Since then various improvements have been made on this approach and it now
yields very precise results for very small systems. Unfortunately, the many particle wavefunction
for systems with 10 or more atoms remains impossible to calculate or even record because of the
sheer number of parameters required to express it exactly.

31
3.2.2 The Kohn-Sham Equation
Hohenberg and Kohn [Hohenberg and Kohn, 1964] were the first to indicate that the
many-electron wavefunction was not the best starting point for solving this sort of problem and
claimed instead that the electron density should be the fundamental variable (actually first suggested
by Thomas and Fermi in 1927 [Thomas, 1927, Fermi, 1927]). Hohenberg and Kohn demonstrated
that there is a one-to-one mapping between the ground state electron density and the ground state
wavefunction of the many-particle system, and that the ground state density of electrons in some
external potential uniquely determines this potential. Using the variational principle (which states
that the the ground state of the system is the one in which energy is minimized), Kohn and Sham
[Kohn and Sham, 1965] formulated a set of self-consistent equations (now called the Kohn-Sham
equations) from which the minimizing electron density n(r) can be found:
(−12∇2 + veff (r)− εjk)ϕjk(r) = 0, (3.1)
with
n(r) =∑
j,k
njk(r)|ϕjk(r)|2, (3.2)
veff (r) = v(r) +∫
n(r′)|r − r′|dr′ + vxc(r), (3.3)
Equation (3.1) is the Schrodinger equation with energy eigenvalues εjk and eigenfunctions (wave-
functions) ϕjk(r). veff includes the potential due to the ions (positions assumed fixed), the Coulomb
interactions between electrons at positions r and r′, and the local exchange correlation potential, vxc,
which includes all many-particle interactions. The densities njk(r) here are a function of position
r and also spin but, for simplicity, are written here as a function of position only. The total ground
state energy is then given by:
E =∑
j
εj + Exc[n(r)]−∫
vxc(r)n(r)dv − 12
∫n(r)n(r′)|r − r′| . (3.4)
Starting with an initial approximation for n(r), one can construct veff , solve for ϕj ,
and recalculate n(r) from Equation (3.2). If the recalculated n(r) is not the same as the original
approximation, the process is iterated until it is. For further information, the reader is referred to
references [Kohn and Sham, 1965, Kohn, 1999], on which much of this discussion is based.

32
� �
Figure 3.1: Muffin Tin approximation
3.2.3 Exchange correlation energy functional approximations
The major approximation made in DFT is the form of the exchange correlation energy
Exc; all other energy terms are, in principle, exact. The simplest form proposed is called the local
density approximation (LDA), where Exc is an integral over local exchange correlation energies
which are simply those of a uniform electron gas. In spite of the apparent inaccuracy of this as-
sumption, the LDA actually yields remarkably good results. It only really obviously fails in the
case of systems which are dominated by electron-electron interactions. Some smaller inaccuracies
in the LDA are corrected by the popular generalized gradient approximation (GGA). Where LDA
is a functional of the electron density only, the GGA includes the electron density and its gradient
at every point. With these approximations, DFT yields quite good results for energy density, total
energy and eigenvalues (energy bands) in many systems. It has a few shortcomings; one example is
its consistent underestimation of semiconductor band gaps.
3.2.4 Methods for solving the Kohn-Sham equations.
DFT would still be computationally intractable for most systems unless an appropriate
basis set (form for ϕi, equation 2.2) is established first. Such a basis must be adaptable to the
particular system being addressed, and be mathematically as simple as possible. LAPW (linearized
augmented plane wave) and pseudopotential methods are some of the most common, and we will

33
� �
Figure 3.2: APW and LAPW wavefuntions across the muffin tin boundary (for p-like wave in iron)[Schwarz et al., 2002]
also discuss a more recent FPLO (full potential local orbital) formulation which forms the basis for
one of the codes used in this study.
APW
The LAPW method is an augmentation of the original APW method [Slater, 1937], in
which the space within the crystal is divided into parts which are described by different basis ex-
pansions. The interstitial region is modeled with plane waves (solutions to Schrodinger’s equation in
a constant potential) and non-overlapping spherical regions (of variable radii) centered on each atom
are modeled with a more complex and atom-like linear combination of radial functions times spher-
ical harmonics (solutions within a spherical potential). The assumption that the potential (which
is in actual fact continuously varying) can be described by these two distinct potentials is called
the muffin tin approximation. The (energy dependent) APW solution inside the muffin tin must be
continuous with the (energy independent) plane wave solution in the interstitial at the muffin tin
boundary. Unfortunately, this means that a different set of APW basis functions must be found for
every eigenenergy, making this method too challenging numerically for any large systems.

34
LAPW
The linearized APW (LAPW) method [Andersen, 1975] solves this problem by creating
energy-independent solutions inside the muffin tins, which are composed of a sum of a solution at
a particular linearization energy, and the energy derivative of that solution at the same energy. This
basis is flexible enough that all eigenenergies in the region of the linearization energy can be found
from the secular equation with a single diagonalization. The resulting wavefunction is smooth and
differentiable across the muffin-tin boundary. Unfortunately, the required size of the basis set for
the LAPW method is larger than for APW, so this is not yet the most efficient method. Also, the
LAPW’s do not treat well states that are far away from the linearization energy, so the LAPW’s
must be supplemented with local orbitals (called LO’s [Singh, 1991]) at energies closer to that of
the outlying states, with the condition that their value and derivative must be zero at the muffin tin
boundary.
APW+lo
In the code employed for most calculations in this study (WIEN2k [Blaha et al., 2001]), a
highly efficient mixed basis is used which combines LAPW+LO with yet another approach (called
APW+lo), based on the method proposed by Sjostedt et al. [Sjostedt et al., 2000], which combines
the best features of APW and LAPW. It has the APW small basis set (by not requiring the basis
functions to be differentiable at the muffin tin boundary) but includes the energy-independence and
flexibility of the LAPW by adding a local orbital (lo) function of composition similar to the muffin-
tin solutions in the LAPW scheme. However, in this case the energy derivative part of the lo is
not included in every solution but only for a few ’physically important’ quantum numbers. In the
minimum basis scheme, APW+lo is used for any states that are particularily difficult to converge,
and LAPW+LO for all others.
Pseudopotentials
If one were to attempt to construct a basis for the entire crystal from plane waves, the
size of the basis would have to be enormous because of the fact that, near the fixed ions, the correct
wavefunction solution would oscillate very rapidly and become very complex because of the strong
potentials and the required condition of orthogonality between different quantum-number atomic
states. The pseudopotential approximation models the system with planewaves but, within a certain
radius r from the atom sites, the deep atomic potential is replaced by a much simpler pseudopoten-

35
� �
Figure 3.3: Comparison between real and pseudo- potentials and wavefunctions.
tial. This approximation is usually good because of the fact that the core and semicore states are
relatively unaffected by the crystal environment and do not contribute to the atomic interactions in
the crystal. We only need to treat carefully the valence states. Therefore a very general pseudopo-
tential can be constructed for each atomic species which takes into account the effects of the nucleus
and core electrons and results in a greatly simplified pseudowavefunction near the core, significantly
reducing the total number of plane waves needed to represent the wavefunction.
Full potential local orbital
A more recent full potential scheme was formulated to try to get the accuracy of the full
potential LAPW but with a much greater efficiency by introducing a basis that is readjusted at
every iteration cycle of the calculation [Koepernik and Eschrig, 1999]. In this model (which has
historical roots in the LCAO model), the crystal wavefunctions are formed in real space as a linear
combination of nonorthogonal atomic orbital-like basis functions centered at each atom. The core
states are calculated based on a spherical potential centered at each atom, while the valence states
(the number of states to be treated as valence is selected by the user) are subjected to an additional
confining potential, which compresses the long-ranging valence orbitals. The form of this confining
potential includes a set of dimensionless compression parameters whose values have an effect on

36
the total energy only as long as the basis set is incomplete. At each iteration, the total energy is
minimized with respect to the compression parameters, which are also recalculated at each step in
the iteration. The basis set is adapted to the best set of parameters at each step and, once a complete
basis set has been reached, the energy is at a minimum and the compression parameter values no
longer matter. This process turns out to converge on a solution very rapidly and efficiently, and the
total energy results from this code agree with the Wien2k code [Blaha et al., 2001] within chemical
accuracy. This code was used as well as Wien2k in one of the studies, to check the results at
ultra-high volume reduction for consistency.
3.3 Deriving physically relevant properties of materials
3.3.1 Bandstructure
The augmented plane waves needed to represent the entire crystal are indexed by their
momentum (wavevector) k. In momentum space, each wavefunction then can be represented by a
single k-point in an array of points. Just as the real-space periodic crystal can be fully represented
by its smallest non-repeating unit cell, symmetry allows the array in momentum space to be reduced
to a smaller unit called the Brillouin zone, wherein every wavevector which falls outside that zone
can be mapped back into it by a fixed translation K in momentum space (analogous to the real-space
lattice parameter). The Kohn-Sham equation represents an eigenvalue problem whose solutions (εk,
from Equation (3.1)) give the energy corresponding to each wavevector. Ideally, one would sum
an infinite number of wavefunctions (solve the Kohn-Sham equation over an infinite number of k-
points in the Brillouin zone) in order to perfectly describe the crystal. This is of course unfeasible
but it turns out that, as a result of symmetry, the eigenvalues in many regions in k-space are similar
and it is only necessary to calculate them on a finite sized grid of k-points (with the particular grid
carefully chosen to properly sample the momentum space), and the remaining values in k-space are
determined by interpolation. The important details of the electronic structure can generally be fully
captured by plotting the energies as a function of k along certain high-symmetry directions in the
Brillouin zone. The plot of the eigenvalues as a function of k forms a set of energy bands. Each
band corresponds to a different electronic or molecular orbital state, and their position, dispersion,
and interaction with other energy bands reveal important information about the overall electronic
properties of a material.

37
� �
����������������
�
Figure 3.4: Electronic band structure for cubic Li3N and the corresponding density of states.

38
3.3.2 Density of states and absorption spectra
Only certain wavefunction solutions can represent the electronic states of the crystal:
those that are solutions to the Schrodinger equation, with the appropriate boundary conditions. The
number of possible solutions at a particular energy is found by integrating over all of k-space. The
continuous spectrum of number of states as a function energy is called the density of states (in units
of number of electronic states per unit energy per unit volume). There are many techniques for per-
forming the Brillouin-zone integration involved in determining this value. In Wien2k, the improved
tetrahedron method [Blochl et al., 1994] is used, which splits the irreducible portion of reciprocal
space into smaller cubes or parallelpipeds topologically like cubes, which are subsequently each
split into 6 equal-volume tetrahedral regions (carefully arranged from knowledge of the particular
space group symmetry so that the k-points are properly weighted). The eigenvalues and eigen-
vectors are solved for at the four corners of each tetrahedron and linearly interpolated elsewhere,
and integration over each tetrahedron can be calculated from a weighted sum over the irreducible k
points. The resultant plot gives the occupation of each band in the bandstructure.
In addition to the total DOS, it is possible to calculate partial or projected density of states
(p-DOS) - the contributions to the density of states (or energy bands) by individual atoms and, within
the atomic spheres, by individual orbital-like states. In spin polarized calculations, the contributions
from up- and down-spin electrons are also calculated separately.
X-ray spectra can also be calculated based on the density of states. The formalism was
developed by Neckel et al. [Neckel et al., 1975] In Wien2k, emission and absorption edges can
be simulated for dipole allowed transitions from L to L+1 or L-1 states. The p-DOS of L+1 and
L-1 are generated and then multiplied by a radial transition probability and the transition matrix
elements. The calculated spectra are lorentz-broadened to simulate effects of lifetime broadening
and spectrometer resolution.
3.3.3 Equation of state and structural stability
The solution of the density functional equation is the total energy for the entire crystal,
and the lowest-energy solution corresponds to the ground state charge density and energy for any
particular crystal structure. When modeling a particular system’s behavior under pressure, one
can manually compress the lattice parameters and calculate total energy at each volume, thereby
generating an equation of state which may be compared to experimental data. When the crystal
structure being compressed is purely isotropic, pressure can be simulated by simply decreasing all

39
lattice parameters proportionately. However, when the material is structurally anisotropic, a lattice
parameter ’relaxation’ must be performed at each volume, in which the total energy is calculated for
a variety of lattice parameter ratios and the minimum energy configuration is chosen. The equation
of state data (energy as a function of volume) can be fit with one of several possible functions which
have been developed, the most common being the Birch-Murnaghan [Birch, 1947]:
E(V ) = E0 +98B0V0
[(V0
V
) 23
− 1
]2 {1 +
(B′ − 4
2
)[(V0
V
) 23
− 1
]}. (3.5)
Alternatives include the Murnaghan [Murnaghan, 1944]:
E(V ) = E0 +V B0
B′
[(V0/V )B′
B′ − 1+ 1
], (3.6)
and Vinet [Vinet et al., 1986]:
E(V ) = E0 − 4B0V0
(B′ − 1)2
{1− 3
2(B′ − 1)
[1−
(V
V0
) 13
]}exp
{32(B′ − 1)
[1−
(V
V0
) 13
]}
(3.7)
where E0 represents the total energy at ambient conditions, B0 the ambient pressure bulk modulus,
where
B0 = −V0
∣∣∣∣∂P
∂V
∣∣∣∣V =V0
(3.8)
and is a representation of the compressibility of a material and B′ the pressure derivative of the bulk
modulus.
When there are two competing structural phases, a calculation of the total energy of each
will indicate which is indeed stable. It is therefore possible to predict the volume at which a struc-
tural phase transition will occur by generating an equation of state for each phase and determining
where they reach free energy equilibrium. The Gibb’s Free energy for a material is given by:
G(T, p) = U + pV − TS (3.9)
where U is the total internal energy (the solution to the Kohn-Sham equation), p and V are pressure
and volume, T is temperature and S is entropy. The last term may be ignored in the calculations
performed in this study, however, as all are zero-temperature calculations. The phase transition is
predicted to occur at the crossover between the free energy curves for the two phases.

40
5 6 7 8 9 10 11 12
-526.4
-526.2
-526.0
-525.8
-525.6
-525.4
36 38 40 42-524.8
-524.7
-524.6P
T
V0
E0
Tota
l ene
rgy
(eV
/ato
m)
volume (A3/atom)
Gib
b's
Free
Ene
rgy
(eV
/ato
m)
Pressure (GPa)
Figure 3.5: Equation of state curves for two structural phases (of Li3N). The slope of the line drawntangent to both EOS curves gives the transition pressure. In the inset are the intersecting Gibb’s freeenergy curves for these phases.

41
Chapter 4
Structural and Electronic changes in
ionic solid lithium nitride by diffraction,
spectroscopy and first-principles DFT
4.1 Introduction
4.1.1 Chemical bonding
Nitrogen can form compounds with elements from almost every column in the periodic
table, with chemical bonding ranging from covalent to ionic to metallic. There is, in fact, no such
thing as a purely ionic or covalent bond however, and all of these N compounds contain a combi-
nation of these bonding types. The driving principle behind the formation of a particular type of
bond is, in general, the increased stability of an atom with a completely filled electronic shell. In
an ionic bond, two particular (different) atomic species can attain filled shells by exchanging one or
more electrons, resulting in a pair of ions called a cation (positively charged) and anion (negatively
charged). The Coulomb attraction between these oppositely charged ions is what constitutes the
bond. As the ions get sufficiently close that their electron clouds begin to overlap, however, the
interionic forces become strongly repulsive as a result of Pauli’s exclusion principle; filled elec-
tron shells cannot accommodate additional electrons. The interionic distance at which the attractive
and repulsive forces balance out is the equilibrium (minimum total energy) atomic separation in
the crystal. Additionally, the arrangement of ions within a crystal lattice will tend to be such that
the coulomb forces between ions will be smallest and most isotropic. As pressure is increased and

42
� �
�� �� ��
Figure 4.1: Illustration of an ionic bond (a), a polar covalent bond (b) and a nonpolar covalent bond(c) [McMurry and Fay, 2004].
ions are forcibly pushed together, the total energy of the system increases, and at a certain point,
the ions in the crystal will generally reorient themselves in such a way as to reduce the interionic
forces (and, thus, the total energy) by increasing coordination number or distance between ions of
like charge. This is the simplest picture of the pressure-induced structural phase transition. Phase
transitions may be prompted by other more subtle election-correlation effects, but for the purpose
of this study, this the most important one to understand. As already noted, however, a purely ionic
bond never actually occurs. In real solids there will always be a non-negligible amount of shared or
delocalized charge (Figure 4.1 is a more realistic picture of an ionic bond). However, the simple
model put forth here, which treats the ionic crystal purely as a collection of point charges or charged
rigid spheres with solely electrostatic interactions, has yielded surprisingly accurate predictions of
the properties of ionic solids.
The covalent bond is formed when a pair of atoms can achieve a filled electronic shell by
’sharing’ one or several electrons. The shared electron will occupy the region of space between the
two ions (which under normal circumstances would repel each other), attracting each ion to itself
and, thus, each ion to the other. If the attractive force is strong enough, a stable covalent ’bond’ will
be formed (Figure 4.1). If the two atoms involved in the bond are of the same species (for example
N2), their attraction for electrons (electronegativites) will be identical, and thus the shared electrons
(3, for N2) will occupy the space between the atoms uniformally (or, one may say that the shared
electrons will spend an equal amount of time bound to each atom). If, however, the atoms are of
different species, the electrons will be displaced towards the atom with a higher electonegativity,
forming a polar bond which is a combination of covalent and ionic, and can be described by the
percentage of ionic character (Figure 4.1).
Metallic systems are generally composed of atoms with unfilled valence electronic shells

43
from which electrons can be removed rather easily. These outer electrons become delocalized and
form a uniform ’sea’ of negative charge, to which the (now positively charged) ions are attracted.
The delocalized electrons are able to move freely throughout the lattice of cations, and, when subject
to a potential gradient, will move collectively, forming an electrical current.
At high pressure, when atoms in a solid are pressed closer and closer together, the outer
electrons in even an ionic solid will eventually be forced to delocalize and the system will become
metallic. However, the way in which this process occurs varies greatly from one material to the
next and sometimes surprisingly high pressure is required, as we shall see in this study. Many other
types of bonding exist which are not relevant for this particular study, and there are many additional
variations of the three mentioned here so briefly, the description of which will be left as an exercise
for the reader.
Lithium nitride is the only known thermodynamically stable alkali metal nitride and is one
of the most ionic of all known nitrides. At ambient pressure, the nitrogen exists in an anomalous
multiply charged (N3−) state [Dovesi et al., 1984, Kerker, 1981] which is stable only because of its
crystal environment - a hexagonal bipyramid of Li+ ions. This layered structure (α-Li3N, P6/mmm)
consists of Li2N layers, widely separated and connected by one lithium atom per unit cell occupying
a site between the nitrogen atoms in adjacent layers [Zintl and Brauer, 1935, Rabenau and Schulz,
1976, Rabenau]. This material is a superionic conductor via vacancy-induced Li+ diffusion within
the Li2N layers [Wolf, 1984, Sarnthein et al., 1996, Bechtold-Schweickert et al., 1984]. Although
this phenomenon is not a central focus of this particular study, it has driven so much of the past
work on Li3N that we will here give some additional details.
4.1.2 Superionic Conductivity
Superionic conductivity (SIC) is a property of some materials in which one of the atom
species is able to move through the crystal (at liquid-like rates) while the crystal itself remains in
the solid phase. [Keen, 2002] There are three basic types of SICs: those that become superionic
via a first-order structural phase transition driven by temperature or sometimes pressure, those that
become so when the defects in a particular phase suddenly begin to conduct after a gradual and
continuous disordering, and those for which there is no clear phase transition but simply a gradually
increasing mobility of defects.
Li3N may presumably be considered to be either a type II or III SIC. Only the lowest
pressure hexagonal (α) phase is a known SIC, and that at ambient temperature and pressure. The

44
rate of conductivity is, however, strongly temperature dependent (pressure effects on the SIC have
not been investigated). As mentioned above, the conductivity is driven by Li vacancy defects within
the hexagonal planes and is orders of magnitude higher perpendicular to the c axis than parallel to
it [Wolf, 1984]. The Li1+ ions are not allowed to migrate freely through the interstitial, however.
They move through the lattice by jumping from one vacant lattice site to another, spending a much
higher percentage of the time occupying a particular lattice site than en route.
Experimental verification or quantitative measurements of superionic conductivity are
quite difficult and at high pressure a method for direct measurement has not yet been found. Spec-
troscopies that probe local structure instantaneously (such as EXAFS [Boyce et al., 1981]), seem
promising. Indirect evidence for a superionic phase transition can include anomalies in specific heat
or lattice expansion. The majority of the SIC investigations, however, are conducted computation-
ally with methods such as molecular dynamics.
4.1.3 Li3N Applications
One of the reasons the SIC phase has drawn interest is the prediction that the water and
ammonia ices which compose the cores of the giant planets are existing in a superionic phase
[Cavazzoni et al., 1999], explaining the unusual magnetic fields measured around Uranus and Nep-
tune. The provocative similarity of the cubic phase of Li3N to the high-pressure nonmolecular
predicted phase of NH3 suggests that this and further studies of this analogous lithium-containing
compound may have important implications for geophysics and planetary physics. The applications
of SICs as battery electrolyte materials has prompted studies of these materials [Nazri, 1989] and
Li3N also has potential for such uses [Rabenau and Schulz, 1976, Rabenau].
The possibilities for Li3N’s use as a hydrogen storage medium or component of a hydro-
gen storage or release process has also prompted some studies [Hu and Ruckenstein, 2005, Ichikawa
et al., 2004, Nakamori et al., Chen et al., 2002]. Hydrogen is a very promising clean fuel, provided
an economically practical, stable, safe and rapid storage method with high capacity can be found.
Storing H2 as a liquid or gas turns out to be too costly, dangerous and inefficient, and the best pos-
sibility is containment within a solid crystal. Li3N has been reported to absorb as much as 10.4 wt
% hydrogen (with a reversible capacity of 5.5 wt %, however) with reasonably fast kinetics, and its
potential has been explored in the above cited papers.
A last technical application (which prompted an investigation into its behavior at high
pressure [Ho et al., 1999]) was Li3N’s usefulness in combination with GaCl3 in the synthesis of GaN

45
[Xie et al., 1996], a semiconductor with properties optimal for use in various nanoscale electronics.
4.1.4 Structural properties
Properties of Li3N revealed through these studies are as follows: at ∼0.5 GPa, α-Li3N
transforms into a second layered hexagonal structure (β, P63/mmc; Figure 4.5) with BN-like hon-
eycomb LiN layers [Beister et al., 1988]. In this structure, each nitrogen binds an additional lithium
atom above and below the plane and, unlike the Li2N layers in α-Li3N, adjacent LiN layers are
shifted relative to one another. β-Li3N is metastable at ambient pressure and is typically found
mixed with the α-phase. It remains stable up to 35 GPa – the high-pressure limit of experiments on
Li3N to date. A second phase transition to a cubic structure - P43m at 37.9 GPa [Ho et al., 1999] or
Fm3m at 27.6 GPa [Schon et al., 2001] - has been predicted. If it exists, the similarity of this phase
to those of other simple ionic cubic solids such as NaCl makes it an interesting study, particularly
in light of its higher ionicity. Understanding the behavior of the unstable and highly charged N3−
ions under large compression is of particular interest.
We present here the first concrete experimental evidence that β-Li3N indeed transforms
to a cubic structure (γ-Li3N) in the pressure range of 36-45 GPa. This transformation represents an
increase in structural and bonding strength and isotropy, and is accompanied by a relatively large
volume collapse and a fourfold widening of the electronic band gap. γ-Li3N is uncommonly stable
and quite compressible in this pressure regime and up to at least 200 GPa, making it a possible
candidate for an internal pressure standard.
4.1.5 Electronic properties
Electronic changes accompanying pressure-driven structural phase transitions in cova-
lently bonded materials such as graphite and boron nitride are relatively well understood because
their directional bonding is affected by changes in the local crystal environment in a predictable
way.
Valence bond and molecular orbital theory
To explain the nature of the bonds in common covalent compounds, some discussion of
valence bond and molecular orbital theory is needed. A simple model which describes bonding
based solely on atomic orbitals of valence electrons (s-like, p-like, d-like, etc.) turns out to be
inadequate, in many systems, to explain the behavior of an electron in the electric field generated

46
� �
�� ��
Figure 4.2: a) sp3 and b) sp2 hybrid orbitals. [McMurry and Fay, 2004]
by the nucleus and surrounding electrons in a crystal. In many instances (such as graphite and
carbon), the bonding states could only be described with a superposition of different atomic orbitals
belonging to the atoms in the system. Valence bond theory (which is adequate for providing a good
qualitative description of what is going on in simpler organic molecules containing C, N and O)
depicts these new orbitals as simple hybrids.
For example, in the case of diamond, in which each carbon atom is tetrahedrally coor-
dinated with 4 others, symmetry required 4 symmetric bonds surrounding each atom. Carbon’s
valence configuration is 2s22p2. A stable configuration can be formed if the electrons redistribute
to a 2s12p3 configuration. The s and p electrons hybridize to form four new orbitals called ’sp3
hybrids’, all with equal length and shape (Figure 4.2), which are shared with the four neighboring
carbon atoms such that each carbon ’sees’ four completely filled sp3 hybrid orbitals (called σ bonds);
an extremely stable and strong configuration which is directly reflected in diamond’s extraordinary
properties.
We will mention one other common hybrid because it is relevant for the following discus-
sion: the sp2 hybrid, which is a good model for the bonding in graphite. In this case, the 2s12p3
valence electrons hybridize such that the s electron mixes with only 2 of the p electrons, forming 3
equal sp2 orbitals and one remaining p orbital. The σ bonds in this case are composed of the 3 sp2
orbitals which are shared with the 3 nearest neighbor carbon atoms within the hexagonal (ab) planes
of graphite. The remaining p orbital has the symmetry of the atomic-like pz orbital with which we
are already familiar: it forms two lobes above and below the carbon atom and perpendicular to the

47
� �Figure 4.3: bonding and antibonding combinations of atomic orbitals.
hexagonal planes (Figure 4.2). The overlap (shared electrons) between the p orbitals and neighbor-
ing p orbitals form what we call π bonds. The primary distinguishing feature of π and σ bonds is
that a σ bond exists in the region along a line drawn between the nuclei of the bonded atoms.
The valence bond theory is simple and qualitatively accurate but does not yield good quan-
titative results; for that we must move on to molecular orbital (MO) theory. Using this approach it is
qualitatively much more difficult to describe even the simplest molecules. This theory does not view
the electrons as ’belonging’ to any particular bond, but to the molecule as a whole. Quantum me-
chanically, MOs can be seen as a linear combination of the one-electron type atomic basis functions
centered on each atom, which then become the appropriate eigenstates of the Hamiltonian describ-
ing that particular system. The atomic orbitals can be combined additively or subtractively, forming
two MOs which occupy different regions in space and have different energies (Figure 4.3). The
low-energy MO occupies the region between the nuclei and is termed the bonding state, because
it is energetically advantageous for the bonding electrons to occupy this region. This can be seen
as a constructive (energy-lowering) interference of the one-electron wavefunctions as two atoms
are brought close together. The subtractive (called antibonding) combination can be understood as
the destructive interference of electron wavefunctions as atoms are brought together, which results
in an increase of energy. Therefore, these states do not overlap in the region between the nuclei.
As atoms are brought close together (by a method such as pressure), then, we see a decrease in
energy of the constructively interfering electronic states (which are occupied and located between

48
the atoms), and an increase in the energy of the destructively interfering (unoccupied) states. This
effect on the fundamental band gap in a material as a function of pressure will become important
later in this discussion.
Electronic Interlayer state
In non-directionally-bonded closed-shell ionic materials, however, the situation is a bit
more subtle, and electronic changes not as well documented. Previous existing work on highly
ionic solid Li3N demonstrates that this material retains its ionic character up to very high pressure,
while undergoing a significant structural transition [Lazicki et al., 2005]. Inelastic x-ray scattering
experiments as well as first-principles calculations reveal that this structural change is accompanied
by distinct changes in the electronic bands. Here we explore the origins of these changes and
identify an important feature in the band structure: an interlayer band (to the best of our knowledge,
observed here for the first time in an ionic solid) which was previously incorrectly understood to
have Li 2s character [Kerker, 1981].
This interlayer band (Figure 4.4) was first predicted in lithium intercalated graphite com-
pounds [Posternak et al., 1983] when a conduction band previously labeled an ’alkali band’ and
assumed to originate from Li s was shown to have an unusual amount of its charge density in
the vacuum region between the hexagonal layers, rather than spherically distributed around the
Li atoms. The actual Li s states were identified at much higher energy. This interlayer state has
free-electronlike character in the region between the layers. It was also shown to exist in the pure
graphite, and also when the dimensions of the system were reduced down to a monolayer. The
density is not bound to individual C atoms, however, but to the neutral monolayer’s short range
attractive potential. A study based on the observation of similar bands in hexagonal boron nitride
[Catellani et al., 1985] suggests that they originate from bonding and antibonding combinations of
surface states which are bound to each monolayer.
Recently, the presence of this layer has taken on new significance with the observation by
Csanyi et al. [Csanyi et al., 2005], that superconductivity in the graphite intercalates appears to be
correlated with the occupation of the interlayer band. In the Li intercalated graphites, the energy
of the band can be lowered (to the point where it becomes occupied as it crosses the fermi level)
by increasing the concentration of Li ions or the c-axis lattice constant. An examination of the
presence of superconductivity in some of the graphite intercalates and not others shows a provoca-
tive correlation between the phenomena. Also, hybridization between the carbon π∗ bands and the

49
� �Figure 4.4: Band structure of primitive graphite [Boeri et al., 2007], highlighting the character ofthe bands. Green corresponds to σ bands, red to π and blue to interlayer states.

50
free electron-like band (which they attribute to the calcium intercalant, however) appears to facili-
tate electron-phonon coupling in the material [Calandra and Mauri, 2005]. Further investigation by
Boeri et al. [Boeri et al., 2007] suggests that it is the filling of the interlayer band which prompts
the occurrence of strong electron phonon interactions between the π∗ and interlayer electrons and
providing the mechanism for superconductivity.
Band gaps under pressure
In the cubic (γ) phase of Li3N, an observed pressure-driven widening of the electronic
band gap is related to an expected rapid increase in energy of the conduction bands relative to the
valence bands, as a result of their higher principle quantum number and kinetic energy. Neigh-
boring compounds Li2O and LiF are shown to exhibit similar band-gap increases demonstrating
that, far from being unusual, this appears to be the norm for second-row closed-shell ionic solids.
Metallization for Li3N is not predicted until pressures exceeding 8 TPa - a nearly 13-fold volume
compression [Lazicki et al., 2005].
4.2 Experimental Details
Polycrystalline lithium nitride powder (99.5 % purity, CERAC, Inc) was loaded into a
membrane diamond-anvil cell of LLNL design. Several diamond sizes were used to obtain an ex-
tended range of pressure up to 200 GPa. In the lower pressure experiments, argon was used as a
pressure medium and internal pressure standard. For the high-pressure experiments, no pressure
medium was used, and copper or ruby (Al2O3:Cr3+) were included in the sample chamber as pres-
sure indicators. Under non-hydrostatic conditions, the equation of state fitting parameters differed
from those obtained under quasi-hydrostatic conditions by 8.7%, 0.8% and 13% for Bo, Vo and Bo’,
respectively. Samples were loaded in an argon environment as Li3N is hygroscopic. High-pressure
behavior was investigated by angle-dispersive powder x-ray diffraction (ADXD) at 16IDB and in-
elastic x-ray Raman scattering (XRS) at 16IDD of the High-Pressure Collaborative Access Team
(HPCAT) beamlines at the Advanced Photon Source (APS). For the ADXD experiments, we used
intense monochromatic x-rays (λ = 0.3683 or 0.4126 A) microfocused to ∼10 µm at the sample
using a pair of piezo-crystal controlled bimorphic mirrors. X-ray diffraction patterns were recorded
on a high-resolution image plate detector (MAR 350) and analyzed with the FIT2D [HAM], XRDA
[Desgreniers and Lagarec, 1994] and GSAS (EXPGUI) [Toby, 2001] programs. For the XRS exper-

51
iments, we used monochromatic x-rays (9.687 keV) focused to ∼20 x 50 µm at the sample through
an x-ray translucent Be gasket by a pair of 1 m-long Kirkpatrick-Baez focusing mirrors. Six spher-
ically bent Si(660) single crystal analyzers (50 mm in diameter) were vertically mounted on a 870
mm Rowland circle to refocus inelastically scattered x-ray photons onto a Si detector (Amp Tek) at
a scattering angle of 25◦ in a nearly back scattering geometry (Bragg angle of 88.6◦). This configu-
ration corresponds to a momentum transfer of q ∼2.2 A−1. The overall system provides an energy
resolution of ∼1 eV.
4.3 Computational Details
We have also performed first-principles electronic structure calculations to explore and
clarify the electronic changes happening under pressure. Because of the large six-fold compression
carried out in these calculations, we used two methods for comparison: full-potential linearized
augmented plane-waves (LAPW) as implemented in WIEN2k code [?] within the Generalized Gra-
dient Approximation [Perdew et al., 1996] and a full-potential nonorthogonal local-orbital minimum
basis bandstructure scheme [Koepernik and Eschrig, 1999], within the local spin-density approxi-
mation (LSDA) [Perdew and Wang, 1992]. For the LAPW calculation, muffin tin radii (Rmt) were
set so that neighboring muffin tin spheres were nearly touching at each volume, and the plane wave
cutoff Kmax was determined by RmtKmax = 9.0. The Brillouin zone was sampled on a uniform
mesh with 185 irreducible k-points. The energy convergence criterion was set to 0.1 mRy. For both
calculations we found it necessary to put the lithium 1s core electrons into the valence states. Thus,
in the FPLO scheme, Li 1s, 2s, 3p, 3s, 3p and 3d states and N 2s, 2p, 3s, 3p and 3d states were used
as valence states and only the lower-lying N 1s state was treated as a core state. The results of these
two codes were in good agreement.
4.4 Results
4.4.1 X-Ray Diffraction
At low pressures our x-ray data indicate a coexistence of α and β phase, consistent with
previous observations [Ho et al., 1999]. The mixture converts to single phase (opaque) β-Li3N near
0.5 GPa. Between 35 and 45 GPa, we observed β-phase transform to a new transparent phase, γ-
Li3N, which remains stable up to 201 GPa, the maximum pressure achieved in the present study. A

52
4.0 3.5 3.0 2.5 2.0 1.5 1.0
d-spacing
measured calculated difference C
u
Cu
201
GP
a43
GP
a~3
8 G
Pa
~0 G
Pa
In
tens
ity (a
rb. u
nits
)
Figure 4.5: ADXD diagrams of Li3N at ambient pressure (a mixture of α and β hexagonal phases),at ∼38 GPa (β phase, directly prior to the phase transition), at 43 GPa (γ phase, directly followingthe phase transition), and at 201 GPa (still γ phase, mixed with copper pressure indicator). Refinedand difference patterns from the GSAS Rietveld refinement are shown, and hkl reflections from eachphase shown in green (α), red (β), black (γ), and magenta (copper). The three crystal structures areshown, with large atoms representing the highly negative nitrogen ions, small representing lithium.

53
16
18
20
22
24
26
28
30
0 50 100 150 200
0 50 100 150 2000
250
500
750
V/V0 ~ 8%
-Li3N
-Li3N
Pressure (GPa)
Vol
ume
per f
orm
ula
unit
(A3 )
theory EOS experimental EOS experimental data
NaCl (B2)
B (G
Pa)
P (GPa)
MgO-Li3N Ne
Figure 4.6: Experimental and calculated equation of state of β- and γ-Li3N. In the inset, the highpressure bulk modulus of γ-Li3N is compared to other common highly compressible materials.[Sata et al., 2002, Hemley et al., 1989] (NaCl, MgO and Ne Curves are interpolated up to 200 GPa).

54
possible beginning of this transition was reported in [Ho et al., 1999] and [Beister et al., 1988]. An
additional transition to an orthorhombic structure predicted at 168 GPa [Schon et al., 2001] is not
seen. Figure 4.5 shows the measured and refined diffraction patterns of γ-Li3N at 43 GPa and 201
GPa. The refinement was performed based on the Li3Bi structure (Fm3m) with one formula unit per
primitive fcc cell consisting of one lithium and one nitrogen ion occupying m3m sites, and the two
additional lithium ions in the 43m sites, each tetrahedrally coordinated with 4 nitrogen ions. Slight
changes in relative intensities of the diffraction peaks appear to be due to increasing occupancy of
the Li 43m sites with pressure (92.2% at 43 GPa and 99.9% at 201 GPa).
The pressure-volume data for the β and γ phases and their 3rd order Birch-Murnaghan
equation of state (BM-EOS, Equation (5.1)) fits are shown in Figure 4.6, with fitting parameters
summarized in Table 4.1. Equation of state is also calculated with DFT and shown as the dotted
lines in Figure 4.6. The fitting parameters are compared to experimental data in Table 4.1, and
the good agreement between experiment and theory indicates that the approximations made in the
calculations are appropriate for this system.
The β → γ transition is accompanied by an 8% volume collapse and an increase in the
coordination number for every atom. In the β phase (a∼3.20 A, c∼5.71 A, at the transition), each
N3− ion is surrounded by 11 Li+ ions (three in the hexagonal planes at 1.85 A, two above and below
the plane at 1.90 A and six in trigonal prismatic coordination at 2.1 A). In the γ phase (a∼4.5 A),
14 Li+ ions surround N3−, eight tetrahedrally coordinated with N at 1.95 A and six octahedrally
at 2.25 A. Across the phase transition there is no discontinuity in the nearest-neighbor N distance
(∼3.23 A), and the nearest N-Li distance even increases slightly. The significant increase in packing
without a decrease in distance between highly charged N ions makes the γ phase highly preferred
at high pressures. The more populated and symmetric distribution of Li ions serves to effectively
shield the highly charged N ions from one another and even potentially to compress their ionic radii
[Wilson et al., 1996], stabilizing the cubic structure up to very large lattice constant reduction.
The compressibility of γ-Li3N rivals other common and highly compressible closed-shell
cubic solids [Sata et al., 2002, Hemley et al., 1989] as seen in the inset of Figure 4.6. The results
clearly show that γ-Li3N is harder than neon, but softer than MgO and even NaCl above 100 GPa.
The distinct lack of broadening in the measured ADXD (seen at 201 GPa in Figure 4.5) even in the
absence of a pressure medium also suggests that this material has very low shear strength, which is
consistent with a high compressibility. In instances where this is not the case, anisotropic stresses in
the material will begin to result in small distortions of the crystal lattice which will diffract x-rays
at slightly varying angles. As a result, the narrow peaks will appear smeared out or broadened.

55
395 400 405 410 415 420 425
XRS
XAStotal N p DOS
-Li 3N
(40
GP
a)-L
i 3N (1
3 G
Pa)
+-L
i 3N (0
GP
a)
N pz
N px,y
Li s
Inte
nsity
(arb
itrar
y un
its)
Energy (eV)
Figure 4.7: Measured nitrogen k-edge XRS spectra from the three phases of Li3N (error bars es-timated as the square root of the counts) compared with calculated Nitrogen p and Lithium s pro-jected density of states and with the calculated x-ray absorption spectrum. The calculated curveswere offset by 394.2 eV (arbitrary) in every case, for the sake of qualitative comparison with theexperimental results.

56
Table 4.1: Volume per formula unit Vo, bulk modulus Bo, its pressure derivative Bo’, volume changeat the β→γ transition and transition pressure as obtained in experimental(*) and theoretical workin present and other studies. Experimental errors are primarily a result of non-hydrostaticity in theDAC. The γ-phase predicted in reference [Ho et al., 1999] is space group P43m.
V0 ( A3
f.u.) B0(GPa) B0’ ∆V
V0P(GPa)
Exp.* β 34.4(.8) 71(19) 3.9(.9) 8(2)% 40(5)
γ 30.8(.8) 78(13) 4.2(.2)
Th. β 34.44(.08) 68(3) 3.6(.1) 6.7% 40.4
γ 31.16(.08) 73.1(.8) 3.85(.01)
[Ho et al., 1999]* β 35.04 74(6) 3.7(.7) >35
[Ho et al., 1999] β 30.88 78.2 3.77 8% 37.9
γ 28.08 82.8 3.84
[Schon et al., 2001] β 33.36 28(5)
γ 30.44
[Beister et al., 1988]* β 34.48 >10
The similar trend in compressibility between γ-Li3N and the isoelectronic close-shelled Ne appears
analogous to the case of ionic CsI and Xe which follow nearly identical compression curves [Zisman
et al., 1985]. But unlike CsI and Xe which undergo a whole series of high-pressure phase transitions,
γ-Li3N and Ne have a very high phase stability.
4.4.2 X-Ray Raman Scattering
Before we were certain of the ionic character of this compound at high pressure, the sig-
nificant (and provocatively similar to graphite-diamond and hexagonal-cubic BN) structural phase
transition led us examine the electronic structure for features similar to those seen in the covalently
bonded compounds. We therefore performed x-ray Raman spectroscopy, with which one can probe
the k-shells of low-Z materials (in our case, nitrogen). The most distinctive features of this spectrum
(Figure 4.7) are a ’near edge’ peak near 397 eV and a separate broader band near 403 eV, both of
which change with pressure. The relative intensity of the lower energy peak decreases from α to β
phase and vanishes in the cubic and more closely packed γ phase. All peaks shift to higher energy
with increasing pressure.
The acquired spectra describe the density of electronic transitions from nitrogen core to
the lowest lying unoccupied 2p conduction states. In the case of the covalently bonded materials,
the x-ray Raman spectrum is characterized by two distinct features: a sharper peak at lower energy
which has been shown to correspond to transitions to π* molecular orbital states, and a broader
peak at higher energy which describes transitions to σ* states. The phase transition from a layered

57
-14
-12
-10
-8
-6
-4
-2
0
2
4
6
8
10
12
14
-Li3N (P ~ 40 GPa)-Li
3N (P ~ 13 GPa)-Li3N (P ~ 0 GPa)
Ene
rgy
(eV
)
AKM KWZXLW
AKM
Figure 4.8: Calculated electronic band structure for the three phases of Li3N, with the interlayerband highlighted in orange in the two hexagonal phases.
hexagonal structure such as graphite to a more isotropic cubic structure such as diamond is accom-
panied by a change from sp2 to sp3 bonding types. An sp2-bonded solid has a sizable proportion
of π* bonding states which are completely absent in an sp3 bonded material. Therefore, we expect
(and in fact do see) the narrower lower energy peak disappear across the hexagonal-cubic transition
in the covalently bonded compounds. An initial examination of the data acquired for Li3N (Figure
4.7) was hopeful; to all appearances, the same story was being told. We see the same characteristic
leading edge peak in both hexagonal phases and not in the cubic phase.
Within the dipole approximation, and disregarding possible excitonic effects, the nitro-
gen k-edge x-ray raman should give us a reasonably good approximation of the x-ray absorption
spectrum. We therefore calculated this quantity from the nitrogen p projected density of states mul-
tiplied by the dipole-allowed transition matrix elements and a transition probability (Figure 4.7).
The important features in the experimental spectrum are reproduced reasonably accurately in the
calculated x-ray absorption spectrum and in the nitrogen p projected density of states as well. The

58
projected density of states is shown for the purpose of demonstrating one important point: the lead-
ing edge peak (which, in the case of graphite, represents a π* bonding state with predominantly C
pz character [Batson, 1993]) is composed of nearly equal contributions from pz and px+py. This
indicates that the nitrogen p states in hexagonal Li3N have little or no directional character; their
distribution is spherically symmetric (and the electronic states energetically indistinguishable). This
is good evidence in support of a closed-shell ionic state and raises interesting questions about the
nature of this leading edge peak. Why is it present in the hexagonal phase and not in the cubic, if
the p electron states are unaffected by changes in local coordination?
In contrast, electronic structure interpretations of ambient Li3N from previous works
claim that the electronic bands from which this density arises have lithium 2s character [Kerker,
1981]. We plot the bandstructures for the three phases (Figure 4.8), and, from the symmetry of the
band in question (highlighted), it appears this is indeed a reasonable interpretation. In the α phase,
the band has a minimum with parabolic character around the Γ point and has Γ+1 symmetry, as is
expected for the s-band. β-Li3N has two formula units per primitive cell, so the (symmetric) Γ+1
band folds back at the Brillouin zone boundary, giving rise to a second band with (antisymmetric)
Γ+3 symmetry (notation taken from Robertson [Robertson, 1984]). The projected density of Li s
states (black dotted curve in Figure 4.7) compared to nitrogen p, however, shows rather insignifi-
cant s contribution to this band, particularly in the α phase. It appears that a different interpretation
altogether is needed for this low-energy conduction band.
4.5 Discussion
Again we suggest an answer from a comparison with graphite and hexagonal boron ni-
tride. These materials, in addition to the π* and σ* states in the absorption spectrum, possess a
smaller and weaker peak, the existence of which has been long known but generally ignored be-
cause of its overlap with the much more dominant sp bands [Catellani et al., 1985, Reihl et al.,
1986, Fauster et al., 1983]. Its character, however, is well understood and in fact very recently it
has been suggested to play a vital role in the superconductivity of the lithium intercalated graphite
compounds [Csanyi et al., 2005]. This band is a free-electron-like interlayer (IL) state (much less
well separated from the other electronic bands than in Li3N) which is manifested as a concentra-
tion of electronic density in the interstitial region between the hexagonal layers. This state tends to
hybridize with the more dispersed atomic orbitals in the system, in our case nitrogen p.
An examination of the charge density originating from the IL band (Figures 4.9 and

59
1
9
2
11
9
b.
a.
10
10 5
Figure 4.9: Valence (a) and interlayer (b) α-Li3N charge densities perpendicular to the basal plane(left panels) and within the basal plane (right panels). Contours are labeled in units of 0.01 e/A3
and separated by 0.05 e/A3 (a) and 0.01 e/A3 (b).

60
b.
2
1
2
1
1
a.
2
1
1
2
Figure 4.10: Valence (a) and interlayer (b) β-Li3N charge densities perpendicular to the basal plane(left panels) and within the basal plane (right panels). Contour lines are labeled in units of 0.1 e/A3
and separated by 0.05 e/A3.
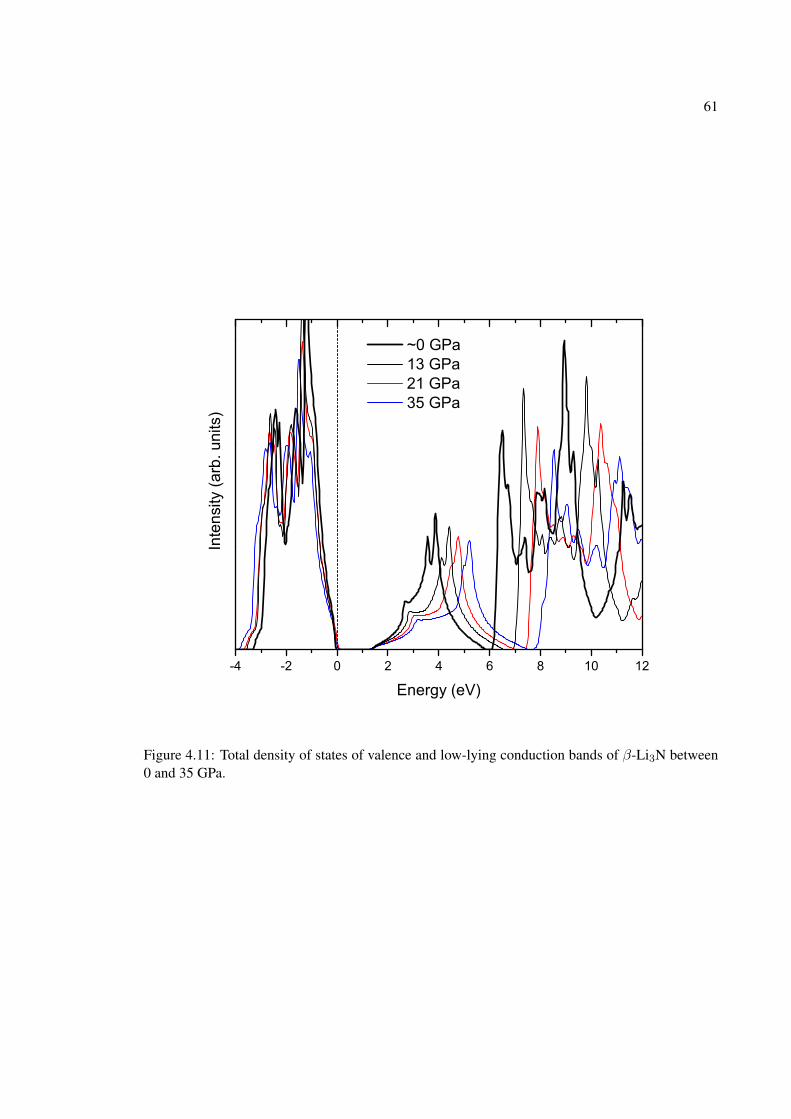
61
-4 -2 0 2 4 6 8 10 12
~0 GPa 13 GPa 21 GPa 35 GPa
Inte
nsity
(arb
. uni
ts)
Energy (eV)
Figure 4.11: Total density of states of valence and low-lying conduction bands of β-Li3N between0 and 35 GPa.

62
4.10) indeed reveals, in the hexagonal phases, a concentration of electron density in the more open
interstitial regions between the hexagonal planes. The charge density associated with the very large
N3− ions is extended rather far into the IL regions, such that the IL state adopts a significant amount
of N p character, which is here evident from the N-atom-like charge densities we see in this energy
range. The IL bands show a large dispersion along kz (Γ-A), indicating that the states are not
strongly confined between the hexagonal layers in this material.
The IL bands in this material differ from those seen in graphite and graphite intercalates
and also h-BN in several ways. The effective band masses at the conduction band minima for α
and β-Li3N are 0.36mo and 0.46mo, respectively - a significant deviation from free electron-like
behavior. Between 0 and 35 GPa in the β phase, the energy of the IL band (particularly at the
minimum at K) does not change very much (Figure 4.11), in contrast to lithium intercalates which
exhibit an increase of IL band energy with decreasing c-axis lattice constant [Csanyi et al., 2005,
Blase et al., 1995] The increased stability and lack of free-electron-like character in the IL bands of
hexagonal Li3N phases are likely due to the presence of Li ions between the layers, which serve to
break up the interlayer space and create disconnected regions of charge.
Within the dipole approximation (limit of small momentum transfer q), the XRS spectrum
will replicate the x-ray absorption spectrum and transitions from the core to an IL final state would
not be allowed (except in the case of a specifically oriented single-crystal sample [Batson, 1993]).
At larger values of q, however, non dipole-allowed transitions can contribute to the spectrum. In our
case q ∼2.2 A−1, which is too large for the dipole approximation to be very good. However, within
the dipole limit the N k-edge XRS should show only final states with N 2p character and we do
indeed see good agreement between the XRS and N p projected DOS. This suggests that transitions
to the IL state are primarily only allowed to the extent that it is hybridized with the nitrogen p states,
and the intensity of the leading edge peak is a measure of the degree of that hybridization. The XRS,
therefore, provides an indirect measurement of the presence of an IL state, but the intensity of the
leading edge peak may not represent its full extent.
The existence of the IL band could also explain the lack of sharp onset to the leading edge
peak often seen in XRS due to excitonic effects [Buczko et al., 2000, Soininen, 2001, Shirley, 1998,
Shirley et al., 2001]. In cases where the electronic transition is 1s → π∗ on a single atom, one has
a core hole and electron in close enough proximity for an exciton to be created. If the transition is
to an interlayer region, however, the core hole will be far enough away that exitonic effects will be
less, and we will not see such a sharp onset [Koma et al., 1986].
In this model, the large increase in band gap across the phase transition from hexagonal

63
Figure 4.12: Sample image at ambient pressure (a) and at the β→γ phase transition near 40 GPa(b). The bright spot at 40 GPa is the ruby grain used for pressure calibration.
β-Li3N to cubic γ-Li3N can be understood simply as a loss of the IL band. The cubic structure is
highly close-packed; it does not contain empty interstitial regions large enough for electronic states
with non-atomic character to exist. The implication then is that in this regime pressure is not moving
the system toward a covalent or metallic system (the typical behavior as bands broaden) but instead
into a much more strongly ionic state. In the cubic phase we see more localized and symmetric
charge distributions around the nitrogen atoms, making them even closer to the ideal N3− state and
explaining the insulating character and high stability of this phase.
The large bandgap increase is evident experimentally from the change in optical absorp-
tion near the phase transition (Figure 4.12). The calculated band gap increases from β → γ is 1.5
to 5.5 eV (and the GGA tends to cause an underestimate of the gap). At 5.5 eV we may expect to
see a completely transparent sample but, in fact, we see a strong yellow-orange tint (corresponding
to a gap in the vicinity of 2.5 eV). However, many other factors such as absorption from a color
center produced by Li vacancies (which are indeed predicted especially in the hexagonal phases,
as a driving force for superionic conductivity [Schulz and Thiemann, 1979]) could cause such a
coloration.
The calculated behavior of the γ-Li3N band gap upon further increase of pressure is some-
what unusual and interesting (Figure 4.13). As volume is reduced, the sim 5.5 eV indirect funda-
mental gap between Γ and X begins to increase rather rapidly, passing the band minimum at L near
V/V0 = 0.4. The Γ-L indirect gap continues to increase more slowly up to ∼8.2 eV at V/Vo = 0.22
(calculated pressure of ∼760 GPa), before finally beginning to collapse. Metallization via closing

64
0.1 0.2 0.3 0.4 0.5
0
5
10
15
20
25
30
0 5 10
fundamental gap - L gap - X gap
Ene
rgy
sepa
ratio
n (e
V)
Volume reduction (V/V0)
Den
sity
of S
tate
s
Energy (eV)
Figure 4.13: Change in valence band energies relative to bottom of the conduction band in the γphase from the phase transition to metallization. Energy gaps explained in the density of states plot(inset): open circles give the fundamental band gap, and the energy separation between the bottomof the conduction band and the center of mass of the valence band (open triangles) and the bottom ofthe valence band (closed triangles) are also shown. V0 is the volume of α-Li3N at ambient pressure.

65
of the Γ-L gap finally occurs at V/Vo = 0.08 (calculated pressure of ∼8 TPa, which is a lower limit
due to the known GGA misrepresentation of band gaps.) The gap closing is due to broadening of
the valence and conduction bands; the band centers, however, continue to separate throughout the
entire range of pressure. By metallization, the N 2p upper valence states have broadened by a factor
of 8.
For the sake of comparison, some of the highest metallization pressures that have ever
been predicted are for other cubic closed-shell solids Ne, MgO and NaCl at 134 TPa, 21 TPa and
0.5 TPa, respectively [Boettger, 1986, Oganov et al., 2003, Feldman et al., 1990]. Clearly, γ-Li3N
fits well into this family. This analysis is neglecting the possibility of an additional structural phase
transition for Li3N at higher pressures. An fcc to a more close-packed hcp or orthorhombic phase
transition is conceivable; however, from the example of He [Young et al., 1981], this may not
significantly effect the metallization pressure.
This unusual phenomenon of band gap widening under pressure has already been ob-
served in a few materials. In the case of diamond and cubic boron nitride, for instance, it is the
bonding-antibonding splitting of valence and conduction band states which are responsible for a
gap opening under pressure, coupled with the lack of d states in the low-lying conduction bands
[Fahy et al., 1987, Wentzcovitch et al., 1986] (further explanation will follow). γ-Li3N bonding
character appears to be quite strongly ionic however, so this explanation is not adequate.
Under pressure the dominant electronic band effects we observe are shifting and broad-
ening. The energy shift is determined by the principle that bands with higher total energy (re-
lated to principle quantum number n) will increase in energy with respect to lower bands, and that
bands with smaller ` (orbital character) increase in energy with respect to larger ` [McMahan, 1986,
McMahan and Albers, 1982]. All bands increase in energy under pressure, but the higher energy
bands are the ones most strongly effected by a volume reduction. The kinetic and potential energy
of the states vary with volume as V−2/3 and V−1/3, respectively, so at small volume the kinetic term
becomes the dominant energy. The number of radial nodes in a wavefunction is roughly a measure
of the kinetic energy, so it is evident that the s bands will be more strongly effected (will increase in
energy more rapidly) than the p, and the d and f states even less because of the decreasing number
of radial nodes. The mechanism for metallization in most higher-Z ionic, insulating compounds,
is the strong relative decrease in energy of the conduction d bands relative to the s and p valence
bands, leading to eventual transfer of electrons from d to s across the fermi energy, or hybridization
between these states [McMahan, 1986, McMahan and Albers, 1982].
The first and second-row compounds, however, have filled (or partially filled) bands of

66
0.7 0.8 0.9 1.0
6
8
10
12 Li3N Li2O LiF
Ban
d G
ap (e
V)
V/V0
Figure 4.14: Band gap increases as a function of volume reduction for related close-shelled cubicLi compounds. LiF and Li2O are cubic at ambient pressure and V0 refers to the ambient pressurevolume. Li3N V0 (in this instance alone) is taken as the volume at the β → γ phase transition.

67
principle quantum numbers 1 and 2, which are lacking d states. In the bandstructures for these
compounds there are no low energy conduction bands with d character. The reason for the record-
breaking metallization pressure of Ne is that the band overlap does not occur until the 3d conduction
bands have fallen in energy through all the 3s and 3p bands, to finally overlap the 2p valence bands at
an astonishing 34-fold volume compression. Close-shelled ionic compounds Li3N (and, similarly,
Li2O and LiF) have completely filled 1s shells on the lithium ions and 2p shells on the anion. The
conduction bands, therefore, consist of entirely Li 2s/2p character and anion 3s/3p character, which
can be expected to increase in energy more rapidly than the lower-quantum number valence states,
resulting in the observed band gap increase in all three of these compounds [Clerouin et al., 2005,
Zunger and Freeman, 1977]. Using Wien2k, we have also calculated the gap widening in these
compounds and compared to that of Li3N in Figure 4.14. Zunger et al. detect a small amount
of hybridization (covalency) in the LiF bonds, and credit the bonding-antibonding splitting with
the gap increase. The pressure-induced energy shift in eigenvalues for covalent materials due to
bonding-antibonding splitting is generally much stronger than shifts in ionic systems [Zunger and
Freeman, 1977], and so it may be that it is this contribution which is causing the LiF band gap
increase with pressure to be so much larger than that of Li3N and Li2O.
Finally, we compare lithium nitride to some related alkali pnictides (Figure ?? and see
nice systematic behavior in this family of compounds. The hexagonal→cubic phase transition hap-
pens at lower and lower pressure with increasing atomic number until, in the case of Li3Bi, the cubic
structure is the ambient phase. NH3 has been predicted to transform to a hexagonal superionic phase
at high pressure and temperature, and we postulate that it may follow the same sequence of phase
transitions at extreme conditions.
4.6 Conclusion
In summary, we have provided the first coherent picture of the structural and electronic
changes associated with a graphite-diamond-like transition in Li3N. The high-pressure cubic phase
has been discovered to possess several interesting and unique properties including unusually high
phase stability and robust ionicity to pressures exceeding 200 GPa and high compressibility rival-
ing commonly used pressure media such as NaCl. Other alkali pnictides are shown to follow a
systematic sequence of phase transitions, indicating that high density NH3 may follow the same
trends.
In addition, Li3N is demonstrated to possess large concentrations of states with charge

68
� �
Figure 4.15: Phase transition sequence of alkali pnictides under pressure. The triangles show thehigh pressure limit of experiments performed on these materials [Leonova et al., 2003, Datchi et al.,2006].

69
(unoccupied) in the open interlayer regions of the hexagonal phases, which result in low-energy
conduction bands of the variety previously observed in layered covalently bonded compounds but
not to our knowledge previously seen in ionic materials. The strong hybridization between the
interlayer state and nitrogen p states allows its detection with X-ray Raman spectroscopy. The large
band gap increase across the hexagonal-cubic phase transition is then interpreted as a loss of the
interlayer band. Further increase of the band gap as pressure is increased is related to the rapid
upward shift of the lower conduction bands relative to the valence bands, by reason of their higher
angular momentum character. This band gap widening is revealed to be a general trend in the
closed-shell ionic second row compounds.
4.7 Acknowledgements
We acknowledge D. Kasinathan, J. Kunes, Bruce Baer and Andras Libal for useful dis-
cussions during this investigation. Use of the HPCAT facility was supported by DOE-BES, DOE-
NNSA (CDAC), NSF, DOD-TACOM, and the W. M. Keck Foundation. We thank HPCAT beamline
scientist M. Somayazulu for technical assistance. This work has been supported by the LDRD(04ERD020)
and SEGRF programs at the LLNL, University of California under DOE No. W7405-ENG-48 and
by the SSAAP (DE-FG03-03NA00071) and NSF(ITR 031339) at UCD.

70
Chapter 5
Pressure-induced
antifluorite-to-anticotunnite phase
transition in dense ice analog lithium
oxide
5.1 Introduction
Lithium oxide (Li2O) is one of simplest ionic oxides and it is isoelectronic to H2O. At
ambient pressure it exists in the antifluorite structure [Shunk, 1969], characterized by oxygen (O2−)
ions arranged in an fcc sublattice with lithium (Li1+) ions in tetrahedral interstitial sites (Figure
5.3a). This structure is in contrast to that of isovalent symmetric ice (ice X), where the oxygen
sublattice forms a bcc arrangement [Hirsch and Holzapfel, 1984].
At low pressures, water takes on nine different structural phases, in all of which the H2O
molecules remain well-defined and the solids are held together by relatively weak hydrogen bonds.
The phase sequence is shown in Figure 5.1. In the range of 40 to 60 GPa, a transition to this
ice X phase 5.2 (see Figure 5.2) has been predicted [Hirsch and Holzapfel, 1984, Schweizer
and Stillinger, 1984, Benoit et al.] and also indicated experimentally with various spectroscopies
[Polian and Grimsditch, 1984, Pruzan et al., 1993, Pruzan, 1994, Goncharov et al., 1996, Aoki et al.,
1996, Struzhkin et al., 1997]. This simple nonmolecular bcc phase is marked by the presence of the
hydrogen atoms at the midpoints between oxygen atoms. Pressure appears to be moving this system

71
� �
Figure 5.1: Phase diagram of water from [Lin et al., 2006].
� �
Figure 5.2: Crystal structure of Ice X [Lin et al., 2006].

72
from a covalently bonded molecular system to an ionic or dissociated phase.
A further transformation to an antifluorite phase in ice at some pressure above 150 GPa
has been predicted [Demontis et al., 1988, 1989], and experiments show changes in vibrational mode
coupling [Goncharov et al., 1996] and single-crystal x-ray diffraction peak intensity [Loubeyre et al.,
1999] near 150 GPa. Recent studies argue that a new phase is either hexagonal or orthorhombic
[Benoit et al., 1996], but the existence and nature of this phase and the pressure at which it is reached
are still uncertain [Loubeyre et al., 1999, Benoit et al., 2002]. In further similarity to ice, for which
a high-pressure, high-temperature superionic phase has been predicted [Cavazzoni et al., 1999],
ambient pressure Li2O becomes superionic at temperatures above 1350 K [Hull et al., 1988], prior
to melting at 1705 K [Liu et al., 1985]. The superionic phase of water appears to be characterized
very short-lived bonds with∼50/50% covalent/ionic character and conduction occurs via H+ proton
diffusion [Goldman et al., 2005].
In the superionic phase of Li2O, oxygen ions constitute a rigid framework while Li+
ions move from one tetrahedral site to another via octahedral interstitial sites. Despite its marked
similarities to H2O, until very recently the high pressure behavior of Li2O was not addressed in the
literature. One report by Kunc et al. [Kunc et al., 2005] identified a high pressure phase transition
using powder x-ray diffraction and investigated trends under pressure using ab initio calculations,
but so far data at only one pressure point in this high pressure phase has been reported.
Understanding the behavior of Li2O at high temperatures and pressures could therefore
be very useful as an aid in understanding the behavior of H2O ice and similar low-Z ices. These hot,
dense ice structures are of very great importance to planetary science, geosciences, and fundamental
chemistry, because of the fact that superionic phases of some of these compounds (H2O, CH4 and
NH3) within the thick intermediate layer of such giant planets as Uranus and Neptune have been
suggested to be responsible for their mass distribution and magnetic fields [Cavazzoni et al., 1999,
Hubbard, 1981, Ness et al., 1986].
Experimentally it is very difficult to study these compounds because the electron density
on the hydrogen ions (the conducting ion species) is so low that their location and motion is very
difficult to detect experimentally. Additionally, the pressure/temperature regions at which these
phases are predicted to occur is just at the boundary of what is possible using current diamond anvil
cell techniques. Even computational techniques are challenged by these compounds because unex-
pected quantum effects can have a strong effect on their overall properties. It therefore makes sense
to supplement the investigations of the ices with detailed studies of their structural and electronic
analogs. The properties of Li2O, which is about as good an example of a closed-shell ionic solid

73
as can be found, differ remarkably for the ambient condition phase of H2O, but the above evidence
suggests that, at high pressure, H2O may be approaching much more closely the state of ambient
Li2O.
Technological applications for Li2O also exist and justify an investigation of this material;
they range from possibilities for hydrogen storage (in combination with Li3N [Hu and Ruckenstein,
2005]), to use as a blanket breeding material for thermonuclear reactors to convert energetic neu-
trons to usable heat and to breed tritium necessary to sustain deuterium-tritium reactions [Tanaka
et al., 2000, Noda et al., 1981]. Additionally, investigation of this simple material is a reference
point for understanding more complex metal-oxides.
In this study, we investigate the high pressure behavior of Li2O at room temperature with
ADXD and Raman spectroscopy. We present further and more complete evidence for a phase
transition from antifluorite to anticotunnite structure, recently observed for the first time by Kunc et
al. [Kunc et al., 2005], and discuss it in light of similarities to trends observed in the alkali metal
sulfides.
5.2 Experiment
Polycrystalline Li2O powder (99.5% purity, CERAC, Inc.) was loaded into a membrane
diamond anvil cell (DAC) of Livermore design. Brilliant cut diamonds with 0.3 mm flats were
used with a 0.15 mm diameter sample chamber in a rhenium gasket of 0.05 mm initial thickness
to achieve a pressure range of 8 to 61 GPa. No pressure medium was used in the experiments, as
α-Li2O has a low enough bulk modulus that non-hydrostaticity was not predicted to be a serious
concern. This assumption turned out to be potentially problematic, as will be shown. In the first
experiment copper was included in the sample chamber as an internal pressure indicator and in the
second pressure was determined from micron-sized ruby (Al2O3:Cr3+) crystals using the quasihy-
drostatic ruby pressure scale [Mao et al., 1986a]. All sample loadings were performed in an inert
environment, as Li2O is hygroscopic.
High-pressure behavior of Li2O was investigated by ADXD and Raman spectroscopy,
both at ambient temperature. ADXD was performed at the microdiffraction beamline 16IDB of
the HPCAT (High Pressure Collaborative Access Team) at the APS (Advanced Photon Source). In
these experiments, we used intense monochromatic x-rays (λ = 0.36798 or 0.41285 A) microfo-
cused to about 0.01 mm at the sample using a pair of piezo-crystal controlled bimorphic mirrors.
The x-ray diffraction patterns were recorded on a high-resolution image plate detector (MAR 345).

74
a b
Figure 5.3: (a) antifluorite α-Li2O structure. (b) anticotunnite β-Li2O structure showing thetri-capped trigonal prismatic coordination. Large atoms represent oxygen and smaller representlithium.

75
8 10 12 14 16 18 20 22
(222
)
(204
)
(201
)
(220
)
(213
)
(004
)+(3
02)
(020
)
(013
)
(211
) (2
10)+
(112
) (111) (102)+(200)
(011
) (0
02)
61.9 GPa
Inte
nsity
(arb
. uni
ts)
2
Cu (4
00)
Cu (3
11)
(220
)
CuC
u (2
00)
(111
)
-Li2O
-Li2O34.3 GPa
experimental results calculated results difference
Figure 5.4: Rietveld refined x-ray diffraction profile of α- and β-Li2O. For the diffraction patternsshown, the final refinement converged to R(F2) = 0.1054 for the α phase and R(F2) = 0.1197 forthe β phase. In the high pressure phase, only the most intense reflections are labeled. Unit cellparameters for the phase were determined from the positions of the most isolated and/or intensepeaks: (002), (011), (111), (211), (013) and (020).
The recorded two-dimensional diffraction images (Debye-Scherrer rings) were then integrated to
produce high quality ADXD patterns using FIT2D and analyzed with the XRDA [Desgreniers and
Lagarec, 1994] and GSAS (EXPGUI) [Toby, 2001] programs.
Raman spectra were excited using an argon-ion laser (λ = 514.5 nm) focused to ∼0.01
mm. Scattered light (measured in back-scattering geometry) was filtered with a 514.5 nm Super-
Notch-Plus filter, analyzed with a single spectrometer (characterized by less than 3 cm−1 spectral
resolution) consisting of a 1200 grooves/mm ion-etched blazed holographic diffraction grating, and
imaged with a liquid nitrogen cooled CCD camera at Lawrence Livermore National Laboratory. A
spectral range of 100-1400 cm−1 was used.

76
8 10 12 14 16 18 20 22
44 GPaC
u
CuCu
2
47 GPa
Cu
50 GPa
Inte
nsity
(arb
. uni
ts)
53 GPa
Figure 5.5: Li2O ADXD patterns across the phase transition from cubic to orthorhombic, showingthe large pressure range of two-phase coexistence.
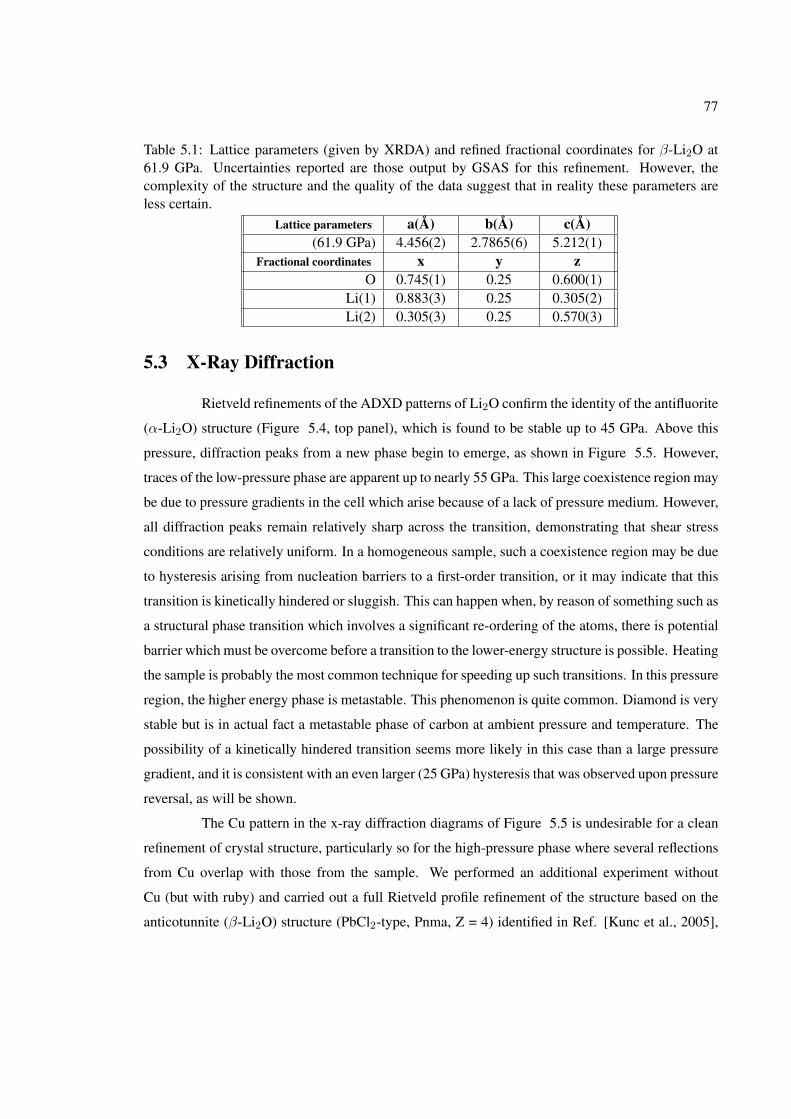
77
Table 5.1: Lattice parameters (given by XRDA) and refined fractional coordinates for β-Li2O at61.9 GPa. Uncertainties reported are those output by GSAS for this refinement. However, thecomplexity of the structure and the quality of the data suggest that in reality these parameters areless certain.
Lattice parameters a(A) b(A) c(A)(61.9 GPa) 4.456(2) 2.7865(6) 5.212(1)
Fractional coordinates x y zO 0.745(1) 0.25 0.600(1)
Li(1) 0.883(3) 0.25 0.305(2)Li(2) 0.305(3) 0.25 0.570(3)
5.3 X-Ray Diffraction
Rietveld refinements of the ADXD patterns of Li2O confirm the identity of the antifluorite
(α-Li2O) structure (Figure 5.4, top panel), which is found to be stable up to 45 GPa. Above this
pressure, diffraction peaks from a new phase begin to emerge, as shown in Figure 5.5. However,
traces of the low-pressure phase are apparent up to nearly 55 GPa. This large coexistence region may
be due to pressure gradients in the cell which arise because of a lack of pressure medium. However,
all diffraction peaks remain relatively sharp across the transition, demonstrating that shear stress
conditions are relatively uniform. In a homogeneous sample, such a coexistence region may be due
to hysteresis arising from nucleation barriers to a first-order transition, or it may indicate that this
transition is kinetically hindered or sluggish. This can happen when, by reason of something such as
a structural phase transition which involves a significant re-ordering of the atoms, there is potential
barrier which must be overcome before a transition to the lower-energy structure is possible. Heating
the sample is probably the most common technique for speeding up such transitions. In this pressure
region, the higher energy phase is metastable. This phenomenon is quite common. Diamond is very
stable but is in actual fact a metastable phase of carbon at ambient pressure and temperature. The
possibility of a kinetically hindered transition seems more likely in this case than a large pressure
gradient, and it is consistent with an even larger (25 GPa) hysteresis that was observed upon pressure
reversal, as will be shown.
The Cu pattern in the x-ray diffraction diagrams of Figure 5.5 is undesirable for a clean
refinement of crystal structure, particularly so for the high-pressure phase where several reflections
from Cu overlap with those from the sample. We performed an additional experiment without
Cu (but with ruby) and carried out a full Rietveld profile refinement of the structure based on the
anticotunnite (β-Li2O) structure (PbCl2-type, Pnma, Z = 4) identified in Ref. [Kunc et al., 2005],
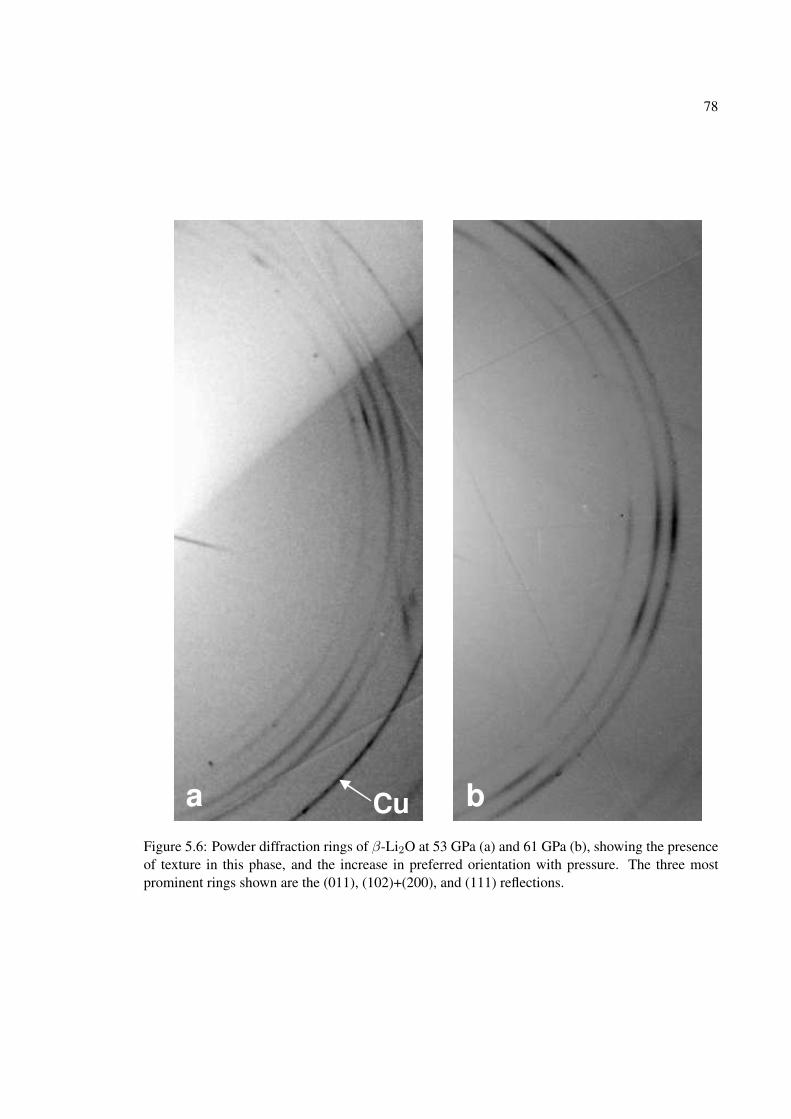
78
a bCu
Figure 5.6: Powder diffraction rings of β-Li2O at 53 GPa (a) and 61 GPa (b), showing the presenceof texture in this phase, and the increase in preferred orientation with pressure. The three mostprominent rings shown are the (011), (102)+(200), and (111) reflections.

79
and also seen in the similar alkali metal sulfide Li2S system [Grzechnik et al., 2000]. Clearly, the
refined results (summarized in Figure 5.4, lower panel) are reasonably good even at 61.9 GPa.
The origin of the small reflection near 2Θ = 15.7 is unknown, but does not originate from the
sample. Refined parameters include cell parameters, profile function, fractional coordinates, thermal
parameters, Chebyshev polynomial background and the spherical harmonic (6th order) correction
for preferred orientation (PO). The starting atomic coordinates were those determined for Li2S in
the Pnma structure at 7.9 GPa; a = 5.92 A, b = 3.65 A, c = 6.90 A, xO = 0.77, xLi1 = 0.98, xLi2 =
0.32, zO = 0.61, zLi1 = 0.36, zLi2 = 0.56. The final refinement converges to R(F2) = 0.1197, with
atom positions given in Table 5.1. At this pressure, a refinement of the PO correction yielded a
texture index of 1.5437, indicating a moderate PO in the orthorhombic phase at 61.9 GPa (where a
texture index value of 1.0 means no texture and 3.0 is strong texture). This effect is confirmed by
the presence of clear intensity variations around the powder diffraction rings shown in Figure 5.6.
The PO appears to increase from 53 to 61 GPa (these patterns were, however, taken during separate
experiments), an effect which may lead to the intensity inversion of the two most prominent peaks
which is observed between 53 and 61 GPa in the diffraction spectra. Because of the quality of
the data and relatively small number of diffraction peaks available, the refinement was not entirely
conclusive, and the resulting structure must, therefore, be viewed as approximate.
The crystal structure of β-Li2O can be understood to consist of chains of distorted tri-
capped trigonal prisms of cations parallel to the y-axis, giving the anion a coordination number of
9 (Figure 5.3b). Near the transition, the polyhedral cation-anion distances range from 1.664 A
to 2.246 A with an average of 1.89 A. These values are reasonable, based on the Li-O distances
quoted for lithium oxide clusters in Ref. [Finocchi and Noguera, 1996]. In comparison, in the α-
Li2O structure, the anion coordination number is 8 with a cation-anion distance of 1.79 A near the
transition. There is a 5.4 ± 0.3 % volume collapse across the transition.
Figure 5.7 shows the pressure-volume data of the two phases, along with the best fit 3rd
order Birch-Murnaghan equation of state (EOS) curves:
P =3
2B0(v
−7/3 − v−5/3)
[1 +
3
4(B′
0 − 4)(v−2/3 − 1)
](5.1)
where v = (V/V0). Also shown are experimental data points and calculated EOS curves from Ref.
[Kunc et al., 2005]. Fitting parameters are summarized in Table 5.2. Because of a limited pressure
range studied for β-Li2O, it was necessary to constrain B’ to equal 4. This approximation was based
on the procedure adopted by Grzechnik et al. [Grzechnik et al., 2000] in the case of Li2S. Variation
of this value between 3.5 and 4.5 resulted in at most a 12% difference in Bo and a 1% difference

80
16
18
20
22
24
0 10 20 30 40 50 60 70 80
45 50 55 60
2.80
2.85
2.90
4.45
4.50
4.55
5.15
5.20
5.25
bac -Li2O
b
V/V ~ 5.4 %
-Li2O
-Li2O
Pressure (GPa)
Vol
ume
per f
orm
ula
unit
(A3 )
c
a
Pressure (GPa)
latti
ce
para
met
ers
(A)
Figure 5.7: EOS for the two Li2O phases. In the main plot, solid curves are the Birch-MurnaghanEOS fits to the experimental data (shown as open circles) in this study. Solid squares are the exper-imental data from Ref. [Kunc et al., 2005] and dotted curves are the theoretically calculated EOS[Kunc et al., 2005] for both phases. Inset: trends in the evolution with pressure of the lattice param-eters in the β phase. Empty circles are data from this study (error bars shown when they exceed sizeof data points), and solid squares are experimental data from Ref. [Kunc et al., 2005].

81
Table 5.2: Birch-Murnaghan EOS fitting parameters. Volumes are given per formula unit.
Bo (GPa) Vo (A3) B’This work Ref. [Kunc et al., 2005] This work Ref. [Kunc et al., 2005] This work Ref. [Kunc et al., 2005]
α 90(1) 75(7)a 24.24(2) 24.69(9)a 3.51(5) 5.2(7)a
β 188(12) 80.8(18)b 20.0(2) 23.51(6)b 4 (fixed) 3.92(6)baExperimental resultsbCalculated results
in Vo. The agreement between experimental and calculated equations of state for α-Li2O suggest
that pressure is reasonably hydrostatic in this phase. Contrary to the results of Kunc et al. [Kunc
et al., 2005], under pressure we do not see major broadening of fluorescence line spectra from the
ruby pressure calibrant in the α phase, an observation which could indicate that this phase supports
substantial shear stress.
Although the single experimental data point shown for the high pressure β phase in Ref.
[Kunc et al., 2005], which was also acquired without a pressure medium, agrees well with the
present work, there is a dramatic disparity between their calculated equation of state and the ex-
perimental one from this study. The β-Li2O pressure-volume data from Ref. [Kunc et al., 2005]
are generated from ab initio total energy DFT calculations, using the Projector Augmented Waves
(PAW) method. In the high pressure phase, the lattice constants and internal positions are deter-
mined by a process of ‘relaxing’ these parameters (eight of them, in total), minimizing all forces at
each step. In the experiment, however, the proposed increase in PO with pressure may suggest an
increase in stress inhomogeneity as well, a highly non-hydrostatic state which is not well modeled
by the ’relaxed’ structure in the calculation. The use of an optimally hydrostatic pressure medium
in a future experiment may indicate just how well the theoretical model approximates reality in this
case. It is doubtful that non-hydrostaticity alone can explain away the discrepancy, however. If the
value for bulk modulus for the β phase were actually as close to that of the α phase as theory pre-
dicts, it is unlikely that non-hydrostatic effects would cause such a large ‘error’ in the experimental
equation of state of the β but not the α phase.
Although the dramatic factor-of-two increase in bulk modulus across this phase transition
appears anomalously large, actually a similar (and larger) increase is recorded for the antifluorite-
anticotunnite transition in Li2S [Grzechnik et al., 2000] and, although values for bulk modulus are
not quoted, it appears that a similar effect is seen in Na2S [Vegas et al., 2001]. An examination of
the pressure evolution of the a, b and c lattice parameters, shown in the inset of Figure 5.7, may
explain the large increase in bulk modulus. We find that the b-axis is much stiffer (almost three

82
400 600 800 1000 400 600 800 1000
61.7 GPa
49.1 GPa
50.3 GPa
23.4 GPa
Inte
nsity
(arb
. uni
ts)
9.1 GPa
Raman shift (cm-1)
62.5 GPa
25.3 GPa
ba
8.5 GPa
Figure 5.8: Raman spectra upon increasing (a) and decreasing (b) pressure. Cosmic radiation spikeswere removed from two of the spectra.
times greater) than the a and c axes. Thus, the trigonal prism chains shown in Figure 5.3b are seen
to be very rigid and to strongly resist compression. This is consistent with the sizable directional
effects which are apparent from the intensity variations of the diffraction rings in Figure 5.6.
5.4 Raman Spectroscopy
The pressure-induced changes in Raman spectra of Li2O give further evidence of a phase
transition beginning near 49 GPa upon increasing pressure, as shown in Figure 5.8. The low-
pressure α phase has four formula units per unit cube. Factor group analysis gives one Raman
active optical phonon mode T2g, which describes motion of the Li sublattice. This mode is seen in
the Raman spectrum near 575 cm−1 at low pressure. At the phase transition from α to β there is

83
a considerable lowering of symmetry and consequently a significant increase in number of modes.
The β phase has four formula units per unit cell, and factor group analysis yields 6Ag + 3B1g + 6B2g
+ 3B3g Raman active phonon modes. In the Raman spectrum of the β phase, we see three prominent
bands (near 750, 800 and 830 cm−1) and at least seven weaker bands at lower Raman shifts, not
counting even weaker features appearing as shoulders of these bands. Since the sample is powder,
a precise mode assignment for the Raman peaks is difficult. The observation of fewer modes than
predicted by group theory is likely due to accidental degeneracy, insufficient instrumental resolution,
and/or diminishingly weak intensity.
The pressure-induced shifts of the distinguishable Raman bands are plotted in Figure 5.9,
observed in both up (solid circles) and down (open circles) strokes of pressure. Experimental data
and theory curves from [Kunc et al., 2005] are also shown, for comparison. Data points are fit
with an equation of state derived from valence force field theory which was previously shown to be
physically realistic [Van Uden, 1 January 2002]. The frequency shifts with pressure of the individual
bands and the corresponding mode Gruneisen parameters are shown in Table 5.3. The Raman band
in the α phase shifts noticeably more rapidly than those in the β phase - a further confirmation of
a large difference in bulk modulus. The dotted lines represent the approximate transition pressures
upon increasing and decreasing pressure. There is a large (nearly 25 GPa) hysteresis in this transition
(also seen from Figure 5.8) and when decreasing pressure the β → α transition occurs near 25
GPa. Several of the orthorhombic Raman bands can be seen to overlap and undergo changes in
relative intensity in the pressure region between 25 and 45 GPa that is inaccessible when increasing
pressure. Kunc et al. [Kunc et al., 2005] observed a similar hysteresis and the data from their
Raman experiment agrees well with the present study. Their calculated results (shown as dotted
curves) for the α phase are also in very good agreement; the curve is almost perfectly aligned with
our experimental data in that phase. The β phase calculated phonon mode shifts, however, show
a marked disagreement. Nevertheless, this is not surprising as their EOS describes a much softer
material with much more homogeneous stress conditions, so the Raman bands would be expected
to occur at a lower frequency, and would shift more rapidly with pressure, as indeed the calculations
predict.
5.5 Discussion
The mechanism for the antifluorite-anticotunnite phase transition is already well under-
stood because of the numerous well-known pressure-induced fluorite-cotunnite transitions that oc-

84
0 10 20 30 40 50 60 70300
400
500
600
700
800
900
Kunc [12]
increasing pressure
Ram
an m
ode
frequ
ency
(cm
-1)
Pressure (GPa)
decreasing pressure
Figure 5.9: The shift in pressure of Li2O Raman bands. Solid lines are fits to the experimental datafrom this study. Red dotted lines represent the calculated theoretical pressure dependence of theRaman frequencies from Ref. [Kunc et al., 2005]. In the cubic phase, the theoretical curve lines upexactly with the experimental result from this study. Vertical dashed lines approximate the phasetransition pressure upon increasing and decreasing pressure.

85
Table 5.3: Frequencies, pressure coefficients, and Gruneisen parameters (all calculated at 50 GPa),for the plotted Raman modes of Li2O.
Phase ω[
1ω
dωdP
]γ
(cm−1) (10−3 GPa−1)
α-Li2O 758 5.5(5) 1.3(1)
β-Li2O 829 4.8(4) 1.8(2)
799 3.4(4) 1.3(2)
747 2.5(4) 0.9(2)
632 3.7(4) 1.4(2)
557 5.1(5) 1.9(2)
488 3.6(4) 1.3(2)
473 4(1) 1.4(2)
411 5(1) 1.9(2)
357 5.1(5) 1.9(2)
342 2.7(8) 1.0(2)
a b
Figure 5.10: (a) α-Li2O along the (111) plane, showing the transition mechanism to β-Li2O (b). Forthe cubic structure shown in (a), all oxygen ions are coplanar, located midway between planes oflithium ions which are separated by 1.032 A near 50 GPa. For the orthorhombic structure shown in(b), half the oxygen ions have moved into the lower plane of Li ions (shown as colored polyhedra)and half into the upper (empty), with the planes separated by 1.402 A near 50 GPa.

86
cur [Gerward et al., 1992, Leger et al., 1995]. If one pictures the antifluorite structure as (111)
planes of anions separated by pairs of (111) planes composed of ions from the cation sublattice, the
mechanism for the transition can be seen as a displacement of the anions in the [111] directions,
half to the adjacent upper plane and half to the adjacent lower plane, accompanied by rotations and
distortions of the Li triangular polyhedra within the planes (Figure 5.10). This transition has the
advantage of increasing the oxygen coordination number from 8 to a more stable 9, increasing the
average O-Li separation distance from 1.78 A to 1.89 A, and increasing the packing through the 5.4
% volume collapse from 17.56 A3/formula unit to 16.61 A3/formula unit near 50 GPa. At this pres-
sure, the α-Li2O phase lattice parameter is a = 4.126 A while the β-Li2O phase parameters are given
by a = 4.518 A, b = 2.808 A, c = 5.246 A. Accompanying this transition is a remarkable 100 GPa
increase in bulk modulus, for which an inhomogeneous stiffening of the material along the b-axis
is at least partially responsible. The repulsion between closely spaced and highly charged ions also
contributes to the overall stiffening of the crystal lattice, and threatens to destabilize the structure
unless the coordination number is high around the most highly charged (O2−) ions. Therefore, a
transition to an Ni2In-type structure is expected at higher pressure, as it would further increase the
anion coordination number to 11.
An examination of the known behavior of alkali-metal chalcogenides under pressure may
allow us to understand and predict the behavior of this class of materials. Although Li2O is the first
alkali-metal oxide which has been shown to possess a pressure-induced antifluorite-anticotunnite
transition, it is common in alkali-metal sulfides [Grzechnik et al., 2000, Vegas et al., 2001, Schon
et al., 2001]. Li2S, Na2S, K2S, and Rb2S have all been shown or are predicted to undergo an
antifluorite to anticotunnite transition, at lower and lower pressures with increasing cation size until,
in Cs2S, the anticotunnite phase is stable at ambient conditions (Figure 5.11). These compounds
are predicted to undergo a second transition from the anticotunnite to a hexagonal Ni2In-type phase
at even higher pressure [Schon et al., 2001] and so it is likely that Li2O will do the same, although
the calculations of Kunc et al. [Kunc et al., 2005], indicate that this will not occur below 100 GPa.
Alkali metal oxides K2O, Na2O and Rb2O also have the antifluorite structure at ambient
conditions [Dovesi et al., 1984, Lide, 1998]. The only alkali metal oxide exception is Cs2O, which
has been seen to possess the CdCl2 structure [Tsai et al., 1956] which, however, is a simple rhom-
bohedral distortion of the fluorite structure. No high-pressure studies have been performed on these
materials, but we can reasonably expect that they will follow the same series of transitions that have
been observed here. Ice also, in the past, has been predicted to exist in the antifluorite structure at
sufficiently high pressure [Demontis et al., 1988, 1989]. Since then this proposition has been called

87
Fm3m Pnma + Pn21a PnmaLi2S
Fm3m Pnma Ni2InNa2S
distorted Ni2In (Pmma)K2S
Ni2InRb2S
distorted Ni2In (Cmcm)
Ni2In (P63/mmc or Cmcm)Cs2S Pnma
30 60 GPa
Fm3m PnmaLi2O
antifluorite (Fm3m) anticotunnite (Pnma) Ni2In (P63/mmc)
H2O ?Ice Ih XVIIVIVIII
GPa
45150
Figure 5.11: Comparison of Li2O pressure behavior with that of the alkali-metal sulfides. H2O maytransition to a cubic antifluorite-type phase above 170 GPa, and, in the nonmolecular form, may beexpected to follow the same trends as the alkali metal chalcogenides. 5 represents the high pressurelimit of experiments.

88
into question, but the actual high pressure structure remains to be seen experimentally, and is most
currently not predicted to exist below 170 GPa [Benoit et al., 2002]. Ice VII gradually becomes
”symmetric” ice-X at the pressure range of 40-90 GPa, with a bcc oxygen sublattice, similar to
that of ice VII but with hydrogen atoms occupying the central position between adjacent oxygen
atoms. The possibility of a transition of ice X to a phase similar to that of α-Li2O could indicate a
systematic pressure-induced structural behavior for all alkali-metal chalcogenides.
5.6 Conclusion
A recently discovered pressure-induced antifluorite-anticotunnite phase transition, seen
for the first time in an alkali-metal chalcogenide [Kunc et al., 2005], was investigated in detail using
x-ray diffraction and x-ray Raman scattering. Several new properties of the high pressure phase
were discovered. A dramatic increase in bulk modulus was seen for the first time, and the source
of the high pressure phase’s rigidity identified to be related to an inhomogeneous stiffening of one
of the crystal lattice parameters. A consequent preferred orientation which increases with pressure
in the orthorhombic phase was identified as responsible for an inversion in the intensities of two
of the most prominent x-ray diffraction peaks. The pressure-induced shift in the Raman bands of
both phases was observed, and found to be consistent with our observation of a large bulk modulus
increase. The x-ray diffraction and Raman data both point towards a strong hysteresis across this
transition, which is consistent with a kinetically hindered or sluggish first-order transition, or one in
which a large volume change and a large change in bulk modulus can serve as nucleation barriers for
the transition. Comparisons were drawn between Li2O and a series of alkali metal sulfides, allowing
us to make confident predictions about the high pressure behavior of the rest of the alkali-metal
chalcogenides and even, perhaps, the behavior of dense, nonmolecular ice at ultrahigh pressures.
5.7 Acknowledgments
We would like to thank J. P. Klepeis for many helpful discussions. This work has been
supported by the LLNL, University of California, under the auspices of the U.S. DOE under Con-
tract No. W-7405-ENG-48 and by the Stewardship Science Academic Alliances Program under
grant DOE 01-06NA26204. Use of the HPCAT facility was supported by DOE-BES, DOE-NNSA
(CDAC, LLNL, UNLV), NSF, DOD-TACOM, and the W. M. Keck Foundation. We thank HPCAT
beamline scientist Maddury Somayazulu for technical assistance.

89
Chapter 6
Search for superconductivity in lithium
borocarbide at high pressure
6.1 Introduction
In 2001, the discovery of superconductivity below a critical temperature (Tc) of 39 K in
metal diboride MgB2 [Nagamatsu et al., 2001] has led to an extensive search for similar behavior
among related intermetallic compounds. Superconductivity (the state of a material in which current
can flow with zero resistance, and magnetic fields are expelled) in this material is unusual and
unexpected because at the time of the discovery, it was thought that superconductivity was becoming
pretty predictable. BCS theory seemed to do a good job with the conventional element and alloy
superconductors (which generally exhibit superconductivity at very low temperatures - near absolute
zero and much lower than that of MgB2). For higher critical temperatures, superconductivity was
thought to be limited to complex cuprate or perovskite ceramics, discovered in 1986 [Bednorz and
Muller, 1986]. And these so called ’high-Tc’ (Tc ¿ 90 K) have structures and compositions which
are manifestly different from that of the simple intermetallic MgB2.
BCS theory (put forth by and named after Bardeen, Cooper and Schreiffer [Bardeen et al.,
1957]) asserts that phonons (small collective movements of the positively charged ions in the lattice)
mediate coupling of pairs of electrons (called Cooper pairs) and facilitate their frictionless, collec-
tive motion through the crystal. The pairing of electrons opens up a gap in the continuous spectrum
of allowed energy states, such that small excitations (such as scattering of electrons off of ions – the
usual energy-dissipative effect in normal conductors) are suppressed, since they do not possess the

90
minimum energy required to excite the system. The size of this energy gap is related to the binding
energy of the electron pairs, and it is closely related to the transition temperature. BCS theory is
insufficient, however to explain the behavior of the high-Tc materials and the true explanation is in
fact still unknown.
Electron-phonon coupling was indeed eventually established as the actual source of super-
conductivity in MgB2, but with some exotic new features [Choi et al., 2002, Pickett, 2002]. Other
conventional superconductors possess a high density of charge carriers - usually from open d-shells;
in MgB2 only the s and p shell electrons are involved, and even then only about half of them. In
other conventional superconductors, all electrons behave the same way. In MgB2, however, there
are two separate populations of electrons at the Fermi level (both of boron p character), each of
which results in a superconducting energy gap. The larger gap corresponds to a Tc of 45 K, and the
smaller to one of 15 K. They operate together in a nontrivial way to produce the observed Tc of 39
K.
In an attempt to better understand this new breed of superconductivity, a large variety
of roughly related compounds have been examined for similarity. Lithium borocarbide (LiBC) is
isovalent with and structurally similar to MgB2 (Figure 6.2), with hexagonal sheets of BC in place
of B2 and Li in place of Mg (Figure 6.1) [Worle et al., 1995]. However, due to the alternation of
B and C atoms within and perpendicular to the hexagonal sheets, LiBC is an insulator [Fogg et al.,
2003, 2006]. If it can be driven metallic, such as by hole-doping, suggestions of superconductivity
to temperatures even higher than MgB2 have been made [Ravindran et al., 2001], and verified by
calculations of electron-phonon coupling strength [Rosner et al., 2002, Dewhurst et al., 2003]. How-
ever, no experimental efforts to date have reported superconductivity above 2 K in this compound
[Nakamori et al., Fogg et al., 2003, 2006, Zhao et al., 2003, Bharathi et al., 2002, Renker et al.,
2004, Souptel et al., 2003], and additional theoretical studies have attempted to further illuminate
the behavior of LiBC [Fogg et al., 2003, 2006, Dewhurst et al., 2003, Kobayashi and Arai, 2003a,b,
Lebegue et al., 2004, 2005]. An investigation of lattice dynamics of LixBC at various annealing
temperatures has shown that standard hole-doping techniques may remove only small amounts of
surface Li - insufficient for superconductivity [Renker et al., 2004]. Resonant inelastic x-ray scatter-
ing experiments have been interpreted in terms of lack of complete hybridization between B and C
states, indicating that electronic structure calculations may inadequately describe this material since
they do not take into account this effect, or such effects as B-C disorder and structural relaxation
near hole dopants [Karimov et al., 2004].
Although high Tc superconductivity in LixBC continues to elude us, over the course of the

91
Figure 6.1: LiBC crystal structure. White, black and grey atoms represent lithium, carbon andboron, respectively.
previous investigations several other interesting properties of LiBC have been suggested, including
extreme anisotropy in the thermal expansion [Fogg et al., 2003, 2006] and Born effective charges
[Lee and Pickett, 2003], and calculated anomalous behavior of the c-axis lattice constant under
pressure which implies a sort of negative Poisson ratio [Kobayashi and Arai, 2003a,b].
As an alternative to hole-doping, another possibility for producing an insulator-metal
transition and possible superconductivity is by applying pressure. In this paper we pursue this
possibility both with experiment and theory calculations, and we investigate trends and changes in
structural and bonding anisotropy under pressure, including the predicted lattice parameter anomaly
[Kobayashi and Arai, 2003a,b].
6.2 High Pressure Experiments
The synthesis of LiBC has been reported before [Zhao et al., 2003] and is summarized
here. Amorphous boron (99.99%, 325 mesh, Alfa Aesar) and carbon (99.9999%, 200 mesh, Alfa
Aesar) powders were thoroughly mixed in a 1:1 atomic ratio for ∼45 minutes. Lithium (99.9%,

92
� �
Figure 6.2: MgB2 structure [Zweiacker].
ingot, Alfa Aesar) was added to the boron-carbon mixture in a 1.2:1:1 (Li:B:C) atomic ratio in an
argon-filled dry box. The elements were mixed together for ∼2 hours with a mortar and pestle,
resulting in a uniform black powder which was then pressed at ∼0.4 GPa into a 6 mm diameter
pellet. This pellet was placed in an argon-filled arc-furnace. The argon was first purified by arc
melting a zirconium pellet. The Li1.2BC pellet was arc melted, starting a self-sustaining exothermic
reaction where the excess lithium (having served as a flux) was released, resulting in a golden LiBC
pellet.
Pieces of LiBC cut from the arc-melted pellet were loaded into a membrane diamond
anvil cell (DAC) of Livermore design. Brilliant cut diamonds with 0.3 mm flats were used with a
0.15 mm diameter sample chamber in a rhenium gasket of 0.05 mm initial thickness to achieve a
pressure range of 1 to 60 GPa. No pressure medium was used in the experiments, as the reactivity
of LiBC is uncertain. Copper was included in the sample chamber as an internal pressure indicator.
All sample loadings were performed in an inert environment, as LiBC is hygroscopic.
High-pressure behavior of LiBC was investigated by angle dispersive x-ray diffraction
(ADXD) at ambient temperature at the microdiffraction beamline BL10XU of the SPring-8 facil-
ity. In these experiments, we used intense monochromatic x-rays (λ = 0.4168 A) microfocused to

93
5 10 15 20 25
Cu
Cu
CuCu
Cu
* (202
)(110
)
(004
)
(102
)
(100
)
(002
)
In
tens
ity (a
rb. u
nits
)
2
observed calculated difference
Figure 6.3: Sample GSAS refined ADXD pattern for LiBC and Cu at∼4.5 GPa. Major LiBC peaksare labeled with their hkl indices. The small peak labeled with an ∗ near 2Θ=21◦ does not originatefrom the sample.
about 0.02 mm at the sample. The x-ray diffraction patterns were recorded on a high-resolution
image plate detector (Rigaku R-AXIS IV) and x-ray charge-coupled device (Bruker APEX). The
recorded two-dimensional diffraction images (Debye-Scherrer rings) were then integrated to pro-
duce high quality ADXD patterns using FIT2D [HAM] and analyzed with the XRDA [Desgreniers
and Lagarec, 1994] and GSAS (EXPGUI) [Toby, 2001] programs.
6.3 Theoretical Calculations
We performed electronic structure calculations using the mixed basis set of augmented
plane waves + local orbitals (APW+lo) and linearized augmented plane waves (LAPW) as imple-
mented in WIEN2k code [Blaha et al., 2001]. A gradient corrected Perdew-Berke-Ernzerhof (PBE)
functional [Perdew et al., 1996] (Generalized Gradient Approximation; GGA) to density functional
theory was used to describe the exchange and correlation effects. Muffin tin radii (Rmt) were set so
that neighboring muffin tin spheres were nearly touching at each volume, and the plane wave cutoff

94
34
36
38
40
42
44
46
0 10 20 30 40 50 60 70
0 20 40
2.3
2.4
2.5
2.6
Pressure (GPa)
Vol
ume
per u
nit c
ell (
A3 )
experimental results theory results Kobayashi et al. results
c/a
Pressure (GPa)
Figure 6.4: Equation of state of LiBC up to 60 GPa. The solid line is a third-order Birch-Murnaghanfit to the experimental data, and the dotted line represents the calculated theoretical equation of state.In the inset, results from this study are compared with those of Kobayashi et al. [Kobayashi andArai, 2003a,b] for the evolution of c/a with pressure.
Kmax was determined by RmtKmax = 9.0. The Brillouin zone was sampled on a uniform mesh with
280 irreducible k-points. The energy convergence criterion was set to 0.1 mRy.
6.4 Experimental Results
The LiBC crystal structure shown in Figure 6.1 (first determined by Worle et al. [Worle
et al., 1995]) was confirmed from a Rietveld refinement of the ADXD spectra. A sample refinement
at 4.5 GPa is shown in Figure 2. The compound takes on D46h (P63/mmc) space group symmetry
with Li, B and C atoms in 2a, 2c, and 2d Wyckoff positions, respectively. The B and C atoms alter-

95
nately occupy the sites within graphenelike hexagonal sheets, and Li ions fill the interlayer regions.
The unit cell along the c axis is doubled, because of the alternating stacking of the BC layers, with
B superposed directly above C. The compound was found to remain stable in the ambient pressure
phase up to 60 GPa, which was the maximum pressure achieved in the experiment. Experimental
pressure-volume data are shown in Figure 6.4, and fit with the 3rd order Birch-Murnaghan equation
of state (Equation (5.1)). Fitting parameters are: V0=45.62(7) A3 per unit cell, B0=125(3) GPa,
and B’=3.7(1). The equation of state was also calculated from first principles and the results are
shown as the dotted curve in Figure 6.4, with equation of state fitting parameters V0=46.04(5) A3,
B0=123(2) GPa and B’=3.43(9). Agreement between experiment and theory for LiBC is remarkably
good. The bulk modulus of this material is of the same order as that of MgB2 and other AlB2-type
compounds, which range from 105 to 193 GPa [Ravindran et al., 2001]. The compressibility is
moderate, but the good agreement between calculations (for which fully hydrostatic compression is
enforced) and experiment indicates that, although no pressure medium was used in the experiment,
conditions in the DAC sample chamber appear quasi-hydrostatic.
The evolution of the c/a lattice parameter ratio is shown in the inset of Figure 6.4, com-
pared with the calculations of Kobayashi and Arai [Kobayashi and Arai, 2003a,b] (with the volume
values quoted in [Kobayashi and Arai, 2003a,b] transformed to pressures using the equation of state
obtained in this study). Using all-electron calculations of precisely the same sort also employed
here, they find that the c/a ratio actually increases as volume is reduced. The reason for the sig-
nificant disparity between the results of this work and those presented in [Kobayashi and Arai,
2003a,b] is unclear, but it appears to significantly undermine their conclusions. They claim that
this unexpected c/a increase with pressure gives further evidence for an anomalous c-axis contrac-
tion under anisotropic a-b compression (implying a negative Poisson ratio), which was obtained by
first-principles molecular dynamics calculations.
The linear compressibility of LiBC is compared with a variety of other low-Z layered
hexagonal materials, including MgB2, by fitting normalized lattice parameters as a function of pres-
sure with the one-dimensional analog to the first order Murnaghan equation:
r/r0 = [(β′/β0)P + 1]−1/β′ . (6.1)
This procedure provides a very approximate description of the nonlinear relation between lattice
parameters and pressure. Curves are shown in Figure 6.5, and β0 fitting parameters (relative rather

96
0 10 20 300.80
0.85
0.90
0.95
1.00
c/co
(c) (a)00LiBC 180(4) 922(35)MgB
2 333(23) 625(89)
graphite 35(5) 1200(36)h-BN 37.6(1) 2113(41)diamond 1318(7)
a/ao
a/a 0,
c/c 0
Pressure (GPa)
Figure 6.5: High pressure behavior of a and c lattice parameters (normalized to ambient-pressure a0
and c0), compared with MgB2 and similar layered hexagonal compounds [Goncharov et al., 2001,Zhao and Spain, 1989, Solozhenko et al., 1995] as well as with diamond [Occelli et al., 2003].Curves shown are the first-order Murnaghan equation (Equation 2) fits to experimental data (circles).Values for first order axial compression coefficients (as described in the text) are shown in the insetfor LiBC and related compounds [Goncharov et al., 1996, Zhao and Spain, 1989, Solozhenko et al.,1995, Occelli et al., 2003]. β−1
0 is the linear compressibility at zero pressure.

97
than exact numerical values should be taken as physically meaningful) are summarized in the inset.
Ambient pressure lattice parameters were not measured experimentally for LiBC since the diamond
anvil cell was loaded at ∼0.8 GPa, and so these values were taken from the fitting with Equation
(6.1), yielding a0 = 2.7141(7) A and c0 = 7.146(5) A.
The a-axis compressibility of LiBC is shown to be quite close to that of diamond and
graphite a-axis compressibilities, confirming the existence of strong covalent bonds within the
hexagonal BC planes. LiBC is over five times more compressible along the c-axis than along the
a-axis, indicating much weaker interlayer bonding, similar to the van der Waals-type interactions
between neighboring planes in h-BN. The greater stiffness along the c-axis of LiBC compared to
graphite and h-BN, however, is most likely a result of the presence of Li ions between the planes,
just as the larger Mg ions in MgB2 contribute to an even larger c-axis stiffening.
6.5 Discussion
The anisotropy in linear compressibility is clearly related to bonding in the material,
which we investigate with electronic structure calculations. An examination of the calculated pro-
jected density of states in Figure 6.6 reveals the hybridized states which form covalent bonds in
LiBC. The σ states are formed mainly by bonding combinations of sp2 states on both B and C, as
in graphite. Lee and Pickett find that B and C are very different chemically, however, with Born
effective charges of approximately +1, +2 and -3 given for Li, B and C [Lee and Pickett, 2003].
Figure 6.7 shows that the electron density is indeed largely concentrated in the sp3 orbitals around
the carbon atom; the covalent bond is strongly polarized and the atomic interactions are a mixture
of covalent and ionic and remain thus up to metallization. Part of the stiffness of the material in the
x-y plane is due to Coulomb repulsions between the significantly electronegative C atoms. It is the
BC alternation within the plane that is responsible for the gap (at Γ; see Figure 6.8) in the σ states;
a gap which increases initially as pressure is increased (similar to the gap between bonding and
antibonding σ bands in diamond [Surh et al., 1992]) and remains large up to metallization, with the
bonding σ states remaining fully occupied and dropping further and further below the Fermi level.
The interplanar bonding, as is obvious from the experimentally determined high com-
pressiblity, is much weaker than that which exists within the planes. The lack of electron density
in the interstitial regions between the BC planes (Figure 6.7c), and the small amount of hybridiza-
tion seen from the projected density of states (Figure 6.6) shows that the B pz and C pz states
are relatively localized and weakly interacting. The B-C alternation along the c-axis is responsible

98
-15 -10 -5 0 5 0.000
0.025
0.050
0.00
0.05
0.10
0.15
Li p x +p
y
Li p z
Li s
Energy (eV)
(b)
(a) C p x +p
y
C p z
C s B p
x +p
y
B p z
B s
P
artia
l Den
sity
of S
tate
s (s
tate
s*eV
-1
*f.u
. -1 )
Figure 6.6: Projected density of states at ambient pressure (a) and at metallization (b).

99
0.6
0.4
0.2
C
B
Li
CLi
B0.21
CB
(a) (b)
(c) (d)
Figure 6.7: Electron density in (a) the (0001) plane, (b) the (1010) plane and (c) contours along the(1010) plane at ambient and (d) metallization pressure. Contour values are given in units of e/A3.Subsequent contours differ by 0.2 e/A3.
for the gap between the primarily C pz upper valence bands and the B pz conduction bands. As
pressure increases, this gap eventually collapses as the BC layers are brought closer together and
the bands broaden. Lee and Pickett [Lee and Pickett, 2003] propose that there is considerable cova-
lency between Li and the BC layers, particularly between Li and C. This effect is not obvious from
an examination of the electron density and the projected density of states (Figure 6.7), but it appears
that this covalency increases with pressure since, at metallization, the valence bands between 0 and
-14 eV have acquired very appreciable Li character.
The bandstructure of LiBC is shown in Figure 6.8. At ambient pressure, it bears many
similarities to that of MgB2 (Figure 6.9); they both have nearly flat bands of p σ character at the
top of the valence bands between Γ and A (which, in MgB2, cross the Fermi level to form nearly
cylindrical Fermi surfaces around the Γ point), as well as bonding and antibonding p π bands near

100
Γ M K Γ A L H A
E F
Ene
rgy
(eV
)
0
2
4
6
8
-2
-4
-6
-8
-10
-12
-14
-16Γ M K Γ A L H A
E F
Ene
rgy
(eV
)
0
2
4
6
8
-2
-4
-6
-8
-10
-12
-14
-16
Γ M K Γ A L H A
E F
Ene
rgy
(eV
)
0
2
4
6
8
-2
-4
-6
-8
-10
-12
-14
-16
Γ M K Γ A L H A
E F
Ene
rgy
(eV
)
0
2
4
6
8
-2
-4
-6
-8
-10
-12
-14
-16
Figure 6.8: Bandstructures at ambient pressure (top left), ∼60 GPa (top right), ∼325 GPa (bottomleft) and ∼450 GPa (bottom right).

101
� �
Figure 6.9: MgB2 bandstructure [Kortus et al., 2001]. The fatter bands represent boron characterwith pz bands shown in red and px+py bands shown in black

102
the Fermi level (which cross it, to form Fermi surface ’webbed tunnels’ in the case of MgB2) near
the M and K regions. For MgB2, these two Fermi surface features are characterized by different
superconducting energy gaps, making it a a two-band superconductor with a transition temperature
of 39 K [Choi et al., 2002]. The bandstructure of LiBC was investigated under pressure, to see if
any similar features would evolve. As pressure increases, the occupied p σ bands (which have a
mixture of boron and carbon character) drop in energy with respect to the C π bands, losing their
flatness between Γ and A and dropping even further below the Fermi level. The gap between the σ
and σ* bands remains large. The unoccupied p π bands (predominantly from boron) drop in energy
at L and H, while increasing between Γ and M and between Γ and K, and finally overlapping to
become semimetallic at a calculated pressure of 324 GPa (V/V0 = 0.46), which is a lower limit
since the GGA approximation tends to cause an underestimate of the band gap. This is an indirect
gap closure, and the direct gap near M and K, which is closed in the case of MgB2, becomes
larger under pressure. After metallization, the density of states at the Fermi level increases rather
rapidly to 0.1 eV−1 by 450 GPa (compared to N(EF ) ∼0.7 eV−1 in MgB2 and Li0.5BC [Rosner
et al., 2002]), but none of these states come from the σ bands, which are of primary importance
for superconductivity in the case of MgB2. We have not investigated the issue of electron-phonon
coupling, but this examination of the electronic behavior alone indicates that we are very unlikely to
see LiBC become superconducting under pressure experimentally; indeed (assuming no additional
phase transitions), it does not even metallize in a range which is practically achievable using current
static high pressure methods.
6.6 Conclusion
LiBC is shown experimentally to remain stable in the ambient pressure crystal structure up
to at least 60 GPa. Under quasihydrostatic pressure no anomalous behavior of the lattice parameters
was observed; reducing the volume caused a drop in the c/a ratio representing the expected move-
ment towards a more close-packed, isotropic material. The large anisotropy in linear compressibility
indicates that the bonding in this material is also highly anisotropic. The strong intralayer bonding -
similar to h-BN and graphite interlayer interactions - has a mixture of covalent and ionic character.
There is very little interaction between neighboring layers, resulting in high compressibility along c.
Increasing pressure causes increased interlayer interaction, as well as an increase in covalency be-
tween Li and neighboring BC planes. Calculations do not predict metallization until over 325 GPa,
and by that pressure the electronic structure has become dissimilar to that of MgB2. Most impor-

103
tantly, the increased gap in the σ bands indicates that, if superconductivity were to appear, it must
be of a sort unrelated to the σ states, such as has been observed in graphite intercalate compounds
[Csanyi et al., 2005] rather than MgB2.
6.7 Acknowledgements
Work at the SPring-8 BL10XU was performed with the approval of the Japan Synchrotron
Radiation Research Institute (JASRI), and has been supported by the LDRD(04ERD020) and SEGRF
programs at LLNL, University of California, under DOE Grant No. W7405-ENG-48, by the SSAAP
(DE-FG01-06NA2620) and by the Alfred P. Sloan Foundation.

104
Appendix A
Structure Solution
Solving for a crystal structure from x-ray diffraction intensity vs. 2Θ two-dimensional
profiles (for example, Figure 2.11) is a process involving many steps, of which we will here give
an overview.
A.1 Indexing
The first task is to locate the 2Θ positions of the peaks in the diffraction pattern and from them index
the crystal system and unit cell dimensions. Each of the peaks for a particular phase will correspond
to a reflection from a particular Bragg plane in the crystal, whose orientation is described by a set
of indices usually labeled with h, k and l and known as the Miller indices. They are actually the
(dimensionless) reciprocals of the fractional intercepts of a particular crystal plane with the real
space x, y and z axes. The d-spacing of a particular lattice plane can be constructed in real space as:
~d = ax + by + cz (A.1)
which, in a crystal in which a = b = c = a0, can be written as:
~d = a0
[x
h+
y
k+
z
l
](A.2)
and the magnitude as:
|~d| = dhkl =a0√
h2 + k2 + l2(A.3)

105
Table A.1: Lattice parameter and angle relationships for the seven crystal classes
Triclinic a 6= b 6= c α 6= β 6= γMonoclinic a 6= b 6= c α = γ = 90◦ 6= βOthorhombic a 6= b 6= c α = β = γ = 90◦
Tetragonal a = b 6= c α = β = γ = 90◦
Cubic a = b = c α = β = γ = 90◦
Trigonal a = b = c α = β = γ < 120◦ 6= 90◦
Hexagonal a = b 6= c α = β = 90◦, γ = 120◦
The relationship between dhkl and h, k and l and in the other seven crystal systems can be worked
out as well (from the lattice parameter angle specifications shown in Table A.1) and are given below.
Cubic:1d2
=h2 + k2 + l2
a20
(A.4)
Tetragonal:1d2
=h2 + k2
a20
+l2
c20
(A.5)
Hexagonal:1d2
=43
(h2 + hk + k2
a20
)+
l2
c20
(A.6)
Rhombohedral:
1d2
=(h2 + k2 + l2)sin2α + 2(hk + kl + hl)col2α− cosα)
a20(1− 3cos2α + 2cos3α
(A.7)
Orthorhombic:1d2
=h2
a20
+k2
b20
+l2
c20
(A.8)
Monoclinic:1d2
=1
sin2β
(h2
a20
+k2sin2β
b20
+l2
c20
− 2hlcosβ
a0c0
)(A.9)
Triclinic:1d2
=1
V 2(S11h
2 + S22k2 + S33l
2 + 2S12hk + 2S23kl + 2S13hl) (A.10)
where V = volume of the unit cell and
S11 = b20c
20sin
2α, (A.11)
S22 = a20c
20sin
2β, (A.12)

106
S33 = a20b
20sin
2γ, (A.13)
S12 = a0b0c20(cosαcosβ − cosγ), (A.14)
S23 = a20b0c0(cosβcosγ − cosα), (A.15)
S13 = a0b20c0(cosγcosα− cosβ). (A.16)
Continuing with the simple cubic case, the d spacing of a crystal can then be related to
the 2Θ peak position by the Bragg condition:
nλ = 2dhklsin(Θ) = 2a0√
h2 + k2 + l2sin(Θ) (A.17)
and,
h2 + k2 + l2 =(
2a0
nλ
)2
sin2(Θ) (A.18)
Now we have a clear relation between the hkl indices of each peak, and the peak positions. λ and
Θ are known for each peak but a0 is not yet known. For the simplest systems (cubic, tetragonal
and hexagonal), it is possible to identify the hkl indices for the first few peaks by hand. For more
complex systems, a computer algorithm (autoindexing program) must be used. A procedure for
indexing the peaks for a simple lattice is as follows.
h, k and l are integer values, and for the first few diffraction peaks, they are small (between 0 and
3), so, in (A.18), h2 + k2 + l2 is going to take on integer values between 0 and 27. (2a0/nλ)2 is
unknown but a fixed value for every diffraction peak, and sin2Θ is known for each peak. So, all
we need to do is find values of h, k and l that give a constant value for each peak when divided by
sin2Θ for that peak. From that constant value, the lattice parameter a0 can be calculated.
Another way to do this is to look at the ratios of two peak positions from the same phase:
h21 + k2
1 + l21h2
2 + k22 + l22
=sin2(Θ1)sin2(Θ2)
(A.19)
which can give us some simple and identifiable fractions from which h, k and l can be inferred. For
all nonprimitive classes of crystals, certain hkl reflections will be systematically absent, and it is
from these that the particular space group can be calculated.

107
As has already been stated, this process is only really practical for the simplest crystal
system. For more complex systems, an autoindexing program must be used. There are many avail-
able for free from http://www.ccp14.ac.uk such as Crysfire or Checkcell. These programs take as
input the peak positions and wavelength and will generate cell parameters and look for best space
group solutions.
A.2 Whole profile fitting and Rietveld refinement
The x-ray diffraction peaks, in an idea crystal with perfect instrumentation for collecting
scattered photons, would appear as delta functions. Their positions and intensities would be known
exactly, from which cell parameters and atom positions could be calculated with a high degree of
accuracy. We have already discussed the relationship between peak position and unit call parameter.
The intensity of diffracted peaks is directly related to the atom positions through the structure factor,
which can be defined as follows:
Fhkl =N∑
j=1
fjexp[2πi(hxj + kyj + lzj)] (A.20)
where Fhkl is the amplitude and phase for a particular hkl reflection, the sum is over every atom
(total of N atoms) in the cell, fj is called the scattering factor of atom j (related to the number of
electrons and, thus, the atom type), and xj , yj and zj are the coordinates of atom j.
In reality, however, these peaks are broadened and shifted slightly by effects such as
instrument resolution, thermal motion, crystallite (domain) size in the sample, stress, strain or pre-
ferred orientation in the sample (an especially critical effect in high pressure crystallography), and
stacking faults or other crystalline defects. These result in uncertainties in peak positions (especially
when there are several different crystalline phases with partially or completely overlapping peaks)
and intensity. These effects must all be deconvolved and taken into account in order to generate
accurate structures. In addition, we can learn some interesting things about the material (especially
under pressure) from strain effects and various kinds of defects which effect the diffraction pat-
tern. The process of creating a model diffraction pattern which accurately accounts for all phases
contributing to a diffraction pattern, and all the effects mentioned above is known as the Rietveld
method [Rietveld, 1967, 1969], which we will now summarize (for the case of powder diffraction).
The intensity of the diffraction peak is related to the square of the structure factor. The
formulation employed in the GSAS program for Rietveld refinement [Larson and Dreele, 2000]

108
(which is also available from http://www.ccp14.ac.uk, as well as a nice graphical interface called
EXPGUI [Toby, 2001]) describing the observed intensity of a peak is as follows:
Io = Ib + Id + Sh
∑p
SphYph (A.21)
where Ib represents the contribution from the background, which is modeled as an empirical func-
tion, Id is an additional (and optional) contribution to the background from diffuse scattering, Sh
and Sph are scaling factors for a particular x-ray diffraction powder profile (called a histogram
within the program, which is why it is labeled with an ’h’), and for a particular phase (labeled ’p’)
within that profile. Yph is the intensity of the bragg peak, which is directly related to the square of
the structure factor given in (A.20). It can be defined as follows:
Yph = |Fph|2 ·H(T − Tph) ·Kph (A.22)
where H(T − Tph) is a profile peak shape function and Kph is a product of several correction
factors:
Kph =EphAhOphMpL
Vp, (A.23)
of which I will only identify explicitly Oph; the correction for preferred orientation in the sample,
which becomes especially useful in analysis of high pressure diffraction data.
There are two possible approaches to solving the problem of extracting structure factors
(Fo) from a real experimental diffraction profile. One is to start with the crystal structure, calculate
the structure factor (Fc) and generate an ideal profile. The observed structure factor (Fo) is then
calculated by treating the intensity ratios between peaks as the same as the calculated ratios from
the ideal pattern. In this way, the starting values are biased by the particular structure model used to
calculate the structure factors.
The calculated intensity can then be modified with the various effects such as background
scattering, preferred orientation and others mentioned above until it matches well with observed
intensity. Mathematically, we are attempting to do a least-squares minimization of a function like
this:
Mp =∑
w(Io − Ic)2 (A.24)

109
, where w is a weighting factor, and Io is the observed and Ic the calculated intensity at each step.
The residuals giving the quality of the refinement are defined as:
Rp =∑ |Io − Ic|∑
Io(A.25)
and
Rwp =
√Mp∑wI2
o
, (A.26)
which are used to assess the progress of the refinement at each step. This is the Rietveld refinement
method.
The second approach, known as the Le Bail method [Bail et al., 1988] (which is really just
a starting point for the Rietveld refinement), is to work backwards by generating structure factors
from the real observed intensity. This is accomplished by setting all the calculated structure factors
Fc = 1 and running the least-squares algorithm to extract Fo. The set of Fo’s from the first cycle
are then used as the Fc’s for the next, until a good fit is reached. The profile shape parameters and
lattice parameters (from the peak positions) may also be refined at every step in this process, since
they are not dependent on the structure factor. This second method requires no detailed structural
information about any of the phases contributing to the diffraction pattern (aside from the space
groups and initial estimates of lattice parameters, which we have already indexed in the previous
step), but it generates an estimate for the structure factors of each, which are then used in the full
Rietveld refinement.
There are many possible profile function (H(T −Tph)) types to select from in GSAS. The
one used in these studies is based on a pseudo-voight (F (∆T )) [Thompson et al., 1987] description
of the line shapes:
H(∆T ) =n∑
i=1
giF (∆T ′) (A.27)
where the function F (∆T ′) is a combination of gaussian and lorentzian components, for which
there are eighteen possible refinable coefficients corresponding to adjustments of full width half-
maximum (FWHM), asymmetry parameters, gaussian and lorentzian fractions and others. This
(and most) Rietveld refinement programs are designed for high quality ambient pressure diffraction
patterns, where signal-to-noise ratio is good and hundreds of peaks are identifiable. This is most
certainly not the case for high pressure crystallography, in which all scattered photons are coming

110
through the diamond (introducing a large amount of background scattering) and cut off at high angle
by the dimensions of the DAC. It is dangerous (and unhelpful) when analyzing high pressure data
to attempt refinement of too many parameters, due to the overall poor quality of the diffraction
patterns. In these studies, the only profile parameters refined were the FWHMs of the gaussian and
lorentzian components.
After a good Le Bail fitting (and well defined lattice parameters and profile coefficients)
has been achieved, the precise crystal structure is refined using the Rietveld method, with starting
values for observed structure factor (F 2o ) derived from the Le Bail fitting. Parameters in the Ri-
etveld refinement include background scattering (for which there are several empirical functions to
select from, some of which are tailored for specific types of background scattering. In this study,
the Chebyshev polynomial fit was always a good choice. The atomic positions (x, y and z from
(A.20), fractional occupation of atomic sites and thermal motion corrections (contributions to the
atomic scattering factors fj in (A.20)) can all have an effect on the peak intensities and were all
refined in these studies. The fraction of each phase contributing to the diffraction pattern was also
refined (relating to the relative intensities of peaks from different phases), and finally the preferred
orientation, which we will say something more about.
In an ideal powder sample, all crystal fragments will be ordered completely at random,
and the scattered peak intensities are completely independent of the orientation of the sample or
the direction of the incident beam. This also means that the diffraction rings (Figure 2.11) will
be completely uniform and without intensity variations. In real samples, however, there is always
some degree of preferential orientation of the crystallites (also called ’texture’), usually along the
axis of a cylindrical sample, which introduces single-crystal like variations in this intensity. In the
integrated two-dimensional peak spectrum, the relative intensities will therefore be incorrect. The
amount of preferred orientation in a sample generally changes under pressure, particularly when the
pressure is non-hydrostatic (non-isotropic), so it is an important factor to consider in this analysis.
A mathematical (spherical harmonic) correction can be applied, for which the number of spherical
harmonic terms used must be specified. The precise sample orientation relative to the incident beam
(three parameters) and the the harmonic coefficients can be refined (in my case, I refined only the
harmonic coefficients.) The magnitude of the texture is evaluated from a texture index (J). For
cases of no texture, J=1, and for a single crystal, J → ∞. A reasonable value for texture in a
powder sample is between 1 and 3.

111
Bibliography
O. Krogh Andersen. Linear methods in band theory. Phys. Rev. B, 12(8):3060–3083, Oct 1975. doi:
10.1103/PhysRevB.12.3060.
Orson L. Anderson, Donald G. Isaak, and Shigeru Yamamoto. Anharmonicity and the equation of
state for gold. Journal of Applied Physics, 65(4):1534–1543, 1989.
R. J. Angel, M. Bujak, J. Zhao, G. D. Gatta, and S. D. Jacobsen. Effective hydrostatic limits of
pressure media for high-pressure crystallographic studies. Journal of Applied Crystallography,
pages 26–32, 2007.
K. Aoki, H. Yamawaki, M. Sakashita, and H. Fujihisa. Infrared absorption study of the hydrogen-
bond symmetrization in ice to 110 GPa. Phys. Rev. B, 54(22):15673–15677, Dec 1996. doi:
10.1103/PhysRevB.54.15673.
N. W. Ashcroft. Metallic hydrogen: A high-temperature superconductor? Phys. Rev. Lett., 21(26):
1748–1749, Dec 1968. doi: 10.1103/PhysRevLett.21.1748.
A. Le Bail, H. Duroy, and J.L. Fourquet. Ab-initio structure determination of LiSbWO6 by x-ray
powder diffraction. Materials Research Bulletin, 23:447–452, 1988.
J. Bardeen, L. N. Cooper, and J. R. Schrieffer. Theory of superconductivity. Phys. Rev., 108(5):
1175–1204, Dec 1957. doi: 10.1103/PhysRev.108.1175.
Marina Bastea, Arthur C. Mitchell, and William J. Nellis. High pressure insulator-metal transition
in molecular fluid oxygen. Phys. Rev. Lett., 86(14):3108–3111, Apr 2001. doi: 10.1103/Phys-
RevLett.86.3108.

112
P. E. Batson. Carbon 1s near-edge-absorption fine structure in graphite. Phys. Rev. B, 48(4):2608–
2610, Jul 1993. doi: 10.1103/PhysRevB.48.2608.
E. Bechtold-Schweickert, M. Mali, J. Roos, and D. Brinkmann. 7Li diffusion constant in the su-
perionic conductor Li3N measured by NMR. Phys. Rev. B, 30(5):2891–2893, Sep 1984. doi:
10.1103/PhysRevB.30.2891.
J. G. Bednorz and K. A. Muller. Possible high f. superconductivity in the Ba-La-Cu-O system.
Zeitschrift fur Physik B – Condensed Matter, 54:189–193, 1986.
Heinz Jurgen Beister, Sabine Haag, Rdiger Kniep, Klaus Strssner, and Karl Syassen. Phase transfor-
mations of lithium nitride under pressure. Angewandte Chemie International Edition in English,
27(8):1101–1103, 1988. doi: 10.1002/anie.198811011.
M. Benoit, M. Bernasconi, P. Focher, and M. Parrinello. New high-pressure phase of ice. Phys. Rev.
Lett., 76(16):2934–2936, Apr 1996. doi: 10.1103/PhysRevLett.76.2934.
Magali Benoit, Dominik Marx, and Michele Parrinello. Nature.
Magali Benoit, Aldo H. Romero, and Dominik Marx. Reassigning hydrogen-bond centering in
dense ice. Phys. Rev. Lett., 89(14):145501, Sep 2002. doi: 10.1103/PhysRevLett.89.145501.
A. Bharathi, S. Jemima Balaselvi, M. Premila, T. N. Sairam, G. L. N. Reddy, C. S. Sundar, and
Y. Hariharan. Synthesis and search for superconductivity in LiBC. Solid State Communications,
124(10–11):423–428, 2002.
Francis Birch. Finite elastic strain of cubic crystals. Phys. Rev., 71(11):809–824, Jun 1947. doi:
10.1103/PhysRev.71.809.
P. Blaha, K. Schwarz, G.K.H. Madsen, D. Kvasnicka, and J. Luitz. WIEN2K, an augmented plane
wave+local orbitals program for calculating crystal properties, karlheinz schwarz, technical uni-
verstt wien, austria, 2001.
X. Blase, Angel Rubio, Steven G. Louie, and Marvin L. Cohen. Quasiparticle band structure of
bulk hexagonal boron nitride and related systems. Phys. Rev. B, 51(11):6868–6875, Mar 1995.
doi: 10.1103/PhysRevB.51.6868.
Peter E. Blochl, O. Jepsen, and O. K. Andersen. Improved tetrahedron method for brillouin-zone
integrations. Phys. Rev. B, 49(23):16223–16233, Jun 1994. doi: 10.1103/PhysRevB.49.16223.

113
L. Boeri, G. B. Bachelet, M. Giantomassi, and O. K. Andersen. Electron-phonon interaction in
Graphite Intercalation Compounds. ArXiv Condensed Matter e-prints, January 2007. Provided
by the Smithsonian/NASA Astrophysics Data System.
J. C. Boettger. Equation of state and metallization of neon. Phys. Rev. B, 33(10):6788–6791, May
1986. doi: 10.1103/PhysRevB.33.6788.
Stanimir A. Bonev, Eric Schwegler, Tadashi Ogitsu, and Giulia Galli. A quantum fluid of metallic
hydrogen suggested by first-principles calculations. Nature, 431(7009):669–672, 2004. doi:
10.1038/nature02968.
J. B. Boyce, T. M. Hayes, and J. C. Mikkelsen. Extended-x-ray-absorption-fine-structure investiga-
tion of mobile-ion density in superionic agi, cui, cubr, and cucl. Phys. Rev. B, 23(6):2876–2896,
Mar 1981. doi: 10.1103/PhysRevB.23.2876.
M. S. Bruno and K. J. Dunn. Stress analysis of a beveled diamond anvil. Review of Scientific
Instruments, 1984.
R. Buczko, G. Duscher, S. J. Pennycook, and S. T. Pantelides. Excitonic effects in core-excitation
spectra of semiconductors. Phys. Rev. Lett., 85(10):2168–2171, Sep 2000. doi: 10.1103/Phys-
RevLett.85.2168.
Matteo Calandra and Francesco Mauri. Theoretical explanation of superconductivity in c[sub 6]ca.
Physical Review Letters, 95(23):237002, 2005. doi: 10.1103/PhysRevLett.95.237002.
A. Catellani, M. Posternak, A. Baldereschi, H. J. F. Jansen, and A. J. Freeman. Electronic interlayer
states in hexagonal boron nitride. Phys. Rev. B, 32(10):6997–6999, Nov 1985. doi: 10.1103/Phys-
RevB.32.6997.
C. Cavazzoni, G. L. Chiarotti, S. Scandolo, E. Tosatti, M. Bernasconi, and M. Parrinello. Superionic
and Metallic States of Water and Ammonia at Giant Planet Conditions. Science, 283(5398):44–
46, 1999. doi: 10.1126/science.283.5398.44.
Ping Chen, Zhitao Xiong, Jizhong Luo, Jianyi Lin, and Kuang Lee Tan. Interaction of hydrogen
with metal nitrides and imides. Nature, 420:302–304, 2002. doi: 10.1038/nature01210.
Hyoung Joon Choi, David Roundy, Hong Sun, Marvin L. Cohen, and Steven G. Louie. The origin
of the anomalous superconducting properties of MgB2. Nature, 418(6899):758–760, 2002. doi:
10.1038/nature00898.

114
J. Clerouin, Y. Laudernet, V. Recoules, and S. Mazevet. Ab initio study of the optical properties
of shocked LiF. Physical Review B (Condensed Matter and Materials Physics), 72(15):155122,
2005. doi: 10.1103/PhysRevB.72.155122.
Gabor Csanyi, P. B. Littlewood, Andriy H. Nevidomskyy, Chris J. Pickard, and B. D. Simons. The
role of the interlayer state in the electronic structure of superconducting graphite intercalated
compounds. Nature Physics, 1:42–45, 2005. doi: 10.1038/nphys119.
F. Datchi, S. Ninet, M. Gauthier, A. M. Saitta, B. Canny, and F. Decremps. Solid ammonia at high
pressure: A single-crystal x-ray diffraction study to 123 GPa. Physical Review B (Condensed
Matter and Materials Physics), 73(17):174111, 2006. doi: 10.1103/PhysRevB.73.174111.
D. L. Decker. Equation of state of sodium chloride. Journal of Applied Physics, 37(13):5012–5014,
1966.
D. L. Decker. High-pressure equation of state for NaCl, KCl, and CsCl. Journal of Applied Physics,
42(8):3239–3244, 1971.
Daniel L. Decker. Equation of state of NaCl and its use as a pressure gauge in high-pressure
research. Journal of Applied Physics, 36(1):157–161, 1965.
P. Demontis, M. L. Klein, and R. LeSar. High-density structures and phase transition in an ionic
model of H2O ice. Phys. Rev. B, 40(4):2716–2718, Aug 1989. doi: 10.1103/PhysRevB.40.2716.
Pierfranco Demontis, Richard LeSar, and Michael L. Klein. New high-pressure phases of ice. Phys.
Rev. Lett., 60(22):2284–2287, May 1988. doi: 10.1103/PhysRevLett.60.2284.
S. Desgreniers and K. Lagarec. XRDA: a program for energy-dispersive X-ray diffraction
analysis on a PC. Journal of Applied Crystallography, 27(3):432–434, Jun 1994. doi:
10.1107/S0021889893012610.
J. K. Dewhurst, S. Sharma, C. Ambrosch-Draxl, and B. Johansson. First-principles calculation of
superconductivity in hole-doped LiBC: Tc = 65K. Phys. Rev. B, 68(2):020504, Jul 2003. doi:
10.1103/PhysRevB.68.020504.
R. Dovesi, C. Pisani, F. Ricca, C. Roetti, and V. R. Saunders. Hartree-fock study of crystalline
lithium nitride. Phys. Rev. B, 30(2):972–979, Jul 1984. doi: 10.1103/PhysRevB.30.972.

115
Jon H. Eggert, Kenneth A. Goettel, and Isaac F. Silvera. Ruby at high pressure. II. fluorescence
lifetime of the R line to 130 GPa. Physical Review B, page 5733, 1989.
S. Fahy, K. J. Chang, Steven G. Louie, and Marvin L. Cohen. Pressure coefficients of band gaps of
diamond. Phys. Rev. B, 35(11):5856–5859, Apr 1987. doi: 10.1103/PhysRevB.35.5856.
Th. Fauster, F. J. Himpsel, J. E. Fischer, and E. W. Plummer. Three-dimensional energy band
in graphite and lithium-intercalated graphite. Phys. Rev. Lett., 51(5):430–433, Aug 1983. doi:
10.1103/PhysRevLett.51.430.
J. L. Feldman, B. M. Klein, M. J. Mehl, and H. Krakauer. Metallization pressure for NaCl in the B2
structure. Phys. Rev. B, 42(5):2752–2760, Aug 1990. doi: 10.1103/PhysRevB.42.2752.
E. Fermi. Accad. Nazl. Lincei, page 602, 1927.
Fabio Finocchi and Claudine Noguera. Structure and bonding of small stoichiometric lithium oxide
clusters. Phys. Rev. B, 53(8):4989–4998, Feb 1996. doi: 10.1103/PhysRevB.53.4989.
F. Fock. Zs. f. Phys., page 126, 1930.
A. M. Fogg, P. R. Chalker, J. B. Claridge, G. R. Darling, and M. J. Rosseinsky. LiBC electronic,
vibrational, structural, and low-temperature chemical behavior of a layered material isoelectronic
with MgB2. Phys. Rev. B, 67(24):245106, Jun 2003. doi: 10.1103/PhysRevB.67.245106.
A.M. Fogg, J. Meldrum, G.R. Darling, J.B. Claridge, and M.J. Rosseinsky. Chemical control of
electronic structure and superconductivity in layered borides and borocarbides: Understanding
the absence of superconductivity in LixBC. Journal of the American Chemical Society, 128(31):
10043–10053, 2006.
L. Gerward, J. S. Olsen, S. Steenstrup, M. Malinowski, S. Asbrink, and A. Waskowska. X-ray
diffraction investigations of CaF2 at high pressure. Journal of Applied Crystallography, 25(5):
578–581, Oct 1992. doi: 10.1107/S0021889892004096.
Nir Goldman, Laurence E. Fried, I-Feng W. Kuo, and Christopher J. Mundy. Bonding in the su-
perionic phase of water. Physical Review Letters, 94(21):217801, 2005. doi: 10.1103/Phys-
RevLett.94.217801.

116
A. F. Goncharov, V. V. Struzhkin, M. S. Somayazulu, R. J. Hemley, and H. K. Mao. Compression
of Ice to 210 Gigapascals: Infrared Evidence for a Symmetric Hydrogen-Bonded Phase. Science,
273(5272):218–220, 1996. doi: 10.1126/science.273.5272.218.
Alexander F. Goncharov, Viktor V. Struzhkin, Eugene Gregoryanz, Jingzhu Hu, Russell J. Hemley,
Ho-kwang Mao, G. Lapertot, S. L. Bud’ko, and P. C. Canfield. Raman spectrum and lattice
parameters of MgB2 as a function of pressure. Phys. Rev. B, 64(10):100509, Aug 2001. doi:
10.1103/PhysRevB.64.100509.
Eugene Gregoryanz, Olga Degtyareva, Maddury Somayazulu, Russell J. Hemley, and Ho kwang
Mao. Melting of dense sodium. Physical Review Letters, 94(18):185502, 2005. doi:
10.1103/PhysRevLett.94.185502.
A. Grzechnik, A. Vegas, K. Syassen, I. Loa, M. Hanfland, and M. Jansen. Reversible antifluorite
to anticotunnite phase transition in Li2S at high pressures. Journal of Solid State Chemistry, 154
(2):603–611, 2000.
D. R. Hartree. Proceedings of the Cambridge Philosophical Society, page 89, 1928.
R. J. Hemley, C. S. Zha, A. P. Jephcoat, H. K. Mao, L. W. Finger, and D. E. Cox. X-ray diffraction
and equation of state of solid neon to 110 GPa. Phys. Rev. B, 39(16):11820–11827, Jun 1989.
doi: 10.1103/PhysRevB.39.11820.
K. R. Hirsch and W. B. Holzapfel. Symmetric hydrogen bonds in ice X. Physics Letters A, 101(3):
142–144, 1984.
Allen C. Ho, Maurice K. Granger, Arthur L. Ruoff, P. E. Van Camp, and V. E. Van Doren. Experi-
mental and theoretical study of Li3N at high pressure. Phys. Rev. B, 59(9):6083–6086, Mar 1999.
doi: 10.1103/PhysRevB.59.6083.
P. Hohenberg and W. Kohn. Inhomogeneous electron gas. Phys. Rev., 136(3B):B864–B871, Nov
1964. doi: 10.1103/PhysRev.136.B864.
Y.H. Hu and E. Ruckenstein. High reversible hydrogen capacity of LiNH2/Li3N mixtures. Industrial
and Engineering Chemistry Research, 44(5):1510–1513, 2005.
W. B. Hubbard. Interiors of the Giant Planets. Science, 214(4517):145–149, 1981. doi: 10.1126/sci-
ence.214.4517.145.

117
S. Hull, T. W. D. Farley, W. Hayes, and M. T. Hutchings. The elastic properties of lithium oxide
and their variation with temperature. Journal of Nuclear Materials, 160(2–3):125–134, 1988.
Takayuki Ichikawa, Shigehito Isobe, Nobuko Hanada, and Hironobu Fujii. Lithium nitride for
reversible hydrogen storage. Journal of Alloys and Compounds, 365(1–2):271–276, 2004.
Valentin Iota, Choong-Shik Yoo, Jae-Hyun Klepeis, Zsolt Jenei, William Evans, and Hyunchae
Cynn. Six-fold coordinated carbon dioxide VI. Nature Materials, 6(1):34–38, 2007. doi:
10.1038/nmat1800.
A. Jayaraman. The diamond-anvil high-pressure cell. Scientific American, 250:54–62, April 1984.
Provided by the Smithsonian/NASA Astrophysics Data System.
Raymond Jeanloz, Peter M. Celliers, Gilbert W. Collins, Jon H. Eggert, Kanani K. M. Lee, R. Stew-
art McWilliams, Stephanie Brygoo, and Paul Loubeyre. High-Pressure Geoscience Special
Feature: Achieving high-density states through shock-wave loading of precompressed samples.
PNAS, 104(22):9172–9177, 2007. doi: 10.1073/pnas.0608170104.
Richard B. Kaner, John J. Gilman, and Sarah H. Tolbert. MATERIALS SCIENCE: Designing
Superhard Materials. Science, 308(5726):1268–1269, 2005. doi: 10.1126/science.1109830.
P F Karimov, N A Skorikov, E Z Kurmaev, L D Finkelstein, S Leitch, J MacNaughton, A Moewes,
and T Mori. Resonant inelastic soft x-ray scattering and electronic structure of LiBC. Journal of
Physics: Condensed Matter, 16(28):5137–5142, 2004.
Yoshinori Katayama, Takeshi Mizutani, Wataru Utsumi, Osamu Shimomura, Masaaki Yamakata,
and Ken-ichi Funakoshi. A first-order liquid-liquid phase transition in phosphorus. Nature, 403
(6766):170–173, 2000. doi: 10.1038/35003143.
David A. Keen. Disordering phenomena in superionic conductors. Journal of Physics: Condenced
Matter, 14:R819–R857, 2002.
Takemura Kenichi, Sato Kyoko, Fujihisa Hiroshi, and Onoda Mitsuko. Modulated structure of solid
iodine during its molecular dissociation under high pressure. Nature, 423(6943):971–974, 2003.
doi: 10.1038/nature01724.
G. Kerker. Electronic structure of Li3N. Phys. Rev. B, 23(12):6312–6318, Jun 1981. doi:
10.1103/PhysRevB.23.6312.

118
Kazuaki Kobayashi and Masao Arai. Lattice anomaly of LiBC and related compounds under
anisotropic compression. Journal of the Physical Society of Japan, 72(2):217–220, 2003a. doi:
10.1143/JPSJ.72.217.
Kazuaki Kobayashi and Masao Arai. LiBC and related compounds under high pressure. Physica C:
Superconductivity, 388–389:201–202, 2003b. Proceedings of the 23rd International Conference
on Low Temperature Physics (LT23).
Klaus Koepernik and Helmut Eschrig. Full-potential nonorthogonal local-orbital minimum-
basis band-structure scheme. Phys. Rev. B, 59(3):1743–1757, Jan 1999. doi: 10.1103/Phys-
RevB.59.1743.
W. Kohn and L. J. Sham. Self-consistent equations including exchange and correlation effects.
Phys. Rev., 140(4A):A1133–A1138, Nov 1965. doi: 10.1103/PhysRev.140.A1133.
Walter Kohn, 1999. Nobel Lecture.
Atsushi Koma, Kazushi Miki, Hiroyoshi Suematsu, Takahisa Ohno, and Hiroshi Kamimura.
Density-of-states investigation of C8K and occurrence of the interlayer band. Phys. Rev. B, 34
(4):2434–2438, Aug 1986. doi: 10.1103/PhysRevB.34.2434.
J. Kortus, I. I. Mazin, K. D. Belashchenko, V. P. Antropov, and L. L. Boyer. Superconductivity of
metallic boron in MgB2. Phys. Rev. Lett., 86(20):4656–4659, May 2001. doi: 10.1103/Phys-
RevLett.86.4656.
K. Kunc, I. Loa, A. Grzechnik, and K. Syassen. Li2O at high pressures: structural proper-
ties, phase-transition, and phonons. Physica Status Solidi B, 242(9):1857–1863, 2005. doi:
10.1002/pssb.200461786.
A.C. Larson and R.B. Von Dreele. General structure analysis system (GSAS), 2000. Los Alamos
National Laboratory Report LAUR 86-748.
A. W. Lawson and T. Y. Tang. A diamond bomb for obtaining powder pictures at high pressures.
Review of Scientific Instruments, 21:815, 1950.
A. Lazicki, B. Maddox, W. J. Evans, C.-S Yoo, A. K. McMahan, W. E. Pickett, R. T. Scalettar,
M. Y. Hu, and P. Chow. New cubic phase of Li3N: Stability of the N3− ion to 200 GPa. Physical
Review Letters, 95(16):165503, 2005. doi: 10.1103/PhysRevLett.95.165503.

119
A. Lazicki, C.-S. Yoo, W. J. Evans, and W. E. Pickett. Pressure-induced antifluorite-to-anticotunnite
phase transition in lithium oxide. Physical Review B (Condensed Matter and Materials Physics),
73(18):184120, 2006. doi: 10.1103/PhysRevB.73.184120.
A. Lazicki, C.-S. Yoo, H. Cynn, W. J. Evans, W. E. Pickett, J. Olamit, Kai Liu, and Y. Ohishi.
Search for superconductivity in LiBC at high pressure: Diamond anvil cell experiments and first-
principles calculations. Physical Review B (Condensed Matter and Materials Physics), 75(5):
054507, 2007. doi: 10.1103/PhysRevB.75.054507.
S. Lebegue, B. Arnaud, P. Rabiller, M. Alouani, and W. E. Pickett. Quasiparticle properties of the
possible superconductor materials LiBC and NaBC. Europhysics Letters, 68(6):846–852, 2004.
doi: 10.1209/epl/i2004-10292-4.
S. Lebegue, B. Arnaud, P. Rabiller, M. Alouani, and W. E. Pickett. Quasiparticle properties of the
possible superconductor materials LiBC and NaBC. Europhysics Letters, 69(2):311, 2005. doi:
10.1209/epl/i2004-10396-9.
Kwan-Woo Lee and W. E. Pickett. Born effective charges and infrared response of LiBC. Phys.
Rev. B, 68(8):085308, Aug 2003. doi: 10.1103/PhysRevB.68.085308.
J. M. Leger, J. Haines, A. Atouf, O. Schulte, and S. Hull. High-pressure x-ray- and neutron-
diffraction studies of BaF2: An example of a coordination number of 11 in AX2 compounds.
Phys. Rev. B, 52(18):13247–13256, Nov 1995. doi: 10.1103/PhysRevB.52.13247.
M. E. Leonova, I. K. Bdikin, S. A. Kulinich, O. K. Gulish, L. G. Sevast’yanova, and K. P. Burdina.
High-pressure phase transition of hexagonal alkali pnictides. Inorganic Materials, 39(3):266–
270, 2003. doi: 10.1023/A:1022629709143.
David R. Lide, editor. CRC Handbook of Chemistry and Physics. CRC Press, Boca Raton, FL, 79th
edition, 1998.
J.-F. Lin, E. Schwegler, and C.-S. Yoo. Phase diagram and physical properties of H2O at high
pressures and temperatures: Applications to planetary interiors. In Steven D. Jacobsen and Suzan
van der Lee, editors, Earth’s Deep Water Cycle, volume 168 of Geophysical Monograph Series.
American Geophysical Union, 2006. doi: 10.1029/168GM12.
Magnus J. Lipp, William J. Evans, Bruce J. Baer, and Choong-Shik Yoo. High-energy-density
extended CO solid. Nature Materials, 4(3):211–215, 2005. doi: 10.1038/nmat1321.

120
Y. Y. Liu, M. C. Billone, A. K. Fisher, S. W. Tam, and R. G. Clemmer. Journal of Fusion Technology,
8:1970, 1985.
Paul Loubeyre, Rene LeToullec, Elodie Wolanin, Michel Hanfland, and Daniel Hausermann. Mod-
ulated phases and proton centring in ice observed by x-ray diffraction up to 170 GPa. Nature,
397(6719):503–506, 1999. doi: 10.1038/17300.
B. R. Maddox, A. Lazicki, C. S. Yoo, V. Iota, M. Chen, A. K. McMahan, M. Y. Hu, P. Chow,
R. T. Scalettar, and W. E. Pickett. 4f delocalization in Gd: Inelastic x-ray scattering at ultrahigh
pressure. Physical Review Letters, 96(21):215701, 2006. doi: 10.1103/PhysRevLett.96.215701.
Brian R. Maddox. PhD dissertation, University of California, Davis, 2006.
H. K. Mao and P. M. Bell. High-pressure physics: Sustained static generation of 1.36 to 1.72
megabars. Science, 200:1145–1147, 1978.
H. K. Mao and P. M. Bell. Carnegie Institute of Washington Yearbook, page 644, 1977.
H. K. Mao and P. M. Bell. Electrical resistivity measurements of conductors in the diamond-window,
high-pressure cell. Review of Scientific Instruments, 52(4):615–616, 1981.
H. K. Mao and R. J. Hemley. Optical studies of hydrogen above 200 gigapascals: Evidence for
metallization by band overlap. Science, 244:1462–1465, 1989.
H. K. Mao, J. Xu, and P. M. Bell. Journal of Geophysical Research, 91:4673, 1986a.
H. K. Mao, J. Xu, and P. M. Bell. Journal of Geophysical Research, page 4673, 1986b.
Wendy L. Mao, Ho-kwang Mao, Alexander F. Goncharov, Viktor V. Struzhkin, Quanzhong Guo,
Jingzhu Hu, Jinfu Shu, Russell J. Hemley, Maddury Somayazulu, and Yusheng Zhao. Hydro-
gen Clusters in Clathrate Hydrate. Science, 297(5590):2247–2249, 2002. doi: 10.1126/sci-
ence.1075394.
A. K. McMahan. Pressure-induced changes in the electronic structure of solids. Physica B+C,
139-140:31–41, 1986.
A. K. McMahan and R. C. Albers. Insulating nickel at a pressure of 34 TPa. Phys. Rev. Lett., 49
(16):1198–1201, Oct 1982. doi: 10.1103/PhysRevLett.49.1198.

121
John McMurry and Robert C. Fay. Chemistry, Fourth Edition. Pren-
tice Hall, 2004. images taken from the textbook companion website:
http://wps.prenhall.com/wps/media/objects/602/616516/index.html.
F. D. Murnaghan. The Compressibility of Media under Extreme Pressures. PNAS, 30(9):244–247,
1944. doi: 10.1073/pnas.30.9.244.
Jun Nagamatsu, Norimasa Nakagawa, Takahiro Muranaka, Yuji Zenitani, and Jun Akimitsu.
Superconductivity at 39 K in magnesium diboride. Nature, 410(6824):63–64, 2001. doi:
10.1038/35065039.
Y. Nakamori, G. Kitahara, K. Miwa, S. Towata, and S. Orimo. Reversible hydrogen-storage func-
tions for mixtures of Li3N and Mg3N2, journal = Applied Physics A: Materials Science and
Processing, volume = 80, number = 1, pages = 1, year = 2005.
Gholamabbas; Nazri. Solid-state lithium battery, May 1989.
J. B. Neaton and N. W. Ashcroft. Pairing in dense lithium. Nature, 400(6740):141–144, 1999. doi:
10.1038/22067.
A. Neckel, K. Schwarz, R. eibler, P. Rastl, and P. Weinberger. Microchim. Acta., Suppl. 6(2):257,
1975.
W. J. Nellis, J. A. Moriarty, A. C. Mitchell, M. Ross, R. G. Dandrea, N. W. Ashcroft, N. C. Holmes,
and G. R. Gathers. Metals physics at ultrahigh pressure: Aluminum, copper, and lead as proto-
types. Phys. Rev. Lett., 60(14):1414–1417, Apr 1988. doi: 10.1103/PhysRevLett.60.1414.
Norman F. Ness, Mario H. Acuna, Kenneth W. Behannon, Leonard F. Burlaga, John E. P. Conner-
ney, Ronald P. Lepping, and Fritz M. Neubauer. Magnetic Fields at Uranus. Science, 233(4759):
85–89, 1986. doi: 10.1126/science.233.4759.85.
K. Noda, K. Uchida, T. Tanifuji, and S. Nasu. Study of radiation damage in Li2O by means
of electron-spin resonance. Phys. Rev. B, 24(7):3736–3742, Oct 1981. doi: 10.1103/Phys-
RevB.24.3736.
Florent Occelli, Paul Loubeyre, , and Rene LeToullec. Properties of diamond under hydrostatic
pressures up to 140 GPa. Nature Materials, 2(3):151–154, 2003. doi: 10.1038/nmat831.

122
Artem R. Oganov, Michael J. Gillan, and G. David Price. Ab initio lattice dynamics and struc-
tural stability of MgO. The Journal of Chemical Physics, 118(22):10174–10182, 2003. doi:
10.1063/1.1570394.
John P. Perdew and Yue Wang. Accurate and simple analytic representation of the electron-gas cor-
relation energy. Phys. Rev. B, 45(23):13244–13249, Jun 1992. doi: 10.1103/PhysRevB.45.13244.
John P. Perdew, Kieron Burke, and Matthias Ernzerhof. Generalized gradient approximation made
simple. Phys. Rev. Lett., 77(18):3865–3868, Oct 1996. doi: 10.1103/PhysRevLett.77.3865.
Warren Pickett. Superconductivity: Mind the double gap. Nature, 418(6899):733–734, 2002. doi:
10.1038/418733a.
G. J. Piermarini, S. Block, J. D. Barnett, and R. A. Forman. Calibration of the pressure dependence
of the r[sub 1] ruby fluorescence line to 195 kbar. Journal of Applied Physics, 46(6):2774–2780,
1975. doi: 10.1063/1.321957.
A. Polian and M. Grimsditch. New high-pressure phase of H2O: Ice X. Phys. Rev. Lett., 52(15):
1312–1314, Apr 1984. doi: 10.1103/PhysRevLett.52.1312.
M. Posternak, A. Baldereschi, A. J. Freeman, E. Wimmer, and M. Weinert. Prediction of elec-
tronic interlayer states in graphite and reinterpretation of alkali bands in graphite intercalation
compounds. Phys. Rev. Lett., 50(10):761–764, Mar 1983. doi: 10.1103/PhysRevLett.50.761.
Ph. Pruzan. Pressure effects on the hydrogen bond in ice up to 80 GPa. Journal of Molecular
Structure, 322:279–286, 1994.
Ph. Pruzan, J. C. Chervin, and B. Canny. Stability domain of the ice viii proton-ordered phase at
very high pressure and low temperature. The Journal of Chemical Physics, 99(12):9842–9846,
1993. doi: 10.1063/1.465467.
A. Rabenau and Heinz Schulz. Re-evaluation of the lithium nitride structure. Journal of the Less
Common Metals, 50:155–159, 1976.
Albrecht Rabenau. Lithium nitride and related materials case study of the use of modern solid state
research techniques. Solid State Ionics.

123
David E. Ramaker, Lalit Kumar, and Frank E. Harris. Exact-exchange crystal hartree-fock calcula-
tions of molecular and metallic hydrogen and their transitions. Phys. Rev. Lett., 34(13):812–814,
Mar 1975. doi: 10.1103/PhysRevLett.34.812.
C. V. Raman and K. S. Krishnan. A new type of secondary radiation. Nature, page 501, 1928.
P. Ravindran, P. Vajeeston, R. Vidya, A. Kjekshus, and H. Fjellvag. Detailed electronic structure
studies on superconducting MgB2 and related compounds. Phys. Rev. B, 64(22):224509, Nov
2001. doi: 10.1103/PhysRevB.64.224509.
B. Reihl, J. K. Gimzewski, J. M. Nicholls, and E. Tosatti. Unoccupied electronic states of graphite
as probed by inverse-photoemission and tunneling spectroscopy. Phys. Rev. B, 33(8):5770–5773,
Apr 1986. doi: 10.1103/PhysRevB.33.5770.
B. Renker, H. Schober, P. Adelmann, P. Schweiss, K.-P. Bohnen, and R. Heid. Lattice dynamics of
LiBC. Physical Review B (Condensed Matter and Materials Physics), 69(5):052506, 2004. doi:
10.1103/PhysRevB.69.052506.
C. F. Richardson and N. W. Ashcroft. High temperature superconductivity in metallic hydrogen:
Electron-electron enhancements. Phys. Rev. Lett., 78(1):118–121, Jan 1997. doi: 10.1103/Phys-
RevLett.78.118.
H. M. Rietveld. Line profiles of neutron powder-diffraction peaks for structure refinement. Acta
Crystallographica, pages 151–152, 1967.
H. M. Rietveld. A profile refinement method for nuclear and magnetic structures. Journal of Applied
Crystallography, pages 65–71, 1969.
John Robertson. Electronic structure and core exciton of hexagonal boron nitride. Phys. Rev. B, 29
(4):2131–2137, Feb 1984. doi: 10.1103/PhysRevB.29.2131.
H. Rosner, A. Kitaigorodsky, and W. E. Pickett. Prediction of high Tc superconductivity in hole-
doped LiBC. Phys. Rev. Lett., 88(12):127001, Mar 2002. doi: 10.1103/PhysRevLett.88.127001.
Mario Santoro, Federico A. Gorelli, Roberto Bini, Giancarlo Ruocco, Sandro Scandolo, and Wil-
son A. Crichton. Amorphous silica-like carbon dioxide. Nature, 441(7095):857–860, 2006. doi:
10.1038/nature04879.

124
J. Sarnthein, K. Schwarz, and P. E. Blochl. Ab initio molecular-dynamics study of diffusion and de-
fects in solid Li3N. Phys. Rev. B, 53(14):9084–9091, Apr 1996. doi: 10.1103/PhysRevB.53.9084.
Nagayoshi Sata, Guoyin Shen, Mark L. Rivers, and Stephen R. Sutton. Pressure-volume equation
of state of the high-pressure B2 phase of NaCl. Phys. Rev. B, 65(10):104114, Mar 2002. doi:
10.1103/PhysRevB.65.104114.
James S. Schilling. What high pressure studies have taught
us about high-temperature superconductivity, 2001. URL
http://www.citebase.org/abstract?id=oai:arXiv.org:cond-mat/0110267.
J. Christian Schon, Marcus A. C. Wevers, and Martin Jansen. Prediction of high pressure phases in
the systems li3n, na3n, (li,na)3n, li2s and na2s. Journal of Materials Chemistry, 11:69–77, 2001.
doi: 10.1039/b002956o.
H. Schulz and K. H. Thiemann. Defect structure of the ionic conductor lithium nitride (Li3N). Acta
Crystallographica Section A, 35(2):309–314, Mar 1979. doi: 10.1107/S0567739479000632.
K. Schwarz, P. Blaha, and G. K. H. Madsen. Electronic structure calculations of solids using the
WIEN2k package for materials sciences. Computer Physics Communications, 147(1-2):71–76,
August 2002. doi: 10.1016/j.physletb.2003.10.071.
Kenneth S. Schweizer and Frank H. Stillinger. High pressure phase transitions and hydrogen-bond
symmetry in ice polymorphs. The Journal of Chemical Physics, 80(3):1230–1240, 1984. doi:
10.1063/1.446800.
Katsuya Shimizu, Hiroto Ishikawa, Daigoroh Takao, Takehiko Yagi, and Kiichi Amaya. Supercon-
ductivity in compressed lithium at 20 K. Nature, 419(6907):597–599, 2002. doi: 10.1038/na-
ture01098.
Eric L. Shirley. Ab initio inclusion of electron-hole attraction: Application to x-ray absorption and
resonant inelastic x-ray scattering. Phys. Rev. Lett., 80(4):794–797, Jan 1998. doi: 10.1103/Phys-
RevLett.80.794.
Eric L. Shirley, J. A. Soininen, G. P. Zhang, J. A. Carlisle, T. A. Callcott, D. L. Ederer, L. J. Ter-
minello, and R. C. C. Perera. Modeling final-state interaction effects in inelastic x-ray scattering
from solids: resonant and non-resonant. Journal of Electron Spectroscopy and Related Phenom-
ena, 114-116:939–946, 2001.

125
F. A. Shunk. Constitution of Binary Alloys, 2nd Suppl. McGraw-Hill, New York, 1969.
David Singh. Ground-state properties of lanthanum: Treatment of extended-core states. Phys. Rev.
B, 43(8):6388–6392, Mar 1991. doi: 10.1103/PhysRevB.43.6388.
E. Sjostedt, L. Nordstrom, and D. J. Singh. An alternative way of linearizing the augmented plane-
wave method. Solid State Communications, 114(1):15–20, March 2000.
J. C. Slater. Wave functions in a periodic potential. Phys. Rev., 51(10):846–851, May 1937. doi:
10.1103/PhysRev.51.846.
E. Smorgrav, E. Babaev, J. Smiseth, and A. Sudbo. Observation of a metallic superfluid in a
numerical experiment. Physical Review Letters, 95(13):135301, 2005. doi: 10.1103/Phys-
RevLett.95.135301.
A. Soininen. Final-State Interactions in Inelastic X-Ray Scattering. PhD thesis, University of
Helsinki, 2001.
V. L. Solozhenko, G. Will, and F. Elf. Isothermal compression of hexagonal graphite-like boron
nitride up to 12 GPa. Solid State Communications, 96(1):1–3, 1995.
Dmitri Souptel, Zakir Hossain, Gunter Behr, Wolfgang Loser, and Christoph Geibel. Synthesis and
physical properties of LiBC intermetallics. Solid State Communications, 125(1):17–21, 2003.
S. M. Stishov. Quantum effects in condensed matter at high pressure. Physics - Uspekhi, 44(3):
285–290, 2001.
Viktor V. Struzhkin, Alexander F. Goncharov, Russell J. Hemley, and Ho-kwang Mao. Cascading
fermi resonances and the soft mode in dense ice. Phys. Rev. Lett., 78(23):4446–4449, Jun 1997.
doi: 10.1103/PhysRevLett.78.4446.
Michael P. Surh, Steven G. Louie, and Marvin L. Cohen. Band gaps of diamond under anisotropic
stress. Phys. Rev. B, 45(15):8239–8247, Apr 1992. doi: 10.1103/PhysRevB.45.8239.
Satoru Tanaka, Masaki Taniguchi, and Hisashi Tanigawa. XPS and UPS studies on electronic struc-
ture of Li2O, journal of nuclear materials. 283-287(2):1405–1408, 2000.
H. Thomas. Proceedings of the Cambridge Philosophical Society, page 542, 1927.

126
P. Thompson, D. E. Cox, and J. B. Hastings. Rietveld refinement of Debye–Scherrer synchrotron
X-ray data from Al2O3. Journal of Applied Crystallography, 20(2):79–83, Apr 1987. doi:
10.1107/S0021889887087090.
Brian H. Toby. EXPGUI, a graphical user interface for GSAS. Journal of Applied Crystallography,
34(2):210–213, 2001. doi: 10.1107/S0021889801002242.
Khi-Ruey Tsai, P. M. Harris, and E. N. Lassettre. The crystal structure of cesium monoxide. Journal
of Physical Chemistry, 60(3):338–344, 1956. ISSN 0022-3654.
N.W.A. Van Uden. Determination of the mode gruneisen parameter of AlN using different fits on
experimental high pressure data. International Journal of High Pressure Research, 22:37–41(5),
1 January 2002.
A. Vegas, A. Grzechnik, K. Syassen, I. Loa, M. Hanfland, and M. Jansen. Reversible phase tran-
sitions in Na2S under pressure: a comparison with the cation array in Na2SO4. Acta Crystallo-
graphica Section B, 57(2):151–156, Apr 2001. doi: 10.1107/S0108768100016621.
P. Vinet, J. Ferrante, J. R. Smith, and J. H. Rose. A universal equation of state for solids. Journal of
Physics C: Solid State Physics, 19(20):L467–L473, 1986.
Yogesh K. Vohra, Steven J. Duclos, and Arthur L. Ruoff. High-pressure x-ray diffraction studies on
rhenium up to 216 GPa (2.16 Mbar). Physcal Review B, pages 9790–9792, 1987.
C. E. Weir, E. R. Lippincott, A. Van Valkenburg, and E. N. Bunting. Infrared studies in the 1- to 15-
micron region to 30,000 atmospheres. Journal of Research of the National Bureau of Standards,
63, 1959.
Renata M. Wentzcovitch, K. J. Chang, and Marvin L. Cohen. Electronic and structural properties
of BN and BP. Phys. Rev. B, 34(2):1071–1079, Jul 1986. doi: 10.1103/PhysRevB.34.1071.
E. Wigner and H. B. Huntington. On the possibility of a metallic modification of hydrogen. The
Journal of Chemical Physics, 3(12):764–770, 1935. doi: 10.1063/1.1749590.
M. Wilson, P. A. Madden, N. C. Pyper, and J. H. Harding. Molecular dynamics simulations
of compressible ions. The Journal of Chemical Physics, 104(20):8068–8081, 1996. doi:
10.1063/1.471523.

127
M. L. Wolf. Observation of solitary-wave conduction in a molecular dynamics simulation of the
superionic conductor Li3N. Journal of Physics C: Solid State Physics, 17(10):L285–L288, 1984.
Michael Worle, Reinhard Nesper, Gunter Mair, Martin Schwarz, and Hans Georg Von Schnering.
LiBC - ein vollstandig interkalierter heterographit. Zeitschrift fr anorganische und allgemeine
Chemie, 621(7):1153–1159, 1995. doi: 10.1002/zaac.19956210707.
Yi Xie, Yitai Qian, Wenzhong Wang, Shuyuan Zhang, and Yuheng Zhang. A Benzene-Thermal Syn-
thetic Route to Nanocrystalline GaN. Science, 272(5270):1926–1927, 1996. doi: 10.1126/sci-
ence.272.5270.1926.
Chih-shiue Yan, Yogesh K. Vohra, Ho-kwang Mao, and Russell J. Hemley. Very high growth rate
chemical vapor deposition of single-crystal diamond. PNAS, 99(20):12523–12525, 2002. doi:
10.1073/pnas.152464799.
C. S. Yoo, B. Maddox, J.-H. P. Klepeis, V. Iota, W. Evans, A. McMahan, M. Y. Hu, P. Chow,
M. Somayazulu, D. Hausermann, R. T. Scalettar, and W. E. Pickett. First-order isostructural
mott transition in highly compressed MnO. Physical Review Letters, 94(11):115502, 2005. doi:
10.1103/PhysRevLett.94.115502.
David A. Young, A. K. McMahan, and Marvin Ross. Equation of state and melting curve of he-
lium to very high pressure. Phys. Rev. B, 24(9):5119–5127, Nov 1981. doi: 10.1103/Phys-
RevB.24.5119.
L. Zhao, P. Klavins, and Kai Liu. Synthesis and properties of hole-doped Li1−xBC. Journal of
Applied Physics, 93(10):8653–8655, 2003. doi: 10.1063/1.1556285.
You Xiang Zhao and Ian L. Spain. X-ray diffraction data for graphite to 20 GPa. Phys. Rev. B, 40
(2):993–997, Jul 1989. doi: 10.1103/PhysRevB.40.993.
E. Zintl and G. Brauer. Z. Elektrochem, 41:102, 1935.
A. N. Zisman, I. V. Aleksandrov, and S. M. Stishov. X-ray study of equations of state of solid
xenon and cesium iodide at pressures up to 55 GPa. Phys. Rev. B, 32(1):484–487, Jul 1985. doi:
10.1103/PhysRevB.32.484.
Alex Zunger and A. J. Freeman. Ground- and excited-state properties of LiF in the local-density
formalism. Phys. Rev. B, 16(6):2901–2926, Sep 1977. doi: 10.1103/PhysRevB.16.2901.

128
Pierre Zweiacker. Applications des supraconducteurs. url:
http://lanoswww.epfl.ch/studinfo/courses/cours supra/Materiaux/mgb1.jpg. notes for a course
called ”Supraconductivite” given at the Ecole Polytechnique Federale de Lausanne.