Properties and functions of glial cells in the developing ...
109
Aus dem Max-Delbrück-Centrum für Molekulare Medizin DISSERTATION Properties and functions of glial cells in the developing and injured brains zur Erlangung des akademischen Grades Doctor of Philosophy in Medical Neurosciences (PhD in Medical Neurosciences) vorgelegt der Medizinischen Fakultät Charité – Universitätsmedizin Berlin von Giselle Cheung aus Hong Kong, China
Transcript of Properties and functions of glial cells in the developing ...

Aus dem Max-Delbrück-Centrum für Molekulare Medizin
DISSERTATION
Properties and functions of glial cells in the developing and injured brains
zur Erlangung des akademischen Grades Doctor of Philosophy in Medical Neurosciences
(PhD in Medical Neurosciences)
vorgelegt der Medizinischen Fakultät Charité – Universitätsmedizin Berlin
von
Giselle Cheung
aus Hong Kong, China

Glial properties in development and injury ii
Gutachter: 1. Prof. Dr. H. Kettenmann
2. Prof. Dr. med. J. Priller
3. Prof. Dr. med. I. Bechmann
Datum der Promotion: 29.09.2008

Glial properties in development and injury iii
Acknowledgements
I sincerely thank my supervisor Prof. Dr. Helmut Kettenmann for giving me an opportunity
to work in his laboratory and for supporting and believing in me each step of the way; Dr.
Katrin Färber who led me into microglial research and provided assistance throughout my
studies; and Dr. Liping Wang who made me an electrophysiologist and introduced me to
interesting projects one of which concerning astrocytes and stroke is described in this
thesis. I thank our collaborators Dr. Oliver Kann for extracellular potassium measurements;
Prof. Dr. Matthias Endres, Prof. Dr. Gerd Kempermann, Dr. Golo Kronenberg, Shengbo Ji
and Karen Gertz for stroke experiments; and Dr. Shinichi Kohsaka for providing Iba1-EGFP
mice. Many thanks go to our skillful technicians Irene Haupt for generating primary
microglia cultures; Christiane Gras for biocytin immunohistochemistry; Rainer Kröber for
maintaining the setups and equipments in very good conditions; and Karin Heufelder for
keeping the lab organized and well-supplied. I am grateful for financial and academic
support from the International PhD programme in Molecular Cell Biology at Max-Delbrück-
Center and International Graduate Program of Medical Neurosciences at Charité-
Universitätsmedizin Berlin; helpful administrative assistance by Sylvia Sibilak, Lutz Steiner
and especially our irreplaceable secretary Birgit Jarchow who always made everything a lot
easier. To all former and present colleagues, I express my fullest appreciation for their
kindness and support and for making my time in the laboratory and in Berlin an enjoyable
experience. Particularly, I would like to thank my very special friends Joo-Hee Wälzlein
who always knew exactly what I was thinking and proof read everything down to the
smallest details; Hannes Kiesewetter whose warm welcome and help extended much
beyond the laboratory; and Jochen Müller who provided endless laughter and support
including the German translation of the summary text. I am thankful for my family for their
unconditional love and encouragements; my friends for their support from different places
of the world. Last but not least, I would not have done it without Simon who always saw
something in me. I have been and will continue to be inspired by his strong motivation and
belief in scientific research.

Glial properties in development and injury iv
Table of Contents
Acknowledgements...........................................................................................................iii
Table of Contents ..............................................................................................................iv
List of Figures...................................................................................................................vii
List of Tables ...................................................................................................................viii
List of Abbreviations.........................................................................................................ix
1 Introduction ...............................................................................................................11
1.1 Microglia in the developing brain ..........................................................................11 1.1.1 Microglial dynamics in development..............................................................11
1.1.2 Microglial potassium channels ......................................................................13
1.1.3 Chemokines as neuromodulators..................................................................15
1.1.4 Neurotransmitters and development .............................................................18
1.2 Astrocytes in the injured brain ..............................................................................21 1.2.1 Functional heterogeneity of astrocytes..........................................................21
1.2.2 Astrocytes in response to brain injury ...........................................................22
2 Objectives and Hypotheses......................................................................................24
2.1 Objectives ............................................................................................................24 2.2 Hypotheses ..........................................................................................................25
3 Materials and Methods..............................................................................................26
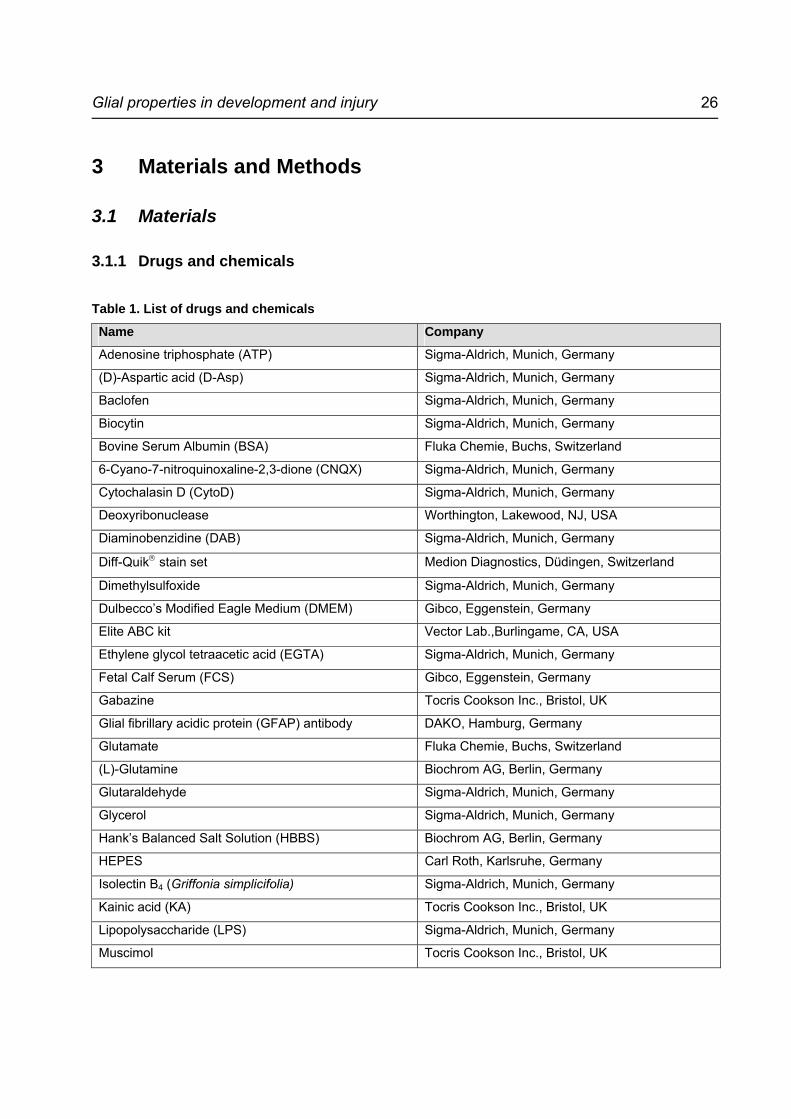
3.1 Materials...............................................................................................................26 3.1.1 Drugs and chemicals.....................................................................................26
3.1.2 Intra- and extracellular solutions ...................................................................27
3.1.3 Cytokine and proliferation assays .................................................................28
3.1.4 Equipments, apparatus, and computer software ...........................................29
3.2 Animals ................................................................................................................31 3.3 Induction of mild brain ischemia ...........................................................................31 3.4 Acute brain slice preparation................................................................................31 3.5 Primary microglia cultures ....................................................................................32

Glial properties in development and injury v
3.6 Visualization of cell populations ...........................................................................32 3.6.1 Setup and equipments ..................................................................................32
3.6.2 Microglia........................................................................................................33
3.6.3 Astrocytes .....................................................................................................34
3.7 Electrophysiology .................................................................................................34 3.7.1 Setup and equipments ..................................................................................34
3.7.2 Whole cell voltage-clamp configuration and biocytin dye-filling.....................34
3.7.3 Voltage-clamp recordings .............................................................................35
3.8 Imaging experiments ............................................................................................36 3.8.1 Setup and equipments ..................................................................................36
3.8.2 Bright phase imaging of microglial motility ....................................................37
3.8.3 Intracellular calcium imaging of microglia......................................................38
3.9 Extracellular potassium measurement .................................................................39 3.10 Microglial migration assay ....................................................................................40 3.11 Microglial proliferation assay ................................................................................40 3.12 Cytokine release quantification ............................................................................41
3.12.1 Cytokine release in vitro ................................................................................41
3.12.2 Cytokine release in situ .................................................................................41
3.13 Immunohistochemistry for biocytin .......................................................................42 3.14 Analyses and statistics .........................................................................................42
4 Results .......................................................................................................................44
4.1 GABAA receptor stimulation and microglial current response...............................44 4.1.1 Muscimol-induced current response in microglia ..........................................44
4.1.2 Influence of postnatal brain slice on muscimol-induced current response ....47
4.1.2.1 Isolated AMG ...............................................................................................47
4.1.2.2 Microglia cultures .........................................................................................48
4.1.2.3 Adult ramified microglia................................................................................49
4.2 GABAA receptor stimulation and macroglial and neuronal current response........50 4.3 GABAA receptor stimulation and extracellular potassium.....................................53
4.3.1 Extracellular potassium level.........................................................................53
4.3.2 Microglial response towards elevated extracellular potassium level .............55
4.4 GABAA receptor stimulation and functional properties of microglia ......................57

Glial properties in development and injury vi
4.4.1 Intracellular calcium changes ........................................................................57
4.4.2 Chemotaxis and proliferation.........................................................................60
4.4.3 Cytokine release ...........................................................................................62
4.4.4 Motility ...........................................................................................................64
4.5 Properties of striatal astrocytes in response to stroke ..........................................66 4.5.1 GFAP-EGFP fluorescence and morphology..................................................66
4.5.2 Membrane current.........................................................................................67
4.5.3 Gap junction network ....................................................................................69
4.5.4 AMPA/KA glutamate receptor expression .....................................................69
4.5.5 Glutamate transporter expression .................................................................71
5 Discussion .................................................................................................................73
5.1 Invading microglia sense GABAergic activities in the developing brain................73 5.1.1 GABAA receptor expression on macroglia and neurons in postnatal brain....73
5.1.2 Elevation of extracellular potassium upon membrane depolarization............74
5.1.3 Current response of microglia towards elevated extracellular potassium......74
5.1.4 Cytokine release upon GABAergic innervations............................................76
5.1.5 Microglial properties upon GABAergic innervations ......................................78
5.1.6 Approaches to study microglial properties ....................................................80
5.2 Unique physiological properties in striatal astrocytes in response to stroke.........82 5.2.1 Subpopulations of astrocytes with distinct properties in the striatum ............82
5.2.2 Ischemia-induced changes in astrocytic properties.......................................83
5.3 Proposed roles of invading microglia and striatal astrocytes................................85
6 Summary....................................................................................................................87
7 Zusammenfassung....................................................................................................89
8 References .................................................................................................................92
Curriculum Vitae.............................................................................................................106
Publications ....................................................................................................................107
Meetings and Presentations ..........................................................................................108
Erklärung.........................................................................................................................109

Glial properties in development and injury vii
List of Figures
Fig. 1. Developmental faith of microglia..............................................................................14
Fig. 2. Dynamics of microglial K+ currents. .........................................................................16
Fig. 3. E-I switch of neuronal GABAA receptors..................................................................20
Fig. 4. Acute brain slice preparation of AMG. .....................................................................33
Fig. 5. Modified settings for electrophysiological recordings...............................................36
Fig. 6. Determination of arm movement of AMG. ...............................................................38
Fig. 7. Membrane properties of AMG. ................................................................................44
Fig. 8. Muscimol-induced current response in AMG. ..........................................................45
Fig. 9. Sensitivity of muscimol-induced current response in AMG. .....................................46
Fig. 10. Current response in isolated AMG upon muscimol stimulation..............................48
Fig. 11. Current response in cultured microglia upon muscimol stimulation. ......................49
Fig. 12. Current response in adult ramified microglia upon muscimol stimulation. .............50
Fig. 13. Current response in macroglia and neurons upon muscimol stimulation...............52
Fig. 14. Muscimol-induced changes in [K+]0. ......................................................................54
Fig. 15. Current response in microglia towards [K+]0 elevation. ..........................................56
Fig. 16. Ca2+ response in cultured microglia upon muscimol stimulation............................57
Fig. 17. Ca2+ response in AMG upon muscimol stimulation................................................58
Fig. 18. Ca2+ response in neighboring cells upon muscimol stimulation. ............................59
Fig. 19. Ca2+ response in isolated AMG upon muscimol stimulation. .................................60
Fig. 20. Effect of [K+]0 elevation on microglial chemotaxis. .................................................61
Fig. 21. Effect of [K+]0 elevation on microglial proliferation. ................................................61
Fig. 22. Effect of muscimol and [K+]0 elevation on cytokine release in vitro........................62
Fig. 23. Effect of muscimol and [K+]0 elevation on cytokine release in situ. ........................63
Fig. 24. Effect of muscimol and [K+]0 elevation on AMG motility. ........................................65
Fig. 25. Effect of stroke on morphology of striatal astrocytes. ............................................66
Fig. 26. Effect of stroke on physiology and networks of striatal astrocytes.........................68
Fig. 27. Effect of stroke on AMPA/KA receptor expression in striatal astrocytes. ...............71
Fig. 28. Effect of stroke on glutamate transporter expression in striatal astrocytes. ...........72
Fig. 29. Invading microglia sense GABAergic activities in the developing brain. ................85
Fig. 30. Unique physiological properties in striatal astrocytes in response to stroke. .........86

Glial properties in development and injury viii
List of Tables
Table 1. List of drugs and chemicals ..................................................................................26
Table 2. List of fluorescent indicators .................................................................................27
Table 3. Solutions for acute brain slices and cell cultures ..................................................27
Table 4. List of antibodies and standards for cytokine assays............................................28
Table 5. Solutions for cytokine assays ...............................................................................28
Table 6. Solutions for proliferation assays..........................................................................29
Table 7. Solutions for immunohistochemistry .....................................................................29
Table 8. List of equipments and apparatus.........................................................................29
Table 9. List of computer software......................................................................................30

Glial properties in development and injury ix
List of Abbreviations
Acetoxymethyl (AM)
Adenosine triphosphate (ATP)
Ameboid microglia (AMG)
Aspartic acid (Asp)
Blood-brain barrier (BBB)
Bovine serum albumin (BSA)
Bromodeoxyuridine (BrdU)
Central nervous system (CNS)
Connexin (Cx)
Corpus callosum (CC)
Current/voltage (I/V)
6-Cyano-7-nitroquinoxaline-2,3-dione (CNQX)
Cytochalasin D (CytoD)
Delayed rectifying potassium (Kdr)
Diaminobenzidine (DAB)
Dulbecco’s Modified Eagle Medium (DMEM)
Enhanced green fluorescent protein (EGFP)
Enzyme-Linked ImmunoSorbent Assay (ELISA)
Ethylene glycol tetraacetic acid (EGTA)
Excitatory to inhibitory (E-I)
Extracellular potassium concentration ([K+]o)
Fetal calf serum (FCS)
(relative) Fluorescent intensity (F/F0)
Gamma-amino-butyric acid (GABA)
Glial fibrillary acidic protein (GFAP)
Growth regulated oncogene (GRO)
Hank’s Balanced Salt Solution (HBBS)
Holding potential (HP)
Image Cells Easily (ICE)
Glial properties in development and injury x
Interleukin (IL)
Intracellular calcium concentration ([Ca2+]i)
Intracellular chloride concentration ([Cl-]i)
Inward rectifying potassium (Kir)
Ionized calcium-binding adaptor molecule (Iba)
Kainic acid (KA)
Keratinocyte-derived chemokine (KC)
Lipopolysaccharide (LPS)
Macrophage inflammatory protein (MIP)
Membrane potential (MP)
Membrane resistance (Rm)
Middle cerebral artery occlusion (MCAo)
Monocyte chemoattractant protein (MCP)
Naval Medical Research Institute (NMRI)
Neuron-glia 2 (NG2)
Phosphate buffer (PB)
Phosphate buffer saline (PBS)
Pipette resistance (Rp)
Regulated upon Activation - Normal T cell Expressed and Secreted (RANTES)
Room temperature (RT)
Stromal cell-derived factor (SDF)
Tetraethylammonium (TEA)
Tetrodotoxin (TTX)
Tris-HCl buffer (TB)
Tumor necrosis factor (TNF)

Glial properties in development and injury 11
1 Introduction
1.1 Microglia in the developing brain
1.1.1 Microglial dynamics in development Microglia, unlike neurons and macroglial cells, are of mesodermal lineage and infiltrate the
central nervous system (CNS) early in development (Perry and Gordon, 1991; Cuadros
and Navascues, 2001). Rio-Hortega (1932) identified regions of microglial invasion at the
corpus callosum and other white matter areas and named them fountains of microglia. In
rodents, the number of microglia transiently increases during the last days of embryonic
and first two weeks of postnatal days (Milligan et al., 1991). Ling (1979) demonstrated that
blood monocytes invade the early postnatal brain at the corpus callosum and become
ameboid microglia (AMG). It appears that several routes of entry constitute subpopulations
of microglia in the CNS at different stages of life (Provis et al., 1996). A large number of
cells enter through the meninges by traversing the pial surface. They can also enter
through the ventricular space by squeezing between the neuroepithelial cells. Other cells in
the circulating blood may enter the brain parenchyma through the endothelial wall
(Navascues et al., 2000). The fact that the blood-brain barrier (BBB) is not fully developed
until the second week of birth in rodents allows an efficient early invasion of microglia
required for later development (Xu et al., 1993). It is generally believed that the majority of
microglial precursors come from the meninges and ventricular lumen during embryonic
development, while entry through blood stream predominates in mature brains (Navascues
et al., 2000).
Once in the CNS, these highly motile AMG perform active phagocytosis of cellular debris in
response to naturally occurring cell death (Ferrer et al., 1990; Brockhaus et al., 1996).
They could also promote brain tissue remodeling by directly influencing neuronal survival
and growth of their processes (Thery et al., 1991; Chamak et al., 1994; Mallat and
Chamak, 1994). Microglial migration has been well documented in retina, optic tectum and
cerebellum (Navascues et al., 2000). It is believed that AMG in these and other CNS
regions make use of their processes in dispersing themselves (Brockhaus et al., 1996;
Cuadros et al., 1997). They migrate first tangentially parallel to the CNS surface along

Glial properties in development and injury 12
axonal tracts and then radially perpendicular to the surface into different layers of the
nervous parenchyma (Cuadros et al., 1994; 1997). This is in line with the observation that
AMG are first seen in the white then grey matter (Perry et al., 1985). Naturally occurring
cellular processes like axon growth and cell rearrangement modulate microglial behavior in
the developing brain (Cuadros and Navascues, 1998). Similarly, cell death may also be an
important cue for microglial migration (Pearson et al., 1993). Ameboid but not ramified
microglia are strongly immunoreactive to thrombospondin, a prominent factor present
during axonal growth suggesting that microglia alter their receptor expression patterns
throughout development (Chamak et al., 1995).
Proliferation of microglia occurs in many regions of the developing CNS including the
corpus callosum (Ling and Tan, 1974; Imamoto and Leblond, 1978; Kaur and Ling, 1991).
Márin-Teva et al. (1999) have demonstrated that AMG in the developing quail retina
undergo alternating stages of migration and mitosis. This process peaks between postnatal
day 5 and 10 and progressively decreases as the brain matures (Perry and Gordon, 1991;
Ling and Wong, 1993). Studies mostly carried out in vitro have identified factors like
neurotrophin-3, interleukin-4 (IL-4), IL-5, pigment epithelium-derived factor, and adrenergic
agonists in regulating microglial proliferation (Suzumura et al., 1994; Ringheim, 1995;
Elkabes et al., 1996; Sugita et al., 1997; Fujita et al., 1998). Astrocytes and neurons may
modulate microglial proliferation presumably by secreted factors (Elkabes et al., 1996;
Dobbertin et al., 1997; Streit et al., 1999). Although many of these factors are found in the
developing brain, direct evidence of their effects on the expansion of microglial population
in vivo has not yet been resolved.
At their destinations, microglia differentiate into a ramified phenotype and show changes in
immunophenotypical characteristics including expression of surface markers (Cuadros and
Navascues, 1998). Such transformation occurs between the second and third postnatal
weeks (Ling and Wong, 1993). In adult CNS, proliferation of resident microglia and
recruitment of circulating monocytes across intact BBB account for a slow turnover of
microglial population (Lawson et al., 1992). It is believed that microglia are less ramified in
brain regions rich in plasma proteins which are normally excluded by complete BBB in
other regions (Perry and Gordon, 1991). Astrocytes also promote ramification of microglia
in vitro (Suzumura et al., 1994; Eder et al., 1997; Fujita et al., 1998; Tanaka et al., 1999).

Glial properties in development and injury 13
While these cells have always been thought to be quiescent and resting, recent advances
in in-vivo imaging clearly showed that they are constantly sensing the environment with
their processes (Davalos et al., 2005; Nimmerjahn et al., 2005). Thus, it is believed that
microglia carry out active tissue scanning and quickly respond to injury by transforming to
their activated states (Hanisch and Kettenmann, 2007). Activated microglia then undergo
microgliosis and efficiently increase in number (Streit et al., 1999). This is accompanied by
the recruitment of bone marrow-derived cells into the neural parenchyma (Ladeby et al.,
2005). Interestingly, many immunohistochemical features present in AMG but lost in
ramified microglia reappeared after activation (Streit et al., 1988).
As various mechanisms account for entrance, colonization, proliferation and differentiation
of microglial populations at different developmental and injury states, it is essential that
invading microglia early in development should be considered as a unique population and
studied only in relevant context. Fig. 1 illustrates dynamics and expansion of microglial
populations in the developing brain. While many microglial behaviors are influenced by the
environment, details of how invading microglia incorporate themselves into the neural
parenchyma in vivo are yet to be elucidated.
1.1.2 Microglial potassium channels Like peripheral macrophages, microglia express a variety of ion channels conducting the
movement of K+, Na+, H+, Ca2+ and Cl- ions across the plasma membrane (Eder, 1998,
2005; Farber and Kettenmann, 2005). They have important roles in regulating membrane
potential (MP), cell volume and intracellular ion concentrations which in turn modulate
microglial proliferation, migration, cytokine secretion, as well as shape changes (Eder,
1998, 2005). Among them, K+ channels are particularly important for stabilizing microglial
MP at around -70 mV. The inward rectifying K+ (Kir) channels detected in all microglia
preparations are open upon membrane hyperpolarization and sensitive to extracellular
Ba2+, Cs+, tetraethylammonium (TEA), and quinine (Norenberg et al., 1994). A single
channel conductance of 30 pS typical for classical Kir channels was previously recorded in
cultured microglia (Kettenmann et al., 1990). Time- and voltage-dependent inactivation of
Kir currents occurs due to blockade by extracellular Na+ (Standen and Stanfield, 1979).

Glial properties in development and injury 14
Fig. 1. Developmental fate of microglia. Most authors believe that microglial precursors are of mesodermal origin and enter the developing CNS through different routes. Upon entry, ameboid microglia (AMG) proliferate and migrate through the CNS (‘spreading'). Once they reach their final locations, differentiation into ramified microglia occurs. Adapted from (Cuadros and Navascues, 1998).
With elevated extracellular potassium concentration ([K+]o), the reversal potential of Kir
current becomes more positive leading to an increase in chord conductance (Eder et al.,
1995b). It is believed that Kir2.1 encodes for microglial Kir channels given its characteristic
properties of macrophage Kir2.1 channels and the presence of Kir2.1 transcripts in
microglia culture (Kubo et al., 1993; DeCoursey et al., 1996; Schilling et al., 2000). In many
cases where Kir channels are closed, voltage-gated delayed rectifying K+ (Kdr) channels
take over in regulating K+ homeostasis. For example, Kdr channels are important in
stabilizing activated microglia in which Kir channels are mostly closed (Norenberg et al.,
1994). They are activated at -40 mV and increase in amplitude as the cell depolarizes and
are blocked by substances like 4-aminopyridine, TEA, Ba2+, Cd2+, and Zn2+ (Norenberg et
al., 1994; Schilling et al., 2000). Apart from maintaining MP, K+ channels may also
modulate microglial cytokine release and proliferation. In particular, microglial nitric oxide

Glial properties in development and injury 15
release and proliferation are regulated by Kv1.5 and/or Kv1.3 channel expression
(Pannasch et al., 2006). Furthermore, it was demonstrated that K+ efflux via Kdr channels
was required for the conversion of proinflammatory cytokine IL-1β into its mature and
active form (Cheneval et al., 1998; Sanz and Di Virgilio, 2000). Prominent Kir current was
detected in proliferating microglia implying its potential regulatory functions (Schlichter et
al., 1996). Conversely, proliferation of activated microglia lacking Kir current relied on Kdr
channels (Kotecha and Schlichter, 1999).
Functional importance of microglial K+ channels is reflected by changes in membrane
currents throughout development and pathology (Fig. 2). Ramified microglia in situ express
very little, if any, voltage-gated current and are considered “resting” (Boucsein et al., 2000).
Postnatal (Brockhaus et al., 1993) and cultured microglia (Kettenmann et al., 1990), on the
other hand, express large Kir currents. Upon stimulation with lipopolysaccharide (LPS), a
membrane component of gram-negative bacteria, pronounced Kdr current often
accompanied by decreased Kir current is detected (Norenberg et al., 1992). In response to
brain injury imposed by facial nerve axotomy, microglia in situ transiently acquire first
inward then outward rectifying K+ currents (Boucsein et al., 2000).
Apparently, microglial K+ channel activities are tightly regulated to maintain ion
homeostasis for many cellular processes. Further understanding of potential functions of
these channels, especially during brain development, will be of great benefits.
1.1.3 Chemokines as neuromodulators Cytokines are small proteins used to signal between cells and are important for many
physiological and pathological cellular processes in the nervous systems. Those that are
responsible for regulating cell migration are called chemotactic cytokines or chemokines.
They are divided into four subclasses based on spacing of cysteine residues which are C,
C-C (β), C-X-C (α), and C-X3-C (Laing and Secombes, 2004). In general, α- and β-
chemokines predominantly attract neutrophils and mononuclear phagocytes, respectively.
While constitutive microglial release of chemokines is often low, rapid release occurs under
stress or in the presence of pathogens (Hanisch, 2002). Thus, the majority of studies focus
on their functions in inflammation, neuroprotection, as well as glial activation (Aloisi, 2001;
Bajetto et al., 2002). Upon stimulation, microglia release chemokines like growth regulated

Glial properties in development and injury 16
Fig. 2. Dynamics of microglial K+ currents. Changes in K+ currents are shown for (A) an ameboid microglia on postnatal corpus callosum brain slice; (B) cultured microglia before and after LPS stimulation; and (C) microglia on adult brain slice 0 (“resting”), 0.5, 1, 3 and 7 days after facial nerve axotomy. Each cell was voltage clamped at -70 mV. Membrane currents were activated by de- and hyperpolarizing voltage steps at 10-mV increments. Adapted from (Haas et al., 1996; Boucsein et al., 2000; Farber and Kettenmann, 2005).
oncogene α or keratinocyte-derived chemokine (GROα or KC), macrophage inflammatory
protein 1 α (MIP-1α), MIP-1β, MIP-2, monocyte chemoattractant protein-1 (MCP-1),
RANTES (for “regulated upon activation, normal T cell expressed and secreted”),
interferon-inducible protein-10, and IL-8 to recruit leukocytes to the sites of injury (Hanisch,
2002; Ambrosini and Aloisi, 2004). As immune cells of the CNS, microglia also express

Glial properties in development and injury 17
functional receptors allowing them to sense and to be modulated by chemokines (Hanisch,
2002; Farber and Kettenmann, 2005). Most of them are G-protein coupled receptors
leading to mobilization of Ca2+ from internal stores to the cytosol which in turn modulate
microglial chemotaxis and downstream immune responses. Microglial receptors for β-
chemokines MCP-1, RANTES, and MIP-1α have been detected in vitro (Boddeke et al.,
1999). Furthermore, Albright et al. (1999) have observed functional CCR5 and CXCR4
receptors which bind MIP-1β and stromal cell-derived factor-1 (SDF-1), respectively.
Activation of CXCR3 by CCL21 also promoted chemotaxis and triggered a long lasting Cl-
conductance in cultured microglia (Biber et al., 2001; Rappert et al., 2002).
Recent findings have supported chemokines as neuromodulators which play important
roles in development, neuronal survival, neurohormonal actions, and behavior (Rostene et
al., 2007). In particular, the similarities between hematopoiesis and neuropoiesis have led
to investigations of possible roles of chemokines in attracting neurons and glial cells in the
CNS. Several known chemokine and receptor systems including SDF-1/CXCL12,
RANTES/CCL5, MCP-1/CCL2, MIP-1α/CCL3, IL-8/CXCL8, GRO-α(or KC)/CXCL1, and
fractalkine/CX3CL1 are constitutively expressed in the CNS and appear to be regulated by
developmental processes (Ambrosini and Aloisi, 2004). It was demonstrated that SDF-1
could promote migration of embryonic neural progenitor cells in vitro (Lazarini et al., 2000;
Tran et al., 2004) and regulate axonal patterning in developing hippocampal neurons (Pujol
et al., 2005). The release of dopamine and vasopressin from neurons can also be
modulated by SDF-1 (Callewaere et al., 2006; Skrzydelski et al., 2007). In vivo studies
using mice deficient for SDF-1 and its receptor revealed the importance of this chemokine
system in cell migration in normal brain development (Ma et al., 1998). Cultures of human
fetal glial cells express receptors for chemokines and release MCP-1 upon stimulation,
suggesting possible involvement of chemokines as regulatory factors during development
(Rezaie et al., 2002a; Cartier et al., 2005). MIP-1α regulates proliferation of hematopoietic
stem cells at different stages of development (Broxmeyer and Kim, 1999). MIP-1α and
MCP-1 treatment could also promote astrocyte migration in vitro possibly via novel
astrocytic receptors (Heesen et al., 1996). Moreover, subnanomolar concentration of MIP-
1α could induce chemotactic response in astrocytes in vitro (Tanabe et al., 1997).
Interestingly, roles of chemokines like IL-8 and GROα in synaptic activity in mouse

Glial properties in development and injury 18
cerebellum have also been postulated (Giovannelli et al., 1998). In addition, synergy
between GROα and platelet derived growth factor (PDGF) mediates oligodendrocyte
precursor proliferation (Robinson et al., 1998). While roles of chemokines and their
receptors in inflammatory response are well accepted, other functions including those
related to expansion of glial and precursor cell population during development cannot be
overlooked. In this respect, contribution of microglia, the major source of chemokines in the
CNS, to these processes is to be further investigated.
1.1.4 Neurotransmitters and development As active sensors of the environment, microglia express a large repertoire of functional
neurotransmitter receptors, some of which are relevant for the developing brain (Farber
and Kettenmann, 2005; Pocock and Kettenmann, 2007). Stimulation of these receptors is
often coupled to changes in K+ conductance and/or intracellular calcium concentration
([Ca2+]i) leading to downstream effects important for microglial functions. From a basal
[Ca2+]i of 50 – 150 nM, receptor-mediated transient Ca2+ influx into microglia is an
important mechanism present in many signal transduction pathways. Microglia including
AMG express a variety of purinergic receptor subtypes whose activation by adenosine
triphosphate (ATP) increases cationic and K+ conductance as well as [Ca2+]i (Haas et al.,
1996; Farber and Kettenmann, 2006). As a result, microglial properties like motility and
migration (Honda et al., 2001; Nimmerjahn et al., 2005; Haynes et al., 2006; Farber et al.,
2008), cytokine release (Hide et al., 2000; Suzuki et al., 2004); reactive oxygen species
release (Parvathenani et al., 2003), and phagocytosis (Koizumi et al., 2007) were
modulated. It was observed that microglia in situ could sense astrocytic Ca2+ waves via
their purinergic receptors (Schipke et al., 2002). In addition, functional expressions of
adrenaline and dopamine receptors have also been detected on cultured microglia and
AMG (Farber et al., 2005). It is speculated that enhanced migration as a result could attract
microglia towards regions of purinergic, adrenergic and dopaminergic transmission relevant
for the developing brain (Farber et al., 2005). Although no synaptic connections between
microglia and neurons has ever been observed, receptors for major neurotransmitters
mostly associated to inflammatory responses are present on microglia. Glutamate
receptors were detected on rat microglia in vitro whose activation were coupled to transient
Glial properties in development and injury 19
increase in [Ca2+]i and release of tumor necrosis factor-α (TNF-α) and Fas ligand which in
turn regulated neuronal death and protection (Pin and Duvoisin, 1995; Noda et al., 2000;
Taylor et al., 2003; Hagino et al., 2004; Taylor et al., 2005). Microglia in vitro and in situ can
sense gamma-amino-butyric acid (GABA) via GABAB receptors resulting in an increase in
K+ conductance and [Ca2+]i (Kuhn et al., 2004). The authors have demonstrated that
cytokine release by activated microglia was attenuated by simultaneous GABAB receptor
activation suggesting anti-inflammatory effect.
In the developing brain, GABA is released from growth cones of developing axons prior to
synapse formation (Gao and van den Pol, 2000). It acts as a trophic factor regulating
various important processes in development. Haydar et al (2000) showed that GABA and
glutamate activities modulate proliferation of neural progenitor cells. Cortical migration of
postmitotic cells was also regulated by differential GABAA receptor stimulation (Behar et
al., 2000; Heck et al., 2007). It was also observed that GABAA receptor activation together
with L-type Ca2+ channels in differentiating neurons promote neurite outgrowth (Maric et
al., 2001). Furthermore, Barbin et al. (1993) observed that GABAA receptors played a role
in outgrowth of hippocampal neurons in vitro. The formation of neuronal circuits during
brain development requires intricate mechanisms involving different cell types and
signaling molecules. GABAergic precedes glutamatergic activities in a developing brain
acting as a source for neuronal excitation (Balslev et al., 1996). This is enabled by the fact
that GABAA receptors are expressed on neurons since embryonic stages and are
excitatory in immature neurons (Cobas et al., 1991; Balslev et al., 1996). Although
presynaptic GABAB receptors are present since birth, those mediating postsynaptic
inhibition appears only later (Gaiarsa et al., 1995). Subsequently, glutamate receptors
which are previously ‘silent’ become functional mediating glutamatergic synapses (Isaac et
al., 1997). Kullmann et al. (1996) attributed this to glutamate spill-over preferentially
promoting functional receptors (Patneau and Mayer, 1990). Thus, it is suggested that
GABAA and glutamate receptors display activity dependent sequential participation to
neuronal excitation (Ben-Ari et al., 1997).
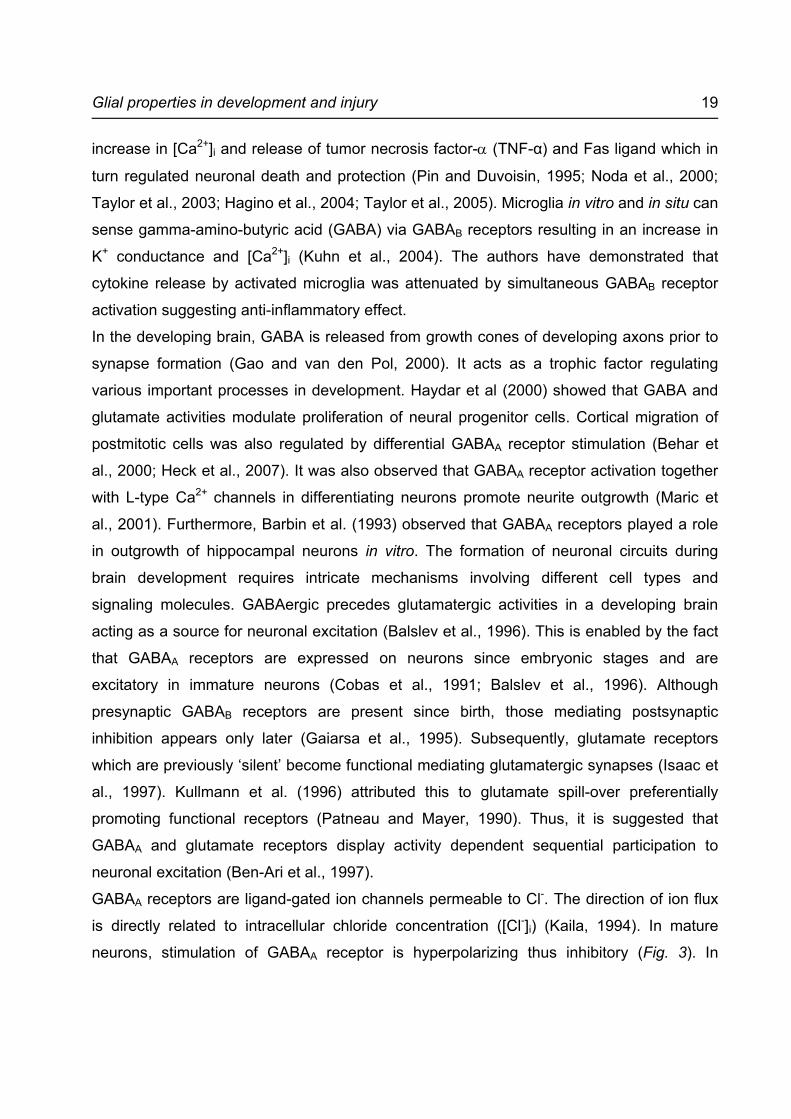
GABAA receptors are ligand-gated ion channels permeable to Cl-. The direction of ion flux
is directly related to intracellular chloride concentration ([Cl-]i) (Kaila, 1994). In mature
neurons, stimulation of GABAA receptor is hyperpolarizing thus inhibitory (Fig. 3). In

Glial properties in development and injury 20
immature neurons, on the other hand, membrane depolarization occurs due to high [Cl-]i
giving rise to an excitatory response (Martina et al., 2001; Marandi et al., 2002; Gulledge
and Stuart, 2003). As [Cl-]i progressively decrease in development, the negative shift of the
reversal potential of GABA during the second postnatal week parallels excitatory to
inhibitory (E-I) switch of the action of GABA. (Kuner and Augustine, 2000; Marandi et al.,
2002). Ganguly et al., (2001) observed that GABA itself promotes such switch in
GABAergic responses. In particular, GABAA receptor-mediated Ca2+ influx regulates the
late expression of KCC2, a transporter responsible for extruding Cl- ions from the cells.
Fig. 3. E-I switch of neuronal GABAA receptors. High [Cl-]i is maintained in immature neurons by NKCC1. As a result, GABAA receptor activation leads to efflux of Cl- and depolarization. Cl- extruder KCC2 is expressed late in development and contributes to low [Cl-]i in mature neurons. Thus, hyperpolarization occurs due to Cl- influx upon GABAA receptor. Adapted from (Ben-Ari et al., 2007).
Vertebrate macroglial cells also express glutamate and GABA receptors (Von Blankenfeld
et al., 1991). Due to constantly high [Cl-]i, GABAA receptor stimulation by GABA or the
specific agonist, muscimol, is always depolarizing as observed in cultured astrocytes and
oligodendrocytes (Bowman and Kimelberg, 1984; Gilbert et al., 1984). This was also
demonstrated in mouse postnatal corpus callosum (Berger et al., 1992) and hippocampal

Glial properties in development and injury 21
slices (Steinhauser et al., 1994), as well as Bergmann glial cells (Muller et al., 1994)
suggesting their extrasynaptic functions.
Apart from acting as a classical inhibitory neurotransmitter, GABA has other functional
roles synergistic to glutamate in the developing brain. The potential involvement of glial
GABAA receptors in developmental processes promotes further studies exploring
interactions between glia and developing networks. At present, functional GABAA receptors
have not been detected on any microglia preparations.
1.2 Astrocytes in the injured brain
1.2.1 Functional heterogeneity of astrocytes It has become evident that astrocytes express a large variety of ion channels and receptors
through which communications with neurons take place (Verkhratsky and Steinhauser,
2000; Haydon, 2001). Electrophysiological properties of glial cells have been extensively
investigated in the hippocampus using acute brain slices. Steinhauser et al. (1992; 1994)
have differentiated two types of astroglial cells in the hippocampus and called them passive
and complex cells based on their membrane properties. Later studies have shown that
complex cells express functional glutamate receptors but lack transporters and vice versa
in passive cells (Seifert and Steinhauser, 1995; Zhou and Kimelberg, 2001). Morphological
distinctions among astrocytes were further revealed using transgenic mice in which
enhanced green fluorescent protein (EGFP) is expressed under the control of the glial
fibrillary acidic protein (GFAP) promoter (Matthias et al., 2003). In the hippocampus,
brightly fluorescent cells have branching nets of processes and are mostly GFAP
immunopositive; whereas the weakly fluorescent cells consistently lack GFAP protein
expression and have short, thin processes (Matthias et al., 2003). Furthermore, the
majority of brightly and weakly fluorescent cells have typical passive and complex
membrane currents, respectively (Matthias et al., 2003). The expression of glutamate
transporters by brightly fluorescent astrocytes allowed glutamate uptake and release which
is important for regulating glutamatergic synaptic activities (Anderson and Swanson, 2000).
The weakly fluorescent cells, on the other hand, also include glial cells positive for
proteoglycan NG2 which stands for “neuron-glia 2” (Matthias et al., 2003). These NG2 cells
were first considered precursor cells in the oligodendrocyte lineage and have been shown

Glial properties in development and injury 22
to receive glutamatergic synaptic input (Bergles et al., 2000). Furthermore, synapses
between neurons and NG2 positive cells undergo activity-dependent modifications
analogous to long-term potentiation at excitatory synapses (Ge et al., 2006). Thus,
astrocytes comprise of heterogeneous populations with distinctive membrane properties,
GFAP promoter activity, morphology as well as response towards glutamate. These
differences are essential for distinct functions in the brain.
1.2.2 Astrocytes in response to brain injury Functional properties of astrocytes change during injury and disease (Verkhratsky and
Steinhauser, 2000). In the process called astrogliosis, the brain responds to injury by an
increase in the number of hypertrophic astrocytes with up-regulation of GFAP. As a result,
these reactive astrocytes express voltage-gated currents depending on their proliferation
state (MacFarlane and Sontheimer, 1997; Bordey et al., 2000; Hinterkeuser et al., 2000;
Bordey et al., 2001). Up-regulation in outwardly rectifying K+ currents in reactive astrocytes
thought to be involved in controlling cell proliferation was observed in situ (Bordey and
Sontheimer, 1998; Bordey et al., 2001) and in vitro (MacFarlane and Sontheimer, 1997;
Perillan et al., 1999; 2000; Anderova et al., 2004). Furthermore, after focal cortical freeze-
lesion, dividing cells showed an enhanced expression of Kdr channels but did not express
Kir channels (Bordey et al., 2000; 2001). Astrocytes also respond towards brain ischemia
and associated neuronal death (Contreras et al., 2004; Rossi et al., 2007).
One way by which astrocytes communicate among themselves is through gap junctions.
These are specialized transmembrane pores between two cells made up of two opposing
hemichannels composed of connexins. As ions and small molecules < 1 kDa can pass
freely between these cells, intracellular signaling molecules and electrical currents can
propagate from one cell to the next (Giaume and McCarthy, 1996). In K+ spatial buffering,
astrocytes remove K+ ions from the extracellular space at one location and transport them
within a network of cells and eventually extrude the ions at other sites (Horio, 2001). The
expression and permeability of gap junctions are tightly regulated under physiological and
pathological conditions. In the hippocampus, astrocytes expressing glutamate transporters
display extensive gap junction coupling which is completely absent in cells with glutamate
receptor expression (Wallraff et al., 2004). It has been established that membrane
Glial properties in development and injury 23
depolarization as a result of ischemia promotes gap junction opening while other signals
like dephosphorylation, lowered pH, and elevated Ca2+ level lead to closure (Contreras et
al., 2004). Short-term middle cerebral artery occlusion (MCAo) followed by reperfusion has
been used as a model for mild brain ischemia to study the impact of ischemia on astrocyte
physiology. Thirty minutes MCAo/reperfusion confers delayed neuronal cell death and
astrogliosis in the striatum sparing the cortex (Endres et al., 1998; Katchanov et al., 2001;
2003). Astrocytic coupling plays diverse and important roles during focal ischemia in that
toxic substance from astrocytes in the core of lesion can diffuse to healthier cells in the
penumbra. Conversely, health-promoting molecules can diffuse into dying cells in the
reversed direction (Rossi et al., 2007). At present, both beneficial and detrimental effects of
gap junction coupling have been supported (Blanc et al., 1998; Lin et al., 1998; Frantseva
et al., 2002; Nakase et al., 2003a; Nakase et al., 2003b; Perez Velazquez et al., 2003).
Increased levels of extracellular glutamate and other neurotransmitters occur in response
to ischemia (Phillis et al., 1996). Whereas vesicular release of glutamate from astrocytes
occur in response to increased [Ca2+]i (Montana et al., 2006), the major source of
extracellular glutamate accumulation is through reversed glutamate uptake (Phillis et al.,
2000; Rossi et al., 2000). Specifically, it appears that during early phases of ischemia,
neurons release glutamate and astrocytes take it up as transporters on neurons are more
likely to reverse (Ottersen et al., 1996; Silver et al., 1997). This process may serve as a
mechanism of glutamate clearance thus conferring neuroprotection. However, as uptake of
glutamate continues in prolonged ischemia, astrocytes may eventually reach a stage where
they begin to release glutamate and thereby promote neurodegeneration (Mitani and
Tanaka, 2003).

Glial properties in development and injury 24
2 Objectives and Hypotheses
Increasing evidence revealed distinctive roles of glial cells in the brain under both
physiological and pathological situations. Microglia can sense the environment via ion
channels and neurotransmitter receptors (Farber and Kettenmann, 2005; Pocock and
Kettenmann, 2007). While many studies focused on immunomodulatory properties of
microglia, their functions in postnatal brain development are yet largely unknown. In
particular, postnatal invading microglia as a unique subpopulation may have potential
interactions with GABAergic innervations in the maturing brain (Ben-Ari et al., 2007).
Similarly, astrocytes are heterogeneous in terms of morphology, protein expression,
membrane currents and neurotransmitter receptor expression (Matthias et al., 2003). In
contrast to microglia, one population of astrocytes in the hippocampus forms extensive gap
junction networks propagating signals across the brain (Wallraff et al., 2004) whereas
another glial subtype receives synaptic signals from neurons (Bergles et al., 2000). These
properties are particularly important during brain ischemia where toxic substances like
glutamate and K+ accumulate in the extracellular space upon neuronal death (Rossi et al.,
2007). As an experimental model, short mild brain ischemia affects the striatum where
changes in glial properties have been explored (Katchanov et al., 2001; 2003; Kronenberg
et al., 2005).
2.1 Objectives
The aim of this study was to investigate properties of glial cells during development and
disease in two independent projects.
Project 1 was designed to establish the role of invading microglia in the developing mouse
brain. In particular, their response towards GABAergic activities in acute brain slices was
investigated. Specific aims were to:
1. detect and characterize functional GABAA receptors on microglia;
2. compare microglial response between postnatal and developed brain;
3. investigate functional outcome in microglial behaviors, namely motility, migration,
proliferation, and cytokine release; and

Glial properties in development and injury 25
4. develop convenient and reliable methods to study properties of invading microglia.
Project 2 was designed to investigate physiological properties of astrocytes in response to
mild brain ischemia. In particular, using whole cell patch-clamp recordings, GFAP-EGFP
expressing astrocytes in the striatum were characterized before and after mild stroke
induced by MCAo/reperfusion. Specific aims were to:
1. characterize subpopulations of astrocytes in terms of GFAP-EGFP expression,
morphology, current patterns, glutamate receptor/transporters expression, and gap
junction networks; and
2. compare characteristic properties before and at different time points after 30 min
MCAo/reperfusion.
2.2 Hypotheses
With Project 1, it was hypothesized that invading microglia can sense GABAA receptor
activities in postnatal brain directly by expressing functional receptors and/or indirectly via
signals from neighboring cell types. In turn, characteristic microglial properties relevant for
development would be modulated. With these, it was intended that functional significance
of invading microglia, particularly towards postnatal neurotransmitter innervations, could be
revealed. With Project 2, it was predicted that, like in other brain regions, astrocytes could
be characterized into subpopulations with distinctive physiological properties serving
unique functions in the striatum. In response to ischemia, these properties would be altered
further revealing their functions in physiology and pathology. These findings may add to the
growing evidence of the role of astrocytes in neuroprotection. As a result, specific
properties of glial cells in development and injury could be recognized by these studies.
Glial properties in development and injury 26
3 Materials and Methods
3.1 Materials
3.1.1 Drugs and chemicals Table 1. List of drugs and chemicals
Name Company
Adenosine triphosphate (ATP) Sigma-Aldrich, Munich, Germany
(D)-Aspartic acid (D-Asp) Sigma-Aldrich, Munich, Germany
Baclofen Sigma-Aldrich, Munich, Germany
Biocytin Sigma-Aldrich, Munich, Germany
Bovine Serum Albumin (BSA) Fluka Chemie, Buchs, Switzerland
6-Cyano-7-nitroquinoxaline-2,3-dione (CNQX) Sigma-Aldrich, Munich, Germany
Cytochalasin D (CytoD) Sigma-Aldrich, Munich, Germany
Deoxyribonuclease Worthington, Lakewood, NJ, USA
Diaminobenzidine (DAB) Sigma-Aldrich, Munich, Germany
Diff-Quik® stain set Medion Diagnostics, Düdingen, Switzerland
Dimethylsulfoxide Sigma-Aldrich, Munich, Germany
Dulbecco’s Modified Eagle Medium (DMEM) Gibco, Eggenstein, Germany
Elite ABC kit Vector Lab.,Burlingame, CA, USA
Ethylene glycol tetraacetic acid (EGTA) Sigma-Aldrich, Munich, Germany
Fetal Calf Serum (FCS) Gibco, Eggenstein, Germany
Gabazine Tocris Cookson Inc., Bristol, UK
Glial fibrillary acidic protein (GFAP) antibody DAKO, Hamburg, Germany
Glutamate Fluka Chemie, Buchs, Switzerland
(L)-Glutamine Biochrom AG, Berlin, Germany
Glutaraldehyde Sigma-Aldrich, Munich, Germany
Glycerol Sigma-Aldrich, Munich, Germany
Hank’s Balanced Salt Solution (HBBS) Biochrom AG, Berlin, Germany
HEPES Carl Roth, Karlsruhe, Germany
Isolectin B4 (Griffonia simplicifolia) Sigma-Aldrich, Munich, Germany
Kainic acid (KA) Tocris Cookson Inc., Bristol, UK
Lipopolysaccharide (LPS) Sigma-Aldrich, Munich, Germany
Muscimol Tocris Cookson Inc., Bristol, UK

Glial properties in development and injury 27
Paraformaldehyde Merck, Damstadt, Germany
Penicillin/Streptomycin Biochrom AG, Berlin, Germany
Poly-L-lysine Sigma-Aldrich, Munich, Germany
Potassium ionophore I cocktail A (Selectophore®) * Fluka Chemie, Buchs, Switzerland
Streptavidin-HRP Conjugate Biosource, Nivelles, Belgium
Sucrose Merck, Damstadt, Germany
Tetramethylbenzidine Moss Inc., Maryland, USA
Tetrodotoxin (TTX) Tocris Cookson Inc., Bristol, UK
Trypsin Gibco, Eggenstein, Germany
Tween 20 Merck, Hohenbrunn, Germany
* Institute for Neurophysiology, Charité-Universitätsmedizin Berlin, Germany
Table 2. List of fluorescent indicators
Name Company
Tomato lectin-conjugated Alexa Fluor®594 (Linkage) BioTez GmbH, Berlin, Germany
Alexa Fluor®594 Invitrogen, Carlsbad, CA, USA
Tomato (lycopersicon esculentum) lectin Vector Lab.,Burlingame, CA, USA
Fluo-4 AM Invitrogen, Carlsbad, CA, USA
3.1.2 Intra- and extracellular solutions Table 3. Solutions for acute brain slices and cell cultures
Standard Brain Slice Buffer HEPES Buffer Standard Internal Solution
NaCl 134 150 -
KCl 2.5 5.4 130
C6H12O6 10 10 -
MgCl2 ⋅ 6H2O 1.3 1 2
CaCl2 ⋅ 2H2O 2 2 0.5
K2HPO4 ⋅ 3H2O 1.25 - -
NaHCO3 26 - -
HEPES - 5 10
EGTA - - 5
pH 7.4 7.4 7.3
Osmolarity (mmol/kg) 349 335 283

Glial properties in development and injury 28
3.1.3 Cytokine and proliferation assays Table 4. List of antibodies and standards for cytokine assays
Name µg/ml Company
Anti-mouse capture antibody
IL-12 p40/70 1.25 BD Pharmingen, Heidelberg, Germany
IL-6 1 R&D Systems, Wiesbaden, Germany
KC 1 R&D Systems, Wiesbaden, Germany
MIP-1α 2 R&D Systems, Wiesbaden, Germany
TNF-α* 0.8 R&D Systems, Wiesbaden, Germany
Biotinylated anti-mouse detection antibody
IL-12 p40/70 0.625 BD Pharmingen, Heidelberg, Germany
IL-1 0.1 R&D Systems, Wiesbaden, Germany
KC 0.1 R&D Systems, Wiesbaden, Germany
MIP-1α 0.05 R&D Systems, Wiesbaden, Germany
TNF-α* 0.3 R&D Systems, Wiesbaden, Germany
Recombinant mouse cytokines
IL-12 p40/70 0 - 0.002 R&D Systems, Wiesbaden, Germany
IL-6 0 - 0.002 R&D Systems, Wiesbaden, Germany
KC 0 - 0.002 R&D Systems, Wiesbaden, Germany
MIP-1α 0 - 0.004 R&D Systems, Wiesbaden, Germany
TNF-α* 0 - 0.002 R&D Systems, Wiesbaden, Germany
* Mouse TNF-α/TNFSF1A Duoset Kit (R&D Systems, Wiesbaden, Germany)
Table 5. Solutions for cytokine assays
Solution Assay Content pH
TNF-α 137 mM NaCl + 2.7 mM KCl +8.1 mM Na2HPO4 + 1.5 mM KH2PO4 7.4 PBS
Others 20mM NaH2PO4/Na2HPO4 + 140mM NaCl 7.4
Capture PBS All PBS 7.5
Washing Buffer All PBS + 0.05% Tween20 7.4
IL-12 PBS + 1% BSA 7.4 Blocking Buffer
Others PBS + 1% BSA + 5% Sucrose 7.4
IL-12, TNF-α PBS + 1% BSA 7.4 Dilution Buffer
Others 20mM Tris base+ 150mM NaCl + 0.1% BSA + 0.05% Tween 20 7.3
HRP-Diluent All PBS + 0.1% BSA + 0.05% Tween20 7.4

Glial properties in development and injury 29
Table 6. Solutions for proliferation assays
Solution Content
BrdU 1:90 BrdU* in DMEM (10% FCS)
Fixative 70% EtOH + 0.5 M HCl
Washing Buffer PBS* + 10% FCS
Nuclease stock Nuclease* + 50% glycerol
Nuclease Solution 1:100 nuclease stock in incubation buffer*
Anti-BrdU Solution 1:100 Anti-BrdU-POD* in washing buffer + 10 mg/ml BSA
ABTS-substrate buffer ABTS-substrate* in substrate buffer*
Peroxidase Solution 1 mg/ml substrate enhancer* in ABTS-substrate buffer
* BrdU labeling and detection kit III (Roche, Mannheim, Germany)
Table 7. Solutions for immunohistochemistry
Solution Content pH
Phosphate buffer (PB) - 0.1 M 100 mM Na2HPO4 + 100 mM NaH2PO4 7.4
Tris-buffered saline - 0.05 M 100 mM Tris-HCl + 100 mM NaCl 7.4
Tris-HCl buffer (TB) - 0.1 M 100 mM Tris-HCl 7.6
3.1.4 Equipments, apparatus, and computer software Table 8. List of equipments and apparatus
Name Company
Amplifier (EPC-9) HEKA Electronics, Lambrecht, Germany
Capillaries (borosilicate) Hilgenberg, Malsfeld, Germany
Capillaries (theta glass – double barrel) * Science Products, Hofheim, Germany
CCD Camera (Quanticam) Phase, Lübeck, Germany
Culture flasks and plates Nunc, Wiesbaden, Germany
Digital camera (AxioCam) Zeiss, Jena, Germany
ELISA plates (IMMUNOTMplates, MaxiSorpTM) Nunc, Wiesbaden, Germany
Filter set for EGFP and Fluo-4
Dichroic mirror = 502 nm
Emission filter = 535 nm
Omega Optical, Austin, TX, USA
Filter sets for Alexa Fluor®594
Dichroic mirror = 595 nm
Emission filter = 645 nm
Omega Optical, Austin, TX, USA

Glial properties in development and injury 30
Filter tips for internal solution (0.22 µm) Millipore, Carrigtwohill, Ireland
Laser Doppler flow meter+ Perimed, Jarfälla, Sweden
Micro Chemotaxis Chamber (48-well) Neuroprobe, Gaithersburg, MD, USA
Micromanipulator (Patchman) Eppendorf, Hamburg, Germany
Microplate reader (VictorTM 1420) Perkin Wallac, Freiburg, Germany
Microscope (Axioplan) Zeiss, Jena, Germany
Microscope (Axioskop) Zeiss, Jena, Germany
Microscope (Axioskop)* Zeiss, Jena, Germany
Microscope (Axiovert25) Zeiss, Jena, Germany
Monochromator (Polychrom IV) Till Photonics, Martinsried, Germany
Nylon monofilament (8.0) coated with silicone resin /hardener mixture (Xantopren and Elastomer activator)+
Bayer Dental, Osaka, Japan
Objective 20X – numerical aperture 0.5w Olympus, Hamburg, Germany
Objective 20X – numerical aperture 0.5w* Zeiss, Jena, Germany
Objective 40X – numerical aperture 0.8w Zeiss, Jena, Germany
Objective 4X – numerical aperture 0.1 Olympus, Hamburg, Germany
Objective 40X – numerical aperture 0.5 Zeiss, Jena, Germany
Pipette Puller (P-2000 Laser Based) Sutter Instrument, Novato, CA, USA
Polycarbonate filter (5 µm) Poretics Corp., Livermore, USA
Vaporizer (Fluotec 3)+ Colonial Medical, Amherst, NH, USA
Vibratome (HM 650V) Microm, Walldorf, Germany
Vibratome (VT 1000 S) Leica, Heidelberg, Germany
* Institute for Neurophysiology, Charité-Universitätsmedizin Berlin, Germany +Department of Experimental Neurology, Charité-Universitätsmedizin Berlin, Germany
Table 9. List of computer software
Name Company
Adobe® Photoshop® CS 8.0 Adobe Systems Inc., San Jose, CA, USA
FeliXTM Photon Technology Int., Wedel, Germany
Image Pro® 5.0 Media Cybernetics, Bethesda, MD, USA
Imaging Cells Easily (ICE) 3.5.99 Max-Delbrück Center, Berlin, Germany
Microsoft® Office 2003 Microsoft, Redmond, WA, USA
Origin® 7.0 OriginLab, Northampton, MA, USA
TIDA Version 5.0 HEKA Electronics, Lambrecht, Germany
Wallac 1420 Version 2.01 Perkin Wallac, Freiburg, Germany

Glial properties in development and injury 31
3.2 Animals
Wildtype Naval Medical Research Institute (NMRI) mice were provided by Charles River
Laboratories (Sulzfeld, Germany). Transgenic mice expressing EGFP under the control of
the ionized calcium-binding adaptor molecule 1 (Iba1) promoter on a C57/BL6 background
were generated by Hirasawa et al. (2005) and obtained from Dr. Kohsaka (Tokyo, Japan).
Another transgenic mouse line with GFAP promoter driven EGFP expression on a FVB/N
background were generated by Nolte et al. (2001). All animals were bred and maintained in
the institutional animal facilities of Max-Delbrück Center (Berlin, Germany) and Charité-
Universitätsmedizin Berlin (Berlin, Germany). Animal experiments were approved by official
committees and adhere to institutional guidelines.
3.3 Induction of mild brain ischemia
Induction of cerebral ischemia in mice was performed by Shengbo Ji and Karen Gertz in
the laboratory of Prof. Dr. Endres at the Department of Experimental Neurology, Charité-
Universitätsmedizin Berlin. Mice were first anesthetized with 1.5% isoflurane and
maintained in 1.0% isoflurane, 69% N2O and 30% O2 using a Fluotec 3 vaporizer. Left
MCAo was induced according to previously described protocols (Endres et al., 1998). An
8.0 nylon monofilament coated with a silicone resin/hardener mixture was inserted into the
left internal carotid artery up to the anterior cerebral artery thereby occludes the middle
cerebral artery and anterior choroidal arteries. After 30 min, the filament was withdrawn
and reperfusion resumed. To ensure equivalent levels of ischemia, regional cerebral blood
flow was measured using laser Doppler flowmetry. Core temperature of the mice was
maintained at 36.5 ± 0.5oC. Sham-operated animals had filaments inserted into the carotid
artery without further advancement.
3.4 Acute brain slice preparation
Postnatal brain slices were prepared from mice between 6 and 8 days old; adult slices from
35 - 40 days old mice. For ischemia experiments, animals were sacrificed on specific days
after MCAo/reperfusion. In brief, mice were decapitated and forebrains were carefully
removed and washed in freshly prepared standard brain slice buffer continuously gassed to

Glial properties in development and injury 32
maintain 5% CO2 and pH 7.4. 150 µm thick coronal slices were made at 4oC using a
vibratome. They were then gently transferred and maintained in the brain slice buffer and
allowed to rest at room temperature (RT; 21 to 25oC) for at least 1 hr before use. Acute
slices were used within 6 hr after preparation.
3.5 Primary microglia cultures
Primary microglia cultures were prepared from cerebral cortex of newborn NMRI mice as
described previously (Prinz et al., 1999). In brief, cortical tissue was freed of blood vessels
and meninges in Hank’s Balanced Salt Solution (HBBS) and trypsinized in 1% trypsin and
0.05% deoxyribonuclease for 5 min at RT. It was then dissociated with a fire-polished
pipette, and washed twice in HBBS. Dissociated cells were plated on glass coverslips
coated with poly-L-lysine and cultured in Dulbecco’s Modified Eagle Medium (DMEM)
supplemented with 10% fetal calf serum (FCS), 2 mM L-glutamine, and antibiotics (100
units/ml penicillin and 100 µg/ml streptomycin). After 9 – 12 days with medium change
every three days, microglia were separated from the underlying astrocytic layer by gentle
shaking and collected at 800 rpm for 10 min at 4oC. The cells were then seeded on glass
coverslips or 96-well plates at a density of 5 × 10⁴ cells/coverslip or 2 × 10⁵ cells/well,
respectively. Cultures usually contained >95% microglia detected by isolectin B4 (Griffonia
simplicifolia) and were used for experiments within 1 to 3 days after plating.
3.6 Visualization of cell populations
3.6.1 Setup and equipments Acute brain slices or culture coverslips were placed in a holding chamber mounted on the
stage of an upright light microscope. In order to secure the position of brain slices without
disturbing areas of interest, they were kept between a glass coverslip and a U-shaped
platinum grid lined with thin threads of nylon. To maintain constant condition during
experiments, the chamber was continuously perfused (at 4 ml/min) with standard brain
slice or HEPES buffer for brain slices or cultures, respectively. Specimens were viewed at
different magnifications using 4X or 40X water immersion objectives. For fluorescence
detection, excitation beams consisting of specified single wavelengths were generated by a
monochromator controlled by TIDA software via an EPC-9 amplifier. The emitted light was

Glial properties in development and injury 33
detected by appropriate sets of filters specific for the fluorophores used. Images were
captured by a CCD camera and saved using Imaging Cells Easily (ICE) software.
3.6.2 Microglia After at least 1 hr of rest, large numbers of AMG could be identified on the surface of
postnatal brain slices at the corpus callosum region near the lateral ventricles as previously
described (Brockhaus et al., 1993). Their distinctive round morphology and large size of
over 10 µm in diameter allowed easy identification under light microscopy (Fig. 4).
Fig. 4. Acute brain slice preparation of AMG. Images of (A) a mouse brain with dotted lines marking corpus callosum section, (B) coronal slice, and (C) large number of AMG on the surface of corpus callosum boxed in B. (D-F) Image sequence showing migration of AMG to the surface of slice at 0, 30 and 60 min after preparation. Red arrows denote newly emerged AMG from within brain slice.
In some experiments, AMG in situ were selectively labeled by staining brain slices for 30
min at RT in 60 µg/ml tomato lectin-conjugated Alexa Fluor®594. Tomato lectin is a marker
for rodent blood vessels and microglia. The linked fluorophore can be excited at 591 nm
and visualized by emitted light at 618 ± 4 nm. In brain slices obtained from Iba1-EGFP
Glial properties in development and injury 34
mice, EGFP positive microglia were visualized using excitation and emission wavelengths
at 488 and 530 ± 10 nm, respectively.
3.6.3 Astrocytes Acute brain slices obtained from GFAP-EGFP mice were used to selectively observe
astrocyte populations. Similar to Iba1-EGFP cells described above, EGFP fluorescence
was excited at 488 nm and visualized at 530 ± 10 nm.
3.7 Electrophysiology
3.7.1 Setup and equipments Electrophysiological studies were carried out using setup described in Section 3.6.1. Patch
pipettes were pulled from borosilicate capillaries (inner, outer, ∅ = 0.87, 1.5; with 0.15 mm
filament) using a pipette puller and filled with standard internal (pipette) solution. In some
cases, Alexa Fluor®594 (10 µg/ml) was added to the pipette solution to confirm intracellular
access. For gap junction coupling experiments, 0.5 - 0.6% biocytin was also included in the
pipette solution. Prior to use, this solution was passed through a filter tip (0.22 µm) in order
to avoid blockage of pipette tips. For each patch-clamp experiment, filled pipette was first
secured on a Cl--coated silver electrode and carefully guided towards the cell of interest
using a micromanipulator. Mild positive pressure was always applied through a U-tube into
the pipette while approaching the cell to avoid contamination at the tip. When cells below
brain slice surface were targeted, positive pressure also aided in navigation through the
cell layers. Electrical potential and current between the patch electrode and ground
electrode inserted into the perfusion were measured by EPC-9 amplifier and monitored on
screen using TIDA software. Pipette resistance (Rp) ranged from 5 to 8 MΩ. All
experiments were performed at RT.
3.7.2 Whole cell voltage-clamp configuration and biocytin dye-filling Conventional whole cell voltage-clamp studies of cells both in vitro and in situ were
performed according to previously described protocols (Hamill et al., 1981). With patch
pipette placed close to the membrane of a cell of interest, positive pressure was removed
and steady continuous suction was applied at the pipette tip through the U-tube. This

Glial properties in development and injury 35
normally led to giga-seal formation within 30 s which represented tight contact between
pipette tip and cell membrane creating resistance of >1 GΩ. The patch of membrane was
then broken by suction and current injection through the electrode (also called ‘zap').
Capacitative transients and series resistance were compensated by the software. MP and
membrane resistance (Rm) were measured on screen. Only cells with stable membrane
potential throughout measurements were used. To determine membrane properties,
membrane current profile of each cell was obtained by measuring current associated with
applied de- and hyperpolarizing 50-ms voltage steps from a holding potential (HP).
In experiments where biocytin was included in the pipette solution, cells were quickly
approached and sealed to avoid leakage of biocytin. Subsequently, cells were filled for 20
min with continuous perfusion to wash out residue biocytin in the extracellular space. To
avoid confusion, only a single cell was filled in a given brain slice. After carefully removing
patch pipettes, slices were fixed in 4% paraformaldehyde and 0.1% glutaraldehyde in 0.1
M phosphate buffer (PB), pH 7.4 for 12 hr at 4oC and subsequently washed with 0.1 M PB
and stored at 4oC before biocytin immunohistochemistry.
3.7.3 Voltage-clamp recordings After establishing whole cell configuration and under voltage-clamp, membrane current
traces were recorded over time with series of de- and hyperpolarizing voltage jumps from
HP repeated every 5 s. Step protocols used are detailed in Results section. Test
substances were applied via bath perfusion into the chamber for various time periods. To
minimize indirect neuronal effects induced by neurotransmitter applications on glial cells,
0.5 µM TTX and 0.1 mM CdCl2 were added to the bath solution to block voltage-gated Na+
and Ca2+ channels, respectively. 50 µM 6-Cyano-7-nitroquinoxaline-2,3-dione (CNQX) was
also included while measuring glutamate transporter response to minimize interference by
AMPA/kainate (KA) glutamate receptor activity.
In some experiments, single AMG were isolated from the brain slice surface to minimize
influence from other cells. This was possible since they were normally sitting loosely on the
surface. After establishing tight seal, they were gently moved away from the surface by
moving the patch pipettes but maintained within the perfusion (Fig. 5A). Once the desired
distance was reached, the cell was allowed to rest for at least 5 min before the patch was

Glial properties in development and injury 36
opened. Most AMG remained stable and responsive even at a distance of 300 µm away
from the slice surface. The patch was normally tight enough to sustain the weight of the cell
and the movement. Similar procedures were previously carried out to detect the response
of AMG towards ATP stimulation (Haas et al., 1996). Based on this, current response of
cells towards 0.5 - 1 mM ATP at the end of each recording was used to confirm cell viability
and patch quality.
In other cases, postnatal brain hemisphere slices were made by carefully cutting the
coronal brain slices in halves with a blade (Fig. 5B). These hemisphere slices were placed
above coverslips of microglia cultures which were transferred together to the recording
chamber for path-clamp experiments. With this, cultured microglia located close to the
corpus callosum region of the slices were studied. Contrary to the isolated AMG method,
this allowed studies of cultured microglia in the presence of brain slice.
Fig. 5. Modified settings for electrophysiological recordings. Conventional patch-clamp settings were modified for studies of isolated AMG. (A) Single AMG was first voltage-clamped on the surface of the brain slice and then carefully lifted up. Membrane current recordings were made at desired distance after at least 5 min of rest. (B) In separate experiments, measurements from cultured microglia under the influence of acute slices were carried out. Half of an acute brain slice was placed on a coverslip of cultured microglia (left panel). Patch-clamp studies on a cultured microglia located near the corpus callosum of the brain slice followed (right panel). Red dots represent AMG from acute slices and green dots are cultured microglia.
3.8 Imaging experiments
3.8.1 Setup and equipments Imaging experiments were carried out using the same setup and equipments described in
Section 3.6.1 and 3.7.1. Imaging protocols were generated and executed by TIDA and ICE
software, which controlled the monochromator and CCD camera via EPC-9 amplifier. In
cases of fluorescence imaging, series of excitation beams were generated from a
monochromator and the emitted light was collected with appropriate sets of filters.

Glial properties in development and injury 37
Resulting image sequences were captured with the CCD camera and stored. Test
substances were applied via bath perfusion. All experiments were performed at RT.
3.8.2 Bright phase imaging of microglial motility To quantify the movement of AMG on brain slices, series of bright field images were
captured at 40X magnification at 1 image every 2 s. AMG motility in terms of displacement
and arm movement were measured.
Displacement of AMG was assessed at a sampling rate of 1 image every 40 s. It is a
measure of the total distance travelled by the cell in two dimensions. The center of each
cell was manually tracked in each frame using the Track Object function on Image Pro® 5.0
and recorded as x and y-coordinates ),( )()( nn yx for frame n. To account for minor drift of
brain slice during recording, changes in cell position between frames were corrected by the
displacement of a reference point on the brain slice. The corrected displacement ( nD )
between 2 frames (from n-1 to n) was calculated using the following equation:
( ) ( )[ ] ( ) ( )[ ]2)1()()1()(2
)1()()1()(2
−−−− −−−+−−−= nRnRnCnCnRnRnCnCn yyyyxxxxD
where C and R stand for coordinates for the cell of interest and reference point,
respectively. Coordinates were measured in pixels whereas 3.7 pixels = 1 µm. Total
displacement was the sum of nD measured in all frames over time and was normalized to
100% baseline activity of corresponding cell.
Besides moving away from its original position, motility of AMG in terms of movement of
their processes (or arms) was also quantified and compared (Fig. 6). At a sampling rate of
1 image every 2 s, differences between consecutive images were isolated using Image
Pro® 5.0 so that only moving components were visible. A filter was then applied to enhance
edges. With the Line Profile function, intensity along the perimeter of a given cell relative to
a reference blank area was measured on a two dimensional plane. Thus, each distinct
peak represented a moving arm. As a result, the sum of peaks detected in all frames was
taken as a measure of arm movement of that cell. To account for variable cell size and

Glial properties in development and injury 38
basal activity, relative arm movement during treatment period normalized to baseline
activity of each cell was determined.
Fig. 6. Determination of arm movement of AMG. (A) Image sequences were processed and sample images are shown. Each bright field image (left panel) was compared to the previous one to obtain a difference image (middle panel). By doing so, background was removed and movement emphasized. This was then filtered to enhance edges (right panel) to allow detection of arms. (B) Intensity profiles around an AMG are shown for two time points (t1 and t2). This was corrected to a reference blank area (Ref.). Distinct peaks on the plots represent moving arms indicated by . (C) Schematic diagrams illustrate the quantification of moving arms. Arm movement is quantified by the sum of peaks over time.
3.8.3 Intracellular calcium imaging of microglia Intracellular Ca2+ imaging experiments were designed using previously described protocols
(Schipke et al., 2002; Kuhn et al., 2004). To label intracellular free Ca2+, postnatal brain
slices were loaded with a Ca2+- sensitive dye Fluo-4 AM (10 µM) in standard brain slice
buffer for 40 min at RT. Similarly, cultured microglia on coverslips were loaded with 5 µM
Fluo-4 AM in HEPES buffer for 30 min at 37oC. In both cases, equilibration was achieved
after washing samples in perfusion chamber for 5 min at RT. Fluo-4 AM is a cell-permeable
acetoxymethyl (AM) ester. Once inside the cell, AM groups are cleaved by esterases thus
entrapping the dye within the cytosol. Cleaved Fluo-4 binds to free Ca2+ and leads to an
increase in fluorescence intensity which can be detected by excitation and emission

Glial properties in development and injury 39
wavelengths at 488 and 530 ± 10 nm, respectively. The measure of relative fluorescence
intensity (F/F0) for each cell over time was taken as a measure of [Ca2+]i.
As it was reported that Fluo-4 preferentially loads astrocytes over microglia in acute brain
slices (Schipke et al., 2002), much stronger Ca2+ signals were often observed in non-AMG
neighboring cells. This interfered with the measurement of [Ca2+]i in the AMG. To
overcome this, single AMG from brain slices loaded with Fluo-4 were giga-sealed with
patch pipettes and lifted up from the surface as described in Section 3.7.3. Here, the glass
pipettes were filled with standard brain slice buffer and the membrane patches were not
broken in order to maintain intracellular content. At a distance of 300 µm above brain slice
surface, response in neighboring cells was no longer detectable. Secondary signals from
these cells were also minimized. Similar to patch-clamp studies, cell viability and patch
quality were tested by 0.5 - 1 mM ATP.
3.9 Extracellular potassium measurement
Recordings of [K+]0 in acute brain slices were performed at the Institute of
Neurophysiology, Charité-Universitätsmedizin Berlin, in the laboratory of Dr. Oliver Kann
adapting previously described protocols (Heinemann, 1992; Kann et al., 2003). Acute brain
slices from postnatal and adult NMRI mice were prepared and allowed to rest for at least 1
hr. They were then placed in a recording chamber mounted on a microscope with constant
perfusion of standard brain slice buffer (at 4 ml/min). DC-coupled recordings of local field
potentials and changes in [K+]o were performed with double-barrel reference and K+-
sensitive microelectrodes. In brief, electrodes were pulled from double barrel theta glass.
The reference barrel was filled with 154 mM NaCl; the ion-sensitive barrel with K+
ionophore I cocktail A and 100 mM KCl. K+-sensitive microelectrodes with a sensitivity of 59
± 2 mV to a tenfold increase in K+ concentration were used for experiments. The amplifier
was equipped with negative capacitance feedback control, which permitted recordings of
changes in [K+]o with time constants of 50 to 200 ms. Changes in voltage were digitized at
10 Hz using FeliXTM software. Electrodes were placed on the surface or in the depth of
about 30 µm of brain slices at the corpus callosum or other regions under 20X water
immersion objective. To translate the recorded potential values in mV to [K+]o, a modified
Nernst equation was used (Heinemann, 1992; Kann et al., 2003):

Glial properties in development and injury 40
[ ] ( ) [ ]oM IonvsEIon loglog 11 +××= −
where ME , recorded potential; s , electrode slope obtained at calibration; v , valence of the
specific ion; [ ]0Ion , ion concentration at rest; and [ ]1Ion , ion concentration during activation.
Throughout recordings, test substances were applied and washed out through the
perfusion system at a rate of 4 ml/min.
3.10 Microglial migration assay
Cell migration assays were performed in 48-well microchemotaxis chambers as described
previously (Nolte et al., 1996). 29 µl of serum-free DMEM containing test substance at
desired concentrations were added the lower wells. DMEM alone and DMEM containing
300 µM ATP were used as negative and positive controls, respectively. Upper and lower
wells were separated by polycarbonate filter with 5 µm pore size. 50 µl DMEM containing 4
x 105 microglia was added to the upper wells, and the chamber was incubated at 37oC and
5% CO2 for 2 hr. Afterwards, the filter was removed and fixed with Diff-Quik®-Fix solution
for 5 min. It was then stained in Diff-Quik®-I (red) for nuclei and Diff-Quik®-II (blue) for
membrane for 5 min each. After washing in water for another 5 min, the filter was left air-
dried. Top side of the filter (i.e. facing cells) was then washed out with water. The number
of cells at each well on the filter was counted using a microscope with a 40X objective and
averaged from 4 random fields per well. This was taken as the rate of microglial migration
towards the test substance which was then normalized to control conditions.
3.11 Microglial proliferation assay
Cultured microglia plated in 96-well plates were stimulated for 24 or 48 hr with test
substance in DMEM/10% FCS with or without LPS (100 ng/ml). The negative control for
basal and induced proliferation was treated with DMEM only or DMEM with LPS,
respectively. To quantify cell proliferation, 10 µM Bromodeoxyuridine (BrdU) labeling
solution was also added to the medium. Proliferation was assessed using BrdU labeling
and detection kit according to manufacturer’s instructions. The amount of BrdU

Glial properties in development and injury 41
incorporated by the cells was taken as a measure of proliferation. In brief, cells were first
fixed at -20oC for 30 min followed by partial digestion of cellular DNA with nuclease solution
for another 30 min at 37oC. Digested samples were further incubated with anti-BrdU-POD
solution for 30 min at 37oC under 5% CO2. Finally, peroxidase solution with enhancer was
added for 30 min at RT. Cleavage of ABTS produced a colored reaction product which was
then quantified at 405 nm against 490 nm using a microplate reader and Wallac software.
Basal and LPS-induced BrdU incorporation (i.e. proliferation) was normalized to respective
controls.
3.12 Cytokine release quantification
3.12.1 Cytokine release in vitro To quantify cytokine release by cultured microglia, cells plated in 96-well plates were
treated with test substances in DMEM/10% FCS. Negative controls were treated with
DMEM only. After 24 hr, culture medium was collected and the amounts of cytokines
released into the medium were measured using Enzyme-Linked ImmunoSorbent Assay
(ELISA). In particular, the release of IL-6, IL-12, KC, TNF-α, and MIP-1α were investigated.
ELISA plates were first coated with specific anti-mouse capture antibodies in phosphate
buffer saline (PBS) overnight at RT. After incubation with blocking buffer for 1 hr at RT (or 2
hr at 37oC for IL-12 assay), prediluted samples and standards in DMEM/10% FCS were
added for 2 hr at RT. After washing, captured cytokines were detected by specific
biotinylated anti-mouse detection antibodies in dilution buffer for 2 hr at RT (or 1 hr at RT
for IL-12 assay). Streptavidin-HRP conjugate (1:200,000 in HRP-diluent) was then added
for 30 min for linkage to the bound detection antibodies. Subsequent binding of
tetramethylbenzidine onto HRP generated a distinctive blue color within 5 to 7 min at which
point color change was stopped by 1N H2SO4. The resulting yellow color was measured at
450 nm against 540 nm using a microplate reader and Wallac software. This was taken as
the amount of cytokine release and was normalized to respective controls.
3.12.2 Cytokine release in situ To determine cytokines released in situ, 150-µm thick postnatal acute slices were used.
Here, half hemispheres of coronal slices containing corpus callosum were stored in 96-well

Glial properties in development and injury 42
plates in standard brain slice buffer while maintaining 5% CO2 and pH 7.4. After at least 1
hr of resting period, buffer was changed to 150 µl fresh buffer containing test substances
and incubated for 1.5 or 3 hr. To study the effect of short stimulation on long-term cytokine
release, some experiments were carried out by 15 min stimulation followed by fresh buffer
for a total of 1.5 hr. Pure brain slice buffer was used as controls. Buffer containing secreted
cytokines was collected for ELISA as described in Section 3.12.1 with modifications. In
order to optimize detection, 100 µl of sample buffer was used without dilution and
standards were made with standard brain slice buffer instead of DMEM/10% FCS.
3.13 Immunohistochemistry for biocytin
Biocytin-filled cells were identified according to a previously described protocol
(D'Ambrosio et al., 1998). Briefly, sections were first rinsed in 0.1 M PB and then 0.1 M
Tris-HCl buffer (TB), pH 7.4. Endogenous peroxidases were suppressed with 1% H2O2 for
2 hr. To reduce nonspecific background staining and to permeabilize membranes, samples
were then incubated with 2% bovine serum albumin (BSA) and 0.25% dimethylsulfoxide in
0.05 M Tris-buffered saline, pH 7.4 for 1 hr. Samples were then treated using Elite ABC kit
for 48 hr at 4oC according to manufacturer’s instructions. After preincubation with 0.025%
diaminobenzidine (DAB) and 0.005% NiCl for 15 min to increase staining density, fresh
DAB and NiCl containing 0.002% H2O2 were added for 60 min. Finally, 0.1 M TB was
added to stop the reaction and sections were mounted, dried and coverslipped on gelatin-
coated slides. Sections were examined under a light microscope and biocytin positive
single cells through different brain slice were counted while adjusting focus.
3.14 Analyses and statistics
Electrophysiological data were filtered at 2.9 kHz and analyzed by TIDA Version 5.0.
Fluorescent images obtained from ICE 3.5.99 were merged in Adobe® Photoshop® CS 8.0
using gradient maps and merge options. Image sequences were processed and analyzed
by ICE 3.5.99 and Image Pro® 5.0. Data for motility was analyzed using Microsoft® Excel
2003. Recordings of [K+]0 measurements were calibrated to basal [K+]0 and exported from
FeliXTM and analyzed in Microsoft® Excel 2003. Absorbance readings were exported from

Glial properties in development and injury 43
Wallac 1420 Version 2.01. All statistical analyses were carried out and plotted in Origin®
7.0 and Microsoft® Excel 2003. All values are expressed as mean ± standard error of the
mean (SEM). Differences between groups were evaluated by unpaired two-sample
Student’s t-test on Microsoft® Excel 2003. Differences of single group from mean were
evaluated by one-sample t-test on Origin® 7.0. P-values <0.05 were considered statistically
significant with , p<0.05; , p<0.01.

Glial properties in development and injury 44
4 Results
4.1 GABAA receptor stimulation and microglial current response
4.1.1 Muscimol-induced current response in microglia Accumulation of AMG was observed on the surface of the corpus callosum of acute slices
prepared from 6 – 8 days old mouse brain (Fig. 7A). They could be identified by their
distinctive round morphology and were approached with glass pipettes with Rp ranging
from 6 – 8 MΩ. At a HP of -70 mV, characteristic microglial membrane current profile was
recorded as shown in Fig. 7B. Hyperpolarizing voltage steps evoked inward rectifying
current while no voltage-gated current was detected upon depolarization. Current/voltage
(I/V) plot in Fig. 7C further revealed time-dependent inactivation of inward current at
hyperpolarizing voltage steps below -130 mV. Mean MP and Rm of AMG were -64 ± 1 mV
and 399 ± 23 MΩ, respectively (n = 145).
Fig. 7. Membrane properties of AMG. (A) AMG at the surface of the corpus callosum of acute brain slices obtained from 6 - 8 days old mouse were approached with a glass pipette and voltage-clamped as shown by dotted square. (B) Membrane current profile was obtained by applying de- and hyperpolarizing voltage steps ranging from -170 to +50 mV at 10-mV increments from a HP of -70 mV (see inset). (C) I/V plot was generated from transient ( ) and steady ( ) states of the current profile.

Glial properties in development and injury 45
To study membrane current changes of AMG upon GABAA receptor stimulation, 100 µM
muscimol, a specific GABAA receptor agonist was used. Membrane current was monitored
using voltage-steps protocol repeated every 5 s. Muscimol application for 30 s elicited
increase in inward current in all cells tested (n = 32; Fig. 8A-B).
Fig. 8. Muscimol-induced current response in AMG. (A) Membrane current of AMG was monitored by applying series of de- and hyperpolarizing voltage steps ranging from -170 to +50 mV at 20-mV increments from a HP of -70 mV (see inset). Bath application of muscimol (Mus; 100 µM for 30 s) induced current changes as shown. (B) Sections before ( ) and during ( ) muscimol-induced response are magnified. (C) I/V plot shows mean ± SEM current at , and for muscimol-induced component ( = - ). (D) Membrane current profiles recorded before (Control) and during (Mus) muscimol stimulation by de- and hyperpolarizing voltage steps ranging from -170 to +50 mV at 20-mV increments (see inset) are shown. Mus-sensitive components were obtained by subtracting Control from Mus. I/V plot was made from transient ( ) and steady ( ) states. , p<0.01 between and .

Glial properties in development and injury 46
This current increase reached 130 ± 23 pA at -170 mV (p = 0.0001; Fig. 8C). The peak
response occurred after 21 ± 2 s and membrane current returned to baseline after 149 ± 2
s. To further characterize the muscimol-induced current response, membrane current
profile was recorded every 10 s (Fig. 8D). Muscimol-sensitive components were obtained
by subtracting control current from the peak of the response during muscimol application
and showed a time-dependent inactivation typical for the opening of Kir channels.
Repeated stimulation revealed that muscimol-induced current response in AMG could only
be elicited once. A second muscimol application even after a 10 min washout did not
trigger any response (n = 8; Fig. 9A) although they remained responsive to ATP (1 mM).
Thus, the effects of blockers could only be tested on the first response.
Fig. 9. Sensitivity of muscimol-induced current response in AMG. Membrane current of AMG was recorded using protocol as shown in inset of Fig. 8A and representative traces are shown. (A) Muscimol (Mus; 100 µM for 30 s) was applied twice with 10 min apart. Only the first application elicited current response. (B) Muscimol response was abolished by 90-s preincubation with gabazine (Gbz; 10 µM). (C) Baclofen (Bac; 500 µM for 30 s) application did not affect subsequent muscimol response. (D) Muscimol response was blocked by 2-min preincubation with BaCl2 (100 µM). ATP (1 mM for 30 s) was used as a positive control in A and B.

Glial properties in development and injury 47
In the presence of 10 µM gabazine, a selective, potent GABAA receptor antagonist, only
20% of cells responded towards muscimol (n = 10; Fig. 9B). Such response was only 47 ±
5 pA at -170 mV voltage step, significantly smaller than muscimol response without blocker
(p = 0.003). Since microglia express GABAB receptors (Kuhn et al., 2004), experiments
were carried out to rule out possible interference by activities of this subtype. Cells were
first treated with 500 µM baclofen, a specific GABAB receptor agonist. In 2 out of 10 cells
showing current response towards baclofen, subsequent muscimol-induced inward current
was unaffected (Fig. 9C). Furthermore, the involvement of K+ channels was tested by a K+
channel blocker BaCl2. In 89% of cells (n = 9), muscimol response was blocked by
preincubation with 100 µM BaCl2 (Fig. 9D). Note that almost all of the intrinsic inward
rectifying current was blocked by Ba2+ at this concentration.
4.1.2 Influence of postnatal brain slice on muscimol-induced current response
4.1.2.1 Isolated AMG
To test whether muscimol directly stimulated AMG or indirectly via a secondary substance
released from the acute brain slice, single AMG isolated from brain slices were studied.
After establishing a tight seal with the recording pipette at the surface of the brain slice, the
patched AMG were carefully lifted up to various distances and maintained for at least 5 min
(Fig. 10). Whereas 100% of cells showed muscimol-induced response at the surface (see
above), only 83% (n = 5 out of 6) and 20% (n = 3 out of 15) of cells responded at 150 and
300 µm above surface, respectively. The amplitudes of these responses were also
significantly smaller than that measured at the surface. In cells which showed muscimol-
induced response at 150 and 300 µm, the inward currents recorded with -170 mV voltage
jump were only 30% (39 ± 13 pA) and 16% (20 ± 7 pA), respectively, of the average
response at the surface. Current response towards 0.5 – 1 mM ATP at the end of the all
recordings did not significantly change in relation to distance above surface. This confirmed
that the isolated cells were viable, stable and equally responsive towards the positive
control. The progressive loss of frequency and amplitude of muscimol response in AMG
was a clear indication that AMG do not express functional GABAA receptors but showed
prominent indirect response.

Glial properties in development and injury 48
Fig. 10. Current response in isolated AMG upon muscimol stimulation. (A) At the surface of corpus callosum acute brain slices, the membrane of an AMG was tightly sealed with a patch pipette filled with pipette solution. It was then carefully lifted up by manipulating the patch pipette within bath perfusion. After 5-min rest period, the membrane was broken and the cell was voltage clamped. An image of an AMG at 300 µm above surface is shown. Note the absence of surrounding cells. (B) Using recording protocol shown in inset of Fig. 8A, muscimol (Mus; 100 µM for 30 s) was applied via bath perfusion. ATP (500 µM for 30 s) was used as positive control for cell viability. (C) Diagram illustrates decreasing percentage of AMG responsive to muscimol with increasing distance above surface of brain slices.
4.1.2.2 Microglia cultures
In order to further establish that muscimol response in microglia was indirect, primary
cultures of mouse microglia plated on coverslips were used. They were voltage-clamped
and recorded in the same manner described for AMG. Similar to AMG, inward rectifying
currents could also be elicited in cultured microglia by hyperpolarizing voltage steps from a
HP of -70 mV (Fig. 11A). Mean MP and Rm were -63 ± 1 mV and 416 ± 32 MΩ,
respectively (n = 86). Here, in the absence of an acute brain slice environment, no change
in membrane current could be detected upon 100 µM muscimol application for 30 s (n =
43; Fig. 11B). To confirm that the lack of response was due to the absence of brain slice
but not culturing procedures, brain slice environment was introduced to cultured microglia
by carefully placing half hemisphere of postnatal slices on coverslips of cultured cells (Fig.
11C). As shown in the image, cultured microglia close to the corpus callosum region of the
brain slices were subsequently approached with patch pipettes. Under these conditions,
89% of cultured microglia in close vicinity to the slice showed inward current response
towards muscimol application. I/V relationship of muscimol current was similar to that
observed in AMG (n = 18; Fig. 11D-E). Likewise, the peak of this response was observed
22 ± 3 s after muscimol application. Thus, cultured microglia, similar as the AMG, also
lacked functional expression of GABAA receptors but readily responded towards muscimol
in close vicinity of acute brain slices.

Glial properties in development and injury 49
Fig. 11. Current response in cultured microglia upon muscimol stimulation. (A) Membrane current profile of a cultured microglia was recorded using protocol shown in inset of Fig. 7B. I/V plot was generated from the transient ( ) and steady ( ) states. (B) Using protocol as shown in inset of Fig. 8A, membrane current was monitored upon bath application of muscimol (Mus; 100 µM for 30 s). (C) In a separate experiment, half hemisphere of postnatal brain slice was placed over a coverslip with cultured microglia and a cultured cell near the corpus callosum region was voltage-clamped (enlarged image of the selected cell is shown in inset). (D) Similar as in B, membrane current was recorded upon muscimol stimulation. (E) I/V plot was generated from and and muscimol-induced current ( ).
4.1.2.3 Adult ramified microglia
Microglia from adult brain slices were used to test whether the GABAA receptor mediated
effect was specific for early postnatal brain. With 35 – 40 days old transgenic mice
expressing EGFP under the control of the Iba1 promoter (Hirasawa et al., 2005), microglia
could be identified in 150-µm thick brain slices. Most microglia had a ramified morphology
as described previously (Boucsein et al., 2000). Unlike postnatal brain slices, no AMG
accumulation could be observed at the corpus callosum region of these adult slices. In fact,
EGFP positive cells were hardly observed in this area but were predominantly found in the
neighboring cortical regions. These microglia with ramified morphology located in the
cortical regions close to the corpus callosum were then voltage-clamped using similar
protocols described for AMG. Alexa Fluor®594 (10 µg/ml) included in the patch pipettes
revealed small soma and ramification (Fig. 12A). Membrane current profiles showed only
much smaller inward currents compared to AMG and cultured microglia. Bath application of
100 µM muscimol for 30 s did not trigger current changes in any cell tested while

Glial properties in development and injury 50
subsequent ATP (1 mM) response confirmed cell viability and responsiveness (n = 8; Fig.
12B).
These observations demonstrated that GABAA receptor activities could be indirectly
sensed by microglia in the postnatal corpus callosum but not by ramified ones in
neighboring cortical regions of the adult brains.
Fig. 12. Current response in adult ramified microglia upon muscimol stimulation. (A) Iba1-EGFP positive ramified microglia in cortical region near the corpus callosum of 35 - 40 days old mice were voltage-clamped. An image of such cell filled with Alexa Fluor®594 (10 µg/ml) included in the pipette solution is shown. Using protocol described in inset of Fig. 7B, membrane current profile revealed small inward currents. (B) Membrane current was also monitored by recording protocol described in inset of Fig. 8A upon bath application of muscimol (Mus; 100 µM for 30s). Subsequent ATP (1 mM for 30 s) application was used as a positive control for cell viability.
4.2 GABAA receptor stimulation and macroglial and neuronal current
response
To identify the source of indirect signal from the acute brain slice which triggered current
response in AMG, macroglial cells and neurons within or near the postnatal corpus
callosum were tested for the presence of functional GABAA receptors. Astrocytes were
identified on brain slices obtained from GFAP-EGFP transgenic mice (Fig. 13A-B). Alexa
Fluor®594 (10 µg/ml) was included in the pipette solution to further reveal cell morphology
after achieving intracellular access. GFAP-EGFP positive astrocytes with fine processes
located at the corpus callosum of postnatal brain slices were voltage-clamped and
recorded using methods described for microglia. They were characterized by passive
membrane currents sometimes with a small voltage-gated component elicited by
depolarizing voltage jump from a HP of -70 mV. In all tested cells, bath application of
muscimol (100 µM for 30 s) triggered an inward current response (n = 9; Fig. 13A-B). As
shown by I/V plot generated from 1–3, it was consistently observed that the resting

Glial properties in development and injury 51
conductance at depolarizing voltage steps permanently decreased after application of
muscimol. To accurately determine the reversal potential of muscimol-induced current
response, membrane conductance after washout was subtracted from that obtained at the
peak of the response. I/V plots for 2–3 revealed that the resulting reversal potential of this
response was close to 0 mV as expected for a Cl- conductance. In addition to astrocytes,
two other macroglial populations within the corpus callosum were identified by their
morphology in postnatal brain slices obtained from wildtype NMRI mice. Their identities
were further confirmed by characteristic membrane current profiles and Alexa Fluor®594
dye filling. First, oligodendrocyte progenitor cells with fine processes parallel to the axonal
tracts had passive membrane current and characteristic tail currents. Similar as reported
previously in the same brain region (Berger et al., 1992), muscimol induced current
changes in these cells which reversed at 0 mV (n = 3; Fig. 13C). Another cell type
characteristic for glial precursor cells with prominent voltage-gated outward current but no
inward current was also studied (n = 4; Fig. 13D). In these cells, a long-lasting decrease of
resting conductance was also observed after muscimol application. Similar to the
astrocytes, a reversal potential of muscimol-induced current changes was also close to 0
mV. Recordings in glial cells were performed in the presence of 0.5 µM TTX in order to
minimize effects from neurons. Apart from glial cells found in the corpus callosum, neuronal
GABAA receptors in neighboring cortical regions were also tested. Besides voltage-gated
outward currents, these cells also had large Na+ currents measurable at depolarizing
voltage steps which was characteristic for neurons (n = 6; Fig. 13E). Bath application of
100 µM muscimol for 30 s triggered inward current much larger than that detected in glial
cells. Muscimol-induced current could be isolated as in the astrocytes and glial precursor
cells by subtracting conductance after the response from that during that peak of the
response. As a result, a reversal potential close to 0 mV was observed. In these
neighboring glial cells and neurons, peak response was reached after 12 ± 1 s of
application which was significantly faster than that observed in AMG (p = 0.0005).
It appeared that, upon muscimol stimulation, current changes involving the opening of Cl-
channels could be first detected in macroglial cells and neurons. After a significant delay,
AMG responded indirectly. Thus, the source of indirect signals sensed by the AMG was
likely to be the neighboring cells in postnatal brain slices.

Glial properties in development and injury 52
Fig. 13. Current response in macroglia and neurons upon muscimol stimulation. Images are shown for astrocytes with (A) no or (B) small voltage-gated components; (C) an oligodendrocyte progenitor cell; (D) a glial precursor cell with voltage-gated outward current; and (E) a cortical neuron. A-B were identified at the corpus callosum of postnatal brain slices obtained from GFAP-EGFP transgenic mice; C-D in the same area in wildtype mouse; and E in cortical region near corpus callosum of wildtype mouse. Alexa Fluor®594 (10 µg/ml) in pipette solution revealed morphology. Characteristic membrane currents were recorded and monitored using protocols as shown in inset of Fig. 7B and 8A. To each cell type, muscimol (Mus; 100 µM) was applied for 30 s via bath perfusion. Membrane currents before (1), during (2) and after (3) muscimol-induced current response are marked. I/V plots were generated from respective isolated currents indicated by numbers and symbols. To minimize indirect effects on macroglial cells by neuronal activity, recordings in A-D were carried out in the presence of 0.5 µM TTX.
Glial properties in development and injury 53
4.3 GABAA receptor stimulation and extracellular potassium
4.3.1 Extracellular potassium level K+ sensitive microelectrodes were used to measure changes in [K+]0 in brain slices upon
bath application of muscimol. By placing the electrodes on the surface of the corpus
callosum of postnatal brain slices close to the AMG, it was measured that a first application
of muscimol (100 µM for 30 s) increased [K+]0 transiently from 5 to 7.5 ± 0.2 mM (n = 6;
Fig. 14A, E). The peak of the increase was reached after 54 ± 7 s of application and [K+]0
returned to baseline after 342 ± 18 s. Subsequent applications separated by 15-min
washout induced significantly smaller increase only to 5.7 mM. In the presence of gabazine
(10 µM), muscimol did not elicit an increase in [K+]0 (n = 4; Fig. 14B, E). With the K+
sensitive electrodes inserted about 30 µm into the corpus callosum slice, a [K+]0 increase
reaching 9.6 ± 0.8 mM was detected upon first application of muscimol (100 µM for 30 s);
significantly greater than that observed at the surface (n = 4; Fig. 14C, F). Similar to the
surface, changes elicited by second and third applications within slices were also much
smaller than the first response. Furthermore, potential difference in [K+]0 elevation between
postnatal corpus callosum and cortical regions (n = 6) was also assessed. However, [K+]0
elevation upon muscimol application was not different between two regions either on the
surface or within slices indicating that K+ released to the extracellular space was similar in
neighboring brain regions (Fig. 14F). To study age-dependent K+ release upon GABAA
receptor stimulation, [K+]0 was measured in adult brain slices obtained from 35 - 40 days
old mice. Significantly smaller [K+]0 increase was observed both at the surface (to 5.6 ± 0.1
mM; n = 5) and within adult slices (to 6.5 ± 0.2 mM; n = 3) compared to postnatal ones at
the corpus callosum (Fig. 14D, F). In order to further understand the kinetics of K+ release,
rates of K+ accumulation and removal were calculated from the slope of corresponding
responses. In general, rates of muscimol-induced K+ accumulation were 6 times greater
than removal. Both accumulation and removal of K+ in first muscimol stimulation were
significantly faster than subsequent ones (Fig. 14G). Such processes were also faster
within than on the surface of brain slices; in postnatal than in adult slices (Fig. 14H).
These experiments indicated that [K+]0 increase in the extracellular space upon GABAA
receptor stimulation was more pronounced in postnatal reaching nearly 10 mM than adult
brain.

Glial properties in development and injury 54
Fig. 14. Muscimol-induced changes in [K+]0. K+ sensitive microelectrodes were used to monitor [K+]0 in brain slices over time. Representative traces are shown for (A) repeated muscimol applications (Mus; 100 µM for 30 s) 15 min apart; (B) muscimol stimulation in the presence of gabazine (Gbz; 10 µM for 3 min preincubation) followed by a recovery response on the surface of postnatal (P6 – P8) corpus callosum (CC); (C) repeated muscimol applications 15 min apart about 30 µm below surface of postnatal CC; (D) repeated muscimol stimulation 15 min apart about 30 µm below surface of adult (P35 – P40) CC. (E – H) Bar charts showing mean ± SEM values of peak amplitudes or rates of K+ accumulation and removal. , p<0.05;
, p<0.01. Significance level in G and H applies to both accumulation and removal.

Glial properties in development and injury 55
4.3.2 Microglial response towards elevated extracellular potassium level It was reported previously that conductance of microglial Kir channels increases with
elevated [K+]0 (Kettenmann et al., 1990). However, the impact of changes in [K+]0 within
physiological range has not been investigated. Microglia were tested for their response
towards moderate elevation of [K+]0 by addition of KCl. 30-s bath application of 2.5, 5, and
7.5 mM KCl transiently increased [K+]0 from the basal level of 5 mM to 7.5, 10, and 12.5
mM, respectively. In response to these, dose-dependent increase of inward rectifying
current in AMG (n = 16; Fig. 15A) and in cultured microglia (n = 19; Fig. 15B) was
observed. Membrane conductance increased in AMG by 0.4, 0.8 and 1.2 pS; and in
cultured microglia by 1.7, 3.3, and 5.0 pS with 2.5, 5 and 7.5 mM KCl, respectively.
Conductance increase was determined by dividing the induced current by voltage between
the -110 and -130 mV voltage steps from a HP of -70 mV.
To test whether an increase in [K+]0 could mimic muscimol-induced current response,
membrane current in the same AMG was recorded during applications of muscimol (100
µM for 30 s) followed by KCl. In contrast to the lack of multiple muscimol-induced
responses in AMG, KCl applications could always induce subsequent current changes after
a muscimol application. In particular, after washout of a typical muscimol-induced current
response, bath perfusion of 5 mM KCl for 30 s which increased [K+]0 from 5 to 10 mM
triggered inward rectifying current response similar in amplitude to that induced by
muscimol as shown in I/V plots (n =5; Fig. 15C). In addition, the average muscimol-induced
conductance of 0.8 pS (n = 32) was similar to the increase triggered by 5 mM [K+]0
elevation. Furthermore, membrane current profiles obtained before and during the peak of
response towards 5 mM KCl (n = 4; Fig. 15D) revealed typical current changes observed
with muscimol. These findings suggest that the elevation of [K+]0 within physiological range
could be the source of muscimol-induced current response in AMG on postnatal acute
brain slices and cultured microglia placed close by.

Glial properties in development and injury 56
Fig. 15. Current response in microglia towards [K+]0 elevation. Using protocol as shown in inset of Fig. 8A, membrane currents were recorded from microglia upon repeated 30-s bath applications of increasing concentrations of KCl. Representative traces for (A) an AMG and (B) a cultured microglia are shown. 2.5, 5, and 7.5 mM KCl applications transiently increased basal [K+]0 from 5 to 7.5, 10, and 12.5 mM, respectively. For each application, induced current changes were determined by subtracting conductance of baseline from that measured at the peak of the current response. I/V plots reveal mean ± SEM amplitudes of induced currents indicated by corresponding symbols. (C) In an AMG, induced current responses were compared between 30-s application of muscimol (Mus; 100 µM) and 5 mM KCl (total [K+]0 = 10 mM). (D) KCl-induced current was further analyzed by recording membrane current profiles using protocols described in inset of Fig. 8D. KCl-sensitive currents were isolated by subtracted membrane profiles recorded during control from that recorded during peak of response. I/V plot was made from transient ( ) and steady ( ) states.

Glial properties in development and injury 57
4.4 GABAA receptor stimulation and functional properties of microglia
4.4.1 Intracellular calcium changes Both AMG and cultured microglia were tested for muscimol-induced changes in [Ca2+]i.
Cultured microglia were loaded with 5 µM Fluo-4 AM, a Ca2+ sensitive dye (Fig. 16A). 100
µM muscimol stimulation for 30 s did not trigger Ca2+ response in any cell tested (n = 74;
Fig. 16B). ATP (500 µM for 30 s) was always used as a control for cell responsiveness and
only cells showing ATP response were counted.
Fig. 16. Ca2+ response in cultured microglia upon muscimol stimulation. (A) Image of cultured microglia loaded with a Ca2+ sensitive dye Fluo-4 AM (5 µM) is shown. (B) Changes in [Ca2+]i in terms of relative fluorescent intensity (F/F0) was monitored upon stimulation with muscimol (Mus; 100 µM for 30 s). Representative plot of mean ± SEM values from a single experiment containing 150 cells is shown. ATP (500 µM for 30 s) was used as a control for cell responsiveness.
To observe changes in [Ca2+]i in AMG, postnatal acute brain slices were loaded with 10 µM
Fluo-4 AM and a microglia marker, tomato lectin coupled to Alexa Fluor®594 (60 µg/ml). At
the surface of the acute brain slices, 97% of AMG located at the corpus callosum showed
transient Ca2+ response towards 100 µM muscimol application for 30 s via bath perfusion
(n = 160; Fig. 17A-B). In the presence of gabazine (10 µM), muscimol-induced Ca2+
response was only observed in 35% of cells (n = 65; Fig. 17C). To test whether such effect
was associated with increase in [K+]0, 10 mM KCl was applied for 30 s (total [K+]0 = 15
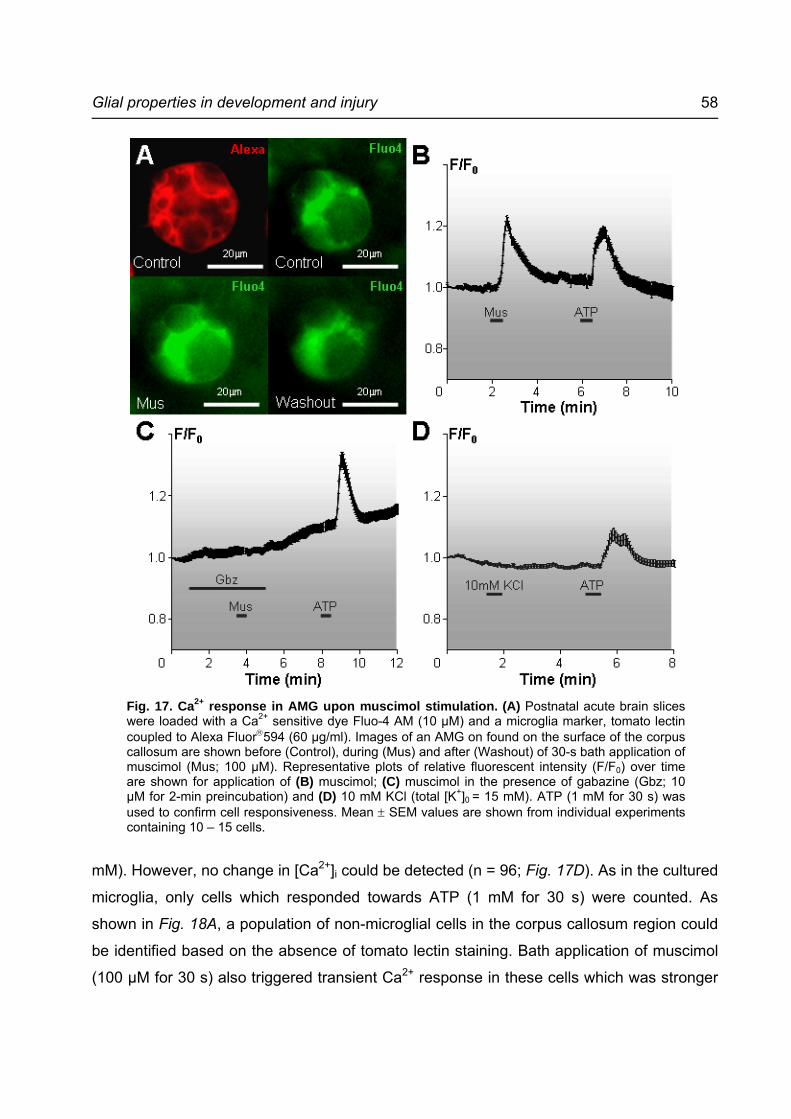
Glial properties in development and injury 58
Fig. 17. Ca2+ response in AMG upon muscimol stimulation. (A) Postnatal acute brain slices were loaded with a Ca2+ sensitive dye Fluo-4 AM (10 µM) and a microglia marker, tomato lectin coupled to Alexa Fluor®594 (60 µg/ml). Images of an AMG on found on the surface of the corpus callosum are shown before (Control), during (Mus) and after (Washout) of 30-s bath application of muscimol (Mus; 100 µM). Representative plots of relative fluorescent intensity (F/F0) over time are shown for application of (B) muscimol; (C) muscimol in the presence of gabazine (Gbz; 10 µM for 2-min preincubation) and (D) 10 mM KCl (total [K+]0 = 15 mM). ATP (1 mM for 30 s) was used to confirm cell responsiveness. Mean ± SEM values are shown from individual experiments containing 10 – 15 cells.
mM). However, no change in [Ca2+]i could be detected (n = 96; Fig. 17D). As in the cultured
microglia, only cells which responded towards ATP (1 mM for 30 s) were counted. As
shown in Fig. 18A, a population of non-microglial cells in the corpus callosum region could
be identified based on the absence of tomato lectin staining. Bath application of muscimol
(100 µM for 30 s) also triggered transient Ca2+ response in these cells which was stronger

Glial properties in development and injury 59
and occurred quicker than that observed in AMG (Fig. 18B). To determine their identity,
these cells were subsequently voltage-clamped. As a result, passive membrane profiles
typical for astrocytes were measured from these cells (n = 10).
Fig. 18. Ca2+ response in neighboring cells upon muscimol stimulation. (A) Image of the corpus callosum of a postnatal brain slice loaded with a Ca2+ sensitive dye Fluo-4 AM (10 µM) is shown. Microglia were selectively labeled with tomato lectin coupled to Alexa Fluor®594 (60 µg/ml). (B) Ca2+ response was recorded in AMG and a non-microglial population (indicated by arrows in A) upon 30-s bath application of muscimol (Mus; 100 µM). Mean ± SEM values of relative fluorescent intensity (F/F0) over time from a single experiment containing 10 cells is shown. ATP (1 mM for 30 s) was used as control for cell responsiveness. To identify the non-microglial population, these cells were subsequently approached with patch pipettes (dotted lines in A). Using protocol described in inset of Fig. 7B, typical membrane current for astrocytes were measured from these cells (inset of B).
To study Ca2+ response in isolated AMG, similar approach was carried out as in patch-
clamp studies. Patch pipette filled with external solution were used to form a tight seal with
the membrane of AMG loaded with Fluo-4. They were then lifted up above surface by
manipulating the patch pipettes. In this case, membrane patch was not broken in order to
keep intracellular content including Ca2+ dye undisturbed. After 5 min of rest at 300 µm
above brain slice surface, background Ca2+ signal was no longer visible and Ca2+ signal of
the lifted-up AMG returned to stable baseline. 100 µM muscimol application for 30 s
triggered Ca2+ response only in 38% of cells tested (n = 8 out of 21; Fig. 19). ATP at 1 mM
was applied at the end of the recording to confirm cell viability and responsiveness. It is
apparent that cultured microglia, which did not show any current response to muscimol,
also did not respond to it with mobilization of intracellular Ca2+. On the other hand, AMG

Glial properties in development and injury 60
which indirectly reacted to muscimol with current response also showed Ca2+ response
which was, however, unrelated to elevated [K+]0 and decreased with distance from the
brain slice but still detectable at 300 µm above.
Fig. 19. Ca2+ response in isolated AMG upon muscimol stimulation. (A) A single AMG from brain slice loaded with Fluo-4 AM was lifted 300 µm above surface of postnatal corpus callosum by manipulating the patch pipette (dotted lines). Membrane patch at the pipette tip was not broken to maintain intracellular content. Images before (Control) and during (Mus) muscimol stimulation (100 µM for 30 s) are shown. (B) Associated plot showing relative fluorescent intensity (F/F0) over time. ATP (1 mM for 30 s) was used as control for cell responsiveness.
4.4.2 Chemotaxis and proliferation The ability of cultured microglia to migrate towards ATP in the presence of different
concentrations of [K+]0 was assessed using a microchemotaxis chamber. Over 2 hr, 300
µM ATP alone significantly increased microglial migration rate to 226 ± 27% of control.
[K+]0 was elevated from 5 mM in control to 7.5, 10, 15 or 25 mM by addition of 2.5, 5, 10 or
20 mM KCl, respectively. From 5 independent experiments, no effect of increased [K+]0 on
neither basal nor ATP-stimulated microglial migration was observed (Fig. 20). In other
experiments, the effect of increased [K+]0 on microglial proliferation was assessed.
Cultured microglia plated on 96-well pates were treated with different concentrations of KCl
with or without LPS (100 ng/ml) for 24 and 48 hr. Proliferation was measured by the
amount of BrdU incorporation during incubation periods relative to control. LPS significantly
decreased proliferation by 81 ± 7 and 54 ± 7% after 24 and 48 hr, respectively. However, in
6 independent experiments, increase of [K+]0 by 2.5, 5, 10 or 20 mM did not affect basal
nor LPS-attenuated proliferation at both time points (Fig. 21). Thus, both microglial
chemotaxis and proliferation were not affected or modulated by elevated [K+]0.
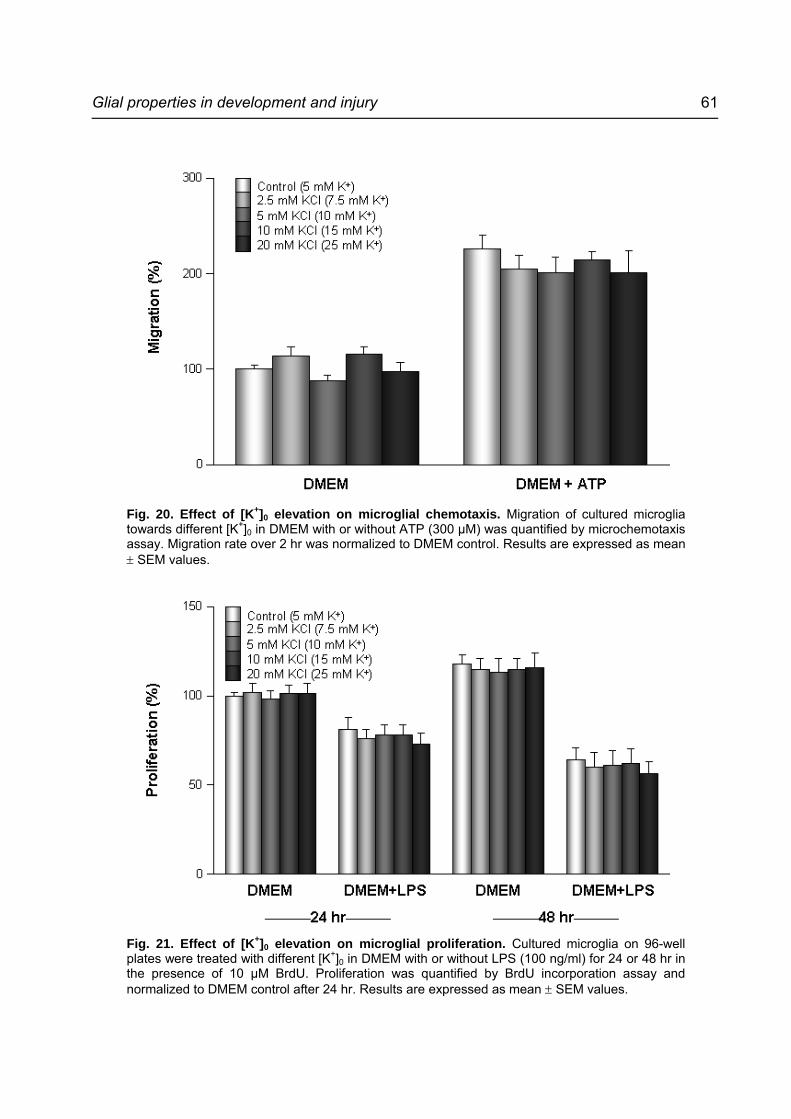
Glial properties in development and injury 61
Fig. 20. Effect of [K+]0 elevation on microglial chemotaxis. Migration of cultured microglia towards different [K+]0 in DMEM with or without ATP (300 µM) was quantified by microchemotaxis assay. Migration rate over 2 hr was normalized to DMEM control. Results are expressed as mean ± SEM values.
Fig. 21. Effect of [K+]0 elevation on microglial proliferation. Cultured microglia on 96-well plates were treated with different [K+]0 in DMEM with or without LPS (100 ng/ml) for 24 or 48 hr in the presence of 10 µM BrdU. Proliferation was quantified by BrdU incorporation assay and normalized to DMEM control after 24 hr. Results are expressed as mean ± SEM values.

Glial properties in development and injury 62
4.4.3 Cytokine release Cytokine release from microglia culture was studied upon stimulation with muscimol and
elevated [K+]0. Cultured microglia plated on 96-well plates were treated with muscimol (100
or 200 µM) or KCl (2.5, 5, 10, 20 mM) for 24 hr. Culture medium was collected and tested
for release of various cytokines by ELISA. Whereas muscimol had no effect, KCl from 5 –
20 mM dose-dependently enhanced microglial release of MIP-1α. In particular, 5 mM KCl
significantly induced release to 145 ± 10% of control in 4 independent experiments (Fig.
22). Basal release of other cytokines, namely IL-6, IL-12, KC, and TNF-α was not affected
by neither muscimol nor KCl.
Fig. 22. Effect of muscimol and [K+]0 elevation on cytokine release in vitro. Cultured microglia on 96-well plates were treated with muscimol (100 or 200 µM) and different [K+]0 in DMEM for 24 hr. The amount of IL-6, IL-12, KC, TNF-α, and MIP-1α released into culture medium was quantified by ELISA and normalized to control for each cytokine. Results are expressed as mean ± SEM values. , p<0.01 compared with MIP-1α control.
To better relate to the developing brain environment in situ, release of MIP-1α from
postnatal brain slices was also tested. Slices containing the corpus callosum region were
incubated with test substance for various time periods. MIP-1α released into buffer was
quantified by ELISA as described for cultured microglia. After 1.5 hr, muscimol (100 µM)
and KCl (5 mM) significantly induced MIP-1α production to 117 ± 5 (n = 15) and 115 ± 6 %
(n = 16) of control, respectively (Fig. 23A–B). The muscimol-induced MIP-1α production

Glial properties in development and injury 63
was blocked by gabazine (10 µM) and the effect of muscimol and KCl was not observed in
the presence of BaCl2 (100 µM). The KCl effect was not mimicked by equimolar NaCl
indicating that increased osmolarity did not play a role in the induced release. Furthermore,
as shown in Fig. 23C, 10 mM KCl resulted in a higher increase in MIP-1α production than 5
Fig. 23. Effect of muscimol and [K+]0 elevation on cytokine release in situ. Postnatal brain slices containing corpus callosum were incubated with various substances. The amount of MIP-1α released into the buffer was quantified by ELISA and normalized to corresponding controls. MIP-1α release was tested after 1.5 hr incubation of (A) muscimol (Mus; 100 µM) alone, in the presence of gabazine (Gbz; 10 µM) or BaCl2 (100 µM); (B) 5 mM KCl (total [K+]0 = 10 mM) alone or in the presence of BaCl2. 5 mM NaCl was added as a control for the effect of osmotic changes. (C) Brain slices treated with 10 mM KCl (total [K+]0 = 15 mM) for 1.5 and 3 hr were also tested. (D) To study the effect of short stimulation, Mus or KCl was added for only 15 min. Total release after 1.5 hr was measured and normalized to control where short 15-min stimulation was with buffer only. Results are expressed as mean ± SEM values. , p<0.05; , p<0.01 compared with corresponding controls unless stated otherwise.

Glial properties in development and injury 64
mM (130 ± 7% of control; n = 11). The relative increase in MIP-1α release induced by 10
mM KCl after 3 hr was 127 ± 9% (n = 13), similar to that after 1.5 hr. In addition, the effect
of short stimulation on long-term MIP-1α production was tested. Brain slices were treated
with muscimol or 10 mM KCl for only 15 min. Total MIP-1α released after 1.5 hr was not
different from control indicating that prolonged stimulation beyond 15 min was required (n =
8; Fig. 23D). Thus, both muscimol and elevated [K+]0 enhanced MIP-1α release in situ.
4.4.4 Motility To observe and quantify cell movement, AMG located on postnatal corpus callosum brain
slices were imaged at 2-s interval. After 15 min of baseline measurement, test substance
was applied via bath perfusion. Images were subsequently analyzed for motility in terms of
displacement and arm movement. Whereas displacement is a measure of the total
distance travelled by a cell in two-dimension over 15 min, arm movement is quantified by
activities around the cell in a single focal plane during the first 5 min of measurement. In
general, baseline displacement and arm movement were 1.0 µm (n = 178) and 144 ± 0.5 (n
= 92) arm movements per min, respectively. To correct for variability in basal activities
among cells, relative motility during treatment normalized to basal activity of each cell was
used. While the presence of 100 µM muscimol did not change basal displacement
significantly (n = 22; Fig. 24A), relative arm movement increased to 160 ± 8% of baseline
(n = 14; Fig. 24B). This increase was completely blocked by 10 µM gabazine (n = 8) and
partially decreased by 100 µM BaCl2 (n = 10). 5 mM KCl (total [K+]0 = 10 mM; n = 44) had
no effect on displacement (n = 44) and mildly enhanced arm movement to 107 ± 1% of
control (n = 17). It was sensitive to 100 µM BaCl2 (n = 12) and not mimicked by equimolar
NaCl (n = 12). As a positive control, ATP (500 µM), which increased microglial chemotaxis,
significantly increased displacement to 156 ± 8% of control (n = 25). Analysis for
associated arm movement was however unreliable due to considerable displacement.
Thus, 15-min preincubation of brain slices with 5 µM cytochalasin D (CytoD), an inhibitor of
actin filaments, was used as a negative control. As a result, AMG retracted most of their
arms towards cell body which led to a significant reduction of arm movement (12 ± 2% of
control; n = 12) accompanied by a decrease of displacement to 73 ± 12% of control (n =
13). Thus, arm movement of AMG was enhanced in the presence of muscimol.

Glial properties in development and injury 65
Fig. 24. Effect of muscimol and [K+]0 elevation on AMG motility. (A) Displacement of AMG on postnatal corpus callosum brain slices was measured from the total distance traveled in two dimension over time of stimulation (15 min). (B) Arm movement was estimated from activities along the perimeter of AMG over time of stimulation (5 min). To account for variable basal activities among cells, relative displacement and arm movement of each cell during bath perfusion of test substance was normalized to respective baseline activities (100%; dotted lines). Mean ± SEM values are plotted for displacement and arm movement under treatment with muscimol (Mus; 100 µM) in the presence or absence of gabazine (Gbz; 10 µM) or BaCl2 (100 µM); and 5 mM KCl (total [K+]0 = 10 mM) in the presence or absence of BaCl2. 5 mM NaCl was used to test for effect of changes in osmolarity. As positive and negative controls, ATP (500 µM) and cytochalasin D (CytoD; 5 µM for 15-min preincubation) were used. , p<0.05; , p<0.01 compared with corresponding baseline unless stated otherwise.

Glial properties in development and injury 66
4.5 Properties of striatal astrocytes in response to stroke
4.5.1 GFAP-EGFP fluorescence and morphology Using 150-µm thick acute brain slices obtained from GFAP-EGFP transgenic mice, two
astrocytic populations were identified in the striatum based on distinct fluorescent intensity
and morphology. Brightly fluorescent cells displayed highly ramified processes, whereas
weakly fluorescent cells had round soma and few processes with little, if any branching
(Fig. 25A-C). By observing random visual fields, 40% of 476 GFAP positive cells were
brightly and 60% weakly fluorescent. Only cells which clearly belonged to one of the
groups were included. The morphological features of individual cells were even better
visualized after cells were dialyzed with fluorescent dye Alexa Fluor®594 via the patch
pipette (Fig. 26). This further revealed that some cells with low fluorescence intensity
extended few thin processes emanating from the soma.
Fig. 25. Effect of stroke on morphology of striatal astrocytes. (A) EGFP fluorescence of the striatum in an acute brain slice from a control adult GFAP-EGFP transgenic mouse. Arrows and arrow heads denote weakly and brightly fluorescent cells, respectively. (B-C) Sections from A shown at higher magnification. (D-E) EGFP fluorescence of the contra- and ipsilateral striata 7 d after 30-min MCAo/reperfusion. (F) EGFP fluorescence from astrocytes in core of stroke lesion of the same time point after stroke.

Glial properties in development and injury 67
Upon mild brain ischemia induced by 30 min MCAo/reperfusion, the majority of astrocytes
in the core or border of the lesion area showed uniform up-regulated fluorescence.
Representative images of an ipsilateral and contralateral striatum 7 days after stroke are
shown (Fig. 25D-E). Note that using the same exposure time in capturing both images,
hardly any fluorescent signals could be detected on the unaffected hemisphere. Although
brightly fluorescent, the morphology of these cells resembled that of the weakly fluorescent
cells in normal striatum (Fig. 25F). The number of processes appeared to have increased.
Some astrocytes even had thickened, enlarged and long processes that terminated on
blood vessels. From 12 animals (31 slices), less than 5% of EGFP positive cells (39 out of
818) could be classified, based on morphology and fluorescence level, as typical brightly or
weakly fluorescent astrocytes found in control animals.
4.5.2 Membrane current GFAP positive cells in the striatum were visually selected based on their fluorescence
intensity and morphology and approached with patch pipettes. Membrane profiles were
recorded with a series of 50-ms voltage jumps at 10-mV increments ranging from -200 to
+80 mV from a HP of –70 mV. All brightly fluorescent cells were found to have passive
membrane currents with no apparent time and voltage-dependence (n = 43; Fig. 26A). The
MP and Rm were -67.4 ± 1.4 mV and 49.4 ± 4.4 MΩ, respectively (n = 43). On the other
hand, the majority of the weakly fluorescent cells (92%) expressed voltage-gated currents
(n = 48; Fig. 26B). Outward currents triggered by depolarization exhibited delayed
activation and subsequent inactivation. Inwardly rectifying currents were also recorded at
hyperpolarizing voltages. MP and Rm of these weakly fluorescent cells was -72.3 ± 0.8 mV
and 57.1 ± 3.1 MΩ, respectively (n = 44). Only cells with stable MPs (between -50 and -85
mV) were analyzed.
To determine the impact of mild ischemia, membrane profiles of GFAP positive cells on 1,
4, 7, 14, 28, and 70 day(s) after MCAo/reperfusion were recorded. In the core or border of
the stroke lesion, 85% of cells were found to express voltage-gated currents (n = 74; Fig.
26C). Depolarization triggered a delayed, inactivating outward current accompanied by
inwardly rectifying currents recorded with hyperpolarization. The MP and Rm of these cells
were -72.5 ± 0.8 mV and 73.2 ± 6.6 MΩ, respectively (n = 62). These values were similar to

Glial properties in development and injury 68
Fig. 26. Effect of stroke on physiology and networks of striatal astrocytes. (A) Left: A brightly fluorescent GFAP-EGFP cell from control striatum was filled with 10 µg/ml Alexa Fluor®594 and 0.5 - 0.6% biocytin. Middle: Membrane profile in response to de- and hyperpolarizing voltage steps as shown in inset. Right: Biocytin immunostaining revealed extent of gap junction coupling. Center of image is enlarged for clarity. (B-C) Similar approach as in A for a weakly fluorescent cell in control striatum and a complex cell in lesion site 7 d after stroke. (D) Bar chart indicating percentages of cells with complex versus passive membrane profile in control striatum as well as in the lesion sites 1, 4, 7, 14, 28, 70 d after stroke. (E) Mean ± SEM numbers of cells coupled to passive and complex cells are compared in control and lesion sites 4 and 7 d after stroke. , p<0.05; , p<0.01.

Glial properties in development and injury 69
those of control complex cells but significantly different from control passive cells (p< 0.01).
The remainder 15% of cells after stroke expressed passive currents. The relation between
complex and passive cells is illustrated in Fig. 26D. In sham-operated animals 4 and 7
days after operation, two populations of astrocytes could be distinguished as in untreated
control animals. In particular, all brightly fluorescent (n = 5) and weakly (n = 6) fluorescent
cells were passive and complex, respectively. This indicated that physiological and
morphological changes in astrocytes were not affected by factors associated with the
intervention for example anesthesia, skin incision or stress related to the operation.
4.5.3 Gap junction network To study the extent of gap junction coupling of subpopulations of astrocytes, patched cells
were filled with 0.5 - 0.6% biocytin during whole-cell recording. Only cells with stable
resting potential during the recording period were evaluated. Subsequently, networks of
cells containing biocytin were identified by immunohistochemistry. All passive cells (n = 27;
MP = -70.4 ± 0.8 mV) were coupled to a network of other cells. The network of biocytin
positive cells consisted on average of 40 ± 7 cells (Fig. 26A, E). On the other hand, biocytin
spread from weakly fluorescent cells (n = 16; MP = -71.6 ± 1.0 mV) with complex currents
was also observed. On average, these significantly smaller networks consisted of 13 ± 3
cells (Fig. 26B, E).
Similarly, gap junction coupling in GFAP positive cells 4 and 7 days after mild ischemia
was also assessed. Interestingly, complex cells found 7 days after MCAo/reperfusion
showed a significant increase in size of coupling networks compared to control. In all
recorded complex cells (n = 17; MP = -75.3 ± 1.3 mV), tracer spread from single injected
astrocyte to a total of 58 ± 14 surrounding cells (Fig. 26C, E). On the contrary, passive cells
found at this time point (n = 11) were coupled to only 17 ± 5 cells, significantly lower than
control passive cells.
4.5.4 AMPA/KA glutamate receptor expression KA was used to test for functional expression of AMPA/KA glutamate receptors in GFAP
positive cells. Series of de- and hyperpolarizing voltage jumps ranging from -130 to +90
mV from a HP of -70 mV were applied repeatedly every 6 s. In all weakly fluorescent cells
in control animals, KA (500 µM) triggered current response of 1057.6 ± 91.4 pA measured

Glial properties in development and injury 70
at -70 mV (n = 27; Fig. 27A). KA evoked a complex response, which was composed of
three different components (Fig. 27A, C). The difference between I/V curves obtained at
various time points reflected current components which changed over time. Within few
seconds after application, the resting K+ conductance decreased and the reversal potential
of this blocked conductance was at -70 mV. Subsequently, a conductance increase
developed which had a reversal potential of 0 mV indicating that a cationic current was
activated. This conductance increase returned to baseline within about 4 min after washout
of KA. In 10 out of 30 cells, an outward rectifying current developed with a delay of 3 to 4
min after washout of KA. The reversal potential of this current was at -70 mV. This K+
conductance increase was transient and returned to baseline after about 5 min. The resting
K+ conductance, which was reduced in amplitude at the beginning of the response,
remained reduced in 20 out of 30 cells, even after 20 min recording time. In conclusion, KA
triggered in all cells, 1) a transient cationic current; 2) a rapid and sometimes long-lasting
blockade of the resting K+ conductance; and in some cells, 3) a transient increase of an
outwardly directed K+ current with a significant delay. Whereas subsequent bath
application of KA after a 5-10 min washout elicited a second current response in the same
cell with about half the amplitude of the first one, this complex response to KA was
completely blocked by 50 µM CNQX, the AMPA/KA glutamate subtype receptor blocker (n
= 5; Fig. 27A). On the other hand, current response in brightly fluorescent cells consisted of
only one component, namely a conductance increase with a reversal potential close to 0
mV (Fig. 27B, C). Only 52% of brightly fluorescent cells responded to KA with significantly
smaller amplitude of 248.8 ± 64.9 pA measured at -70 mV (n = 23).
Over 1, 4, 7, 18, 28, 70 days after 30 min MCAo/reperfusion, 3 – 4 animals were sacrificed
at each time point to test for KA-induced current response. All complex cells showed KA-
induced complex current response which consisted of three components, similar to the
complex response found in weakly fluorescent cells in control animals. The amplitude,
however, was significantly smaller after stroke with a mean ± SEM value reaching only
748.5 ± 73.1 pA at -70 mV (n = 50; Fig. 27C).
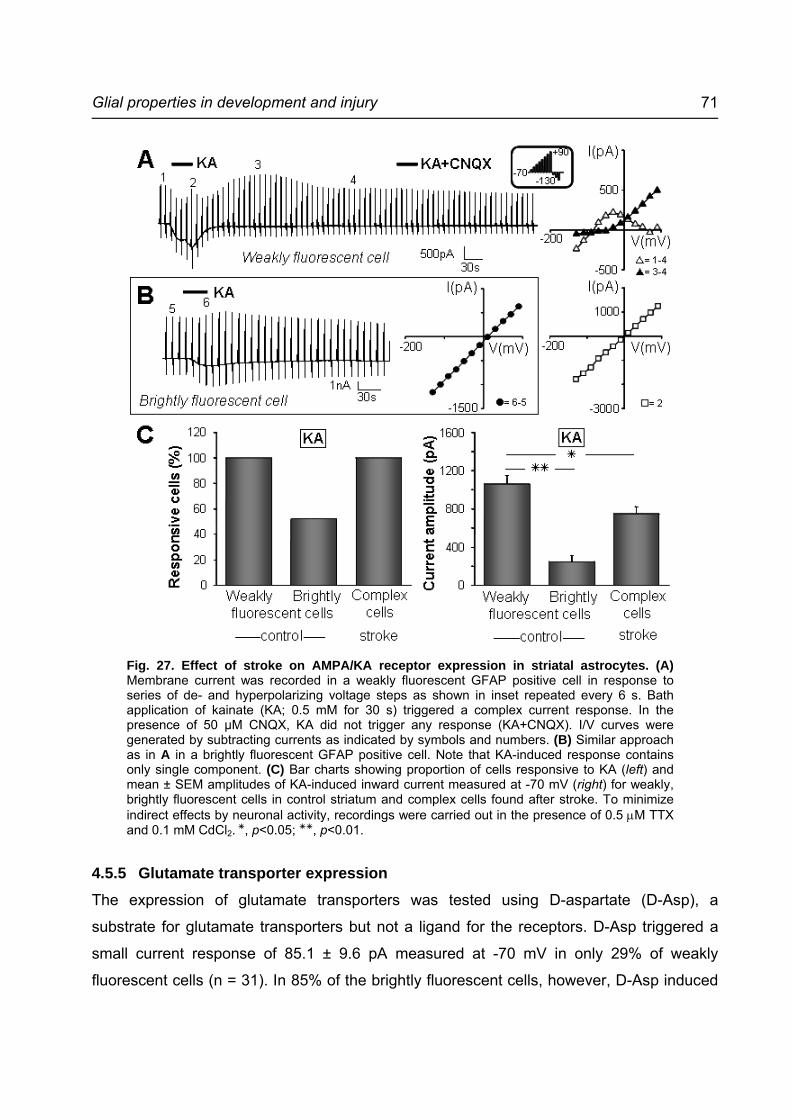
Glial properties in development and injury 71
Fig. 27. Effect of stroke on AMPA/KA receptor expression in striatal astrocytes. (A) Membrane current was recorded in a weakly fluorescent GFAP positive cell in response to series of de- and hyperpolarizing voltage steps as shown in inset repeated every 6 s. Bath application of kainate (KA; 0.5 mM for 30 s) triggered a complex current response. In the presence of 50 µM CNQX, KA did not trigger any response (KA+CNQX). I/V curves were generated by subtracting currents as indicated by symbols and numbers. (B) Similar approach as in A in a brightly fluorescent GFAP positive cell. Note that KA-induced response contains only single component. (C) Bar charts showing proportion of cells responsive to KA (left) and mean ± SEM amplitudes of KA-induced inward current measured at -70 mV (right) for weakly, brightly fluorescent cells in control striatum and complex cells found after stroke. To minimize indirect effects by neuronal activity, recordings were carried out in the presence of 0.5 µM TTX and 0.1 mM CdCl2. , p<0.05; , p<0.01.
4.5.5 Glutamate transporter expression The expression of glutamate transporters was tested using D-aspartate (D-Asp), a
substrate for glutamate transporters but not a ligand for the receptors. D-Asp triggered a
small current response of 85.1 ± 9.6 pA measured at -70 mV in only 29% of weakly
fluorescent cells (n = 31). In 85% of the brightly fluorescent cells, however, D-Asp induced

Glial properties in development and injury 72
current response of 158.9 ± 21.3 pA at -70 mV (n = 27; Fig. 28A, B). The I/V curve of the
D-Asp-induced current in brightly fluorescent cells showed an extrapolated reversal
potential at high positive potentials. The response however did not reverse even at
potentials as positive as 100 mV. At all time points after 30-min MCAo/reperfusion, 51% of
complex cells responded to D-Asp with an amplitude of 70.0 ± 16.3 pA at -70 mV (n = 43;
Fig. 28B), similar to what was observed in control weakly fluorescent cells. Thus, in the
control striatum, the majority of weakly fluorescent cells showed receptor current while
brightly fluorescent cells had transporter current. In response to stroke, brightly fluorescent
cells dominated the lesion site with complex membrane properties similar to control weakly
fluorescent cells and preferentially expressed glutamate receptors over transporters.
Fig. 28. Effect of stroke on glutamate transporter expression in striatal astrocytes. (A) Membrane current was recorded in a weakly (left) and brightly (middle) fluorescent GFAP positive cell in response to series of de- and hyperpolarizing voltage steps repeated every 6 s as shown in inset of Fig. 27. Bath application of D-aspartate (D-Asp; 0.5 mM for 30 s) triggered current responses. I/V curves (right) were generated by subtracting currents as indicated by symbols and numbers. (B) Bar charts showing proportion of cells responsive to D-Asp (left) and mean ± SEM amplitudes of D-Asp-induced inward currents measured at -70 mV (right) for weakly and brightly fluorescent cells in control striatum as well as complex cells found after stroke. To exclude an indirect contribution from neuronal glutamate receptors, recordings were carried out in the presence of 0.5 µM TTX, 0.1 mM CdCl2 and 50 µM CNQX. , p<0.05; , p<0.01.

Glial properties in development and injury 73
5 Discussion
5.1 Invading microglia sense GABAergic activities in the developing
brain
5.1.1 GABAA receptor expression on macroglia and neurons in postnatal brain Prior to synapse formation, the neurotransmitter GABA is released by a vesicular
mechanism from growth cones of developing axons. It occurs spontaneously and is
enhanced by increased neuronal activities (Gao and van den Pol, 2000). At this stage of
development, it acts as a trophic factor which modulates developmental processes like
neuronal growth, migration, proliferation and differentiation. It also participates in the
formation of synapse and construction of brain networks (Ben-Ari et al., 2007). The notion
that neuronal precursor cells and immature neurons express functional GABAA receptors
before synapse formation is well established (Owens and Kriegstein, 2002). Thus, it is
conceivable that GABA is released in the developing corpus callosum. Using a receptor
specific agonist, muscimol, it was observed in the present study that astrocytes,
oligodendrocytes and glial precursor cells in the corpus callosum of postnatal brain slices
as well as cortical neurons near this region show current response mediated by functional
GABAA receptors expression. Associated reversal potentials near 0 mV indicated the
opening of Cl- channels. These observations are supported by several previous studies.
Specific GABAA receptor-mediated current response was detected in cultured astrocytes
(Bormann and Kettenmann, 1988) and oligodendrocytes (Von Blankenfeld et al., 1991).
Berger et al. (1992) characterized GABAA receptors in glial precursors and promyelinating
oligodendrocytes in mouse corpus callosum brain slices during first two postnatal weeks.
The expression of astrocytic GABAA receptors in grey matter is well documented
(Steinhauser et al., 1994). In addition, complex glial cells in rat hippocampus respond
towards GABAA but not GABAB receptor agonist (Bekar et al., 1999). Functions of glial
GABAA receptors have been proposed as a way to sense neuronal activities (von
Blankenfeld and Kettenmann, 1991), regulate extracellular pH (Kaila et al., 1991) and K+
homeostasis (Barres et al., 1990). Thus, in the developing mouse corpus callosum,
macroglia and neurons can sense GABAergic innervations via GABAA receptors.

Glial properties in development and injury 74
5.1.2 Elevation of extracellular potassium upon membrane depolarization The classical inhibitory neurotransmitter GABA has a depolarizing action in the developing
brain due to high [Cl-]i in immature neurons and glial cells (Ben-Ari et al., 2007). Membrane
depolarization is accompanied by the efflux of K+ and Cl-. Thus an increase in [K+]0 upon
GABAA receptor stimulation is often observed (Hoppe and Kettenmann, 1989; Muller et al.,
1989). Depolarization of glial precursor cells even activates Ca2+ channels (Kirchhoff and
Kettenmann, 1992). In the present study, a transient Ca2+ response upon specific GABAA
receptor stimulation was detected in astrocytes presumably as a result of membrane
depolarization. Thus, it is likely that elevation of [K+]0 detected in postnatal brain slices is
due to K+ efflux from glial cells and immature neurons. [K+]0 elevation was twice as large
within than on the surface of corpus callosum postnatal brain slices, reaching up to 5 mM
of increase. This can be explained by the presence of more cells, presumed source of K+,
within the brain slices as reflected by faster K+ accumulation. The rate of removal, on the
other hand, increased proportionally despite less efficient washout below surface implying
the presence of an additional removal mechanism which became more effective with
higher K+ release. Uptake of K+ released during neuronal activity by astrocytes in the
process of K+ spatial buffering is a likely explanation (Butt and Kalsi, 2006). K+ release was
not specific to the corpus callosum and could also be detected within cortical region. In
fact, neurons with cell bodies in neighboring cortical region showed larger current response
towards muscimol compared to glial cells. Furthermore, muscimol-induced [K+]0 elevation
appeared to be age-dependent in that it was significantly smaller in adult brain slices. As
neurons mature, GABAA receptors become inhibitory resulting in membrane
hyperpolarization. This E-I switch of GABA action in neurons begins around postnatal days
5 - 8 (Kuner and Augustine, 2000; Marandi et al., 2002). As it was reported that GABA
facilitates this switch (Ganguly et al., 2001), it is likely that during this short window of time
which coincides with the occurrence of invading microglia, extracellular GABA level thus
depolarization-induced K+ efflux is favored.
5.1.3 Current response of microglia towards elevated extracellular potassium Cultured microglia and ramified microglia in situ express metabotropic GABAB receptor
triggering outward K+ current and Ca2+ response modulating cytokine release (Kuhn et al.,

Glial properties in development and injury 75
2004). In the developing brain, however, the action of GABA is primarily through
depolarizing GABAA receptors (Ben-Ari et al., 2007). Using a model where invading
microglia could be identified in situ at the corpus callosum of postnatal brain slices,
possible contribution of microglia to GABAergic innervations was studies. AMG have
similar membrane properties as observed in cultured microglia despite different
morphology. Whereas AMG were about 10 µm in diameter, round, and highly motile with
filopodia-like processes extending in all directions; cultured microglia attached to glass
coverslips were relatively flat with mobile edges. Similar to previously described studies,
membrane profiles recorded in this study under voltage-clamp configuration showed that
both AMG and cultured microglia express prominent inwardly but no outwardly rectifying K+
channels (Kettenmann et al., 1990; Brockhaus et al., 1993). In both preparations, Kir
current displayed time-dependent inactivation. At a HP of -70 mV, comparable MP and Rm
were detected between these preparations. It was previously reported that extracellular
Ba2+ at a range of 1-100 µM inhibited microglial Kir current but had no effect on Kdr current
(Franchini et al., 2004). In AMG, muscimol always triggered an increase in conductance of
a current which showed inward rectification, reversed at -70 mV and was sensitive to 100
µM BaCl2, suggesting that it was mediated by intrinsic Kir channels.
Although considerable variations in neurotransmitter receptor expression exist between
different microglial preparations (Pocock and Kettenmann, 2007), the complete lack of
GABAA receptor-induced current response on cultured microglia suggested that the current
response in AMG could be indirect. Furthermore, muscimol-induced response in AMG
often occurred later than those detected in neighboring cells and those elicited by ATP in
the same cells. The progressive loss of muscimol-induced current response in isolated
AMG at increasing distance away from brain slice surface strongly suggested the
significance of being in close contact with neighboring cells. The elicited current response
by placing brain slices on otherwise non-responsive cultured microglia further confirmed
that muscimol-induced inward current observed in AMG was secondary.
The increase in [K+]0 upon GABAA receptor stimulation and the detected opening of Kir
channels on AMG strongly implied that this secondary response was mediated by
extracellular K+. Kir channel activity in vitro is strongly dependent on [K+]0. An increase in
[K+]0 increased cord conductance of the channel and shifted reversal potential to more

Glial properties in development and injury 76
positive direction (Kettenmann et al., 1990). In the present study, moderate elevation in
[K+]0 by 2.5, 5, and 7.5 mM from 5 mM dose-dependently increased K+ conductance in
AMG. More pronounced effect was observed in cultured microglia. K+-induced current
response lasted longer in AMG than in cultured microglia likely due to more efficient wash
out from coverslips. Similar amplitudes and kinetics were observed when comparing
current responses induced by muscimol and 5 mM KCl. K+-induced response also occurred
sooner than muscimol indicating a more direct effect of K+.
Considerably smaller [K+]0 elevation observed upon consecutive muscimol stimulations
could presumably be due to GABAA receptor desensitization often observed in neurons
(Hutcheon et al., 2000). It was also observed that after the first current response towards
muscimol, subsequent application of KCl but not muscimol elicited a second response in
AMG. Thus, it is apparent that there is a threshold of [K+]0 increase above which is
detectable by AMG. Furthermore, higher muscimol-induced increase in [K+]0 in postnatal
than adult brain is an explanation for the absence of current response in adult microglia.
The ramified cells typically had very small Kir current, as previously reported by Boucsein
(2000), which translates to lower sensitivity towards changes in [K+]0.
It is clearly evident that an increase of [K+]0 due to membrane depolarization upon GABAA
receptor activities opens Kir channels on microglia in the developing brain; but is too small
to be detectable in the developed brain by ramified microglia which are also less
responsive.
5.1.4 Cytokine release upon GABAergic innervations The majority of studies on microglial chemokine release and receptor expression focus on
neurodegenerative and inflammatory conditions where microglial response is rapidly
induced (Hanisch, 2002). Due to low and undetectable levels of constitutive release, the
roles of chemokines under physiological conditions are often neglected. Recently,
emerging data suggest potential functions of chemokines in modulating brain activities in
addition to their classical roles in inflammatory responses. Evidence for their involvement in
normal brain functions including development have been demonstrated (Rostene et al.,
2007). In the present study, unstimulated microglial cytokine release into culture medium
over 24 hr could be detected using ELISA. Among various cytokines tested, induction of

Glial properties in development and injury 77
MIP-1α release by elevated [K+]0 suggests specific actions of this chemokine. MIP-1
belongs to the CC chemokine subfamily. Its four members are MIP-1α, MIP-1β, MIP-1δ,
and MIP-1γ (Menten et al., 2002). Although constitutively expressed in low amounts,
astrocytes and fetal microglia promptly synthesize and release MIP-1 proteins in vitro upon
stimulation (McManus et al., 1998; Miyamoto and Kim, 1999). MIP-1α binds to G-protein
coupled receptors CCR1 and CCR5 leading to downstream processes important for many
inflammatory conditions (Murdoch and Finn, 2000; Maurer and von Stebut, 2004). The role
of MIP-1α and CCR1 in postnatal development of the cerebellum has been implicated
(Cowell and Silverstein, 2003). In this brain region, immunoreactivity of CCR1 was
observed in neurons, Bergmann glia, astrocytes and resting microglia which peaked
between P7 and P21. MIP-1α expression in white matter microglia was detectable between
P7 and P14, which coincides with the period of neuronal and glial maturation (Cowell and
Silverstein, 2003). Interestingly, MIP-1α positive cells were often found near processes and
cell bodies of CCR1-immunoreactive cells. As differential expression and release of
chemokines and their receptors across developmental stages exists, it is essential to relate
in vitro effect of elevated [K+]0 to the developing brain. Here, K+-induced significant
increase of basal MIP-1α release was also measured from postnatal acute brain slices
over as short as 1.5 hr. Although no direct evidence confirmed source of MIP-1α release
from brain slices, in vitro experiments suggest that microglia could contribute to the
release. While muscimol had no effect on cultured microglia, similar effects of muscimol
and elevated [K+]0 could be demonstrated in situ. It is postulated that microglial MIP-1α
release in situ could be indirectly modulated upon GABAA receptor stimulation via elevated
[K+]0.
During immediate early phase of acute neurodegeneration, release of TNF-α and IL-1 was
detected as early as 1 hr after insult (Allan and Rothwell, 2001). It was also observed that
the release of TNF-α and IL-6 from microglia in response to bacterial antigens requires
only short-term stimulation (Hanisch et al., 2001). In the present developmental model,
however, 15-min short stimulation could not induce MIP-1α release in situ indicating that
prolonged presence of stimulus, namely GABAergic activities, may be required to take its
effect. It is likely that vesicular release of GABA from axonal growth cones during
development occurs in pulses upon action potentials (Gao and van den Pol, 2000). It could

Glial properties in development and injury 78
be possible that MIP-1α release is only required when GABAergic activities in the brain
remains consistently strong.
It was reported that MIP-1α regulates proliferation of a subpopulation of hematopoietic
stem cells in vivo and in vitro and regulate hematopoiesis depending on the stages of
development (Owen-Lynch et al., 1998; Broxmeyer and Kim, 1999). While impaired
hematopoiesis was observed in CCR1 -/- mice, normal growth and development was not
affected in these animals implying compensation of other MIP-1α receptor subtypes (Gao
et al., 1997). Chemokines such as MCP-1 and MIP-1α also promote microglial migration
and cytoskeleton reorganization in vitro (Cross and Woodroofe, 1999; Maciejewski-Lenoir
et al., 1999). Effects of MIP-1α on properties of glial cells have also been discovered. MIP-
1α and MCP-1 treatment could promote astrocyte migration in vitro possibly via novel
astrocytic receptors (Heesen et al., 1996). Moreover, subnanomolar concentration of MIP-
1α could induce chemotactic response in astrocytes in vitro (Tanabe et al., 1997). In view
of these in vitro reports, observations in situ of the present study support the potential of
MIP-1α released upon GABAA receptor stimulation in interacting with astrocytes and
precursor cells in the developing corpus callosum.
5.1.5 Microglial properties upon GABAergic innervations Microglial proliferation and migration are two important and well-documented processes of
invading microglia (Cuadros and Navascues, 2001). There have been reports
demonstrating that microglia in the developing quail retina go through alternating stages of
migration and mitosis (Marin-Teva et al., 1999). The process of proliferation peaks between
postnatal day 5 and 10 in the developing brain (Perry and Gordon, 1991; Ling and Wong,
1993). It was observed that AMG in many brain regions including the corpus callosum
make use of their processes in dispersing themselves (Brockhaus et al., 1996; Cuadros et
al., 1997). As naturally occurring cellular processes could regulate microglial proliferation
and migration (Cuadros and Navascues, 2001), the potential of GABAergic innervations in
the developing brain in promoting these events was tested in the present study. Whereas
increased [K+]0 upon GABAA receptor stimulation elicited current response in AMG and
cultured microglia, an effect on microglial proliferation in vitro was not observed.
Chemotaxis was also unaffected by the presence of increasing K+ gradient. Despite reports

Glial properties in development and injury 79
indicating the roles of K+ channels in microglial proliferation, volume changes and migration
(Eder, 2005), K+-mediated current changes in microglia observed in this study was not
associated with cell proliferation and migration. However, it cannot be ruled out that
cultured microglia behave differently than AMG in situ. As mentioned, microglia, even the
resting ramified ones, continuously monitor their surroundings with moving processes
(Davalos et al., 2005; Nimmerjahn et al., 2005). It was first observed by Brockhaus et al.
(1996) that invading microglia in postnatal corpus callosum used velum-like processes to
actively screen and phagocytoze dead or damaged cells in their surroundings. In the
present study, movement of these processes was systematically quantified and compared.
It was observed that muscimol significantly enhanced relative arm movement of AMG but
displacement of the cells away from its original position was not affected. With increased
sensitivity to their surroundings, AMG may be able to better perform their characteristic
tasks including removal of cellular debris in the developing brain where GABAergic activity
is strong. To establish this claim, further studies of in situ phagocytosis upon muscimol
stimulation is warranted. Additionally, apart from neighboring astrocytes, Ca2+ response
was also observed in AMG upon muscimol stimulation. The decreased number of
responding AMG at a distance above surface and lack of response in cultured microglia
suggest that, similar to current response observed, [Ca2+]i increase was also an indirect
effect which was strongest at the surface of the brain slice. Unlike current response,
however, Ca2+ response in single AMG at 300 µm above surface of brain slice was still
detectable, although much less frequently. Microglia in vitro respond to neuropeptides like
kinins with mobilization of intracellular Ca2+ and migration (Noda et al., 2006). Ca2+
response towards a series of neurotransmitters including GABA via GABAB receptors have
also been observed (Kuhn et al., 2004; Pocock and Kettenmann, 2007). Here, the lack of
functional GABAA receptor on AMG demonstrated by electrophysiological studies indicates
that direct receptor mediated effect is unlikely. Extracellular K+, the substance mediating
microglial current response and cytokine release, had only little effect on arm movement
and no effect on Ca2+ response implying alternative mechanisms which are yet unknown.
Nevertheless, it is evident that in the presence of GABAA receptor agonist, enhanced arm
movement and Ca2+ response in AMG could be observed in postnatal brain slice. However,
the mechanisms involved should be further investigated.

Glial properties in development and injury 80
5.1.6 Approaches to study microglial properties Microglia comprise of a largely heterogeneous population which varies across species,
brain regions, developmental stages as well as preparations (Hanisch and Kettenmann,
2007). Among these, the invading microglia in early and postnatal development display
distinctive characteristics not observed in other stages. Using acute brain slices obtained
from postnatal mouse brain, AMG accumulation on the surface of the corpus callosum
made physiological studies of this unique population possible (Brockhaus et al., 1993;
Brockhaus et al., 1996; Haas et al., 1996; Farber et al., 2005). These in situ studies have
the advantage that the environment of the developing corpus callosum is preserved to
some extent. However, the presence of activities of neighboring cells may also obscure or
mask response from AMG. One of the objectives of the present study is to address this
problem by devising methods to understand microglial response in relations to their
surroundings. By lifting up AMG via patch pipettes according to previously described
methods (Walz et al., 1993; Haas et al., 1996), whole cell voltage-clamp or Ca2+ imaging
experiments could be performed at various distances above surface of brain slices. The
contact between AMG and the tip of patch pipettes was usually tight enough to withstand
slow mechanical manipulations of height within continuous bath perfusion and downward
force generated by the weight of the large cell. A resting period of 5 min at the destination
was necessary for the cells to recover from stress. ATP-induced current and Ca2+ response
detected in all of these isolated AMG before the end recordings confirmed cell viability and
good patch quality. Although not tested in this study, by including Ca2+ sensitive dyes in the
pipette solution with appropriate salt concentrations, it is possible to perform Ca2+ imaging
and patch-clamp experiments simultaneously.
An apparent constraint of using cultured microglia is that culture manipulations disturb or
even activate naive microglia (Walz and Bekar, 2001). Contents of culture medium may
also alter their response (Eder et al., 1995a). Besides, in the absence of intact brain tissue,
some indirect microglial response may not be detectable, like in the present study. This
problem can be overcome by placing freshly prepared acute brain slices on coverslips of
cultured cells. Similar to the AMG liftup approach, properties of cultured microglia can be
assessed within minutes. However, long-term effect of reintroducing brain slice

Glial properties in development and injury 81
environment beyond few hours cannot be performed due to limited time within which fresh
brain slices can be kept.
Most studies assessing microglial motility use time-lapse microscopy to measure distance
travelled by cells on coverslips over hours of stimulation (Ifuku et al., 2007). This is useful
when general or directional migration of cells is of interest. In the present study, however,
AMG on the surface of brain slices did not migrate considerably within minutes of
stimulation. Instead, their processes were responsive in this time frame. AMG have distinct
morphology different from cultured microglia where many of their functions rely on their
moving arms. Their phagocytotic activities for example, do not require significant
displacement of cells from its original location (Brockhaus et al., 1996). In many cases, it
takes only minutes for an AMG to respond to and phagocytoze cell debris. These
properties cannot be observed in vitro. Although there has been reports characterizing this
type of movement in cultures (Nolte et al., 1996; Rezaie et al., 2002b), no previous study
has quantified arm movements of AMG. By measuring changes of intensity around the
perimeter of these round cells, relative movement of arms could be estimated. In order to
detect only moving arms, a sampling rate of 2 s was chosen so that arms which remained
stationary over 2 s were excluded in the calculation by obtaining the difference between
consecutive images. This also successfully removed stationary background. After using a
filter to enhance edges, background became darker and moving arms brighter. With CytoD
pretreatment, arms of AMG retracted considerably which was reflected in the
quantification. This method, however, is only reliable in cases where the AMG did not move
significantly from its original position or out of focus thus only the first 5 min of stimulation
was analyzed and compared to the first 5 min of control period. It should also be noted that
extension of arms without movement along the perimeter which is also of interest with
regards to phagocytosis could not be detected using this method. An attempt to measure
this would be to increase the size of the sampling circle to detect moving objects at various
distances from the center of the cell. This would also require a very stable image recording.

Glial properties in development and injury 82
5.2 Unique physiological properties in striatal astrocytes in response
to stroke
5.2.1 Subpopulations of astrocytes with distinct properties in the striatum Distinctions between astrocytic populations in terms of “complex” and “passive” membrane
properties were previously established in situ (Steinhauser et al., 1994) and were
subsequently supported by further studies (Seifert and Steinhauser, 1995; Zhou and
Kimelberg, 2001). The generation of GFAP-EGFP transgenic mice allowed observations
and electrophysiological recordings of a population of astroglial cells in many brain regions
including the cortex, cerebellum, striatum, corpus callosum and hippocampus (Nolte et al.,
2001). In the present study, two types of GFAP-EGFP positive astrocytes in roughly equal
proportion were identified in adult mouse striatum. Based on GFAP-EGFP expression, they
could be divided into brightly and weakly fluorescent cells. Brightly fluorescent cells had
larger soma surrounded by fine, ramified processes. They always lacked voltage-gated
channels resulting in passive membrane current profiles. The majority of these cells
displayed glutamate transporter activities as similarly described previously (Zhou and
Kimelberg, 2001). Weakly fluorescent cells in the striatum, on the other hand, had smaller
soma and clearly distinguishable processes most of which were only visible by dye filling
via patch pipettes. They expressed delayed rectifying K+ outward thus were complex cells
and showed large AMPA/KA receptor response which was also similarly demonstrated by
Zhou and Kimelberg (2001). These distinct characteristics also parallel previous reports in
the hippocampus (Matthias et al., 2003) and brain stem (Grass et al., 2004) using the same
transgenic model. However, unlike the hippocampus, glutamate receptor/transporter
responses were not exclusive to one cell type in the striatum implying the possibility of co-
expression of glutamate receptors and transporters in a small proportion of cells. That is, in
the striatum, KA and D-Asp also triggered small and infrequent responses in brightly and
weakly fluorescent cells, respectively. While KA triggered only classical cationic
conductance of glutamate receptor response in brightly fluorescent cells, the corresponding
current response in weakly fluorescent cells was composed of complex current
components involving a cationic conductance. Furthermore, 20-min biocytin dye-filling into
patched cells revealed that brightly fluorescent passive cells were highly coupled via gap

Glial properties in development and injury 83
junctions. This high coupling rate among passive cells which resembled the classical
protoplasmic astrocytes supported their proposed role in spatial buffering of extracellular
glutamate and K+ released by neurons (Anderson and Swanson, 2000). However, in
contrast to the hippocampus where weakly fluorescent cells were uncoupled (Wallraff et
al., 2004), those in the striatum were found to be coupled albeit to a significantly smaller
extent than brightly fluorescent ones. Further studies are warranted to investigate the
functional significance of the presence of gap junction coupling in complex cells of the
striatum.
Thus, in the healthy striatum, it is shown in the present in situ study that like in other brain
regions, two populations of astrocytes exist with distinctive ion channel expression and
differential response towards glutamate. They also differ in terms of their mode of
communication via gap junction coupling which implies different mechanisms of
transporting and distributing substances among cells.
5.2.2 Ischemia-induced changes in astrocytic properties In the striatum, GFAP-EGFP positive cells over days after 30-min MCAo/reperfusion
displayed a collection of unique properties not exclusively present in any one cell type in
control animals. Most obviously, GFAP-EGFP expression increased within the ischemic
lesion area as compared to the contralateral hemisphere similar to previous observations
upon cortical stab wounds (Nolte et al., 2001). In the injured striatum, clear distinction
between brightly and weakly fluorescent cells could not be made, however cells with
complex membrane current became progressively dominant over days after
MCAo/reperfusion. In fact, up-regulation of outwardly rectifying K+ currents which appeared
to play a role in proliferation of reactive astrocytes have been demonstrated in situ and in
vitro (MacFarlane and Sontheimer, 1997; Bordey and Sontheimer, 1998; Anderova et al.,
2004). Furthermore, the increased proportion of complex cells was accompanied by
increased expression of glutamate receptor on astroglia in the striatum. It was reported in
the cerebellum that over-expression of AMPA receptors lead to elongated glial processes
(Ishiuchi et al., 2001) whereas a down-regulation resulted in retraction in Bergmann glia
(Iino et al., 2001). In line with these reports, it was indeed observed in the present study
that weakly fluorescent cells in control tissue and cells after stroke have more extended

Glial properties in development and injury 84
processes than brightly fluorescent cells correlating with expression of AMPA/KA
receptors. These together may enhance the ability of astrocytes in detecting areas of high
extracellular glutamate concentration and respond accordingly. Another fascinating
observation is that these complex cells were found to be highly coupled; even more than
passive cells in control striatum. On the other hand, passive cells showed decreased gap
junction coupling compared to those in control striatum. This could be explained by the
observation that they were rarely found in the ischemic striatum. Beneficial effects of
astrocytic gap junction coupling have been demonstrated by increased ischemic infarct
size in connexin 43 (Cx43) deficient mice (Siushansian et al., 2001) and enhanced
neuronal death in Cx43 +/- mice (Nakase et al., 2003a; 2003b). A recent report
demonstrated that decreased Cx43 protein expression resulted in impaired gap junction
coupling only in the injured hemisphere upon photothrombotic lesion (Haupt et al., 2007).
In other studies, astrocytic gap junction coupling appeared to promote brain damage by
providing a pathway for propagation of toxic signals throughout the brain (Lin et al., 1998;
Frantseva et al., 2002). Since astrocytes do not undergo cell death in the present
MCAo/reperfusion model (Katchanov et al., 2001; Kronenberg et al., 2005), it is postulated
that the observed increase in coupling network may be neuroprotective. In fact, neuronal
death which began 18 hr and peaked after 72 hr after MCAo (Katchanov et al., 2001)
preceded enhanced astrocytic coupling which was detected only after at least 4 days. This
could imply different time frames of action where brain damage precedes repair
mechanisms. It is also interesting that the expression of glutamate transporter in these
astrocytes after stroke was not up-regulated. Glutamate transporters are normally
considered as a means through which extracellular glutamate can be removed during
glutamatergic synaptic activities and from the injured sites (Anderson and Swanson, 2000).
In this case, the lack of increased glutamate transporter expression together with a higher
coupling rate among astrocytes suggest the possibility that, neuroprotective substances
outside of the lesion area could reach the site of injury via network of astrocytes without
having to sacrifice for the spreading of glutamate into healthier surrounding brain regions.
In order to establish this claim, details of the composition and regulations of the coupling
network among complex reactive astrocytes in the striatum in response to stroke should be
further defined.

Glial properties in development and injury 85
5.3 Proposed roles of invading microglia and striatal astrocytes
According to the present observations, invading microglia, although lacking functional
GABAA receptors, could sense GABAA receptor activities in neighboring macroglia and
neurons via intrinsic Kir channels (Fig. 29). This was accompanied by induced release of
the chemokine MIP-1α from microglia in vitro and from postnatal brain slices which may
potentially attract astrocytes and neural stem cells towards the developing white matter. In
addition, GABAA receptor activities also stimulated arm movement and intracellular Ca2+
response in invading microglia in situ which may have functional significance in microglial
properties like phagocytosis. Together, these may contribute to the development of
postnatal white matter where trophic actions of GABA are important.
Fig. 29. Invading microglia sense GABAergic activities in the developing brain. A proposed series of events occurring at the postnatal corpus callosum is illustrated. GABAergic innervations stimulate GABAA receptors on macroglia and cortical neurons. This is followed by membrane depolarization and thus K+ efflux from these cells. The resulting increase in [K+]0 opens Kir channels on ameboid microglia (AMG) which have invaded the brain from sites including the ventricles. This in turn enhanced chemokine MIP-1α release which may attract neural or hematopoietic precursors and astrocytes. Through mechanisms yet to be elucidated, enhanced arm movement and elicited Ca2+ response in AMG have potential functional significance in phagocytotic activities. Images of cells are modified from http://www.helpforheadaches.com/articles/nihsheets/life-neuron.htm.
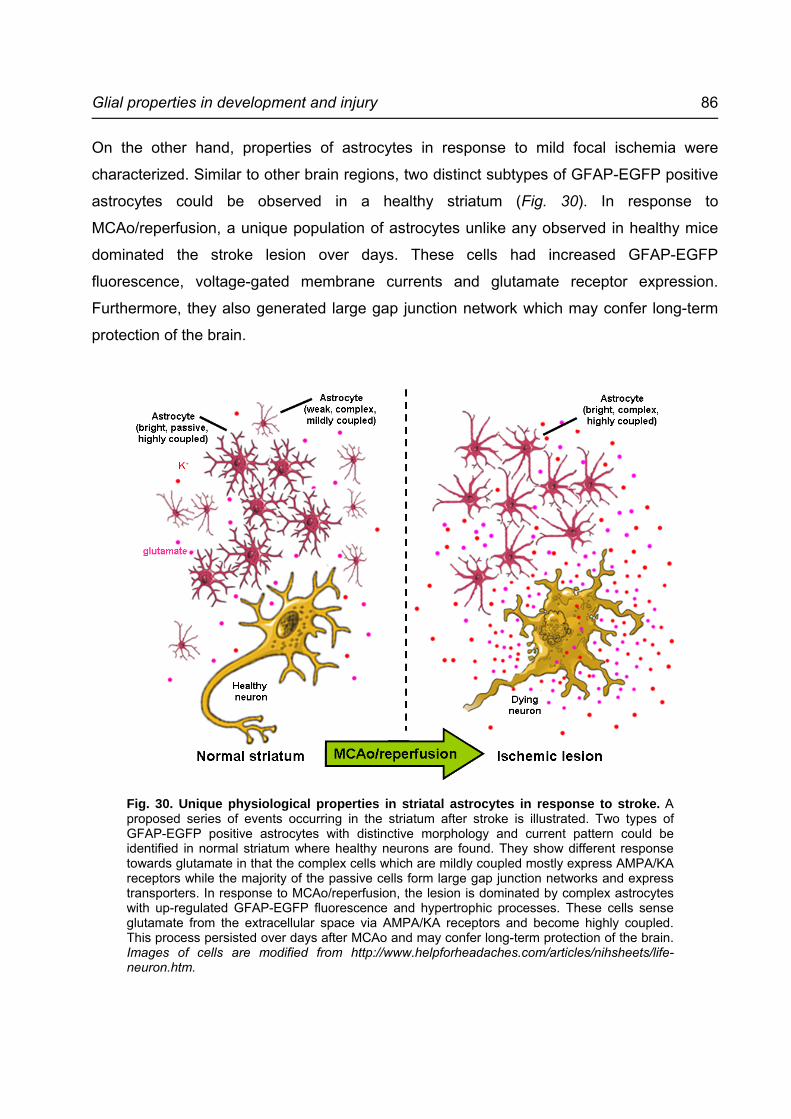
Glial properties in development and injury 86
On the other hand, properties of astrocytes in response to mild focal ischemia were
characterized. Similar to other brain regions, two distinct subtypes of GFAP-EGFP positive
astrocytes could be observed in a healthy striatum (Fig. 30). In response to
MCAo/reperfusion, a unique population of astrocytes unlike any observed in healthy mice
dominated the stroke lesion over days. These cells had increased GFAP-EGFP
fluorescence, voltage-gated membrane currents and glutamate receptor expression.
Furthermore, they also generated large gap junction network which may confer long-term
protection of the brain.
Fig. 30. Unique physiological properties in striatal astrocytes in response to stroke. A proposed series of events occurring in the striatum after stroke is illustrated. Two types of GFAP-EGFP positive astrocytes with distinctive morphology and current pattern could be identified in normal striatum where healthy neurons are found. They show different response towards glutamate in that the complex cells which are mildly coupled mostly express AMPA/KA receptors while the majority of the passive cells form large gap junction networks and express transporters. In response to MCAo/reperfusion, the lesion is dominated by complex astrocytes with up-regulated GFAP-EGFP fluorescence and hypertrophic processes. These cells sense glutamate from the extracellular space via AMPA/KA receptors and become highly coupled. This process persisted over days after MCAo and may confer long-term protection of the brain. Images of cells are modified from http://www.helpforheadaches.com/articles/nihsheets/life-neuron.htm.

Glial properties in development and injury 87
6 Summary
Emerging findings demonstrate that in the central nervous system, glial cells interact with
neuronal networks and thereby modulate brain activities. In particular, microglia and
astrocytes respond rapidly towards the environment with morphological and physiological
changes. In two separate projects, the functions of invading microglia in the developing
brain (Project 1) and properties of astrocytes in response to mild focal ischemia (Project 2)
were investigated:
Project 1: Microglia invade the brain during early stages of development and migrate along
fiber tracts to their final destinations where they become resident. However, specific signals
through which they communicate with the developing brain are yet largely unknown. The
present study utilized ameboid microglia at the corpus callosum of postnatal mouse acute
brain slices as a model for invading microglia. Their response towards GABAA receptor
activities, which is essential for trophic actions of GABA in brain development, was studied.
Whole cell patch-clamp experiments revealed that muscimol, a specific agonist for GABAA
receptor, triggered a transient increase in K+ conductance in ameboid microglia. Such
response was progressively lost in single cells lifted up from slice surface and was
observed in cultured microglia only in close vicinity to brain slices suggesting that it was
indirect. Muscimol also stimulated GABAA receptors on macroglia and neurons in postnatal
brain leading to an elevation of extracellular K+ concentration ([K+]0). In addition, an
experimental increase of [K+]0 mimicked muscimol-induced current response in microglia.
These results indicated that invading microglia in early postnatal development sense
GABAergic activities indirectly via sensing changes in [K+]0. This in turn stimulated the
release of a chemokine, macrophage inflammatory protein-1 alpha, from microglia in vitro
and from postnatal brain slices; while the release of a number of other cytokines, microglial
chemotaxis and proliferation were not affected. Moreover, in adult brain slices, muscimol
only led to a small increase in [K+]0 which failed to elicit current response in ramified
microglia suggesting functional significance specific for the developing brain. Concurrently,
motility and intracellular Ca2+ level of ameboid microglia were also enhanced upon GABAA
receptor stimulation.

Glial properties in development and injury 88
Project 2: There is at present no consensus about the beneficial or detrimental roles of
astrocytes in brain injuries. Using adult transgenic mice expressing enhanced green
fluorescent protein under the glial fibrillary acidic protein (GFAP) promoter, astrocytes in
the striatum were characterized before and after mild focal ischemia. In healthy striatum,
two types of GFAP positive astrocytes with distinctive properties could be identified; 1)
brightly fluorescent cells were characterized by bushy processes, passive membrane
properties, glutamate transporter activity, and formed large gap junction coupling network;
2) weakly fluorescent cells generally had thin and clearly distinguishable processes,
voltage-gated currents, complex current responses to kainate, and low coupling rate. While
the brightly fluorescent cells have properties typical for classical astrocytes, the weakly
fluorescent ones resemble a glial cell subtype recently described in the hippocampus. To
investigate properties of these cell populations upon brain injury, short middle cerebral
artery occlusion (MCAo) followed by reperfusion which leads to delayed neuronal cell
death and astrogliosis in the striatum was used as a model for mild focal ischemia. In
response to MCAo/reperfusion, brightly fluorescent cells became dominant over days
within the ischemic lesion and the majority of these cells expressed voltage-gated channels
and showed complex responses to kainate. Interestingly, they had high coupling rate which
even exceeded that of control brightly fluorescent cells. Conversely, a minority of cells
found after ischemia had passive membrane properties and decreased coupling rate. Taken together, findings from these projects demonstrated properties of glial cells in the
developing and injured brains suggesting possible functional significance. Invading
microglia, although they did not express functional GABAA receptor subtype, could sense
GABAergic activities in neighboring cells of the developing brain via [K+]0 increase. This
modulated microglial properties which may contribute to white matter development. Striatal
astrocytes, on the other hand, underwent distinct pathophysiological changes after
ischemic insults and constituted a novel physiological phenotype which formed large
syncytium. The delayed and long-lasting effects suggested possible neuroprotective
functions of these reactive astrocytes.

Glial properties in development and injury 89
7 Zusammenfassung
Jüngere Forschungsergebnisse zeigen, dass Gliazellen eine wichtige Rolle im
Zentralnervensystem spielen, die darin besteht, dass sie mit neuronalen Netzwerken
interagieren und somit Hirntätigkeiten modulieren. Besonders Mikroglia und Astrozyten
reagieren unmittelbar mit aktiver Änderung ihrer Zellmorphologie und – physiologie auf
Reize ihrer Umgebung. Somit wurde in zwei getrennten Projekten die Funktionen
einwandernder Mikroglia im sich entwickelnden Gehirn (Projekt 1) sowie die Eigenschaften
von Astrozyten als Reaktion auf Fokale Ischämie (Projekt 2) untersucht:
Projekt 1: Mikroglia dringen während früher Entwicklungsstadien in das Gehirn ein und
wandern entlang von Fasertrakten zu ihrem Zielort, an dem sie in die ruhende Form
übergehen. Dennoch sind die Signale, durch die sie mit dem sich entwickelnden Gehirn
kommunizieren, noch immer weitgehend unbekannt. Die hier vorgelegte Studie nutzte
amöboide Mikroglia aus dem Corpus callosum akuter Hirnschnitte aus postnatalen Mäusen
als ein Modell für einwandernde Mikroglia. Es wurde deren Reaktion auf GABAA
Rezeptoraktivität, welche essentiell für die trophische Wirkung von GABA während der
Hirnentwicklung ist, untersucht. Whole cell patch clamp Experimente erbrachten den
Beweis, dass Muscimol, ein spezifischer GABAA Rezeptor-Agonist, eine transiente
Erhöhung der Kaliumleitfähigkeit in amöboiden Mikrogliazellen erzeugt. Diese Reaktion
verschwandt sukzessive als einzelne Mikroglia über die Schnittoberfläche angehoben
wurden. Ebenso war die Reaktion in Kultur nur in unmittelbarer Nähe zu einem Hirnschnitt
zu beobachten, was auf einen indirekten Effekt schließen lässt. Muscimol aktivierte im
postnatalen Gehirn GABAA Rezeptoren auf benachbarten Makroglia sowie auf Neuronen,
was zu einer Erhöhung der extrazellulären Kaliumkonzentration ([K+]O) führte. Zusätzlich
konnte eine experimentelle [K+]O Erhöhung den Effekt von Muscimol imitieren. Diese
Ergebnisse zeigten, dass eindringende Mikroglia während der frühen postnatalen
Entwicklung GABAerge Aktivität indirekt durch Änderungen der [K+]O detektieren. Dies
wiederum stimulierte die Freisetzung eines Chemokins namens macrophage inflammatory
protein-1 alpha sowohl aus postnatalen Hirnschnitten als auch aus Mikrogliazellen in
Kultur; die Freisetzung anderer Zytokine, die mikrogliale Chemotaxis sowie Proliferation
wurden nicht beeinflusst. Des weiteren führte Muscimol in Hirnschnitten von adulten

Glial properties in development and injury 90
Mäusen nur zu einem geringen Anstieg der [K+]O, welcher nicht in der Lage war, eine
Stromantwort in ramifizierten Mikroglia hervorzurufen. Dies legt eine funktionelle
Signifikanz spezifisch für das sich entwickelnde Gehirn nahe. Gleichzeitig führte die
GABAA Rezeptor Stimulation zu einer Erhöhung der Motilität und der intrazellulären
Kalziumkonzentrationen amöboider Mikroglia.
Projekt 2: Derzeit besteht keine Einigkeit bezüglich der förderlichen oder schädlichen
Rolle von Astrozyten bei Hirnverletzungen. Unter Zuhilfenahme adulter transgener Mäuse,
die das enhanced green fluorescence protein (EGFP) unter dem Promotor von glial
fibrillary acidic protein (GFAP) exprimieren, wurden Populationen von Astrozyten im
Striatum vor und nach Fokaler Ischämie untersucht. In akuten Schnitten, die aus gesunden
Hirnen gewonnen wurden, konnten zwei Typen von GFAP-positiven Astrozyten im Striatum
ausgemacht werden. 1) Hell fluoreszierende Zellen, charakterisiert durch buschige
Fortsätze, passive Membraneigenschaften, Glutamattransporter-Aktivität und Kopplung
durch Gap Junction Netzwerke. 2) Schwach fluoreszierende Zellen mit dünnen und klar zu
identifizierenden Fortsätzen, spannungsaktivierten Strömen, einer komplexen
Stromantwort auf Kainat und einer geringen Kopplungsrate. Während die hell
fluoreszierenden Zellen Charakteristika klassischer Astrozyten zeigten, hatten die schwach
fluoreszierenden Zellen Ähnlichkeit mit einem kürzlich im Hippocampus beschriebenen
astrozytären Subtyp. Um die Eigenschaften dieser Zellpopulationen in Reaktion auf
Hirnverletzungen zu untersuchen, wurden kurze Okklusionen der mittleren zerebralen
Arterie (MCAo), gefolgt von Reperfusion, durchgeführt. Dies führte zu verzögerten
neuronalen Zelltod und Astrogliose im Striatum und diente als Modell für Fokale Ischämie.
Als Antwort auf MCAo/Reperfusion zeigte sich, dass stark fluoreszierende Zellen im Laufe
mehrerer Tage dominant im Bereich der ischämischen Läsion wurden. Die Mehrheit dieser
Zellen exprimierte spannungsaktivierte Kanäle und zeigte komplexe Antworten auf Kainat.
Interessanterweise zeigten diese Zellen eine höhere Kopplungsrate als Kontrollzellen mit
starker Fluoreszenz. Eine Minderheit der Zellen hingegen zeigte passive
Membraneigenschaften und wies im Vergleich zu passiven Kontrollzellen eine verminderte
Kopplungsrate auf.
Zusammengefasst zeigen die Ergebnisse aus dieser Studie Eigenschaften von Gliazellen
im sich entwickelnden und verletzten adulten Gehirn, die eine funktionelle Signifikanz

Glial properties in development and injury 91
nahelegen. Einwandernde Mikroglia können GABAerge Aktivitäten in benachbarten Zellen
des sich entwickelnden Gehirns teilweise detektieren obwohl sie keine funktionellen
GABAA Rezeptoren exprimieren. Dies findet durch eine Erhöhung der [K+]O statt, welche
die mikroglialen Eigenschaften moduliert, was möglicherweise zur Entwicklung der weißen
Substanz beiträgt. Andererseits unterlagen striatale Astrozyten verschiedenen
pathophysiologischen Änderungen nach einer Ischämie und stellten einen neuen
physiologischen Phänotyp dar, der ein großes Synzytium bildete. Der verzögerte und lang
anhaltende Effekt legt eine mögliche neuroprotektive Funktion reaktiver Astrozyten nahe.

Glial properties in development and injury 92
8 References Albright AV et al. (1999) Microglia express CCR5, CXCR4, and CCR3, but of these, CCR5
is the principal coreceptor for human immunodeficiency virus type 1 dementia isolates. J
Virol 73:205-213.
Allan SM, Rothwell NJ (2001) Cytokines and acute neurodegeneration. Nat Rev Neurosci
2:734-744.
Aloisi F (2001) Immune function of microglia. Glia 36:165-179.
Ambrosini E, Aloisi F (2004) Chemokines and glial cells: a complex network in the central
nervous system. Neurochem Res 29:1017-1038.
Anderova M et al. (2004) Voltage-dependent potassium currents in hypertrophied rat
astrocytes after a cortical stab wound. Glia 48:311-326.
Anderson CM, Swanson RA (2000) Astrocyte glutamate transport: review of properties,
regulation, and physiological functions. Glia 32:1-14.
Bajetto A et al. (2002) Characterization of chemokines and their receptors in the central
nervous system: physiopathological implications. J Neurochem 82:1311-1329.
Balslev Y et al. (1996) Synaptogenesis in the neocortical anlage and early developing
neocortex of rat embryos. Acta Anat (Basel) 156:2-10.
Barbin G et al. (1993) Involvement of GABAA receptors in the outgrowth of cultured
hippocampal neurons. Neurosci Lett 152:150-154.
Barres BA et al. (1990) Ion channels in vertebrate glia. Annu Rev Neurosci 13:441-474.
Bekar LK et al. (1999) GABAA receptor agonists modulate K+ currents in adult
hippocampal glial cells in situ. Glia 26:129-138.
Ben-Ari Y et al. (2007) GABA: a pioneer transmitter that excites immature neurons and
generates primitive oscillations. Physiol Rev 87:1215-1284.
Ben-Ari Y et al. (1997) GABAA, NMDA and AMPA receptors: a developmentally regulated
'menage a trois'. Trends Neurosci 20:523-529.
Berger T et al. (1992) GABA- and glutamate-activated currents in glial cells of the mouse
corpus callosum slice. J Neurosci Res 31:21-27.
Bergles DE et al. (2000) Glutamatergic synapses on oligodendrocyte precursor cells in the
hippocampus. Nature 405:187-191.

Glial properties in development and injury 93
Biber K et al. (2001) Ischemia-induced neuronal expression of the microglia attracting
chemokine Secondary Lymphoid-tissue Chemokine (SLC). Glia 34:121-133.
Blanc EM et al. (1998) Astrocytic gap junctional communication decreases neuronal
vulnerability to oxidative stress-induced disruption of Ca2+ homeostasis and cell death. J
Neurochem 70:958-970.
Boddeke EW et al. (1999) Cultured rat microglia express functional beta-chemokine
receptors. J Neuroimmunol 98:176-184.
Bordey A, Sontheimer H (1998) Properties of human glial cells associated with epileptic
seizure foci. Epilepsy Res 32:286-303.
Bordey A et al. (2000) Reactive astrocytes show enhanced inwardly rectifying K+ currents
in situ. Neuroreport 11:3151-3155.
Bordey A et al. (2001) Electrophysiological characteristics of reactive astrocytes in
experimental cortical dysplasia. J Neurophysiol 85:1719-1731.
Bormann J, Kettenmann H (1988) Patch-clamp study of gamma-aminobutyric acid receptor
Cl- channels in cultured astrocytes. Proc Natl Acad Sci U S A 85:9336-9340.
Boucsein C et al. (2000) Electrophysiological properties of microglial cells in normal and
pathologic rat brain slices. Eur J Neurosci 12:2049-2058.
Bowman CL, Kimelberg HK (1984) Excitatory amino acids directly depolarize rat brain
astrocytes in primary culture. Nature 311:656-659.
Brockhaus J et al. (1996) Phagocytozing ameboid microglial cells studied in a mouse
corpus callosum slice preparation. Glia 16:81-90.
Brockhaus J et al. (1993) Membrane properties of ameboid microglial cells in the corpus
callosum slice from early postnatal mice. J Neurosci 13:4412-4421.
Broxmeyer HE, Kim CH (1999) Regulation of hematopoiesis in a sea of chemokine family
members with a plethora of redundant activities. Exp Hematol 27:1113-1123.
Butt AM, Kalsi A (2006) Inwardly rectifying potassium channels (Kir) in central nervous
system glia: a special role for Kir4.1 in glial functions. J Cell Mol Med 10:33-44.
Callewaere C et al. (2006) The chemokine SDF-1/CXCL12 modulates the firing pattern of
vasopressin neurons and counteracts induced vasopressin release through CXCR4. Proc
Natl Acad Sci U S A 103:8221-8226.

Glial properties in development and injury 94
Cartier L et al. (2005) Chemokine receptors in the central nervous system: role in brain
inflammation and neurodegenerative diseases. Brain Res Brain Res Rev 48:16-42.
Chamak B et al. (1994) Brain macrophages stimulate neurite growth and regeneration by
secreting thrombospondin. J Neurosci Res 38:221-233.
Chamak B et al. (1995) Immunohistochemical detection of thrombospondin in microglia in
the developing rat brain. Neuroscience 69:177-187.
Contreras JE et al. (2004) Role of connexin-based gap junction channels and
hemichannels in ischemia-induced cell death in nervous tissue. Brain Res Brain Res Rev
47:290-303.
Cowell RM, Silverstein FS (2003) Developmental changes in the expression of chemokine
receptor CCR1 in the rat cerebellum. J Comp Neurol 457:7-23.
Cross AK, Woodroofe MN (1999) Chemokines induce migration and changes in actin
polymerization in adult rat brain microglia and a human fetal microglial cell line in vitro. J
Neurosci Res 55:17-23.
Cuadros MA, Navascues J (1998) The origin and differentiation of microglial cells during
development. Prog Neurobiol 56:173-189.
Cuadros MA, Navascues J (2001) Early origin and colonization of the developing central
nervous system by microglial precursors. Prog Brain Res 132:51-59.
Cuadros MA et al. (1994) Development of microglia in the quail optic tectum. J Comp
Neurol 348:207-224.
Cuadros MA et al. (1997) Microglia development in the quail cerebellum. J Comp Neurol
389:390-401.
D'Ambrosio R et al. (1998) Functional specialization and topographic segregation of
hippocampal astrocytes. J Neurosci 18:4425-4438.
Davalos D et al. (2005) ATP mediates rapid microglial response to local brain injury in vivo.
Nat Neurosci 8:752-758.
DeCoursey TE et al. (1996) Ion channel expression in PMA-differentiated human THP-1
macrophages. J Membr Biol 152:141-157.
Del-Rio H (1932) In: Cytology and Cellular Pathology of the Nervous System (Penfield W,
ed), pp 481-534. New York: Hoeber.

Glial properties in development and injury 95
Dobbertin A et al. (1997) Neurons promote macrophage proliferation by producing
transforming growth factor-beta2. J Neurosci 17:5305-5315.
Eder C (2005) Regulation of microglial behavior by ion channel activity. J Neurosci Res
81:314-321.
Eder C et al. (1997) Distinct soluble astrocytic factors induce expression of outward K+
currents and ramification of brain macrophages. Neurosci Lett 226:147-150.
Eder C et al. (1995a) Properties of voltage-gated currents of microglia developed using
macrophage colony-stimulating factor. Pflugers Arch 430:526-533.
Eder C et al. (1995b) Properties of voltage-gated potassium currents of microglia
differentiated with granulocyte/macrophage colony-stimulating factor. J Membr Biol
147:137-146.
Elkabes S et al. (1996) Brain microglia/macrophages express neurotrophins that selectively
regulate microglial proliferation and function. J Neurosci 16:2508-2521.
Endres M et al. (1998) Attenuation of delayed neuronal death after mild focal ischemia in
mice by inhibition of the caspase family. J Cereb Blood Flow Metab 18:238-247.
Farber K, Kettenmann H (2005) Physiology of microglial cells. Brain Res Brain Res Rev
48:133-143.
Farber K, Kettenmann H (2006) Purinergic signaling and microglia. Pflugers Arch 452:615-
621.
Farber K et al. (2005) Dopamine and noradrenaline control distinct functions in rodent
microglial cells. Mol Cell Neurosci 29:128-138.
Farber K et al. (2008) The ectonucleotidase cd39/ENTPDase1 modulates purinergic-
mediated microglial migration. Glia 56:331-341.
Ferrer I et al. (1990) Naturally occurring cell death in the cerebral cortex of the rat and
removal of dead cells by transitory phagocytes. Neuroscience 39:451-458.
Franchini L et al. (2004) Inwardly rectifying K+ channels influence Ca2+ entry due to
nucleotide receptor activation in microglia. Cell Calcium 35:449-459.
Frantseva MV et al. (2002) Ischemia-induced brain damage depends on specific gap-
junctional coupling. J Cereb Blood Flow Metab 22:453-462.
Fujita H et al. (1998) Adrenergic agonists suppress the proliferation of microglia through
beta 2-adrenergic receptor. Neurosci Lett 242:37-40.

Glial properties in development and injury 96
Gaiarsa JL et al. (1995) Postnatal development of pre- and postsynaptic GABAB-mediated
inhibitions in the CA3 hippocampal region of the rat. J Neurophysiol 73:246-255.
Ganguly K et al. (2001) GABA itself promotes the developmental switch of neuronal
GABAergic responses from excitation to inhibition. Cell 105:521-532.
Gao JL et al. (1997) Impaired host defense, hematopoiesis, granulomatous inflammation
and type 1-type 2 cytokine balance in mice lacking CC chemokine receptor 1. J Exp Med
185:1959-1968.
Gao XB, van den Pol AN (2000) GABA release from mouse axonal growth cones. J Physiol
523 Pt 3:629-637.
Ge WP et al. (2006) Long-term potentiation of neuron-glia synapses mediated by Ca2+-
permeable AMPA receptors. Science 312:1533-1537.
Giaume C, McCarthy KD (1996) Control of gap-junctional communication in astrocytic
networks. Trends Neurosci 19:319-325.
Gilbert P et al. (1984) gamma-Aminobutyric acid directly depolarizes cultured
oligodendrocytes. J Neurosci 4:561-569.
Giovannelli A et al. (1998) CXC chemokines interleukin-8 (IL-8) and growth-related gene
product alpha (GROalpha) modulate Purkinje neuron activity in mouse cerebellum. J
Neuroimmunol 92:122-132.
Grass D et al. (2004) Diversity of functional astroglial properties in the respiratory network.
J Neurosci 24:1358-1365.
Gulledge AT, Stuart GJ (2003) Excitatory actions of GABA in the cortex. Neuron 37:299-
309.
Haas S et al. (1996) ATP-induced membrane currents in ameboid microglia acutely
isolated from mouse brain slices. Neuroscience 75:257-261.
Hagino Y et al. (2004) Heterogeneity and potentiation of AMPA type of glutamate receptors
in rat cultured microglia. Glia 47:68-77.
Hamill OP et al. (1981) Improved patch-clamp techniques for high-resolution current
recording from cells and cell-free membrane patches. Pflugers Arch 391:85-100.
Hanisch UK (2002) Microglia as a source and target of cytokines. Glia 40:140-155.
Hanisch UK, Kettenmann H (2007) Microglia: active sensor and versatile effector cells in
the normal and pathologic brain. Nat Neurosci 10:1387-1394.

Glial properties in development and injury 97
Hanisch UK et al. (2001) The protein tyrosine kinase inhibitor AG126 prevents the massive
microglial cytokine induction by pneumococcal cell walls. Eur J Immunol 31:2104-2115.
Haupt C et al. (2007) Temporal profile of connexin 43 expression after photothrombotic
lesion in rat brain. Neuroscience 144:562-570.
Haydon PG (2001) GLIA: listening and talking to the synapse. Nat Rev Neurosci 2:185-
193.
Haynes SE et al. (2006) The P2Y12 receptor regulates microglial activation by extracellular
nucleotides. Nat Neurosci 9:1512-1519.
Heesen M et al. (1996) Mouse astrocytes respond to the chemokines MCP-1 and KC, but
reverse transcriptase-polymerase chain reaction does not detect mRNA for the KC or new
MCP-1 receptor. J Neurosci Res 45:382-391.
Heinemann U, Arens, J. (1992) Production and calibration of ion-sensitive microelectrodes.
In: Practical Electrophysiological Methods (Kettenmann H, Grantyn R., ed), pp 206-212.
New York: Wiley-Liss.
Hide I et al. (2000) Extracellular ATP triggers tumor necrosis factor-alpha release from rat
microglia. J Neurochem 75:965-972.
Hinterkeuser S et al. (2000) Astrocytes in the hippocampus of patients with temporal lobe
epilepsy display changes in potassium conductances. Eur J Neurosci 12:2087-2096.
Hirasawa T et al. (2005) Visualization of microglia in living tissues using Iba1-EGFP
transgenic mice. J Neurosci Res 81:357-362.
Honda S et al. (2001) Extracellular ATP or ADP induce chemotaxis of cultured microglia
through Gi/o-coupled P2Y receptors. J Neurosci 21:1975-1982.
Hoppe D, Kettenmann H (1989) GABA triggers a Cl- efflux from cultured mouse
oligodendrocytes. Neurosci Lett 97:334-339.
Horio Y (2001) Potassium channels of glial cells: distribution and function. Jpn J Pharmacol
87:1-6.
Hutcheon B et al. (2000) Developmental change in GABAA receptor desensitization
kinetics and its role in synapse function in rat cortical neurons. J Physiol 522 Pt 1:3-17.
Ifuku M et al. (2007) Bradykinin-induced microglial migration mediated by B1-bradykinin
receptors depends on Ca2+ influx via reverse-mode activity of the Na+/Ca2+ exchanger. J
Neurosci 27:13065-13073.
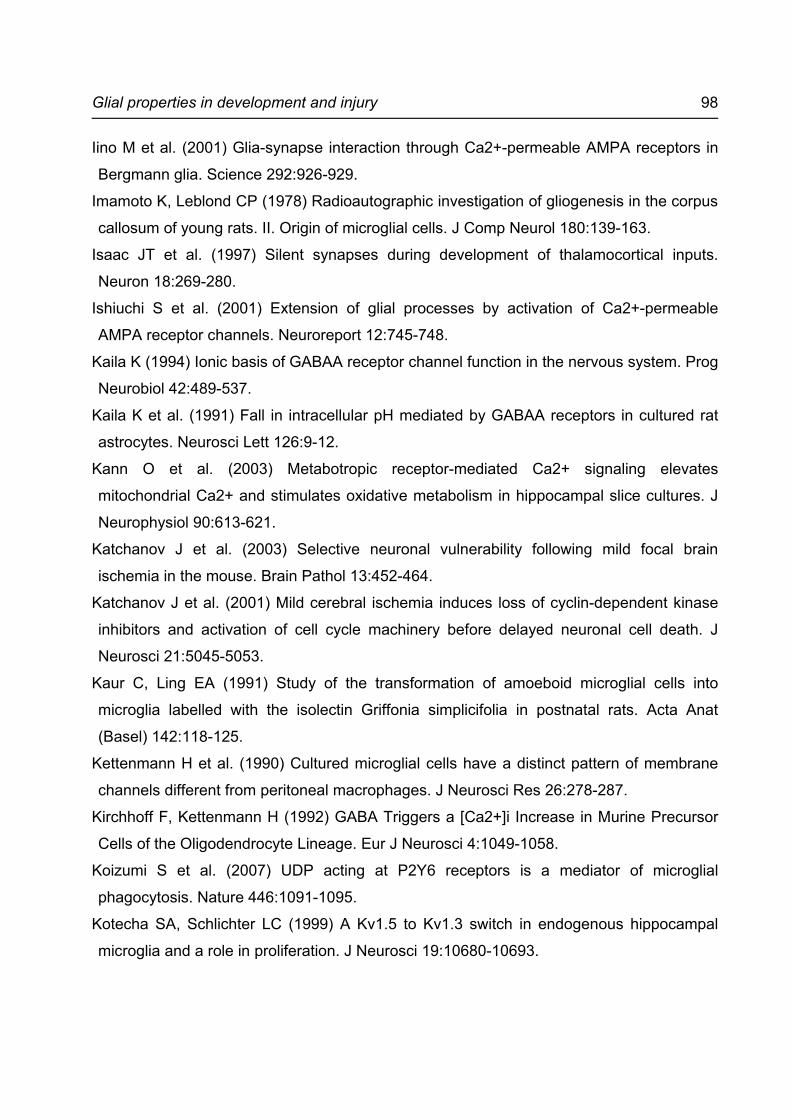
Glial properties in development and injury 98
Iino M et al. (2001) Glia-synapse interaction through Ca2+-permeable AMPA receptors in
Bergmann glia. Science 292:926-929.
Imamoto K, Leblond CP (1978) Radioautographic investigation of gliogenesis in the corpus
callosum of young rats. II. Origin of microglial cells. J Comp Neurol 180:139-163.
Isaac JT et al. (1997) Silent synapses during development of thalamocortical inputs.
Neuron 18:269-280.
Ishiuchi S et al. (2001) Extension of glial processes by activation of Ca2+-permeable
AMPA receptor channels. Neuroreport 12:745-748.
Kaila K (1994) Ionic basis of GABAA receptor channel function in the nervous system. Prog
Neurobiol 42:489-537.
Kaila K et al. (1991) Fall in intracellular pH mediated by GABAA receptors in cultured rat
astrocytes. Neurosci Lett 126:9-12.
Kann O et al. (2003) Metabotropic receptor-mediated Ca2+ signaling elevates
mitochondrial Ca2+ and stimulates oxidative metabolism in hippocampal slice cultures. J
Neurophysiol 90:613-621.
Katchanov J et al. (2003) Selective neuronal vulnerability following mild focal brain
ischemia in the mouse. Brain Pathol 13:452-464.
Katchanov J et al. (2001) Mild cerebral ischemia induces loss of cyclin-dependent kinase
inhibitors and activation of cell cycle machinery before delayed neuronal cell death. J
Neurosci 21:5045-5053.
Kaur C, Ling EA (1991) Study of the transformation of amoeboid microglial cells into
microglia labelled with the isolectin Griffonia simplicifolia in postnatal rats. Acta Anat
(Basel) 142:118-125.
Kettenmann H et al. (1990) Cultured microglial cells have a distinct pattern of membrane
channels different from peritoneal macrophages. J Neurosci Res 26:278-287.
Kirchhoff F, Kettenmann H (1992) GABA Triggers a [Ca2+]i Increase in Murine Precursor
Cells of the Oligodendrocyte Lineage. Eur J Neurosci 4:1049-1058.
Koizumi S et al. (2007) UDP acting at P2Y6 receptors is a mediator of microglial
phagocytosis. Nature 446:1091-1095.
Kotecha SA, Schlichter LC (1999) A Kv1.5 to Kv1.3 switch in endogenous hippocampal
microglia and a role in proliferation. J Neurosci 19:10680-10693.

Glial properties in development and injury 99
Kronenberg G et al. (2005) Nestin-expressing cells divide and adopt a complex
electrophysiologic phenotype after transient brain ischemia. J Cereb Blood Flow Metab
25:1613-1624.
Kubo Y et al. (1993) Primary structure and functional expression of a mouse inward
rectifier potassium channel. Nature 362:127-133.
Kuhn SA et al. (2004) Microglia express GABA(B) receptors to modulate interleukin
release. Mol Cell Neurosci 25:312-322.
Kullmann DM et al. (1996) LTP of AMPA and NMDA receptor-mediated signals: evidence
for presynaptic expression and extrasynaptic glutamate spill-over. Neuron 17:461-474.
Kuner T, Augustine GJ (2000) A genetically encoded ratiometric indicator for chloride:
capturing chloride transients in cultured hippocampal neurons. Neuron 27:447-459.
Ladeby R et al. (2005) Microglial cell population dynamics in the injured adult central
nervous system. Brain Res Brain Res Rev 48:196-206.
Laing KJ, Secombes CJ (2004) Chemokines. Dev Comp Immunol 28:443-460.
Lawson LJ et al. (1992) Turnover of resident microglia in the normal adult mouse brain.
Neuroscience 48:405-415.
Lazarini F et al. (2000) Differential signalling of the chemokine receptor CXCR4 by stromal
cell-derived factor 1 and the HIV glycoprotein in rat neurons and astrocytes. Eur J
Neurosci 12:117-125.
Lin JH et al. (1998) Gap-junction-mediated propagation and amplification of cell injury. Nat
Neurosci 1:494-500.
Ling EA (1979) Transformation of monocytes into amoeboid microglia in the corpus
callosum of postnatal rats, as shown by labelling monocytes by carbon particles. J Anat
128:847-858.
Ling EA, Tan CK (1974) Amoeboid microglial cells in the corpus callosum of neonatal rats.
Arch Histol Jpn 36:265-280.
Ling EA, Wong WC (1993) The origin and nature of ramified and amoeboid microglia: a
historical review and current concepts. Glia 7:9-18.
Ma Q et al. (1998) Impaired B-lymphopoiesis, myelopoiesis, and derailed cerebellar neuron
migration in CXCR4- and SDF-1-deficient mice. Proc Natl Acad Sci U S A 95:9448-9453.

Glial properties in development and injury 100
MacFarlane SN, Sontheimer H (1997) Electrophysiological changes that accompany
reactive gliosis in vitro. J Neurosci 17:7316-7329.
Maciejewski-Lenoir D et al. (1999) Characterization of fractalkine in rat brain cells:
migratory and activation signals for CX3CR-1-expressing microglia. J Immunol 163:1628-
1635.
Mallat M, Chamak B (1994) Brain macrophages: neurotoxic or neurotrophic effector cells?
J Leukoc Biol 56:416-422.
Marandi N et al. (2002) Two-photon chloride imaging in neurons of brain slices. Pflugers
Arch 445:357-365.
Maric D et al. (2001) GABA expression dominates neuronal lineage progression in the
embryonic rat neocortex and facilitates neurite outgrowth via GABA(A) autoreceptor/Cl-
channels. J Neurosci 21:2343-2360.
Marin-Teva JL et al. (1999) Proliferation of actively migrating ameboid microglia in the
developing quail retina. Anat Embryol (Berl) 200:289-300.
Martina M et al. (2001) Cell-type-specific GABA responses and chloride homeostasis in the
cortex and amygdala. J Neurophysiol 86:2887-2895.
Matthias K et al. (2003) Segregated expression of AMPA-type glutamate receptors and
glutamate transporters defines distinct astrocyte populations in the mouse hippocampus. J
Neurosci 23:1750-1758.
Maurer M, von Stebut E (2004) Macrophage inflammatory protein-1. Int J Biochem Cell Biol
36:1882-1886.
McManus CM et al. (1998) Cytokine induction of MIP-1 alpha and MIP-1 beta in human
fetal microglia. J Immunol 160:1449-1455.
Menten P et al. (2002) Macrophage inflammatory protein-1. Cytokine Growth Factor Rev
13:455-481.
Milligan CE et al. (1991) Differential immunochemical markers reveal the normal
distribution of brain macrophages and microglia in the developing rat brain. J Comp
Neurol 314:125-135.
Mitani A, Tanaka K (2003) Functional changes of glial glutamate transporter GLT-1 during
ischemia: an in vivo study in the hippocampal CA1 of normal mice and mutant mice
lacking GLT-1. J Neurosci 23:7176-7182.

Glial properties in development and injury 101
Miyamoto Y, Kim SU (1999) Cytokine-induced production of macrophage inflammatory
protein-1alpha (MIP-1alpha) in cultured human astrocytes. J Neurosci Res 55:245-251.
Montana V et al. (2006) Vesicular transmitter release from astrocytes. Glia 54:700-715.
Muller T et al. (1994) Developmental regulation of voltage-gated K+ channel and GABAA
receptor expression in Bergmann glial cells. J Neurosci 14:2503-2514.
Muller W et al. (1989) gamma-Aminobutyric acid-induced ion movements in the guinea pig
hippocampal slice. Brain Res 484:184-191.
Murdoch C, Finn A (2000) Chemokine receptors and their role in inflammation and
infectious diseases. Blood 95:3032-3043.
Nakase T et al. (2003a) Astrocytic gap junctions composed of connexin 43 reduce
apoptotic neuronal damage in cerebral ischemia. Stroke 34:1987-1993.
Nakase T et al. (2003b) Neuroprotective role of astrocytic gap junctions in ischemic stroke.
Cell Commun Adhes 10:413-417.
Navascues J et al. (2000) Entry, dispersion and differentiation of microglia in the
developing central nervous system. An Acad Bras Cienc 72:91-102.
Nimmerjahn A et al. (2005) Resting microglial cells are highly dynamic surveillants of brain
parenchyma in vivo. Science 308:1314-1318.
Noda M et al. (2006) Anti-inflammatory effects of kinins via microglia in the central nervous
system. Biol Chem 387:167-171.
Noda M et al. (2000) AMPA-kainate subtypes of glutamate receptor in rat cerebral
microglia. J Neurosci 20:251-258.
Nolte C et al. (1996) Complement 5a controls motility of murine microglial cells in vitro via
activation of an inhibitory G-protein and the rearrangement of the actin cytoskeleton.
Neuroscience 73:1091-1107.
Nolte C et al. (2001) GFAP promoter-controlled EGFP-expressing transgenic mice: a tool
to visualize astrocytes and astrogliosis in living brain tissue. Glia 33:72-86.
Norenberg W et al. (1992) Inflammatory stimuli induce a new K+ outward current in
cultured rat microglia. Neurosci Lett 147:171-174.
Norenberg W et al. (1994) Voltage-dependent potassium channels in activated rat
microglia. J Physiol 475:15-32.
Glial properties in development and injury 102
Ottersen OP et al. (1996) Ischemic disruption of glutamate homeostasis in brain:
quantitative immunocytochemical analyses. J Chem Neuroanat 12:1-14.
Owen-Lynch PJ et al. (1998) The growth inhibitory role and potential clinical value of
macrophage inflammatory protein 1 alpha in myeloid leukaemias. Leuk Lymphoma 30:41-
53.
Owens DF, Kriegstein AR (2002) Is there more to GABA than synaptic inhibition? Nat Rev
Neurosci 3:715-727.
Pannasch U et al. (2006) The potassium channels Kv1.5 and Kv1.3 modulate distinct
functions of microglia. Mol Cell Neurosci 33:401-411.
Patneau DK, Mayer ML (1990) Structure-activity relationships for amino acid transmitter
candidates acting at N-methyl-D-aspartate and quisqualate receptors. J Neurosci
10:2385-2399.
Pearson HE et al. (1993) Microglial invasion and activation in response to naturally
occurring neuronal degeneration in the ganglion cell layer of the postnatal cat retina. Brain
Res Dev Brain Res 76:249-255.
Perez Velazquez JL et al. (2003) Gap junctions and neuronal injury: protectants or
executioners? Neuroscientist 9:5-9.
Perillan PR et al. (1999) K(+) inward rectifier currents in reactive astrocytes from adult rat
brain. Glia 27:213-225.
Perillan PR et al. (2000) Inward rectifier K(+) channel Kir2.3 (IRK3) in reactive astrocytes
from adult rat brain. Glia 31:181-192.
Perry VH, Gordon S (1991) Macrophages and the nervous system. Int Rev Cytol 125:203-
244.
Perry VH et al. (1985) Immunohistochemical localization of macrophages and microglia in
the adult and developing mouse brain. Neuroscience 15:313-326.
Phillis JW et al. (1996) Changes in extracellular amino acid neurotransmitters and purines
during and following ischemias of different durations in the rat cerebral cortex. Neurochem
Int 29:115-120.
Phillis JW et al. (2000) Transporter reversal as a mechanism of glutamate release from the
ischemic rat cerebral cortex: studies with DL-threo-beta-benzyloxyaspartate. Brain Res
868:105-112.

Glial properties in development and injury 103
Pin JP, Duvoisin R (1995) The metabotropic glutamate receptors: structure and functions.
Neuropharmacology 34:1-26.
Pocock JM, Kettenmann H (2007) Neurotransmitter receptors on microglia. Trends
Neurosci 30:527-535.
Prinz M et al. (1999) Microglial activation by components of gram-positive and -negative
bacteria: distinct and common routes to the induction of ion channels and cytokines. J
Neuropathol Exp Neurol 58:1078-1089.
Provis JM et al. (1996) Microglia in human retina: a heterogeneous population with distinct
ontogenies. Perspect Dev Neurobiol 3:213-222.
Pujol F et al. (2005) The chemokine SDF-1 differentially regulates axonal elongation and
branching in hippocampal neurons. J Cell Sci 118:1071-1080.
Rappert A et al. (2002) Secondary lymphoid tissue chemokine (CCL21) activates CXCR3
to trigger a Cl- current and chemotaxis in murine microglia. J Immunol 168:3221-3226.
Rezaie P et al. (2002a) Expression of beta-chemokines and chemokine receptors in human
fetal astrocyte and microglial co-cultures: potential role of chemokines in the developing
CNS. Glia 37:64-75.
Rezaie P et al. (2002b) Motility and ramification of human fetal microglia in culture: an
investigation using time-lapse video microscopy and image analysis. Exp Cell Res
274:68-82.
Ringheim GE (1995) Mitogenic effects of interleukin-5 on microglia. Neurosci Lett 201:131-
134.
Robinson S et al. (1998) The chemokine growth-regulated oncogene-alpha promotes
spinal cord oligodendrocyte precursor proliferation. J Neurosci 18:10457-10463.
Rossi DJ et al. (2000) Glutamate release in severe brain ischaemia is mainly by reversed
uptake. Nature 403:316-321.
Rossi DJ et al. (2007) Astrocyte metabolism and signaling during brain ischemia. Nat
Neurosci 10:1377-1386.
Rostene W et al. (2007) Chemokines: a new class of neuromodulator? Nat Rev Neurosci
8:895-903.
Schilling T et al. (2000) Upregulation of Kv1.3 K(+) channels in microglia deactivated by
TGF-beta. Am J Physiol Cell Physiol 279:C1123-1134.

Glial properties in development and injury 104
Schipke CG et al. (2002) Astrocyte Ca2+ waves trigger responses in microglial cells in
brain slices. FASEB J 16:255-257.
Schlichter LC et al. (1996) Properties of K+ and Cl- channels and their involvement in
proliferation of rat microglial cells. Glia 17:225-236.
Seifert G, Steinhauser C (1995) Glial cells in the mouse hippocampus express AMPA
receptors with an intermediate Ca2+ permeability. Eur J Neurosci 7:1872-1881.
Silver IA et al. (1997) Ion homeostasis in brain cells: differences in intracellular ion
responses to energy limitation between cultured neurons and glial cells. Neuroscience
78:589-601.
Siushansian R et al. (2001) Connexin43 null mutation increases infarct size after stroke. J
Comp Neurol 440:387-394.
Skrzydelski D et al. (2007) The chemokine stromal cell-derived factor-1/CXCL12 activates
the nigrostriatal dopamine system. J Neurochem 102:1175-1183.
Standen NB, Stanfield PR (1979) Potassium depletion and sodium block of potassium
currents under hyperpolarization in frog sartorius muscle. J Physiol 294:497-520.
Steinhauser C et al. (1994) Properties of GABA and glutamate responses in identified glial
cells of the mouse hippocampal slice. Hippocampus 4:19-35.
Steinhauser C et al. (1992) Heterogeneity in the Membrane Current Pattern of Identified
Glial Cells in the Hippocampal Slice. Eur J Neurosci 4:472-484.
Streit WJ et al. (1988) Functional plasticity of microglia: a review. Glia 1:301-307.
Streit WJ et al. (1999) Reactive microgliosis. Prog Neurobiol 57:563-581.
Sugita Y et al. (1997) Pigment epithelium-derived factor (PEDF) has direct effects on the
metabolism and proliferation of microglia and indirect effects on astrocytes. J Neurosci
Res 49:710-718.
Suzuki T et al. (2004) Production and release of neuroprotective tumor necrosis factor by
P2X7 receptor-activated microglia. J Neurosci 24:1-7.
Suzumura A et al. (1994) Interleukin-4 induces proliferation and activation of microglia but
suppresses their induction of class II major histocompatibility complex antigen expression.
J Neuroimmunol 53:209-218.
Tanabe S et al. (1997) Murine astrocytes express a functional chemokine receptor. J
Neurosci 17:6522-6528.

Glial properties in development and injury 105
Tanaka J et al. (1999) Morphological differentiation of microglial cells in culture:
involvement of insoluble factors derived from astrocytes. Neurosci Res 34:207-215.
Taylor DL et al. (2003) Activation of microglial group III metabotropic glutamate receptors
protects neurons against microglial neurotoxicity. J Neurosci 23:2150-2160.
Taylor DL et al. (2005) Stimulation of microglial metabotropic glutamate receptor mGlu2
triggers tumor necrosis factor alpha-induced neurotoxicity in concert with microglial-
derived Fas ligand. J Neurosci 25:2952-2964.
Thery C et al. (1991) Cytotoxic Effect of Brain Macrophages on Developing. Eur J Neurosci
3:1155-1164.
Tran PB et al. (2004) Chemokine receptors are expressed widely by embryonic and adult
neural progenitor cells. J Neurosci Res 76:20-34.
Verkhratsky A, Steinhauser C (2000) Ion channels in glial cells. Brain Res Brain Res Rev
32:380-412.
von Blankenfeld G, Kettenmann H (1991) Glutamate and GABA receptors in vertebrate
glial cells. Mol Neurobiol 5:31-43.
Von Blankenfeld G et al. (1991) Expression and Developmental Regulation of a GABAA
Receptor in Cultured Murine Cells of the Oligodendrocyte Lineage. Eur J Neurosci 3:310-
316.
Wallraff A et al. (2004) Distinct types of astroglial cells in the hippocampus differ in gap
junction coupling. Glia 48:36-43.
Walz W, Bekar LK (2001) Ion channels in cultured microglia. Microsc Res Tech 54:26-33.
Xu J et al. (1993) Variation with age in the labelling of amoeboid microglial cells in rats
following intraperitoneal or intravenous injection of a fluorescent dye. J Anat 182 ( Pt
1):55-63.
Zhou M, Kimelberg HK (2001) Freshly isolated hippocampal CA1 astrocytes comprise two
populations differing in glutamate transporter and AMPA receptor expression. J Neurosci
21:7901-7908.

Glial properties in development and injury 106
Curriculum Vitae
Mein Lebenslauf wird aus datenschutzrechtlichen Gründen in der elektronischen Version
meiner Arbeit nicht veröffentlicht.

Glial properties in development and injury 107
Publications
Wang L*, Cheung G*, Kronenberg G, Gertz K, Ji S, Kempermann G, Endres M, Kettenmann H. Mild brain ischemia induces unique physiological properties in striatal astrocytes. Glia, (2008, in press)
Cheung G, Kann O, Färber K, Kettenmann H. GABAA receptor activity in postnatal mouse brain enhances macrophage inflammatory protein 1 alpha release and microglial motility. (2008, in preparation)
Klempin F, Kronenberg G, Cheung G, Kettenmann H, Kempermann G. Investigation into the properties of doublecortin-expressing cells in the adult mouse piriform cortex as compared to the dentate gyrus. (2008, in preparation)
Färber K, Cheung G, Mitchell D, Wallis R, Kettenmann H. Complement C1q is a proinflammatory stimulus, and mannose-binding lectin is an anti-inflammatory stimulus, for microglia activation. J Neurosci Res (2008, submitted)
Ifuku M, Färber K, Okuno Y, Yamakawa Y, Miyamoto T, Nolte C, Merrino VF, Kita S, Iwamoto T, Komuro I, Wang B, Cheung G, Ishikawa E, Ooboshi H, Bader M, Wada K, Kettenmann H, Noda M. Bradykinin-induced microglial migration mediated by B1-bradykinin receptors depends on Ca2+ influx via reverse-mode activity of the Na+/Ca2+ exchanger. Journal of Neuroscience. 27: 13065-13073, 2007
Babu H, Cheung G, Kettenmann H, Palmer TD, Kempermann G. Enriched monolayer precursor cell cultures from micro-dissected adult mouse dentate gyrus yield functional granule cell-like neurons. PLoS ONE. 2:e388, 2007
* Authors contributed equally

Glial properties in development and injury 108
Meetings and Presentations
Cheung G, Kann O, Färber K, Kettenmann H. Ameboid microglia in developing brain indirectly respond to GABA- and glutamatergic activities by sensing the resulting increase in extracellular potassium (FENS Forum 2008-submitted abstract, Geneva, Switzerland). Cheung G, Kann O, Färber K, Kettenmann H. Ameboid microglia in developing brain indirectly respond to GABA- and glutamatergic activities by sensing the resulting increase in extracellular potassium (Berlin Neuroscience Forum 2008-submitted abstract, Bad Liebenwalde, Germany). Cheung G, Kann O, Färber K, Kettenmann H. Ameboid microglia in developing brain sense GABAA and glutamate receptor activities by intrinsic potassium channels (Berlin Brain Days 2007-poster, Berlin, Germany). Cheung G, Wang LP, Kronenberg G, Gertz K, Ji Shengbo, Kempermann G, Endres M, Kettenmann H. Unique physiological properties in striatal astrocytes induced by mild stroke (SFN 2007-poster, San Diego, USA). Cheung G, Färber K, Kann O, Kettenmann H. Microglia respond indirectly to GABAergic stimulation in early postnatal corpus callosum (Euroglia 2007-poster, London, UK). Cheung G, Färber K, Kann O, Kettenmann H. Microglia respond indirectly to GABAergic stimulation in early postnatal corpus callosum (Berlin Brain Days 2006-poster, Berlin, Germany). Cheung G, Färber K, Kann O, Kettenmann H. Microglia respond indirectly to GABAergic stimulation in early postnatal corpus callosum (MDC PhD Retreat 2006-poster, Berlin, Germany). Cheung G, Färber K, Kettenmann H. Response of microglia to GABAergic stimulation in early postnatal corpus callosum. (Berlin Neuroscience Forum 2006-poster, Bad Liebenwalde, Germany). Cheung G, Färber K, Kettenmann H. Response of microglia to GABAergic stimulation. (Berlin Brain Days 2005-poster, Berlin, Germany). Cheung G, Färber K, Kettenmann H. Response of microglial cells to GABAA receptor stimulation. (MDC PhD Retreat 2005-poster, Berlin, Germany).

Glial properties in development and injury 109
Erklärung
„Ich, Giselle Cheung, erkläre, dass ich die vorgelegte Dissertationsschrift mit dem Thema:
Properties and functions of glial cells in the developing and injured brains selbst verfasst
und keine anderen als die angegebenen Quellen und Hilfsmittel benutzt, ohne die
(unzulässige) Hilfe Dritter verfasst und auch in Teilen keine Kopien anderer Arbeiten
dargestellt habe.“
Berlin, den ______________________
Giselle Cheung