Proof-of-Concept of the Phytoimmobilization Technology for TNX
99
WSRC-TR-2001-00032, REV. 0 Key Words: Phytoremediation, Ac, Co, Cr, Hg, Pb, Ra, Th, U, Stabilization, Wetlands, Apatite, Zeolite, Metallic Iron, Water Oak, Tupelo, Cypress, Loblolly Pine, Red Maple, Ferns Retention: Permanent Proof-of-Concept of the Phytoimmobilization Technology for TNX Outfall Delta: Final Report Daniel I. Kaplan (1) , Anna S. Knox (2) , Thomas G. Hinton (2) , Rebecca R. Sharitz (2) , Bruce P. Allen (2) , Steven M. Serkiz (1) (1) Westinghouse Savannah River Company (2) Savannah River Ecology Laboratory March 19, 2001 Westinghouse Savannah River Company Savannah River Site Aiken, SC 29808 Prepared for the U.S. Department of Energy Under Contract Number DE-AC09-96SR18500
Transcript of Proof-of-Concept of the Phytoimmobilization Technology for TNX

WSRC-TR-2001-00032, REV. 0
Key Words: Phytoremediation, Ac, Co, Cr, Hg, Pb, Ra, Th,U, Stabilization, Wetlands, Apatite, Zeolite, Metallic Iron,Water Oak, Tupelo, Cypress, Loblolly Pine, Red Maple, FernsRetention: Permanent
Proof-of-Concept of the Phytoimmobilization Technology forTNX Outfall Delta: Final Report
Daniel I. Kaplan(1), Anna S. Knox(2), Thomas G. Hinton(2),Rebecca R. Sharitz(2), Bruce P. Allen(2), Steven M. Serkiz(1)
(1) Westinghouse Savannah River Company(2) Savannah River Ecology Laboratory
March 19, 2001
Westinghouse Savannah River CompanySavannah River SiteAiken, SC 29808
Prepared for the U.S. Department of Energy UnderContract Number DE-AC09-96SR18500
This document was prepared in conjunction with work accomplished under Contract No.DE-AC09-96SR18500 with the U.S. Department of Energy.
DISCLAIMER
This report was prepared as an account of work sponsored by an agency of the United States Government.Neither the United States Government nor any agency thereof, nor any of their employees, makes anywarranty, express or implied, or assumes any legal liability or responsibility for the accuracy,completeness, or usefulness of any information, apparatus, product or process disclosed, or represents thatits use would not infringe privately owned rights. Reference herein to any specific commercial product,process or service by trade name, trademark, manufacturer, or otherwise does not necessarily constitute orimply its endorsement, recommendation, or favoring by the United States Government or any agencythereof. The views and opinions of authors expressed herein do not necessarily state or reflect those of theUnited States Go vernment or any agency thereof.
This report has been reproduced directl y from the best available copy.
Available for sale to the public, in paper, from: U.S. Department of Commerce, National TechnicalInformation Service, 5285 Port Roy al Road, Springfield, VA 22161, phone: (800)553-6847, fax: (703) 605-6900, email: [email protected] online ordering:http://www.ntis.gov/ordering.htm
Available electronically at http://www.doe.gov/bridge
Available for a processing fee to U.S. Department of Energy and its contractors, in paper, from: U.S.Department of Energy, Office of Scientific and Tech nical Information, P.O. Box 62, Oak Ridge, TN37831-0062, phone: (865 ) 576-8401, fax: (865) 576-5728, email: [email protected]

WSRC-TR-2001-00032, REV. 0
Page 1
Key Words: Phytoremediation, Ac, Co, Cr, Hg, Pb, Ra, Th,U, Stabilization, Wetlands, Apatite, Zeolite, Metallic Iron,Water Oak, Tupelo, Cypress, Loblolly Pine, Red Maple, FernsRetention: Permanent
Proof-of-Concept of the Phytoimmobilization Technology forTNX Outfall Delta: Final Report
Daniel I. Kaplan(1), Anna S. Knox(2), Thomas G. Hinton(2),Rebecca R. Sharitz(2), Bruce P. Allen(2), Steven M. Serkiz(1)
(1) Westinghouse Savannah River Company(2) Savannah River Ecology Laboratory
March 19, 2001
Westinghouse Savannah River CompanySavannah River SiteAiken, SC 29808
Prepared for the U.S. Department of Energy UnderContract Number DE-AC09-96SR18500

WSRC-TR-2001-00032, REV. 0
Page 2
REVIEWS AND APPROVALS
___________________________________________________________________________
Daniel I. Kaplan, Co-author, Waste Processing Technology Date
___________________________________________________________________________
Anna S. Knox, Co-author, Savannah River Ecology Laboratory Date
___________________________________________________________________________
Thomas G. Hinton, Co-author, Savannah River Ecology Laboratory Date
___________________________________________________________________________
Rebecca R. Sharitz, Co-author, Savannah River Ecology Laboratory Date
___________________________________________________________________________
Bruce P. Allen, Co-author, Savannah River Ecology Laboratory Date
___________________________________________________________________________
Steven M. Serkiz, Co-author, Waste Processing Technology Date
___________________________________________________________________________
B. Thomas Butcher, Level 4 Manager, Waste Processing Technology Date
___________________________________________________________________________
Gary Iversen, Design Check, Waste Processing Technology Date

WSRC-TR-2001-00032, REV. 0
Page 3
TABLE OF CONTENTS
TABLE OF CONTENTS........................................................................................................3LIST OF FIGURES.................................................................................................................4LIST OF TABLES...................................................................................................................51.0 Executive Summary...........................................................................................................72.0 Introduction .......................................................................................................................9
2.1 Background.....................................................................................................................92.2 Objectives......................................................................................................................142.3 Scope..............................................................................................................................182.4 Status .............................................................................................................................19
3.0 Materials and Methods ...................................................................................................213.1 Plants and Soil Field Survey at the TNX OD Site .....................................................213.2 Plant Uptake Greenhouse Experiment.......................................................................253.3 Leaf Leaching Experiment ..........................................................................................253.4 Geomat Efficiency Laboratory Experiment ..............................................................263.5 Geomat Efficiency Field Experiment .........................................................................273.6 Geochemistry & Sorption Experiment.......................................................................273.7 Modeling Phytoimmobilization...................................................................................28
4.0 Results and Discussion ....................................................................................................284.1 Plant and Soil Field Survey at the TNX OD Site.......................................................28
4.1.1 Annual Biomass Estimates....................................................................................284.1.2 Plant Species Abundance ......................................................................................30
4.2 Field Survey of Plant and Soil Contaminant Concentrations ..................................334.2.1 Soil Properties at the TNX OD .............................................................................344.2.2 Contaminant Uptake by Plants Growing in the TNX OD .................................36
4.3 Plant Uptake Greenhouse Experiment.......................................................................564.4 Leaf Leaching Experiment ..........................................................................................624.5 Geomat Efficiency Laboratory Experiment ..............................................................624.6 Geomat Efficiency Field Experiment .........................................................................654.7 Modeling Phytoimmobilization...................................................................................65
4.7.1 Abbreviated Mass-Balance Model .......................................................................654.7.2 Linear-Kinetic Reservoir Model...........................................................................75
5.0 Conclusions ......................................................................................................................796.0 References ........................................................................................................................807.0 Appendix A: Additional Data........................................................................................838.0 Appendix B: Email Transmission Entitled TNX OD Clean Up Levels, by Karen
Conner, 10/24/00 ........................................................................................................899.0 Appendix C: Abbreviated Mass-Balance Calculations Evaluating
Phytoimmobilization Application at the TNX OD Site..........................................9210.0 Distribution ....................................................................................................................97
WSRC-TR-2001-00032, REV. 0
Page 4
LIST OF FIGURES
Figure 1. Simplified cross sectional view of the TNX Outfall Delta operable unit. ..............10Figure 2. First step in phytoimmobilization, phytoextraction, involves extraction of the
sediment contaminant, followed by translocation of the contaminant into the aboveground plant parts. ............................................................................................................12
Figure 3. Second step in phytoimmobilization, sequestration, involves immobilizing thecontaminants leached from plant litter material within a sequestering agent. ..................13
Figure 4. Emplacement of the sequestering agent can be either (A), incorporated into thecontaminated sediment surface, or (B) in the geomat configuration. ...............................14
Figure 5. Contaminant reservoirs included in the linear-kinetic reservoir model. .................16Figure 6. Example of the type of output that the linear-kinetic reservoir model produces
(COC stands for constituent of concern). .........................................................................17Figure 7. Experiments conducted and their relation to the linear-kinetic reservoir model. ...18Figure 8. Plant tissue and soil sampling locations at the TNX OD........................................23Figure 9. Litter Basket locations at the TNX-OD. .................................................................24Figure 10. Elemental concentrations in netted-chain ferns as a function of harvesting date. 55Figure 11. Predicted soil Ra-228 activity as a function of years of phytoimmobilization
remediation at the TNX OD site (volume of remediated soil = 4214 m3; target 10e-6 riskclean up level indicated with dotted line). ........................................................................69
Figure 12. Predicted soil Pb-212 activity as a function of years of phytoimmobilizationremediation at the TNX OD site (volume of remediated soil = 4214 m3; target 10e-6 riskclean up level indicated with dotted line). ........................................................................70
Figure 13. Predicted soil Th-228 activity as a function of years of phytoimmobilizationremediation at the TNX OD site (volume of remediated soil = 4214 m3; target 10e-6 riskclean up level indicated with dotted line). ........................................................................71
Figure 14. Predicted soil U-235 activity as a function of years of phytoimmobilizationremediation at the TNX OD site (volume of remediated soil = 4214 m3; target 10e-6 riskclean up level indicated with dotted line). ........................................................................72
Figure 15. Predicted soil U-238 activity as a function of years of phytoimmobilizationremediation at the TNX OD site (volume of remediated soil = 4214 m3; target 10e-6 riskclean up level indicated with dotted line). ........................................................................73
Figure 16. Predicted soil Ac-228 activity as a function of years of phytoimmobilizationremediation at the TNX OD site (volume of remediated soil = 4214 m3; target 10e-6 riskclean up level was not calculated). ...................................................................................74
Figure 17. Linear-kinetic Reservoir Model of Phytoimmobilization at the TNX OD Site. ...76

WSRC-TR-2001-00032, REV. 0
Page 5
LIST OF TABLES
Table 1. Status and reporting of project tasks. .......................................................................20Table 2. Experimental matrix for the Geomat Efficiency Field Experiment. ........................27Table 3. Leaf litter mass collected on March 15, 2000 from sampling baskets placed in 40
locations in the contaminated area and 6 locations in the uncontaminated area. .............29Table 4. Annual leaf-litter biomass estimates for leaves at the TNX OD. .............................30Table 5. Species-composition of leaf litter (wt-%) (Table continues in Table 6). .................31Table 6. Specie-composition of leaf litter (%-g species/100-g total leaf litter) (Table
continues in Table 5).........................................................................................................32Table 7. Mass of leaves of plant species collected from 21-leaf litter baskets located in the
contaminated portion of the TNX OD. .............................................................................33Table 8. Soil characterization of an uncontaminated background soil collected from
coordinate BGCH05 and a contaminated soil collected from coordinate A-5. ................35Table 9. Elemental Composition (µg/g) of an uncontaminated background soil collected from
coordinate BGCH05 and a contaminated soil collected from coordinate A-5. ................35Table 10. Elemental composition and total concentration ratio (plant concentration/total soil
concentration) of plants collected from coordinate A-5 within the TNX OD onNovember 11, 1999...........................................................................................................36
Table 11. Correlation coefficients (r) between concentration ratios and soil concentrations.37Table 12. COCs concentrations (mg/kg dry wt.) of leaves recovered from the TNX-OD
study site (table continues on next page). .........................................................................40Table 13. Correlation coefficients (r) between Mn or Fe and COC total concentration ratios
(CR-T)...............................................................................................................................43Table 14. Total soil and plant concentrations (mg/kg; dry wt.) and total concentration ratios
(CR-T; plant conc./total soil conc.) (table continues on following page).........................44Table 15. Average total concentration ratios (CR-T; plant conc./total soil conc.) values. ....47Table 16. COC concentrations (mg/kg; dry weight) and total concentration ratios (CR-T;
plant conc./total soil conc.) from leaves and soils collected from coordinate A-5 at theTNX-OD study site. ..........................................................................................................49
Table 17. COC concentrations (mg/kg; dry weight) and total concentration ratios (CR-T;plant conc./total soil conc.) from leaves and soils collected from coordinate B-3 at theTNX-OD study site. ..........................................................................................................50
Table 18. COC concentrations (mg/kg; dry weight) and total concentration ratios (CR-T;plant conc./total soil conc.) from leaves and soils collected from coordinate C-5 at theTNX-OD study site. ..........................................................................................................51
Table 19. COCs concentration in four fern plants (mg/kg; dry weight) collected at the TNXOD study site. ...................................................................................................................53
Table 20. Total concentration ratios (plant conc./total soil conc.) in four fern plants collectedat the TNX OD study site. ................................................................................................54
Table 21. Greenhouse study of netted-chain fern in non-contaminated background soil: totalsoil (Soil-T) and available soil (Soil-A) COC concentrations (mg/kg), tissueconcentrations (mg/kg), and concentration ratios (CR-T; plant conc./soil conc.). ...........57

WSRC-TR-2001-00032, REV. 0
Page 6
Table 22. Greenhouse study of netted-chain fern in contaminated B-5 soil: total soil (Soil-T)and available soil (Soil-A) COC concentrations (mg/kg), tissue concentrations (mg/kg),and concentration ratios (CR-T; plant conc./soil conc.). ..................................................58
Table 23. Greenhouse study of netted-chain fern in contaminated C-5 soil: total soil (Soil-T)and available soil (Soil-A) COC concentrations (mg/kg), tissue concentrations (mg/kg),and concentration ratios (CR-T; plant conc./soil conc.). ..................................................58
Table 24. Greenhouse study of Bermuda grass in non-contaminated background soil: totalsoil (Soil-T) and available soil (Soil-A) COC concentrations (mg/kg), tissueconcentrations (mg/kg), and concentration ratios (CR-T; plant conc./soil conc.). ...........59
Table 25. Greenhouse study of Bermuda grass in contaminated B-5 soil: total soil (Soil-T)and available soil (Soil-A) COC concentrations (mg/kg), tissue concentrations (mg/kg),and concentration ratios (CR-T; plant conc./soil conc.). ..................................................60
Table 26. Greenhouse study of Bermuda grass in contaminated C-5: total soil (Soil-T) andavailable soil (Soil-A) COC concentrations (mg/kg), tissue concentrations (mg/kg), andconcentration ratios (CR-T; plant conc./soil conc.). .........................................................61
Table 27. Chromium distribution coefficients (Kd) for several sequestering agents in a SRSsurface water. ....................................................................................................................63
Table 28. Effect of sequestering materials on aqueous Hg concentration.(a)..........................64Table 29. Kd values (mL/g) of Co, Ba, Eu, Pb, and U for various potential sequestering
agent materials.(a) ..............................................................................................................65Table 30. Current soil inventory (Icurrent soil; Equation 3), allowable soil inventory, annual
contaminant reduction in the soil (ACRtotal; Equation 7) and the number of yearsnecessary to accomplish clean up to 10e-6 risk levels......................................................68
Table 31. Preliminary input values for the Linear-kinetic Reservoir Model ofPhytoimmobilization (additional input in next table). ......................................................77
Table 32. Preliminary input values for the Linear-kinetic Reservoir Model ofPhytoimmobilization (additional input in previous table). ...............................................78
Table 33. Scientific names of several plants referred to in this report. ..................................84Table 34. Available soil (Soil-A) and plant concentrations (mg/kg; dry weight) and available
concentration ratios (CR; plant conc./available soil conc.). .............................................85Table 35. Average available concentration ratios (CR-A; plant conc./available soil conc.)
values. ...............................................................................................................................88Table 36. Current and allowable soil activity at the study site...............................................93Table 37. Current soil inventory (Icurrent soil; Equation 1) of selected isotopes........................93Table 38. Netted-chain fern and leaf litter activity levels (Aplant i) based on soil activity
(Acurrent soil) and concentration ratio (CRplant i) data (Equation 2). .....................................94Table 39. Netted-chain fern and leaf-litter isotope inventory (Iplant i; Equation 3). ................94Table 40. Annual contaminant reduction (ACRplant i; Equations 4 and 5) in soils as a result of
plant uptake (inventory in plant/inventory in soil). ..........................................................95Table 41. Total inventory allowed based on 10e-6 risk. ........................................................95

WSRC-TR-2001-00032, REV. 0
Page 7
1.0 EXECUTIVE SUMMARY
A series of proof-of-principle studies was initiated to evaluate the soil remediationtechnology, phytoimmobilization, for application at the TNX Outfall Delta (TNX OD)operable unit. Phytoimmobilization involves two steps. The first step is entitledphytoextraction, and it takes place mostly during the spring and summer. During this stepthe plants extract contaminants from the sediment into the roots and then translocate thecontaminants to the aboveground plant parts. The second step is referred to as sequestrationand it takes place largely during the autumn and winter when annual plants senesce ordeciduous trees drop their leaves. This step involves the immobilization of the contaminantonce it leaches form the fallen leaves into a “geomat,” a geotextile embedded with mineralsequestering agents. This final report describes the results to date, including those reportedin the status report (Kaplan et al. 2000a), those completed since the report was issued, andthe preliminary calculations of the phytoimmobilization effectiveness.
Leaf litter at the site was found to contain measurable concentrations of the constituents ofconcern (COCs; actinium, cobalt, chromium, mercury, lead, radium, thorium and uranium).Equally important, the leaf litter at the site was found to have a large annual biomass, >7000kg/ha/yr. As part of a survey of the indigenous plants at the test site, it was discovered thatthe netted-chain fern (Woodwardia areolata) contained exceptionally high contaminantconcentrations of cobalt, cerium (an analog for actinium) and chromium. Contaminantconcentrations in netted-chain ferns were found to vary with the seasons. During the spring,when plant growth was greatest, all contaminant plant concentrations were their lowest.During the autumn, the season when the leaves (or in the case of ferns, the fronds) come intocontact with the geomat, the contaminant plant concentrations were their greatest. This trendin plant concentration is ideal for the phytoimmobilization technology. Among the moreabundant trees at the site, tupelo (Nyssa sylvatica var. biflora) was found to take up highconcentrations of barium (an analog for radium), cobalt, and thorium.
Greenhouse studies were conducted in which netted-chain ferns were grown in contaminatedsoils collected from the TNX OD operable unit. The netted-chain fern took up appreciablygreater concentrations of essentially all contaminants than a grass (Bermuda grass, Cynnodondactylon). The fern hyperaccumulated cobalt (defined as having a concentration ratio [plantconcentration/soil concentration] greater than unity) and had exceptionally high uptake ratiosof cadmium, chromium, cesium, mercury, lead and uranium (concentration ratios between0.1 and 1).
Laboratory studies were conducted to evaluate various sequestering agents. Pyrite, a sulfidemineral, was found to have a distribution coefficient (Kd value) of 20,000 mL/g for mercury.Hydroxyapatite, a phosphate source, was able to remove large amounts of cobalt (Kd = 7700mL/g), europium (an analogue for actinium; Kd = 720,000 mL/g), lead (Kd = 138,000 mL/g),and uranium (Kd = 282,000 mL/g). Clinoptilolite, a zeolite cation exchange mineral,effectively removed barium (an analogue for radium; Kd = 6200 mL/g). A fielddemonstration of the various sequestering agents was set up at the TNX OD site, but theproject was terminated prior to collecting the first year’s data.

WSRC-TR-2001-00032, REV. 0
Page 8
The first year’s status report (Kaplan et al. 2000a) concluded that a manner in whichphytoimmobilization might be deployed at the site was to use the existing trees and plantadditional netted-chain ferns. The existing trees would have a high litter biomass, but onlymoderate contaminant concentrations. The ferns would produce less biomass, but wouldhave appreciably greater contaminant concentrations. The sequestering agents would consistof a combination of hydroxyapatite, clinoptilolite, and a sulfide source. Pieces of geomat,made up of sequestering agent embedded between two pieces of geofabric, would be used todeploy the sequestering agents around the existing trees and the planted ferns. Thecontaminant survey and greenhouse results obtained since the status report was issuedsupport this approach of deployment with the modification that tupelo trees should also beplanted to increase the annual leaf-litter biomass and uptake by leaves.
A mass balance calculation was conducted with the available site-specific data to provide anearly estimate of the efficacy of the proposed phytoimmobilization scheme. In thesecalculations, it was assumed that the amount of contaminant remediated would incrementallydecrease over time, thereby diminishing the error of extrapolating long-term estimates basedon short-term experimental results. Based on these conservative estimates, Th-232, Th-234,and U-233 already exist at levels well below the 10e-6 risk level and therefore do not requireremediation. The remaining risk drivers at the site are Ra-228, Pb-212, Th-228, U-235, andU-238. Ra-228 could be cleaned up to below 10e-6 risk levels within 52-years; Pb-212, Th-228, U-235, and U-238 would require >300-years. Another set of calculations wasconducted using increased, readily achievable, annual biomass input values. In addition tocleaning up Ra-228, these calculations indicated that Pb-212 and U-235 could be cleaned upto 10e-6 risk levels within 183 and 298 years, respectively. Th-228 and U-238 would not becleaned within 300-years of phytoimmobilization. A final set of calculations was conductedusing a lower clean up requirement based on a 10e-5 risk level. The risk levels upon whichclean up levels are based have not been established yet, but a risk level of 10e-5 is veryprobable in light of the fact that an industrial worker, one of the possible risk receptors, has arisk level of 10e-3. All the contaminants included in the 10e-5 risk-level calculations, exceptTh-228, could be clean with phytoimmobilization within 10 years or did not requireremediation.
There are very few remediation options for ecologically sensitive wetland areas.Application of phytoimmobilization at the TNX OD site has a number of attributes, but alsoan important limitation, namely that it will likely not clean up the site of all radionuclides.Among its attributes, phytoimmobilization uses existing natural geocycling processes andsimply interrupts these processes by accumulating the contaminants in the geomat.Additionally, it should greatly reduce the cost of waste disposal by creating a concentratedwaste in the sequestering agent. However, the fact that not all the contaminants will becleaned in a timely manner compromises its utility, thereby requiring that we further evaluateother remediation approaches and/or the clean up goals of the site.

WSRC-TR-2001-00032, REV. 0
Page 9
2.0 INTRODUCTION
2.1 BACKGROUND
The TNX pilot-scale research facility located on the Savannah River Site, released processwaste into an unlined seepage basin between 1958 and 1980. The basin, referred to as theOld TNX Seepage Basin, was designed to contain wastewater until it could seep into theunderlying sediments, which would then act to impede contaminant migration. The wastedischarged to the Old TNX Seepage Basin included large quantities of Cr, Hg, Nacompounds, depleted U, Th, and other radionuclides and heavy metals. The basin contentsare believed to have entered the nearby inner and outer swamps on the flood plains of theSavannah River by subsurface flow and overland flow; a result of purposely breaching abasin wall and routinely overfilling the basin (Figure 1).
The constituents of concern (COC) at the operable unit include Ac, Co, Cr, Hg, Pb, Ra, Thand U. These contaminants are concentrated primarily in the upper 30-cm of sediment in theInner Swamp area (WSRC 1999). A large portion of the operable unit is designated as awetland. As such, the approaches applicable to remediating the site are limited due to theecologically sensitive nature of the site. Among the most promising approaches toremediating the site are: 1) soil mixing, which involves mixing a sequestering agent into thecontaminated sediment, 2) monitored natural attenuation, which involves monitoring that thecontaminants do not move off site, 3) phytoremediation, a broad term referring to any formof remediation in which plants are involved, and 4) returning the site to its natural wettercondition by installing engineered earthen ridges to restrict water movement off site and thenimposing monitored natural attenuation on the geochemically reduced site.
The subject of this report is the evaluation of a new form of phytoremediation referred to asphytoimmobilization for application at the TNX OD operable unit. Phytoimmobilizationinvolves two steps. The first step is entitled phytoextraction, and it takes place mostly duringthe spring and the summer. During this step, plants extract contaminants from the sedimentinto the roots and then translocate the contaminants to the aboveground plant parts (Figure2). The second step is referred to as sequestration and it takes place during the autumn andwinter (Figure 3). This involves the immobilization of the contaminant once it leaches fromthe fallen leaf or senescent plants during the autumn.

WSRC-TR-2001-00032, REV. 0
Page 10
Levee
Sav
anna
h R
iver
High Ground
InnerSwamp
OutfallDelta Lower
Discharge Gully
Figure 1: Simplified Outfall Delta OU Cross SectionFigure 1: Simplified Outfall Delta OU Cross Section
OuterSwamp
TNX OU VOC Plume
Old TNX Seepage Basin(TNX OU)
LowerDischarge
Gully
Storm drainage pipe
Figure 1. Simplified cross sectional view of the TNX Outfall Delta operable unit.

WSRC-TR-2001-00032, REV. 0
Page 11
The sequestering agent used in this technology should have a number of qualities; it should:
• remove the targeted contaminant(s) in the presence of leaf-leachate,• immobilize the contaminants for a sufficient amount of time, and• not release undesirable constituents from its matrix into its surroundings.
The sequestering agent can be emplaced by mixing into the surface sediment, or as a geomat(Figure 4). A geomat consists of a sequestering agent placed in between two sheets of ageotextile. The advantage of the geomat configuration is that it can be removed. Theadvantage of the soil-mixing configuration is that no labor is required to make and removethe geomat. Other considerations regarding which configuration to use include the end useof the contaminated site and the risk associated with leaving the sequestered contaminants inplace.
There are a number of different materials that can be used as sequestering agents (reviewedby Cantrell and Kaplan 1998). The criteria for selecting a sequestering agent will depend onthe contaminants and the chemical composition of the background solution; in this case, thebackground solution is plant leachate. Examples of potential sequestering agents includeapatite (a calcium phosphate mineral) for Pb, Cd, Th, and U, and sulfide minerals for Hg, Sn,and Ag.
The two most important attributes of phytoimmobilization are that it has minimalenvironmental impact on the site, and that it concentrates the waste. This latter point isespecially important when compared to conventional phytoextraction approaches toremediating sites contaminated with radioactivity. Phytoextraction generates a large volumeof waste. There are few facilities that will incinerate radioactive waste. Thus, the radioactivewaste removed from a site must be disposed of via subsurface burial. This is extremelycostly:
• $3700/m3 for low level waste,• $8800/m3 to 214,000/m3 for mixed waste,• $8800/m3 for hazardous waste, and• $28,500/m3 for transuranic radioactive (TRU) waste.

WSRC-TR-2001-00032, REV. 0
Page 12
Figure 2. First step in phytoimmobilization, phytoextraction, involves extraction of thesediment contaminant, followed by translocation of the contaminant into the above groundplant parts.
ContaminantSequesteringAgent

WSRC-TR-2001-00032, REV. 0
Page 13
Figure 3. Second step in phytoimmobilization, sequestration, involves immobilizing thecontaminants leached from plant litter material within a sequestering agent.
Contaminant
SequesteringAgent

WSRC-TR-2001-00032, REV. 0
Page 14
Figure 4. Emplacement of the sequestering agent can be either (A), incorporated into thecontaminated sediment surface, or (B) in the geomat configuration.
2.2 OBJECTIVES
The objectives of this study were to 1) conduct a proof-of concept of thephytoimmobilization technology, and 2) parameterize a computational design tool that couldbe used in the future deployment of this technology. Rather than conduct a fielddemonstration that would be costly and contain an unacceptable amount of scientificuncertainty, it was decided between Savannah River Technology Center and EnvironmentalRestoration Division personnel to conduct a series of small experiments that wouldindependently investigate each of the various processes involved in phytoimmobilization.The important advantage of this approach is that it permitted a large number of controlledexperiments to be conducted that could evaluate and quantify the various processes thatoccur during deployment of the technology.
These experiments were organized to supply information that could be applied to acomputational design tool, a linear-kinetic reservoir model. The linear-kinetic reservoirmodel (Lasaga 1980) uses matrix algebra to evaluate the concentration of a contaminant invarious reservoirs as a function of time. The six reservoirs that were considered in thephytoimmobilization project are schematically presented in Figure 5. An example of theoutput from the linear-kinetic reservoir model is presented in Figure 6. However, the projectwas terminated prior to completing all the studies needed for supplying input to the model.Instead a simplified mass-balance calculation was conducted using the available data.
Contaminant
Sequestering Agent
BA

WSRC-TR-2001-00032, REV. 0
Page 15
The various experiments that were conducted and how they relate to the conceptual model ofthe phytoimmobilization process are presented in Figure 7. These studies are:
1. Field Survey of Plant and Soil Contaminant Concentrations: The objective of thisstudy was to determine, as a function of plant species, the contaminantconcentrations and the concentration ratio (concentration in plant tissue dividedby the concentration in the soil) in herbaceous plants and tree leaves of plantsgrowing in the TNX OD site. Eighteen sets of herbaceous plant, leaf litter, andsoil samples were collected from the contaminated and uncontaminated portion ofthe TNX OD. The samples were then analyzed for their contaminantconcentrations.
2. Plant Uptake Experiment: The objective of this greenhouse investigation was todetermine the rate at which netted-chain fern (Woodwardia areolata) andBermuda grass (Cynnodon dactylon) took up contaminants from three differentsediments collected from the TNX OD site. The uptake data would then be usedin the model.
3. Leaf Leaching Experiment: The objective of this study was to determine the rateat which the contaminants leached from plant material. Plant tissues collectedfrom the TNX OD were placed in a dialysis bag, which in turn was placed inuncontaminated TNX surface water. The rate of contaminant concentrationsreleased from the leaves was monitored over two months.
4. Geomat Efficiency Laboratory Experiment: The objective of this laboratoryinvestigation was to conduct a survey of several potential sequestering agents fortheir ability to remove contaminants from the aqueous phase.
5. Geomat Efficiency Field Experiment: The objective of this field study was toevaluate the most effective sequestering agents identified during the laboratorystudy during a one-year period.
6. Geochemistry and Sorption Experiment: The objective of this laboratoryinvestigation was to quantify the relative availability (leachability) of thecontaminants within TNX OD soils and to provide Kd values for the model.

WSRC-TR-2001-00032, REV. 0
Page 16
Figure 5. Contaminant reservoirs included in the linear-kinetic reservoir model.
Soil
SequesteringAgent
Plant
Water
Water
Water

WSRC-TR-2001-00032, REV. 0
Page 17
Figure 6. Example of the type of output that the linear-kinetic reservoir model produces(COC stands for constituent of concern).
Soil
Plant
Water
SequesteringAgent
Time
COCConc.ormass

WSRC-TR-2001-00032, REV. 0
Page 18
Figure 7. Experiments conducted and their relation to the linear-kinetic reservoir model.
2.3 SCOPE
The constituents of concern (COCs) in these studies were Ac, Ba, Co, Cr, Hg, Pb, Ra, Th,and U. Evaluation of the technology was made relevant to the TNX OD operable unit. Toreduce analytical cost, it was decided by Savannah River Technology Center andEnvironmental Restoration Division personnel to restrict analyses to inductively coupledplasma – mass spectrometry (ICP-MS) and cold-vapor fluorescence spectroscopy, avoidingcostly radiochemical analyses. Actinium and Ra concentrations were below detection by theICP-MS. Thus, Eu and Ce, both trivalent cations, were used as analogues for Acbiogeochemical behavior, and Ba, a divalent cation, was used as an analogue for Rabiogeochemical behavior. Europium, Ce, and Ba were easily detected by the ICP-MS. Thecold-vapor fluorescence spectroscopy was used for Hg analyses.
Soil
SequesteringAgent
Plant
Water
Water
Water
VI. Geochemistry &Sorption Expt.
I. Field Survey II. Plant Uptake Expt.
III. Leaf Leaching Expt. IV. Geomat Efficiency Lab Expt.
V. Geomat Efficiency Field Expt.

WSRC-TR-2001-00032, REV. 0
Page 19
This project was terminated early, thus not all of the original objectives were achieved. Theproject was terminated because simplified mass-balance calculations indicated that thephytoimmobilization technology would not clean up the site of all the radionuclides in atimely manner.
2.4 STATUS
The project included 7 tasks: one task for each of the six objectives presented in theObjective Section (Section 2.2) and a modeling task. The status of each task is presented inTable 1. All subtasks were completed except for the following:
• collecting the 2nd year of data from the Plant Uptake Greenhouse Experiment (Task2),
• analyzing the chemical composition of the leachates recovered from the LeafLeaching Experiment (Task 3),
• collecting data for the Geomat Efficiency Field Experiment (Task 5), and• conducting the linear-kinetic reservoir modeling (Task 7).
Since the status report (Kaplan et al. 2000a), the following subtasks were completed:
• Sample chemical analysis of the plant and soil samples collected during the FieldSurvey of Plant and Soil Contaminant Concentrations Task,
• Completion of the 1st harvest of the Plant Uptake Greenhouse Experiment, and• Completion of the abbreviated mass-balance model of phytoimmobilization at the
TNX OD.
The results from these newly completed experiments have been incorporated into the resultspresented in the status report (Kaplan et al. 2000a). This report contains roughly twice asmuch information as the status report. The status report contained 10 figures, this reportcontains 17 figures; the status report contains 15 tables, this report contains 41 tables; thestatus report was 40 pages long, this report is greater than 90 pages long.

WSRC-TR-2001-00032, REV. 0
Page 20
Table 1. Status and reporting of project tasks.
No. Task Subtask CompletionStatus
First Reported
1 Field Survey of Plant and SoilContaminant Concentrations
• Collect samples and extract soil anddigest plant material
Completed Kaplan et al. 2000a
• Analyze samples Completed This report, Section 4.2.22 Plant Uptake Greenhouse Expt. • Set up greenhouse experiment Completed Kaplan et al. 2000a
• Conduct 1st year’s uptake study Completed This report, Section 4.3• Conduct 2nd year’s uptake study Incomplete
3 Leaf Leaching Expt. • Set up experiment Completed Kaplan et al. 2000a• Recover leaf leachate samples as a
function of timeIncomplete
4 Geomat Efficiency LaboratoryExpt.
• Conduct Experiment Completed Kaplan et al. 2000a
5 Geomat Efficiency Field Expt. • Set up experiment in field Completed Kaplan et al. 2000a• Conduct experiment: collect and
chemically characterize plant andsequestering agents
Incomplete
6 Geochemistry & Sorption Expt. • Conduction sequential extractions Completed(a) Kaplan et al. 19997 Modeling Phytoimmobilization • Write and test linear-kinetic reservoir
modelCompleted Kaplan et al. 2000a
• Run simulations with linear-kineticreservoir model
Incomplete
• Run abbreviated mass-balance model Completed(b) This report, Section 4.7.2(a) Laboratory portion of this task was completed last year as part of another project (Kaplan et al. 1999).(b) The abbreviated mass-balance model was conducted with available data to provide a gross estimate of the expectedperformance of the phytoimmobilization technology.
WSRC-TR-2001-00032, REV. 0
Page 21
3.0 MATERIALS AND METHODS
There were seven tasks in this project: the six experiments depicted in Figure 7 and amodeling task. The Materials and Methods of each of the seven tasks are described below.
3.1 PLANTS AND SOIL FIELD SURVEY AT THE TNX OD SITE
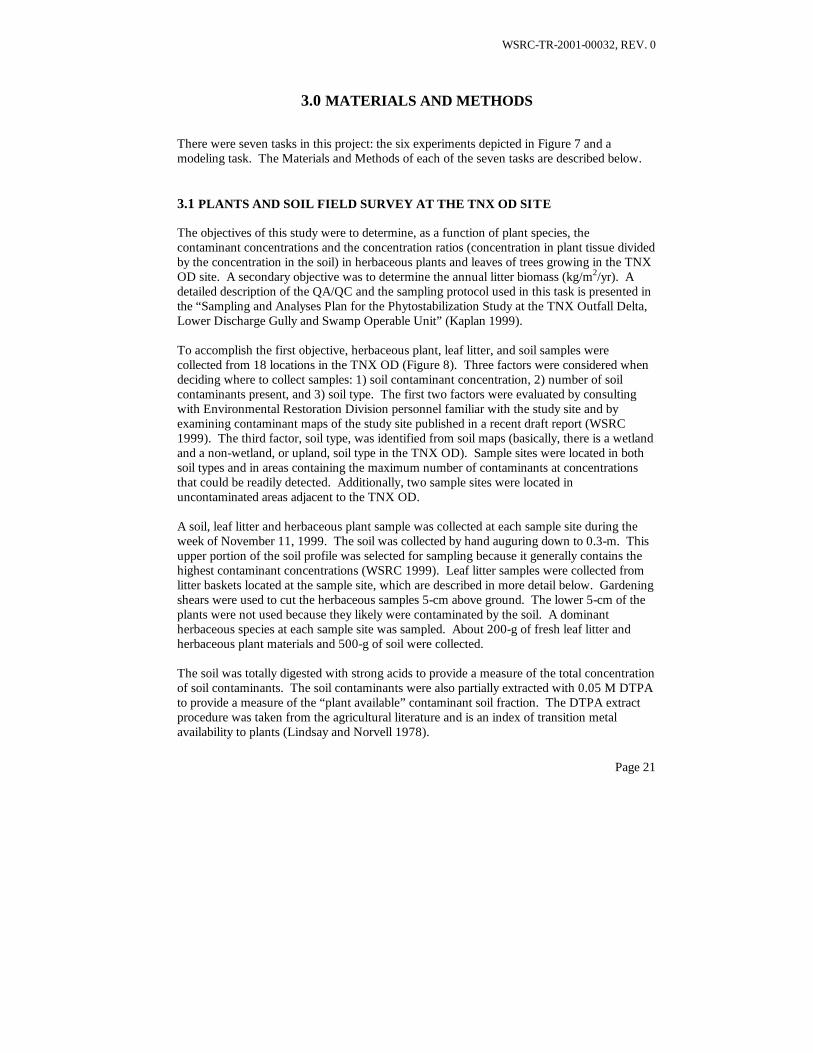
The objectives of this study were to determine, as a function of plant species, thecontaminant concentrations and the concentration ratios (concentration in plant tissue dividedby the concentration in the soil) in herbaceous plants and leaves of trees growing in the TNXOD site. A secondary objective was to determine the annual litter biomass (kg/m2/yr). Adetailed description of the QA/QC and the sampling protocol used in this task is presented inthe “Sampling and Analyses Plan for the Phytostabilization Study at the TNX Outfall Delta,Lower Discharge Gully and Swamp Operable Unit” (Kaplan 1999).
To accomplish the first objective, herbaceous plant, leaf litter, and soil samples werecollected from 18 locations in the TNX OD (Figure 8). Three factors were considered whendeciding where to collect samples: 1) soil contaminant concentration, 2) number of soilcontaminants present, and 3) soil type. The first two factors were evaluated by consultingwith Environmental Restoration Division personnel familiar with the study site and byexamining contaminant maps of the study site published in a recent draft report (WSRC1999). The third factor, soil type, was identified from soil maps (basically, there is a wetlandand a non-wetland, or upland, soil type in the TNX OD). Sample sites were located in bothsoil types and in areas containing the maximum number of contaminants at concentrationsthat could be readily detected. Additionally, two sample sites were located inuncontaminated areas adjacent to the TNX OD.
A soil, leaf litter and herbaceous plant sample was collected at each sample site during theweek of November 11, 1999. The soil was collected by hand auguring down to 0.3-m. Thisupper portion of the soil profile was selected for sampling because it generally contains thehighest contaminant concentrations (WSRC 1999). Leaf litter samples were collected fromlitter baskets located at the sample site, which are described in more detail below. Gardeningshears were used to cut the herbaceous samples 5-cm above ground. The lower 5-cm of theplants were not used because they likely were contaminated by the soil. A dominantherbaceous species at each sample site was sampled. About 200-g of fresh leaf litter andherbaceous plant materials and 500-g of soil were collected.
The soil was totally digested with strong acids to provide a measure of the total concentrationof soil contaminants. The soil contaminants were also partially extracted with 0.05 M DTPAto provide a measure of the “plant available” contaminant soil fraction. The DTPA extractprocedure was taken from the agricultural literature and is an index of transition metalavailability to plants (Lindsay and Norvell 1978).
WSRC-TR-2001-00032, REV. 0
Page 22
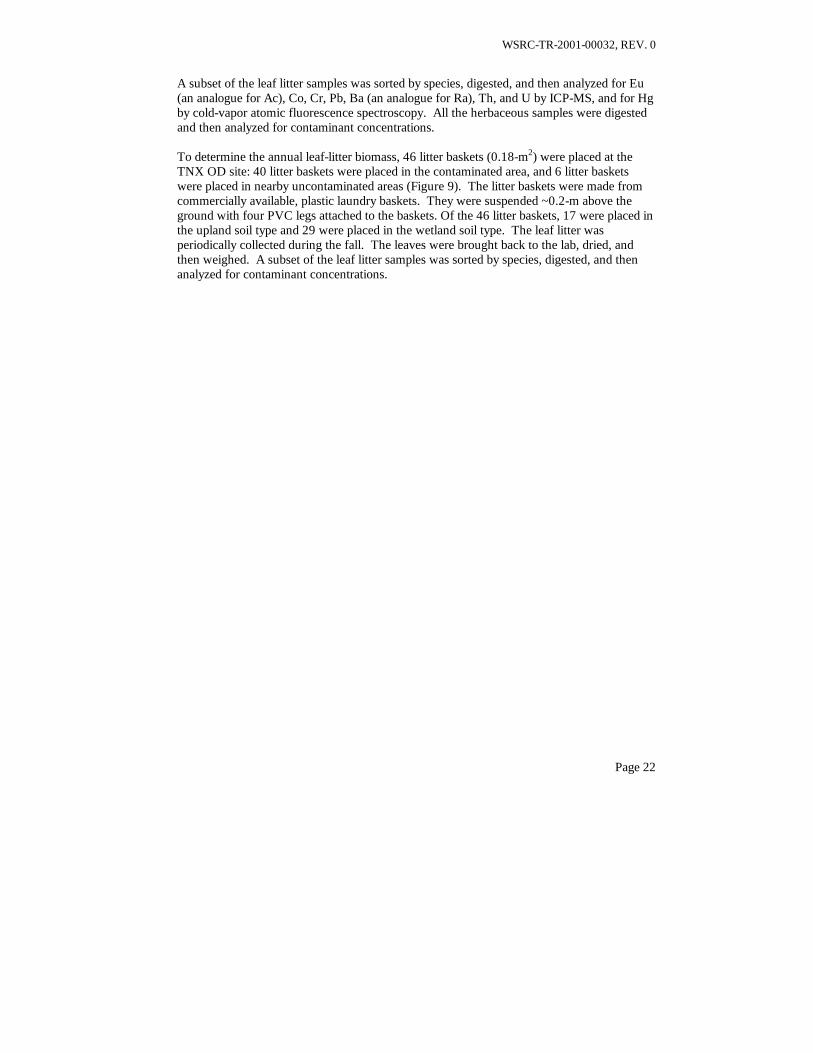
A subset of the leaf litter samples was sorted by species, digested, and then analyzed for Eu(an analogue for Ac), Co, Cr, Pb, Ba (an analogue for Ra), Th, and U by ICP-MS, and for Hgby cold-vapor atomic fluorescence spectroscopy. All the herbaceous samples were digestedand then analyzed for contaminant concentrations.
To determine the annual leaf-litter biomass, 46 litter baskets (0.18-m2) were placed at theTNX OD site: 40 litter baskets were placed in the contaminated area, and 6 litter basketswere placed in nearby uncontaminated areas (Figure 9). The litter baskets were made fromcommercially available, plastic laundry baskets. They were suspended ~0.2-m above theground with four PVC legs attached to the baskets. Of the 46 litter baskets, 17 were placed inthe upland soil type and 29 were placed in the wetland soil type. The leaf litter wasperiodically collected during the fall. The leaves were brought back to the lab, dried, andthen weighed. A subset of the leaf litter samples was sorted by species, digested, and thenanalyzed for contaminant concentrations.

WSRC-TR-2001-00032, REV. 0
Page 23
Figure 8. Plant tissue and soil sampling locations at the TNX OD.
100 0 100 200 300 400 500 600 700 800 Feet
Figure 2: Vegetative Sam ple Locations
P la ntNo rthP la ntNo rth
Tr ueNo rthTr ueNo rth
36 ^2 2 '
$
$
$
$
$
$
$
$
$
$
$
$
$
$
$
$
$ $
X-008 Ditch
Hig h Ground
Inn er SwampOuter Swam p
Ou tfall D elta
Disc harg e Gully
BG C H05 BGT R03
A03
A04
A05
B0 3
B0 4
B0 5
C02
C03
C04
C05 D05
D06
D03
D04
D07
G03
saf/ nph 11 /1 7/9 9

WSRC-TR-2001-00032, REV. 0
Page 24
Figure 9. Litter Basket locations at the TNX-OD.
$Z
$Z
$Z
$Z
$Z
$Z
$Z
$Z
$Z
$Z
$Z
$Z
$Z
$Z
$Z
$Z
$Z
$Z
$Z
$Z
$Z
$Z
$Z
$Z
$Z
$Z
$Z
$Z
$Z
$Z
$Z
$Z
$Z
$Z
$Z
$Z
$Z
$Z
$Z
$Z
X-008 Ditch
High Ground
Inner Swamp
Outer Swamp
Outfall DeltaDischarge Gully
A02
A03
A04
A05
A07
B02
B03
B04
B05
B06
B07
B08
B17
C02
C03C04
C05
C07
C08
C16
C17
D03
D04
D05
D06
D07
D08
G01
G02
G03
G07
G11
H01
H04
H05
H06
H07
I17I18
J17
100 0 100 200 300 400 500 600 700 800 Feet
PlantNorthPlantNorth
TrueNorthTrueNorth
36 2̂2'
FIGURE 1: BIOMASS SAMPLE LOCATIONS
SAF/NPH 11/ 17/99
WSRC-TR-2001-00032, REV. 0
Page 25
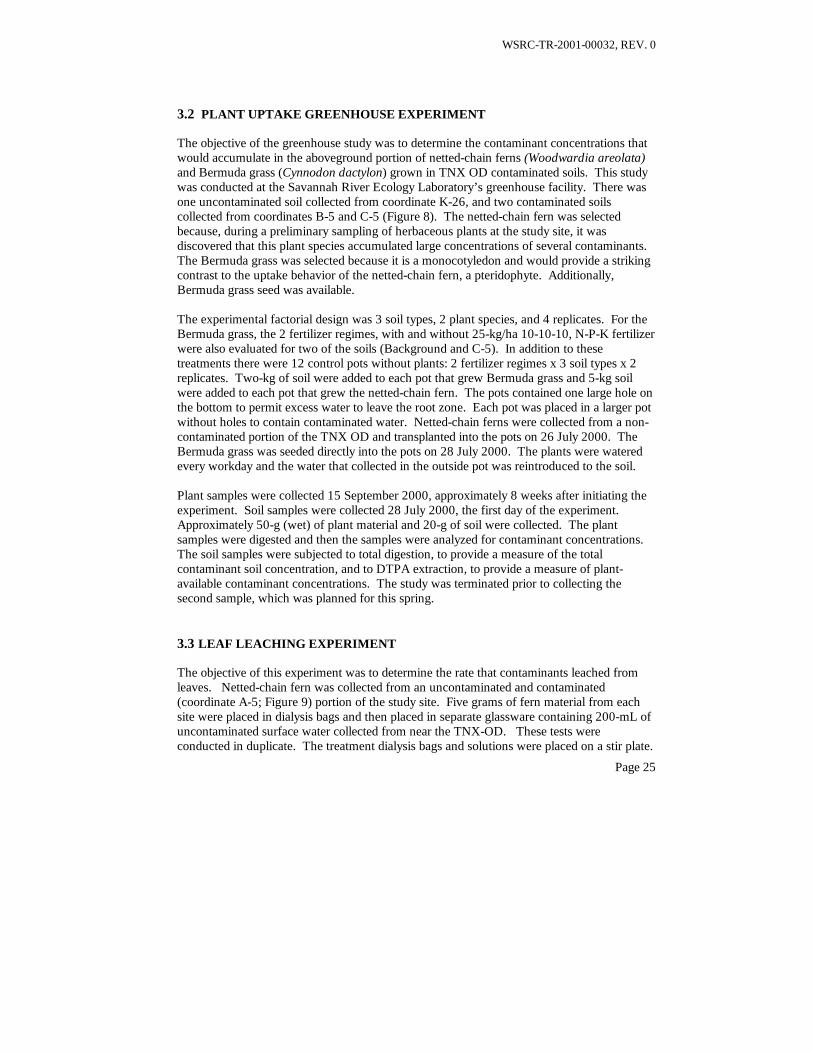
3.2 PLANT UPTAKE GREENHOUSE EXPERIMENT
The objective of the greenhouse study was to determine the contaminant concentrations thatwould accumulate in the aboveground portion of netted-chain ferns (Woodwardia areolata)and Bermuda grass (Cynnodon dactylon) grown in TNX OD contaminated soils. This studywas conducted at the Savannah River Ecology Laboratory’s greenhouse facility. There wasone uncontaminated soil collected from coordinate K-26, and two contaminated soilscollected from coordinates B-5 and C-5 (Figure 8). The netted-chain fern was selectedbecause, during a preliminary sampling of herbaceous plants at the study site, it wasdiscovered that this plant species accumulated large concentrations of several contaminants.The Bermuda grass was selected because it is a monocotyledon and would provide a strikingcontrast to the uptake behavior of the netted-chain fern, a pteridophyte. Additionally,Bermuda grass seed was available.
The experimental factorial design was 3 soil types, 2 plant species, and 4 replicates. For theBermuda grass, the 2 fertilizer regimes, with and without 25-kg/ha 10-10-10, N-P-K fertilizerwere also evaluated for two of the soils (Background and C-5). In addition to thesetreatments there were 12 control pots without plants: 2 fertilizer regimes x 3 soil types x 2replicates. Two-kg of soil were added to each pot that grew Bermuda grass and 5-kg soilwere added to each pot that grew the netted-chain fern. The pots contained one large hole onthe bottom to permit excess water to leave the root zone. Each pot was placed in a larger potwithout holes to contain contaminated water. Netted-chain ferns were collected from a non-contaminated portion of the TNX OD and transplanted into the pots on 26 July 2000. TheBermuda grass was seeded directly into the pots on 28 July 2000. The plants were wateredevery workday and the water that collected in the outside pot was reintroduced to the soil.
Plant samples were collected 15 September 2000, approximately 8 weeks after initiating theexperiment. Soil samples were collected 28 July 2000, the first day of the experiment.Approximately 50-g (wet) of plant material and 20-g of soil were collected. The plantsamples were digested and then the samples were analyzed for contaminant concentrations.The soil samples were subjected to total digestion, to provide a measure of the totalcontaminant soil concentration, and to DTPA extraction, to provide a measure of plant-available contaminant concentrations. The study was terminated prior to collecting thesecond sample, which was planned for this spring.
3.3 LEAF LEACHING EXPERIMENT
The objective of this experiment was to determine the rate that contaminants leached fromleaves. Netted-chain fern was collected from an uncontaminated and contaminated(coordinate A-5; Figure 9) portion of the study site. Five grams of fern material from eachsite were placed in dialysis bags and then placed in separate glassware containing 200-mL ofuncontaminated surface water collected from near the TNX-OD. These tests wereconducted in duplicate. The treatment dialysis bags and solutions were placed on a stir plate.

WSRC-TR-2001-00032, REV. 0
Page 26
5-ml aliquots were periodically collected during a 2-month equilibration period from theaqueous phase. The study was terminated prior to submitting the aqueous samples forchemical analysis.
3.4 GEOMAT EFFICIENCY LABORATORY EXPERIMENT
The objective of this laboratory study was to conduct a survey of potential sequestering agentmaterials that could be used in conjunction with the phytoimmobilization technology at theTNX OD site. The following sequestering agents were tested:
• metallic iron (Fe),• North Carolina apatite (NCA),• hydroxylapatite (HA),• zeolite (clinoptilolite -ZC and phillipsite-ZP),• Fe oxide waste (Fe richTM waste byproduct from an industrial process that
generates TiO2 pigment; E.I. Du Pont de Nemours, Wilmington, DE),• gypsum, and• pyrite.
To avoid interactions between COCs and to minimize waste handling, the tests wereconducted in three separate experiments: a Cr experiment; a Hg experiment; and a Ba (usedas an analog for radium), Co, Pb, and U experiment. All experiments were conducted incentrifuge tubes and had a contact time of 1-wk. Each treatment had three replicates. Twobackground solutions were used in these studies: distilled water and rainwater with organiccarbon added to it. The latter background solution was intended to approximate leafleachate, the solution expected to come into contact with the sequestering agent during thedeployment of phytoimmobilization. About 200-g (dry weight) of leaf-litter collected from anon-contaminated area of TNX was put in contact with 2-L of rainwater collected fromAiken, SC during April 2000. The leaf-litter suspension was left for about 3-wk at roomtemperature. The water became opaque from the leaching of organic matter from the leaf-litter. Three sets of spike solutions were prepared with the distilled water and the highorganic matter leachate solution. For the Cr experiment, the two background solutions werespiked with 1-mg L-1 Cr(VI). For the Hg experiment, the two background solutions werespiked with 2-mg L-1 Hg(II). For the Ba, Co, Pb, and U experiment, the backgroundsolutions were spiked with 50-µg L-1 of each COC.
Approximately 0.3-g of each sequestering agent was shaken with 30-mL of spike solution.After a 1-wk contact time, the aqueous phases were analyzed for Cr, Ba, Co, Pb, and U byICP-MS and for Hg by Cold-Vapor Atomic Fluorescence Spectrometer. The partitioning ofthe metals to the various sequestering agents was quantified by a distribution coefficient, Kd(concentration of contaminant on the solid phase divided by the concentration of thecontaminant in the aqueous phase).

WSRC-TR-2001-00032, REV. 0
Page 27
3.5 GEOMAT EFFICIENCY FIELD EXPERIMENT
The objective of this study was to field test some of the better sequestering agents identifiedduring the laboratory trials described above in Section 3.4. Twenty-nine mesocosms wereestablished in coordinate H-5 in the study site (Table 2). The mesocosms were made from15-cm diameter PVC tubing and were 30-cm high. Within each mesocosm, a geomat wasplaced on top of a 2-cm layer of sand that was designed to act as a spacer to separate theunderlying contaminated soil from the geomat. The geomat was made by cutting 16-cmdiameter circles out of a geofabric (AMOCO Style 5412, Atlanta, GA). The edges of twogeofabric circles were sewn together, leaving a 3-cm opening. Through this opening, 300-gof sequestering agent was added. The opening was then sewn together. A screen was placedon top of the mesocosm to minimize the amount of leaves falling into the mesocosm, but atthe same time permitting rain to enter.
The project was terminated before plant material could be added to the mesocosms. Detailsof the proposed experimental plan are presented in the status report (Kaplan et al. 2000a).
Table 2. Experimental matrix for the Geomat Efficiency Field Experiment.
Treatment # Replicates Leaf Material1 Fe(0) 3 Leaf Litter2 Apatite 3 Leaf Litter3 Clinoptilolite 3 Leaf Litter4 Clinoptilolite/Apatite/Fe(0) 3 Leaf Litter5 Fe(0) 2 Fern6 Apatite 2 Fern7 Clinoptilolite 2 Fern8 Clinoptilolite/Apatite/Fe(0) 2 Fern9 Fe(0) 3 None10 Apatite 3 None11 Clinoptilolite 3 None
3.6 GEOCHEMISTRY & SORPTION EXPERIMENT
The objective of this study was to determine the relative availability of the variouscontaminants and to determine distribution coefficients, Kd values, which could be used inmodeling the phytoimmobilization technology. The laboratory portion of this work wascompleted as part of a previous study (Kaplan et al. 1999). The site-specific field data takenfrom this report that will be used in our modeling are presented in Section 4.7.

WSRC-TR-2001-00032, REV. 0
Page 28
3.7 MODELING PHYTOIMMOBILIZATION
It was originally planned that a linear-kinetic reservoir model would be used to predict theeffectiveness of applying the phytoimmobilization technology at the study site. However, anabbreviated mass-balance model was used to provide some preliminary estimates. Althoughthis simplified model lacks technical rigor, it could be used with the existing data andprovided an early indication of the technology efficacy. A description of the model, inputparameters used in the calculations and the results from the calculations are presented in theResults section, Section 4.7. Insufficient data were available for conducting calculationswith the linear-kinetic reservoir model. A brief discussion of the linear-kinetic reservoirmodel and the available input values is provided in the Results section, Section 4.7.2. Amore detailed description of the model is provided in the status report (Kaplan et al. 2000a).
4.0 RESULTS AND DISCUSSION
4.1 PLANT AND SOIL FIELD SURVEY AT THE TNX OD SITE
4.1.1 Annual Biomass Estimates
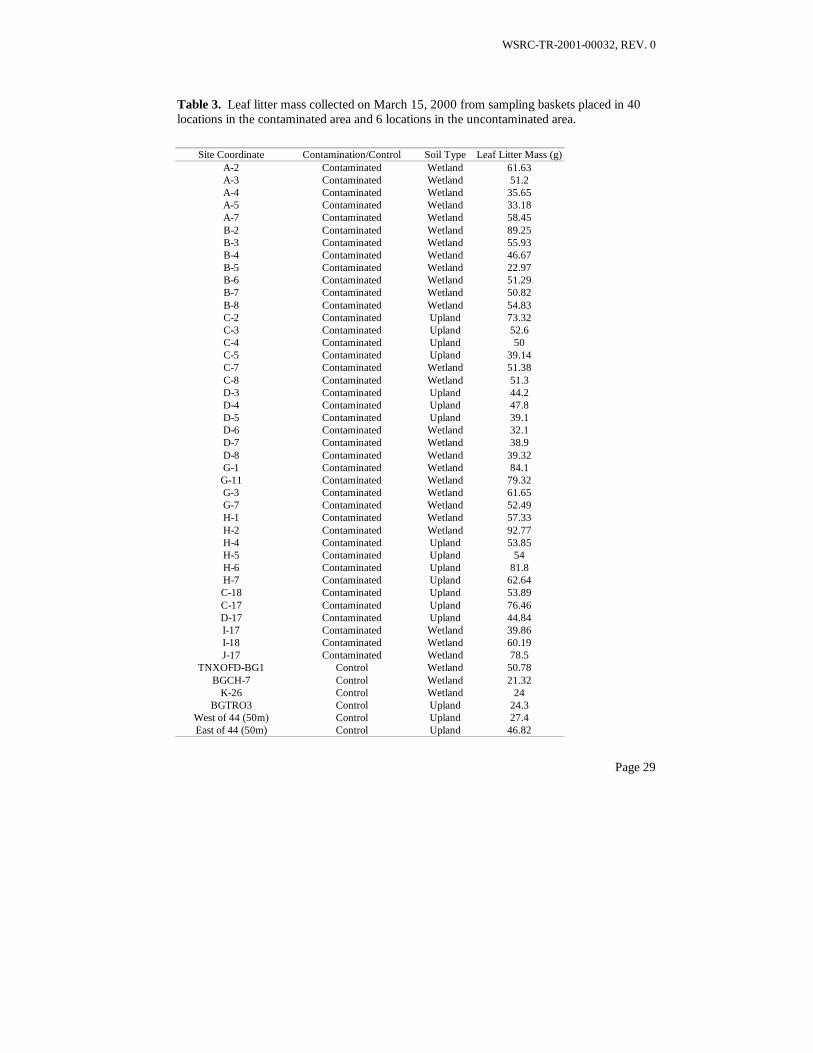
Table 3 gives the mass of leaf litter collected from 40 sampling baskets located in thecontaminated area and 6 sampling baskets located in the uncontaminated area of the studysite. Unfortunately, the project was not initiated until October 1, 1999 and the samplingbaskets were placed in the field after the deciduous leaves had started to fall.1 Consequently,these data underestimate the true amount of leaves that fall annually. Due to radiologicalsafety concerns, we were not permitted to collect the leaves beneath the baskets that hadalready fallen in the contaminated area. However, we were able to collect and weigh theleaves beneath the collection baskets located in the uncontaminated area. The annual leaf-litter biomass at the site was estimated based on the leaf biomass ratio in and beneath thesampling baskets in the uncontaminated area (Table 4). Based on these 6 uncontaminatedsamples, the annual leaf-litter biomass is:
• 7389 ± 833 kg/ha/yr for the wetland soils, and• 5556 ± 1056 kg/ha/yr for the upland soils.
Only 24% and 33% of the total leaf litter that fell during the fall of 1999 was collected in thebaskets located in the wetlands and uplands, respectively.
1 It was not possible to collect leaf litter data in the fall of 2000 because the project wasterminated before all the autumn leaves had fallen.
WSRC-TR-2001-00032, REV. 0
Page 29
Table 3. Leaf litter mass collected on March 15, 2000 from sampling baskets placed in 40locations in the contaminated area and 6 locations in the uncontaminated area.
Site Coordinate Contamination/Control Soil Type Leaf Litter Mass (g)A-2 Contaminated Wetland 61.63A-3 Contaminated Wetland 51.2A-4 Contaminated Wetland 35.65A-5 Contaminated Wetland 33.18A-7 Contaminated Wetland 58.45B-2 Contaminated Wetland 89.25B-3 Contaminated Wetland 55.93B-4 Contaminated Wetland 46.67B-5 Contaminated Wetland 22.97B-6 Contaminated Wetland 51.29B-7 Contaminated Wetland 50.82B-8 Contaminated Wetland 54.83C-2 Contaminated Upland 73.32C-3 Contaminated Upland 52.6C-4 Contaminated Upland 50C-5 Contaminated Upland 39.14C-7 Contaminated Wetland 51.38C-8 Contaminated Wetland 51.3D-3 Contaminated Upland 44.2D-4 Contaminated Upland 47.8D-5 Contaminated Upland 39.1D-6 Contaminated Wetland 32.1D-7 Contaminated Wetland 38.9D-8 Contaminated Wetland 39.32G-1 Contaminated Wetland 84.1G-11 Contaminated Wetland 79.32G-3 Contaminated Wetland 61.65G-7 Contaminated Wetland 52.49H-1 Contaminated Wetland 57.33H-2 Contaminated Wetland 92.77H-4 Contaminated Upland 53.85H-5 Contaminated Upland 54H-6 Contaminated Upland 81.8H-7 Contaminated Upland 62.64C-18 Contaminated Upland 53.89C-17 Contaminated Upland 76.46D-17 Contaminated Upland 44.84I-17 Contaminated Wetland 39.86I-18 Contaminated Wetland 60.19J-17 Contaminated Wetland 78.5
TNXOFD-BG1 Control Wetland 50.78BGCH-7 Control Wetland 21.32
K-26 Control Wetland 24BGTRO3 Control Upland 24.3
West of 44 (50m) Control Upland 27.4East of 44 (50m) Control Upland 46.82

WSRC-TR-2001-00032, REV. 0
Page 30
Table 4. Annual leaf-litter biomass estimates for leaves at the TNX OD.
SoilType
Sample ID Leaf Litterin Basket(a)
(g/0.18 m2)
Leaf LitterBeneathBasket(a)
(g/0.18 m2)
Total LeafLitter
(g/0.18 m2)
Mass(b)
(g/0.18 m2)Mass(b)
(kg/ha/yr)% in
BasketAve. %
inBasket
Wetland TNXOFD-BG1 50.78 97.0 147.78 133 ± 15 7389 ± 833 34 24 ± 10BGCH-7 21.32 113.04 134.36 16K-26 24 94.2 118.2 20
Upland BGTRO3 24.3 54.3 78.6 100 ± 19 5556 ± 1056 31 33 ± 8West of 44 (50m) 27.4 80.95 108.35 25East of 44 (50m) 46.82 66.26 113.08 41
(a) Leaf litter was collected between November 9, 1999 and March 15, 2000. By November 9, 1999, leaveshad already started falling. The recently fallen leaves beneath the leaf litter baskets were collected andweighed and their mass is reported in “Leaf Litter Beneath Basket. ” By March 15, 2000, essentially all of thedeciduous leaves had fallen. The leaf litter baskets had an area of 0.5-m2.(b) Average ± standard deviation.
4.1.2 Plant Species Abundance
The material collected in 21 leaf litter baskets was separated by species. The percent of themass of each species is presented in Table 5 and Table 6. A list of the scientific names ofmany of the plant species referred to in this report is presented in Appendix A. A summaryof the relative abundance of the dominant species is present in Table 7. Water oak, tupelo,baldcypress, and loblolly pine account for 43% of the total leaf litter mass.

WSRC-TR-2001-00032, REV. 0
Page 31
Table 5. Species-composition of leaf litter (wt-%) (Table continues in Table 6).
Location MapNode
Soil Type Bald-cypress(a)
Willow Pine Sycamore Red Maple Unknown Water Oak Oak Tupelo TupeloSeeds
A-2 Wetland 35(b) (c) 11 4 1 2 44A-5 Wetland 11 3 55 21 5A-7 Wetland 25 9 4 7 35 17B-2 Wetland 41 15 7 2 28B-3 Wetland 19 15 2 55B-4 Wetland 28 3 1 4B-5 Wetland 44 56C-3 Upland 17 8 41 7 6C-4 Upland 5 15 23 31 19 2 4C-5 Upland 3 36 52 5 4D-3 Upland 2 20 21 10D-6 Wetland 26 11 29 5D-7 WetlandD-8 Wetland 10 26 15 47G-2 WetlandG-3 Wetland 37 9 22 12G-7 Wetland 36 36
TNXOFD-BG1 Wetland 5 60 16BGCH-7 Wetland 54 46
K-26 Wetland 11 9 76BGTRO3 Upland 6 9 75
West of 44 (50m) Upland 7 8East of 44 (50m) Upland 6 75 19
(a) The scientific names for many of these plant species are presented in Table 7.(b) Total leaf litter mass is presented in Table 3.(c) Empty cells within the table indicate 0 wt-% of species was present in the sample.

WSRC-TR-2001-00032, REV. 0
Page 32
Table 6. Specie-composition of leaf litter (%-g species/100-g total leaf litter) (Table continues in Table 5).
Map NodeLocation
Soil Type Sweetgum(a) Iron Wood Vitis spp. Ilex opaca Sticks Beech Hickory Beauty Berry
A-2 Wetland (b) 2 1A-5 Wetland 4(c)
A-7 Wetland 3 1B-2 Wetland 7B-3 Wetland 2 7B-4 Wetland 45 6 12B-5 WetlandC-3 Upland 12 9C-4 UplandC-5 UplandD-3 Upland 26 2 14 5D-6 Wetland 29D-7 WetlandD-8 Wetland 2G-2 WetlandG-3 Wetland 20G-7 Wetland 10 9 3 6
TNXOFD-BG1 Wetland 6 11 3BGCH-7 Wetland
K-26 Wetland 4BGTRO3 Upland 4 6
West of 44 (50m) Upland 30 55East of 44 (50m) Upland 1
(a) The scientific names for many of these plant species are presented in Table 7.(b) Empty cells within the table indicate 0 wt-% of specie was present in the sample.(c) Total leaf litter mass is presented in Table 3.

WSRC-TR-2001-00032, REV. 0
Page 33
Table 7. Mass of leaves of plant species collected from 21-leaf litter baskets located in thecontaminated portion of the TNX OD.
Common Name Scientific Name Mass (kg/ha) % MassWater Oak Quercus nigra 98 11Tupelo Nyssa sylvatica 97 11Baldcypress Taxodium distichum 96 11Loblolly Pine Pinus taeda 89 10Red Maple Acer rubrum 52 6Sweetgum Liquidambar styraciflua 48 5American Sycamore Platanus occidentalis 29 3Other 381 43Total biomass 890 100(a) Leaf litter was collected between November 9, 1999 and March 15, 2000. By November9, 1999, leaves had already started falling. Thus, these values do not represent a total leaflitter biomass. The leaf litter baskets had an area of 0.18-m2.
4.2 FIELD SURVEY OF PLANT AND SOIL CONTAMINANT CONCENTRATIONS
The objective of this study was to conduct a survey of indigenous plants for their ability totake-up soil contaminants. Originally, it was intended that more in-depth studies of highuptake plants would follow this survey to provide confirmation and greater understanding ofthe processes responsible for the greater contaminant uptake by the plant. Sixteen sets ofsoil, herbaceous, and leaf litter samples were collected for this survey. It was important tocollect soil samples along with the plant samples because low concentrations in the planttissue could be attributed to either low soil contaminant concentrations or low plant uptakerates. The total COC concentrations were measured in the soil samples by total digestion.Additionally, the “plant available” COC concentration was extracted from the soils using theDTPA extractant (Lindsay and Norvell 1978). This extractant is commonly used inagriculture to provide a measure of whether trace nutrient fertilizers need to be added to soilsto improve plant health (Mengel and Kirkby 1978). For phytoimmobilization, it wasanticipated that plants would not be able to extract all the contaminants in the soil, only some“plant available” fraction.

WSRC-TR-2001-00032, REV. 0
Page 34
4.2.1 Soil Properties at the TNX OD
Selected soil properties of an uncontaminated soil collected from coordinate BGCH05 and acontaminated soil collected from coordinate A-5 are presented in Table 8. Both soils areacidic, contain moderate levels of organic matter and have a sandy texture. The cationexchange capacity (CEC) values are typical of this area. Also, reported in Table 8 are anionexchange capacity (AEC) values. This parameter is like CEC except it is for anions, and ithas been shown to increase substantially in SRS soils under increasingly acidic conditions(Kaplan and Serkiz 1999). The AEC values of these soils are relatively high when comparedto levels measured in other parts of the country, thus these soils would be expected to retainanions to a greater extent than other soils. Additional soil characterization and adsorptionand desorption properties of the TNX OD soil are reported by Kaplan and Serkiz (1999).
Contaminant concentrations in a soil collected from one of the most contaminated regions ofthe site, coordinate A-5, and a soil in an uncontaminated portion of the site are presented inTable 9. Concentrations of Ag, Cr, Co, Cu, Hg, Pb, Th, and U-238 are appreciably greater inthe A-5 soil than in the background soil. For U-238, there is a four order-of-magnitudedifference between the concentrations in these two soils. We are not interested in theconcentration of Ba and Ce per se, but are interested in these elements only insofar as theycan be used as analogues for Ra and Ac, respectively. Additional discussion of the total soiland available soil COC concentration data are presented in Section 4.2.2.

WSRC-TR-2001-00032, REV. 0
Page 35
Table 8. Soil characterization of an uncontaminated background soil collected from coordinate BGCH05 and a contaminated soilcollected from coordinate A-5.
Soil >2-mm Sand Silt Clay pH Organic C CEC AEC Fe-oxides(a)
(%,wt) (%,wt) (%,wt) (%,wt) (mg/kg) (cmol(+)/kg) (cmol(-)/kg) (%,wt)Uncont. Background 0.8 ± 1.0(b) 79.4 ± 2.1 13.6 ± 0.3 6.3 ± 0.8 4.16 ± 0.01 1395 4.75 ± 0.08 1.56 ± 0.17 0.01Contaminated A-5 21.2 ± 6.3 48.8 ± 6.8 23.6 ± 1.6 6.4 ± 1.1 4.00± 0.08 1493 8.96± 0.09 2.43± 0.05 0.08(a) Fe-oxides: extracted by sodium dithionite from total soil (an estimate of concentration of Fe-oxide coatings); reported as % Fe2O3.(b) Analyses were conducted as duplicates or without duplication (where no standard deviation is presented).
Table 9. Elemental Composition (µg/g) of an uncontaminated background soil collected from coordinate BGCH05 and acontaminated soil collected from coordinate A-5.
Soil Ag Al As Ba Be Cd Ce Cr Co CuUncontaminated Background <0.0001 1915 0.36 21.97 0.46 <0.0002 19.40 2.82 0.99 30.04Contaminated A-5 1.8 6252 0.57 78.72 0.80 0.33 53.56 44.60 3.69 88.25
Fe Hg Mn Ni Pb Sr Tl Th-232 U-235 U-238Uncontaminated Background 2635 0.034 84.28 1.87 4.09 1.46 0.11 2.71 <0.002 0.6Contaminated A-5 7533 6.821 114.37 18.82 17.60 7.16 0.08 201.01 1.20 187.7

WSRC-TR-2001-00032, REV. 0
Page 36
4.2.2 Contaminant Uptake by Plants Growing in the TNX OD
As part of a preliminary study, five plants and unsorted tree leaf litter collected fromcoordinate A-5 were analyzed for targeted contaminant concentrations (Table 10). Inaddition to reporting contaminant concentrations in the plants, the data were normalized fordifferences in soil contaminant concentrations by calculating total concentration ratios (CR-T= mg/kg dry plant / total mg/kg dry soil). It is important to normalize the plant contaminantconcentrations in this manner to provide insight as to the cause for low plant contaminantconcentrations. Low plant contaminant concentrations could be the result of low soilcontaminant concentrations, the contaminant existing in a non-biologically available form, orthe plant can avoid the soil contaminant. By expressing the plant uptake data asconcentration ratios, it is possible to rule out the first cause, that is, that soil contaminantconcentrations were low.
One herbaceous plant, the netted-chain fern (Woodwardia areolata), had relatively large totalconcentration ratios, especially for U, Th, and Hg. Also important is that the tree leaf littercontained appreciable concentrations of the targeted contaminants. This is notable becausethe biomass of the leaf litter is large in this area, and will always account for a majority of theannual litter biomass, even if a monoculture of an herbaceous hyperaccumulater was to beintroduced to the site for remediation purposes. The leaf litter had high concentration of Co(17 mg/kg) and also a high total concentration ratio (4.59). The exceptionally high Coconcentration and total concentration ratio in the leaf litter needs confirmation.
Table 10. Elemental composition and total concentration ratio (plant concentration/total soilconcentration) of plants collected from coordinate A-5 within the TNX OD on November 11,1999.
Co Cr Hg Pb U-238 Th-232Plant/Treespecies
mg/kg
CR-T
mg/kg
CR-T
mg/kg
CR-T
mg/kg
CR-T
mg/kg
CR-T mg/kg
CR-T
Netted-chainFern(a)
2.4 0.65 4.7 0.11 0.8 0.12 0.7 0.17 20.7 0.11 21.5 0.107
Switchcane 0.8 0.10 1.7 0.04 BDL --- 0.6 0.15 0.6 0.003 0.8 0.004Red maple 0.3 0.08 1.0 0.02 0.1 0.01 0.3 0.07 0.3 0.002 0.3 0.002Bald-cypress 0.4 0.11 0.8 0.02 0.0 0.00 0.2 0.05 0.2 0.001 0.3 0.002
Sweetgum 0.5 0.14 1.0 0.02 0.1 0.01 0.2 0.05 4.0 0.021 0.3 0.002Leaf-litter(b) 17.0 4.59 1.1 0.02 BDL --- 0.3 0.07 2.9 0.015 0.3 0.002(a) Scientific names for plants are presented in Appendix A.(b) This was an assorted subsample taken directly from the leaf-litter collection baskets. The other tree leafsamples reported in this table were from another subsample that was sorted by tree specie.(c) B.D.L. = below detection limit, which is ~0.01 mg/L Hg.

WSRC-TR-2001-00032, REV. 0
Page 37
The remainder of this section will present the data from the full field survey, as opposed tothe preliminary data presented above. Correlation coefficients were calculated for the totalconcentration ratios (CR-T; plant concentration/total soil concentration) and the availableconcentration ratios (CR-A; plant concentration/available soil concentration) (Table 11).These correlation coefficients include the data from several plant species and differentlocations at the TNX OD site. The total soil concentrations were appreciably bettercorrelated with plant uptake, as measured by the concentration ratio, than the available soilconcentrations. This finding is surprising in light of the fact that there have been severalstudies conducted in agricultural environments showing the converse to be true (Adriano1986). However, this trend is true for all nine COCs evaluated. Furthermore, the correlationcoefficients for all but one COC, uranium, were significant at the 1- or 5-% level ofprobability. Henceforth, our discussion of concentration ratios will focus on the totalconcentration ratios and total soil concentration data. The available concentration ratio andsoil data are included in Table 35 in Appendix A.
Table 11. Correlation coefficients (r) between concentration ratios and soil concentrations.
Constituent of Concern Soil-T vs. CR-T(a) Soil-A vs. CR-A(a)
Ba (an analog for Ra) -0.52*(b) -0.45Ce (an analog for Ac) -0.70** -0.45
Co -0.49* -0.10Cr -0.74** -0.55*Fe -0.78** -0.53*Hg -0.78** NAMn -0.59** -0.50*Pb -0.76** -0.48*U -0.42 -0.32
(a) Soil-T = total soil concentration, CR-T = plant concentration/total soil concentration,Soil-A = available soil concentration, CR-A = plant concentration/available soilconcentration.(b) * identifies a significant correlation at the ≤0.05 level of probability for 17observations (critical r is ± 0.46).** identifies a significant correlation at the ≤0.01 level of probability for 17observations (critical r is ± 0.58).

WSRC-TR-2001-00032, REV. 0
Page 38
COC concentrations in the leaf litter collected in the sampling baskets are organized in Table12 by plant species. The primary advantage of organizing the data in this manner is that it iseasy to compare COC concentrations in plants grown in contaminated and uncontaminatedportions of the study site. Many of the plants were able to take up more Cr and Co, andespecially U and Th from contaminated soils than from uncontaminated soils. Especiallyhigh Th uptake was observed in tupelo, sweetgum and water oak, and of U uptake by tupelo,sweetgum, and red maple. Oddly, several plants were able to take up more Sr in theuncontaminated soils than in the contaminated soils. The cause for this is not known.
Mn and Fe biogeochemistry was included in this study because the uptake of these twoessential plant nutrients has been shown to have a profound impact on contaminant uptake(Adriano 1986, Mengel and Kirkby 1978). These elements influence plant health becausethey are essential nutrients. These elements influence COC soil retention because they canform strongly sorbing solid oxyhydroxides. Statistical analysis found a significant (P ≤ 0.01)correlation between Fe total concentration ratios and Ba, Cr, Pb, and U total concentrationratios and between Mn total concentration ratios and Ce, Cr, Pb, and U total concentrationratios (Table 13). Unfortunately, no cause and effect can be invoked based on this data andtherefore it is not possible to elucidate any mechanism(s) to explain this data. Suffice it tosay, a strong correlation exists between the uptake of Fe and Mn and a number of the COC.
Concentration ratio data are presented in Table 14 from samples collected in thecontaminated portion of the study site. It is not possible to conduct statistical comparisonsbetween plant species and between elements because neither site nor plant type were heldconstant (e.g., tupelo CR-T data was collected from sites A-5 and B-3, whereas red maplewas collected from C-5 and B-3). However, some rankings can be made based on this data.A ranking of the COCs and Mn and Fe by their total concentration ratios is:
(Mn ≈ Ba) > (Pb ≈ Fe) > (Ce ≈ U) > (Cr ≈ Hg ≈ Th).
Manganese and barium generally had total concentration ratios greater than unity, indicatinghyperaccumulation. This is not altogether surprising in light of the fact that Mn is anessential nutrient and Ba is a chemical analogue to Ca. The total concentration ratios of Cr,Hg, and Th were generally ~1e-2.
Based on this data, there were few plant species that had consistently high concentrationratios at several sites. Among the more consistently high concentration ratios were:
• Co and Ba concentration ratios in tupelo, and• Cr, Ba, and Ce in netted-chain fern.

WSRC-TR-2001-00032, REV. 0
Page 39
The average total concentration ratios are presented in Table 15. Additionally, the plantspecies with the greatest and the second greatest concentration ratio averages are identified.An important caveat needs to be reinforced before discussing this data set. First of all,comparisons between plant species using this data is compromised because the plants werenot collected from soils from the same location, more specifically, they were not collectedfrom soils with the same COC concentrations. This is important because concentration ratiostypically vary with soil contaminant concentrations; specifically, they tend to increase as thesoil contaminant concentrations increase. However, the average total concentration ratios arepresented here because they provide a convenient and condensed metric for discussion.
Among the concentration ratios that stand out are:
• Co and Ba concentration ratios for tupelo,• Cr, Th, and U concentrations ratios for sweetgum, and• Cr, Hg, and Ce concentration ratios for the netted-chain fern.
Perhaps most remarkable about this data is that the leaf litter had unexpectedly highconcentration ratios for a number of COC’s, including Co, U, Ba, Ce, and Pb. This is animportant finding because leaf litter has a large annual biomass and would require relativelylittle effort to utilize for phytoimmobilization. It is also interesting to note that those leaflitter samples with the greatest concentration ratios consisted of relatively higher percentagesof tupelo (Table 5 and Table 6)
Previous work has shown that some ferns can take up high concentrations of metals(Nishizonon et al. 1987, 1988, 1989, Morishita et al. 1992, Ichihasi et al. 1992, Neite et al.1991). During the last few years fern species have been intensively screened for hyper-accumulation of trace elements by different laboratories. Hiraga et al. (1999) found that thehydroxyphenylpentanoic acid, a root exudate, enhanced the uptake and transport of alkalineand alkaline earth metals and heavy divalent metal ions. Ozeki et al. (2000) analyzed theaccumulation of trace elements in 96 species of ferns by instrumental neutron activationanalysis and found that trace element accumulation is highly variable and species dependent.Dryopteris erythrosora was found to take up large amounts of the lanthanides and rare earthelements under natural conditions (Ozeki et al. 2000). Recently, Ma et al. (2000) discoveredthat the Blake fern (Pteris vitatta) hyperaccumulates arsenic, with concentration ratios ashigh as 200. They theorize that the presence of arbuscular mycorrhizal fungi in these plantsenhance the ability of these plants to take up high concentrations of arsenic. Arbuscularmycorrhizal fungi grow within plant roots and into the soil and greatly increase the ability ofthe plant to extract soil nutrients and solutes.

WSRC-TR-2001-00032, REV. 0
Page 40
Table 12. COCs concentrations (mg/kg dry wt.) of leaves recovered from the TNX-OD study site (table continues on next page).
PlantSpecies
Type of Site SiteLocation(a)
Hg Cr Co Sr Cs Pb U Eu(d) Mn Fe Th
Non-contaminated
Ctrl 46Ctrl 46d
BDL(b)
BDLBDLBDL
1.71.8
177174
0.140.43
0.570.57
0.650.61
0.870.87
32303097
203207
0.0280.032
Tupelo(b)
Contaminated A-5B-3
B-3wD-8
0.010.05BDL0.06
0.430.470.290.59
19.220.218.022.1
58.047.641.743.3
0.220.110.110.90
1.00.420.350.62
2.48.99.01.2
0.050.030.020.03
171211449911349
145131123179
10.37.55.12.0
Non-contaminated
Ctrl 45 BDL BDL 0.15 102 0.17 0.34 0.04 0.05 1241 244 0.041Sweetgum
Contaminated A-5D-3B-4B-4d
0.030.040.020.03
0.650.780.610.89
0.740.470.370.36
89.488.054.155.0
0.150.190.100.16
0.950.620.350.41
1.717.07.06.9
0.010.030.020.02
1805226812531258
138214177185
4.76.84.73.9
Non-contaminated
Ctrl 41 0.05 BDL 0.79 73 0.54 0.78 BDL 0.04 1314 259 0.008Cypress
Contaminated A-5C-5B-3
0.100.070.06
0.861.070.50
0.760.252.9
49.638.635.4
11.20.100.07
2.61.0
0.59
0.200.370.26
0.020.020.01
541250281
166142123
0.5350.3470.180
(a) Site location are presented in Figure 8(b) Leaf samples were collected between November 9, 1999 and March 15, 2000.(c) BDL = Below detection limit(d) Eu is an analog for Ac.

WSRC-TR-2001-00032, REV. 0
Page 41
Table 12 (Continuation). COCs concentrations (mg/kg dry wt.) of leaves recovered from the TNX-OD study site.
PlantSpecies
Type of Site SiteLocation(a)
Hg Cr Co Sr Cs Pb U Eu(c) Mn Fe Th
Non-contaminated
Ctrl 41Ctrl 42Ctrl 44
BDL(b)
0.020.02
BDLBDLBDL
0.240.430.09
40.248.125
0.260.150.05
0.220.270.19
BDLBDLBDL
0.020.030.01
34693241967
14610075
0.0180.0090.011
Water oak(b)
Contaminated A-5wB-3D-8
0.060.060.01
0.350.350.41
0.340.761.39
54.952.426.6
0.160.120.14
0.620.310.32
0.100.051.2
0.040.030.02
272621611701
183159188
1.51.32.1
Non-contaminated
Ctrl 41Ctrl 42Ctrl 44
BDL0.09BDL
BDLBDLBDL
0.450.750.22
14.316.910.1
0.310.150.10
0.200.220.24
BDLBDLBDL
0.0060.0050.005
17921623716
13010090
0.0100.008BDL
LoblollyPine
Contaminated A-5C-5D-8
0.020.020.06
0.410.700.54
0.450.161.78
15.88.8
11.2
0.060.210.09
0.560.780.40
0.110.810.06
0.0060.0080.007
969308753
697970
0.130.240.24
Non-contaminated
Ctrl 43 0.03 BDL 0.61 108 0.41 1.1 0.03 0.05 2293 309 BDLRed Maple
Contaminated A-5A-5wC-5C-5dB-5
B-5wB-3
B-3w
0.060.050.080.060.070.020.030.06
0.470.501.20.9
0.620.650.520.38
0.560.720.190.150.320.396.56.8
59.545.241.066.451.456.780.375.4
0.770.090.520.190.150.080.140.08
0.740.631.21.1
0.700.890.680.74
0.210.288.17.7
0.210.711.1
0.81
0.020.020.020.020.010.010.020.02
8469591077995580594816776
225250179165258300208207
0.340.220.510.460.370.280.900.70
Non-contaminated
Ctrl 41Ctrl 42Ctrl 44
0.060.04BDL
BDLBDLBDL
0.775.3
0.52
37.749.898.2
0.940.110.20
0.801.320.64
0.02BDL0.02
0.020.030.12
152414562025
183159188
0.0240.0270.025
Leaf litter(d)
Contaminated A-5C-5B-5B-3
0.060.070.050.04
0.521.240.520.60
1.890.240.838.86
62.242.449.950.9
1.70.230.090.09
0.811.2
0.830.69
0.552.01.23.7
0.020.020.020.02
883651582745
187216186177
2.50.71.92.6

WSRC-TR-2001-00032, REV. 0
Page 42
(a) Site location are presented in Figure 8; w- washed control; d- duplicate. Leaf samples were collected between November 9, 1999 and March 15, 2000.(b) BDL = Below detection limit(c) Eu is an analog for Ac.(d) This was an assorted subsample taken directly from the leaf-litter collection baskets; the remainder of the sample was sorted by species.

WSRC-TR-2001-00032, REV. 0
Page 43
Table 13. Correlation coefficients (r) between Mn or Fe and COC total concentration ratios (CR-T).
COC Mn CR-T Fe CR-TBa (an analog for Ra) 0.26 0.64**Ce (an analog for Ac) 0.69** 0.53*
Co 0.41 0.30Cr 0.77** 0.78**Fe 0.78** --Hg 0.08 0.32Mn -- 0.78**Pb 0.82** 0.77**U 0.79** 0.61**
(a) CR-T = plant concentration/total soil concentration, Soil-A = available soilconcentration, CR-A = plant concentration/available soil concentration.(b) * identifies a significant correlation at the ≤0.05 level of probability for 17observations (critical r is ± 0.46).** identifies a significant correlation at the ≤0.01 level of probability for 17observations (critical r is ± 0.58).

WSRC-TR-2001-00032, REV. 0
Page 44
Table 14. Total soil and plant concentrations (mg/kg; dry wt.) and total concentration ratios (CR-T; plant conc./total soil conc.) (tablecontinues on following page).
Co Cr Hg ThPlant Species SiteLocation(a)
Soil-T Plant CR-T Soil-T Plant CR-T Soil-T Plant CR-T Soil-T Plant CR-TA5 15.3 19.2 1.3 185.8 0.43 0.002 9.75 0.01 0.001 881 10.3 0.012Tupelo(b)
B3 23.3 20.2 0.87 240 0.47 0.002 0.05 413 7.5 0.018A5 15.3 0.74 0.05 185.8 0.65 0.003 9.75 0.03 0.003 881 4.7 0.005D3 0.47 9.21 0.78 0.085 0.04 22 6.8 0.309
Sweet-gum
B4 23.4 0.37 0.02 287 0.61 0.002 1.22 0.02 0.016 611 4.7 0.008C5 0.168 0.19 1.1 19.9 1.2 0.060 12.1 0.08 0.007 25 0.51 0.020Red MapleB3 23.3 6.5 0.28 240 0.52 0.002 0.03 413 0.9 0.002A5 15.3 0.34 0.02 185.8 0.35 0.002 9.75 0.06 0.006 881 1.5 0.002Water OakB3 23.3 0.76 0.03 240 0.35 0.001 0.06 413 1.3 0.003A5 15.3 0.45 0.03 185.8 0.41 0.002 9.75 0.02 0.002 881 0.13 0.0001Loblolly PineC5 0.168 0.16 0.95 19.9 0.7 0.035 12.1 0.02 0.002 25 0.24 0.010C5 0.168 0.24 1.43 19.9 1.24 0.062 12.1 0.07 0.006 25 0.7 0.028B5 0.915 0.83 0.91 33.4 0.52 0.016 3.72 0.05 0.013 329 1.9 0.006
Leaf Litter
B3 23.3 8.86 0.38 240 0.6 0.003 0.04 413 2.6 0.006A5 15.3 0.32 0.02 185.8 1 0.005 9.75 0.07 0.007 881 3.2 0.004C2 0.17 37.1 1.58 0.043 0.04 81 0.5 0.006C3 0.23 4.7 0.71 0.151 0.07 11 0.02 0.002
Netted ChainFern(c)
B5 0.915 0.31 0.34 33.4 0.65 0.019 3.72 0.09 0.024 329 2.7 0.008(a) For site location see Figure 8.(b) Leaf samples were collected between November 9, 1999 and March 15, 2000.(c) Netted chain fern sample was collected March 22, 2000.

WSRC-TR-2001-00032, REV. 0
Page 45
Table 14 (Continuation). Total soil and plant concentrations (mg/kg; dry wt.) and total concentration ratios (CR-T; plant conc./totalsoil conc.).
Ba(d) Ce(d) Pb MnPlant Species SiteLocation(a)
Soil-T Plant CR-T Soil-T Plant CR-T Soil-T Plant CR-T Soil-T Plant CR-TA5 15.2 324 21.3 69 0.43 0.006 17.2 1 0.058 662 1712 2.6Tupelo(b)
B3 21 169 8.0 64 0.3 0.005 16.3 0.42 0.026 250 1144 4.6A5 15.2 183 12.0 69 1.4 0.020 17.2 0.95 0.055 662 1805 2.7D3 3.6 188 52.2 9.2 0.83 0.090 2 0.62 0.310 96 2268 23.6
Sweet-gum
B4 15.6 72 4.6 68 0.64 0.009 14.7 0.35 0.024 230 1253 5.4C5 4.8 46 9.6 5.7 1.11 0.195 2 1.2 0.600 17 1077 63.4Red MapleB3 21 97 4.6 64 0.7 0.011 16.3 0.7 0.043 250 580 2.3A5 15.2 130 8.6 69 1.5 0.022 17.7 0.62 0.035 662 2726 4.1Water OakB3 21 129 6.1 64 0.98 0.015 16.3 0.31 0.019 250 2161 8.6A5 15.2 15 1.0 69 0.44 0.006 17.2 0.56 0.033 662 969 1.5Loblolly PineC5 4.8 8 1.7 5.7 1.07 0.188 2 0.78 0.390 17 308 18.1C5 4.8 78 16.3 5.7 1.11 0.195 2 1.2 0.600 17 651 38.3B5 30 58 1.9 19 0.53 0.028 11 0.83 0.075 36 582 16.2
Leaf Litter
B3 21 106 5.0 64 0.57 0.009 16.3 0.69 0.042 250 745 3.0A5 15.2 95 6.3 69 4.9 0.071 17.2 0.32 0.019 662 246 0.4C2 5 70 14.0 34 3.7 0.109 4.5 0.18 0.040 82 85 1.0C3 4.8 84 17.5 3.9 2.4 0.615 1.6 0.22 0.138 6.7 313 46.7
Netted ChainFern (c)
B5 30 67 2.2 19 3.8 0.200 11 0.23 0.021 36 226 6.3(a) Leaf samples were collected between November 9, 1999 and March 15, 2000.(b) For site location see Figure 8.(c) Netted chain fern sample collected March 22, 2000.(d) Ba is an analog for Ra and Ce is an analog for Ac.

WSRC-TR-2001-00032, REV. 0
Page 46
Table 14 (Continuation). Total soil and plant concentrations (mg/kg; dry wt.) and total concentration ratios (CR-T; plant conc./total soilconc.).
U FePlant Species SiteLocation(a)
Soil-T Plant CR-T Soil-T Plant CR-TA5 288 2.4 0.008 27068 145 0.005Tupelo(b)
B3 627 8.9 0.014 8789 131 0.015A5 288 1.7 0.006 27068 138 0.005D3 9.66 17 1.760 2977 214 0.072
Sweet-gum
B4 348 7 0.020 21457 177 0.008C5 1.4 8.1 5.786 3332 179 0.054Red MapleB3 627 1.1 0.002 8759 258 0.029A5 288 0.1 0.0003 27068 183 0.007Water OakB3 627 0.05 0.0001 8789 159 0.018A5 288 0.11 0.0004 27068 69 0.003Loblolly PineC5 1.4 0.81 0.579 3332 79 0.024C5 1.4 2 1.429 3332 216 0.065B5 44 1.2 0.027 19954 186 0.009
Leaf Litter
B3 627 3.7 0.006 8759 177 0.020A5 288 1.42 0.005 27068 239 0.009C2 144 0.25 0.002 5927 98 0.017C3 1.53 0.09 0.059 1820 93 0.051
Netted ChainFern (c)
B5 44 1.1 0.025 19954 176 0.009(a) Leaf samples were collected between November 9, 1999 and March 15, 2000.(b) For site location see Figure 8.(c) Netted chain fern sample collected March 22, 2000.

WSRC-TR-2001-00032, REV. 0
Page 47
Table 15. Average total concentration ratios (CR-T; plant conc./total soil conc.) values.
Plant Species Co Cr Hg Th U Ba(c) Ce(c) Pb Mn FeTupelo 1.09
± 0.30(a)0.002
± 0.0000.001 0.015
± 0.0050.011
± 0.00414.7
± 9.380.005
± 0.0010.042
± 0.0233.6
± 1.40.010
± 0.007Sweetgum 0.04
± 0.020.043
± 0.0470.009 0.158
± 0.2130.595
± 1.00923
± 5.30.040
± 0.010.130
± 0.0210.6
± 1.90.028
± 0.00Red Maple 0.28
± 0.580.031
± 0.0410.007 0.011
± 0.0130.002 7.1
± 3.50.011 0.43
± 0.392.3 0.029
Water Oak 0.03 ± 0.01
0.002 ± 0.000
0.006 0.002 ± 0.001
0.0002 ± 0.0002
7.3 ± 1.7
0.019 ± 0.000
0.027 ± 0.011
6.4 ± 3.2
0.012 ± 0.01
Loblolly Pine 0.49 ± 0.65
0.019 ± 0.023
0.002 0.005 ± 0.007
0.289 ± 0.409
1.3 ± 0.5
0.097 ± 0.13
0.211 ± 0.25
9.8 ± 11.8
0.013 ± 0.01
Leaf Litter 0.64 ± 0.52
0.009 ± 0.03
0.009 0.006 ± 0.013
0.487 ± 0.82
7.7 ± 7.5
0.077 ± 0.100
0.239 ± 0.311
19.1 ± 17.8
0.031 ± 0.03
Netted-ChainFern(d)
0.18 ± 2.62
0.085 ± 0.06
0.016 0.005 ± 0.003
0.023 ± 0.21
10 ± 6.4
0.249 ± 0.23
0.054 ± 0.111
13.6 ± 19.4
0.021 ± 0.02
Greatest CR-T Tupelo Netted-chainFern
Netted-chain Fern
Sweet-gum
Sweetgum Sweetgum Netted-chainFern
Leaf litter LeafLitter
LeafLitter
2nd GreatestCR-T
Leaf litter Sweet-gum
Leaf LitterSweetgum
Tupelo Leaf litter Tupelo LoblollyPine
LoblollyPine
Netted-chain Fern
RedMaple
(a) The number of observations for each mean varies; tupelo =2, sweetgum =3, red maple = 1 or 2, water oat = 2, pine = 2, leaf litter = 3, NettedChain Fern between 2 and 5. The site locations from which plant and soil samples were collected vary between plant species, thus,concentration ratio comparisons between plant species is compromised.(b) Tree leaves were collected between November 9, 1999 and March 15, 2000.(c) Ba is an analog for Ra and Ce is an analog for Ac.(d) This was an assorted subsample taken directly from the leaf-litter collection baskets; the remainder of the sample was sorted by species.

WSRC-TR-2001-00032, REV. 0
Page 48
The concentration ratios of several plant species were compared at three coordinates whereCOC concentrations were relatively high: coordinates A-5 (Table 16), B-3 (Table 17), and C-5 (Table 18). These data sets are important because the soil COC concentrations at any givencoordinate are assumed to be similar between plant species. Unfortunately, there are noreplicates in this data.
Among the concentration ratios from coordinate A-5 (Table 16) that are exceptionally largeare:
• Co, Th, and Ba concentration ratios for tupelo, and• Ce concentration ratio for netted-chain fern.
None of the concentration ratios from coordinate B-3 (Table 17) appear exceptionally large.Among the concentration ratios from coordinate C-5 (Table 18) that are exceptionally largeare:
• U concentration ratio for red maple, and• U concentration ratio for leaf litter.
Another important observation from these data is that the concentration ratios for a givenCOC at a given coordinate location appear to have less difference between the various plantspecies, than when the coordinate location varied. This suggests that some of the apparentdifferences between the plant species may be attributed to factors other than the plantsthemselves, factors such as analytical or laboratory error.

WSRC-TR-2001-00032, REV. 0
Page 49
Table 16. COC concentrations (mg/kg; dry weight) and total concentration ratios (CR-T; plant conc./total soil conc.) from leaves andsoils collected from coordinate A-5 at the TNX-OD study site.
Co Cr Hg Th USoil Conc. (mg/kg) 15.3 185.8 9.75 881 288
Plant CR-T Plant CR-T Plant CR-T Plant CR-T Plant CR-TTupelo(a) 19.2 1.3 0.43 0.002 0.01 0.001 10.3 0.012 2.4 0.008Sweetgum 0.74 0.05 0.65 0.003 0.03 0.003 4.7 0.005 1.7 0.006Water Oak 0.34 0.02 0.35 0.002 0.06 0.006 1.5 0.002 0.1 0.0003Loblolly Pine 0.45 0.03 0.41 0.002 0.02 0.002 0.13 0.0001 0.11 0.0004Leaf Litter(b) 1.8 0.118 0.52 0.003 0.07 0.006 2.5 0.003 0.55 0.002Netted-chain Fern(a) 0.32 0.02 1 0.005 0.07 0.007 3.2 0.004 1.42 0.005(a) Leaf samples were collected between November 9, 1999 and March 15, 2000.(b) This was an assorted subsample taken directly from the leaf-litter collection baskets; the remainder of the sample was sorted by species.(c) Netted-chain fern samples were collected March 22, 2000.
Table 16 (Continuation). COC concentrations (mg/kg; dry weight) and total concentration ratios (CR-T; plant conc./total soil conc.)from leaves and soils collected from coordinate A-5 at the TNX-OD study site.
Ba(d) Ce(d) Pb Mn FeTotal Soil (mg/kg) 15.2 69 17.2 662 27068
Plant CR Plant CR-T Plant CR-T Plant CR-T Plant CR-TTupelo(a) 324 21.3 0.43 0.006 1 0.058 1712 2.6 145 0.005Sweetgum 183 12.0 1.4 0.020 0.95 0.055 1805 2.7 138 0.005Water Oak 130 8.6 1.5 0.022 0.62 0.035 2726 4.1 183 0.007Loblolly Pine 15 1.0 0.44 0.006 0.56 0.033 969 1.5 69 0.003Leaf Litter(b) 107 7.4 0.93 0.013 0.81 0.047 883 1.33 187 0.007Netted-chain Fern(c) 95 6.3 4.9 0.071 0.32 0.019 246 0.4 239 0.009(a) Leaf samples were collected between November 9, 1999 and March 15, 2000.(b) This was an assorted subsample taken directly from the leaf-litter collection baskets; the remainder of the sample was sorted by species.(c) Netted-chain fern samples were collected March 22, 2000.(d) Ba is an analog for Ra and Ce is an analog for Ac.

WSRC-TR-2001-00032, REV. 0
Page 50
Table 17. COC concentrations (mg/kg; dry weight) and total concentration ratios (CR-T; plant conc./total soil conc.) from leaves andsoils collected from coordinate B-3 at the TNX-OD study site.
Total Soil (mg/kg)Co
23.3Cr
240Hg
0.03Th413
U627
Plant CR Plant CR Plant CR Plant CR Plant CRTupelo(a) 20.2 0.87 0.47 0.002 0.05 NA 7.5 0.018 8.9 0.014Red Maple 6.5 0.28 0.52 0.002 0.03 NA 0.9 0.002 1.1 0.002Water Oak 0.76 0.03 0.35 0.001 0.06 NA 1.3 0.003 0.05 0.0001Leaf Litter(b) 8.86 0.38 0.6 0.003 0.04 NA 2.6 0.006 3.7 0.006(a) Leaf samples were collected between November 9, 1999 and March 15, 2000.(b) This was an assorted subsample taken directly from the leaf-litter collection baskets; the remainder of the sample was sorted byspecies.
Table 17 (Continuation). COC concentrations (mg/kg; dry weight) and total concentration ratios (CR-T; plant conc./total soil conc.)from leaves and soils collected from coordinate B-3 at the TNX-OD study site.
Total Soil (mg/kg)Ba(c)
21Ce(c)
64Pb
16.3Mn250
Fe8789
Plant CR-T Plant CR-T Plant CR-T Plant CR-T Plant CR-TTupelo(a) 169 8.0 0.3 0.005 0.42 0.026 1144 4.6 131 0.015Red Maple 97 4.6 0.7 0.011 0.7 0.043 580 2.3 258 0.029Water Oak 129 6.1 0.98 0.015 0.31 0.019 2161 8.6 159 0.018Leaf Litter(b) 106 5.0 0.57 0.009 0.69 0.042 745 3.0 177 0.020(a) Leaf samples were collected between November 9, 1999 and March 15, 2000.(b) This was an assorted subsample taken directly from the leaf-litter collection baskets; the remainder of the sample was sorted byspecies.(c) Ba is an analog for Ra and Ce is an analog for Ac.
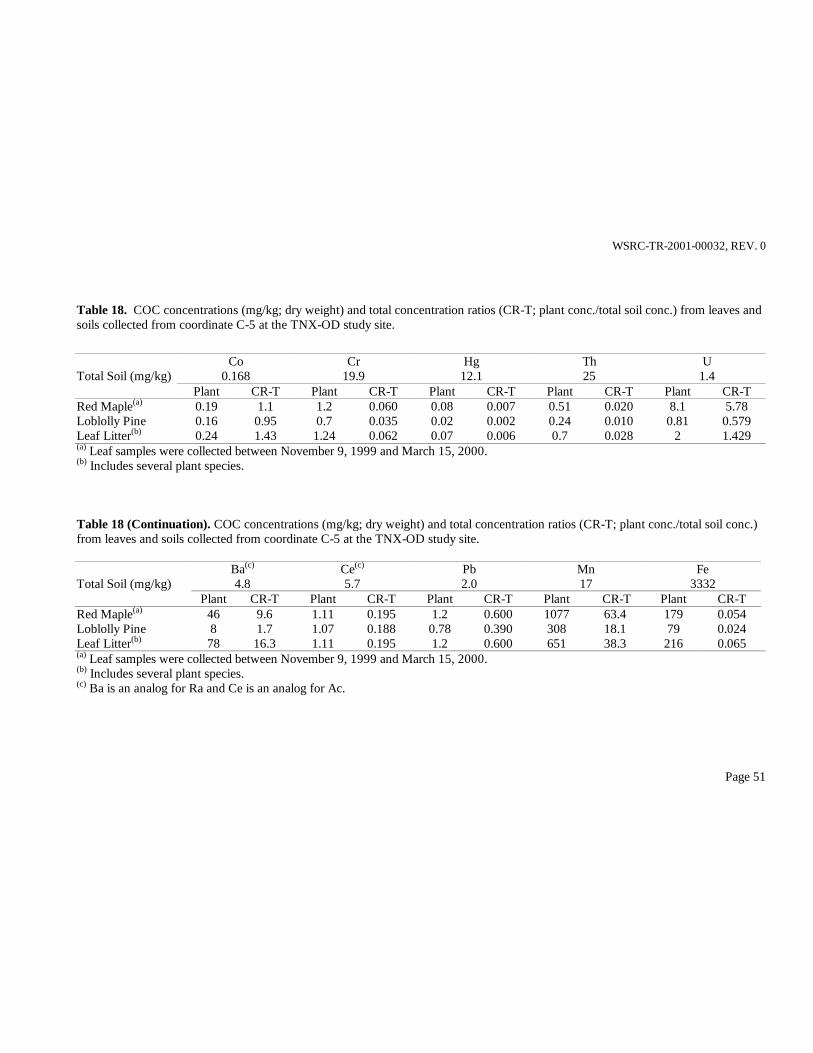
WSRC-TR-2001-00032, REV. 0
Page 51
Table 18. COC concentrations (mg/kg; dry weight) and total concentration ratios (CR-T; plant conc./total soil conc.) from leaves andsoils collected from coordinate C-5 at the TNX-OD study site.
Total Soil (mg/kg)Co
0.168Cr
19.9Hg
12.1Th25
U1.4
Plant CR-T Plant CR-T Plant CR-T Plant CR-T Plant CR-TRed Maple(a) 0.19 1.1 1.2 0.060 0.08 0.007 0.51 0.020 8.1 5.78Loblolly Pine 0.16 0.95 0.7 0.035 0.02 0.002 0.24 0.010 0.81 0.579Leaf Litter(b) 0.24 1.43 1.24 0.062 0.07 0.006 0.7 0.028 2 1.429(a) Leaf samples were collected between November 9, 1999 and March 15, 2000.(b) Includes several plant species.
Table 18 (Continuation). COC concentrations (mg/kg; dry weight) and total concentration ratios (CR-T; plant conc./total soil conc.)from leaves and soils collected from coordinate C-5 at the TNX-OD study site.
Total Soil (mg/kg)Ba(c)
4.8Ce(c)
5.7Pb2.0
Mn17
Fe3332
Plant CR-T Plant CR-T Plant CR-T Plant CR-T Plant CR-TRed Maple(a) 46 9.6 1.11 0.195 1.2 0.600 1077 63.4 179 0.054Loblolly Pine 8 1.7 1.07 0.188 0.78 0.390 308 18.1 79 0.024Leaf Litter(b) 78 16.3 1.11 0.195 1.2 0.600 651 38.3 216 0.065(a) Leaf samples were collected between November 9, 1999 and March 15, 2000.(b) Includes several plant species.(c) Ba is an analog for Ra and Ce is an analog for Ac.

WSRC-TR-2001-00032, REV. 0
Page 52
Not all of the herbaceous plants collected during the survey were chemically analyzed priorto the project being terminated. However, data was collected on various ferns. For the mostpart, the ferns that were sampled were collected from among the most contaminated areas, aswell as from background areas. The plant concentrations are presented in Table 19 and thetotal concentration ratios are presented in Table 20. The total concentration ratios of thenetted-chain fern tended to be higher in the non-contaminated soil. There was no compellingevidence that any one fern species had higher total concentrations ratios than the others, withone notable exception; the ebony spleenwort appeared to take up large amounts of Eu.
One of the uncertainties in this study was whether plant COC concentrations changed duringthe course of the year. To address this question, samples of netted-chain ferns were collectedin March, April, and November from coordinate A-5 (Figure 10). For all elements analyzed,the plant concentrations increased three to ten fold during the growing season. Presumably,this may be the result of the plants growing vigorously during the spring, thereby taking up alot of water and dissolved constituents. Over the course of the growing season, the watertranspires from the leaves and the contaminants accumulate in the plant tissue. Anotherprocess that may be contributing to this trend is that the increased water uptake during thespring may dilute the plant contaminant concentration. This trend is ideal for thephytoimmobilization technology because the concentration of the COC would be at theirmaximum in the autumn, when the leaves would fall to the geomat.

WSRC-TR-2001-00032, REV. 0
Page 53
Table 19. COCs concentration in four fern plants (mg/kg; dry weight) collected at the TNX OD study site.
Plant(a) Type ofSite
SiteLocation(b)
Hg Cr Co Sr Cs Pb U Eu(e) Mn Fe Th
Non-cont. K-26 0.07 7.9 1.4 51 0.7 0.96 0.25 0.13 1977 565 0.52A-5 0.13 1.0 0.32 16.4 0.76 0.32 1.42 0.06 246 239 3.2
A-5w(c) 0.08 0.24 0.22 14.9 0.79 0.27 0.40 0.04 257 93 NA(d)
A-7w(c) 0.06 0.32 0.24 14.8 0.24 0.17 0.56 0.04 304 94 NAB-8w(c) 0.07 0.36 0.37 13.2 0.44 0.12 0.59 0.04 351 91 NA
C-2 0.04 1.58 0.17 15.1 0.26 0.18 0.25 0.04 85 98 NAC-3 0.07 0.71 0.23 30.4 1.49 0.22 0.09 0.03 313 93 NAB-5 0.09 0.65 0.31 15.3 0.61 0.23 1.1 0.05 226 176 NAG-3 0.06 0.61 0.22 18.1 0.26 0.23 0.40 0.05 200 113 NAA-4 0.08 0.54 0.30 18.0 0.30 0.21 0.65 0.06 347 117 NA
Netted-chainFern Cont.
A-4d(c) 0.05 0.69 0.29 16.7 0.39 0.19 0.59 0.05 318 116 NANon-cont. Ctrl 43 0.08 BDL(d) 0.71 87 2.6 0.35 BDL 0.13 182 160 NA
A-7w(c) 0.04 BDL 0.39 28.5 0.26 0.25 0.32 0.03 62 82 NAK-18w(c) 0.04 0.30 0.27 30.7 0.63 0.16 1.1 0.05 58 83 NA
Sensitive FernCont.
A-4 0.03 0.63 0.32 19.1 0.42 0.20 0.51 0.07 248 116 NANon-cont. K-24 0.04 BDL 1.00 37 0.50 0.26 BDL 0.51 131 244 NA
K-18w(c) 0.03 0.33 0.11 21.6 0.16 0.15 0.03 0.01 65 99 NAMarginal
Wood Ferm. Cont.D-7 0.03 0.59 0.31 13.2 1.56 0.41 0.07 0.01 96 75 NA
Non-cont. Ctrl 44 BDL BDL 0.09 24.1 0.41 0.21 BDL 0.05 54 108 NAD-3 0.08 0.90 0.08 30.0 0.37 0.36 0.97 0.11 184 125 NAD-4 0.04 0.52 0.03 17.5 1.50 0.15 0.03 0.04 45 73 NAD-5 0.11 1.00 0.05 22.0 1.44 0.29 0.20 0.08 100 103 NA
EbonySpleenwort Cont.
D6 0.05 0.54 0.04 15.0 0.89 0.20 0.04 0.03 108 95 NA(a) Scientific names of plants presented in Appendix A; Samples collected on March 22, 2000.(b) Site locations are presented in Figure 8.(c) w = washed control, d = duplicate.(d) NA = not available due to data not satisfying QA requirements. BDL = below detection limits.(e) Eu is an analog for Ac.
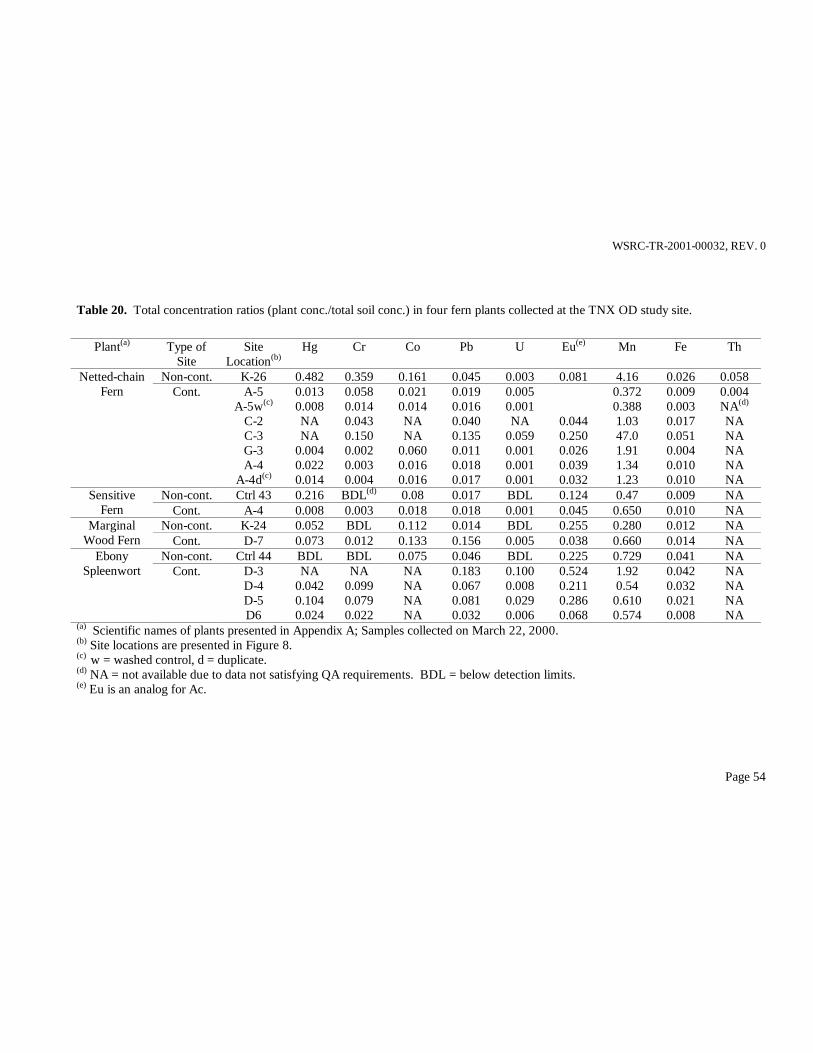
WSRC-TR-2001-00032, REV. 0
Page 54
Table 20. Total concentration ratios (plant conc./total soil conc.) in four fern plants collected at the TNX OD study site.
Plant(a) Type ofSite
SiteLocation(b)
Hg Cr Co Pb U Eu(e) Mn Fe Th
Non-cont. K-26 0.482 0.359 0.161 0.045 0.003 0.081 4.16 0.026 0.058A-5 0.013 0.058 0.021 0.019 0.005 0.372 0.009 0.004
A-5w(c) 0.008 0.014 0.014 0.016 0.001 0.388 0.003 NA(d)
C-2 NA 0.043 NA 0.040 NA 0.044 1.03 0.017 NAC-3 NA 0.150 NA 0.135 0.059 0.250 47.0 0.051 NAG-3 0.004 0.002 0.060 0.011 0.001 0.026 1.91 0.004 NAA-4 0.022 0.003 0.016 0.018 0.001 0.039 1.34 0.010 NA
Netted-chainFern Cont.
A-4d(c) 0.014 0.004 0.016 0.017 0.001 0.032 1.23 0.010 NANon-cont. Ctrl 43 0.216 BDL(d) 0.08 0.017 BDL 0.124 0.47 0.009 NASensitive
Fern Cont. A-4 0.008 0.003 0.018 0.018 0.001 0.045 0.650 0.010 NANon-cont. K-24 0.052 BDL 0.112 0.014 BDL 0.255 0.280 0.012 NAMarginal
Wood Fern Cont. D-7 0.073 0.012 0.133 0.156 0.005 0.038 0.660 0.014 NANon-cont. Ctrl 44 BDL BDL 0.075 0.046 BDL 0.225 0.729 0.041 NA
D-3 NA NA NA 0.183 0.100 0.524 1.92 0.042 NAD-4 0.042 0.099 NA 0.067 0.008 0.211 0.54 0.032 NAD-5 0.104 0.079 NA 0.081 0.029 0.286 0.610 0.021 NA
EbonySpleenwort Cont.
D6 0.024 0.022 NA 0.032 0.006 0.068 0.574 0.008 NA(a) Scientific names of plants presented in Appendix A; Samples collected on March 22, 2000.(b) Site locations are presented in Figure 8.(c) w = washed control, d = duplicate.(d) NA = not available due to data not satisfying QA requirements. BDL = below detection limits.(e) Eu is an analog for Ac.

WSRC-TR-2001-00032, REV. 0
Page 55
Figure 10. Elemental concentrations in netted-chain ferns as a function of harvesting date.
0
1
2
3
4
5
Plan
t Con
c. (m
g/kg
)Co Cr Hg Pb
3/22/004/18/0011/11/99
0
10
20
30
Plan
t Con
c.
(mg/
kg)
Th U
3/22/004/18/0011/11/99
0
500
1000
1500
2000
Plan
t Con
c.
(mg/
kg)
Mn Fe
3/22/004/18/0011/11/99

WSRC-TR-2001-00032, REV. 0
Page 56
4.3 PLANT UPTAKE GREENHOUSE EXPERIMENT
The objective of the Plant Uptake Greenhouse Experiment was to determine the proportionof COC that netted-chain fern (Woodwardia areolata) and Bermuda grass (Cynnodondactylon) would take up from three TNX OD soils. Two of the soils were collected from thecontaminated site (coordinates B-5 and C-5) and one soil was collected from a nearby non-contaminated area (referred to as the background soil). The netted-chain fern was selected inthis test because a preliminary survey of plant uptake at the study site showed that this planthad relatively high concentration ratios. The Bermuda grass was selected as an example of amonocotyledon, which generally do not translocate metals from roots to the abovegroundportion of the plant, and because its seeds were readily available. Bermuda grass would notbe expected to grow well in wetlands. The Bermuda grass was grown under two fertilizerregimes, with and without 25-kg/ha 10-10-10, N-P-K fertilizer. Fertilizer was included as avariable because it was anticipated that the Bermuda grass would not grow well in the TNXOD soils. The netted-chain fern was grown without adding fertilizer.
The B-5 contaminated soil (Table 22) had higher contamination levels than the C-5 soil(Table 23) for all COC except Hg. Perhaps more importantly, the background soil, collected~100-m south of the contamination site, contained rather high concentrations of Cd (3.4mg/kg) and Co (1.2 mg/kg). These are pollutants because they exceed typical wetlandbackground levels by more than an order of magnitude (Dixon et al. 1997). The netted-chainfern hyperaccumulated (had a total concentration ratio greater than unity) Co, Mn, and Hgfrom the background soil (Table 21), Co and Mn in the B-5 (Table 22) and C-5 (Table 23)soils. It had total concentration ratios between 0.1 and 1 for Cr, Cs, Hg, and U when grownin the background soil, for Cd, Cr, Cs, Hg, Pb, and U when grown in the B-5 soil, and Cd,Cr, Cs, Fe, Pb, Th, and U when grown in the C-5 soil. Stated differently, the netted-chainfern had a total concentration ratio greater than 0.1 for all COCs except Hg (in soil C-5) andTh (in B-5 and the background soils).
As anticipated, the Bermuda grass generally had appreciably lower total concentration ratiosthan the netted-chain fern when grown in the background soil (Table 24), the B-5contaminated soil (Table 25), and the C-5 contaminated soil (Table 26). The netted-chainfern had total concentration ratios that were at least an order of magnitude greater those ofthe Bermuda grass for 14 of the 24 COCs (not including Fe and Mn). Compared to theBermuda grass, the netted-chain fern was especially effective at taking up Co, Th, and U andin two of the soils (background and B-5) for Hg. Only 3 of the 24 COC total concentrationratios of the Bermuda grass were greater than those of the netted-chain fern. The three totalconcentration ratios that were greater for the Bermuda grass were Cs and Pb in thebackground soil (Table 24) and Cs in the C-5 contaminated soil.
The addition of fertilizer to the soils supporting Bermuda grass slightly increased or had noeffect on total concentration ratios (Table 21 and Table 23). In soil C-5, the addition offertilizer increased the total concentration ratios of Cs, Th, and U, and in the background soil

WSRC-TR-2001-00032, REV. 0
Page 57
the fertilizer addition increased the concentration ratio for only Cs. The remainingconcentration ratios were near identical, indicating that the results were reproducible.
Table 21. Greenhouse study of netted-chain fern in non-contaminated background soil: totalsoil (Soil-T) and available soil (Soil-A) COC concentrations (mg/kg), tissue concentrations(mg/kg), and concentration ratios (CR-T; plant conc./soil conc.).
Background SoilSoil-T Soil-A Netted-chain
fern conc.CR-T CR-A
Cd 3.4(a) BDL(b) 0.231 0.07 NACo 1.2 0.045 1.87 1.6 41.6Cr 21.98 0.164 5.15 0.2 31.4Cs 0.844 0.002 0.822 0.97 411.0Fe 16470 173 293 0.02 1.7Mn 127 9.6 2110 16.6 219.8Hg 0.076 BDL 0.167 2.2 NAPb 4.5 0.35 1.27 0.28 3.6Th 8.9 0.41 0.273 0.03 0.7U 0.433 0.001 0.112 0.3 112.0(a) Each result is the mean of four replicates; Netted-chain fern leaves were harvested aftersix week of replanting.(b) BDL = below detection limit; NA = not available.

WSRC-TR-2001-00032, REV. 0
Page 58
Table 22. Greenhouse study of netted-chain fern in contaminated B-5 soil: total soil (Soil-T)and available soil (Soil-A) COC concentrations (mg/kg), tissue concentrations (mg/kg), andconcentration ratios (CR-T; plant conc./soil conc.).
B-5 SoilSoil-T Soil-A Netted-chain
Fern Conc.CR-T CR-A
Cd 1.4 BDL(a) 0.223 0.2 NACo 0.915 0.037 1.28 1.4 34.6Cr 33.4 0.256 6.33 0.19 24.7Cs 0.956 0.002 0.825 0.86 412.5Fe 19954 186 909 0.05 4.9Mn 36 4.3 1948 54 453.0Hg 3.72 BDL 0.501 0.13 NAPb 10.9 0.9 2.11 0.19 2.34Th 329 10.5 6.4 0.02 0.61U 44 0.177 5.25 0.12 29.66(a) Each result is the mean of four replicates; netted-chain fern leaves were harvested aftersix week of replanting.(b) BDL = below detection limit; NA = not available.
Table 23. Greenhouse study of netted-chain fern in contaminated C-5 soil: total soil (Soil-T)and available soil (Soil-A) COC concentrations (mg/kg), tissue concentrations (mg/kg), andconcentration ratios (CR-T; plant conc./soil conc.).
C-5 SoilSoil-T Soil-A Netted-chain
Fern Conc.CR-T CR-A
Cd 0.61(a) BDL(b) 0.354 0.58 NACo 0.168 0.01 1.39 8.27 139.0Cr 19.9 0.281 8.12 0.4 28.9Cs 2.5 0.003 1.15 0.46 383.3Fe 3332 32 545 0.16 17.0Mn 17 5.3 1959 117 369.6Hg 12.1 0.003 0.451 0.04 150.3Pb 2 0.29 1.58 0.79 5.4Th 25 0.29 9.1 0.36 31.4U 1.4 0.018 1.36 0.97 75.6(a) Each result is the mean of four replicates; netted-chain fern leaves were harvested aftersix week of replanting.(b) BDL = below detection limit; NA = not available.

WSRC-TR-2001-00032, REV. 0
Page 59
Table 24. Greenhouse study of Bermuda grass in non-contaminated background soil: total soil (Soil-T) and available soil (Soil-A)COC concentrations (mg/kg), tissue concentrations (mg/kg), and concentration ratios (CR-T; plant conc./soil conc.).
No Fertilizer Added FertilizerSoil-T Soil-A Bermuda
Grass Conc.CR-T CR-A Soil-T Soil-A Bermuda
Grass Conc.CR-T CR-A
Cd 3.4(a) BDL(b) 0.172 0.051 NA 3.3 NA 0.181 0.055 NACo 1.2 0.045 0.814 0.678 18.1 1.3 0.042 0.836 0.643 19.9Cr 21.98 0.164 5.22 0.237 31.8 21.56 0.142 5.1 0.237 35.9Cs 0.844 0.002 1.45 1.718 725.0 0.923 0.003 2.3 2.492 766.7Fe 16470 173 207 0.013 1.2 16493 185 225 0.014 1.2Mn 127 9.6 584 4.598 60.8 119 10.2 598 5.025 58.6Hg 0.076 BDL 0.155 2.039 NA 0.082 BDL 0.18 2.195 NAPb 4.5 0.35 2 0.444 5.7 4.35 0.41 2.1 0.483 5.1Th 8.9 0.41 0.132 0.015 0.3 7.9 0.46 0.182 0.023 0.4U 0.433 0.001 0.029 0.067 29.0 0.456 0.002 0.041 0.090 20.5(a) Each result is the mean of four replicates; Bermuda grass leaves were harvested after six week of replanting.(b) BDL = below detection limit; NA = not available.

WSRC-TR-2001-00032, REV. 0
Page 60
Table 25. Greenhouse study of Bermuda grass in contaminated B-5 soil:total soil (Soil-T) and available soil (Soil-A) COC concentrations (mg/kg),tissue concentrations (mg/kg), and concentration ratios (CR-T; plantconc./soil conc.).
Grass in B-5 Soil – No Added FertilizerSoil-T Soil-A Bermuda
Grass Conc.CR-T CR-A
Cd 1.4(a) BDL(b) 0.378 0.270 NACo 0.915 0.037 0.157 0.172 4.24Cr 33.4 0.256 3.67 0.110 14.34Cs 0.956 0.002 0.558 0.584 279Fe 19954 186 66.1 0.003 0.36Mn 36 4.3 264 7.333 61.40Hg 3.72 BDL 0.066 0.018 NAPb 10.9 0.9 0.22 0.020 0.244Th 329 10.5 0.13 0.000 0.012U 44 0.177 0.035 0.001 0.198(a) Each result is the mean of four replicates; Bermuda grass leaves wereharvested after six week of replanting.(b) BDL = below detection limit; NA = not available.

WSRC-TR-2001-00032, REV. 0
Page 61
Table 26. Greenhouse study of Bermuda grass in contaminated C-5: total soil (Soil-T) and available soil (Soil-A) COCconcentrations (mg/kg), tissue concentrations (mg/kg), and concentration ratios (CR-T; plant conc./soil conc.).
No Fertilizer Added Fertilizer AddedSoil-T Soil-A Bermuda
Grass Conc.CR-T CR-A Soil-T Soil-A Bermuda
Grass Conc.CR-T CR-A
Cd 0.61 NA 0.379 0.621 NA 0.613 NA 0.324 0.529 NACo 0.168 0.01 0.142 0.845 14.2 0.175 0.011 0.119 0.680 10.8Cr 19.9 0.281 4.37 0.220 15.6 21.2 0.292 4.33 0.204 14.8Cs 2.5 0.003 4.98 1.992 1660.0 2.35 0.002 23.6 10.043 11800Fe 3332 32 119 0.036 3.7 3189 31.2 147 0.046 4.7Mn 17 5.3 738 43.412 139.2 17.7 5.4 717 40.508 132.8Hg 12.1 0.003 0.122 0.010 40.7 11.89 0.003 0.221 0.019 73.7Pb 2 0.29 1.1 0.550 3.8 1.89 0.32 0.95 0.503 3.0Th 25 3.3 0.945 0.038 0.3 24.36 3.6 3.8 0.156 1.1U 1.4 0.018 0.117 0.084 6.5 1.5 0.021 0.322 0.215 15.3
(a) Each result is mean of four replicates; Bermuda grass leaves were harvested after six week of replanting.(b) BDL = below detection limit; NA = not available.

WSRC-TR-2001-00032, REV. 0
Page 62
4.4 LEAF LEACHING EXPERIMENT
The Leaf Leaching Experiment was set up and the samples were collected. No analyticaldata was collected prior to the termination of the study.
4.5 GEOMAT EFFICIENCY LABORATORY EXPERIMENT
In the second stage of phytoimmobilization, sequestration, contaminants from decomposedplant material would partition directly to a sequestering agent, or geomat. Geomats could bemade from minerals, such as apatite and zeolite. Ground-up minerals can be placed inside ofgeotextile material (e.g., AMOCO Style 5412).
Among the potential sequestering agents tested, only metallic iron was effective at removingCr (VI) from solution (Table 27). Metallic iron removes soluble Cr (VI) from solution byconverting the soluble Cr (VI) species to the sparingly soluble Cr (III) species (Cantrell et al.1995). Thus, the removal of Cr (VI) from solution is not via adsorption, instead, it is byreductive precipitation (Equation 1).
CrO42- + 3/2Feo + 5H+ = Cr(OH)3 + H2O + 3/2Fe 2+ (1)
Mixtures of metallic iron with other sequestering agents were evaluated because it is likelythat more than one material will be required to sequester all eight contaminants. The additionof North Carolina apatite, hydroxyapatite, and clinoptilolite (a type of zeolite) greatlydecreased the Cr(VI)-removal effectiveness of the metallic iron.
The pH of the equilibrium solutions at the end of the contact time between the sequesteringagents and the aqueous Cr(VI) did not vary greatly between treatments. As expected, the pHof the metallic iron, Fe(0), treatment increased. This can be attributed to the metallic ironreducing water, thereby creating hydroxides as shown in Equation 2.
Fe0 + H2O = Fe2+ + OH- + 1/2H2(gas) (2)

WSRC-TR-2001-00032, REV. 0
Page 63
Table 27. Chromium distribution coefficients (Kd) for several sequestering agents in a SRSsurface water.
Treatment Avg. pH Avg. EquilibriumCr(VI) Conc. (mg/L)
Kd(mL/g)
SRS Blank Control 4.6 0.02 --Cr Spike Control 4.4 1.00 --Fe(0) 5.8 0.26 294 ± 8Fe(0) / NC Apatite 5.7 0.46 66 ± 25Fe(0) / Hydroxyapatite 5.3 0.67 26 ± 4Fe(0) / Clinoptilolite 5.2 0.63 11 ± 1Fe(0) / NC-Apatite / Clinoptilolite 5.3 0.78 10 ± 2Fe(0) / Hydroxyapatite / Clinoptilolite 5.2 0.68 17 ± 0(a) 0.3 g solid: 30-mL SRS surface water; 1-wk equilibration period; 3 replicates; totalmass of mixtures = 0.3 g evenly divided between sequestering agents.
Evaluation of Hg sequestering agents was conducted in uncontaminated SRS surface watercontaining 6 mg/L total organic carbon, and a leaf litter leachate containing >100 mg/L totalorganic carbon. The Kd values in the presence of soluble organic matter tended to be lowerthan when the organic matter was not present (Table 28). This is likely the result of theorganic matter forming a complex with the Hg, and the soluble Hg-organic matter complexsorbing less strongly than the uncomplexed Hg to the sequestering agents. Thus, it appearsthe presence of the strongly complexing organic ligands present in plant leachate moderatelydecrease the removal effectiveness of these sequestering materials.
Pyrite had a Kd value of ~20,000 mL/g and metallic iron had a Kd value of >1000 mL/g(Table 28). The reduction in soluble Hg concentrations in pyrite (FeS2) treated solutions isnot surprising because the pyrite can release sulfides, which can then combine with Hg(II) toform the sparingly soluble mercury-sulfide precipitate, cinnabar, HgS (Bodek et al. 1988).The relatively low Kd for the gypsum (CaSO4) may be attributed to the fact that the testsuspension was oxic, therefore the sulfate in the gypsum was never reduced to sulfide, theform of sulfur that forms the sparingly soluble mercury precipitate. In a soil system wheremicrobes are present and where reducing conditions exist, it is very likely that thesequestering ability of gypsum will improve. Thus, evaluation of gypsum for this applicationneeds to be conducted under conditions more similar to those of its final application, namelyin the presence of reducing soils that will convert the sulfate to sulfide.
The more positive the oxidation-reduction potential (or redox), the more oxidized the systemis; conversely the more negative the redox potential, the more reduced the system is. At pH5, the approximate pH of the TNX OD soils, the expected redox range is between 50(reduced) and 650 mV (oxidized). In the metallic iron system, the pH rose to 10.2 and theredox dropped to 110 mV (Table 28). The rather large metallic-iron reduction potential isappreciably larger than expected; values of ~200 mV are common. Faust and Osman (1981)

WSRC-TR-2001-00032, REV. 0
Page 64
reported similar reductions in soluble Hg concentrations in experimental systems when pHvalues increased and Eh values decreased. As described above, the elevated pH in themetallic iron system can be attributed to water molecules being reduced to hydrogen gas andhydroxide ions. The low pH of the pyrite addition can be attributed to the oxidation ofpyrite, which is a well-known acidifying process that is widespread at coal mining sites.
Table 28. Effect of sequestering materials on aqueous Hg concentration.(a)
Treatment 6-mg/L Total Organic Carbon >100-mg/L Total Organic CarbonAvg.pH
Avg.Eh
(mV)
Avg.Hg
(mg/L)
Kd(mL/g)(b)
Avg.pH
Avg.Eh
(mV)
Avg.Hg
(mg/L)
Kd(mL/g)(b)
Blank Control 5.8 409 0.000 -- 5.0 290 0.001 --
Hg Spike Control 3.1 498 1.865 -- 4.7 311 0.630 --Gypsum Addition 3.3 510 1.582 17 ± 0 4.5 330 0.344 448 ± 56Pyrite Addition 3.0 345 0.002 108838 ± 26457 4.3 361 0.009 20259 ± 413Metallic iron Addition 10.2 100 0.029 6270 ± 719 5.8 110 0.127 1364 ± 117(a) 0.3 g solid: 30-mL SRS surface water; 1-wk equilibration period; 3 replicates; total mass of mixtures =0.3 g evenly divided between sequestering agent. High organic matter concentration tests were conductedwith leaf litter leachate solution; low organic matter concentration tests were conducted with SRS surfacegroundwater with 6 mg/L TOC.(b) Average ± standard deviation.
In the third experiment, six elements were added to the solution at concentrations ofapproximately 50 µg/L. After one week the concentrations of each tested element weresignificantly reduced by almost all the amendments (Table 29). Hydroxylapatite and NorthCarolina apatite were the most effective at reducing Eu, Pb, and U concentrations in thesolutions and Kd values in these treatments were very high (Table 29). Other researchers alsoreported the high effectiveness of apatite in remediation of Pb or U contaminated soilsthrough a precipitation mechanism (Knox et al. 2000). Both zeolites were effective for mostelements, however, not for uranium. Metallic iron and Fe oxide (Fe-rich TM, wastebyproduct) removed the greatest mass of the targeted constituents from solution. Themetallic iron could be attractive as a geomat material because it was effective inimmobilizing Cr, Hg, Co, Ba, Eu, Pb and U; however, one problem with metallic iron is thatit has a limited life span before it oxidizes, rusts, and looses its reductive capacity. Thus, ifmetallic iron was to be included in a geomat, then the material would have to be removedbefore the metallic iron completely rusted.

WSRC-TR-2001-00032, REV. 0
Page 65
Table 29. Kd values (mL/g) of Co, Ba, Eu, Pb, and U for various potential sequesteringagent materials.(a)
Treatment Co Ba(b) Eu(b) Pb UHydroxylapatite 7683 421 725426 138607 282448North Carolina Apatite 470 222 313157 214916 264829Zeolite (Clinoptilolite) 4114 6217 14473 1805864 7Zeolite (Phillipsite) 223 6222 819 24828 9Fe oxide (waste by product) 23037 3688 2561951 363449 8479Metallic Fe 259629 26076 1525058 18108 452210(a) 0.3 g solid: 30-mL SRS surface water; 1-wk equilibration period; 3 replicates; total massof mixtures = 0.3 g evenly divided between sequestering agent.(b) Ba and Eu are used as analogs for Ra and Ac geochemical behavior.
4.6 GEOMAT EFFICIENCY FIELD EXPERIMENT
The first part of this project, setting up in the field, was completed. Chemical analyticalresults were not completed prior to the termination of the project.
4.7 MODELING PHYTOIMMOBILIZATION
4.7.1 Abbreviated Mass-Balance Model
Mass-balance calculations were conducted with available data using equations 3 - 8.
Icurrent soil = Acurrent soil x ρsoil bulk x 1e6 (cm3/m3) x 1e-12 (Ci/pCi) x Vsite (3)
Aplant i = Acurrent soil x CRplant i (4)
Iplant i = Aplant i x 1000 g/kg x Mplant i x 1e-4 ha/m3 x Asite 1e-12 pCi/Ci (5)
ACRplant i = = Iplant i /Isoil x 100 (6)
ACRtotal = ACRfern + ACRleaf litter (7)
Isoil j = Isoil j-1 – (Isoil j-1 x ACRtotal) (8)
Icurrent soil = current soil inventory (Ci)Acurrent soil = current soil activity (pCi/g)ρsoil bulk = soil bulk density (g/cm3)Vsite = contamination site volume (m3)Aplant i = fern or leaf litter activity (pCi/g)

WSRC-TR-2001-00032, REV. 0
Page 66
CRplant i = concentration ratio of fern or leaf litter ([pCi/g plant]/[pCi/g soil])Iplant i = fern or leaf litter inventory (Ci/yr)Mplant i = fern or leaf litter annual biomass (kg/ha⋅yr)Asite = contaminated site area (m2)ACRplant i = annual contaminant reduction in soil due to fern or leaf litter uptake (%)ACRtotal = annual contaminant reduction in soil due to fern and leaf litter uptake (%)Isoil j = soil contaminant inventory for year jIsoil j-1 = soil contaminant inventory for the year before year j
The calculations using Equations 3 - 8 and the input values used in the calculations arepresented in Appendix C. For the purposes of these calculations, the following assumptionswere made.
• The site targeted for clean up was 152.4-m x 91.44-m x 0.305-m (500-ft x 300-ftx 1-ft), or 4214-m3 (150,000-ft3). It should be noted that the area selected forclean up does not influence the calculated duration required to achieve a targetedclean up level.
• The site had to be cleaned to 10e-6 risk level. The actual risk level has not beendetermined yet, but this is a low (conservative) level. For instance, the risk for anindustrial worker is 10e-3.
• Soil COC activity did not decrease with time in a linear manner. Instead itdecreased at a slower rate as the COC concentrations in the soil decreased. Thereason for this is that it is expected that plant uptake efficiency will decrease asthe soil COC concentrations in the soil decrease. This is an important assumptionwhich attempts to avoid the common error made in the 1980’s regardingremediation predictions, which assumed that short term kinetic studies conductedat high contaminant concentrations were applicable when the COC concentrationsin the system decreased.
• The geomat was 100% efficient at removing contaminants from the mobileaqueous phase. Since the Kd values for many of the COC’s were >10,000 mL/g,this simplifying assumption does not greatly compromise the otherwiseconservative nature of this calculation (Section 4.5).
• There is no radiological decay. This is an important assumption because theconcentration of Th-232 affects the concentration of the other radionuclides, i.e.,Th-232 (half-life = 1.4 x 10¹⁰ yr) decays to Ra-228 (half-life = 6.7 yr), Ac-228(half-life = 6.1 hr), Th-228 (half-life = 1.9 yr), and Pb-212 (half-life = 10.6 hr).Since Th-232 has an appreciably longer half-life than its daughters, the daughterswill come to secular equilibrium with Th-232. Therefore, so long as the Th-232 ispresent, there will be a continued source of the daughters.
• No COC losses outside of the 4214-m3 zone of interest, i.e., no over-land andsubsurface migration of COCs in the aqueous and colloidal phases.
• The average COC soil concentrations were equal to the Medium SpecificExposure Point Concentrations (WSRC 1999).
• The threshold values are those provided by Karen Connor (see email transmittalin Appendix B).

WSRC-TR-2001-00032, REV. 0
Page 67
The change in the annual soil concentrations (Isoil j; Equation 8) of Ra-228, Pb-212, Th-228,U-235, U-238 and Ac-228 are presented in the following five figures. Additionally, asummary of the number of years required for the technology to be in place in order toachieve the desired reduction in COC concentrations is presented in Table 30. Based onthese calculations, Th-232, Th-234, and U-233 already exist at levels well below the 10e-6risk level and therefore should not be included in the list of COCs (Table 30). The onlyisotope that could be remediated by this technology was Ra-228. Ra-228 activity decreasedbelow the 10e-6 risk level after 52-yr of phytoimmobilization. The remaining contaminants,Pb-212, Th-228, U-235, and U-238 required more than 300-yr of remediation before 10e-6risk levels were obtained.
Since it has not been established that the TNX OD site must be cleaned to a 10e-6 risk level,additional calculations were conducted to determine the length of time it would take to cleanthe site to 10e-5 risk levels (Table 30). Based on these calculations, Th-232, Th-234, U-233,U-235, Pb-212, and Ra-228 already exist at levels below the 10e-6 risk level. Thus, only U-238 and Th-228 would require remediation. Based on these calculations, U-238 could becleaned with phytoimmobilization within 9-yr, whereas Th-228 would not be clean within300-yr.
Another set of analyses was conducted using higher biomass estimates. The netted-chainfern biomass (928 kg/ha⋅yr) and leaf litter biomass (7389 kg/ha⋅yr) used in the baselinecalculations (Figure 11 through Figure 16) were quite conservative. Increasing biomasscould be easily accomplished by adopting common forestry practices, such as thinning trees,planting trees with higher annual leaf biomass (and COC concentration ratios, such astupelo), and fertilizing. For these additional calculations, the biomass for the fern was set to4643 kg/ha⋅yr and for the leaf litter was set to 14,778 kg/ha⋅yr. The new biomass for the fernwas calculated based on a greater plant density estimate (from 65% to 75% cover) and agreater plant mass estimate (from 20 to 60 g/plant). The new leaf litter biomass value istwice that of the conservative value; the forestry practices listed above can typically increasevirgin forest biomass on the Savannah River Site two or three fold (personal communicationwith Dr. John Blake, U.S. Forestry Service, Aiken, SC).
Based on the higher biomass values, the phytoimmobilization technology would clean threeof the five COCs to 10e-6 risk levels (Table 30). Pb-212, Ra-228, and U-235 would becleaned to 10e-6 risk levels within 183, 20, and 298 years, respectively. Th-228 and U-238would not be cleaned within 300 years of phytoimmobilization. As mentioned above, Th-232, Th-234, and U-233 already exist at levels that do not require remediation.

WSRC-TR-2001-00032, REV. 0
Page 68
Table 30. Current soil inventory (Icurrent soil; Equation 3), allowable soil inventory, annual contaminant reduction in the soil (ACRtotal;Equation 7) and the number of years necessary to accomplish clean up to 10e-6 risk levels.
Isotope Current SoilInventory
(Ci)
Allowable SoilInventory (Ci)
AnnualReduction
(%)
Years to AccomplishClean up to 10e-6
Risk Levels
Years to AccomplishClean up to 10e-5
Risk Levels
Years to Accomplish Clean up to10e-6 Risk Levels Using Larger,
Likely Achievable, Annual BiomassValues
Ac-228 0.03274 NA 0.00301 NA NA NAPb-212 0.03388 0.02851 0.00035 >300 0 183Ra-228 0.09165 0.01116 0.04096 52 0 20Th-232 0.15044 3.78527 0.00024 0 0 0Th-228 0.1359 0.01003 0.00024 >300 >300 >300Th-234 1.06825 1.77983 0.00024 0 0 0U-235 0.05518 0.03202 0.00047 >300 0 298U-233 1.21995 2.76375 0.00047 0 0 0U-238 1.20731 0.12283 0.00047 > 300 9 >300

WSRC-TR-2001-00032, REV. 0
Page 69
Figure 11. Predicted soil Ra-228 activity as a function of years of phytoimmobilizationremediation at the TNX OD site (volume of remediated soil = 4214 m3; target 10e-6 riskclean up level indicated with dotted line).
Ra-228
Years of Remediation
0 50 100 150 200 250
Soil
Act
ivity
(Ci/4
214-
m3 )
0.00
0.02
0.04
0.06
0.08
0.10
10e-6 Risk Soil Concentration

WSRC-TR-2001-00032, REV. 0
Page 70
Figure 12. Predicted soil Pb-212 activity as a function of years of phytoimmobilizationremediation at the TNX OD site (volume of remediated soil = 4214 m3; target 10e-6 riskclean up level indicated with dotted line).
Pb-212
Years of Remediation
0 50 100 150 200 250
Soil
Act
ivity
(Ci/4
214-
m3 )
0.028
0.029
0.030
0.031
0.032
0.033
0.034
0.035
10e-6 Risk Soil Concentration

WSRC-TR-2001-00032, REV. 0
Page 71
Figure 13. Predicted soil Th-228 activity as a function of years of phytoimmobilizationremediation at the TNX OD site (volume of remediated soil = 4214 m3; target 10e-6 riskclean up level indicated with dotted line).
Th-228
Years of Remediation
0 50 100 150 200 250
Soil
Act
ivity
(Ci/4
214-
m3 )
0.00
0.02
0.04
0.06
0.08
0.10
0.12
0.14
0.16
10e-6 Risk Soil Concentration
10e-5 Risk Soil Concentration

WSRC-TR-2001-00032, REV. 0
Page 72
Figure 14. Predicted soil U-235 activity as a function of years of phytoimmobilizationremediation at the TNX OD site (volume of remediated soil = 4214 m3; target 10e-6 riskclean up level indicated with dotted line).
U-235
Years of Remediation
0 50 100 150 200 250
Soil
Act
ivity
(Ci/4
214-
m3 )
0.030
0.035
0.040
0.045
0.050
0.055
0.060
10e-6 Risk Soil Concentration

WSRC-TR-2001-00032, REV. 0
Page 73
Figure 15. Predicted soil U-238 activity as a function of years of phytoimmobilizationremediation at the TNX OD site (volume of remediated soil = 4214 m3; target 10e-6 riskclean up level indicated with dotted line).
U-238
Years of Remediation
0 50 100 150 200 250
Soil
Act
ivity
(Ci/4
214-
m3 )
0.00
0.20
0.40
0.60
0.80
1.00
1.20
10e-6 Risk Soil Concentration
10e-5 Risk Soil Concentration
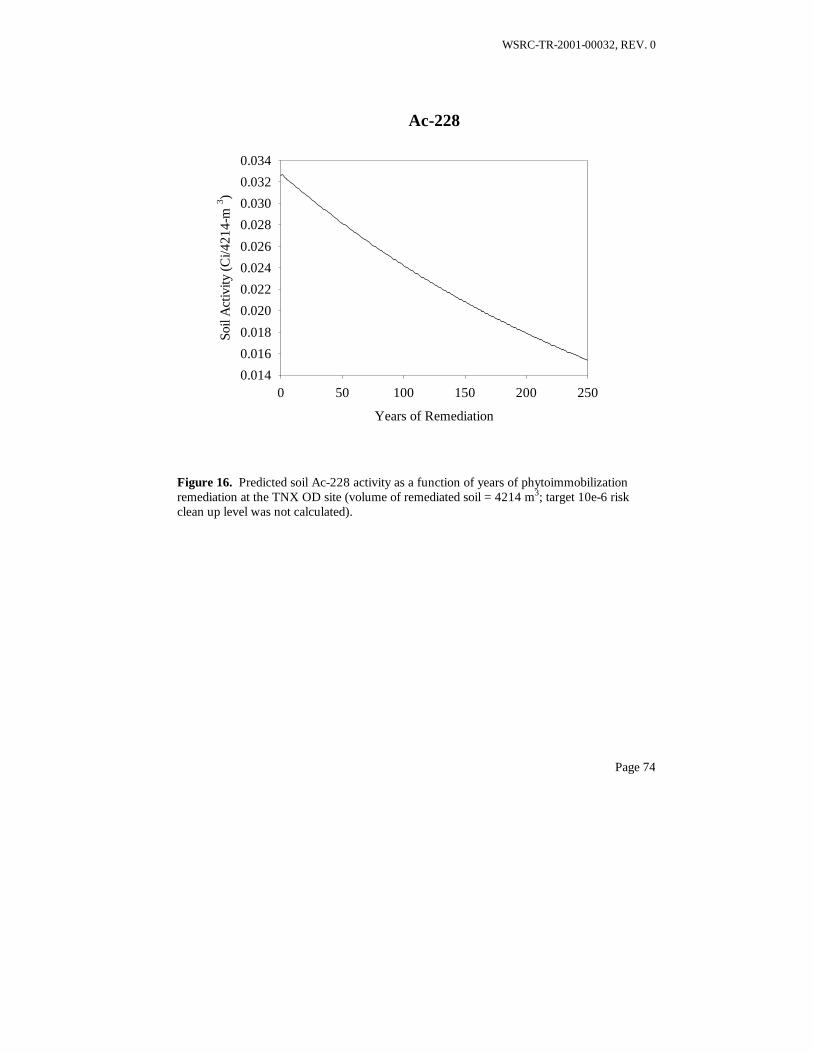
WSRC-TR-2001-00032, REV. 0
Page 74
Figure 16. Predicted soil Ac-228 activity as a function of years of phytoimmobilizationremediation at the TNX OD site (volume of remediated soil = 4214 m3; target 10e-6 riskclean up level was not calculated).
Ac-228
Years of Remediation
0 50 100 150 200 250
Soil
Act
ivity
(Ci/4
214-
m3 )
0.014
0.016
0.018
0.020
0.022
0.024
0.026
0.028
0.030
0.032
0.034

WSRC-TR-2001-00032, REV. 0
Page 75
4.7.2 Linear-Kinetic Reservoir Model
The linear-kinetic reservoir model was not used to evaluate the effectiveness of thephytoimmobilization technology because the project was terminated prior to collecting theneeded data. A description of the model is presented in the status report (Kaplan et al.2000a) and the available input values are described below.
Briefly, the linear-kinetic reservoir approach of Lasaga (1980) evaluates the time-dependantcycling of contaminants using a matrix algebra solution of a series of competing transferreactions between contaminant reservoirs. The mass of contaminant, reaction pathway (i.e.,the reservoirs to which contaminant can be transferred), and the rate that contaminants aretransferred between reservoirs determine the distribution between each of the reservoirs.
The laboratory and field studies were designed to provide model input data for this analysis.In our model conceptualization the reservoirs considered are the root-zone soil, bulk soil(below root zone), vegetation, and the reactive geomat. A general model schematic is shownin Figure 17 and the data collected in this study are designed to provide the mass ofcontaminant in each reservoir and the rate of transfer between the reservoirs as designated bythe arrow. The matrix solution of Lasaga (1980) can then be used to calcuate the distributionof contaminants between each of the reservoirs as a fuction of time.
In preparation for the modeling, input values for the model was assembled based on availabledata (Table 31 and Table 32). In assembling this data, a number of decisions had to bemade. For the sequestering agent, it was decided that metallic iron would not be used, eventhough it had high Kd values. The reason for this decision was that if the metallic iron wereused, it would have to be removed at a rather frequent basis because of its tendency to rust,thereby changing into a poorer sequestering agent. Consequently, the geomat that wasselected consisted of a hydroxyapatite, clinoptilolite, and pyrite.

WSRC-TR-2001-00032, REV. 0
Page 76
Figure 17. Linear-kinetic Reservoir Model of Phytoimmobilization at the TNX OD Site.
One concern is that instead of using the measured Kd values for Hg, Pb, Th, and U, perhapssolubility values should be used. The sequestering agents are removing these contaminantsby forming the sparingly soluble phases of Hg-S, Pb-PO4, ThO2 or Th-PO4, and U-PO4. Theimplications of using a solubility versus a sorption construct is that the contaminant solutionconcentration will remain constant for as long as the solid source material exists. Once thesolid phase controlling solubility is totally dissolved, the contaminant concentration drops tozero. With the sorption, or Kd, construct the contaminant solution concentration variesdirectly with the concentration in the solid phase. The contaminant concentration in the Kdconstruct slowly decreases, all the time maintaining a fixed ratio of contaminantconcentration on the solid phase to the liquid phase.
The proposed input data also lists the highest soil concentration measured in the TNX OD.This “conservatism” may not be necessary; perhaps a better choice for soil concentrationvalues would be to pick the contaminant concentration from a single site, such as the mostcontaminated site near coordinate A-5. No one site has the highest concentrations of allcontaminants.
Reactive Geomat
Root Zone Soil
Vegetation
Bulk Soil

WSRC-TR-2001-00032, REV. 0
Page 77
Table 31. Preliminary input values for the Linear-kinetic Reservoir Model of Phytoimmobilization (additional input in next table).
ParameterCategory Parameter Values Units CommentsAnnualBiomass
Leaf Litter 7389 kg/ha/yr Based on litter collected in & beneath baskets; baskets put out in middle of fall. Control sites only.
Fern 928 kg/ha/yr Assumptions: 17 g/plant (actual is 10 to 25 g/plant); 1.5 ft2/plant, 50% coverGeomat Kd's Ac-Kd 725426 mL/g Hydroxyapatite/Clinoptilolite/Sulfur no OM data, Used Eu as nonrad analog in experiments
Co-Kd 7683 mL/g Hydroxyapatite/Clinoptilolite/Sulfur no OM data.Cr-Kd 15 mL/g Hydroxyapatite/Clinoptilolite/Sulfur. If we add Fe(0) the Geomat Kd greatly increases to 200 mL/g.Hg-Kd 20259 mL/g Pyrite/Leaf Leachate data (Prague 2000); Acidifying nature of pyrite may adversely affect plant growth.Pb-Kd 138607 mL/g Hydroxyapatite/Clinoptilolite/Sulfur no OM dataRa-Kd 6217 mL/g Hydroxyapatite/Clinoptilolite/Sulfur no OM data, Used Ba as nonrad analog in experimentsTh-Kd 5700 mL/g Actually >5700 mL/g, Hydroxyapatite/Clino/Sulfur no OM data, detection limitationU-Kd 282448 mL/g Hydroxyapatite/Clinoptilolite/Sulfur no OM data
Soil Kds Ac-Kd 255 mL/g Conservative Kd from desorption Kd of site specific sediment, WSRC-TR-99-00490 Table 16, Ce as analogCo-Kd 255 mL/g Conservative Kd from desorption Kd of site specific sediment, WSRC-TR-99-00488 Table 16, Ni as analogCr-Kd 58 mL/g Conservative Kd from desorption Kd of site specific sediment, WSRC-TR-99-00494 Table 16Hg-Kd 4704 mL/g Conservative Kd from desorption Kd of site specific sediment, WSRC-TR-99-00494 Table 16Pb-Kd 11460 mL/g Conservative Kd from desorption Kd of site specific sediment, WSRC-TR-99-00494 Table 16Ra-Kd 336 mL/g Conservative Kd from desorption Kd of site specific sediment, WSRC-TR-99-00489 Table 16, Ba as analogTh-Kd 115 mL/g Conservative Kd from desorption Kd of site specific sediment, WSRC-TR-99-00494 Table 16U-Kd 170 mL/g Conservative Kd from desorption Kd of site specific sediment, WSRC-TR-99-00494 Table 16
Soil Conc. Ac-228 101 pCi/g Conservative, Selected greatest Total Concentration (acid digest) from maps in WSRC-RP-4158, Rev. 0Co-60 ??? pCi/gCr 156 mg/kg Conservative, Selected greatest Total Concentration (acid digest) from maps in WSRC-RP-4158, Rev. 0Hg 30.8 mg/kg Conservative, Selected greatest Total Concentration (acid digest) from maps in WSRC-RP-4158, Rev. 0Pb-212 97.1 pCi/g Conservative, Selected greatest Total Concentration (acid digest) from maps in WSRC-RP-4158, Rev. 0Ra-228 106 pCi/g Conservative, Selected greatest Total Concentration (acid digest) from maps in WSRC-RP-4158, Rev. 0Th-232 52.5 pCi/g Conservative, Selected greatest Total Concentration (acid digest) from maps in WSRC-RP-4158, Rev. 0Th-232 694 mg/L Conservative, Selected greatest Total Conc. (acid digest) from 6 sed.; WSRC-TR-99-00488 Tables 14/15U-238 559 mg/kg Conservative, Selected greatest Total Conc. (acid digest) from 6 sed.; WSRC-TR-99-00488 Tables 14/15U-238 123 pCi/g Conservative, Selected greatest Total Concentration (acid digest) from maps in WSRC-RP-4158, Rev. 0

WSRC-TR-2001-00032, REV. 0
Page 78
Table 32. Preliminary input values for the Linear-kinetic Reservoir Model of Phytoimmobilization (additional input in previous table).
ParameterCategory
Parameter Values Units Comments
Leaf/soil Ac-Leaf Litter CR na ppm/ppm Not available yetCo-Leaf Litter CR 46.22 ppm/ppm Plant material and sediment from A-5Cr-Leaf Litter CR 0.24 ppm/ppm Plant material and sediment from A-5Hg-Leaf Litter CR 2.93E-05 ppm/ppm Plant material and sediment from A-5Pb-Leaf Litter CR 0.16 ppm/ppm Plant material and sediment from A-5Ra-Leaf Litter CR 21.16 ppm/ppm Plant material and sediment from A-5, Ba analogTh-Leaf Litter CR 0.01 ppm/ppm Plant material and sediment from A-5U-238 Leaf Litter CR 0.15 ppm/ppm Plant material and sediment from A-5Ac-Fern CR na ppm/ppm Not available yetCo-Fern CR 6.542842 ppm/ppm Plant material and sediment from A-5Cr-Fern CR 1.056054 ppm/ppm Plant material and sediment from A-5Hg-Fern CR 1.169916 ppm/ppm Plant material and sediment from A-5Pb-Fern CR 0.403977 ppm/ppm Plant material and sediment from A-5Ba-Fern CR 29.75858 ppm/ppm Plant material and sediment from A-5; Ba analogTh-Fern CR 1.069652 ppm/ppm Plant material and sediment from A-5U-238 Fern CR 1.102824 ppm/ppm Plant material and sediment from A-5

WSRC-TR-2001-00032, REV. 0
Page 79
5.0 CONCLUSIONS
In the status report associated with this project (Kaplan et al. 2000a), it was concluded that itmay be possible to implement phytoimmobilization at the TNX OD operable unit. Themanner in which phytoimmobilization would be deployed is to use both the natural leaf litter,which generates a lot of biomass with moderate levels of contaminants, and to plant ferns tomine the contaminants near the soil surface, where the contaminants are most concentrated.The geomat would be made by placing a combination of hydroxyapatite, clinoptilolite, and asulfide mineral between two layers of geotextile material. The geomat would then be placedin pieces around existing trees.
A mass balance calculation was conducted with the available site-specific data to provide anearly estimate of the efficacy of the proposed phytoimmobilization scheme. In thesecalculations, it was assumed that the amount of contaminant remediated would decrease overtime, thereby diminishing the error of extrapolating long-term estimates based on short-termexperimental results. Based on these conservative estimates, Th-232, Th-234, and U-233already exist at levels well below the 10e-6 risk level and therefore do not requireremediation. The remaining risk drivers at the site are Ra-228, Pb-212, Th-228, U-235, andU-238. Ra-228 could be cleaned up to below 10e-6 risk levels within 52-years; Pb-212, Th-228, U-235, and U-238 would require >300-years. Another set of calculations wasconducted using increased, readily achievable, biomass input values. In addition to cleaningup Ra-228, these calculations indicated that Pb-212 and U-235 could be cleaned up to 10e-6risk levels within 183 and 298 years, respectively. Th-228 and U-238 would not be cleanedwithin 300-years of phytoimmobilization. A final set of calculations was conducted using alower clean up requirement based on a 10e-5 risk level. The risk levels upon which clean uplevels are based have not been established yet, but a risk level of 10e-5 is very probable inlight of the fact that an industrial worker, one of the possible risk receptors, has a risk level of10e-3. All the contaminants included in the 10e-5 risk-level calculations, expect Th-228,could be clean with phytoimmobilization within 10 years or did not require remediation.
There are very few remediation options for ecologically sensitive wetland areas.Application of phytoimmobilization at the TNX OD site has a number of attributes, but alsoan important limitation, namely that it will likely not clean up the site of all radionuclides.Among its attributes, phytoimmobilization uses existing natural biogeocycling processes andsimply interrupts these processes by accumulating the contaminants in the geomat.Additionally, it should greatly reduce the cost of waste disposal by creating a concentratedwaste in the sequestering agent. However, the fact that not all the contaminants will becleaned in a timely manner compromises its utility, thereby requiring that we further evaluateother remediation approaches and/or the clean up goals of the site.

WSRC-TR-2001-00032, REV. 0
Page 80
6.0 REFERENCES
Adriano, D. C. Trace Elements in the Terrestrial Environment. Springer-Verlag, Inc., NewYork (1986).
Bodek, W.J. Lymn, W.F. Reehel, D.H. Rosenblott, B.I. Walton, R.A. Conway,Environmental Inorganic Chemistry: Properties, Processes, and Estimation Methods, NewYork, Pergamon Press, (1988).
Cantrell, K. J., and D. I. Kaplan. “Sorptive Barriers for Groundwater Remediation.” pp.4663 - 4677. In Robert A. Meyers (ed.), Encyclopedia of Environmental Analysis andRemediation, John Wiley & Sons, Inc., New York (1998).
Cantrell, K. J., D.I. Kaplan, D.I., T. W. Wietsma, “Zero-valent Iron for the in SituRemediation of Selected Metals in Groundwater.” J. Hazardous Materials. 42, p. 201 (1995).
Cunningham, S. D., and D. W. Ow. “Promises and Prospects of Phytoremediation.” PlantPhysiol. 110, p 715 (1996).
Dixon, K. L., V. A. Rogers, S. P. Conner, D. L. Cummings, J. B. Gladden, and J. M. Weber.Geochemical and Physical Properties of Wetland Soils at the Savannah River Site.Westinghouse Savannah River Company, Aiken, SC (1997).
Faust, S. D. In: Chemistry of Natural Waters, Ann Arbor Science Publishers, Inc., (1981).
Hiraga, Y., M. Kurokawa, J. R. Guo, and T. Suga. “Ion-transport Activity ofPhenylpentanoic acids Occurring in the Roots of Athyrium yokoscense.” BioscienceBiotechnology and Biochemistry 63, p 958 (1999).
Ichihaski, H., H. Morita, and R. Tatsukawa. “Rare-earth elements (rees) in Naturally GrownPlants in Relation to Their Variation in Soils.” Environmental Plooution 75, p 157 (1992).
Kaplan, D. I. Sampling and Analyses Plan for the Phytostabilization Study at the TNXOutfall Delta, Lower Discharge Gully and Swamp Operable Unit. WSRC-RP-99-01078.Westinghouse Savannah River Company, Aiken SC (1999).
Kaplan, D. I., A. S. Knox, T. G. Hinton, and S. M. Serkiz. Proof-of-Concept of thePhytoimmobilizaotn Technology for TNX Outfall Delta: Status Report. WSRC-TR-2000-00375, Rev. 0. Westinghouse Savannah River Company, Aiken, SC (2000a).
Kaplan, D. I., S. V. Mattigod, K. E. Parker, and G. Iversen. I-129 Test and Research toSupport Disposal Decisions. WSRC-TR-2000-00283, Rev. 0, Westinghouse Savannah RiverCompany, Aiken, SC (2000b).

WSRC-TR-2001-00032, REV. 0
Page 81
Kaplan, D. I., and S. M. Serkiz. In-situ Kd Values and Geochemical Behavior for Inorganicand Organic Constituents of Concern at the TNX Outfall Delta. WSRC-TR-99-00488.Westinghouse Savannah River Company, Aiken, SC (1999).
Knox, A. S, J.C. Seaman, M.J. Mench, J. Vangronsveld, 2000, Remediation of Metal- andRadionuclide-Contaminated Soils by In Situ Stabilization In: Environmental Restoration ofMetals Contaminated Soils, Ed. IK Iskandar, CRC Press, Boca Raton, FL. (2000).
Lasaga, A. C. 1980. “The Kinetic Treatment of Geochemical Cycles.” Geochimica etCosmochimica Acta. 44, p 815 (1980).
Lindsay, W. L.., and W. A. Norvell. “Development of a DTPA Soil Test for Zinc, Iron,Manganese, and Copper.” Soil Science Society of America Journal. 42, p 421 (1978).
Ma, L. Q., K. M. Komar, C. Tu, W. Zharng, Y. Cai, and E. D. Kennelley. “Discovery of anEfficacious Arsenic Hyperaccumulating Fern Plant.” Nature. (in press) (2000).
Mengel, K. and E. A. Kirkby. Principles of Plant Nutrition. International Potash Institute,Berne, Switzerland (1978).
Morishita, R., and J. K. Boratynski. “Accumulation of Cadmium and Other Metals in Organsof Plants Growing Around Metal Smelters in Japan.” Soil Science and Plant Nutrition 38, p781 (1992).
Neite, H., N. Neikes, and R. Wittig. “Distribution of Heavy-Metals in the Root area and inOrgans of Herbaceous Plants in Beech Forests.” Flora 185, p 325 (1991).
Nishizono, H., H. Ichikawa, S. Suziki, and F. Ishii. “The Role of the Root Cell-wall in theHeavy-metal Tolerance of Athyrium yokoscense.” Plant and Soil 101, p 15 (1987).
Nishizono, H., H. Minemura, S. Suzuki, and F. Ishii. “An Inducible Copper-thiolate Complexin the Fern, Athyrium yokoscense – Involvement in Copper-Tolerance of the Fern.” Plantand Cell Physiology 29, p. 1345 (1988).
Nishizono, H., S. Suzuki, and F. Ishii. “Accumulation of Heavy-metals in the Metal-tolerantfern, Athyrium yokoscense, Growing on Environments.” Plant and Soil 102, p 65 (1987).
Nishizono, H., T. Watanabe, T. Orii, and S. Suzuki. “Suppression of Inhibitory Effects ofCopper on Enzymatic-activities by Copper-binding Substances from Athyrium yokoscenseassayed in vitro.” Plant and Cell Physiology 30 p 565 (1989).
Ozaki, T., S. Enomoto, Y. Minai, S. ambe, F. Ambe, and Y. Makide. “Beneficial Effect ofRare Earth Elements on the Growth of Dryopteris erythrosora.” Journal of Plant Physiology156 p 330 (2000).

WSRC-TR-2001-00032, REV. 0
Page 82
WSRC. RFI/RI with BRA for the TNX Outfall Delta, Lower Discharge Gully and SwampOperable Unit. WSRC-RP-98-4158, Rev. 0. Westinghouse Savannah River Company,Aiken, SC (1999).

WSRC-TR-2001-00032, REV. 0
Page 83
7.0 APPENDIX A: ADDITIONAL DATA

WSRC-TR-2001-00032, REV. 0
Page 84
Table 33. Scientific names of several plants referred to in this report.
Common Name Scientific NameWater Oak Quercus nigra L.Swamp Tupelo Nyssa sylvatica var. biflora (Walt.) Sarg.Bald Cypress Taxodium distichum (L.) L.C. RichLoblolly Pine Pinus taeda L.Red Maple Acer rubrum L.Sweetgum Liquidambar styraciflua L.American Sycamore Platanus occidentalis L.Netted Chain Fern Woodwardia areloata (L.) MooreSensitive Fern Onoclea sensibilis L.Marginal Wood Fern Drypteris marginals (L.) GrayEbony Spleenwort Asplenium platynneuron (L.) OakesSwitchcane Arundinaria gigantea (Walt.) Muhl.Bermuda Grass Cynnodon dactylon (L.)

WSRC-TR-2001-00032, REV. 0
Page 85
Table 34. Available soil (Soil-A) and plant concentrations (mg/kg; dry weight) and available concentration ratios (CR; plantconc./available soil conc.).
Co Cr Hg(b) ThSiteLocation(a)
Soil-A Plant CR-A Soil-A Plant CR-A Soil-A Plant CR-A Soil-A Plant CR-AA5 0.12 19.2 160 0.07 0.43 6.1 0.01 20.3 10.3 0.507Tupelo(c)
B3 0.41 20.2 49 0.14 0.47 3.4 0.05 14.6 7.5 0.514A5 0.12 0.74 6.17 0.07 0.65 9.3 0.03 20.3 4.7 0.232D3 0.06 0.47 8 0.13 0.78 6.0 0.04 1.5 6.8 4.533
Sweet-gum
B4 0.09 0.37 4.11 0.15 0.61 4.1 0.02 11 4.7 0.427C5 0.01 0.19 19.00 0.28 1.2 4.3 0.08 3.3 0.51 6.471Red MapleB3 0.41 6.5 15.85 0.14 0.52 3.7 0.03 14.6 0.90 0.062A5 0.12 0.34 2.83 0.07 0.35 5.0 0.06 20.3 1.5 0.074Water OakB3 0.41 0.76 1.85 0.14 0.35 2.5 0.06 14.6 1.3 0.089A5 0.12 0.45 3.75 0.07 0.41 5.9 0.02 20.3 0.13 0.006Loblolly
Pine C5 0.01 0.16 16.00 0.28 0.7 2.5 0.02 3.3 0.24 0.072C5 0.01 0.24 24.00 0.28 1.24 4.4 0.07 3.3 0.7 0.212B5 0.037 0.83 22.43 0.26 0.52 2.0 0.05 10.5 1.9 0.181
Leaf Litter
B3 0.41 8.86 21.61 0.14 0.6 4.3 0.04 14.6 2.6 0.178A5 0.12 0.32 2.67 0.07 1 14.3 0.07 20.3 3.2 0.158C2 0.28 0.17 0.61 0.17 1.58 9.3 0.04 6.3 0.5 0.079C3 0.02 0.23 11.50 0.14 0.71 5.1 0.07 1.4 0.02 0.014
NettedChainFern (d)
B5 0.41 0.31 0.76 0.26 0.65 2.5 0.09 10.5 2.7 0.257(a) For site location see Figure 8.(b) No total or available Hg is reported because this set of data did not satisfy QA requirements.(c) Leaf samples were collected between November 9, 1999 and March 15, 2000.(d) Netted chain fern sample collected March 22, 2000.

WSRC-TR-2001-00032, REV. 0
Page 86
Table 34 (Continuation). Available soil (Soil-A) and plant concentrations (mg/kg; dry weight) and concentration ratios (CR-A; plantconc./available soil conc.).
Ba Ce Pb MnPlantSpecies
SiteLocation
(a) Soil-A Plant CR-A Soil-A Plant CR-A Soil-A Plant CR-A Soil-A Plant CR-AA5 0.12 324 2700 0.1 0.43 4.3 0.01 1 100.0 15.2 1712 113Tupelo(b)
B3 1.51 169 112 4.12 0.3 0.1 0.19 0.42 2.2 3.3 1144 347A5 0.12 183 1525 0.1 1.4 14.0 0.01 0.95 95.0 15.2 1805 119D3 0.43 188 437 1.01 0.83 0.8 0.36 0.62 1.7 17.2 2268 132
Sweet-gum
B4 2.13 72 34 0.06 0.64 10.7 0.01 0.35 35.0 6.1 1253 205C5 0.2 46 230 0.23 1.11 4.8 0.29 1.2 4.1 5.3 1077 203Red MapleB3 1.51 97 64 4.12 0.7 0.2 0.19 0.7 3.7 3.3 580 176A5 0.12 130 1083 0.1 1.5 15.0 0.01 0.62 62.0 15.2 2726 179Water OakB3 1.51 129 85 4.12 0.98 0.2 0.19 0.31 1.6 3.3 2161 655A5 0.12 15 125 0.1 0.44 4.4 0.01 0.56 56.0 15.2 969 64Loblolly
Pine C5 0.2 8 40 0.23 1.07 4.7 0.29 0.78 2.7 5.3 308 58C5 0.2 78 390 0.23 1.11 4.8 0.29 1.2 4.1 5.3 651 123B5 0.37 58 157 1.05 0.53 0.5 0.9 0.83 0.9 4.3 582 135
Leaf Litter
B3 1.51 106 70 4.12 0.57 0.1 0.19 0.69 3.6 3.3 745 226A5 0.12 95 792 0.1 4.9 49.0 0.01 0.32 32.0 15.2 246 16C2 0.45 70 156 4.94 3.7 0.7 1.71 0.18 0.1 7.5 85 11C3 0.15 84 560 0.17 2.4 14.1 0.26 0.22 0.8 0.5 313 626
NettedChainFern (c)
B5 0.37 67 181 1.05 3.8 3.6 0.9 0.23 0.3 4.3 226 53(a) Leaf samples were collected between November 9, 1999 and March 15, 2000.(b) For site location see Figure 8.(c) Netted chain fern sample collected March 22, 2000.

WSRC-TR-2001-00032, REV. 0
Page 87
Table 34 (Continuation). Available soil (Soil-A) and plant concentrations (mg/kg; dry weight) and concentration ratios (CR-A; plantconc./available soil conc.).
U FePlantSpecies
SiteLocation(a)
Soil-A Plant CR-A Soil-A Plant CR-AA5 0.07 2.4 34.3 74 145 2.0Tupelo(b)
B3 0.503 8.9 17.7 55 131 2.4A5 0.07 1.7 24.3 74 138 1.9D3 0.11 17 154.5 55.2 214 3.9
Sweet-gum
B4 0.19 7 36.8 74.4 177 2.4C5 0.018 8.1 450.0 32 179 5.6Red MapleB3 0.503 1.1 2.2 55 258 4.7A5 0.07 0.1 1.4 74 183 2.5Water OakB3 0.503 0.05 0.1 55 159 2.9A5 0.07 0.11 1.6 74 69 0.9Loblolly
Pine C5 0.018 0.81 45.0 32 79 2.5C5 0.018 2 111.1 32 216 6.8B5 0.177 1.2 6.8 186 186 1.0
Leaf Litter
B3 0.503 3.7 7.4 55 177 3.2A5 0.07 1.42 20.3 74 239 3.2C2 0.933 0.25 0.3 75 98 1.3C3 0.05 0.09 1.8 37 93 2.5
NettedChainFern(c)
B5 0.177 1.1 6.2 186 176 0.9(a) Leaf samples were collected between November 9, 1999 and March 15, 2000.(b) For site location see Figure 8.(c) Netted chain fern sample collected March 22, 2000.

WSRC-TR-2001-00032, REV. 0
Page 88
Table 35. Average available concentration ratios (CR-A; plant conc./available soil conc.) values.
Plant Species Co Cr Hg Th U Ba Ce Pb Mn FeTupelo(a) 105 ±
78.3(b)4.8 ± 2.0 0.511
±0.00526 ± 13 122 ± 77 2.2 ± 3.0 51.1 ±
69.2230 ± 188 2.2 ± 0.1
Sweetgum 6.2 ± 1.8 5.0 ± 2.6 2.48±2.9
71.9 ±72 665 ± 77 8.5 ± 6.9 43.9 ±47.1
152 ± 47 2.7 ± 1.1
Red Maple 17.4 ±2.2
4.0 ± 0.4 0.108±0.066
2.2 147 ± 117 2.5 ± 3.3 3.9 ± 0.3 189 ± 19 5.1 ± 0.6
Water Oak 2.3 ± 0.7 3.8 ± 1.8 0.081±0.011
0.8 ± 0.9 584 ± 705 7.6 ± 10.4 31.8 ±42.7
417 ± 336 2.7 ± 0.3
Loblolly Pine 9.9 ± 8.7 4.2 ± 2.4 0.039±0.047
23.3 ±30.7
83 ± 60 4.5 ± 0.2 29.3 ±37.7
61 ± 4 1.2 ± 0.7
Leaf Litter 22.7 ±1.2
3.1 ± 1.4 0.180±0.019
41.7 ±60.1 206 ± 165 1.8 ±2.6 2.9 ± 1.7 161 ± 56 3.7 ± 2.9
Netted ChainFern
3.9 ± 5.2 3.8 ± 5.2 0.127±0.094
7.1 ± 9.1 422 ± 308 16.9 ± 22.2 8.3 ± 15.8 177 ± 300 2.0 ± 1.1
Greatest CR Tupelo Sweetgum Red Maple Sweet-gum
Sweetgum Tupelo NettedChain Fern
Tupelo WaterOak
RedMaple
2nd GreatestCR
Leaflitter
Tupelo Leaf Litter Tupelo Leaf litter Sweetgum Sweetgum Sweetgum Tupelo LeafLitter
(a) The number of observations for each mean varies; tupelo =2, sweetgum =3, red maple = 1 or 2, water oak = 2, pine = 2, leaf litter = 3, Nettedchain fern = 5. The site locations from which plant and soil samples were collected vary between plant species, thus, concentration ratiocomparisons between plant species is compromised.(b) Tree leaves were collected between November 9, 1999 and March 15, 2000.

WSRC-TR-2001-00032, REV. 0
Page 89
8.0 APPENDIX B: EMAIL TRANSMISSION ENTITLED TNX ODCLEAN UP LEVELS, BY KAREN CONNER, 10/24/00

WSRC-TR-2001-00032, REV. 0
Page 90
Karen Conner
10/24/00 04:09 PMTo: Daniel Kaplancc: Tom Hinton, Dennis Stapleton, Gerald Blount, John Bennett, [email protected]: TNXOD OU Clean-up levels
Dan,
Generally the Regulators want to see an area "cleaned up" to a human health risk level of10-6. In the case of the TNXOD OU we have discussed using a modified Industrial Workerscenario based upon 40 days/year exposure for the Inner and Outer Swamp area or 2xaverage background (whichever is higher). The rest of the TNXOD OU will have to aremedial goal of 10-6 Industrial Worker based upon the typical 250 day/year exposure or 2xaverage background (whichever is higher). The COCs and 10-6 cleanup levels are asfollows:
Constituent Inner/Outer Swamp Discharge Gully/OutfallDelta/High GroundU-235 5.11 pCi/g 0.816 pCi/gU-233/234 441.0 pCi/g 68.8 pCi/gU-238 19.6 pCi/g 3.13 pCi/gTh-234 284.0 pCi/g 45.4 pCi/gTh-232 604.0 pCi/g 92.2 pCi/gCs-137 0.655 pCi/g 0.104 pCi/gPb-212 4.55 pCi/g 1.40 pCi/gRa-228 1.78 pCi/g 1.89 pCi/gTh-228 1.60 pCi/g 1.56 pCi/g
As you can see, at these levels some of the constituents are not really a problem (e.g., Th-234 and Th-232). EPA, at least, indicated they might consider a 10-5 remedial goal, whichmay eliminate more, but not all, of the constituents from consideration. You may want tolook at how long it will take for phytoremedation at different risk levels.
The Principal Threat Source Material (PTSM) represents a cumulative risk of 10-3 basedupon the default RBA for the Industrial Worker. At the TNXOD OU the PTSM isrepresented by Th-228, Ac-228 and Ra-228. Threshold values for PTSM are as follows:
Th-228 35 pCi/gAc-228 66 pCi/gRa-228 66 pCi/g

WSRC-TR-2001-00032, REV. 0
Page 91
From the Scoping Summaries, the total volumes, by subunit, that may require action are asfollows:
Lower Discharge Gully 2500 m3 (3200 yd3)Outfall Delta 3750 m3 (4850 yd3)Inner Swamp 20,400 m3 (26,400 yd3)High Ground 6.740 m3 (8,810 yd3)Outer Swamp No human health or ecological problems identified
I did not do the volume calculations (I think Cliff Cole or Coleman Miles did), so I don'tknow the assumptions used. I believe it is to a cleanup level of 10-6 to a depth of 4 ft, butyou may want to check with them. You could use the BRA figures you already have todetermine the extent (vertical and lateral) based upon the various risk levels (I don't havethis readily available). The area of PTSM has not been determined - you may want to makean conservative assumption of 500 ft x 300 ft x 3 ft deep for your calculations.
Hope this helps,
Karen Conner
WSRC-TR-2001-00032, REV. 0
Page 92
9.0 APPENDIX C: ABBREVIATED MASS-BALANCECALCULATIONS EVALUATING PHYTOIMMOBILIZATION
APPLICATION AT THE TNX OD SITE

WSRC-TR-2001-00032, REV. 0
Page 93
The results from the calculations below are presented in Section 4.7.
Table 36. Current and allowable soil activity at the study site
Isotope Current Allowable RemediationSoil Activity(a) Soil Activity(b) Required?
(pCi/g) (pCi/g)Ac-228 5.2 NA NAPb-212 5.4 4.6 YesRa-228 14.5 1.8 YesTh-232 23.8 604.0 NoTh-228 21.5 1.6 YesTh-234 169.0 284.0 NoU-235 8.7 5.1 Yes
U-233/234 193.0 441.0 NoU-238 191.0 19.6 Yes
(a) From Table 5.1.1, Medium Specific Exposure Point Concentrations (from Section 5,RFI/RI with BRA for the TNX Outfall Delta, Lower Discharge Gully and SwampOperable Unit, WSRC-RP-98-4158, Rev. 0 Draft)(b) Values form a email message from Karen Connor 10/24/00 (See Appendix B).
Table 37. Current soil inventory (Icurrent soil; Equation 1) of selected isotopes.
Isotope Current Soil cm3 to pCi to Volume SoilSoil Activity(a) Density(b) m3 Ci Contaminant Inventory
(pCi/g) (g/cm3) Conversion Conversion Site(c) (m3) (Ci)Ac-228 5.2 1.5 1.00E+06 1.00E-12 4214 0.033Pb-212 5.4 1.5 1.00E+06 1.00E-12 4214 0.034Ra-228 14.5 1.5 1.00E+06 1.00E-12 4214 0.092Th-232 23.8 1.5 1.00E+06 1.00E-12 4214 0.150Th-228 21.5 1.5 1.00E+06 1.00E-12 4214 0.136Th-234 169.0 1.5 1.00E+06 1.00E-12 4214 1.068U-235 8.7 1.5 1.00E+06 1.00E-12 4214 0.055
U-233/234 193.0 1.5 1.00E+06 1.00E-12 4214 1.220U-238 191.0 1.5 1.00E+06 1.00E-12 4214 1.207
(a) From Table 5.1.1, Medium Specific Exposure Point Concentrations (from Section 5,RFI/RI with BRA for the TNX Outfall Delta, Lower Discharge Gully and Swamp OperableUnit, WSRC-RP-98-4158, Rev. 0 Draft)(b) Approximate density of a sand-textured sediment.(c) Assumed a contaminated volume of 500 ft x 300 ft x 1 ft.
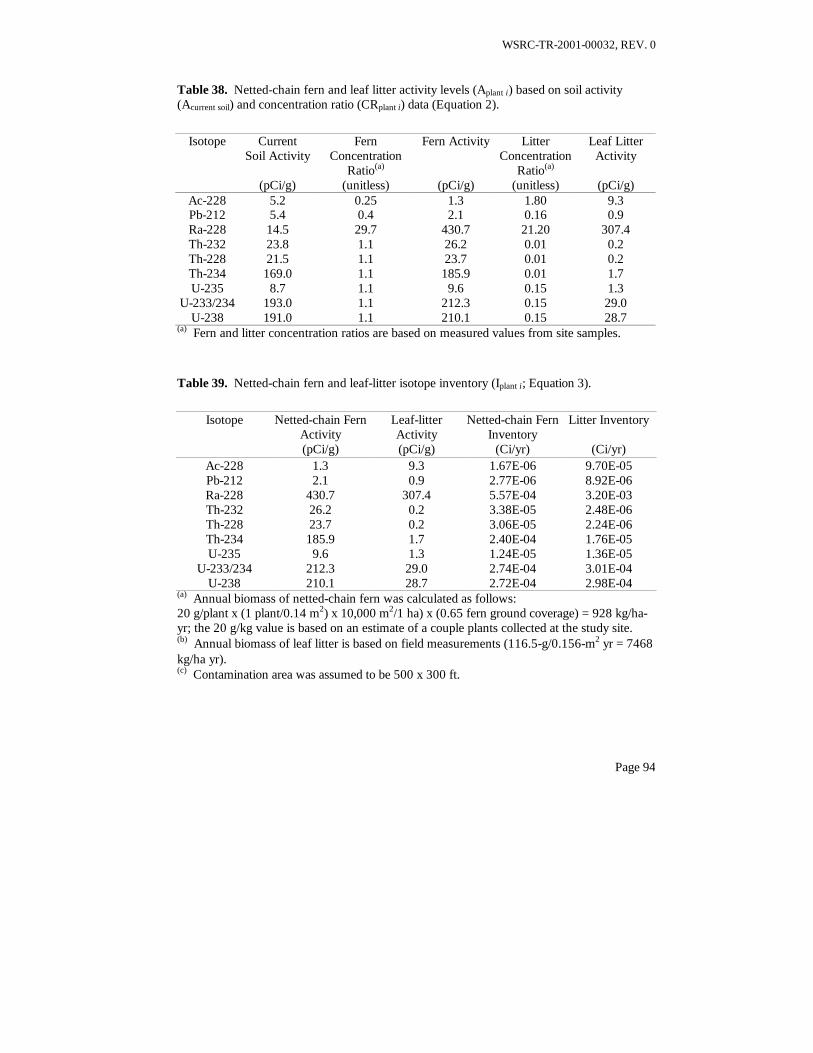
WSRC-TR-2001-00032, REV. 0
Page 94
Table 38. Netted-chain fern and leaf litter activity levels (Aplant i) based on soil activity(Acurrent soil) and concentration ratio (CRplant i) data (Equation 2).
Isotope Current Fern Fern Activity Litter Leaf LitterSoil Activity Concentration
Ratio(a)Concentration
Ratio(a)Activity
(pCi/g) (unitless) (pCi/g) (unitless) (pCi/g)Ac-228 5.2 0.25 1.3 1.80 9.3Pb-212 5.4 0.4 2.1 0.16 0.9Ra-228 14.5 29.7 430.7 21.20 307.4Th-232 23.8 1.1 26.2 0.01 0.2Th-228 21.5 1.1 23.7 0.01 0.2Th-234 169.0 1.1 185.9 0.01 1.7U-235 8.7 1.1 9.6 0.15 1.3
U-233/234 193.0 1.1 212.3 0.15 29.0U-238 191.0 1.1 210.1 0.15 28.7
(a) Fern and litter concentration ratios are based on measured values from site samples.
Table 39. Netted-chain fern and leaf-litter isotope inventory (Iplant i; Equation 3).
Isotope Netted-chain FernActivity
Leaf-litterActivity
Netted-chain FernInventory
Litter Inventory
(pCi/g) (pCi/g) (Ci/yr) (Ci/yr)Ac-228 1.3 9.3 1.67E-06 9.70E-05Pb-212 2.1 0.9 2.77E-06 8.92E-06Ra-228 430.7 307.4 5.57E-04 3.20E-03Th-232 26.2 0.2 3.38E-05 2.48E-06Th-228 23.7 0.2 3.06E-05 2.24E-06Th-234 185.9 1.7 2.40E-04 1.76E-05U-235 9.6 1.3 1.24E-05 1.36E-05
U-233/234 212.3 29.0 2.74E-04 3.01E-04U-238 210.1 28.7 2.72E-04 2.98E-04
(a) Annual biomass of netted-chain fern was calculated as follows:20 g/plant x (1 plant/0.14 m2) x 10,000 m2/1 ha) x (0.65 fern ground coverage) = 928 kg/ha-yr; the 20 g/kg value is based on an estimate of a couple plants collected at the study site.(b) Annual biomass of leaf litter is based on field measurements (116.5-g/0.156-m2⋅yr = 7468kg/ha⋅yr).(c) Contamination area was assumed to be 500 x 300 ft.

WSRC-TR-2001-00032, REV. 0
Page 95
Table 40. Annual contaminant reduction (ACRplant i; Equations 4 and 5) in soils as a result ofplant uptake (inventory in plant/inventory in soil).
Isotope Soil Inventory Yearly Inventory Yearly TotalInventory in Ferns Percentage in Litter Percentage Percentage
(Ci) (Ci/yr) Removed (%) (Ci/yr) Removed (%) Removed (%)Ac-228 0.033 1.67E-06 0.005% 9.70E-05 0.296% 0.301%Pb-212 0.034 2.77E-06 0.008% 8.92E-06 0.026% 0.035%Ra-228 0.092 5.57E-04 0.607% 3.20E-03 3.489% 4.096%Th-232 0.150 3.38E-05 0.022% 2.48E-06 0.002% 0.024%Th-228 0.136 3.06E-05 0.022% 2.24E-06 0.002% 0.024%Th-234 1.068 2.40E-04 0.022% 1.76E-05 0.002% 0.024%U-235 0.055 1.24E-05 0.022% 1.36E-05 0.025% 0.047%
U-233/234 1.220 2.74E-04 0.022% 3.01E-04 0.025% 0.047%U-238 1.207 2.72E-04 0.022% 2.98E-04 0.025% 0.047%
Table 41. Total inventory allowed based on 10e-6 risk.
Isotope Allowable Allowable Soil Current SoilSoil Activity(a) Inventory Inventory
(pCi/g) (Ci) (Ci)Ac-228 NA NA 0.0327Pb-212 4.6 0.0285 0.0339Ra-228 1.8 0.0112 0.0917Th-232 604.0 3.7853 0.1504Th-228 1.6 0.0100 0.1359Th-234 284.0 1.7798 1.0682U-235 5.1 0.0320 0.0552
U-233/234 441.0 2.7637 1.2200U-238 19.6 0.1228 1.2073
(a) Allowable soil activity data was suggested by Karen Conner in email transmission dated10/24/00 (Appendix B)(b) Volume of contaminated site = 500 x 300 x 1 ft = 150,000 ft3 = 4214 m3.(c) Soil bulk density = 1.5 g/cm3. (d) Equation 1.

WSRC-TR-2001-00032, REV. 0
Page 96
WSRC-TR-2001-00032, REV. 0
Page 97
10.0 DISTRIBUTION
B. P. Allen Bld. 737A, SRELN. C. Bell Bld. 730-2B, Rm. 1089J. T. Bennett Bld. 730-2B, Rm. 2174G. C. Blount Bld. 730-2B, Rm. 2179R. F. Blundy Bld. 730-2B, Rm. 2003K. E. Brewer Bld. 730-2B, Rm. 3141B. T. Butcher Bld. 773-43A, Rm. 216S. E. Campbell Bld. 773-2B, Rm. 2170K. R. Conner Bld. 730-2B, Rm. 1099T. G. Hinton Bld. 737A, SRELD. I. Kaplan Bld. 773-43A, Rm. 215A. S. Knox Bld. 737A, SRELE. M. McNamee Bld. 730-2B, Rm. 218L. Newman Bld. 737A, Rm 215S. M. Serkiz Bld. 773A, Rm. B121R. R. Sharitz Bld. 737A, SRELD. L. Stapleton Bld. 730-2B, Rm. 2151
ERD Document Control Project Files, CA1129STI 703-43A (4 copies)WPT File 773-43A, Rm. 213