PROOF BY PICTURE - California Institute of Technology · PROOF BY PICTURE: THE POINCARÉ-HOPF INDEX...
52
NOVEMBER 2001 VOL.1 NO.2 CALTECH UNDERGRADUATE RESEARCH JOURNAL PROOF BY PICTURE
Transcript of PROOF BY PICTURE - California Institute of Technology · PROOF BY PICTURE: THE POINCARÉ-HOPF INDEX...

NOVEMBER 2001VOL.1 NO.2
CALTECH UNDERGRADUATE RESEARCH JOURNAL
PROOF BY PICTURE


MeMe
Gc
Ec
Ap
10 OUTBREAK: THE EBOLA VIRUS by R. Aaron RobisonMuch remains unknown about this frightening tropical disease, but recent discoveries offer the hope of a remedy.
16 RACING THROUGH WATER: SUPERCAVITATION by Victoria SturgeonLife on the high seas speeds up as engineers explore the revolutionary potential of supercavitation.
PROOF BY PICTURE:THE POINCARÉ-HOPF INDEX THEOREM FOR SURFACESby Steve T. Paik
REVIEWS
RESEARCH
FINISAp Applied PhysicsB BiologyEc EconomicsGc GeochemistryMe Mechanical EngineeringM Mathematics
P.22
A new proof for a classic theorem in topology uses visual intuition to bridgethe gap between landscapes and the wind that blows over them.
32 LACKING CHEMICAL SIGNS, ALH84001 MARS METEORITE WAXES LIFELESS by Melissa J. StrausbergGeochemical analysis weakens the possibility of extraterrestrial life in this controversial meteorite.
50 CAT EYES by Ryan Smith
40 SIMULATING STOCK OPTIONS by Mona A. SheikhA new algorithm has the potential to revolutionize trading of American options.
44 LIQUID CRYSTALS ALLOW LARGE-SCALE ALIGNMENT OF CARBON NANOTUBES by Abraham HarteA new construction technique brings closer the realization of nanomachines.
M
Gc
Ec
Ap
LETTERS
6 HELP WANTED: FUTURE AMERICAN PIONEERS by Daniel S. Goldin
8 OPEN DAY AT IVORY TOWERS? by Paul Wymer

20,000 strong
The Caltech Alumni Association is
your connection to a lifelong network
of colleagues and friends.
Join the Association,
now with free five-year membership
for new graduates.
for more information, visit our website athttp://www.its.caltech.edu/~alumni

E X E C U T I V E E D I T O R S
Editor-in-ChiefLakshminarayan “Ram” Srinivasan
Content EditorsRobb RutledgeMike Russo
Art Director/DesignerMarta S. Kaltreider
Online EditorsRobert ChristyVivek ChandranJonathan DamaDylan Simon
Operations ManagerJennifer Li
A S S O C I AT E E D I T O R S
Associate Content EditorsNeda AfsarmaneshAnita ChoiPaul J. ChoiLusine DanakianJonathan FosterBenjamin G. LeeSuhas Nayak
Associate Online EditorTimothy Wan
Associate Operations ManagerPhilip Wong
Associate Print EditorMichelle Giron
S TA F F C O L L A B O R AT O R S
Steve Madden Graphics Advisor, Art Center College of Design
Carolyn Merkel Director, Student-Faculty Programs, Caltech
Gillian Pierce Director, Science Writing Program, Caltech
Ryan Tischler Staff, Student-Faculty Programs, Caltech
C O V E R I M A G E
Surfaces Marta S. Kaltreider
C U R J D O N O R S
Caltech President’s OfficeCaltech Engineering and AppliedSciences DivisionTypecraft, Inc.Associated Students of Caltech
Special thanks to:Steve Madden, for always saying theright thing at the right moment.
CALTECH UNDERGRADUATERESEARCH JOURNAL vol.1 no.11
www.curj.caltech.edu
©2001 CURJ All rights reserved.this issue not for resale.
In the wake of recent terrorist attacks, attention to national defenseovershadowed economic, social, and technological interests. At the newsstands, war coverage blocked out most pages of the majorpapers. In Congress, Republican and Democratic leadership allowedunprecedented loss of civil liberties when they passed the Patriot Actsurveillance and anti-terrorism bill. Amidst the drama of military strikes,America’s domestic wounds festered. The economy had been in declinesince the last presidential election and continued its descent evenwith renewed defense spending. Mismanagement of energy resources,reduction of government funding for alternative energy research, envi-ronmental destruction, wage disparity, and a decrepit public educationsystem were forgotten maladies.
Health still suffers neglect. Anthrax has claimed four lives and posesa threat of unknown proportions, consequently displacing attentionaway from the millions of Americans that suffer from pressing concernslike unaffordable prescription drugs and dysfunctional healthcare. Ifanthrax has replaced cancer, drug abuse, and AIDS as the nation’sforemost health concern, then neither our healthcare system nor thePatriot Act will fix it. With bioterrorism now a permanent threat, theanthrax problem will need systematic integration into a repairedhealthcare system rather than ad hoc emergency-response measures.
At last, the tide is turning. With increasing public demand toattend to matters outside of anthrax and Afghanistan, supporters ofthe status quo can no longer hope that the federal government’s attackon terrorism will remain a blinding diversion. Waking from the tranceof defense, businessmen recall that the danger of economic depressionand layoffs is as serious for the country’s future as the potential falloutof a biological war. Scientists plow forward with research, rememberingthat their discoveries today will rifle through society for years to come.America’s specialized agencies are dealing with terrorism; the nationno longer needs to focus exclusively on that issue.
Moving beyond its posture of self-defense, America averts obsoles-cence. With national security still unsettled, we cannot forget terrorism,but a transition is evolving to a time in which counter-terrorism is onlyone of many important issues. In reconsidering national priorities, wehave not sacrificed our age-old commitment to economic and intellectualprosperity for a defense issue that has no short-term solution. Our journalalso reaffirms its commitment to scientific communication and socialpolicy with each letter, review, and research article. By rememberingits values, America steers clear of Afghanistan’s folly, where obsessionwith war has halted social and economic progress for centuries.
Ram SrinivasanEditor-in-Chief
F R O M T H E E D I T O R

If America is to maintain its leadership role inthe global and competitive environment, wemust sustain our high-tech industry. Thisindustry drives the economic machinery inAmerica that gives us the unprecedentedquality of life and national security that wesometimes take for granted.
In the twenty-first century we must havebright young minds to lead us, as we did inthe 1960s, when many students were drivenby their desire to go to the Moon and embracedthe Space Frontier.
That generation will be retiring soon and Idon’t see our best and brightest young peopleentering the field to meet the incredibledemand for their services. Who is worryingabout America 20 to 30 years from now? Someof our most talented young people are notgoing into science and technology, threateningthe very essence of our productivity. Thedemand is up, but the interest is down. In theend, this will not be good for America.
For the last nine years I have been privi-leged to be the leader of one of the country’spremiere research and development agencies,the National Aeronautics and SpaceAdministration. Before that I spent over 25years in the aerospace industry. During thistime I have seen the rise of the space age, theemergence of microelectronics and mostrecently the impact of information technology.However, in the last several years I have seensigns that our country’s technological superi-ority is at risk.
To confirm our leadership position we mustrenew interest in science and engineeringamong the younger generations in K-12 andthose just entering colleges, and in our currentworkforce. We have many exciting challenges—energy, health care, communications, trans-portation, space exploration, national defense—that are attracting some of our country’sbrightest minds, but overall our production ofscientists and engineers is decreasing.
This is not just a problem for NASA, notjust a problem for the aerospace industry, butfor the country as a whole. Over the past twodecades, the U. S. college-age populationdeclined by more than 21%, from 21.6 millionin 1980 to 17 million last year. The trend ofdecade-long declining enrollment in degreesin several fields of natural science and engi-neering reflects this demographic situation.
I got a glimpse of the future a little morethan a year ago, when the Mars Polar Landercrashed onto the planet’s surface and the MarsClimate Orbiter got lost in space. We had verydedicated and intelligent people, but we didnot have enough of them and they did nothave all the experience they needed.
This was a wake-up call, and I took stepsto secure NASA’s future by assuring adequatetraining and mentoring for our younger minds.However, the “graying” and subsequent retire-ment of our most experienced engineers andscientists is accelerating, not slowing. Unlesswe have a large increase in degree productionand work the supply side of scientists and
LETTERS
HELP WANTED: FUTURE AMERICAN PIONEERS BY DANIEL S. GOLDIN

N O V E M B E R 2 0 0 1 www.curj.caltech.edu 7
engineers—not just the demand side—theaverage age of the engineering workforce inAmerica will continue to rise. About 25% of thecurrent science and engineering workforce aremore than 50 years old, and at NASA, we havetwice as many people over 60 than under 30.
What is the demographic composition ofthe workforce? Women make up 50% of thetotal workforce but comprise only 23% of thescientists and engineers. The situation is worsein some specific areas. For example, only 9%of engineers are women and only 6% of aero-space engineers are women. If we can convinceyoung women over the next decade to becomeengineers and scientists in representativenumbers, we will have almost half the problemsolved.
African Americans, Hispanics, and NativeAmericans comprise only 7% of the total sci-ence and engineering workforce, although theymake up 24% of the population and, demo-graphically, that number is rising. Additionally,these groups tend to be concentrated in socialscience areas, not the hard sciences. Theycomprise less than 3% of the workforce in thephysical and life sciences and in engineering.
These trends are getting worse. Between1996 and 1997, the number of first-year gradu-ate enrollments of African Americans in thescience and engineering fields dropped by 20%.The number of Hispanics entering graduateschool in science and engineering declinedby 18% during the same period. Moreover,minorities receive fewer than 3% of the doc-
torates annually in all of the natural sciences,mathematics, and engineering. Incredibly, since1974, only 25 African-American women havereceived doctorates in physics. We can nolonger ignore these facts.
Highly educated scientists and engineersare part of the answer, but so is an enlightenedinvestment community that sees our futureclearly. Our horizon is focused on quarters inthe fiscal year, but when I ask who’s responsi-ble for America 20 years from now, not manyhands go up. In America, we continue toswim upstream.
Daniel S. Goldin is the longest-serving Administrator of the National Aeronautics and Space Administration. Before joining NASA in 1992, he spent 25 years at the TRW Space and Technology Group.

The Beat Generation. Never before has a generation been so minutely defined andexplained, or so fascinated the generations to come after. The turbulence of post-WWII life cre-ated the right amount of anxiety and listlessness to spawn the twisted brilliance of the time'swritings. In fact, the very word "Beat" is not some clever coinage referring to the pulse of theera. Quite on the contrary. "Beat" describes, as Jack Kerouac defined it, "weariness with all theforms, all the conventions of the world"(p.xii). Indeed, this weariness is expressed in most ofthe Beat writings, and details to what lengths the youth of the day went to break out of thatintangible oppression. The "prosperous" post-war era gave the illusion that everything was "allright" in America, and most people bought into the myth. At the same time, the underbelly ofour society was screaming out into the night, writhing in upheaval, and spitting back at thehand that fed, and ignored, their feelings of discontent with the status-quo. This is the BeatGeneration to me, God save their souls.
John Clellon Holmes coolly captures this magic and madness in his ground-breaking novelGo. This wonderful novel is a pre-On The Road look at the Beats before they were known as theBeats. His conservative nature gives Holmes the unique ability to be an objective narrator, asemi-permeable ghost hovering above the wildness around him. He chronicles the passionatequest taken up by the doom-struck prophets he has chosen to follow--the quest for an identitythrough experience, "...their pragmatic quest for the unusual, the 'real', the crazy... They operat-ed on feelings, sudden reactions, expanding these far out of perspective to see in them profun-dities which Hobbes was certain they could not define if put to it."(p35) In experience, the list-less Beat writers hoped to find an identity. Fed-up with the complacency of the middle-classconventionality, these seekers descended (ascended?) to the fringe groups, the sub and coun-tercultures of society to find acceptance and meaning. In the novel, these places took the formsof New York's dives: filthy apartments and cold water flats, Times Square's seedy clubs, rundown taverns, sweaty jazz clubs, etc. The characters are constantly "go"ing, going, going--searching for themselves in the most unlikely places of chaos and disorder. From Pasternak'swomanizing, to Agatson's drunken debauchery, to Strofsky's ceaseless errands, the players inthe book all suffer from what Holmes calls "lovelessness...the sickness of the age, and its sourcewas in all of us who refused to take the risk of vulnerability."(p. xxii) The wild jazz and bopmusic, drug and sexual experimentation, criminal activity, and glorification of other socialdeviant behavior becomes characteristic of this group and their dubious quest for self. Familyvalues and the overall "normal" definitions of family fell along the wayside and were seen as"square". The wildness of the time pervaded all areas of the rapidly unraveling, inner fibers ofthe outwardly "sturdy" fabric of American post-war society.
Each character in Go struggles with their inner demons in their own colorful way. The prob-lems of identity spill over and create other areas of discontent, but the central issue of confusionabout one's true self stands out in my mind as the key to the "abnormal" behavior exhibited bythe characters. I will explore the character's identity problems individually, although all of thecharacters hinge onto each other in a patchwork of uneasiness and queer desperation.
Paul Hobbes, the protagonist of the novel, is clearly the most mentioned character (as thestory is basically told through his eyes), but is probably the most confusing persona in the story.He is an unemployed writer living with his spunky wife Kathryn. His identity is defined by thesituation. He is a follower in a group of carousing vagabonds, quietly adapting to the environ-ment around him. Usually, he takes a spineless, uninvolved attitude toward the irregularitiesaround him. His own inadequacies about himself, and guilt about not working a paying job getin the way of Hobbes taking a real stand on anything. His marriage is hard to decipher as happyor just plodding, and seems built on confusion from the start; founded more on loneliness andillusion than anything else--"So he and Kathryn met like two dejected conspirators in an alien
The Wellcome Trust, the United Kingdom’slargest charity funding medical research,recently commissioned the Office for PublicManagement to explore ways of improving therelationship between science and the public.Given the Trust’s sphere of influence, thenature of this exercise raises questions aboutefforts in general to “sell science” to the public.
The groundwork for the Office’s analysishas already been done. A group of expertsfrom a wide range of key organizations attend-ed a workshop at the Trust that involved acomplex process leading to alternative scenariosof what the future relationship between scienceand the public might be like. Members of thePublic Understanding of Science cartel are cur-rently invited to comment on these scenarios.Once amended, the scenarios will be the basisfor “an open behavioral simulation of the newrelationships between science and the public.”
Dr. Mike Dexter, the present director of theWellcome Trust, remarked at the beginning ofhis tenure that he thought current efforts atreaching the public were misdirected. “We’recommunicating with the chattering classesbut not the public,” he said. Coincidentally,this was precisely the comment I made to theTrust’s senior management a few years earlierduring my time as their Head of Communicationand Education. I wasn’t particularly surprisedto be ignored, but judging by the Trust’s latestapproach to the problem, Dexter is sufferingthe same fate.
Paradoxically, the Public Understanding ofScience community has in many cases produceda wedge between the two elements it is tryingto marry together. Its approach is characterizedby the membership of the flagship Committee on
the Public Understanding of Science (COPUS).This boasts various dignitaries and professorsbut, perversely, the “public” barely gets alook in. While many innovative projects havebeen developed, the movement itself is largelyself-serving, incoherent and pathologicallyintrospective. However fashionable in academicand “edutainment” circles, “public understand-ing of science” is a largely ineffective idiom,which is perhaps why a recent ParliamentarySelect Committee Report called for a newidentity for this disparate sphere of activity.
Name change or not, there seems a signifi-cant chance that the plot will continue to belost. Rather than attempting to learn from pre-vious activities, the Wellcome Trust seemsintent on an increasingly detached approachto the problem. This is particularly ironic whenthe Trust is probably the only organizationthat could, if it chose to, make a real differenceto the public’s perception of science.
What lessons can be learned from thetrack record? Confusion about aims and objec-tives must be near the top of the list. Theinterpretations of “public,” “understanding,”and “science” have been debated interminably,but to no apparent conclusion. As far as sci-ence is concerned, it seems unlikely that weare dealing with “the greatest, most beautifuland enlightening achievement of the humanspirit” that Karl Popper talked about. As muchis acknowledged by Excellence and Opportunity,a recent government report on science andinnovation. At least this proposal makes nobones about it; members of the public areconsumers and science is simply a means ofcreating new products. If nothing else, this provides focus, but it would seem to take the
OPEN DAY AT IVORY TOWERS?BY PAUL WYMER
LETTERS

N O V E M B E R 2 0 0 1 www.curj.caltech.edu 9
skids from underneath the larger part of thePublic Understanding of Science movement ata stroke.
The vagueness of the term “understand-ing” is emphasised by the number of alterna-tives that have been suggested to replace it.While these have shown an encouraging evo-lution from “appreciation” and “engagement”to “consultation” and even “dialogue,” thereis still an underlying tone of condescension.This is inescapable when the public is appar-ently defined as anyone who is not a scientist.As perhaps one would expect of scientists,several models have been put forward as tohow this amorphous mass may be classifiedand thereby managed. Similarly, attempts atconsultation and dialogue, characterized byfocus groups and citizens panels, sometimesseem analogous to experiments with laboratoryanimals.
Since scientists themselves are inescapablymembers of the public, the dichotomy seemsunhelpful. Conservation groups such asGreenpeace or Friends of the Earth wouldn’tdream of dissociating themselves from thepublic. Regardless of whether one agrees withthem or not, they are very much “by the peo-ple for the people.” This stance, coupled withhighly competent PR and media skills, hasdoubtless led to the ascendancy of these groupsat the expense of science in the public con-sciousness.
To their credit, the Wellcome Trust andother science funding agencies have assidu-ously pursued the media in recent years as ameans of conveying science in a form that isaccessible to the public. Scientists are encour- aged to issue press releases at every opportunity
and given media training in order to do soeffectively. This has certainly resulted in anincrease in column inches for science, but giventhe nature of the media, stories have oftenbeen sensationalized or have concentrated oncontentious issues.
In summary, the openness and transparen-cy in science policy promised by the BritishGovernment in the recent government reportwill require more than cosmetic changes to theway in which science is communicated. It willrequire the opportunity for the public to bedirectly and demonstrably involved in policymaking and the way in which money is allo-cated. Clearly this is easier said than done,but the Wellcome Trust is probably in the bestposition to initiate the process. Public admit-tance to the funding panels would be ashealthy a move for science as the admittanceof women to the Long Room was for cricket.Unfortunately, adopting this as a scenario foropen behavioral simulations of the new rela-tionships between science and the publicmight be sailing a little too close to the wind.
Paul Wymer was head of Communication and Education at the Wellcome Trust from 1990to 1997. He is currently an Education Advisor in the British National Health Service anda teacher in London.

OUTBREAK:
THE EBOLA VIRUSBY R. AARON ROBISON
IN JULY OF 1976, A SUDANESE STOREKEEPER BECAME THE FIRSTrecorded victim of a terrifying new hemorrhagic fever that emerged from its lairin the rain forests of central Africa. The virus that killed him eventually becameknown as Ebola, named after a river in what was then Zaire, where one of thefirst large-scale epidemics occurred in that same year. Those epidemics, whichoccurred simultaneously in Sudan and Zaire, eventually resulted in at least 550reported cases and over 330 deaths, with a fatality rate of nearly 90% in Zaire.Sporadic outbreaks have been recurring since that time, with another severeepidemic in Kikwit, Zaire in 1995. In September of 2000, an epidemic broke outin Uganda that killed 173 people (see Figure 1). Earlier this year in Toronto, awoman traveling from Africa started exhibiting Ebola-like symptoms, sparkinga brief media bonanza before she was finally diagnosed with a form of malaria.
The event that brought Ebola into the minds of most Americans took placein a monkey facility in Reston, Virginia, just ten miles west of Washington, D. C.(see Figure 2). It was there, in the latter part of 1989, that some of the facility’ssimian inhabitants began showing signs of hemorrhagic fever. Those in chargebecame alarmed when more and more of the monkeys began to die of the inex-plicable illness. Panic set in when the virus responsible was discovered to be astrain of the same Ebola virus that had killed hundreds of people in Sudan andZaire. It was quickly discovered that the Reston strain could not infect humans,but the scare left the nation with a haunting awareness of the vulnerability ofAmerica’s urban centers to a deadly and highly contagious pathogen.

N O V E M B E R 2 0 0 1 www.curj.caltech.edu 11
“Ebola may
accomplish in a matter of days
what HIV does to victims
over the course of a decade.”
FEELING THE SYMPTOMS
The virus responsible for wreaking this havocand inspiring such fear is a member of thefiloviridae family of viruses, a distinction sharedonly by the Marburg virus, a similar hemor-rhagic fever virus originating in Africa. Theseviruses are so named for their characteristiclong, filamentous appearance when viewed athigh magnification (see Figure 3). Each virusholds one molecule of RNA, a single-strandedrelative of the double-stranded DNA that com-poses our genes. A shell of protein surroundsthis strand of RNA that encodes all of the virus’genes. These proteins are enclosed in a mem-brane from which protrude glycoproteins, a typeof viral protein that accounts for the virus’ability to enter host cells.
Once a person contracts the virus, threeto eighteen days pass before symptoms start.When they do begin, the symptoms come onabruptly, quickly progressing beyond the initialheadache and fever to more serious symptomsby the third day. In fatal cases, the sick individ-ual begins to bleed internally within one week.Once this hemorrhaging begins, the conditionof the patient deteriorates rapidly. Bleedingescalates and the victim’s organs begin literallyto disintegrate. Finally, as a reaction to thesevere loss of blood, the individual goes intohypotensive shock and dies. This aspect of theillness is the most horrifying because the con-tents of the victim’s body appear to drain fromevery orifice, even the eyes. If the victim sur-vives, the recovery period is extensive, andserious complications can arise in the infection’swake, including arthritis, vision and hearingloss, and conjunctivitis. In Africa, there is alsoan intense social stigma associated with Ebolainfection, and the survivors are often trauma-tized by the social repercussions.
FIGURE 1. Suspected Ebola patients wait anxiously in an isolationward of Lacor Hospital in the Gulu region of Uganda during anEbola epidemic in late 2000. In the space of three months, therewere more than 400 cases of Ebola hemorrhagic fever in Uganda,and over half were fatal. Source: Associated Press, 2000.
FIGURE 2. Image from the movie Outbreak, loosely based on a1989 incident at a monkey facility in Reston, Virginia wheremonkeys mysteriously began dying from hemorrhagic fever. Thecause was later discovered to be a new form of Ebola, luckilyone that could not infect humans. Source: Motion picture Outbreak, 1995.
FIGURE NOT AVAILABLE
ONLINE

REPLICATE AND ATTACK
The course of Ebola infection has provided abewildering puzzle for scientists, who are onlybeginning to understand the precise nature ofthe effect the virus has on our bodies. The entryand growth of the virus in human cells appearsto be rather typical. Once the virus comes incontact with the surface of the cell, the viralproteins present on the virus surface interactwith receptors on the surface of the cell. Thiscauses the cell’s outer membrane to fold inwardand form a cavity with the virus inside, enablingthe contents of the virus to be released intothe cell. The virus disrupts the host cell’s nor-mal functions and commandeers the cellularmachinery to begin making viral proteins andcopies of the viral genome. As the infectionproceeds, new virus structures are formed andappear as long filaments in the infected cell
(see Figure 4). These viruses eventually budfrom the outer membrane of the cell, which thevirus incorporates as its own outer membrane.The newly unleashed virus then proceeds todiffuse and rapidly infects neighboring cells.
Unlike most viruses, which tend to berestricted to particular types of cells or a par-ticular anatomical region, the Ebola virusappears to infect a broad range of host cells,such that the infection often pervades thebody. Nevertheless, examinations of the bodiesof deceased Ebola victims and laboratory ani-mals infected with the virus suggest that thekidneys, liver, and spleen, all essential elementsof the immune system, may be particularlytargeted. The massive tissue death observedin these organs indicates that they are centersof viral replication. Ebola’s presence in these
FIGURE 4. The Ebola virus forms inside an infected cell. Anarrow marks the creation of viral filaments. An Ebola-infectedcell becomes a virus factory producing thousands of new virusesthat bud off and infect other cells. A single drop of infectedblood can contain millions of viruses. Source: S. R. Zaki, C. S. Goldsmith. Pathological Features of Filovirus Infections in Humans. CurrentTopics in Microbiology and Immunology 235, 97-116 (1999).
“Even though the original caseshave been identified in almost every Ebola epidemic,
we are still no closer to finding the reservoir.”
FIGURE 3. This photo, taken in 1976 using an electron micro-graph at 160,000 times magnification, was the first ever of theEbola virus. The virus is long and filamentous, giving its familythe name filoviridae. The outer shell of the virus consists of amembrane studded with proteins. A protein shell surrounds theinner core of RNA. Source: F. A. Murphy.

N O V E M B E R 2 0 0 1 www.curj.caltech.edu 13
organs suggests an attempt to defeat theimmune system.
There are other indications that Ebola maydo just that, prompting some scientists toremark that Ebola can accomplish in a matterof days what HIV does to its victims over thecourse of a decade. Soon after the virus wasfirst uncovered, scientists hypothesized thatsuch immunosuppressive activity did occur,but they did not understand how. One studycompared the immune response over time infatal cases to those that recovered. They dis-covered a marked difference in the immuneactivity between the two groups. Survivingpatients exhibited high levels of antibody earlyon in infection and those levels increased overtime. Antibodies are molecules produced bythe immune system that help to clear virusesfrom the body. The antibodies found in patientswho survived were able to bind to Ebola virusproteins, indicative of an effective advancedimmune response. These patients also hadsignificantly increased activity of killer T-cells,which destroy infected cells. In contrast,patients with fatal cases showed virtually noexpression of antibodies specific to Ebola atany point during infection, and while killer T-cells showed early activity, these cells rapidlydisappeared as infection progressed. Thissuggests a race early in infection between theimmune system and the viral replication. If theimmune system does not respond quicklyenough, it is overtaken and destroyed.
How the virus interacts with the immunesystem is still not fully understood, but some ofthe factors contributing to the immunosuppres-sive effect are known. One important feature isthe virus’ ability to produce a soluble form ofthe protein that is normally found on its surfaceand secrete it in enormous quantities frominfected cells. Recent discoveries indicate thatthis protein selectively binds to and inactivatesneutrophils, a type of immune cell that is essen-tial for the primary inflammatory immuneresponse. This is the activity normally responsi-ble for the redness and swelling we associate
with infections, and helps to activate otherbranches of the immune system.
In addition, the surface protein on the virusappears to have an affinity for the cells liningthe blood vessels, which have an importantrole in signaling responses by the immune sys-tem. Viral infection of these cells has beenshown to interfere with this signaling processand disrupt the cells’ ability to counteract theinfection. A specific portion of this protein isalso known to inhibit the proliferation ofimmune cells. However, while this could permitsecondary infections in Ebola patients, we stillhave no evidence that this happens.
SEARCHING FOR THE VIRAL SOURCE
Ebola infections are short and deadly. Thusthe virus cannot maintain itself in a humanpopulation without quickly killing all its vic-tims and becoming extinct. Because virusesare incapable of being outside a host for morethan a brief duration, there must be a naturalreservoir, another living host in which the virusnormally resides without destructive side effects.When humans encounter this natural reservoir,the virus is transmitted back into the humanpopulation. However, even though the originalcases supposedly responsible for this transmis-sion have been identified in almost every Ebolaepidemic, we are still no closer to finding thereservoir.
Significant efforts have been made to tracethese primary cases in hopes of determiningwhere the contact originated, a search whichhas taken investigators from the decaying rotof bat caves to the remains of dead monkeys.In one of the most vigorous attempts to uncoverthe source, over 3000 animals were taken fromthe region of the 1995 outbreak in Zaire andchecked for signs of the virus, to no avail. Thesearch is further complicated by the infrequencyof outbreaks, suggesting that the source is onethat humans rarely encounter. However, oncethe reservoir is discovered, efforts can be madeto control contact between humans and thehost to curtail epidemics altogether.

RACE FOR A CURE
There have been many approaches to finding atreatment for this formidable virus. All of theseinvestigations have been hampered by thesignificant danger and expense involved inworking with Ebola, which is a Class 4 biologi-cal hazard. This rating, given only to the mostdangerous biological agents, mandates the useof special facilities and procedures for handlingthe virus. The earliest and most rudimentarymeans of dealing with it was to treat patientsin the early stages of infection with the bloodserum of recovering patients, hoping that thehigh concentration of anti-Ebola antibodiesin the hyperimmune serum would give theimmune systems of the patients a fightingchance. However, when used in the chaoticearly outbreaks, this method met with littlesuccess in reducing the fatality rate. Laterstudies in laboratory animals found that thehyperimmune serum taken from non-suscepti-ble animals infected with the virus was highlyeffective at preventing infection in guinea pigsand baboons. The same treatment also seemedto help animals that were already infected. Thetactic may still be effective, but it has yet to beused successfully in patients.
Antiviral drugs have had great success inslowing the growth of HIV into AIDS, and it ispossible that the same type of drugs couldslow Ebola as well. Ebola researchers at theArmy Medical Research Institute of InfectiousDiseases in Fort Detrick, Maryland discovereda drug that is effective at inhibiting a proteinthe virus needs to grow. Inhibiting the mecha-nism by which this protein attaches sugargroups to viral proteins slows viral replication.Unfortunately, as with most antiviral drugs, thedrug itself is toxic and cannot safely be admin-
istered except in minute quantities. The com-promised livers of Ebola victims, increasinglysusceptible to toxins, further aggravate thisproblem. However, below toxic levels, the drugwas effective in treating mice infected withlethal doses of the virus: 100% of the micerecovered when treatment commenced withinone day of the initial infection. When treatmentwas not started until three days after infection,the recovery rate was reduced to 40%, possiblybecause victims’ compromised systems weremore susceptible to the toxicity of the com-pound by that point. The drug has yet to besuccessfully tested in monkeys, let alone inhumans. While it has shown promise in thelaboratory setting, its viability as therapy forhumans is uncertain.
VACCINES TO THE RESCUE
Vaccines have existed in various forms for cen-turies, long before the viruses that causedisease were at all understood. Many modernvaccines are made from killed or attenuatedvirus, which are either dead virus particles or aform of the virus that has been passed formany generations through a non-human organ-ism, such as mice or chickens, until it is nolonger capable of causing a serious infection inhumans. Unfortunately, neither of these vac-cine types is suitable for combating Ebola inhumans because of the risk of exposing indi-viduals to a potentially infectious virus.
The alternative is to create a vaccine thatincorporates only a small piece of the virus,sufficient to raise immunity, but insufficient toenable a complete virus to form. Tests inguinea pigs found that when circular pieces ofDNA (plasmid cDNA) that contained the genes
“The course of Ebola infection
has provided a bewildering puzzle for scientists,
who are only beginnig to understand
the effect the virus has on our bodies.”

N O V E M B E R 2 0 0 1 www.curj.caltech.edu 15
R. Aaron Robison is a fourth year undergraduate in Biology at the California Institute of Technology. The author wishes to thank David Baltimore, President and Professor of Biology at Caltech.
F U R T H E R R E A D I N G
1 H. D. Klenk. Marburg and Ebola Viruses. Current Topics in Microbiology and Immunology 235, 1-225 (1999).
2 C. J. Peters, J. W. LeDuc. Ebola: The Virus and the Disease. Journal of Infectious Diseases 179 (s1), ix-xvi (1999).
3 C. J. Peters et al. Filoviridae: Marburg and Ebola Viruses. In Fields Virology. B. N. Fields et al. (Lippincott-Raven, Philadelphia, 1996), pp. 1161-1176.
4 N. J. Sullivan, A. Sanchez, P. E. Rollin, Z. Y. Yang, G. J. Nabel. Development of a Preventive Vaccine for Ebola Virus Infection in Primates. Nature 408, 605-607 (2000).
for three Ebola viral proteins were injected intothe animals, they were protected against alethal dose of the virus. Last year, using a simi-lar scheme, a group from the Vaccine ResearchCenter at the National Institutes of Health inBethesda, Maryland and the Centers forDisease Control in Atlanta, Georgia injectedmonkeys with Ebola cDNA and an attenuatedadenovirus. The adenovirus was a harmlessstrain of the virus responsible for the commoncold, modified to incorporate Ebola proteins inits genome. The DNA vaccine is traditionallymore effective at producing cellular immunity,whereas the adenovirus also induces produc-tion of protective antibodies. All four monkeysimmunized with this vaccine and subsequentlyinjected with the virus survived. In three mon-keys, the response was so effective that therewas no evidence of any viral replication. Allnon-immunized monkeys died.
While a vaccine offers great promise in thebattle against Ebola, there are still a number ofconcerns surrounding its use, and a vaccine isnot a simple end-all to the problem of Ebola. Inthe vaccine study mentioned above, the quan-tity of virus injected into each monkey wasminiscule, and the vaccine may not be effectiveagainst larger initial infections. In addition, thevaccine only protects against one of four sub-types of the virus that are dangerous tohumans. In order to be effective, the vaccinewould need to protect against all four strains.Once a successful vaccine exists, there is alsodoubt as to how it can be administered. It iseconomically unfeasible to create a vaccineprogram large enough to immunize anyonewho has a chance of coming in contact withthe virus, and attempts to limit the group to
those in contact with the natural reservoir arenot possible until the reservoir has been identi-fied.
THE VIRUS IN PERSPECTIVE
The Ebola virus has attracted global atten-tion and inspired both awe and dread.However, while millions of people have beeninfected with HIV or chronic malaria, approxi-mately one thousand people have died fromEbola since its discovery in 1976. Some civicleaders have questioned the prudence ofexpending resources on a disease that affectsso few people. Even though the current scopeof the virus may be relatively small, there is apossibility that a new form of Ebola may arisethat is not as limited in extent as its predeces-sors. Current research will then have signifi-cant implications. The current duel with Ebolareflects an increasingly frequent theme in med-ical science, where with each new disease ofincreasing complexity and diversity, our inge-nuity is tested as scientists and members of aglobal health community. C

LAST DECEMBER, AN AMERICAN BUSINESS-man, sick with cancer, was sentenced totwenty years of hard labor in a Russian prison.The businessman, Edmund Pope, was chargedwith attempting to purchase the propulsionplans for the Shkval, a Russian torpedo whichsome western military experts believe wasresponsible for the sinking of the Kursk sub-marine last year. Pope’s trial was conductedunder utmost secrecy; no Americans were everpermitted to see the charges against him. Evenhis Russian defense team was forbidden fromseeing the information upon which the prose-cution based its case.
The reason for all this secrecy was theShkval torpedo, an underwater missile thatshatters speed records by using a newly discov-ered phenomenon known as supercavitation.
BY VICTORIA STURGEON
SUPERCAVITATIONRACING THROUGH WATER:

N O V E M B E R 2 0 0 1 www.curj.caltech.edu 17Me
WATER AND DRAG
Any child diving off the board at her neighbor-hood swimming pool knows the effect thatwater has on a fast-moving object. A fall fromtwenty feet onto a hard surface—like the bot-tom of a pool—would break a child’s leg at thevery least, but a ten-year-old might jump offthe high dive a dozen times on any warmsummer afternoon. As soon as she breaks thesurface of the water, her velocity decreases,bringing her to a near stop before she hits thebottom of the deep end.
Similarly, when a projectile is fired into theocean, because of the strong drag force, theprojectile decelerates and loses virtually all ofits forward momentum in only a few thousandfeet. Older torpedoes, in fact, were reusable,floating to the surface and stopping if theymissed their targets.
Drag affects any object moving throughwater. Competitive swimmers know the differ-ence that even a small reduction in drag canhave on performance in a race. The lockerroom at a major high school swim meet is fullof young men shaving their legs, arms, andheads in the hopes of cutting another secondoff their time.
Although the basic concepts poweringthem are strikingly similar, drag slows subma-rine travel to well below airplane speeds.Water limits even nature’s strategies, and thefastest bird moves twice as quickly as thefastest fish. Drag imposes significant con-straints on marine engineering that ultimatelylimit the speed and range of submarines, ships,and projectiles alike.
First explored in the 1940s, supercavitationexploits a loophole that allows underwatertravel with minimal drag. For many years, sci-entists and naval experts studied its parentfield, cavitation, because of the problems thatit brings about. Only recently did researchersconsider supercavitation as a way to buildfaster submarines and torpedoes.
AVOIDING CAVITATION
The same principle that keeps an airplane air-borne causes cavitation around ship propellers:
as velocity increases, pressure decreases.When a ship’s propeller spins underwater, theblades drag liquid around with them. Thepressure of this fast moving water drops,sometimes drastically. Water’s state dependsupon its pressure just as much as it does onits temperature, which is why water boils atlower temperatures at high altitude. Loweringa liquid’s pressure below a certain point,called its vapor pressure, will cause it to boilaway as if it were being heated over a stove.
If a propeller spins fast enough, the sur-rounding liquid will speed up, drop in pressure,and boil away. At first, the physical character-istics of boiling and cavitation are almostidentical. Both involve the formation of smallvapor-filled spherical bubbles that graduallyincrease in size. However, the bubbles producedby the two processes end in very differentmanners. In boiling, bubbles are stable: thehot gas inside either escapes to the surface orreleases its heat to the surrounding liquid. Inthe latter case, the bubble does not collapse,but instead fills with fluid as the gas insidecondenses.
The process is different in cavitation.Cavitation bubbles depend upon the low pres-sure of the surrounding fluid to survive. Asthe pressure of the surrounding liquid increases,the cavity suddenly collapses—a centimeter-sized cavity disappears in milliseconds.Cavities implode violently and create shockwaves that dig pits in exposed metal, scarringpropeller blades and pipes. Engineers aroundthe world strive to minimize cavitation damageby constructing sluiceways, pipes, and chan-nels that control the pressure and velocity ofthe passing liquid to eliminate cavitation.
When it acts upon propellers, cavitationnot only causes damage but also decreasesefficiency. The same decrease in water pres-sure that causes cavitation also reduces theforce that the water can exert against theboat, causing the propeller blades to “race”and spin ineffectively. When a propellerinduces significant cavitation, it is pushingagainst a combination of liquid water andwater vapor. Since water vapor is much less

“Supercavitation exploits a loophole that allows underwater travel
with minimal drag.”
dense than liquid water, the propeller canexert much less force against the water vaporbubbles. With the problems it causes, it is nowonder maritime engineers try to avoid cavi-tation. Varying the shape, pitch, material, andplacement of propellers helps reduce, but noteliminate, the damage.
THE EXCEPTION TO THE RULE
Recently, however, scientists and engineershave developed an entirely new solution tothe cavitation problem. For ships travelingfaster than 60 miles per hour, propeller-inducedcavitation is unavoidable. Supercavitationoffers a solution.
In supercavitation, the small gas bubblesproduced by cavitation expand and combineto form one large, stable, and predictablebubble around the supercavitating object.The bubble is longer than the object, so onlythe leading edge of the object actually con-tacts liquid water. The rest of the object issurrounded by low-pressure water vapor,significantly lowering the drag on the super-cavitating object. Modern propellers intentionallyinduce supercavitation to reap the benefits oflower drag.
A supercavity can also form around a spe-cially designed projectile. The key is creatinga zone of low pressure around the entire objectby carefully shaping the nose and firing theprojectile at a sufficiently high velocity. Athigh velocity, water flows off the edge of thenose with a speed and angle that prevent itfrom wrapping around the surface of theprojectile, producing a low-pressure bubblearound the object (see Figure 1). With anappropriate nose shape and a speed over 110miles per hour, the entire projectile may residein a vapor cavity.
Since drag is proportional to the densityof the surrounding fluid, the drag on a super-cavitating projectile is dramatically reduced,
FIGURE 1. Nose shape affects fluid flow around projectiles, soengineers must design them carefully. An appropriate noseshape and enough speed can create a vapor cavity that enclosesthe entire projectile.Source: J. W. Daly, Ph.D. thesis, Aerodynamics, California Institute of Technology (1945).
ELLIPSOID
SQUARE END CYLINDER
FLOW LINES CAVITY SILHOUETTE

N O V E M B E R 2 0 0 1 www.curj.caltech.edu 19
allowing supercavitating projectiles to attainhigher speeds than conventional projectiles.In water, a rough approximation predicts thata supercavitating projectile has 200,000 timesless skin friction than a normal projectile. Thepotential applications are impressive.
LIFE OF A CAVITY
Supercavities are classified as one of twotypes: vapor or ventilated. Vapor cavities arethe pure type of supercavity, formed only bythe combination of a number of smaller cavi-ties. In a ventilated cavity, however, gases arereleased into the bubble by the supercavitat-ing object or a nearby water surface (seeFigure 2). For example, a torpedo mightrelease its exhaust gases into its supercavity,or a projectile dropped into the ocean mighttake air down with it. Although gases increasethe size of ventilated cavities, additionalcomplications, like gas elasticity and leakagerates, result in a less stable cavity that fluc-tuates in size and shape. In other respects,ventilated cavities and vapor cavities areindistinguishable and subject to the sameprinciples.
The cavitation number, the dimensionlessquantity K, predicts the behavior of a super-cavity. The number is a function of the pressuredifference between the cavity and the sur-rounding water, the density of the surroundingfluid, and the velocity of the object. Physically,the cavitation number is a measure of theinstability of a cavity. For small K, cavitationbegins. As K decreases, the cavity increasesin size and stability (see Figure 3). For super-cavities, the value of K and the shape of theobject’s nose predict the shape and size of thevapor cavity, so monitoring the cavitationnumber of a projectile tracks the status ofits cavity.
Researchers have studied the life cycle ofa projectile-induced supercavity in detail, from
FIGURE 3. The cavitation number, calculated from physi-cal properties of the object and fluid, describes the stateof a cavity. As the cavitation number decreases for thissquare end cylinder, the flow over it increases and thesupercavity grows larger. A larger supercavity is morestable and has less drag, allowing the projectile to travelfaster. Knowing nose shape and cavitation number isenough to predict the shape of a supercavity. Source: J. W. Daly, Ph.D. thesis, Aerodynamics, California Institute of Technology (1945).
FIGURE 2. A projectile dropped into water pulls air down with itto create a ventilated supercavity. The supercavity is less stablethan predicted by its size because the trapped air causes thecavity to fluctuate. Once the air leaks out, the supercavity ismaintained only if the projectile is moving fast enough to createa vapor cavity. Source: J. G. Waugh, G. W. Stubstad. Hydroballistic Modeling (Naval Undersea Center, San Diego, 1972).

the initial moment of supercavitation to thevapor cavity’s death. Immediately after beingfired, a projectile is enclosed within a vaporcavity and experiences little drag. As the pro-jectile slows, its cavitation number increasesand the size of the vapor cavity decreasesuntil it disappears. Unlike a normal cavity, thedeath of a supercavity surrounding a projec-tile is not sudden or violent. The cavity simplyshrinks around the projectile at an ever-increasing rate until the cavity no longer exists.There is little or no damage to the supercavi-tating object from cavity collapse, a crucialadvantage over the craters left by cavitation.However, a closer look reveals some compli-cations slowing down supercavitatingtorpedoes.
BUILDING A BETTER TORPEDO
A torpedo dropped into water draws a columnof air down with it, creating a temporarilyventilated cavity that reduces drag on the tor-pedo. The air eventually leaks out, but if thetorpedo is moving fast enough the collapsingventilated cavity is replaced by a vapor cavity.However, the behavior of the cavity’s tail endbecomes a problem. The supercavity’s tail endmay splash violently around the projectile’srear, causing significant structural damage tocontrol and propulsive surfaces (see Figure 4).
Projectile wobbling creates more problems.Projectiles are quite unstable within theirvapor cavities. Salil Kilkarni and Rudra Pratapat the Indian Institute of Science in Bangalore,India showed that small imbalances in how aprojectile enters the water cause it to wobblewithin its supercavity. The projectile pitchesand yaws about its nose as it proceedsthrough the water, hitting its tail end againstone side of the cavity and then another (seeFigure 5). Since the surface of the vapor cavityis liquid water, these impacts increase dragon the projectile and, over time, slow the pro-jectile. The vapor cavity shrinks (reflectedby an increasing cavitation number) causingincreasingly frequent impacts and thus anescalating drag force that quickly inducescavity death.
FIGURE 4. The tail end of a supercavity splashes around, bang-ing against and damaging a projectile’s tail end. The same sortof cavity splashing occurred when this sphere was dropped intowater. Source: J. G. Waugh, G. W. Stubstad. Hydroballistic Modeling (Naval Undersea Center, San Diego, 1972).
FIGURE 5. Small imbalances during water entry make a super-cavitating projectile’s motion extremely unstable. It pitches andyaws about its nose, slapping its tail against the sides of thesupercavity. These impacts increase the drag on the object,slowing it to the point that its supercavity collapses. Source: J. G. Waugh, G. W. Stubstad. Hydroballistic Modeling (Naval Undersea Center, San Diego, 1972).

N O V E M B E R 2 0 0 1 www.curj.caltech.edu 21
Victoria Sturgeon is a fourth year undergraduate in Mechanical Engineering at the California Institute of Technology. The author wishes to thank Professor Allan Acosta, Richard L. and Dorothy M. Hayman Professor of Mechanical Engineering, Emeritus at Caltech.
F U R T H E R R E A D I N G
1 S. Ashley. Warp Drive Underwater. Scientific American 284, 70-79 (May 2001).
2 D. Graham-Rowe. Faster than a Speeding Bullet. New Scientist 167, 26- 29(July 22, 2000).
3 S. S. Kilkarni, R. Pratap. Studies on the Dynamics of a Supercavitating Projectile. Applied Mathematical Modeling 24, 113-129 (2000).
4 D. Mackenzie. Seismic Shift. Discover Magazine 22, 60-67 (September 2001).
“Supercavitating passenger submarines
could cross the Atlanticin less than an hour.”
MOVING FORWARD WITH SUPERCAVITATION
Supercavitation has obvious applications.Dropped from helicopters and airplanes, newtorpedoes supercavitate from the momentthey enter the water. A supercavitating torpe-do would contact liquid water only at its noseand could outrun any ship; the Russian Shkvaltorpedo has been clocked at speeds up to 230miles per hour. Researchers at the US NavalUndersea Warfare Center were able to fireunpowered supercavitating projectiles atspeeds faster than the speed of sound in water,approximately 1 mile per second!
The U. S. Navy has recently developed asupercavitating bullet to clear underwatermines. Bullets fired from a helicopter-mountedstandard Gatling gun supercavitate throughthe water and detonate mines with little costand even less risk to human life. As for civilianapplications, supercavitating passenger sub-marines could cross the Atlantic in less thanan hour.
However, there are significant technicalproblems to overcome. Foremost is the impos-sibility of steering a supercavitating object(although we probably wouldn’t hear about iteven if a solution had been found), a fact thatrestricts the potential utility of both torpedoesand passenger transportation. Since the onlyportion of a supercavitating projectile thatcontacts liquid water is the nose, there is nopractical way to alter the trajectory without asignificant loss in speed.
Additionally, as discussed above, projec-tile and cavity wobbling damage the tail endof the projectile. One way to reduce damage isto make the cavity larger by ventilating thetail end of the cavity with exhaust. Ventilatingincreases instability but protects the projectilefrom damage. However, even if human pas-senger ships could be launched safely atsupercavitating speeds, the accelerations atthe tail end caused by this instability wouldprobably be too great for passengers.
An additional difficulty is size. To be eco-nomically efficient, a supercavitating submarine
would need to be large enough to transportmany passengers and their luggage. A highvelocity is needed to maintain a large enoughcavity and to provide ample lift, leading us tothe problem of propulsion. Such a submarinerequires a powerful source of propulsion thatdoes not require direct contact with liquidwater. A water jet might work, but that requiresmore power than can be presently generatedunder the circumstances.
FICTION BECOMES REALITY?
The Russian navy, and possibly the Americannavy, has apparently solved some of the tech-nical challenges in developing supercavitatingapplications. However, the nature of the solu-tions is closely guarded, as Edmund Popediscovered last year. We can only speculatehow far military technology has advanced.Supercavitation’s history, now colored byespionage and intrigue, has already inspiredfantastic stories of futuristic naval warfare.Squadrons of ultrafast submarines mightsomeday clash in the oceans, abandoningtraditional stealth tactics in favor of high-speed underwater acrobatics. However,although supercavitation has been widelystudied since the 1940s, many questionsremain unanswered. Despite what navalengineers and science fiction fans mightwish, for the present, supercavitating sub-marines dogfighting underwater will have to wait in our imaginations. C

SUPPOSE YOU ARE AN ANT LIVING ON A SPHERE. FROM YOUR PERSPECTIVEthe world is two-dimensional: you can move back and forth, left and right, butnot up or down. You settle into a comfortable life on the sphere when sudden-ly the wind starts to blow. Air currents develop and begin to circulate aroundthe globe much the same way they do here on earth. In an effort to escape thetorrid winds, you decide to journey across the desolate plains of the globe insearch of a land where the air is perfectly still. Is it possible to find such a calmplace? Fortunately, the answer is always yes—there will be at least one pointon the sphere where the wind speed is zero.
A friend of yours, who is also an ant, lives on another world. Unlike yours,her world is not spherical but toroidal, shaped like a donut. When the weatherchanges for the worse, your friend searches for a place where the wind doesnot blow. Unfortunately, your friend will not always fare as well as you; some-times she will be able to find a point on the torus where the wind speed iszero, but other times she will not find a place of shelter no matter how hardshe looks. This may seem like the work of a mischievous god who teases yourfriend from time to time but always gives you a way out. A mathematicianknows better. He knows that the consequences of topology are on your side.
Only the shape of the world that the ants inhabit distinguishes the twocases. This suggests that only the topology of their world affects the kind ofair currents that can circulate. How does topology allow or prevent an ant fromfinding a sheltered spot? The Poincaré-Hopf Index Theorem offers an explanation.
We begin by describing surfaces in topological terms. When talking abouta sphere or torus, we refer just to its outer surface and not to its inside. Thesurfaces of a sphere and of a torus are two-dimensional, like paper wrappedaround a ball and donut respectively. They are examples of compact surfacesbecause we can enclose each in a box of finite size, and they are called bound-aryless since an ant walking around on the surface of a sphere or torus neverencounters an edge.
PROOF BY PICTURE:
THE POINCARÉ-HOPF INDEX THEOREMFOR SURFACESBY STEVE T. PAIK

Me
MN O V E M B E R 2 0 0 1 www.curj.caltech.edu 23
We assume that the wind on the surfaceof spherical and toroidal planets must flowtangentially, along and in contact with thesurface. At each point, the wind has somemagnitude and direction so it is natural todescribe the weather on these surfaces by acollection of vectors tangent to the surface.This collection of tangent vectors is similar tothe pattern made by iron filings near a barmagnet where the filings indicate the direc-tion of the magnetic field lines. Our tangentvectors cover the entire surface and provide aprescription for the motion of the wind. Thistangent vector field must also be smooth inthe sense that the behavior of the vectorschanges gradually from one point on the sur-face to another nearby point (see Figure 1).From here on, we will refer to smooth tangentvector fields defined on compact boundarylesssurfaces simply as vector fields if we do notexplicitly say otherwise. In order to talk mean-ingfully about these vector fields, we need away to identify them unambiguously.
The problem is as follows. Suppose youdraw a vector field on a surface. Anotherperson can come along and ever so slightlydeform a section of the field. He can continuemaking these tiny alterations until he hasmade so many of them that the field lines flowin a completely new way. The resulting vector
field has no superficial resemblance to theoriginal. This new vector field however isrelated to the original since the person whoaltered the field can always retrace his stepsand get back to the field with which he start-ed. Is there a property of a field that does notchange under such smooth deformations?
Consider isolated points on the surfacewhere the vector field vanishes—the stillspots where the wind doesn’t blow. Thesesingularities are really just zero vectors in thevector field, zeros for short. They are immutablefeatures of the field. This makes zeros special.We can push and pull at field lines near an iso-lated zero or drag a zero around over the sur-face, but the zero remains a zero. No amountof smooth, reversible massaging of the vectorfield will remove it, so the kinds of zeros in thevector field act as a fingerprint for the vectorfield.
Now we are ready to explore the Poincaré-Hopf Index Theorem for surfaces. This celebrat-ed topology theorem relates a specific quantityassociated with the zeros (the index) of a vec-tor field to the number of holes in the surface.Henri Poincaré proved it in 1885 and HeinzHopf proved the full theorem for higher dimen-sions in 1926 after earlier partial results byBrouwer and Hadamard. Presented here is astraightforward proof of the Poincaré-Hopf
“The kinds of zeros act as a fingerprintfor the vector field.”
FIGURE 1. Smooth tangent vector fields are drawn on two different compact boundaryless surfaces. For the sphere (A), here is anexample of a field with only one zero. (B) The torus can be easily covered with a nonzero vector field.
A B

Index Theorem designed to utilize the inter-play between two simple mathematical toolsand your ability to visualize curves and surfaces.
AS THE NEEDLE SPINS: INDEX AND WINDING NUMBER
We can classify a zero by assigning it an inte-ger value called its index, which depends onthe behavior of the field in a small neighbor-hood encompassing the point. To calculate theindex we “pull” the relevant section of thevector field off our surface onto a plane. We dothis because surfaces are generally curved butplanes are not; vector directions are mathe-matically easier to deal with on a flat back-ground. On this plane suppose x-y axes andan origin have been drawn. If this section ofthe field contains a zero, the zero is mappedto the origin of the plane.
Imagine an ant that starts from the originand takes a tiny step outward. She walkscounterclockwise on a tight circular path untilshe returns to her original position. Pretendyou are watching this from above the plane.For each vector the ant encounters on her travel,you take a sheet of paper, copy the pair of x-yaxes and plot the vector. Once the ant hasfinished one tour, make a flipbook using thesepages. Flip through it fast enough and it willappear as if a vector is rotating about the origin.By the time you reach the end of the flipbook,
the vector will have returned to its initial posi-tion (the smoothness of the field guaranteesthis), and so it must have made some wholenumber of trips around the origin. Each com-plete counterclockwise rotation adds one tothe index and each clockwise rotation sub-tracts one. If the vector never makes a fullrotation then the index is 0. This will occurwhen the section of the vector field has nozero (see Figure 2(A)).
The index measures local directional varia-tion of a vector field but we can do the samething on a global scale. For example, if wedrew an arbitrary closed curve snaking itsway around a sphere, it is not possible toassign it an index. Only for curves that occupya small section of some surface does an indexmake sense. The reason for this is that a sur-
face appears flat only upon very close inspection.Approximate flatness is needed to ascribe anindex because we need to be able to “pull” asection of the vector field off our surface andonto a plane. This can only be done if the sur-face is nearly flat.
There is, however, a meaningful term calledthe winding number that quantifies vectorfield variation along arbitrary loops. It is calcu-lated in a similar manner to the index withone subtle difference. First, we draw a closedcurve on a surface that does not run over any
“Singularities are just zero vectors, immutable features of the field.”
Y
X
Y
X
Y
X
Z
FIGURE 2. (A) A zero vector (indicated by z) is mapped to the origin of a plane. The index is the number of times the vectors in thevector field rotate about the origin when traversing a counterclockwise circle around the zero. The index here is 1. (B) The windingnumber is the number of times the vectors in the vector field rotate about the tangent vector to the path. Reversing the orientation of the path simply negates the value of the winding number.
A B

zeros. Again, we call upon an ant to walkalong the curve. This time she will be the onerecording the vectors encountered on thepath, not you.
The ant will stop at each point, draw a pairof x-y axes on a sheet of paper, and plot hervector. But she cannot see the entire surface asyou can. How can she draw meaningful vectordirections without any kind of reference? Soshe chooses to use the tangent vector to thepath as her x-axis. The y-axis she chooses isboth perpendicular to the outward normal vec-tor (a vector that points away from the insideof the surface and is perpendicular to the tan-gent plane) and to the tangent vector (seeFigure 2(B)).
Once her tour of the curve has been com-pleted, the ant flips through her pages and thevectors spin about the origin. From here onthe rules for calculating the winding numberare the same as those for the index.
HOMOTOPY AND CURVE FAMILIES
The winding number of a closed curve has thecrucial property that it does not change whenwe jiggle the curve. It is easy to see why thismust be true: the winding number can onlychange by integer increments, large discontin-uous jumps in value. However, slightly wigglingthe curve should not have any effect on itsvalue. Let’s take advantage of this property tocreate a family of closed curves on a surfaceall with the same winding number. Startingwith one curve, we wiggle it a little to get asecond curve. We wiggle the second a littlemore to get a third and so on. In fact, we cando this as much we like to generate macroscop-ic movements of a closed curve over a surfacewhile keeping the winding number constant.Mathematically speaking, we say that thewinding number is invariant under a homotopyof the path and each curve in the family ishomotopic to any other (see Figure 3).
Two things limit where or how much wemay wiggle a closed curve: holes in the surfaceand zeros in the vector field. The first limita-tion is obvious, but why should a zero restrictwiggling a closed curve? Suppose we had a
curve lying on top of a zero. The techniquefor calculating winding number calls for theobservation of the rotation of vectors as thecurve is traced out. If, somewhere along thispath, there were a vector with zero length, itwould be ambiguous to talk about a net rota-tion, as a vector’s direction is meaninglesswhen its magnitude is zero.
RELATING WINDING NUMBERS AND INDICES
The index and winding number can both beformulated in terms of similar mathematicalintegrals. This is no coincidence. After all,each of these tools measures the rotation ofthe vector field about some fixed point. Thechoice of fixed point distinguishes the twomethods: a zero vector is used for the index,and successive points along some closed curveare used for the winding number. The latter isdefined for any closed path on a surface thatmisses a zero, so it can be studied from a localperspective as well. That is, if a curve encirclesan isolated zero and is small enough, it makessense to ask how the winding number isrelated to the index of that zero.
First we need to know what the orientationof a small curve is. Set a clock flat on a surface.According to our convention, clockwise curvescurl in the direction that the clock’s handsturn. It can be shown that for a small
N O V E M B E R 2 0 0 1 www.curj.caltech.edu 25
Z
FIGURE 3. Three families of closed curves are shown. Curves ofthe same color are homotopic to each other and therefore havethe same winding number. However, the winding number of the solid blue curves is the negative of the winding number of thedashed blue curve since it has the opposite orientation. Notethat the blue curves are not homotopic to the green curvesbecause a zero vector separates them.

clockwise-oriented curve the winding numberis equal to 1 minus the index of the zerocontained within the curve. Now if we reversethe orientation of this curve, making it counter-clockwise, then we need to negate the windingnumber so that it now equals the index minus1. A simple but important case is when thereis no zero in the area enclosed by the curve.Then the index is 0 and hence the windingnumber ±1 depending on the orientation (seeFigure 4).
Although a few more concepts need intro-duction before we present the Poincaré-Hopfproof, our current arsenal of tools shows thatit is impossible for the sphere to admit a com-pletely nonzero vector field. Suppose for amoment that such a vector field did exist.Because there are no zeros to get in our way,it is possible to cover the sphere by a familyof latitude circles that are homotopic to eachother and thus have the same winding number(see Figure 5). But consider the very smallcircles near the north and south poles. Theseclearly have opposite orientations: one circlemust have winding number –1 and the other+1. This is a contradiction, so our originalassumption must have been false.
ZERO TRANSITIONS AND HOLE TRANSITIONS
Consider the surface shown in Figure 6(A)on which are defined two closed curves F1 andF2 that would be homotopic were it not forthe zero, z, separating them. Suppose weknow the winding number of F1. How can wedetermine the winding number of F2? Start bysmoothly deforming the curves until theyintersect, then reverse the orientation of F2 as
TYPES OF ZEROS
FIGURE 4. Zeros are characterized by the behavior of nearbyvectors. A few types of zeros and their indices and windingnumbers for the illustrated curves are listed.
INDEX WINDINGNUMBER
NO ZERO
SOURCE SINK
SADDLE
0,0
+1,+1
-1
-1,+1
0,0
-2
FIGURE 5. Lines of latitude for a sphere are homotopic to eachother assuming there are no zeros in the vector field. The small-est circle at the north pole is oriented counterclockwise, but the smallest circle at the south pole is oriented clockwise so they musthave different winding numbers. This is a contradiction, so theremust be at least one zero vector somewhere in the vector field.
“We can classify a zero by assigning it an integer value calledits index,which depends
on the behavior of the field in asmall neighborhood encompassing
the point.”

shown in Figure 6(B). Since they cross atpoints a and b, we may define each curve asbeing made up of two smaller curves: onecomponent going from a to b across the frontof the surface, and the complementary curvefrom b to a traveling around the back. Nowcut the curves at a and b so that we get fourpieces and reattach them so that we get aclosed curve going around the zero and onebig curve surrounding nothing as shown inFigure 6(C). In the same way that you cancontract the loop of a lasso, we can wiggleG2 into smaller closed curves. This means thatG2 is homotopic to a small clockwise-orientedcircle. No zeros lie within it so its windingnumber must be +1. Contracting G1 results ina small counterclockwise-oriented loop sur-
rounding a zero. We know exactly how to treatthis case. The winding number of G1 equalsthe index of that zero minus 1! It follows thatthe sum of the winding numbers of G1 and G2
equal those of F1 and the reversed F2 sincethey are made up of the same pieces. Reversingorientation simply negates the winding num-ber of F2, so we get:
(1) W(F1) – W(F2) = ind(z)
where W( ) indicates winding number and ind( )stands for index.
The same idea is used to overcome the diffi-culty that arises when two curves are separatedby a hole rather than a zero (see Figure 7(A)).
N O V E M B E R 2 0 0 1 www.curj.caltech.edu 27
F2
F1
Z
FIGURE 6. (A) A zero vector separates two closed curves. (B)The curves, F1 and F2, can be deformed until they intersect onthe front, then (C) cut and reattached into two new curves, G1
and G2, whose winding numbers are easy to calculate. We canthen relate the winding numbers of the two curves to the indexof the zero.
F1
-F2
Z
FRONT
a b
F1
-F2
BACK
Z G1
G2
C
B B
A

F1 and F2 are smoothly deformed until theyintersect (see Figure 7(B)). The orientation ofF1 is then reversed and the curves are cut atthe points of intersection and reattached togive the four loops shown in Figure 7(C).Loops G1 and G3 are oriented counterclock-wise so their winding numbers are each –1. G2
and G4 encircle the hole like a lasso. Visualizesliding G4 out through the hole until it meetsG2. They are homotopic to each other buthave opposite orientations so their windingnumbers (whatever they are) must have oppo-site sign. When we sum the four windingnumbers from the loops, the contributionsfrom G2 and G4 cancel! We conclude that:
(2) W(F2) – W(F1) = –2
PROVING THE POINCARÉ-HOPF INDEX THEOREM
Now that we have all this machinery inplace, the proof of the Poincaré-Hopf Index
F2
F1
FIGURE 7. (A) A hole separates two closed curves. (B) Thecurves, F1 and F2, can be deformed until they intersect on thefront and back, then (C) cut and reattached into four newcurves, G1 through G4. Note that G2 and G4 are homotopic toeach other but have opposite orientations so their windingnumbers cancel. We can then relate the winding numbers ofthe two remaining curves to each other.
-F1
F2
FRONT
-F1
F2
BACK
G1 G2
G4
G3
C
B B
A

Theorem is within reach. Consider a generalcase: a surface with g holes and a vector fieldwith some number of isolated zeros. To simplifythings we drag all the zeros smoothly aroundthe surface and line them up below the firsthole as in Figure 8. This does not change theirindices. Add two small circles at the ends ofthe surface: the bottom one has windingnumber +1 and the top one –1. Start with thebottom circle and wiggle it upward along thesurface; in this process, the curve will makemultiple transitions across zeros and holes,thus altering its winding number. When itreaches the peak, the loop is homotopic to thetiny circle we left waiting there; their windingnumbers must be equal to maintain consistency.This conservation of winding number is thekey to the Poincaré-Hopf Index Theorem.
Let’s do the math. Equation (1) tells usthat each time we move a loop over a zero weneed to decrement the winding number of thecurve by the zero’s index. By the end of thefirst phase, the winding number will be 1minus the sum of the indices of all zeros in thevector field. Equation (2) then tells us todecrement the winding number by 2 eachtime we move across a hole; since there are gholes we subtract 2g by the end of the secondphase. For winding number to be conserved,the following must therefore hold:
1 – ind(z) – 2g = –1
where the sum is over all zeros in the field.Rearranging the formula gives the Poincaré-Hopf Index Theorem:
ind(z) = 2 – 2g
“[The Theorem] says that the kinds of vector fields that may exist on a surface
are determined only by the number of holes in that surface.”
N O V E M B E R 2 0 0 1 www.curj.caltech.edu 29
˚Z
˚Z˚Z
.
.
.
.
.
.
FIGURE 8. A very small clockwise-oriented circle at the bottomof the surface has winding number +1. In phase I, this curve is“moved” over all the zeros in the vector field. In phase II, thecurve is “moved” across all g holes in the surface. The windingnumber is adjusted after each phase transition according to therules we have derived. When we reach the top, the curve mustbe homotopic to a small counterclockwise-oriented circle withwinding number equal to –1. Setting their winding numbersequal gives us the Poincaré-Hopf Index Theorem.
PHASE II(hole transitions)
PHASE I(zero transitions)
w = -1
w = 1 - ind(z) - 2g
w = 1 - ind(z)
w = +1

This is quite an impressive equation. It saysthat only the number of holes in a surfacedetermine the kinds of vector fields that mayexist on that surface. For example, an orangeand an egg will admit similar vector fieldsbecause they both have no holes. The storytold at the beginning of this article shouldnow make sense. Because the sphere has noholes (g = 0) the index sum of a vector fieldon a sphere must equal 2. A nonzero numberimplies that there is at least one zero some-where in the vector field. An ant on a windy,spherical world is lucky. But the torus has onehole (g = 1) so the sum of the indices equals 0.This does not mean that all vector fields onthe torus are free of zeros. Rather, it meansthat it is possible to draw a nonzero vectorfield, such as in Figure 1(B). If such a vectorfield describes the wind on a donut-shapedworld, then an ant on this world will neverfind a sheltered spot. For this ant, there is nosafety in numbers.
Steve Paik is a third year undergraduate in Physics at the California Institute of Technology. This work was completed with Rahul Pandharipande, Professor of Mathematics at Caltech, and funded by the 2000 Caltech Physics 11 Research Program. The author wishes to thank Rahul Pandharipande and Marzia Polito.
F U R T H E R R E A D I N G
1 V. Guillemin, A. Pollack. Differential Topology (Prentice Hall, Upper Saddle River, NJ, 1974).
2 H. Hopf. Differential Geometry in the Large (Springer-Verlag, Heidelberg, Germany, 1989).
3 J. Milnor. Topology from the Differentiable Viewpoint (Princeton University Press, Princeton, NJ, 1997).
“An orange and an egg will admit similar vector fields because they both have no holes.”
C


THE POSSIBILITY THAT LIFE MIGHT EXISTon other planets is compelling. Science fictionwriters have dramatized the existence of “littlegreen men” since the early days of space flight.One scientific theory postulates that extraterres-trial materials, delivered here by comets ormeteors, were the basis for life on Earth.
Life on Earth began roughly 3.9 billion yearsago, the oldest undisputed age of a fossil. In the1950s at the University of Chicago, Stanley Millerand Harold Urey tried to understand the genesisof life by chemically simulating in glassware theconditions on Earth roughly 3.8 to 2.5 billionsyears ago. These chemistry experiments demon-strated that during this Archaean Eon, aminoacids, the building blocks of life, could form withno more than five ingredients: ammonia, methane,hydrogen gas, water, and an electric spark(see Figure 1).
BY MELISSA J. STRAUSBERG
LACKING CHEMICAL SIGNS,
ALH84001MARS METEORITE WAXES LIFELESS

N O V E M B E R 2 0 0 1 www.curj.caltech.edu 33Gc
Liquid water is essential to life on thisplanet. Water vapor is abundant in the uni-verse, but liquid water only exists in themoderate temperature range of 0 to 100degrees Celsius. Our galaxy alone contains amass of water millions of times the mass ofthe Sun, but only a few locations in our solarsystem are thought to have the delicate tem-perature balance necessary for liquid water,the most likely of which are Europa and Mars.
Europa is the fourth largest of Jupiter’smoons. Images from NASA’s Galileo Orbitershow sheets of ice on Europa’s surface, brandedwith cracks and tipped ridges. These featuresmay be the result of a sub-surface water ocean,beginning 1 kilometer down and extending 60kilometers deep. NASA hopes that their 2008Europa Orbiter mission will confirm theseinferences, but for now, the existence of liquidwater on Europa remains an open question.
Mars too may contain liquid water. Whilemuch of the Martian water is frozen in polarice caps, images from NASA’s Mars GlobalSurveyor released last year suggest recentruns of water on the planet’s surface from sub-terranean stores (see Figure 2). The European
Space Agency hopes to discover Martian water in 2003 with their Mars Express orbit-ing spacecraft. Equipped with ground-pene-trating radar, Mars Express will prospect forwater as deep as 5 kilometers into theMartian crust.
Work on these space missions rocketedforward in 1996 when scientist David McKayof the NASA Johnson Space Center in Houstonannounced that his team of researchers fromfive institutions had found evidence of life inthe Martian meteorite ALH84001 (see Figure3). The news drew the world’s attention andNASA Administrator Daniel Goldin briefedPresident Clinton at the White House onMartian life. One of only twelve recoveredMartian meteorites, the fist-sized ALH84001had chemical compounds and fossil-like struc-tures that might have been biological. In thesummer of 2000, we received the now-famousmeteorite for study. After analyzing the mete-orite with a variety of geochemical techniques,our research suggested that the contents ofthe ALH84001 meteorite were not biologicallyproduced.
FIGURE 1. An artist’s rendition of Archean Earth, thought to bethe environment necessary for life to originate. Source: S. Liebes, E. Sahtouris, B. Swimme. A Walk Through Time (John Wiley ans Sons, New York, 1998).
FIGURE 2. A comparison of gullies on Mars (left) and Earth (right).It is yet unknown whether the Martian gullies were caused byflowing water or by some other erosional force at work on theplanet’s surface.Source: NASA/JPL/Malin Space Science Systems, 2000.
ALCOVE
APRONS
CHANNELS
ALCOVE
APRON
CHANNEL

MARS COULD HAVE ONCE SUPPORTED LIFE
The Martian environment may have oncebeen able to sustain life similar to that foundon Earth. After the formation of the Martianvolcano Tharsis more than four billion yearsago, Mars’ atmosphere became filled with thegasses produced by volcanism – ammonia,methane, and hydrogen. Lightning also hit theMartian surface, and with water, the Martianenvironment would have resembled that ofthe Archaean Earth when life formed. NASAbegan its search for Martian life by probingfor organic matter in the planet’s surface soiland underlying crust. From 1976 to 1982, twoNASA Viking spacecraft sought evidence ofMartian life through programmed experiments.Such experiments included monitoring carbondioxide output from soil fed with simplesugars and measuring the soil’s organic com-pound output after heating. The Viking exper-iments did not reveal any organic matter,
but this did not rule out the possibility of lifeon Mars. In 1996, McKay proposed that aharsh oxidizing agent or high quantities of UVradiation could have left the surface of theplanet devoid of organic matter. Still, tracesof organic matter might remain below thesurface.
With the possibility for Martian life stillopen, scientists focused attention on thetwelve discovered Martian meteorites. In1996, McKay and colleagues analyzedALH84001, observing elliptical and tubularstructures that resembled bacteria fossils (seeFigure 4) and detecting long-lived organicmolecules called polycyclic aromatic hydrocar-bons. His paper concluded that these features
FIGURE 3. A piece of the Martian meteorite ALH84001, recoveredfrom the Allan Hills ice fields in 1984. The cube in the lower rightcorner is 1 cm in height. ALH84001 became well-known in 1996when scientists purported to have found life on Mars in the formof ancient biological fossils in this meteorite. Source: Lunar and Planetary Institute, 1996.
FIGURE 4. Electron micrograph of elliptical and tubular struc-tures in Martian meteorite ALH84001, a meteorite from Mars.These odd formations could be fossilized bacteria. Source: Lunar and Planetary Institute, 1996.

N O V E M B E R 2 0 0 1 www.curj.caltech.edu 35
were evidence for primitive bacterial life onMars, but the data was inconclusive. Bothelliptical or tubular structures and polycyclicaromatic hydrocarbons can be producedthrough inorganic as well as living processes.In 1998, Luann Becker of the Hawaii Instituteof Geophysics and Planetology and colleaguesfound amino acids in ALH84001. While thestudy showed that those amino acids seepedinto the meteorites over 13,000 years inAntarctic ice fields, the possibility could notbe excluded that trace amounts of someamino acids might be Martian.
The geological history of ALH84001suggests that the meteorite itself met basicconditions for sustaining life while on Mars.Radioactive dating revealed that the meteoritecrystallized from magma 4.5 billion years ago.Fractures on the meteorite showed that it wasbroken up after it crystallized, perhaps by anearby asteroid impact. Globules of carboncompounds formed in the rock at this time, astrong indication that the meteorite interactedwith air and water while still on Mars. Cosmicray analysis reveals that the meteorite wasejected from Mars 16 million years ago, land-ing on Earth 3 million years later.
HYDROGEN FINGERPRINTS
When samples of ALH84001 are heated totemperatures between 300˚C and 1000˚C,hydrogen containing compounds within themeteorite burn, releasing hydrogen. LikeBecker’s characterization of the meteorite’samino acids, determining the origin of thehydrogen in ALH84001, terrestrial or Martian,biological or inanimate, would further suggestthe presence or absence of traces of life.
We can determine if some of this hydro-gen is originally from Mars by looking at theratio of deuterium to hydrogen in the gas.Deuterium is an isotope of regular hydrogenthat contains an extra neutron, and the deu-terium to hydrogen ratio varies from locationto location. The Martian atmosphere has adeuterium to hydrogen ratio roughly fivetimes that of Earth’s atmosphere. This iso-topic fingerprint makes Martian hydrogeneasy to identify. Any compound from Marscontaining hydrogen, including all organiccompounds, has a much higher deuterium tohydrogen ratio than a structurally identicalcompound from Earth.
Experiments by Laurie A. Leshin and col-leagues at Caltech showed in 1996 thatALH84001 releases deuterium-rich, Martianhydrogen when heated. However, thoseexperiments did not identify the compoundsthat initially held the extraterrestrial hydro-gen. These so-called hydrous phases might beorganic molecules like hydrocarbons, but
“The fist-sized ALH84001 had
chemical compounds and
fossil-like structuresthat might have been biological.”
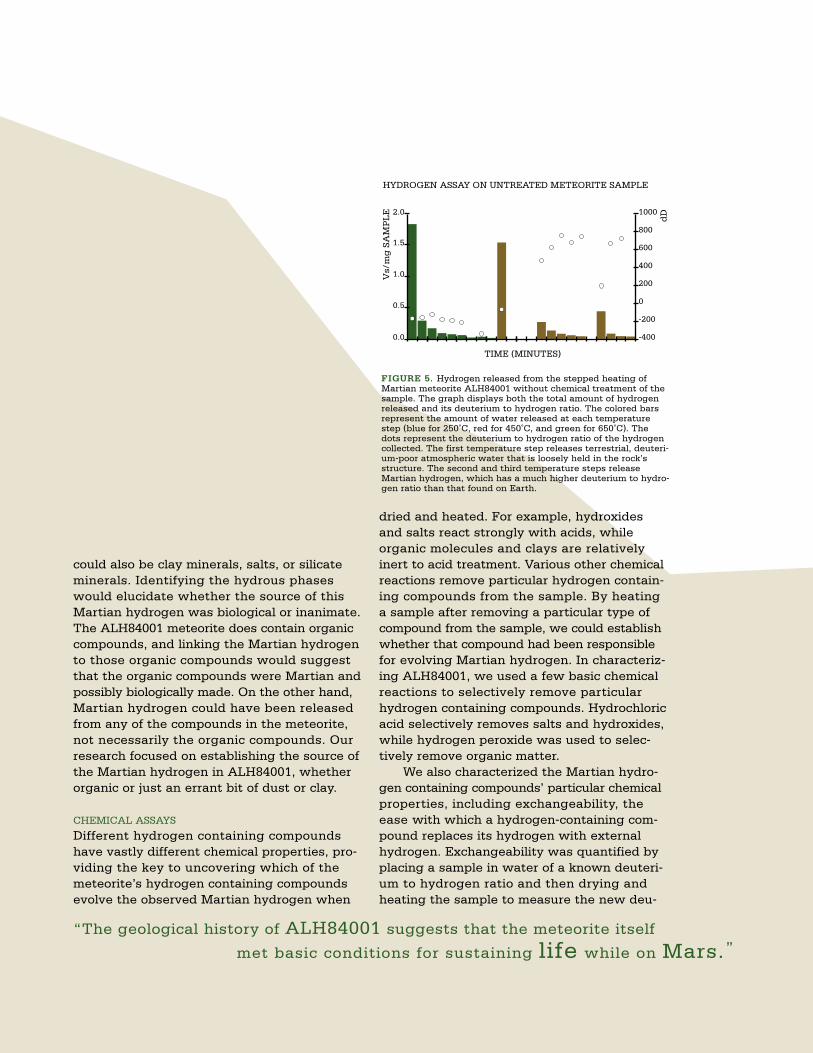
could also be clay minerals, salts, or silicateminerals. Identifying the hydrous phaseswould elucidate whether the source of thisMartian hydrogen was biological or inanimate.The ALH84001 meteorite does contain organiccompounds, and linking the Martian hydrogento those organic compounds would suggestthat the organic compounds were Martian andpossibly biologically made. On the other hand,Martian hydrogen could have been releasedfrom any of the compounds in the meteorite,not necessarily the organic compounds. Ourresearch focused on establishing the source ofthe Martian hydrogen in ALH84001, whetherorganic or just an errant bit of dust or clay.
CHEMICAL ASSAYS
Different hydrogen containing compoundshave vastly different chemical properties, pro-viding the key to uncovering which of themeteorite’s hydrogen containing compoundsevolve the observed Martian hydrogen when
dried and heated. For example, hydroxides and salts react strongly with acids, whileorganic molecules and clays are relativelyinert to acid treatment. Various other chemicalreactions remove particular hydrogen contain-ing compounds from the sample. By heatinga sample after removing a particular type ofcompound from the sample, we could establishwhether that compound had been responsiblefor evolving Martian hydrogen. In characteriz-ing ALH84001, we used a few basic chemicalreactions to selectively remove particularhydrogen containing compounds. Hydrochloricacid selectively removes salts and hydroxides,while hydrogen peroxide was used to selec-tively remove organic matter.
We also characterized the Martian hydro-gen containing compounds’ particular chemicalproperties, including exchangeability, theease with which a hydrogen-containing com-pound replaces its hydrogen with externalhydrogen. Exchangeability was quantified byplacing a sample in water of a known deuteri-um to hydrogen ratio and then drying andheating the sample to measure the new deu-
HYDROGEN ASSAY ON UNTREATED METEORITE SAMPLE
TIME (MINUTES)
Vs/
mg
SA
MP
LE
dD
0.0
0.5
1.0
1.5
2.0 1000
800
600
400
200
0
-200
-400
FIGURE 5. Hydrogen released from the stepped heating ofMartian meteorite ALH84001 without chemical treatment of thesample. The graph displays both the total amount of hydrogenreleased and its deuterium to hydrogen ratio. The colored barsrepresent the amount of water released at each temperaturestep (blue for 250˚C, red for 450˚C, and green for 650˚C). Thedots represent the deuterium to hydrogen ratio of the hydrogencollected. The first temperature step releases terrestrial, deuteri-um-poor atmospheric water that is loosely held in the rock’sstructure. The second and third temperature steps releaseMartian hydrogen, which has a much higher deuterium to hydro-gen ratio than that found on Earth.
“The geological history of ALH84001 suggests that the meteorite itself
met basic conditions for sustaining life while on Mars.”

N O V E M B E R 2 0 0 1 www.curj.caltech.edu 37
terium to hydrogen ratio. Another chemicalproperty tested was thermal stability; we pre-heated some samples to test how stable thehydrogen containing phases were to thermalvariations.
After a particular chemical reaction, asample and its untreated control samplesunderwent heating to release hydrogen todetermine the deuterium to hydrogen ratio.The heating was stepped, meaning that tem-peratures were held at 250˚C, 450˚C, and650˚C. The amount of hydrogen gas liberatedand its deuterium to hydrogen ratio at eachtemperature step is graphed for one trial inFigure 5.
A HANDFUL OF SALTY DUST
Our experiments suggest that a fresh sampleof ALH84001 releases a significant amount ofdeuterium-rich Martian hydrogen when heat-ed to roughly 450˚ C (see Figure 5). When asample is first treated with hydrochloric acid,the hydrogen it releases upon heating has anearly terrestrial deuterium to hydrogen ratio,as shown in Figure 6. This result conclusivelydemonstrates that the Martian hydrogen-con-taining compound is soluble in even a weak acid.
The exchangeability experiment showsthat the deuterium to hydrogen ratio of hydro-gen released from treated samples wentbelow the generally accepted terrestrial ratio(see Figure 7), indicating that the Martianhydrogen carrier is exchangeable. Similar trialsindicate that the Martian hydrogen carrier isinsoluble in a weak base and decomposeswhen pre-heated to around 450ºC.
The above assays determined criticalchemical properties of the Martian hydrogen-containing compound: solubility in a weakacid, insolubility in a moderate base, thermalinstability at 450ºC and high exchangeability.These properties suggest that the Martianhydrogen in ALH84001 does not come fromorganic matter or clay, but is more likely a saltor an acid-soluble hydroxide. Both salt andacid-soluble hydroxides are suspected to beprincipal constituents of surface dust in themodern Martian environment. This surfacedust may have become trapped in ALH84001sometime before its ejection.
Although our results suggest that none ofthe organic matter on ALH84001 is Martian,this “negative result” conclusion is very diffi-cult to prove entirely. It cannot be concluded
HYDROGEN ASSAY ON HYDROCHLORIC ACID TREATED METEORITE SAMPLE
TIME (MINUTES)
Vs/
mg
SA
MP
LE
dD
0.0
0.5
1.0
1.5
2.0 1000
800
600
400
200
0
-200
-400
FIGURE 6. Hydrogen released from the stepped heating of acidtreated Martian meteorite ALH84001. Less hydrogen was releasedat the second temperature step and it was of a lower deuteriumto hydrogen ratio than in untreated ALH84001 (Figure 5). Thisdifference indicates that the Martian hydrogen-containing com-pound is soluble in a weak acid. Temperature steps are in bluefor 250˚C, red for 450˚C, and green for 650˚C; white dots indicatedeuterium to hydrogen ratio.
HYDROGEN ASSAY ON FOUR-DAY WATER-IMMERSED METEORITE SAMPLE
TIME (MINUTES)
Vs/
mg
SA
MP
LE
dD
0.0
0.5
1.0
1.5
2.0 1000
800
600
400
200
0
-200
-400
FIGURE 7. Hydrogen released from the stepped heating of sam-ples of Martian meteorite ALH84001 immersed in water for fourdays. Again, the deuterium to hydrogen ratio of the hydrogenreleased in the second and third steps is nearer the terrestrialvalue than the Martian one. This indicates that ALH84001’sMartian hydrogen-containing compound is exchangeable in water.Temperature steps are in blue for 250˚C, red for 450˚C, and greenfor 650˚C; white dots indicate deuterium to hydrogen ratio.

that there is no needle in a haystack withoutturning over every straw in the haystack.Similarly, a counter argument to our conclu-sions might suggest that perhaps our methodswere not sensitive enough to detect traceamounts of Martian organic compound. Therewill almost always still be a possibility that lifedid exist on Mars.
If the Martian hydrogen-containing com-pound in ALH84001 is in fact a salt ratherthan an acid-soluble hydroxide, we could saywith some confidence that there was onceliquid water on Mars. But recalling the 1950schemical simulations by Stanley Miller andHarold Urey, the origin of life requires a coinci-dence of many factors, including the presenceof liquid water. Still, optimistic scientists con-tinue to search for proof that terrestrial life isnot unique. In 2000, McKay and colleaguesfrom five other institutions reported findingwhat could be the remains of magnetic bacte-ria in ALH84001. NASA is planning a missionthat will go to Mars and bring a soil sampleback to Earth, and more meteorites from Marsare found on Earth every year. Perhaps one ofthese approaches will yield the proof that hasyet been so elusive; for now, Martian life mustremain an intriguing possibility.
Melissa Strausberg is a second year undergraduate in Planetary Science at the California Institute of Technology. This work was completed with John Eiler, Assistant Professor of Geochemistry at Caltech, and funded by the 2000 Axline Caltech Summer Undergraduate Research Fellowship. The author wishes to thankJohn Eiler and Nami Kitchen.
F U R T H E R R E A D I N G
1 L. Becker, B. Popp, T. Rust, J. L. Bada. The origin of organic matter in the Martian meteorite ALH84001. Earth and Planetary Science Letters 167, 71-79 (1999).
2 L. A. Leshin, S. Epstein, E. M. Stolper. Hydrogen Isotope Geochemistry of SNC Meteorites. Geochemica et Cosmochimica Acta 60-14, 2635-2650 (1996).
3 D. S. McKay et al. Search for Past Life on Mars: Possible Relic Biogenic Activity in Martian Meteorite ALH84001. Science 273, 924-930 (1996).
4 H. Y. McSween. What we have learned about Mars from SNC meteorites. Meteoritics 29, 757-779 (1994).
5 L. L. Watson, I. D. Hutcheon, S. Epstein, E. M. Stolper. Water on Mars: Clues from Deuterium/Hydrogen and Water Contents of Hydrous Phases in SNC Meteorites. Science 265, 86-90 (1994).
“The Martian atmosphere has a deuterium to hydrogen ratio roughly five times that of Earth’s atmosphere,
so this isotopic fingerprint makes Martian hydrogen easy to identify.”
C

A P R I L 2 0 0 1 www.curj.caltech.edu 43

JOE BUCKS WORKS FOR WISEINVESTORS, INC. BECAUSE OF HISoutstanding performance last year, his boss gave him a bonus—anoption of 2000 shares of company stock. The option exercise price is $12a share. Joe will pay this amount for the stock if he exercises his option,called a call option. A year later, the stock’s market price has soared to$20 a share, and Joe decides to exercise the option. He pays $24,000 forstock that is currently worth $40,000.
The incentive stock option is common, often awarded as a bonus forgood performance. A stock option is a contract that gives the option-holder the right to trade (buy or sell) a quantity of stock in the future fora predetermined price (the exercise price). At expiry, if the stock price Sis greater than the option price K, Joe Bucks exercises his option. Hepays an amount K for stock worth S, making a profit of S minus K—$16,000 for Joe Bucks. If K exceeds S at expiry, he lets the option expire.A high interest rate makes putting money in the bank more profitablethan buying options, so option values are discounted to reflect whatinterest alone could make. With a high interest rate and a long time toexpiry, options must be steeply discounted to be attractive.
Option contracts can be classified by when an option can be exercised.European options can only be exercised at the expiry date, whereasAmerican options may be exercised at any time before expiry. Analyzingthe European option requires only determining the stock’s final price.The Black-Scholes formula, developed in 1973, provided an easy way todo that, revolutionizing the world of option trading. Once options couldbe accurately priced, more of the world’s financial markets began listingstock options. Option trading has since grown to an annual volume of670 million options last year. Scholes picked up a Nobel Prize for hiswork in 1997 (Black unfortunately passed away in 1995).
The American option’s additional complication—finding the optimaltime for exercise—makes pricing it one of the most challenging problemsin finance. A faster and more accurate valuation of the American optionwould change the world of option trading like the Black-Scholes formuladid nearly three decades ago. Least squares regression might be theanswer.
BY MONA A. SHEIKH
SIMULATING
STOCK OPTIONS

N O V E M B E R 2 0 0 1 www.curj.caltech.edu 41Ec
SIMULATION PREDICTS EUROPEAN OPTION PRICES
The Monte Carlo method predicts stock pricebehavior with lognormal random walks (seeFigure 1). Future price is a function of currentprice, interest rate, how volatile a stock is,and a random factor. We used this method tosimulate the European option, checking ourresults against the theoretical predictions ofthe Black-Scholes equation. In the real world,risky investments need greater incentives thansafe ones, even with the same expected values.We ignore this bias, as does the Black-Scholesequation, and assume risk-neutrality.
Many lognormal random walks togetherproduce a lognormal distribution of final stockprices (see Figure 2). We evaluate the optionfor each run and average our results to predictoption price. Our predictions agree well withthe Black-Scholes equation for the same inter-est rate, volatility, original price, and time toexpiry (see Figure 3).
For the American option, direct applicationof the Monte Carlo technique is impossible.Since the owner of an option can exercise theoption at any time before expiry, modelingrequires an infinite number of points along thepath. Furthermore, this method cannot predictexercise time—an American option will be
exercised early if its holder thinks his profitsare greatest before expiry. The decision toexercise early requires an expected futurestock price based on current price. The Least-Squares Monte Carlo algorithm, recentlydeveloped by Longstaff and Schwartz, pro-vides a means for this prediction.
TIME (YEARS)
ST
OC
K P
RIC
E (
DO
LL
AR
S)
0.8
0.70 0.1 0.2 0.3� 0.4� 0.5� 0.6� 0.7 0.8 0.9 1
0.9
1.1
1
1.2
1.3
1.4
FIGURE 1. Lognormal random walks can simulate stock behav-ior. A “coin” flipped at discrete intervals increases or decreasesstock price. This coin can be weighted to reflect expected long-term behavior (rising or falling). Many walks together produce agood model for the behavior of a stock’s price.
STOCK PRICE (DOLLARS)
VA
LU
E O
F E
UR
OP
EA
N O
PT
ION
S (
DO
LL
AR
S)
0.3
0.2
0.1
00 0.2 0.4 0.6� 0.8� 1� 1.2� 1.4 1.6 1.8
0.4
0.6
0.5
0.7
0.8
0.9
FIGURE 3. For the same interest rate, volatility, and time toexpiry, Monte Carlo simulations of the European call option(points) agree with the theoretical predictions of the Black-Scholes equation (solid line), the accepted method for Europeanoption pricing. The option exercise price is 0.6 for this example,so when stock price is lower than 0.6, the option is worthless.
FINAL STOCK PRICE FROM SIMULATION (DOLLARS)
HO
W M
AN
Y T
RIA
LS
RE
TU
RN
ED
EA
CH
FIN
AL
PR
ICE
5
00.4 0.6 0.8 1� 1.2� 1.4 1.6� 1.8 2 2.2
10
15
20
25�
30
FIGURE 2. Stock option price is computed based on each lognor-mal random walk—a single simulation of a stock’s behavior.Many trials together produce a lognormal distribution of stockprices. An option price is determined for each trial, and the valueof the option is the average over all trials. More trials improvethe estimate, but the simulation takes longer to run.

SIMPLIFYING AN IMPOSSIBLE CALCULATION
Joe Bucks buys a put option. Unlike the calloption his company gave him, this contractgives him the right to sell stock at a predeter-mined price to the option’s issuer. Even if thestock price plummets, Joe can still sell at ahigh price. In a general economic downturn,his profits could cheaply buy other stocks. Wewant to know how much Joe should becharged for that contract.
We again simulate stock prices with log-normal random walks. We consider discretetimes along each path—Joe can only sell onone day a year. This reduced flexibility willundervalue the option price since the besttime to sell will undoubtedly be some otherday of the year. More discrete times improvethe estimate but increase computing time.
Each January 1, Joe decides whether toexercise his option or hang onto it for anotheryear. We predict his behavior. To begin, westart at the end. For this example, our initialstock price is $100, the exercise price is $110,the interest rate is 5% per year compoundedcontinuously (e rate x time), and the contract laststhree years (see Figure 4). At expiry, afterthree years, the decision to sell is obvious:if exercise price exceeds stock price, Joesells. This certainty allows us to step back-ward and predict what Joe was thinking theyear before.
We calculate the payoff (K minus S) foreach of five simulations after three years(paths 1, 4, and 5 are profitable). After twoyears, four paths are profitable (2, 3, 4, 5) and we determine the expected future payoff foreach path (path 1 isn’t profitable after twoyears so Joe doesn’t have to make a deci-sion—he waits). We pair these four Year 2prices with the payoffs at Year 3, discounted
by the interest rate (e -.05 = .95 per year). Tomake waiting worthwhile, the payoff must begreater next year than what selling now andputting our profits in the bank would make.We fit a quadratic function to our points torelate discounted future payoff to presentstock price.
We plot our function beside the Year 2payoffs (see Figure 5), and assume that Joesells only when the immediate payoff exceedsthe expected future payoff. For example, theYear 2 payoff for path 5 is $16, but Joe waitsan extra year because he can earn $2 more.Now we know what Joe will do for all pathsthat reach Year 2—sell on 2 and 4, wait on 3and 5.
We now discount these payoffs and pairthem with the prices for Year 1 (again, onlythose that are profitable need decisions). Weuse Year 2 payoffs for paths 2 and 4, discount-ed one year’s interest, and Year 3 payoffs forpaths 1 and 5, discounted two years’ interest.As before, we find a quadratic function thatestimates expected future payoff and tells usif Joe sells or waits (see Figure 6).
TIME (YEARS)
ST
OC
K P
RIC
E (
DO
LL
AR
S)
90
800 1� 2� 3
110
100
120
130
140
PATH 1PATH 2PATH 3
PATH 4PATH 5EXERCISE PRICE
FIGURE 4. Five simulated price paths for the American putoption exercisable at three discrete times (expiry after threeyears). A put option is the right to sell stock at a predeterminedprice and is profitable when that price exceeds the stock price.The Least-Squares method works backward from the date ofexpiry, predicting future payoffs from present prices to deter-mine whether an investor sells or hangs onto his stock.

After one year, Joe sells only on path 3.After two years, he sells on 2 and 4. On paths1 and 5, Joe exercises the option at expiry. Wecalculate the option payoffs at the optimalexercise times and discount them dependingon how long we had to wait ($3.43, $10.83,$18.05, $4.51, $18.86; see Figure 4). The aver-age prices the option at $11.14. This is howmuch Joe should have been charged for theoption.
FINANCIAL MARKETS RELY ON SPEED
Predicting the future is always difficult, andpricing options is no easy problem. It’s beenaround for thousands of years—since theancient Greeks sold options on goods shippedfrom their ports. Financial markets alwaysneed faster and more accurate predictions.When stock prices jump, new option pricesmust be recalculated immediately; the fastestfirm has the advantage.
Least-Squares provides a straightforwardway to evaluate the American option. However,although computers have no difficulty fittingcurves to data points in present simulations,the large number of paths and time intervalsrequired for accurate pricing demand too muchcomputing time to be practical. Complexoptions with more complicated dependencies
on time and stock price, like the Bermuda,Asian, and Barrier options, will be impossible.Neural networks promise a fast replacementfor polynomial fitting. If they live up to theirpromise, the Least-Squares Monte Carlo algo-rithm and neural networks together couldsolve one of finance’s most difficult problems,transforming the pricing of American optionsthe way the Black-Scholes formula revolution-ized trading of European options.
N O V E M B E R 2 0 0 1 www.curj.caltech.edu 43
Mona Sheikh is a second year undergraduate in Electrical Engineering at the California Institute of Technology. This work was completed with Yaser Abu-Mostafa, professor of Electrical Engineering and Computer Science at Caltech, and funded by the 2000 CaltechSummer Undergraduate Research Fellowship. The author wishes to thank Yaser Abu-Mostafa, Amir Atiya, Malik Magdon-Ismail, and Gentian Buzi.
F U R T H E R R E A D I N G
1 F. Longstaff, E. Schwartz. Valuing American Options by Simulation: A Simple Least-Squares Approach. Review of Financial Studies 14, 113-147 (2001).
2 P. Wilmott, S. Howison, J. Dewynne. The Mathematics of Financial Derivatives(Cambridge University Press, Cambridge, 1995).
3 C. Bishop. Neural Networks for Pattern Recognition (Oxford University Press, Oxford, 1996).
PRICE AT TIME 2 (DOLLARS)
PATH 5
PATH 2PATH 4
PATH 3
PA
YO
FF
(D
OL
LA
RS
)
-5
0
-1090 95� 100� 105 110
5
10
15
20
25
30
EXPECTED PAYOFF AT TIME 3PAYOFF AT TIME 2DISCOUNTED YEAR 3 PAYOFFS
FIGURE 5. A curve is fitted to points marking the discountedYear 3 payoffs and corresponding Year 2 prices for all paths withpositive Year 2 payoffs. This curve is compared to the payoffsfor selling at Year 2. On paths where the payoff exceeds theexpected payoff of waiting (2, 4), the option-holder sells.
EXPECTED FUTURE PAYOFF PAYOFF AT TIME 1DISCOUNTED YEAR 2 OR 3 PAYOFFS
PATH 5 PATH 1
PATH 4
PATH 3
PRICE AT TIME 1 (DOLLARS)
PA
YO
FF
(D
OL
LA
RS
)
-5
0
-1090 95� 100� 105 110
5
10
15
20
25
30
FIGURE 6. The Least-Squares Monte Carlo method is recursive.The results shown in Figure 5 allow us to determine expectedpayoffs for waiting at Year 1. Year 1 prices are paired with Year2 and Year 3 payoffs, depending on how long the investorexpects to wait and discounted for what interest would havemade. This curve and the payoffs from selling at Year 1 allow usto predict the investor’s behavior. He sells at Year 1 on path 3,when the immediate payoff exceeds the expected future payoff.At Year 2, he sells on paths 2 and 4. He sells on paths 1 and 5 atexpiry. The payoffs from the options at each time ($3.43, $10.83,$18.05, $4.51, $18.86; see Figure 4) are averaged to give anoption price of $11.14. This is how much the investor should becharged for the option contract.
C

CARBON NANOTUBES INCLUDE A REMARKABLYversatile set of molecules, which possess extraordinarystrength, flexibility, and thermal conductivity, as well asmany novel electronic characteristics. Depending on thespecific arrangement of its constituent atoms, a nan-otube can be a conductor or semiconductor, and aminiature wire, a diode, or a transistor. Some types ofnanotubes generate orders of magnitude less heat thancomparable copper wires when a current is passedthrough them. With all of these useful electrical andmechanical properties, nanotubes also have only one-sixth the density of steel.
With a proper technique for assembling nanotubes,such a unique material could have diverse technologicalapplications, including more efficient flat-panel displaysand longer lasting batteries. Smaller electronic compo-nents made from nanotubes could increase computerspeed and memory capacity far beyond current levels.Miniaturization with nanotubes could also lead to unprece-dented medical technologies, such as probes and repairdevices that could be injected into the bloodstream todiagnose and treat patients.
Formed from a cylinder-shaped arrangement ofcarbon atoms, a nanotube resembles a rolled sheet ofgraphite. The typical single-walled nanotube (see Figure1) is only a few nanometers in diameter and can extendto over 100 microns long. Nanotubes have very differentphysical properties depending on the orientation oftheir carbon atoms. Nearly all applications require thatgroups of nanotube rods be distributed in some specificpattern, constrained by orientation dependence of phys-ical properties or packaging constraints. A useful wire,for example, must be longer than it is wide, and large
LIQUID CRYSTALS ALLOW LARGE-SCALE ALIGNMENT OF
CARBON NANOTUBESBY ABRAHAM HARTE

N O V E M B E R 2 0 0 1 www.curj.caltech.edu 45Ap
enough that many nanotubes must go into itsconstruction. Developing nanotube-basedtechnologies therefore requires the ability toeasily manipulate which direction a nanotubefaces.
Efforts to align carbon nanotubes havemade modest advances. Up to a few individualnanotubes can be oriented with an atomicforce microscope, but this is inadequate toconstruct larger devices, which require thequick and cheap alignment of large numbersof nanotubes. Eventually, several alignmentmethods will be needed to form the nanotubepatterns necessary for different applications.Our research develops a technique to quicklyand precisely align millions of nanotubes usingliquid crystals, the same technology that formsyour digital watch display.
LIQUID CRYSTALS INSPIRE ALIGNMENT IDEAS
Laptop screens, alarm clocks, and many othereveryday devices use liquid crystals. The liq-uid crystals we used are composed of small,rod-like organic molecules that maintain theirorientations with respect to one another underspecific temperature and pressure conditions.As with carbon nanotubes, liquid crystal prop-erties change with their orientation. For exam-ple, liquid crystal display (LCD) technologylocally rotates liquid crystal molecules totransmit or absorb light and form patterns likethe numbers on a digital clock display. Preciselyaligning cylindrical liquid crystals for commer-cial applications has become commonplace.The similarities between cylindrical liquidcrystals and carbon nanotubes suggest thatanalogous methods might work to align carbonnanotubes.
Applying an electric or magnetic field toalign liquid crystals is the basic guiding principlebehind digital watch displays. In the simplesttype of liquid crystal configuration, light fromthe sun or a light bulb shines through a thinlayer of liquid crystal sandwiched betweentwo glass plates with a polarizing filter on theopposite side. Just as a spring absorbs motionin the direction it stretches, cylindrical liquidcrystal molecules block out light polarizedalong their main axis. When no voltage isapplied, liquid crystal molecules orientthemselves parallel to the glass, so that lighttransmitted through the liquid crystal layerbecomes polarized. The polarizer is orientedperpendicular to this blocking angle, so itabsorbs all of the light transmitted by the liq-uid crystal layer and the liquid crystal layerappears dark. Conversely, to light up the cell,electrodes in the glass apply the electric ormagnetic field necessary to rotate the mole-cules perpendicular to the glass. Since theincoming light now sees the liquid crystal mol-ecules head-on, light transmitted through theliquid crystal layer is not polarized. The polar-izing filter transmits all of the unpolarizedlight from the liquid crystal layer, and the cellappears lit.
The most obvious method to align nan-otubes is to simply apply an electric or magneticfield. This approach is not feasible with solidsamples because intermolecular forces in asolid are difficult to break. Instead, we sus-pended nanotubes in water to allow them torotate freely and applied magnetic fields ashigh as 2 Tesla. We saw no measurable effect,implying that aligning large quantities of nano-tubes requires magnetic fields stronger that weare capable of producing.
Attempting a variation on the first experi-ment, we dissolved the nanotubes in the com-mon liquid crystal 4-pentyl-4-cyanobiphenyl,abbreviated 5CB. 5CB is a thin liquid at roomtemperature, making it easy to dissolve nan-otubes and create cells. By aligning the liquidcrystals using a magnetic field, we expectedthem to exert a torque on the nanotubes, andconsequently align the nanotubes in the same
FIGURE 1. Illustration of a typical single-walled carbon nano-tube. Although it is only a few nanometers wide, it can be up to100,000 times longer than it is wide.

direction. Our results suggest that this indeedhappened, despite the fact that one liquidcrystal is thousands of times smaller and lessmassive than a nanotube. Since liquid crystalscan be as easily aligned with electric fields aswith magnetic fields, our results should beidentical if electric fields, which are oftencheaper to create, are used.
In this experiment, the nanotube solubilityin 5CB liquid crystals was measured to be only10 -6 grams of nanotube per gram of liquid crys-tal, translating to 1 nanotube molecule per 10 9
liquid crystal molecules. Since nanotubes donot dissolve well in any known substance, thispoor solubility is not surprising but practicalapplications would be prohibitively inefficientat these low concentrations. While we did notinvestigate ways of increasing solubility, thereare several promising avenues for furtherresearch, suggesting that this is unlikely to bea major hurdle.
MEASURING NANOTUBE ALIGNMENT
To find the magnetic field’s effect on the nan-otubes, we needed a method to measurenanotube alignment. The resulting setup canmeasure both the alignment of the liquid crys-tals and detect its effect on the nanotubes insolution (see Figure 2).
To prepare the experimental setup, weproduced several batches of thin glass liquidcrystal cells coated with dimethyldichlorosilane.This chemical aligns all the liquid crystals sothat liquid crystal molecules directly in contactwith a glass surfaces remain perpendicular tothe surface. Intermolecular interactions keepthe other liquid crystals in the cell orientedwith each other, so all of the liquid crystals inthe cell will be perpendicular to the glass sur-face in the absence of a magnetic field.
When a sufficiently strong magnetic fieldis applied perpendicular to the molecules, theystart to turn away from the surface. Theresponse of the molecules is not directly pro-portional to the field strength, so below a certaincritical field there is no observable effect. Afield slightly stronger than this will dramati-cally rotate the molecules. This sharp change,called the Freedericksz transition, can easilybe observed through differences in the indicesof refraction along different directions in thecell—a property called birefringence. Liquidcrystal is highly birefringent: as the molecules
POLARIZER ANALYZER
ELECTROMAGNET
PHOTO-DIODEHeNe LASER
FIGURE 2. Schematic of the setup used to measure theFreedericksz transition. The output intensity of the system isused to interpret the degree of rotation of the liquid crystal mol-ecules away from the optic axis.
“[Miniaturization] from nanotubescould increase computer speed and
memory capacity far beyond current levels,
leading to unprecedented medical technologies.”

line up with the magnetic field, the index ofrefraction changes significantly in that direc-tion, “compressing” passing light most in onedirection.
The Freedericksz transition is a simpleindicator of microscopic interactions: anychange in the properties of the liquid crystalcell alters the transition field. If adding carbonnanotubes changed the transition field, thiswould indicate a strong interaction betweenthe materials, suggesting the liquid crystalmeets resistance from the nanotubes as italigns with the field.
Saturating the solution with nanotubesproduced a consistent 10 to 30 percentincrease in the transition field. It is also interest-ing to note that liquid crystal supersaturatedwith nanotubes required three times the fieldstrength to induce the same amount of rotationas liquid crystal without nanotubes, suggestinga reaction of some kind even if the nanotubesare not properly dissolved. The increase in theFreedericksz transition implies that the liquidcrystal is indeed acting on the nanotubes, sinceat a concentration of 109 grams of nanotubeper gram of liquid crystal the mere presenceof nanotubes and dilution of the liquid crystalcertainly could not account for the observedvariations!
SCATTERED LIGHT RESOLVES MEASUREMENT
The upward shift we saw in the Freedericksztransition field could have been caused eitherby the nanotubes aligning along with therotating liquid crystals, or by a randomly-oriented collection of nanotubes impeding themotion of the liquid crystal. Further measure-ments were needed to distinguish betweenthese possibilities. As with liquid crystals,nanotubes absorb light polarized along theiraxis. If the nanotubes were aligning with theliquid crystals, then we might observe a largerdifference between light transmittances ofcells for different polarizations after nanotubeswere added to the solution.
To test this, two thick quartz cells wereproduced in which the liquid crystals werealigned parallel to the cell walls. One of thesewas filled with pure 5CB liquid crystals andthe other contained a saturated 5CB-nanotubesolution. These samples were placed betweentwo crossed-polarizing filters, and the trans-mission of the system was measured as afunction of wavelength. The percent of lighttransmitted in each setup is shown in Figure 3.Birefringence effects determine where theminima and maxima will be, while the totalamplitude of oscillation derives from lossesin the cell, which in turn will depend on thealignment of the liquid crystal and nanotubes.
N O V E M B E R 2 0 0 1 www.curj.caltech.edu 47
400 450 500 550 600 650 700 750 800 850
1.00
0.90
0.80
0.70
0.60
0.50
0.40
0.30
0.20
0.10
0.00
WAVELENGTH (nm)
TR
AN
SM
ISS
ION
FR
AC
TIO
N
LC+SWNTPURE LC
FIGURE 3. Light transmission through liquid crystal cells, withand without nanotubes in solution. At troughs most of the polar-ized light is perpendicular to the aligned liquid crystal and nan-otubes. The polarized light at peaks is parallel to most of themolecules. The larger amplitude of the system with nanotubesimplies that the nanotubes are aligned with the liquid crystaland increase the amount of light blocked or transmitted.

Figure 3 shows that in both cases the locationsof minima and maxima are similar, indicatingthat the nanotubes did little to change thecell’s birefringence, but the much greateramplitude of the nanotube solution oscillationshows that this cell has very different polariza-tion properties, suggesting that the nanotubesare in fact aligned.
The differential loss parameters of thetwo solutions as a function of wavelength areshown in Figure 4. This quantity representsanisotropy, the difference in the brightness oflight shined through the cell from differentdirections. If the liquid crystals or nanotubesin the cell were aligned randomly, theanisotropy would be low since the moleculeswould not be absorbing more light in onedirection than another. If, on the other hand,the molecules were mostly aligned in onedirection, polarized light perpendicular to themain axis of the molecules would be mostlyabsorbed. When the light comes into the cellfrom a different direction, there would bemuch less absorption, so a higher anisotropyindicates a greater alignment of molecules in
“As with carbon nanotubes,
liquid crystal properties change with their orientation.”
A
400 450 500 550 600 650 700 750
0.45
0.40
0.35
0.30
0.25
0.20
0.15
0.10
0.05
WAVELENGTH (nm)
TR
AN
SM
ISS
ION
AN
YS
OT
RO
PY
LC+SWNTPURE LC
FIGURE 4. Peak to trough ratio of light transmissions fromFigure 3. The higher direction dependence of the nanotube solu-tion also indicates that the nanotubes are aligned and blockinglight preferentially in one direction.

N O V E M B E R 2 0 0 1 www.curj.caltech.edu 49
Abraham Harte is a fourth year undergraduate in Physics at the California Institute of Technology. This work was completed with Yuen-Ron Shen, Professor of Physics at the University of California, Berkeley, and funded by the 2000 Caltech Summer Undergraduate Research Fellowship and the National Science Foundation. The author wishes to thank Y. R. Shen, Seok-Cheol Hong, Masahiro Ishigami, and Alex Zettl.
F U R T H E R R E A D I N G
1 Z. F. Ren et al. Synthesis of Large Arrays of Well-Aligned Carbon Nanotubes on Glass. Science 282, 1105-1107 (1998).
2 B. I. Yakobsen, R. E. Smalley. Fullerene Nanotubes: C1,000,000 and Beyond. American Scientist 85, 324-337 (1997).
the cell. Figure 4 shows that adding nanotubesto the liquid crystal did indeed increase direc-tion-dependent losses in the cell, providingeven more evidence that the liquid crystal didin fact align the nanotubes.
ENVISIONING PRACTICAL NANOTUBE ASSEMBLY
Our experiments strongly support the ideathat liquid crystal molecules can be used toalign carbon nanotubes. We expect that thetechniques described here for carbon nanotubealignment will be extended to the smallestscales by depositing liquid crystal-carbon nan-otube solution on a substrate with convention-ally-etched microelectrodes to apply the fieldsand allow input/output capability. The liquidcrystal could then be evaporated away whileholding the nanotubes in place. Without self-constructing circuits, this fabrication techniquemay not be precise enough for nanoelectron-ics, but dynamic alignment of nanotubes inliquid crystal is still a major step forward.
The problem of preserving a nanotubeassembly might be partly solved if nanotubescould retain their alignment after the liquidcrystal was frozen. For example, aligning andfreezing large concentrations of nanotube inliquid crystal could produce a large crystal withsome nanotube properties. Since creating alarge chunk of nanotubes is currently impossi-ble, freezing may prove an effective alternativefor generating strong materials or ultra-efficientheat sinks. Exactly how nanotubes will beassembled for practical applications remainsto be seen, but each new advance in nanotubeassembly brings us closer to the day that com-puters fit on fingertips and full-sized televisionsrun on clock batteries. C

CAT EYES
A wild animal’s glowing eyes looked back at me from the darkness of thegarage, viewing the world from an ethereal angle. The light switch revealed mycat, but those glowing eyes made me wonder how cats see the world.
Ryan SmithArt Center College of Design
BY RYAN SMITH
FINIS
Cat EyesMixed Media, 13”x 13”Artist’s Private Collection

surfp r o g r a m
Caltech’s Summer
Undergraduate Research
Fellowships program
introduces undergraduate students
to research under the guidance
of seasoned mentors.
Students experience the process of
research as a creative intellectual
activity and gain a more realistic
view of the opportunities and
demands of a professional
research career.
For more information go to
http://www.its.caltech.edu/~surf
or phone 626.395.2885