Prompt Oil Price ($/bbl) $61.68 $2.48 4.2% Prompt Gas ... Page Document Library/ADLibrary... ·...
17
1 February 19, 2018 Oil ended last week up. At first glance, the inventory numbers did not seem incredibly bullish however WTI managed to trade up last week. The decline in Cushing inventories was 1.84 mmbbls. The U.S. oil rig count increased by seven rigs, even with a four rig decline in the Permian. The near term contract closed up $2.48, or 4.2%, at $61.68 Natural gas stayed relatively flat last week. The basis markets were the more interesting story. A Permian to Mid-Con 5-year transport deal was apparently signed causing an aggressive rally in the Perm and Waha. The near-term contract closed down $0.02, or 0.8%, at $2.56 Debt Markets S&P E&P (2) outperformed last week 4.7% vs. SPX (2) 4.3% US equities were higher this week, with the S&P 500 gaining 4.3% for its best week since January 2013. While the index remains down for the month, it is once again positive YTD and has gained ~6% since the February 9th low. Treasuries were mostly weaker with the curve flattening, and much of the yield rise coming on Wednesday following hotter-than-expected January CPI data. The dollar was down on the major crosses. Gold finished the week up 3.1%. The S&P 500 consensus 2018 EPS estimate is $156.8 for an implied P/E multiple of 16.8x. The 5-year historical average is 16.1x One issuer priced one issue to raise $450 million last week Year-to-date volume stands at $49.2 billion, compared to $51.3 billion in year-to-date 2017 Retail cash outflows from US high yield mutual funds totaled $6.3 billion last week, compared to the prior week’s outflows of $2.7 billion. This brings year-to-date outflows for 2018 to $12.1 billion, compared to $900 million of inflows in year-to-date 2017 The sole deal to price in the High Yield market last week was an E&P issuer: Jones Energy (CFR: Caa2/CCC (Fitch); Issue: B2/B (Fitch)) priced $450 million of 9.25% Senior Secured 1L Notes at 97.526 to yield 9.875%. The 5NC2 Notes priced in line with talk. Proceeds will be used to repay borrowings under its revolver and for general corporate purposes Noble Energy announced that it executed an agreement to sell its deepwater Gulf of Mexico assets to Fieldwood Energy LLC for a total value of $710 million plus a contingent payment of up to $100 million; Fieldwood Energy concurrently filed a prepackaged Chapter 11 bankruptcy WildHorse Resource Development Corporation announced that it executed a definitive agreement to divest its North Louisiana assets to Tanos Exploration II LLC for $217 million WildHorse concurrently announced the acquisition of 17,453 net acres in Lee County, TX from an undisclosed seller for $19.3 million LINN Energy, Inc. announced that it signed a definitive agreement to divest West Texas conventional assets for $119.5 million Source: BMO Transaction Database, Baker Hughes, BMO Commodity Products Group, Bloomberg, EIA, PLS Note: Current quarter’s data is through the week covered by this issue. 1. EIA U.S. natural gas gross withdrawals and production reported monthly as of November 2017. 2. S&P E&P = S&P Oil & Gas E&P Select Industry, SPX = S&P 500 Index. Key Industry Indicators Quarterly Deal Activity Equity Markets Commodities $2.2 $8.1 $10.2 $10.0 $4.7 $17.2 $21.0 $20.5 $24.0 $19.4 $9.6 $9.4 $6.3 -- 50 100 150 200 250 300 -- $5 $10 $15 $20 $25 $30 $35 $40 1Q15 2Q15 3Q15 4Q15 1Q16 2Q16 3Q16 4Q16 1Q17 2Q17 3Q17 4Q17 1Q18 61% 82% 76% 79% 52% 55% 56% 71% 91% 31% 75% 78% 96% Number of Transactions Transaction Value ($bn) Asset Corporate Number of Transactions % Oil Indicator Current Value Week's Change % Change Direction Prompt Oil Price ($/bbl) $61.68 $2.48 4.2% Prompt Gas Price ($/mmbtu) $2.56 ($0.02) (0.8%) Wkly Trans. Value ($mm) $1,066 ($2,264) (68%) Wkly Trans. Count 4 (5) (56%) US Rig Count 975 -- -- US Oil Prod'n (mmbbl/d) 10.3 0.0 0.2% US Gas Prod'n (bcf/d) (1) 95.8 -- -- US Oil Storage (mmbbl) 422.1 1.8 0.4% US Gas Storage (tcf) 1.9 (0.2) (9.3%) Week in Review Covering the Week of February 10 to February 16, 2018
Transcript of Prompt Oil Price ($/bbl) $61.68 $2.48 4.2% Prompt Gas ... Page Document Library/ADLibrary... ·...
1
February 19, 2018
Oil ended last week up. At first glance, the inventory numbers did not seem incredibly bullish however
WTI managed to trade up last week. The decline in Cushing inventories was 1.84 mmbbls. The U.S. oil rig
count increased by seven rigs, even with a four rig decline in the Permian. The near term contract closed
up $2.48, or 4.2%, at $61.68
Natural gas stayed relatively flat last week. The basis markets were the more interesting story. A Permian
to Mid-Con 5-year transport deal was apparently signed causing an aggressive rally in the Perm and
Waha. The near-term contract closed down $0.02, or 0.8%, at $2.56
Debt
Markets
S&P E&P(2) outperformed last week 4.7% vs. SPX(2) 4.3%
US equities were higher this week, with the S&P 500 gaining 4.3% for its best week since January 2013.
While the index remains down for the month, it is once again positive YTD and has gained ~6% since the
February 9th low. Treasuries were mostly weaker with the curve flattening, and much of the yield rise
coming on Wednesday following hotter-than-expected January CPI data. The dollar was down on the
major crosses. Gold finished the week up 3.1%. The S&P 500 consensus 2018 EPS estimate is $156.8
for an implied P/E multiple of 16.8x. The 5-year historical average is 16.1x
One issuer priced one issue to raise $450 million last week
Year-to-date volume stands at $49.2 billion, compared to $51.3 billion in year-to-date 2017
Retail cash outflows from US high yield mutual funds totaled $6.3 billion last week, compared to the prior
week’s outflows of $2.7 billion. This brings year-to-date outflows for 2018 to $12.1 billion, compared to
$900 million of inflows in year-to-date 2017
The sole deal to price in the High Yield market last week was an E&P issuer:
Jones Energy (CFR: Caa2/CCC (Fitch); Issue: B2/B (Fitch)) priced $450 million of 9.25% Senior
Secured 1L Notes at 97.526 to yield 9.875%. The 5NC2 Notes priced in line with talk. Proceeds will
be used to repay borrowings under its revolver and for general corporate purposes
Noble Energy announced that it executed an agreement to
sell its deepwater Gulf of Mexico assets to Fieldwood Energy
LLC for a total value of $710 million plus a contingent
payment of up to $100 million; Fieldwood Energy
concurrently filed a prepackaged Chapter 11 bankruptcy
WildHorse Resource Development Corporation announced
that it executed a definitive agreement to divest its North
Louisiana assets to Tanos Exploration II LLC for $217 million
WildHorse concurrently announced the acquisition of 17,453
net acres in Lee County, TX from an undisclosed seller for
$19.3 million
LINN Energy, Inc. announced that it signed a definitive
agreement to divest West Texas conventional assets for
$119.5 million
Source: BMO Transaction Database, Baker Hughes, BMO Commodity Products Group, Bloomberg, EIA, PLS
Note: Current quarter’s data is through the week covered by this issue.
1. EIA U.S. natural gas gross withdrawals and production reported monthly as of November 2017.
2. S&P E&P = S&P Oil & Gas E&P Select Industry, SPX = S&P 500 Index.
Key Industry Indicators
Quarterly Deal Activity
Equity
Markets
Commodities
$2.2
$8.1
$10.2
$10.0
$4.7
$17.2
$21.0 $20.5 $24.0
$19.4
$9.6 $9.4 $6.3
--
50
100
150
200
250
300
--
$5
$10
$15
$20
$25
$30
$35
$40
1Q15 2Q15 3Q15 4Q15 1Q16 2Q16 3Q16 4Q16 1Q17 2Q17 3Q17 4Q17 1Q18
61% 82% 76% 79% 52% 55% 56% 71% 91% 31% 75% 78% 96%
Nu
mb
er
of
Tra
ns
ac
tio
ns
Tra
ns
ac
tio
n V
alu
e (
$b
n)
Asset Corporate Number of Transactions
% Oil
IndicatorCurrent
Value
Week's
Change
%
Change Direction
Prompt Oil Price ($/bbl) $61.68 $2.48 4.2%
Prompt Gas Price ($/mmbtu) $2.56 ($0.02) (0.8%)
Wkly Trans. Value ($mm) $1,066 ($2,264) (68%)
Wkly Trans. Count 4 (5) (56%)
US Rig Count 975 -- --
US Oil Prod'n (mmbbl/d) 10.3 0.0 0.2%
US Gas Prod'n (bcf/d)(1) 95.8 -- --
US Oil Storage (mmbbl) 422.1 1.8 0.4%
US Gas Storage (tcf) 1.9 (0.2) (9.3%)
Week in Review
In Commodities, ECM and DCM, let’s go to journalism standards, even
though that’s not how we get the text from those groups. Main change is
that any number below 10 is spelled out (one instead of 1). This does not
apply to statistical analyses, percentages, or money, of course.
Let’s follow these guidelines when sorting articles:
• First priority: Domestic A&D, ranked by size
• Next: Domestic M&A
• Then: US companies doing international deals (like
Noble’s Tamar)
• Then: Others (Cabot’s Lackawanna)
• Then: Prices, rig count, completions, etc.
To paste the arrows with colors,
• FactSet
• Settings
• Presentation Linking and Formatting
• Import
• Colors
• Change Color font…
For the primary Commodities bullet points on oil and gas
prices, please start with “The near-term contract opened the
week at $___” and end that same bullet point with “The
near-term contract closed the week at $____, down(up)
$___, or ___%.” You don’t have to use exactly those words
as long as the opening and closing prices are included . For
example, you could write, “Opening the week at $45.21, the
near-term oil contract declined steadily based on …” – you
know, think like a journalist, be creative.
Covering the Week of February 10 to February 16, 2018

2
February 19, 2018
Ann'd
Date Buyer Seller Area Asset Description Value(1)
Proved
Multiple
Prod.
Multiple Net Acres
($mm) ($/boe) ($/boe/d) ($/acre)
15-Feb-18 Fieldwood Energy LLC Noble Energy Gulf of Mexico Deepwater GOM assets $710 $30.87 $35,500 $2,996
14-Feb-18 Scout Energy Partners Linn Energy LLC Permian Conventional Permian assets $120 $8.30 $18,968 $4,268
12-Feb-18 Tanos Exploration II LLC WildHorse Ark-La-Tex 90,000 net acres in North Louisiana $217 $3.16 $27,760 $2,411
06-Feb-18 Undisclosed Buyer Chesapeake Mid-Continent 238,000 net acres in Anadarko Basin $500 n.a. $21,739 $2,101
06-Feb-18 Halcon Resources Corp Shell Permian 10,524 net acres in Delaware Basin $200 n.a. $181,818 $19,004
06-Feb-18 Halcon Resources Corp Undisclosed Seller Permian 4,413 net acres in Delaware Basin $104 n.a. $462,222 $23,567
06-Feb-18 Viper Energy Partners LP Undisclosed Seller Permian 219 net royalty acres in Permian Basin $26 n.a. n.a. nmf
05-Feb-18 Enduring Resources IV LLC WPX Energy Inc Other Rockies 105,000 net acres in San Juan Basin $700 n.a. $43,750 $6,667
01-Feb-18 Viper Energy Partners LP Royal Resources Eagle Ford 681 net royalty acres in Eagle Ford $123 n.a. $136,667 nmf
01-Feb-18 ConocoPhillips Anadarko Alaska Working interests in Western North Slope $400 n.a. $35,628 $1,380
Blue = BMO provided transaction advisory services Green = BMO provided acquisition financing or related services
Purple = BMO provided both transaction advisory services and acquisition financing or related services
The 10 Most Recent Asset Transactions Over $20 Million
A&D Valuation Trends(3)
Source: BMO Transaction Database, Baker Hughes, BMO Commodity Products Group, Bloomberg, PLS
1. Represents total enterprise value.
2. Calculated as percentage of total LTM transaction count.
3. 100 transactions from June 2013 to 2017YTD with transaction value >$20mm. Adjusted for changes in price outlooks. Recalculated boe reserves are on a 15:1
(gas:oil) basis. Acreage transactions excluded by using deals with PDP of >= 40% of total proved.
Permian25%
Rockies (ex. Bakken)
17%
Bakken7%
Appalachia13%
Mid-Con10%
Eagle Ford7%
Ark-La-Tex4%
Gulf of Mexico1%
Other16%
LTM By Region
Oil62%
Gas38%
LTM By Commodity
Public Company
46%
PE / PE-Backed
20%
Private12%
MLP1%
Other21%
LTM By Buyer Type
R / P
Sales Value /
Proved Reserves
(15:1)
(ratio) ($ / boe) ($ / mcfe)
8x $20.94 $1.40
10x $18.14 $1.21
15x $12.67 $0.84
20x $8.85 $0.59
y = 37.188e-0.072x
R² = 0.3576
--
$10.00
$20.00
$30.00
$40.00
$50.00
$60.00
-- 5.0x 10.0x 15.0x 20.0x 25.0x 30.0x
Sa
les
Pri
ce /
Pro
ve
d
Re
serv
es (
$/b
oe
@ 1
5:1
)
R / P
Asset descriptions are all hard-coded and need to be
adjusted if new deals are added
(2) (2) (2)

3
February 19, 2018
Select Significant Deals on the Market
Disclaimer: The foregoing links are for convenience only and relate to materials that were not prepared or reviewed by BMO Capital Markets. BMO Capital Markets takes
no responsibility for and makes no representations with respect to the contents thereof. These materials may be inconsistent with the views of BMO Capital Markets.
Source of Select Significant Deals on the Market: BMO Transaction Database
Industry Headlines
Noble Energy Selling its Gulf of Mexico
Business to Fieldwood
Fieldwood Energy Files Prepackaged
Chapter 11 Cases and Announces Gulf of
Mexico Acquisition
WildHorse Resource Development
Corporation Announces Divestment of North
Louisiana Assets and Acquisition of Lee
County Properties
LINN Energy Announces Sale of
Conventional West Texas Properties for
$119.5 Million
Bakken
4 Deals Appalachia
4 Deals
Mid-Con
16 Deals
Eagle Ford
12 Deals
Permian
15 Deals
Other
10 Deals
Ark-La-Tex
5 Deals
Rockies
10 Deals
2/16/2018
Appalachia 4
Ark-La-Tex 5
Bakken 4
Eagle Ford 12
Mid-Con 16
Other 10
Permian 15
Rockies 10
76
BMO Deals (Status)
Texas American Eagle Ford (In Market) – See Page 5
Elk River Midland Basin (Post Bid)
Comstock Eagle Ford (Post Bid)
EOG Green River (Post Bid)
(Click headline to link to the full article)
A&D Headlines
Saudi Arabia to Restrain Oil Exports in
March, Confident Cuts Will Stabilize Market
Russia is Taking Over Syria’s Oil and Gas
Mexican Officials Hope Third Time’s a Charm
for Unconventionals
The Oil and Gas Situation: Volatility Returns,
as the Market Overreacts
U.S. Spending Bill Expands Carbon Tax
Credit, Boosting Oil Producers
Is the Era of Austerity Over? Bankers,
Investors Jump Back Into Oil
Exxon Sues the Suers in Fierce Climate-
Change Case

4
February 19, 2018
Purchase Price (US$ mm)
Cash Proceeds $480
Liabilities Assumed $230
Total Consideration(1) $710
Metrics
Daily Production (boe/d) 20,000
Proved Reserves (mmboe) 23.0
Multiples
TEV / Production ($/boe/d) $35,500
TEV / Proved Reserves ($/boe) $30.87
On February 15, 2018, Noble Energy executed an
agreement to sell its deepwater Gulf of Mexico
assets to Fieldwood Energy for a total value of
$710 million
Cash proceeds of $480 million
Fieldwood will assume all abandonment
obligations of ~$230 million
Additional contingent payment of up to $100
million payable from closing through 2022,
determined by Louisiana Light Sweet oil prices
Expected closing during Q2 2018
Fieldwood Energy concurrently filed a prepackaged
Chapter 11 bankruptcy
TRANSACTION SUMMARY
ACQUISITION METRICS
Source: Company press release, Company presentation, PLS, 1Derrick
1. Value (and multiples) are not grossed up for midstream obligations.
ACQUIRED ASSETS
ASSET SUMMARY
Acquired Acreage
237,000 net acres across 67 leases in the
deepwater GOM
6 producing fields with liquids weighted and stable
production profile
5 of the 6 subsea fields operated by Noble, 1 by
Anadarko
Proved reserves of 23 mmboe as of 31-Dec-17
2018E net production of ~20,000 boe/d
Production weighted average WI of 38% and
NRI of 34%
Interesting Deal of the Week:
Noble Energy Divests Gulf of Mexico Assets to Fieldwood Energy for $710 million
OBSERVATIONS
GOM has been a part of Noble’s portfolio for ~50
years
Since November 2017, Noble has divested more
than $2.5 billion worth of assets with GOM being
last major step in portfolio transformation
Noble will focus on assets with growing cash flows
and margins, primarily U.S. onshore and the
Eastern Mediterranean
Noble Energy Deepwater Gulf of
Mexico (Oct 2017, JPM) Page 2
https://globenewswire.com/news-release/2018/02/15/1348833/0/en/Noble-Energy-
Announces-750-Million-Share-Repurchase-Program.html
https://globenewswire.com/news-release/2018/02/15/1348833/0/en/Noble-Energy-
Announces-750-Million-Share-Repurchase-Program.html
https://www.offshoreenergytoday.com/fieldwood-buys-nobles-gulf-of-mexico-assets-for-710-million/
https://globenewswire.com/news-release/2018/02/15/1348833/0/en/Noble-Energy-
Announces-750-Million-Share-Repurchase-Program.html
https://www.epmag.com/noble-gulf-mexico-sale-fieldwood-1684201#p=full

5
February 19, 2018
Highly economic, large, contiguous, and derisked acreage position in
the Eagle Ford black oil window
24,675 gross / 23,164 net largely undeveloped acres located in
southwest Atascosa and southeast Frio counties, Texas
100% operated with high average working interest of ~94%
Executable optimized development plan on 400' well spacing
supports ~230 gross drilling locations in the Lower Eagle Ford
Development plan employs long laterals (~9,400’ average length),
higher intensity / modern completions, targeted lateral placement,
and drilling order to minimize parent well effects
Austin Chalk analogous to development in the Sugarkane Field
Rapidly growing oil-weighted net production estimated to be ~5,000
boe/d by April 2018
Appraisal strategy implemented through data gathering, targeting, and
completion modernization and optimization
Achieving robust performance with recent slickwater completion
wells outperforming 2013 / 2014 Bowman wells’ EUR/ft by over
66% with continuous improvement on subsequent wells
Excellent Eagle Ford reservoir quality with porosity up to 12% and rich
TOC values ranging from 3% to 6%
Ideal lease inventory (~20 leases) with easily managed continuous
development obligations
Favorable marketing contracts and no minimum volume commitments
Currently on the Market from BMO: Texas American Resources Eagle Ford Divestiture
VDR available late February
Bids due mid-April
Contact Chelsea Neville ([email protected] or 713-546-
9703) to request a Confidentiality Agreement, access to the VDR,
and/or a data room presentation
ASSET OVERVIEW
PACKAGE HIGHLIGHTS
Source: Texas American Resources 2018 Eagle Ford Divestiture announcement. https://datarooms.us.bmo.com/_layouts/15/Petris/LoginPageBMOUS.aspx?ClientId=79
PROCESS OVERVIEW
Growing
Production and
Cash Flow with
Advantaged
Position for Full
Development
April 2018E net production of ~5,000 boe/d (~86% oil) from 22 operated wells; rapid growth from January 2017 production of
~50 boe/d
High degree of control as asset is 100% operated with easily managed continuous development obligations
NTM cash flow projected to be approximately $90 million at flat $60/bbl WTI oil and $3.00/mcf Henry Hub gas pricing
Very favorable marketing contracts relative to other Eagle Ford operators; no minimum volume commitments
Extensive infrastructure with proximity to Gulf Coast refineries and international export markets
Premium oil price realizations with LLS pricing – positive differentials of ~$3.00 compared to WTI over the last three months
Positioned for full field development with company-owned gathering system and access to electricity and SWD systems
Largely
Undeveloped
Contiguous Eagle
Ford Position
Attractive entry vehicle or bolt-on acquisition with exposure to highly economic parts of the Eagle Ford
Contiguous 23,164 net acre position in the prolific black oil window located in southwest Atascosa and southeast Frio counties,
Texas ideal for future development
100% operational control with average working interest of ~94%
Optimal maturity and shallow depth to Eagle Ford target of 7,800’ to 8,700’ allows for lateral lengths in excess of 10,000’
Extensive and
Highly Economic
Drilling Inventory
through Modern
Completions
~230 gross operated Lower Eagle Ford drilling locations at 400’ lateral spacing providing ample running room for years of
development
Entire position de-risked by existing wells and extensive data gathering and seismic surveys
~100% of locations have IRRs over 20% at flat $55/bbl WTI oil and $3.00/mcf Henry Hub gas pricing
Significant performance uplift over historical results in the area due to modern completions
Lateral targeting, higher proppant/fluid loading, and tighter cluster spacing are resulting in 66% EUR/ft uplift over legacy
wells with continual improvement
High Quality
Sub-Surface
Attributes
Compact and well-contained 80’ to 100’ thick Lower Eagle Ford quality source rock with oil in place sufficient to fully support
significant uplifts in EUR and recovery per foot
Proven development plan supported by 70 square miles of 3-D seismic and 385’ of proprietary whole core through the entire
prospective Eagle Ford and Austin Chalk reservoir intervals
Favorable structural, fracture setting, high matrix porosity, and oil saturation of the Austin Chalk across TAR’s position supports
a viable secondary target with ~115 locations at 800’ spacing
Austin Chalk in Frio County is prolific in numerous offsets
Oil saturated proprietary core in Atascosa County
Austin Chalk well performance in Sugarkane Field a direct analog

6
February 19, 2018
--
$1
$2
$3
$4
Jan-17 Jul-17 Jan-18 Jul-18 Jan-19
($/m
mb
tu)
$20
$30
$40
$50
$60
$70
$80
Jan-17 Jul-17 Jan-18 Jul-18 Jan-19
($/b
bl)
NGL PRICING(2)
HENRY HUB NATURAL GAS (HISTORICAL / FORECAST)
Commodity Prices
Source: BMO Commodity Products Group, Bloomberg, FactSet
1. Future prices are calendar year average unless stated otherwise.
2. Assumes typical Gulf Coast barrel composition.
WTI OIL (HISTORICAL / FORECAST)
NYMEX WTI Futures as of 16-Feb-18 Close ($/bbl) NYMEX Gas Futures as of 16-Feb-18 Close ($/mmbtu)
Period(1) Current Last Wk. 6 Mo. Ago 1 Yr. Ago
12 Mo. Strip $59.40 $57.21 $47.47 $54.69
2018 $59.85 $57.61 $47.77 $54.93
2019 $55.55 $53.88 $48.12 $54.50
2020 $52.84 $51.54 $48.73 $54.32
2021 $51.27 $50.17 $49.62 $54.46
2022 $50.62 $49.55 $50.73 $54.96
NYMEX Gas Futures as of 16-Feb-18 Close ($/mmbtu)
Period(1) Current Last Wk. 6 Mo. Ago 1 Yr. Ago
12 Mo. Strip $2.75 $2.75 $3.00 $3.29
2018 $2.70 $2.70 $2.98 $3.03
2019 $2.76 $2.77 $2.83 $2.85
2020 $2.77 $2.78 $2.78 $2.84
2021 $2.81 $2.82 $2.78 $2.84
2022 $2.95 $2.96 $2.95 $3.00
Historical Prices as of 16-Feb-18 Close ($/gal)
NGLs Current Last Wk. 6 Mo. Ago 1 Yr. Ago
Ethane $0.24 $0.25 $0.27 $0.27
Propane $0.81 $0.82 $0.75 $0.81
Butane $0.76 $0.70 $0.83 $1.16
Iso-butane $0.94 $0.91 $0.94 $1.03
Pentane+ $1.34 $1.29 $1.08 $1.17
25%
35%
45%
55%
65%
Jan-15 May-15 Sep-15 Jan-16 May-16 Sep-16 Jan-17 May-17 Sep-17 Jan-18
% o
f W
TI
NGL as % of WTI
Links:
http://www.nasdaq.com/markets/crude-oil.aspx
http://www.bloomberg.com/quote/CL1:COM
http://www.nasdaq.com/markets/natural-gas.aspx
http://www.bloomberg.com/quote/NG1:COM
Link to Detailed
Futures Data
Link to Detailed
Historical Graph
Link to Detailed
Futures Data
Link to Detailed
Historical Graph

7
February 19, 2018
$2.56
AECO
Northern
California
Sumas
Southern
California
El Paso - SJ
Waha
HSC
Henry Hub
Panhandle
CIG Chicago
Dominion
Transco
NATURAL GAS PRICING & DIFFERENTIALS TO HENRY HUB ($ / MMBTU) – AS OF 16-FEB-18
Commodity Prices (cont’d)
OIL PRICING & DIFFERENTIALS TO CUSHING WTI ($ / BBL) – AS OF 16-FEB-18
Clearbrook
Midland
Cushing
St. James
(LLS)
East Coast
U.S. (Brent)
Midland Sweet-
Sour Spread
EMS Legend
Price
Diff.
Legend
Price
Diff.
Source: BMO Commodity Products Group, Bloomberg
Note: Prices and differentials are for prompt month futures except for Clearbrook which is based on spot prices.
$61.68
$63.67
$1.99
$61.26
($0.42)
$55.55
($6.13)$59.68
($2.00)
$64.84
$3.16
($1.53)
$2.76
$0.20
$1.80
($0.76)
$2.32
($0.24)
MAPS IN
MASTER VIEW
$1.21
($1.35)
$2.15
($0.41)
$2.47
($0.09)
$2.53
($0.03)
$1.93
($0.63)
$2.03
($0.53)$2.08
($0.48)
$2.03
($0.53)
$2.31
($0.25)

8
February 19, 2018
Ann'd
Date Buyer Seller Asset Description Value(1)
Proved
Multiple
Prod.
Multiple Net Acres
($mm) ($/boe) ($/boe/d) ($/acre)(2)
14-Feb-18 Scout Energy Partners Linn Energy LLC Conventional Permian assets $120 $8.30 $18,968 $4,268
06-Feb-18 Halcon Resources Corp Shell 10,524 net acres in Delaware Basin $200 n.a. $181,818 $19,004
06-Feb-18 Halcon Resources Corp Undisclosed Seller 4,413 net acres in Delaware Basin $104 n.a. $462,222 $23,567
06-Feb-18 Viper Energy Partners LP Undisclosed Seller 219 net royalty acres in Permian Basin $26 n.a. n.a. nmf
31-Jan-18 Lilis Energy Inc OneEnergy Partners LLC 2,798 net acres in Delaware Basin $70 n.a. $164,706 $25,018
Mean $104 $8.30 $206,929 $17,964
Median $104 $8.30 $173,262 $21,285
Blue = BMO provided transaction advisory services Green = BMO provided acquisition financing or related services
Purple = BMO provided both transaction advisory services and acquisition financing or related services
--
$10,000
$20,000
$30,000
$40,000
$50,000
1Q
14
2Q
14
3Q
14
4Q
14
1Q
15
2Q
15
3Q
15
4Q
15
1Q
16
2Q
16
3Q
16
4Q
16
1Q
17
2Q
17
3Q
17
4Q
17
1Q
18
3 6 8 4 1 3 8 7 5 5 11 13 15 7 2 2 4
$ /
acre
# Deals
$22,338
GROSS PRODUCTION
TRANSACTION ACTIVITY (EXCLUDES CORPORATE DEALS)
TRANSACTION PRODUCTION MULTIPLES(3) TRANSACTION ADJUSTED NET ACRE MULTIPLES(3,4)
PERMITTING ACTIVITY BY MONTH
DIFFERENTIALS
Permian Snapshot
RIG COUNT
Source: BMO Transaction Database, Baker Hughes, BMO Commodity Products Group, Bloomberg, Drilling Info, PLS
Note: Current quarter’s data is through the week covered by this issue.
1. Represents total enterprise value. Excludes transactions with deal value <$20 million. 2. $/acre multiple not adjusted for value associated with production.
3. Red line denotes average since 1-Jan-15. Calculated as the weighted average of each quarter’s transactions.
4. Production valued at $45,000/boepd in 2014, $30,000/boepd in 2015, $35,000/boepd in 2016 & 2017, and $40,000/boepd in 2018.
0%
10%
20%
30%
40%
50%
--
100
200
300
400
Jan-14 Jan-15 Jan-16 Jan-17 Jan-18
H V+D % of Total Rigs
-$1.20
-$0.60
$0.00
$0.60
Jan-15 Jul-15 Jan-16 Jul-16 Jan-17 Jul-17 Jan-18
-$4.00
-$2.00
$0.00
$2.00
$ /
mm
btu
$ /
bb
l
Midland Waha
--
$100,000
$200,000
$300,000
$400,000
1Q
14
2Q
14
3Q
14
4Q
14
1Q
15
2Q
15
3Q
15
4Q
15
1Q
16
2Q
16
3Q
16
4Q
16
1Q
17
2Q
17
3Q
17
4Q
17
1Q
18
3 7 9 6 1 3 8 8 5 9 12 14 15 8 0 1 5
$ /
bo
e/d
# Deals
$168,768
Item Value Wkly Change Last Week Item Value Wkly Change Last Week
Rig Count 433 (4) 437 Oil Differential ($0.20) $0.30 ($0.50)
Permitting Activity 171 (137) 308 Gas Differential ($0.61) $0.17 ($0.78)
835
1087
702
930
1112
8871029
909 875
1126
818
1110
605
Feb-17 Apr-17 Jun-17 Aug-17 Oct-17 Dec-17 Feb-18
V+D H
5,000
5,500
6,000
6,500
7,000
7,500
8,000
8,500
9,000
9,500
1,300
1,500
1,700
1,900
2,100
2,300
2,500
2,700
2,900
Jan-14 Jul-14 Jan-15 Jul-15 Jan-16 Jul-16 Jan-17 Jul-17
mm
cf/
d
mb
bl/
d
Oil Gas
2,769
9,095
Asset descriptions are all hard-coded and need to be
adjusted if new deals are added

9
February 19, 2018
-$0.30
-$0.15
$0.00
$0.15
$0.30
$0.45
$0.60
Jan-15 Jul-15 Jan-16 Jul-16 Jan-17 Jul-17 Jan-18
-$4.00
-$2.00
$0.00
$2.00
$4.00
$6.00
$8.00
$ /
mm
btu
$ /
bb
l
LLS HSC
Item Value Wkly Change Last Week Item Value Wkly Change Last Week
Rig Count 70 1 69 Oil Differential $2.15 ($0.10) $2.25
Permitting Activity 119 (7) 126 Gas Differential ($0.03) $0.02 ($0.05)
6,000
7,000
8,000
9,000
10,000
11,000
1,200
1,400
1,600
1,800
2,000
2,200
Jan-14 Jul-14 Jan-15 Jul-15 Jan-16 Jul-16 Jan-17 Jul-17
mm
cf/
d
mb
bl/
d
Oil Gas
1,384
8,280
402476
389 356
496
353 348287
371 372320
416
285
Feb-17 Apr-17 Jun-17 Aug-17 Oct-17 Dec-17 Feb-18
V+D H
--$10,000$20,000$30,000$40,000$50,000$60,000
1Q
14
2Q
14
3Q
14
4Q
14
1Q
15
2Q
15
3Q
15
4Q
15
1Q
16
2Q
16
3Q
16
4Q
16
1Q
17
2Q
17
3Q
17
4Q
17
1Q
18
3 4 3 2 0 1 2 1 2 4 1 3 1 3 2 2 1
$ /
acre
# Deals
$14,979
--
$50,000
$100,000
$150,000
1Q
14
2Q
14
3Q
14
4Q
14
1Q
15
2Q
15
3Q
15
4Q
15
1Q
16
2Q
16
3Q
16
4Q
16
1Q
17
2Q
17
3Q
17
4Q
17
1Q
18
3 6 3 3 1 1 3 1 2 4 2 4 4 3 2 2 2
$ /
bo
e/d
# Deals
$60,424
Ann'd
Date Buyer Seller Asset Description Value(1)
Proved
Multiple
Prod.
Multiple Net Acres
($mm) ($/boe) ($/boe/d) ($/acre)(2)
01-Feb-18 Viper Energy Partners LP Royal Resources 681 net royalty acres in Eagle Ford $123 n.a. $136,667 nmf
02-Jan-18 Penn Virginia Hunt Oil 9,700 net acres in South TX Eagle Ford $86 n.a. $45,989 $8,866
20-Dec-17 Venado Oil & Gas Cabot Oil & Gas 74,500 net acres in South TX Eagle Ford $765 $13.38 $48,863 $10,268
12-Dec-17 EP Energy Corp Carrizo Oil & Gas 24,500 net acres in South TX Eagle Ford $245 n.a. $72,059 $10,000
17-Aug-17 Vitruvian Exploration IV Sanchez Energy Corp 68,000 net acres in Eagle Ford $105 n.a. n.a. $1,544
Mean $265 $13.38 $75,894 $7,670
Median $123 $13.38 $60,461 $9,433
Blue = BMO provided transaction advisory services Green = BMO provided acquisition financing or related services
Purple = BMO provided both transaction advisory services and acquisition financing or related services
0%
5%
10%
15%
20%
--
50
100
150
200
250
Jan-14 Jan-15 Jan-16 Jan-17 Jan-18
H V+D % of Total Rigs
Eagle Ford Snapshot
GROSS PRODUCTION
TRANSACTION ACTIVITY (EXCLUDES CORPORATE DEALS)
PERMITTING ACTIVITY BY MONTH
DIFFERENTIALS RIG COUNT
Source: BMO Transaction Database, Baker Hughes, BMO Commodity Products Group, Bloomberg, Drilling Info, PLS
Note: Current quarter’s data is through the week covered by this issue.
1. Represents total enterprise value. Excludes transactions with deal value <$20 million. 2. $/acre multiple not adjusted for value associated with production.
3. Red line denotes average since 1-Jan-15. Calculated as the weighted average of each quarter’s transactions.
4. Production valued at $45,000/boepd in 2014, $30,000/boepd in 2015, $35,000/boepd in 2016 & 2017, and $40,000/boepd in 2018.
Asset descriptions are all hard-coded and need to be
adjusted if new deals are added
TRANSACTION PRODUCTION MULTIPLES(3) TRANSACTION ADJUSTED NET ACRE MULTIPLES(3,4)
10
February 19, 2018
Ann'd
Date Buyer Seller Asset Description Value(1)
Proved
Multiple
Prod.
Multiple Net Acres
($mm) ($/mcfe) ($/mcfe/d) ($/acre)(2)
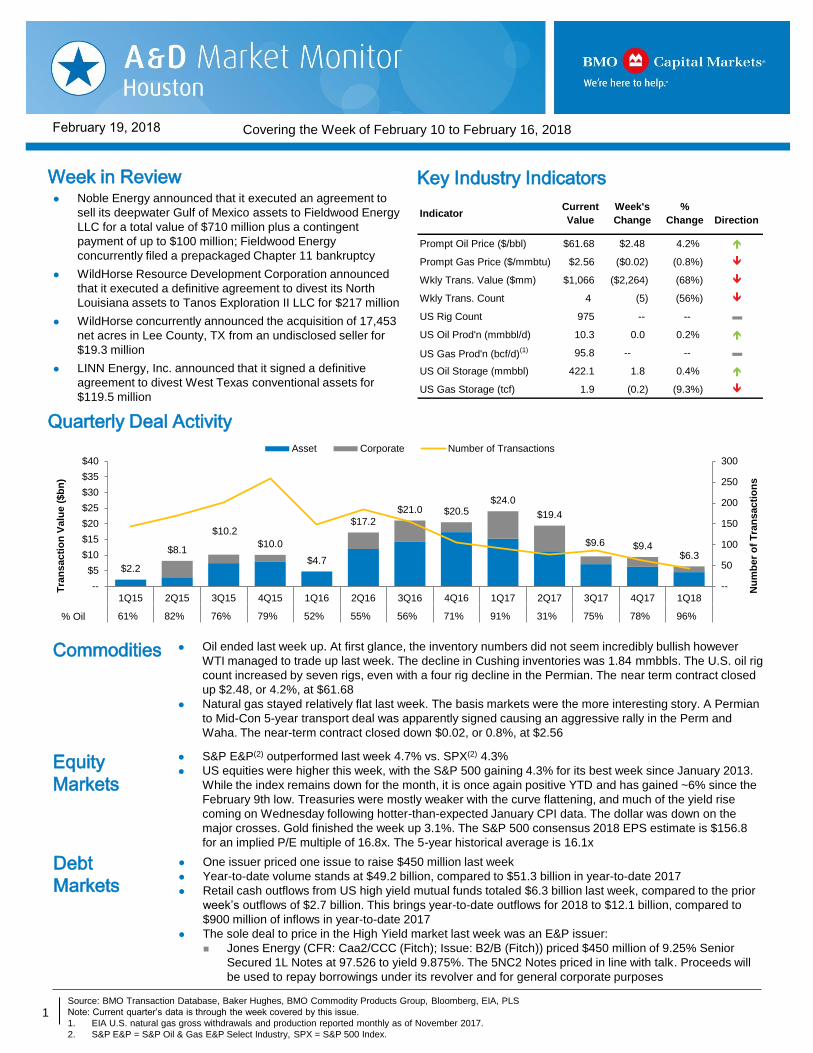
12-Feb-18 Tanos Exploration II LLC WildHorse 90,000 net acres in North Louisiana $217 $0.53 $4,627 $2,411
06-Sep-17 Tellurian Inc Undisclosed Sellers 9,200 net acres in Haynesville $85 n.a. $21,264 $9,250
01-Aug-17 Rockcliff Energy II LLC Samson Resources II LLC 210,000 net acres in East TX & North LA $525 n.a. $5,833 $2,500
12-Jun-17 GEP Haynesville, LLC Sabine Oil & Gas 5,256 net acres in North LA Haynesville $45 n.a. $16,188 $8,562
08-Jun-17 Black Stone Minerals Undisclosed Haynesville / Bossier acreage in East TX $24 n.a. n.a. n.a.
Mean $179 $0.53 $11,978 $5,681
Median $85 $0.53 $11,011 $5,531
Blue = BMO provided transaction advisory services Green = BMO provided acquisition financing or related services
Purple = BMO provided both transaction advisory services and acquisition financing or related services
--
$2.00
$4.00
$6.00
$8.00
$10.00
Jan-15 Jul-15 Jan-16 Jul-16 Jan-17 Jul-17 Jan-18
--
$2.00
$4.00
$6.00
$8.00
$10.00
$ /
mm
btu
$ /
bb
l
LLS Henry Hub
Item Value Wkly Change Last Week Item Value Wkly Change Last Week
Rig Count 50 -- 50 Oil Differential $2.15 ($0.10) $2.25
Permitting Activity 21 (14) 35 Gas Differential -- -- --
5,000
6,000
7,000
8,000
9,000
80
90
100
110
120
130
140
150
Jan-14 Jul-14 Jan-15 Jul-15 Jan-16 Jul-16 Jan-17 Jul-17
mm
cf/
d
mb
bl/
d
Oil Gas
98
8,603
127
187148
124162
133 160
101
198
143
89125
79
Feb-17 Apr-17 Jun-17 Aug-17 Oct-17 Dec-17 Feb-18
V+D H
--
$5,000
$10,000
$15,000
$20,000
1Q
14
2Q
14
3Q
14
4Q
14
1Q
15
2Q
15
3Q
15
4Q
15
1Q
16
2Q
16
3Q
16
4Q
16
1Q
17
2Q
17
3Q
17
4Q
17
1Q
18
0 1 2 1 0 0 3 1 1 2 1 2 0 1 2 0 1
$ /
acre
# Deals# Deals
$5,387
--
$5,000
$10,000
$15,000
$20,000
1Q
14
2Q
14
3Q
14
4Q
14
1Q
15
2Q
15
3Q
15
4Q
15
1Q
16
2Q
16
3Q
16
4Q
16
1Q
17
2Q
17
3Q
17
4Q
17
1Q
18
1 3 2 3 0 0 4 1 1 3 1 2 0 1 2 0 1
$ /
mc
fe/d
# Deals
$7,072
0%
2%
4%
6%
8%
10%
--
10
20
30
40
50
60
Jan-14 Jan-15 Jan-16 Jan-17 Jan-18
H V+D % of Total Rigs
Ark-La-Tex Snapshot
GROSS PRODUCTION
TRANSACTION ACTIVITY (EXCLUDES CORPORATE DEALS)
PERMITTING ACTIVITY BY MONTH
DIFFERENTIALS RIG COUNT
Source: BMO Transaction Database, Baker Hughes, BMO Commodity Products Group, Bloomberg, Drilling Info, PLS
Note: Current quarter’s data is through the week covered by this issue.
1. Represents total enterprise value. Excludes transactions with deal value <$20 million. 2. $/acre multiple not adjusted for value associated with production.
3. Red line denotes average since 1-Jan-15. Calculated as the weighted average of each quarter’s transactions.
4. Production valued at $3,000/mcfepd in 2014, and $2,000/mcfepd in 2015, 2016, 2017, and 2018.
Asset descriptions are all hard-coded and need to be
adjusted if new deals are added
TRANSACTION PRODUCTION MULTIPLES(3) TRANSACTION ADJUSTED NET ACRE MULTIPLES(3,4)

11
February 19, 2018
-$3.00
-$2.00
-$1.00
$0.00
$1.00
$2.00
$3.00
Jan-15 Jul-15 Jan-16 Jul-16 Jan-17 Jul-17 Jan-18
-$15.00
-$10.00
-$5.00
$0.00
$5.00
$10.00
$15.00
$ /
mm
btu
$ /
bb
l
Brent Dominion
Item Value Wkly Change Last Week Item Value Wkly Change Last Week
Rig Count 78 (1) 79 Oil Differential $3.16 ($0.43) $3.59
Permitting Activity 27 (68) 95 Gas Differential ($0.58) ($0.23) ($0.34)
12,000
14,000
16,000
18,000
20,000
22,000
24,000
50
75
100
125
150
Jan-14 Jul-14 Jan-15 Jul-15 Jan-16 Jul-16 Jan-17 Jul-17
mm
cf/
d
mb
bl/
d
Oil Gas
63
19,979
393 415 390341
429
293
465
590
453395
356409
148
Feb-17 Apr-17 Jun-17 Aug-17 Oct-17 Dec-17 Feb-18
V+D H
--
$5,000
$10,000
$15,000
$20,000
$25,000
1Q
14
2Q
14
3Q
14
4Q
14
1Q
15
2Q
15
3Q
15
4Q
15
1Q
16
2Q
16
3Q
16
4Q
16
1Q
17
2Q
17
3Q
17
4Q
17
1Q
18
1 2 4 3 0 1 0 0 1 2 2 4 2 4 0 2 0
$ /
ac
re
# Deals
$5,193
--
$10,000
$20,000
$30,000
$40,000
1Q
14
2Q
14
3Q
14
4Q
14
1Q
15
2Q
15
3Q
15
4Q
15
1Q
16
2Q
16
3Q
16
4Q
16
1Q
17
2Q
17
3Q
17
4Q
17
1Q
18
1 2 4 3 0 1 0 0 1 2 2 5 2 5 1 4 2
$ /
mcfe
/d
# Deals
$5,842
Ann'd
Date Buyer Seller Asset Description Value(1)
Proved
Multiple
Prod.
Multiple Net Acres
($mm) ($/mcfe) ($/mcfe/d) ($/acre)(2)
31-Jan-18 Diversified Gas & Oil Lake Fork Resources Entire share capital of Alliance Petroleum $95 $0.32 $1,799 n.a.
31-Jan-18 Diversified Gas & Oil CNX Resources Corp Appalachia Basin asset in PA and WV $85 $0.22 $1,574 n.a.
29-Jan-18 Undisclosed Buyer Blue Ridge Mountain Non-op WI in Marcellus / Utica $56 n.a. n.a. $6,667
21-Dec-17 Alta Resources LLC Ultra Petroleum 72,000 non-op net acres in Marcellus $115 n.a. $3,833 $1,597
12-Dec-17 Banpu Public Co Ltd Warren Resources Inc 5,200 net acres in PA Marcellus $105 $0.36 $1,826 $20,192
Mean $91 $0.30 $2,258 $9,485
Median $95 $0.32 $1,813 $6,667
Blue = BMO provided transaction advisory services Green = BMO provided acquisition financing or related services
Purple = BMO provided both transaction advisory services and acquisition financing or related services
0%
5%
10%
15%
20%
--
50
100
150
Jan-14 Jan-15 Jan-16 Jan-17 Jan-18
H V+D % of Total Rigs
Appalachia Snapshot
GROSS PRODUCTION
TRANSACTION ACTIVITY (EXCLUDES CORPORATE DEALS)
PERMITTING ACTIVITY BY MONTH
DIFFERENTIALS RIG COUNT
Source: BMO Transaction Database, Baker Hughes, BMO Commodity Products Group, Bloomberg, Drilling Info, PLS
Note: Current quarter’s data is through the week covered by this issue.
1. Represents total enterprise value. Excludes transactions with deal value <$20 million. 2. $/acre multiple not adjusted for value associated with production.
3. Red line denotes average since 1-Jan-15. Calculated as the weighted average of each quarter’s transactions.
4. Production valued at $3,000/mcfepd in 2014, and $2,000/mcfepd in 2015, 2016, 2017, and 2018.
Asset descriptions are all hard-coded and need to be
adjusted if new deals are added
TRANSACTION PRODUCTION MULTIPLES(3) TRANSACTION ADJUSTED NET ACRE MULTIPLES(3,4)

12
February 19, 2018
-$0.90
-$0.45
$0.00
$0.45
Jan-15 Jul-15 Jan-16 Jul-16 Jan-17 Jul-17 Jan-18
-$9.00
-$4.50
$0.00
$4.50
$ /
mm
btu
$ /
bb
l
Clearbrook CIG
Item Value Wkly Change Last Week Item Value Wkly Change Last Week
Rig Count 49 (1) 50 Oil Differential ($2.00) $0.45 ($2.45)
Permitting Activity 23 (9) 32 Gas Differential ($0.42) $0.24 ($0.66)
1,200
1,400
1,600
1,800
2,000
2,200
800
900
1,000
1,100
1,200
1,300
1,400
Jan-14 Jul-14 Jan-15 Jul-15 Jan-16 Jul-16 Jan-17 Jul-17
mm
cf/
d
mb
bl/
d
Oil Gas
1,138
2,065
47
97
62
116 113 111
145
101
150
120
73100
58
Feb-17 Apr-17 Jun-17 Aug-17 Oct-17 Dec-17 Feb-18
V+D H
--
$5,000
$10,000
$15,000
$20,000
$25,000
1Q
14
2Q
14
3Q
14
4Q
14
1Q
15
2Q
15
3Q
15
4Q
15
1Q
16
2Q
16
3Q
16
4Q
16
1Q
17
2Q
17
3Q
17
4Q
17
1Q
18
4 2 6 2 0 0 1 1 0 0 2 3 1 0 2 2 0
$ /
acre
# Deals
$5,703
--
$50,000
$100,000
$150,000
$200,000
1Q
14
2Q
14
3Q
14
4Q
14
1Q
15
2Q
15
3Q
15
4Q
15
1Q
16
2Q
16
3Q
16
4Q
16
1Q
17
2Q
17
3Q
17
4Q
17
1Q
18
4 2 6 2 0 0 1 4 0 3 3 3 1 1 3 2 1
$ /
bo
e/d
# Deals
$54,719
Ann'd
Date Buyer Seller Asset Description Value(1)
Proved
Multiple
Prod.
Multiple Net Acres
($mm) ($/boe) ($/boe/d) ($/acre)(2)
22-Jan-18 Firehawk Oil and Gas LLC Samson Oil & Gas Limited Foreman Butte Project in Williston Basin $42 $6.66 n.a. $809
18-Jan-18 Undisclosed Buyer Vanguard Natural Resources Williston Basin properties $39 n.a. $38,500 n.a.
21-Nov-17 Energy Resources 12 LP Bruin E&P Partners LLC Non-op Bakken assets $88 n.a. n.a. n.a.
20-Nov-17 Statoil Earthstone Energy Inc 1,323 non-op acres in ND $27 n.a. $35,433 $20,408
23-Oct-17 Valorem Energy LINN Energy LLC 20,000 net acres in Williston Basin $285 n.a. $35,625 $14,250
Mean $96 $6.66 $36,519 $11,822
Median $42 $6.66 $35,625 $14,250
Blue = BMO provided transaction advisory services Green = BMO provided acquisition financing or related services
Purple = BMO provided both transaction advisory services and acquisition financing or related services
0%
5%
10%
15%
20%
--
50
100
150
200
Jan-14 Jan-15 Jan-16 Jan-17 Jan-18
H V+D % of Total Rigs
Bakken Snapshot
GROSS PRODUCTION
TRANSACTION ACTIVITY (EXCLUDES CORPORATE DEALS)
PERMITTING ACTIVITY BY MONTH
DIFFERENTIALS RIG COUNT
Source: BMO Transaction Database, Baker Hughes, BMO Commodity Products Group, Bloomberg, Drilling Info, PLS
Note: Current quarter’s data is through the week covered by this issue.
1. Represents total enterprise value. Excludes transactions with deal value <$20 million. 2. $/acre multiple not adjusted for value associated with production.
3. Red line denotes average since 1-Jan-15. Calculated as the weighted average of each quarter’s transactions.
4. Production valued at $45,000/boepd in 2014, $30,000/boepd in 2015, $35,000/boepd in 2016 & 2017, and $40,000/boepd in 2018.
Asset descriptions are all hard-coded and need to be
adjusted if new deals are added
TRANSACTION PRODUCTION MULTIPLES(3) TRANSACTION ADJUSTED NET ACRE MULTIPLES(3,4)

13
February 19, 2018
Item Value Wkly Change Last Week Item Value Wkly Change Last Week
Rig Count 74 (1) 75 Oil Differential ($2.00) $0.45 ($2.45)
Permitting Activity 98 (32) 130 Gas Differential ($0.42) $0.24 ($0.66)
0%
5%
10%
15%
20%
--
20
40
60
80
100
120
Jan-14 Jan-15 Jan-16 Jan-17 Jan-18
H V+D % of Total Rigs
-$0.90
-$0.45
$0.00
$0.45
Jan-15 Jul-15 Jan-16 Jul-16 Jan-17 Jul-17 Jan-18
-$9.00
-$4.50
$0.00
$4.50
$ /
mm
btu
$ /
bb
l
Clearbrook CIG
11,000
11,500
12,000
12,500
13,000
13,500
14,000
200
300
400
500
600
700
800
Jan-14 Jul-14 Jan-15 Jul-15 Jan-16 Jul-16 Jan-17 Jul-17
mm
cf/
d
mb
bl/
d
Oil Gas
655
12,085
934 874
1436
1081855 750
1748
695570 622 652
435260
Feb-17 Apr-17 Jun-17 Aug-17 Oct-17 Dec-17 Feb-18
V+D H
--
$5,000
$10,000
$15,000
$20,000
1Q
14
2Q
14
3Q
14
4Q
14
1Q
15
2Q
15
3Q
15
4Q
15
1Q
16
2Q
16
3Q
16
4Q
16
1Q
17
2Q
17
3Q
17
4Q
17
1Q
18
3 7 2 2 0 0 3 3 0 1 0 0 1 0 1 5 3
$ /
acre
# Deals
$4,011
--
$20,000
$40,000
$60,000
$80,000
$100,000
$120,000
1Q
14
2Q
14
3Q
14
4Q
14
1Q
15
2Q
15
3Q
15
4Q
15
1Q
16
2Q
16
3Q
16
4Q
16
1Q
17
2Q
17
3Q
17
4Q
17
1Q
18
4 9 3 4 2 0 4 4 1 6 0 0 2 5 4 9 3
$ /
bo
e/d
# Deals
$39,645
Ann'd
Date Buyer Seller Asset Description Value(1)
Proved
Multiple
Prod.
Multiple Net Acres
($mm) ($/boe) ($/boe/d) ($/acre)(2)
05-Feb-18 Enduring Resources IV LLC WPX Energy Inc 105,000 net acres in San Juan Basin $700 n.a. $43,750 $6,667
16-Jan-18 Undisclosed Buyer LINN Energy 36,000 net acres in Uinta Basin $132 n.a. $91,034 $3,667
09-Jan-18 Northwoods Energy LLC SM Energy 112,200 net acres in Powder River Basin $500 nmf $227,273 $4,456
14-Dec-17 Undisclosed Buyer Samson Resources II LLC 11,300 net acres in Green River Basin $34 n.a. $22,667 $3,009
14-Dec-17 Undisclosed Buyer EP Energy Corp 23,330 net acres in Uinta Basin $180 n.a. $120,000 $7,715
Mean $309 n.a. $100,945 $5,103
Median $180 n.a. $91,034 $4,456
Blue = BMO provided transaction advisory services Green = BMO provided acquisition financing or related services
Purple = BMO provided both transaction advisory services and acquisition financing or related services
GROSS PRODUCTION
TRANSACTION ACTIVITY (EXCLUDES CORPORATE DEALS)
PERMITTING ACTIVITY BY MONTH
DIFFERENTIALS
Rockies (excl. Bakken) Snapshot
RIG COUNT
Source: BMO Transaction Database, Baker Hughes, BMO Commodity Products Group, Bloomberg, Drilling Info, PLS
Note: Current quarter’s data is through the week covered by this issue.
1. Represents total enterprise value. Excludes transactions with deal value <$20 million. 2. $/acre multiple not adjusted for value associated with production.
3. Red line denotes average since 1-Jan-15. Calculated as the weighted average of each quarter’s transactions.
4. Production valued at $45,000/boepd in 2014, $30,000/boepd in 2015, $35,000/boepd in 2016 & 2017, and $40,000/boepd in 2018.
Asset descriptions are all hard-coded and need to be
adjusted if new deals are added
TRANSACTION PRODUCTION MULTIPLES(3) TRANSACTION ADJUSTED NET ACRE MULTIPLES(3,4)

14
February 19, 2018
-$1.00
-$0.75
-$0.50
-$0.25
$0.00
$0.25
Jan-15 Jul-15 Jan-16 Jul-16 Jan-17 Jul-17 Jan-18
-$1.00
-$0.75
-$0.50
-$0.25
$0.00
$0.25
$ /
mm
btu
$ /
bb
l
Cushing Panhandle
Item Value Wkly Change Last Week Item Value Wkly Change Last Week
Rig Count 91 1 90 Oil Differential -- -- --
Permitting Activity 49 (35) 84 Gas Differential ($0.53) $0.03 ($0.56)
5,000
7,000
9,000
11,000
13,000
15,000
200
300
400
500
600
700
800
Jan-14 Jul-14 Jan-15 Jul-15 Jan-16 Jul-16 Jan-17
mm
cf/
d
mb
bl/
d
Oil Gas
578
9,778
334371
303
371 373 352 347
236 255
355324
376
165
Feb-17 Apr-17 Jun-17 Aug-17 Oct-17 Dec-17 Feb-18
V+D H
--
$5,000
$10,000
$15,000
$20,000
1Q
14
2Q
14
3Q
14
4Q
14
1Q
15
2Q
15
3Q
15
4Q
15
1Q
16
2Q
16
3Q
16
4Q
16
1Q
17
2Q
17
3Q
17
4Q
17
1Q
18
0 1 3 3 0 2 1 2 0 3 3 2 4 1 2 1 0
$ /
acre
# Deals
$8,167
--
$50,000
$100,000
$150,000
$200,000
$250,000
1Q
14
2Q
14
3Q
14
4Q
14
1Q
15
2Q
15
3Q
15
4Q
15
1Q
16
2Q
16
3Q
16
4Q
16
1Q
17
2Q
17
3Q
17
4Q
17
1Q
18
2 2 5 4 0 3 1 2 1 6 4 2 4 2 2 2 2
$ /
bo
e/d
# Deals
$80,272
# Deals
$80,272
Ann'd
Date Buyer Seller Asset Description Value(1)
Proved
Multiple
Prod.
Multiple Net Acres
($mm) ($/boe) ($/boe/d) ($/acre)(2)
06-Feb-18 Undisclosed Buyer Chesapeake 238,000 net acres in Anadarko Basin $500 n.a. $21,739 $2,101
25-Jan-18 Revolution Resources LLC Gastar Exploration Inc 26,100 net acres in the Anadarko Basin $108 $5.60 $37,906 $4,119
27-Dec-17 Chaparral Energy Multiple 7,000 net acres in STACK $60 n.a. n.a. $8,500
14-Nov-17 Exponent Energy III Mid-Con Energy Partners LP 6,591 net acres in Southern Oklahoma $22 $8.09 $40,741 $3,338
13-Oct-17 Perdure Petroleum LLC Chaparral Burbank and TX Panhandle EOR assets $170 $2.35 $29,825 n.a.
Mean $172 $5.35 $32,552 $4,514
Median $108 $5.60 $33,865 $3,728
Blue = BMO provided transaction advisory services Green = BMO provided acquisition financing or related services
Purple = BMO provided both transaction advisory services and acquisition financing or related services
0%
5%
10%
15%
20%
--
50
100
150
200
Jan-14 Jan-15 Jan-16 Jan-17 Jan-18
H V+D % of Total Rigs
Mid-Continent Snapshot
GROSS PRODUCTION
TRANSACTION ACTIVITY (EXCLUDES CORPORATE DEALS)
PERMITTING ACTIVITY BY MONTH
DIFFERENTIALS RIG COUNT
Source: BMO Transaction Database, Baker Hughes, BMO Commodity Products Group, Bloomberg, Drilling Info, PLS
Note: Current quarter’s data is through the week covered by this issue.
1. Represents total enterprise value. Excludes transactions with deal value <$20 million. 2. $/acre multiple not adjusted for value associated with production.
3. Red line denotes average since 1-Jan-15. Calculated as the weighted average of each quarter’s transactions.
4. Production valued at $45,000/boepd in 2014, $30,000/boepd in 2015, $35,000/boepd in 2016 & 2017, and $40,000/boepd in 2018.
Asset descriptions are all hard-coded and need to be
adjusted if new deals are added
TRANSACTION PRODUCTION MULTIPLES(3) TRANSACTION ADJUSTED NET ACRE MULTIPLES(3,4)

15
February 19, 2018
--
$10
$20
$30
$40
1Q
14
2Q
14
3Q
14
4Q
14
1Q
15
2Q
15
3Q
15
4Q
15
1Q
16
2Q
16
3Q
16
4Q
16
1Q
17
2Q
17
3Q
17
4Q
17
1Q
18
5 2 0 0 0 0 2 0 0 0 1 0 0 0 0 1 1
$ /
bo
e
# Deals
$11.38
# Deals
--
$20,000
$40,000
$60,000
$80,000
$100,000
1Q
14
2Q
14
3Q
14
4Q
14
1Q
15
2Q
15
3Q
15
4Q
15
1Q
16
2Q
16
3Q
16
4Q
16
1Q
17
2Q
17
3Q
17
4Q
17
1Q
18
5 2 0 0 0 0 2 1 0 0 2 0 0 0 0 1 1
$ /
bo
e/d
# Deals
$29,387
# Deals
$29,387
Item Value Wkly Change Last Week Item Value Wkly Change Last Week
Rig Count 18 2 16 Oil Differential $2.15 ($0.10) $2.25
Permitting Activity 1 -- 1 Gas Differential -- -- --
--
$2.00
$4.00
$6.00
$8.00
$10.00
Jan-15 Jul-15 Jan-16 Jul-16 Jan-17 Jul-17 Jan-18
--
$2.00
$4.00
$6.00
$8.00
$10.00
$ /
mm
btu
$ /
bb
l
LLS Henry Hub
2,000
2,500
3,000
3,500
4,000
4,500
5,000
1,000
1,200
1,400
1,600
1,800
2,000
Jan-14 Jul-14 Jan-15 Jul-15 Jan-16 Jul-16 Jan-17 Jul-17
mm
cf/
d
mb
bl/
d
Oil Gas
1,760
3,103
19 17
0
31
24 26
17 16
10
23 21 22
2
Feb-17 Apr-17 Jun-17 Aug-17 Oct-17 Dec-17 Feb-18
0%
2%
4%
6%
8%
10%
--
20
40
60
80
Jan-14 Jan-15 Jan-16 Jan-17 Jan-18
H V+D % of Total Rigs
Gulf of Mexico Snapshot
GROSS PRODUCTION
TRANSACTION ACTIVITY (EXCLUDES CORPORATE DEALS)
PERMITTING ACTIVITY BY MONTH(1)
DIFFERENTIALS RIG COUNT
Source: BMO Transaction Database, Baker Hughes, BMO Commodity Products Group, Bloomberg, Drilling Info, PLS
Note: Current quarter’s data is through the week covered by this issue.
1. Permits include directional and unidentified drilling permits. 2. Represents total enterprise value. Excludes transactions with deal value <$20
million. 3. $/acre multiple not adjusted for value associated with production 4. Red line denotes average since 1-Jan-15. Calculated as the
weighted average of each quarter’s transactions..
TRANSACTION PROVED RESERVE MULTIPLES(4) TRANSACTION PRODUCTION MULTIPLES(4)
Asset descriptions are all hard-coded and need to be
adjusted if new deals are added
Ann'd
Date Buyer Seller Asset Description Value(2)
Proved
Multiple
Prod.
Multiple Net Acres
($mm) ($/boe) ($/boe/d) ($/acre)(3)
15-Feb-18 Fieldwood Energy LLC Noble Energy Deepwater GOM assets $710 $30.87 $35,500 $2,996
12-Sep-16 Anadarko Freeport-McMoRan Inc Deepwater GOM assets $2,000 $15.88 $25,000 n.a.
29-Aug-16 EnVen Energy Ventures Shell Brutus and Glider fields $425 n.a. $17,000 n.a.
09-Nov-15 EnVen Energy Ventures Marathon Petronius and Neptune fields $205 n.a. $20,500 n.a.
11-Aug-15 Energy XXI M21K GOM Shelf assets $25 $1.94 $4,582 n.a.
Mean $673 $16.23 $20,516 $2,996
Median $425 $15.88 $20,500 $2,996
Blue = BMO provided transaction advisory services Green = BMO provided acquisition financing or related services
Purple = BMO provided both transaction advisory services and acquisition financing or related services
16
February 19, 2018
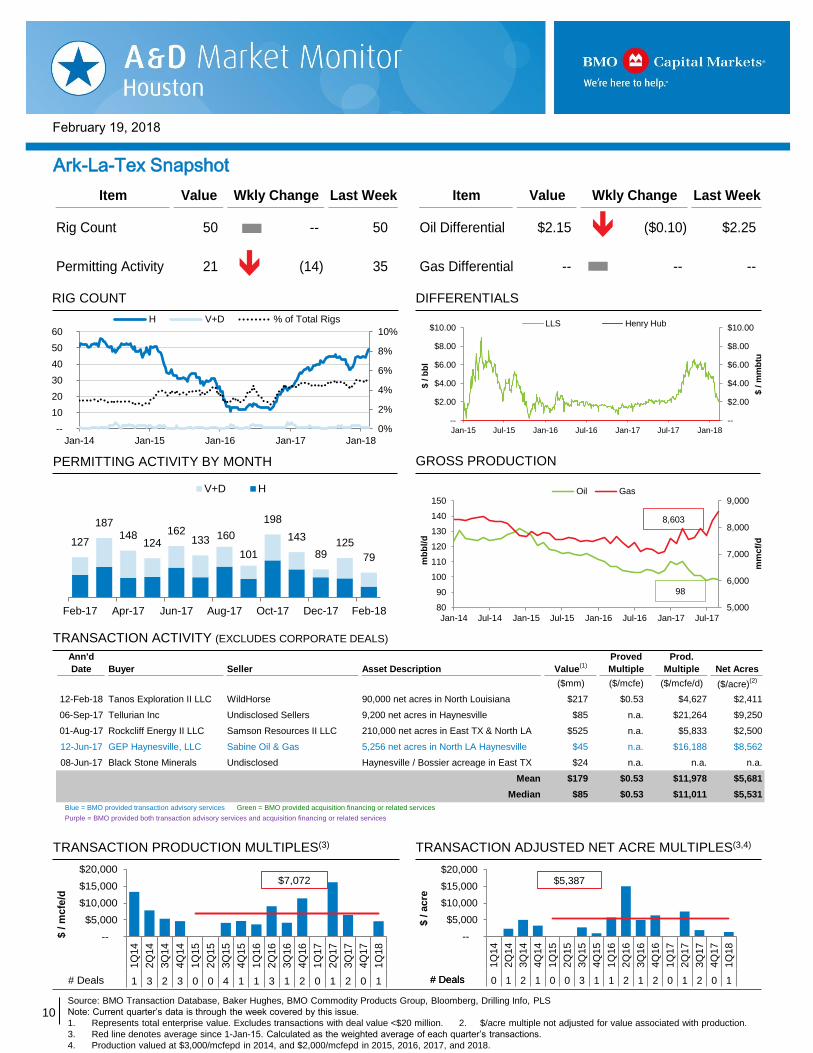
Upcoming Industry Events
February 2018 Feb 20 Houston Producers Forum Luncheon
Feb 20-21 DUG Haynesville
Feb 27-Mar 1 Enercom Dallas
Feb 28 SPE Business Development Study Group
March 2018
Mar 5-9 CERA Week
Mar 6-8 IADC/SPE Drilling Conference
Mar 18 ADAM-Houston Monthly Luncheon
Mar 20 Houston Producers Forum Luncheon
Mar 25 SPE Business Development Study Group
Disclaimer: The foregoing links are for convenience only and relate to materials that were not prepared or reviewed by BMO Capital Markets. BMO Capital Markets takes
no responsibility for and makes no representations with respect to the contents thereof. These materials may be inconsistent with the views of BMO Capital Markets.
Click event to open
April 2018 Apr 9-11 OGIS New York
Apr 14-18 SPE Improved Oil Recovery Conference
Apr 17 Houston Producers Forum Luncheon
Apr 20 ADAM-Houston Monthly Luncheon
Apr 24-25 DUG Rockies
Apr 25 SPE Business Development Study Group
Apr 30-May 3 Offshore Technology Conference
May 2018 May 7 Energy Capital Conference
May 15 Houston Producers Forum Luncheon
May 17 IADC Drilling Onshore Conference & Exhibition
May 18 ADAM-Houston Monthly Luncheon
May 20-23 AAPG 2018 Annual Convention & Exhibition
May 21-23 DUG Permian
May 30 SPE Business Development Study Group
July 2018 Jul 11 IPAA Leaders in Industry Luncheon
Jul 23-25 SPE Unconventional Resources Technology
August 2018 Aug 8 IPAA Leaders in Industry Luncheon
Aug 13-17 Enercom Oil & Gas Conference
Aug 15-16 NAPE Summer
Aug 17 ADAM-Houston Monthly Luncheon
September 2018 Sep 5-6 A&D Strategies & Opportunities
Sep 11-12 IADC Advanced Rig Technology Conference
Sep 12 IPAA/TIPRO Leaders in Industry Luncheon
Sep 21 ADAM-Houston Monthly Luncheon
Sep 24-26 SPE Annual Technical Conference and Exhibition
October 2018 Oct 10 IPAA Leaders in Industry Luncheon
Oct 16 Houston Producers Forum Luncheon
Oct 19 ADAM-Houston Monthly Luncheon
Oct 22-23 Midstream Finance Conference
Oct 23-24 IADC International Well Control 2018 Conference
Oct 23-25 SPE Asia Pacific Oil & Gas Conference
November 2018 Nov 5-7 Executive Oil Conference
Nov 7-9 IADC Annual General Meeting
Nov 11-13 IPAA Annual Meeting
Nov 13-15 DUG Midcontinent
Nov 14 IPAA Leaders in Industry Luncheon
Nov 16 ADAM-Houston Monthly Luncheon
Nov 20 Houston Producers Forum Luncheon
June 2018 Jun 15 ADAM-Houston Monthly Luncheon
Jun 19 Houston Producers Forum Luncheon
Jun 19-20 IADC World Drilling Conference & Exhibition
Jun 19-21 DUG East
Jun 25-27 IPAA Midyear Meeting
Jun 27 SPE Business Development Study Group
December 2018 Dec 12 IPAA Leaders in Industry Luncheon

17
February 19, 2018
This
Week Change
Last
Week
Last
Year
Total Rigs 975 -- 975 751
Oil 798 7 791 597
Gas 177 (7) 184 153
Miscellaneous -- -- -- 1
Directional 71 (2) 73 72
Horizontal 839 7 832 614
Vertical 65 (5) 70 65
Basin
Arkoma 7 (1) 8 5
Barnett 2 -- 2 5
Cana 67 1 66 49
DJ-Niobrara 25 (1) 26 21
Eagle Ford 70 1 69 61
Fayetteville -- -- -- 1
Granite Wash 12 1 11 13
GOM 18 2 16 17
Haynesville 50 -- 50 34
Marcellus 56 1 55 42
Mississippian 4 1 3 3
Permian 433 (4) 437 303
Utica 22 (2) 24 21
Williston 49 (1) 50 36
Other 160 2 158 140
This material is prepared by the BMO Capital Markets’ Investment and Corporate Banking Department, for distribution to BMO Capital Markets’ clientele. It is not a product of
BMO Capital Markets’ Research Department. The views of the Investment and Corporate Banking Department may differ from those of the Research Department.
BMO Capital Markets is a trade name used by BMO Financial Group for the wholesale banking businesses of Bank of Montreal, BMO Harris Bank N.A. (member FDIC), Bank of Montreal
Ireland p.l.c, and Bank of Montreal (China) Co. Ltd and the institutional broker dealer businesses of BMO Capital Markets Corp. (Member SIPC) in the U.S., BMO Nesbitt Burns Inc.
(Member Investment Industry Regulatory Organization of Canada and Member Canadian Investor Protection Fund) in Canada and Asia and BMO Capital Markets Limited (authorised
and regulated by the Financial Conduct Authority) in Europe and Australia. “Nesbitt Burns” is a registered trademark of BMO Nesbitt Burns Inc., used under license. “BMO Capital
Markets” is a trademark of Bank of Montreal, used under license. "BMO (M-Bar roundel symbol)" is a registered trademark of Bank of Montreal, used under license. ® Registered
trademark of Bank of Montreal in the United States, Canada and elsewhere.™ Trademark of Bank of Montreal in the United States and Canada.
Bank of Montreal or its subsidiaries (“BMO Financial Group”) has lending arrangements with, or provide other remunerated services to, many issuers covered by BMO Capital Markets.
The opinions, estimates and projections contained in this report are those of BMO Capital Markets as of the date of this report and are subject to change without notice. BMO Capital
Markets endeavors to ensure that the contents have been compiled or derived from sources that we believe are reliable and contain information and opinions that are accurate and
complete. However, BMO Capital Markets makes no representation or warranty, express or implied, in respect thereof, takes no responsibility for any errors and omissions contained
herein and accepts no liability whatsoever for any loss arising from any use of, or reliance on, this report or its contents. Information may be available to BMO Capital Markets or its
affiliates that is not reflected in this report. The information in this report is not intended to be used as the primary basis of investment decisions, and because of individual client
objectives, should not be construed as advice designed to meet the particular investment needs of any investor. This material is for information purposes only and is not an offer to sell or
the solicitation of an offer to buy any security. BMO Capital Markets or its affiliates will buy from or sell to customers the securities of issuers mentioned in this report on a principal basis.
BMO Capital Markets or its affiliates, officers, directors or employees have a long or short position in many of the securities discussed herein, related securities or in options, futures or
other derivative instruments based thereon. BMO Capital Markets may act as financial advisor and/or underwriter for the issuers mentioned herein and may receive remuneration for
same. The reader should assume that BMO Capital Markets or its affiliates may have a conflict of interest and should not rely solely on this report in evaluating whether or not to buy or
sell securities of issuers discussed herein.
All values in this document are in US$ unless otherwise specified.
Geoff Roberts
MD & Head of U.S. A&D
713-518-1268
Howard Barnwell
MD & Transactions Mgr.
713-546-9767
TRANSACTIONS NEWSLETTER
Contacts
Disclaimer
Source of rig count stats: Baker Hughes
Rig Count Summary
MAPS IN
MASTER VIEW
Rob Priske
Director & Transactions Mgr.
713-546-9727
Legend
Current
Change
Arkoma
Barnett
Cana
DJ-Niobrara
Eagle Ford
Haynesville
Fayetteville
Granite Wash
GOM
Permian
Marcellus
Mississippian
Utica
Williston
7
(1)
2
--
67
1
25
(1)
70
1
--
--
12
1
18
2
50
--
56
1
4
1
433
(4)
22
(2)
49
(1)
Chelsea Neville
Transactions Coordinator
713-546-9703
Rob Priske
Director & Transactions Mgr.
713-546-9727
Geoff Roberts
MD & Head of U.S. A&D
713-518-1268
Marshall Soper
Analyst
713-546-9706
Aaron Moeller
Analyst
713-518-1262