Promotive effects of non-digestible disaccharides on rat Nutrition
37
Instructions for use Title Promotive effects of non-digestible disaccharides on rat mineral absorption depend on the type of saccharide. Author(s) Asvarujanon, Patchana; Ishizuka, Satoshi; Hara, Hiroshi Citation Nutrition, 21(10): 1025-1035 Issue Date 2005-10 Doc URL http://hdl.handle.net/2115/15869 Type article (author version) File Information NUTR21-10.pdf Hokkaido University Collection of Scholarly and Academic Papers : HUSCAP
Transcript of Promotive effects of non-digestible disaccharides on rat Nutrition

Instructions for use
Title Promotive effects of non-digestible disaccharides on rat mineral absorption depend on the type of saccharide.
Author(s) Asvarujanon, Patchana; Ishizuka, Satoshi; Hara, Hiroshi
Citation Nutrition, 21(10): 1025-1035
Issue Date 2005-10
Doc URL http://hdl.handle.net/2115/15869
Type article (author version)
File Information NUTR21-10.pdf
Hokkaido University Collection of Scholarly and Academic Papers : HUSCAP

Title of paper
Promotive effects of nondigestible disaccharides on rat mineral absorption depend on kind of the
saccharide.
Running head
Disaccharides and mineral absorption
Authors
Patchana Asvarujanon, PhD, Satoshi Ishizuka, PhD and Hiroshi Hara, PhD
Institution
Division of Applied Bioscience, Graduate School of Agriculture, Hokkaido University, Sapporo,
060-8589, Japan
Corresponding Author
Hiroshi Hara
Division of Applied Bioscience, Graduate School of Agriculture, Hokkaido University
Kita-9, Nishi-9, Kita-ku, Sapporo 060-8589, Japan
Tel: +81-11-706-3352 Fax: +81-706-2504
E-mail: [email protected]
1

ABSTRACT
OBJECTIVE: We examined the effects of feeding nondigestible disaccharides, difructose
anhydride III (DFAIII), maltitol, melibiose and cellobiose on calcium, magnesium and iron
absorption in comparison to fructooligosaccharide (FOS) in normal and ovariectomized rats.
METHODS: In experiment 1, six groups of male Sprague-Dawley rats were fed either a control
diet (100 g cellulose/kg diet) or test diets containing 30 g of FOS or the four nondigestible
disaccharides in place of the cellulose in the control diet for 4 wk. In experiment 2, two groups of
female Sprague-Dawley rats (sham or ovariectomized) were divided into four subgroups and fed
either the control or test diet containing FOS, DFAIII and melibiose for 5 wk. Feces and cecal
contents were collected to evaluate mineral absorption and cecal fermentation.
RESULTS: In experiment 1, calcium absorption in the all disaccharides groups except the
cellobiose group, magnesium absorption in the all test diet groups, and iron absorption in the
FOS, DFAIII and melibiose groups were higher than those in the control group, respectively. In
ovariectomized rats (experiment 2), calcium absorption in the DFAIII and melibiose groups,
magnesium absorption in the all test diet groups, and iron absorption in the DFAIII group alone
were higher than those in the control group, respectively. Cecal organic acids were positively and
pH was negatively correlated with the absorption of these minerals, although the effects varied.
CONCLUSIONS: Nondigestible disaccharides increase calcium, magnesium, and iron
absorption in normal and ovariectomized rats; however, the effects depend on the disaccharide
tested, a fact that may partly be associated with the cecal fermentation of these disaccharides.
KEY WORDS: Nondigestible disaccharides, calcium, magnesium, iron, intestinal absorption,
ovariectomized, rats
2
Introduction
Mineral deficiencies remain an important nutritional issue, with calcium intake in many
Asian countries below the recommended daily allowance. Such deficiency in calcium is known to
lead to progressive bone loss.1 Magnesium is the second most abundant intracellular cation in
vertebrates, and its deficiency has also been implicated as a risk factor for osteoporosis.2-3
Another mineral with a low intake is iron. Iron deficiency is one of the most common nutritional
problems in the world4 and is a major cause of anemia. The low bioavailability of dietary iron is
an important factor causes of iron deficiency.
As has been demonstrated by in vivo and in vitro studies, ingestion of nondigestible
saccharides, including various types of oligosaccharides,5-6 sugar alcohol7-8 and
polysaccharides,9-10 results in an increase in calcium absorption in rats. We previously showed
that difructose anhydride III (DFAIII) stimulates calcium transport in the isolated mucosa of the
rat small intestine.11 The promotive effect of DFAIII in the small intestine has also been
demonstrated with an in vivo study using ileorectostomized rats.12 Maltitol is another
nondigestible disaccharide reported to have promotive effects on calcium absorption in the small
intestine. Previous studies suggest that these disaccharides in the intestinal lumen directly affect
the epithelium of the small intestine and enhance calcium transport.13
Increases in fermentation in the large intestine with feeding of nondigestible saccharides
is also thought to be involved in the promotion of calcium transport in the large intestine.6,14 It is
well known that fructooligosaccharide (FOS) increases calcium absorption dependent on cecal
fermentation in rats.15-16 Organic acids produced through microbial fermentation decrease the pH
of the cecal contents, which solubilize calcium salts in the large intestine and increase calcium
absorption.17-19 It has been reported that short-chain fatty acids themselves promote calcium
absorption directly20-21 or indirectly through stimulation of mucosal cell proliferation in the large
intestine.22
3

There is little information concerning the effect of nondigestible disaccharides on
magnesium or iron absorption compared to that on calcium absorption. Ingestion of FOS has
been shown to increase magnesium absorption in rats23 and to prevent iron-deficiency anemia
induced by gastric resection.24 Feeding of DFAIII was reported to increase iron absorption and
partially prevents iron-deficiency anemia induced by tannic acid.25
In the present study, we used FOS, which consists of 42% 1-ketose, 46% nystose and 9%
fructofuranosylnystose,26 as a standard oligosaccharide because FOS has been well characterized
as a nondigestible, fermentable oligosaccharide. This study was conducted to compare the effects
of nondigestible disaccharides on calcium, magnesium and iron absorption by using normal and
ovariectomized (OVX) rats. The ovariectomized rat is a model of osteoporosis in
post-menopausal woman. Disaccharides, DFAIII and Maltitol, have been reported to increase
calcium absorption as mentioned above. The former promotes the absorption in the small and
large intestines, and the latter in the small intestine. We included two other nondigestible
disaccharides, melibiose and cellobiose, in this study.
Di-D-fructose-1, 2′:2, 3′-dianhydride (DFAIII) is a disaccharide consisting of two fructose
residues with two glycoside bonds. Maltitol (α-D-glucopyranosyl-1, 4-sorbitol) is a disaccharide
alcohol generated by the hydrogenation of maltose. Melibiose
(6-O-∂-D-galactopyranosyl-D-glucose) is a disaccharide composed of galactose and glucose, and
cellobiose (4-O-D-Glucopyranosyl-D-glucose) is composed of two glucose residues with a
β-glycoside bond. There are no reports on the effects of the latter two disaccharides on mineral
absorption in vivo.
Materials and Methods
This study was approved by the Hokkaido University Animal Committee, and animals
were maintained in accordance with the guidelines of the Hokkaido University for the care and
4

use of laboratory animals.
Animal and Experimental protocol
Male (experiment 1) and female (experiment 2) Sprague-Dawley rats (6 wk old; Clea
Japan, Tokyo, Japan) weighing about 150 g were housed in individual cages in a room with
controlled temperature (22 ± 2℃), relative humidity (40% to 60%), and lighting (lights
from 8:00 AM to 8:00 PM) throughout the study.
In experiment 1, the rats had free access to deionized water and a sucrose-based
semipurified stock diet (shown in Table1) for an acclimation period of 7 days, and were then
divided into six groups of eight rats using a randomized block design based on body weight. Rats
of one group (control diet group) were fed the test diet prepared based on AIN-93G formulation27
containing 100 g cellulose/kg diet (Table1), and those of other five groups were fed test diets
containing 30 g of the five nondigestible saccharides in place of the cellulose in the control diet
for 4 weeks. Saccharides tested were short-chain fructooligosaccharide (FOS; Meioligo-P, Meiji
Seika, Tokyo, Japan), as a standard oligosaccharide, and four nondigestible disaccharides,
di-D-fructose anhydride III (DFAIII, Nippon Beet Sugar MFG Co., Ltd., Obihiro, Japan), maltitol
(MAL; Lesys, Towa Kasei, Natori, Japan), melibiose (MEL,
6-O-∂-D-galactopyranosyl-D-glucose, Nippon Beet sugar MFG., Co., Ltd, Obihiro, Japan) and
cellobiose (CEL, JW cellobiose, Japan chemical and machinery Co., Ltd., Osaka, Japan). All rats
were allowed free access to the test diets and deionized water throughout the test diet period.
Body weight and food intake were measured daily.
In experiment 2, the rats had free access to deionized water and a sucrose-based
semipurified stock diet (Table1) one day before operation. The rats were divided into two groups;
one group of rats underwent bilateral ovariectomy (OVX) and the other group
underwent bilateral laparotomy (sham). Both operations were performed under the same
5

anesthetic procedure (Nembutal: sodium pentobarbital 40 mg/kg of body weight; Abbott
Laboratories, North Chicago, IL, USA). All animals had free access to deionized water and the
stock diet for a 6-day recovery period. After postoperative recovery, sham and OVX rats were
randomly assigned to four subgroups of 8-9 rats. Rats of the four subgroup were fed CON, FOS,
DFA III, or MEL diets, respectively. Rats were fed the assigned test diets for 5 weeks. All rats
were allowed free access to the test diets and deionized water throughout the test period. Body
weight and food intake were measured daily.
Feces were collected during day 10-14 (in experiment 1) and the last 5 days of the test
period (in both experiments) to evaluate absorption of calcium, magnesium and iron. On the last
day of the experiment, all rats were killed under pentobarbital anesthesia (Nembutal: sodium
pentobarbital 50 mg/kg of body weight; Abbott Laboratories). In experiment 1, the cecum was
removed with their contents, weighed, frozen immediately with liquid nitrogen, and stored at –
40°C until subsequent analyses. The cecal contents were collected by cutting open the frozen
cecal wall and cecal wall was washed with saline and weighed. The content weight was evaluated
as the difference in weight between the cecum with and without contents.
Analyses
Collected feces were freeze-dried and milled to a fine powder, and the powdered
feces (approximately 1.5 g) were dry-ashed at a temperature elevated linearly to 550℃ for 6 hr,
and then at 550℃ for 18 hr with an electric furnace (EYELA, TMF-3200, Tokyo Rikakikai,
Tokyo, Japan). The ashed samples were treated with 5.49 mol/l HCl at 200℃ for 30 minutes and
were dissolved in 0.82 mol/l HCl. Calcium, magnesium, and iron concentrations in the ashed
sample solutions were measured by polarizing zeeman-effect atomic absorption spectrometry
(Z-5310, Hitachi, Tokyo, Japan) after suitable dilution.
The cecal contents were diluted with 4 volumes of deionized water and homogenized
6
with a Teflon homogenizer. The pH of the homogenate was measured with a semiconducting
electrode (ISFET pH sensor 0015-15C, HORIBA, Ltd., Kyoto, Japan) as the pH of the cecal
contents. Lipids and proteins in the homogenate of the cecal contents were removed through
treatment with chloroform, and the concentrations of individual organic acids (succinic, lactic,
acetic, propionic, butyric and valeric) were measured by ion-exclusive chromatography using a
high-pressure liquid chromatography (HPLC) system (Organic Acid Analysis System, Shimadzu
Corporation, Kyoto, Japan) constructed with a solvent delivery system (SLC-10 AVP; Shimadzu),
double ion-exchange column (Shim-pack SCR-102h, 8x300 mm; Shimadzu) and an
electroconductivity detector (CDD-6A; Shimadzu), as previously described.28
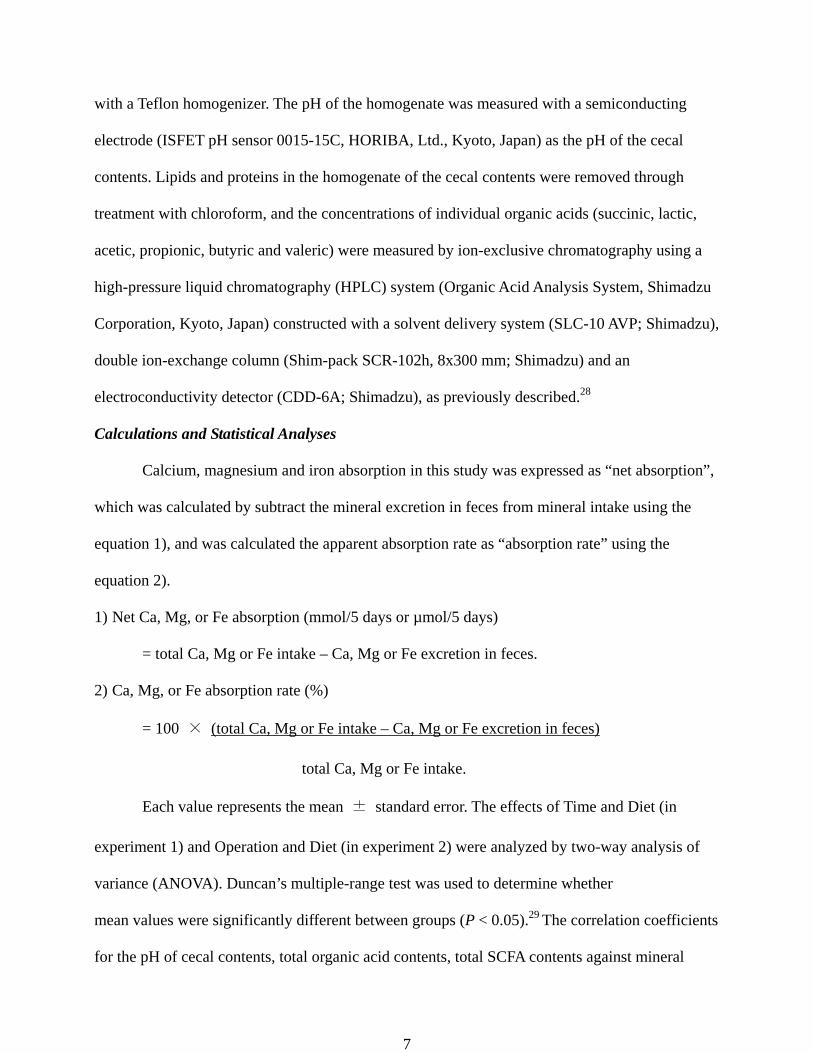
Calculations and Statistical Analyses
Calcium, magnesium and iron absorption in this study was expressed as “net absorption”,
which was calculated by subtract the mineral excretion in feces from mineral intake using the
equation 1), and was calculated the apparent absorption rate as “absorption rate” using the
equation 2).
1) Net Ca, Mg, or Fe absorption (mmol/5 days or µmol/5 days)
= total Ca, Mg or Fe intake – Ca, Mg or Fe excretion in feces.
2) Ca, Mg, or Fe absorption rate (%)
= 100 × (total Ca, Mg or Fe intake – Ca, Mg or Fe excretion in feces)
total Ca, Mg or Fe intake.
Each value represents the mean ± standard error. The effects of Time and Diet (in
experiment 1) and Operation and Diet (in experiment 2) were analyzed by two-way analysis of
variance (ANOVA). Duncan’s multiple-range test was used to determine whether
mean values were significantly different between groups (P < 0.05).29 The correlation coefficients
for the pH of cecal contents, total organic acid contents, total SCFA contents against mineral
7

absorption were calculated by the least squares method.30
Results
Experiment 1
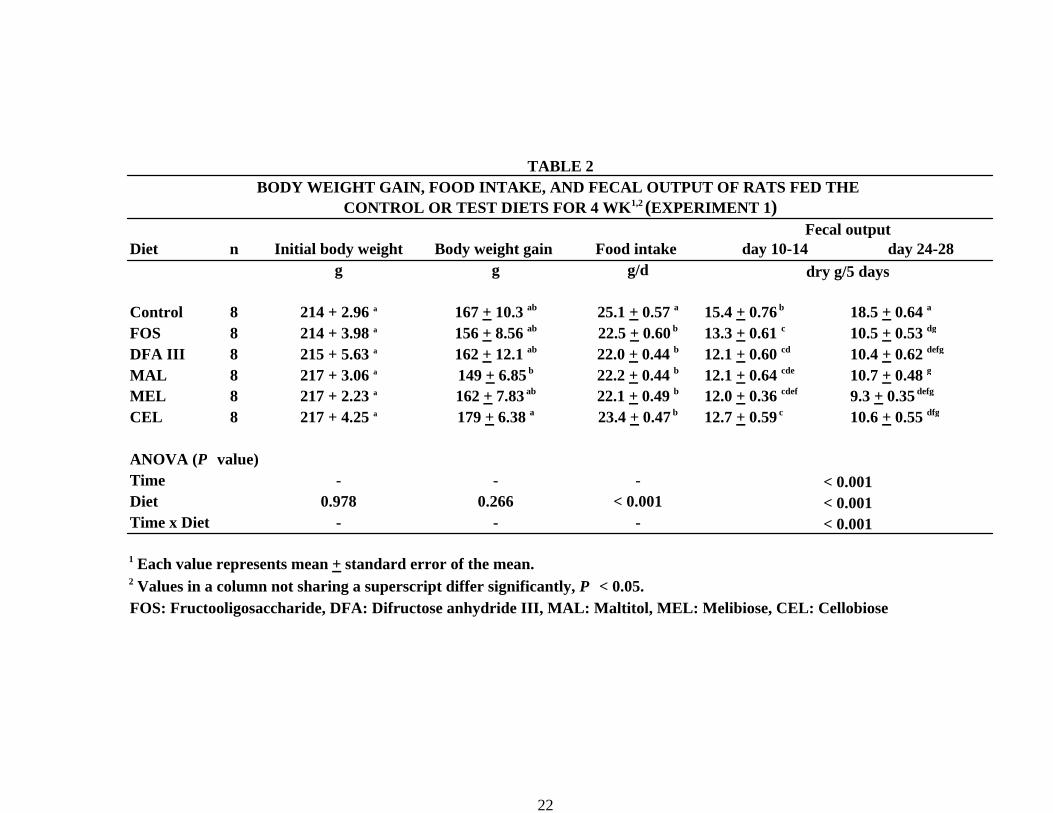
There were no significant differences in body weight gain between the five
oligosaccharide groups and that in the control group (Table 2); however, gain in the CEL group
was significantly higher than in the MAL group. Food intake in the control group was higher than
those in rats in each of the test diet groups, but there were no differences among the five
oligosaccharide groups. Fecal dry weight excreted for 5 days was influenced by Time and Diet (P
< 0.001). The output of the control group was higher than those of other groups in both the first
(day 10-14) and second (day 24-28) balance periods, but there were no differences among the
five oligosaccharide groups. Fecal output of all groups except for the control group on day 24-28
tended to be lower compared to those on day 10-14 (P < 0.001 for Time and Time x Diet).
There were no differences in calcium and magnesium intake among the diet groups on
day 10-14, but the calcium intake of the control group was higher than those of the other diet
groups on day 24-28 (data not shown). Net calcium and magnesium absorption was influenced by
Time and Diet (Table 3). Magnesium balance was higher in the second period than in the first
period, but calcium balance had the interaction between Time and Diet. Net calcium absorption in
the DFAIII group was higher than that in all other groups except for the MEL group during day
24-28. Net magnesium absorption in the FOS group was higher than that in the control group in
both periods.
There were no differences in iron intake among groups in the first period, and that in the
control group during the second period was higher than those in the other groups except for the
DFAIII group (data not shown). Net iron absorption was influenced by Time and Diet, and there
was interaction between Time and Diet. Net iron absorption in the first period was higher in the
DFAIII group compared to those of the MAL and CEL groups (Table 3). In the second period,
8

iron absorption in the DFAIII and MEL groups was higher than those in the control, MAL and
CEL groups.
Changes in calcium and magnesium absorption rates were very similar to those in net
calcium and magnesium balance (Figure 1-2). Calcium absorption rate of the DFAIII group in the
second period was higher than those of the other groups except for the MAL and MEL groups.
Magnesium absorption rates of the all oligosaccharide groups were higher than the control group
in both balance periods. Changes in iron absorption rate were also similar to those in net balance
(Figure 3). The rate in the DFAIII group alone was higher than that in the control group in the
first period; however, those of the FOS, DFAIII and MEL groups were higher than that in the
control group in the second period.
The wet weight of the cecal wall and cecal contents (g/100 g body weight) was higher in
the FOS, DFAIII and MEL groups than in the control group (Table 4). The highest values for the
cecal wall and contents were in the DFAIII and FOS groups, respectively. The pH of the cecal
content was higher in the control group than in the other test diet groups. The pH value in the
FOS group was the lowest among the groups.
Rats fed the DFAIII diet had the highest pools of succinic, acetic and propionic acids and
total SCFAs in the cecal contents (Table 5). The lactic acid pools in the FOS and MEL groups
were much higher than those in the other groups. The butyrate pool was highest in the MAL
group, followed by that in the DFAIII group. The total organic acid pools of all the
oligosaccharide groups were higher than that in the control group, with the highest value
observed in the FOS group. The total SCFA pool was the highest in the DFAIII group, followed
by that in the MAL group, and values in both groups were higher than that in the control group.
Experiment 2
Initial body weight was different between sham and OVX rats (P = 0.008, Table 6). Body
weight gains and food intakes were higher in OVX rats than in sham rats (P < 0.001 for
9

Operation). Food intake in the DFAIII group was lower than that in the control group in both
sham and OVX rats. Dry weight of feces excreted over the last 5 days was higher in the OVX rats
than in the sham rats; however, there were no differences among diet groups. The uterine weight
was much lower in OVX rats than in sham rats.
Ovariectomy influenced calcium, magnesium and iron intakes in the results of two way
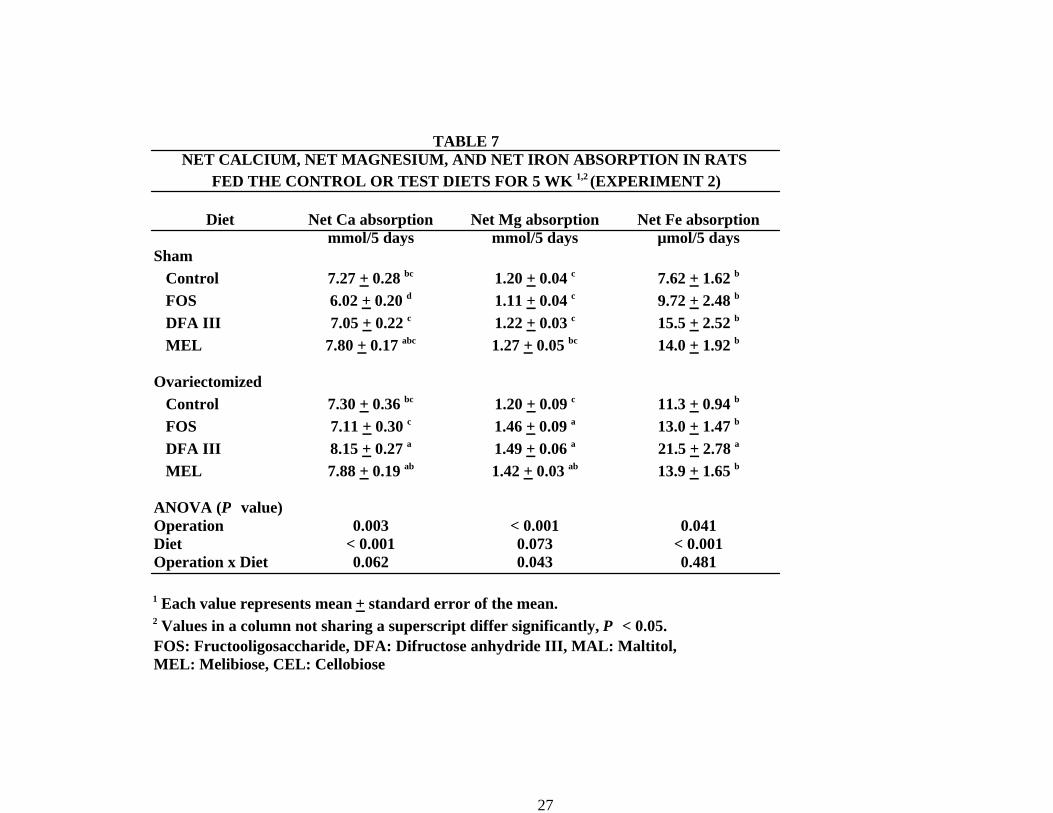
ANOVA (all P < 0.001, data not shown). Net calcium, magnesium and iron absorption was
influenced by Operation (OVX) and Diet except for Diet for magnesium (Table 7). Net calcium
absorption in OVX rats was higher in the DFA III group than in the control group. Net
magnesium absorption was higher in three oligosaccharide groups (FOS, DFAIII, MEL) than in
the control group in OVX rats, and absorption in the FOS and DFAIII groups, but not the control
group were higher in OVX rats than in the sham rats, respectively. Iron absorption in OVX rats
fed DFAIII was higher than those in all other groups.
Calcium absorption rate was also influenced by Operation and Diet (P < 0.001 ). The
absorption rate was higher in rats fed DFAIII and MEL compared to that in rats fed the control
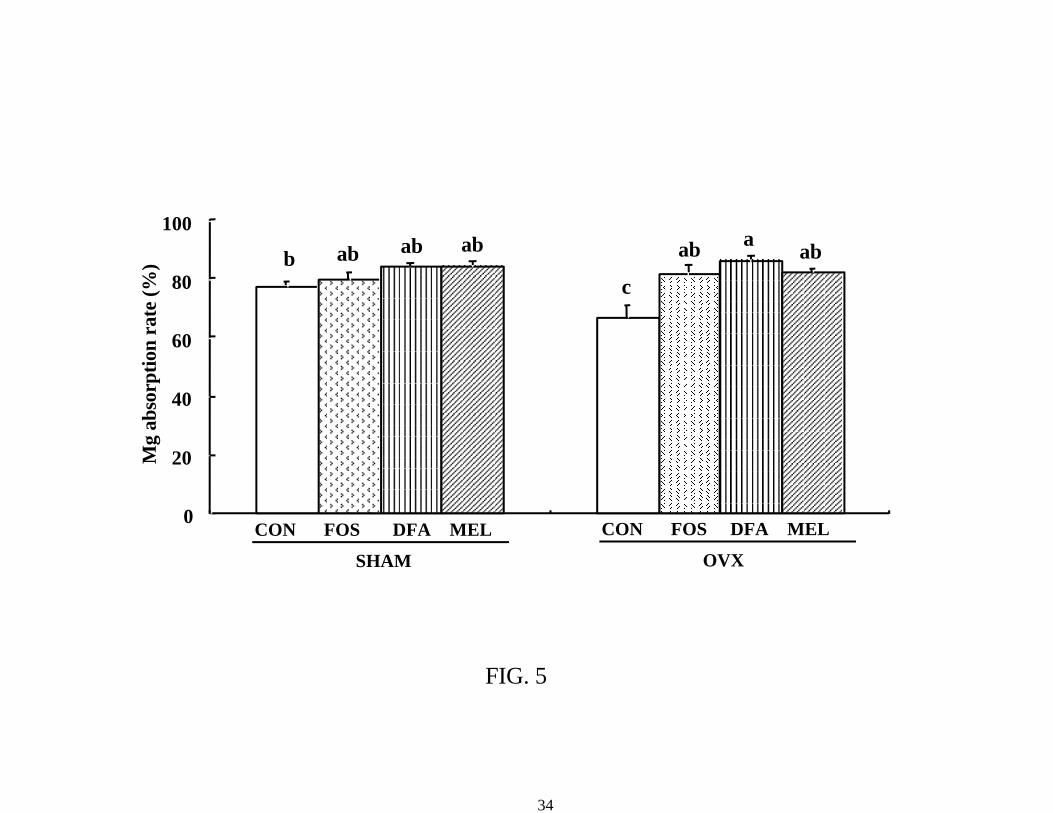
and FOS diets in both sham and OVX groups (Figure 4). Magnesium absorption rates in the
OVX rats were higher in the three oligosaccharide groups compared to that in control group
(Figure 5). In the control diet groups, the absorption rate in sham rats was higher than that in
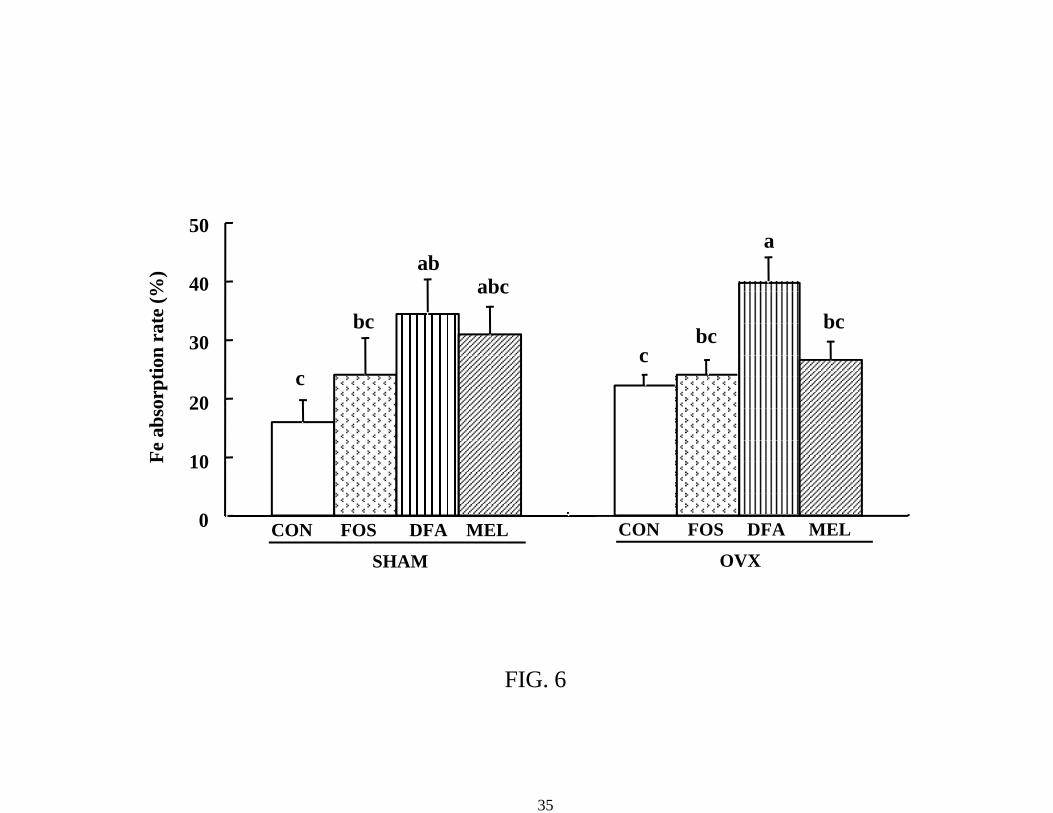
OVX rats. There were no significant differences among diet groups in sham rats. The iron
absorption rate in the DFAIII group was higher than that in the control group in sham rats, and
higher than those in the other three groups in OVX rats (Figure 6).
Discussion
In the present study, the effects of the ingestion of four disaccharides, DFAIII, MAL,
MEL and CEL on calcium, magnesium and iron absorption were compared to those of FOS and
control (only cellulose) diets. All disaccharides were effective in increasing the absorption of at
least one mineral; however, the effects varied markedly among these nondigestible saccharides.
10

Calcium absorption was increased most effectively by DFAIII and MEL, followed by MAL, but
these three disaccharides had similar effects on magnesium absorption. Iron absorption was
increased more effectively by DFAIII and MEL than by the other two disaccharides. In female
OVX rats, iron absorption was enhanced by DFAIII ingestion alone. These results suggest that
the mechanisms involved in the promotion of mineral absorption, especially those of calcium and
iron are different between these disaccharides. The reason for limited effects of MEL and FOS on
iron absorption in OVX rats compared to that in normal male and sham female rats, is not yet
known.
We examined both net absorption (net balance) and absorption rate (%) as food intakes
were differed among the diet groups, between male and female and between sham and OVX rats.
In male rats (Exp. 1), net calcium and iron absorption were clearly increased by the ingestion of
DFAIII and MEL (Table 3), even though intakes of these minerals were reduced in all the
oligosaccharide groups. This is reflected in the high values for these absorption rates in the
DFAIII and MEL groups in the second balance period (Figs. 1 and 3, right panels). This result
shows that these two disaccharides have good potential for enhancing calcium and iron
absorption. Deficiencies in these two minerals are apparent in many countries. DFAIII and MEL
may be beneficial foodstuffs for improving these mineral deficiencies. This finding again reveals
that the effects of nondigestible disaccharides on mineral absorption depend on the type of
disaccharide.
The mechanisms for the promotion of mineral absorption by nondigestible saccharides are
proposed both in the small and large intestines, including the cecum. Increasing cecal
fermentation is the established mechanism involved in the promotion of calcium and magnesium
absorption in rats.6,14,31 The proposed mechanisms are (1) the expansion of the lumen surface due
to enlargement of the cecum, and (2) the increase in soluble mineral concentrations in the large
intestinal contents as a result of decreasing pH.17-19 Some studies have suggested that SCFAs
11

produced from these saccharides are responsible for the enhancement of calcium absorption in
the large intestine.20-21,32 The results in Table 2 show that the nondigestible disaccharides used in
this study were fermentable because fecal dry weight was lower in the groups fed the four
disaccharides compared to the control group fed cellulose. Increases in fermentation were
supported by the larger pools of organic acids; however, these pools varied markedly among the
groups fed the four disaccharides. The highest level of organic acid including SCFA was in the
FOS group, which was followed by the MEL group. The organic acid pools of rats fed MAL and
CEL were less than a half of the levels in the FOS and MEL groups, showing that these
disaccharides are relatively less fermentable. The absence of or only minor effects of MAL and
CEL on calcium and iron absorption may be associated with the lower fermentability of these
disaccharides.
We next evaluated correlations between several cecal parameters and mineral absorption
(Table 8). Absorption of the three minerals in the second period was negatively correlated to the
cecal pH and was positively correlated to total organic acid pool and cecal weight (wall and
contents), which suggests that the cecal fermentation is involved in the promotion of mineral
absorption for those tested. In the second period, calcium, but not magnesium absorption, was
correlated to the acetic and propionic acid pools. These SCFAs have been shown to promote
calcium absorption as described above.20-21,32 Magnesium absorption was correlated to the lactic
acid pool and pH and not to SCFA pool. Lactic acid is a stronger acid than SCFA. This result
demonstrates that lower pH, not the existence of organic acids, is important for magnesium
absorption in the large intestine. In contrast to the second period, no correlations between these
cecal parameters and calcium absorption were found in the first period. Ingestion of DFAIII did,
however, increase calcium absorption in the first period (Fig. 1 left panel). Factors other than
cecal fermentation may contribute to the enhancement of calcium absorption by DFAIII. The
promotive effects in the small intestine may be involved in the DFAIII-induced increase in
12

calcium absorption. Mitamura et al.12 have reported that DFAIII enhanced calcium absorption in
the small intestine, and Mineo et al.33 have shown that DFAIII directly affects the intestinal
epithelial cells and activates passage through tight junctions to increase calcium absorption in the
small intestine.
Iron absorption was the most strongly stimulated among that of the three minerals by
ingestion of nondigestible disaccharides, especially DFAIII. The absorption rate of iron was
strongly correlated to SCFA pools in the first period, but not in the second period, in which, the
absorption was strongly correlated to the cecal enlargement (weight of the cecal wall and
contents). There is no direct evidence that iron is absorbed from the large intestine; however,
Sakai et al.25 have shown that the cecal fermentation of FOS is involved in the prevention of
anemia induced by gastric resection. However, the mechanisms for iron absorption from the large
intestine still need to be clarified.
We used OVX rats in which it has been reported that net calcium balance is impaired by
increases in the intestinal calcium secretion and by calcium malabsorption with decreasing levels
of estradiol.34 In experiment 2, the uterine weight was much lower in OVX rats than in sham rats,
indicating the success of the surgical procedure in all OVX rats. We observed that OVX impaired
calcium and magnesium, but not iron absorption (Figure 4-6). Reduced net calcium absorption by
OVX was restored by feeding DFA III or MEL, which agrees with previous results obtained by
using OVX rats.12 The present study also showed that magnesium absorption impaired by OVX
was restored by feeding of DFAIII or MEL as well as FOS. These results suggest that feeding
these disaccharides can benefit impaired calcium and magnesium absorption in postmenopausal
women.35-37
In conclusion, the ingestion of nondigestible disaccharides increases calcium, magnesium
and iron absorption in normal and OVX rats; however, the beneficial effects of disaccharide
ingestion on mineral absorption differ according to disaccharide type.
13

14

References
1) Brody T. Inorganic nutrients. In: Nutrition biochemistry, 2nd ed. San Diego:Academic
Press, 1999:761-794.
2) Rude RK. Magnesium deficiency: A cause of heterogeneous disease in humans. J Bone
Miner Res 1998;13:749-758.
3) Reginster JY, Strause L, Deroisy R, Lecart MP, Saltman P, Franchimont P. Preliminary
report of decreased serum magnesium in postmenopausal osteoporosis. Magnesium
1989;8:106-109.
4) FAO/WHO. Prevention micronutrient deficiencies. In: ICN: fact sheet number one.
Supporting paper of the international conference on nutrition, December 1992. Rome,
1992.
5) Chonan O, Matsumoto K, Watanuki M. Effect of galactooligosaccharides on calcium
absorption and preventing bone loss in ovariectomized rats. Biosci Biotechnol Biochem
1995;59:236-239.
6) Ohta A, Ohtsuki M, Baba S, Adachi T, Sakata T, Sakaguchi E. Calcium and magnesium
absorption from the colon and rectum are increased in rats fed fructooligosaccharides. J
Nutr 1995;125:2417-2424.
7) Goda T, Yamada M, Takase S, Hosoya N. Effect of maltitol intake on intestinal calcium
absorption in the rat. J Nutr Sci Vitaminol (Tokyo) 1992;38:277-286.
8) Brommage R, Binacua C, Antille S, Carrie AL. Intestinal calcium absorption in rats is
stimulated by dietary lactulose and other resistant sugars. J Nutr 1993;123:2186-2194.
9) Hara H, Suzuki T, Kasai T, Aoyama Y, Ohta A. Ingestion of guar gum hydrolysate
partially restored calcium absorption in the large intestine lowered by suppression of
gastric acid secretion in rats. Br J Nutr 1999;81:315-321.
10) Watanabe O, Hara H, Aoyama Y, Kasai T. Increased intestinal calcium absorption from
15

the ingestion of a phosphorylated guar gum hydrolysate independent of cecal
fermentation in rats. Biosci Biotechnol Biochem 2000;64:613-616.
11) Suzuki T, Hara H, Kasai T, Tomita F. Effects of difructose anhydride III on calcium
absorption in small and large intestines of rats. Biosci Biotechnol Biochem
1998;62:837-841.
12) Mitamura R, Hara H, Yoritaka A, Chiji H. Supplemental of feeding difructose anhydride
III restores calcium absorption impaired by ovariectomized rats. J Nutr
2002;132:3387-3393.
13) Goda T, Takase S, Hosoya N. Maltitol-induced increase of transepithelial transport of
calcium in rat small intestine. J Nutr Sci Vitaminol (Tokyo) 1993;39:589-595.
14) Ohta A, Ohtsuki M, Takizawa T, Inaba H, Adachi T, Kimura S. Effects of
fructooligosaccharides on the absorption of magnesium and calcium by cecectomized rats.
Int J Vitam Nutr Res 1994;64:316-323.
15) Oku T, Tokunaga T, Hosoya N. Nondigestiblity of a new sweetener, “Neosugar” in the rat.
J Nutr 1984;114:1574-1581.
16) Tokunaga T, Oku T, Hosoya, N. Influence of chronic intake of new sweetener (Neosugar)
on growth and gastrointestinal function of the rat. J Nutr Sci Vitaminol 1986;32:111-121.
17) Younes H, Demigne C, Remesy C. Acidic fermentation in the caecum increases
absorption of calcium and magnesium in the large intestine of the rat. Br J Nutr
1996;75:301-314.
18) Levrat MA, Remesy C, Demigne C. High propionic acid fermentations and mineral
accumulation in the cecum of rats adapted to different levels of inulin. J Nutr
1991;121:1730-1737.
19) Demigne C, Levrat MA, Remesy C. Effect of feeding fermentable carbohydrates on the
cecal concentrations of mineral and their fluxs between the cecum and blood plasma in
16

rats. J Nutr 1989;119:1625-1630.
20) Mineo H, Hara H, Tomita F. Short-chain fatty acids enhance diffusional calcium transport
in the epithelium of the rat cecum and colon. Life Science 2001;69:517-526.
21) Trinidad TP, Wolever TM, Thompson LU. Effects of calcium concentration, acetate, and
propionate on calcium absorption in the human distal colon. Nutrition 1999;15:529-533.
22) Sakata T. Stimulatory effect of short-chain fatty acids on epithelial cell proliferation in the
rat intestine: a possible explanation for trophic effects of fermentable fibre, gut microbes
and mucosal trophic factors. Br J Nutr 1987;58:95-103.
23) Delzenne N, Aertssens J, Verplaetse H, Roccaro M, Roberfroid M. Effect of fermentable
fructo-oligosacharides on mineral, nitrogen and energy digestive balance in the rat. Life
Science 1995;57:1579-1587.
24) Sakai K, Ohta A, Shiga K, Takasaki M, Tokunaga T, Hara H. The cecum and dietary
short-chain fructooligosaccharides are involved in preventing postgastrectomy anemia in
rats. J Nutr 2000;130:1608-1612.
25) Afsana K, Shiga K, Ishizuka S, Hara, H. Ingestion of an indigestible saccharide,
difructose anhydride III, partially prevents the tannic acid-induced suppression of iron
absorption in rats. J Nutr 2003;133:3553-3560.
26) Hidaka H, Hirayama M, Sumi NA. Fructooligosaccharides-production enzyme from
Aspergillus niger ATCC 20611. Agric Biol Chem 1988;52:1181-1187.
27) Reeves PG, Nielsen FH, Fahey GJ. AIN-93 purified diets for laboratory rodents: final
report of the American Institute of Nutrition Ad Hoc Writing Committee on the
reformulation of the AIN-76A rodent diet. J Nutr 1993;123:1939-1951.
28) Hoshi S, Sakata T, Mikuni K, Hashimoto H, Kimura S. Galactosylsucrose and
xylosylfructoside alter digestive tract size and concentrations of cecal organic acids in rats
fed diets containing cholesterol and cholic acid. J Nutr 1994;124:52-60.
17

29) Duncan DB. Multiple range and multiple F test. Biometrics 1955;11:1-42.
30) Ichihara K. Correlation coefficient. In: Statistics for Bioscience: practical technique and
theory. Tokyo:Nankoudou, 1991:224-339.
31) Younes H, Coudray C, Bellanger J, Demigne C, Rayssiguier Y, Remesy C. Effects of two
fermentable carbohydrate (inulin and resistant starch) and their combination on calcium
and magnesium balance in rats. Br J Nutr 2001;86:479-485.
32) Trinidad TP, Wolever TMS, Thompson LU. Effects of acetate and propionate on calcium
absorption in the rectum and distal colon of human. Am J Clin Nutr 1996;63:574-578.
33) Mineo H, Hara H, Shigematsu N, Okuhara Y, Tomita F. Melibiose, difructose anhydride
III and difructose anhydride IV enhance net calcium absorption in rat small and large
intestinal epithelium by increasing the passage of tights junctions in vitro. J Nutr
2002;132:3394-3399.
34) O′Loughlin PD, Morris HA. Estrogen deficiency impairs intestinal calcium absorption in
the rat. J Physiol 1998;511:313-322.
35) Nordin BE, Need AG, Morris HA, O'Loughlin PD, Horowitz M. Effect of age on calcium
absorption in postmenopausal women. Am J Clin Nutr. 2004;80:998-1002.
36) Kass-Wolff JH. Calcium in women: healthy bones and much more. J Obstet Gynecol
Neonatal Nurs. 2004;33:21-33.
37) Van den Heuvel EG, Muijs T, Van Dokkum W, Schaafsma G. Lactulose stimulates calcium
absorption in postmenopausal women. J Bone Miner Res. 1999;14:1211-1216.
18

FIG. 1 Calcium absorption rate in rats fed control or test diets containing 30 g nondigestible
oligosaccharide/kg diet at 2 wk (day 10-14) and 4 wk (day 24-28) after the start of feeding the
test diets in male rats (experiment 1). Each value represents the mean ± standard error (n = 8). P
values estimated by two-way analysis of variance (Time, Diet and Time x Diet were <0.001, <
0.001, 0.039, respectively). Values not sharing a letter are significantly different, P < 0.05. FOS:
Fructooligosaccharide, DFA: Difructose anhydride III, MAL: Maltitol, MEL: Melibiose, CEL:
Cellobiose
FIG. 2 Magnesium absorption rate in rats fed control or test diets containing 30 g nondigestible
oligosaccharide/kg diet at 2 wk (day 10-14) and 4 wk (day 24-28) after the start of feeding the
test diets in male rats (experiment 1). Each value represents the mean ± standard error (n = 8). P
values estimated by two-way analysis of variance (Time, Diet and Time x Diet were < 0.001. <
0.001, 0.013, respectively). Values not sharing a letter are significantly different, P < 0.05. FOS:
Fructooligosaccharide, DFA: Difructose anhydride III, MAL: Maltitol, MEL: Melibiose, CEL:
Cellobiose
FIG. 3 Iron absorption rate in rats fed control or test diets containing 30 g nondigestible
oligosaccharide/kg diet at 2 wk (day 10-14) and 4 wk (day 24-28) after the start of feeding the
test diets in male rats (experiement 1). Each value represents the mean ± standard error (n = 8). P
values estimated by two-way analysis of variance (Time, Diet and Time x Diet were < 0.001, <
0.001, 0.005, respectively). Values not sharing a letter are significantly different, P < 0.05. FOS:
Fructooligosaccharide, DFA: Difructose anhydride III, MAL: Maltitol, MEL: Melibiose, CEL:
Cellobiose
19

FIG. 4 Calcium absorption rate in sham-operated and ovariectomized female rats fed control or
test diets containing 30 g nondigestible oligosaccharide/kg diet for 5 wk after the start of feeding
the test diets (experiment 2). Each value represents the mean ± standard error (n = 8 in the sham
rats; n = 9 in the ovariectomized group). P values estimated by two-way analysis of variance
(Operation, Diet and Operation x Diet were < 0.001, < 0.001, 0.296, respectively). Values not
sharing a letter are significantly different, P < 0.05. FOS: Fructooligosaccharide, DFA:
Difructose anhydride III, MEL: Melibiose
FIG. 5 Magnesium absorption rate in sham-operated and ovariectomized female rats fed control
or test diets containing 30 g nondigestible oligosaccharide/kg diet for 5 wk after the start of
feeding the test diets (experiment 2). Each value represents the mean ± standard error (n = 8 in
the sham rats; n = 9 in the ovariectomized group). P values estimated by two-way analysis of
variance (Operation, Diet and Operation x Diet were 0.156, < 0.001, 0.017, respectively). Values
not sharing a letter are significantly different, P < 0.05. FOS: Fructooligosaccharide, DFA:
Difructose anhydride III, MEL: Melibiose
FIG. 6 Iron absorption rate in sham-operated and ovariectomized female rats fed control or test
diets containing 30 g nondigestible oligosaccharide/kg diet for 5 wk after the start of feeding the
test diets (experiment 2). Each value represents the mean ± standard error (n = 8 in the sham rats;
n = 9 in the ovariectomized group). P values estimated by two-way analysis of variance
(Operation, Diet and Operation x Diet were 0.573, 0.002, 0.566, respectively). Values not sharing
a letter are significantly different, P < 0.05. FOS: Fructooligosaccharide, DFA: Difructose
anhydride III, MEL: Melibiose
20

21
ELEMENT g/kg dietCasein3 250Corn oil 50Mineral mixture4 35Vitamin mixture4 10Choline bitartate 2.5Cellulose 100
TABLE 1COMPOSITION OF STOCKS1 AND THE TEST DIETS2
1
3
4
(CEL).
2
Sucrose To make 1 kgCrystallized cellulose (100 g/kg diet; Avicel PH102, AsahiChemical Industry Co., Ltd., Tokyo, Japan) was added to the
Casein (ALACID; New Zealand Dairy Board, Wellington,
Mineral and vitamin mixtures were prepared according to theAIN-93G formulation.
stock diet.
New Zealand).
Crystallized cellulose (30 g/kg diet) was replaced withfructooligosaccharide(FOS), di-D-fructose anhydride III (DFA III), maltitol (MAL), melibiose (MEL) and cellobiose
Diet n Initial body weight Body weight gain Food intake day 10-14 day 24-28g g g/d
Control 8 214 + 2.96 a 167 + 10.3 ab 25.1 + 0.57 a 15.4 + 0.76 b 18.5 + 0.64 a
FOS 8 214 + 3.98 a 156 + 8.56 ab 22.5 + 0.60 b 13.3 + 0.61 c 10.5 + 0.53 dg
DFA III 8 215 + 5.63 a 162 + 12.1 ab 22.0 + 0.44 b 12.1 + 0.60 cd 10.4 + 0.62 defg
MAL 8 217 + 3.06 a 149 + 6.85 b 22.2 + 0.44 b 12.1 + 0.64 cde 10.7 + 0.48 g
MEL 8 217 + 2.23 a 162 + 7.83 ab 22.1 + 0.49 b 12.0 + 0.36 cdef 9.3 + 0.35 defg
CEL 8 217 + 4.25 a 179 + 6.38 a 23.4 + 0.47 b 12.7 + 0.59 c 10.6 + 0.55 dfg
ANOVA (P value)Time - - -Diet 0.978 0.266 < 0.001Time x Diet - - -
TABLE 2BODY WEIGHT GAIN, FOOD INTAKE, AND FECAL OUTPUT OF RATS FED THE
CONTROL OR TEST DIETS FOR 4 WK1,2 (EXPERIMENT 1)
1 Each value represents mean + standard error of the mean.
Fecal output
dry g/5 days
< 0.001< 0.001< 0.001
FOS: Fructooligosaccharide, DFA: Difructose anhydride III, MAL: Maltitol, MEL: Melibiose, CEL: Cellobiose
2 Values in a column not sharing a superscript differ significantly, P < 0.05.
22

DietDay 10-14 Day 24-28 Day 10-14 Day 24-28 Day 10-14 Day 24-28
Control 9.74 + 0.27 abc 8.10 + 0.60 d 1.46 + 0.07 e 1.74 + 0.09 bcd 27.8 + 1.92 abc 18.8 + 3.26 cd
FOS 10.6 + 0.38 ab 8.83 + 0.54 cd 1.75 + 0.09 bc 1.99 + 0.08 a 33.1 + 2.49 ab 24.6 + 2.63 bcd
DFA III 10.3 + 0.30 abc 11.1 + 0.53 a 1.62 + 0.04 cde 1.93 + 0.10 ab 37.5 + 1.36 a 31.7 + 1.92 ab
MAL 9.76 + 0.48 abc 9.12 + 0.38 bcd 1.51 + 0.04 de 1.79 + 0.06 abc 25.7 + 3.32 bc 16.8 + 2.51 d
MEL 10.2 + 0.13 abc 10.2 + 0.48 abc 1.63 + 0.04 cde 1.88 + 0.09 ab 29.6 + 2.10 ab 28.7 + 4.51 b
CEL 10.4 + 0.43 ab 8.10 + 0.49 d 1.63 + 0.06 cde 1.70 + 0.08 bcde 26.5 + 1.35 bc 6.19 + 3.21 e
ANOVA (P value)TimeDietTime x Diet
FOS: Fructooligosaccharide, DFA: Difructose anhydride III, MAL: Maltitol, MEL: Melibiose, CEL: Cellobiose
2 Values in a column not sharing a superscript differ significantly, P < 0.05.
NET CALCIUM, NET MAGNESIUM, AND NET IRON ABSORPTION IN RATS FED THETABLE 3
CONTROL OR TEST DIETS FOR 4 WK 1,2 (EXPERIMENT 1)
1 Each value represents mean + standard error of the mean.
0.024
< 0.0010.0040.007 0.618
0.008< 0.001 < 0.001
<0.001
mmol/5 days mmol/5 days µmol/5 days
Net Ca absorption Net Mg absorption Net Fe absorption
23

Diet
ControlFOSDFA IIIMALMELCEL
ANOVA P value
FOS: Fructooligosaccharide, DFA: Difructose anhydride III, MAL: MaltitolMEL: Melibiose, CEL: Cellobiose
1 Each value represents mean + standard error of the mean.2 Values in a column not sharing a superscript differ significantly, P < 0.05.
< 0.001 < 0.001 < 0.001
TABLE 4WEIGHT OF THE CECAL WALL, CECAL CONTENTS, AND THE pH OF
THE CECAL CONTENTS OF RATS FED CONTROL OR TEST DIETS FOR 4 WK 1,2 (EXPERIMENT 1)
1.01 + 0.06 c
wet g/100 g body weight
0.21 + 0.01 bc
0.15 + 0.01 d
1.71 + 0.11 b
0.78 + 0.09 cd
0.14 + 0.01 d
6.40 + 0.08 bc
6.24 + 0.10 cd
6.61 + 0.20 b
0.23 + 0.02 b 5.76 + 0.06 e
0.27 + 0.02 a 5.95 + 0.04 de
2.05 + 0.17 a
1.65 + 0.18 b
0.19 + 0.01 c
7.22 + 0.12 a
Cecal wall Cecal contents pHwet g/100 g body weight
0.53 + 0.06 c
24

Succinic acid Lactic acid Acetic acid Propionic acid n-butyric acid Total SCFA 3 Total organic acid 4
Control 30.0 + 7.60 b 7.58 + 0.83 c 53.8 + 8.51 b 7.26 + 1.34 b 6.77 + 1.43 c 70.9 + 11.3 c 108 + 19.0 e
FOS 11.1 + 4.27 b 469 + 68.8 a 54.8 + 14.3 b 17.0 + 2.52 b 1.26 + 0.66 c 73.0 + 16.5 c 554 + 71.3 a
DFA III 67.7 + 32.7 a 21.8 + 2.12 c 153 + 16.4 a 48.0 + 12.4 a 25.2 + 4.41 b 228 + 29.3 a 317 + 33.7 c
MAL 36.6 + 9.25 ab 14.3 + 2.11 c 63.6 + 6.89 b 16.8 + 2.16 b 53.9 + 8.82 a 138 + 13.8 b 189 + 17.4 de
MEL 2.07 + 1.05 b 344 + 26.6 b 48.2 + 6.87 b 11.2 + 2.46 b 4.37 + 1.27 c 64.7 + 7.85 c 411 + 33.3 b
CEL 23.6 + 9.38 b 84.6 + 35.4 c 58.3 + 7.88 b 11.6 + 3.48 b 21.7 + 4.28 b 93.9 + 14.6 bc 202 + 35.0 d
ANOVA P value 0.085 < 0.001 < 0.001 < 0.001 < 0.001 < 0.001 < 0.001
FOS: Fructooligosaccharide, DFA: Difructose anhydride III, MAL: Maltitol, MEL: Melibiose, CEL: Cellobiose
and n-valeric acid.
1 Each value represents mean + standard error of the mean.2 Values in a column not sharing a superscript differ significantly, P < 0.05.
4 Total organic acid includes SCFAs, succinic and lactic acids.
3 Total SCFA: sum of acetic acid, propionic acid, n-butyric acid, iso-butyric acid, iso-valeric acid,
µmol / cecum contents
TABLE 5CONCENTRATIONS OF SCFA AND OTHER ORGANIC ACIDS IN THE CECAL CONTENTS
OF RATS FED CONTROL OR TEST DIETS FOR 4 WK 1,2 (EXPERIMENT 1)
25

n Initial body weight Body weight gain Food intake Fecal output Uterine weightg g g/d dry g/5 days g/100 g body weight
Sham Control 8 157 + 3.28 98.8 + 4.86 c 18.9 + 0.29 d 5.10 + 0.15 bc 0.23 + 0.03 ab
FOS 8 156 + 4.02 93.0 + 7.22 c 17.9 + 0.21 de 5.15 + 0.37 bc 0.20 + 0.02 b
DFA III 8 158 + 2.38 87.9 + 4.16 c 17.2 + 0.16 e 4.85 + 0.33 c 0.23 + 0.02 ab
MEL 8 156 + 2.90 94.8 + 7.15 c 18.3 + 0.21 d 4.60 + 0.33 c 0.25 + 0.02 a
Ovariectomized Control 9 162 + 2.00 167 + 6.77 ab 22.0 + 0.39 ab 5.79 + 0.39 ab 0.02 + 0.01 c
FOS 9 162 + 2.86 175 + 7.28 a 22.7 + 0.46 a 6.13 + 0.29 a 0.02 + 0.01 c
DFA III 9 162 + 1.45 154 + 4.00 b 20.7 + 0.33 c 5.71 + 0.26 ab 0.02 + 0.01 c
MEL 9 162 + 2.89 158 + 5.60 b 21.5 + 0.45 bc 5.39 + 0.25 abc 0.02 + 0.01 c
ANOVA (P value)Operation 0.008 < 0.001 < 0.001 0.005 < 0.001Diet 0.979 0.108 < 0.001 0.207 0.359Operation x Diet 0.966 0.328 0.046 0.371 0.328
FOS: Fructooligosaccharide, DFA: Difructose anhydride III, MAL: Maltitol, MEL: Melibiose, CEL: Cellobiose
2 Values in a column not sharing a superscript differ significantly, P < 0.05.
TABLE 6INITIAL BODY WEIGHT, BODY WEIGHT GAIN, FOOD INTAKE, FECAL OUTPUT AND UTERINE
WEIGHT OF RATS FED THE CONTROL OR TEST DIETS FOR 5 WK1,2 (EXPERIMENT 2)
1 Each value represents mean + standard error of the mean.
26
Diet Net Ca absorption Net Mg absorption Net Fe absorptionmmol/5 days mmol/5 days µmol/5 days
Sham Control 7.27 + 0.28 bc 1.20 + 0.04 c 7.62 + 1.62 b
FOS 6.02 + 0.20 d 1.11 + 0.04 c 9.72 + 2.48 b
DFA III 7.05 + 0.22 c 1.22 + 0.03 c 15.5 + 2.52 b
MEL 7.80 + 0.17 abc 1.27 + 0.05 bc 14.0 + 1.92 b
Ovariectomized Control 7.30 + 0.36 bc 1.20 + 0.09 c 11.3 + 0.94 b
FOS 7.11 + 0.30 c 1.46 + 0.09 a 13.0 + 1.47 b
DFA III 8.15 + 0.27 a 1.49 + 0.06 a 21.5 + 2.78 a
MEL 7.88 + 0.19 ab 1.42 + 0.03 ab 13.9 + 1.65 b
ANOVA (P value)Operation 0.003 < 0.001 0.041Diet < 0.001 0.073 < 0.001Operation x Diet 0.062 0.043 0.481
FOS: Fructooligosaccharide, DFA: Difructose anhydride III, MAL: Maltitol, MEL: Melibiose, CEL: Cellobiose
2 Values in a column not sharing a superscript differ significantly, P < 0.05.
TABLE 7NET CALCIUM, NET MAGNESIUM, AND NET IRON ABSORPTION IN RATS
FED THE CONTROL OR TEST DIETS FOR 5 WK 1,2 (EXPERIMENT 2)
1 Each value represents mean + standard error of the mean.
27
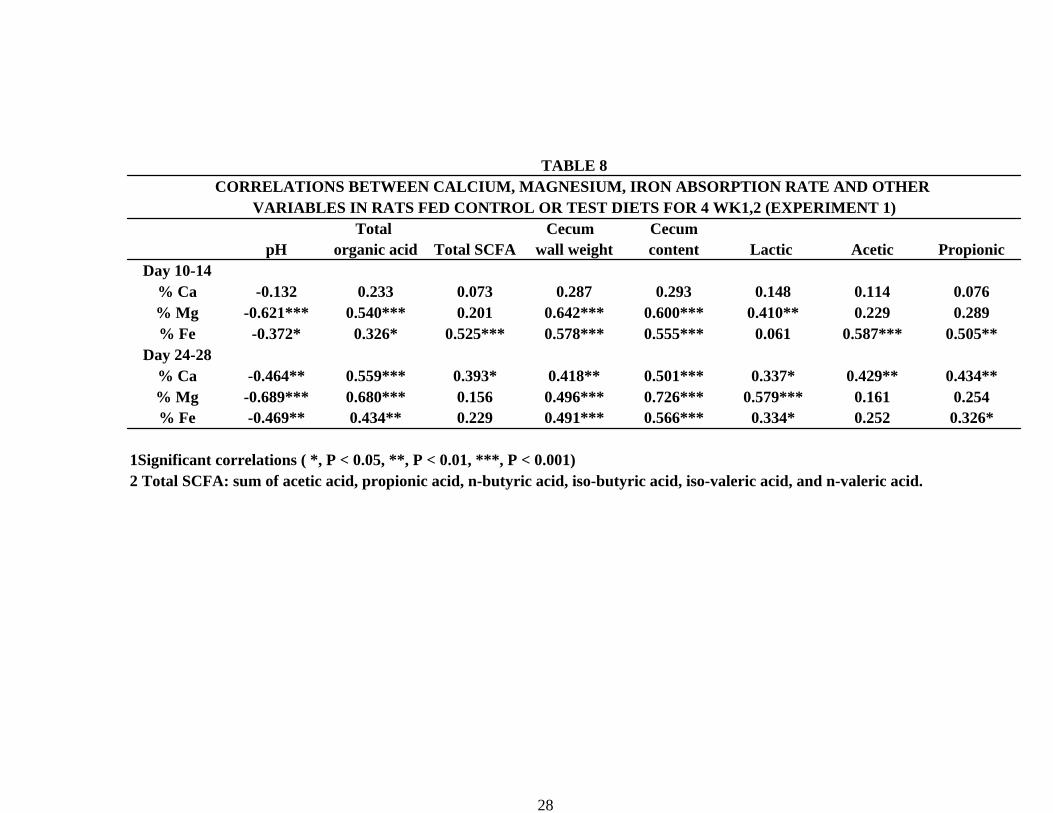
TABLE 8CORRELATIONS BETWEEN CALCIUM, MAGNESIUM, IRON ABSORPTION RATE AND OTHER
VARIABLES IN RATS FED CONTROL OR TEST DIETS FOR 4 WK1,2 (EXPERIMENT 1)Total Cecum Cecum
pH organic acid Total SCFA wall weight content Lactic Acetic PropionicDay 10-14
% Ca -0.132 0.233 0.073 0.287 0.293 0.148 0.114 0.076% Mg -0.621*** 0.540*** 0.201 0.642*** 0.600*** 0.410** 0.229 0.289% Fe -0.372* 0.326* 0.525*** 0.578*** 0.555*** 0.061 0.587*** 0.505**
Day 24-28% Ca -0.464** 0.559*** 0.393* 0.418** 0.501*** 0.337* 0.429** 0.434**% Mg -0.689*** 0.680*** 0.156 0.496*** 0.726*** 0.579*** 0.161 0.254% Fe -0.469** 0.434** 0.229 0.491*** 0.566*** 0.334* 0.252 0.326*
1Significant correlations ( *, P < 0.05, **, P < 0.01, ***, P < 0.001)2 Total SCFA: sum of acetic acid, propionic acid, n-butyric acid, iso-butyric acid, iso-valeric acid, and n-valeric acid.
28

29

0
20
40
60
80
100
1
Ca
abso
rptio
n ra
te (%
)
DAY 24-28
abc ab
a ab a ab
e
cd ab
bc ab de
CON FOS DFA MAL MEL CEL DAY 10-14
CON FOS DFA MAL MEL CEL
FIG. 1
30

0
20
40
60
80
100
Mg
abso
rptio
n ra
te (%
)
e
c c d cd
e
a bc c ab d
DAY 24-28CON FOS DFA MAL MEL CEL
DAY 10-14
FIG. 2
CON FOS DFA MAL MEL CEL
31

0
20
40
60
Fe a
bsor
ptio
n ra
te (%
)
bc
aba
bc bc c
d
c bc
d
bc
e
FIG. 3
DAY 24-28CON FOS DFA MAL MEL CEL
DAY 10-14
CON FOS DFA MAL MEL CEL
32

0
20
40
60
80
100
Ca
abso
rptio
n ra
te (%
)
c c ab a
d dbc bc
CON FOS DFA MEL
SHAM
FIG. 4
CON FOS DFA MEL
OVX
33
0
20
40
60
80
100
Mg
abso
rptio
n ra
te (%
) b ab ab ab
c
ab a ab
FIG. 5
CON FOS DFA MEL
SHAM
CON FOS DFA MEL
OVX
34
0
10
20
30
40
50
Fe a
bsor
ptio
n ra
te (%
)
c
bc
ababc
c bc
a
bc
FIG. 6
CON FOS DFA MEL
SHAM
CON FOS DFA MEL
OVX
35

22