Promoting environmental and social benefits of REDD+ · PDF filePeru through spatial analysis...
40
Promong environmental and social benefits of REDD+ in Peru through spaal analysis How maps can support the achievement of mulple policy goals
Transcript of Promoting environmental and social benefits of REDD+ · PDF filePeru through spatial analysis...
Promoting environmental and social benefits of REDD+ in Peru through spatial analysisHow maps can support the achievement of multiple policy goals

The United Nations Environment Programme World Conservation Monitoring Centre (UNEP-WCMC) is the specialist biodiversity assessment centre of the United Nations Environment Programme (UNEP), the world’s foremost intergovernmental environmental organisation. The Centre has been in operation for over 30 years, combining scientific research with practical policy advice.
This publication may be reproduced for educational or non-profit purposes without special permission, provided acknowledgement to the source is made. Reuse of any figures is subject to permission from the original rights holders. No use of this publication may be made for resale or any other commercial purpose without permission in writing from UNEP. Applications for permission, with a statement of purpose and extent of reproduction, should be sent to the Director, UNEP-WCMC, 219 Huntingdon Road, Cambridge, CB3 0DL, UK.
ACKNOWLEDGEMENTSThis brochure has been produced by UNEP-WCMC in collaboration with the Ministry for the Environment of Peru (MINAM), as part of the REDD-PAC project under the International Climate Initiative (IKI). The German Federal Ministry for the Environment, Nature Conservation, Building and Nuclear Safety supports this initiative on the basis of a decision adopted by the National Parliament (the German Bundestag).
We would like to thank the REDD+ MINAM Project (funded by the Gordon and Betty Moore Foundation and the German Development Bank (KfW)), Conservation International and the Forest Carbon, Markets and Communities Programme (funded by USAID) for support provided to the joint working session between UNEP-WCMC and MINAM, as well as to the development of the report. Personal thanks go to Lucas Dourojeanni (MINAM), Valerie Kapos and Lera Miles (UNEP-WCMC), Giovanna Egas (MINAM) and all participants of the working session, for their insight, technical contributions and/or feedback on the draft.
DISCLAIMERThe contents of this report do not necessarily reflect the views or policies of UNEP, contributory organisations or editors. The designations employed and the presentations of material in this report do not imply the expression of any opinion whatsoever on the part of UNEP or contributory organisations, editors or publishers concerning the legal status of any country, territory, city area or its authorities, or concerning the delimitation of its frontiers or boundaries or the designation of its name, frontiers or boundaries. The mention of a commercial entity or product in this publication does not imply endorsement by UNEP.
CONTRIBUTORSMariella Güisa and Andrea Calderón-UrquizoProyecto REDD+ MINAMAvenida Dos de Mayo 1545, 5th floorSan Isidro, Lima, Peru
CITATION Epple, C., Thorley, J., Güisa, M., Calderón-Urquizo, A., Walcott, J., Väänänen, E., Bodin, B., Woroniecki, S., Salvaterra, T. and Mant, R. (2014) Promoting environmental and social benefits of REDD+ in Peru through spatial analysis. How maps can support the achievement of multiple policy goals. UNEP-WCMC, Cambridge, UK.
Available online at: wcmc.io/Peru_REDD_environmental_and_social_benefits
© 2014 United Nations Environment Programme
UNEP World Conservation Monitoring Centre219 Huntingdon RoadCambridge, CB3 0DLUnited KingdomTel: +44 (0) 1223 277314Fax: +44 (0) 1223 277136Email: [email protected]: www.unep-wcmc.org
Cordula Epple, Julia Thorley, Judith Walcott, Elina Väänänen, Blaise Bodin, Stephen Woroniecki, Tania Salvaterra and Rebecca MantUNEP World Conservation Monitoring Centre 219 Huntingdon Road, Cambridge, CB3 0DL, UK
UNEP promotes environmentallysound practices globally and in its own activities.
Our printing and distribution policy aims to reduce UNEP’s carbon footprint. This publication is printed on Carbon
Balanced, FSC-certified paper, and is made from 10% recovered fibre. It is manufactured under the international ISO 14001
standard, EMAS (Eco-Management & Audit Scheme) and the IPPC (Integrated Pollution Prevention and Control) regulation.

Promoting environmental and social benefits of REDD+ in Peru through spatial analysis
How maps can support the achievement of multiple policy goals

COVER IMAGE CREDITSFront: Left: Map showing importance of forest for soil erosion control and water regulation in relation to biomass carbon. © UNEP-WCMC. Middle: Boy from the Bélgica community presenting his fish catch. © Proyecto REDD+ MINAM. Right: Amazon parrot. © Proyecto REDD+ MINAM
Licences for images throughout with CC BY 2.0http://creativecommons.org/licenses/by/2.0/legalcode
Licences for images throughout with CC BY-NC-ND 2.0https://creativecommons.org/licenses/by-nc-nd/2.0/
Back: Top: Burnt tree stumps on recently cleared land in Madre de Dios province. © Proyecto REDD+ MINAM. Middle: Man transporting bananas. © Proyecto REDD+ MINAM. Bottom: Dredged material on river bank. © Proyecto REDD+ MINAM

Contents1 Introduction ................................................................................................................................12 Preparations for REDD+ in Peru ..................................................................................................33 Potential synergies between REDD+ and other environmental policies and strategies in Peru ..44 Using spatial information to support the achievement of multiple environmental and social
benefits from REDD+ .................................................................................................................94.1 Identification of appropriate areas for different types of REDD+ actions ................................94.2 Other possible uses of spatial information in the context of REDD+ .....................................325 Conclusions ............................................................................................................................... 32

Promoting environmental and social benefits of REDD+
1 IntroductionDeforestation and forest degradation are among the main processes contributing to anthropogenic climate change. Overall land-use change, which includes the processes of deforestation as well as forest regrowth, has made an estimated net contribution of 10% to global anthropogenic carbon dioxide emissions in the past decade. Thus, land use change is second only to burning of fossil fuels as a source of emissions. Gross carbon dioxide emissions from tropical deforestation and forest degradation are about double the net global emissions from land use change because of the presence of significant regrowth in some regions that compensates for about half of the gross emissions (IPCC 2013). In line with these findings, the Conference of the Parties of the United Nations Framework Convention on Climate Change (UNFCCC) has encouraged developing country Parties to contribute to mitigation actions in the forest sector through five activities generally referred to as REDD+: reducing emissions from deforestation and forest degradation, conservation of forest carbon stocks, sustainable management of forests, and enhancement of forest carbon stocks (see Figure 1).
If designed well, actions to implement REDD+ activities have the potential to deliver a range of environmental and social benefits in addition to climate change mitigation. Environmental benefits from securing the many ecological functions of forests can include biodiversity conservation and the provision of ecosystem services, such as water regulation, erosion control and the supply of timber
and non-timber forest products. On the social side, some of the possible benefits from REDD+ implementation are improved forest governance and more inclusive participation in local decision-making on land use, and in some cases direct economic contributions to livelihoods. However, depending on how actions for REDD+ are planned and implemented, they could also pose certain risks. For example, if forests are protected from conversion to agriculture, but the drivers of conversion are not addressed, other ecosystems are likely to become threatened as this pressure is displaced, and local livelihoods could be affected.
The achievement of multiple social and environmental benefits - while avoiding risks - can make REDD+ a more attractive option for different stakeholder groups, including the local communities who live in forest areas. It can also increase the long-term sustainability of REDD+. For example, an increasing body of evidence indicates that species diversity can promote ecosystem functioning (Gamfeldt et al. 2013, Hooper et al. 2012, Tilman et al. 2012, Hinsley et al. 2014). This means that forests that are managed in a way that maintains and enhances biodiversity may be more resilient to future pressures from human activities or climate change. Increased resilience of forests in its turn is likely to lead to greater permanence of their carbon stocks.
Figure 1: REDD+ activities as agreed under the UNFCCC
Aiming for a range of positive outcomes is also in line with the safeguards for REDD+ that were agreed at the 16th Conference of the Parties (COP 16) to the UNFCCC in Cancun, which include a request to countries to promote and support the use of REDD+ actions to enhance social and environmental benefits1. At COP 18, Parties further decided that the work programme on results-based finance for REDD+ should address options for scaling up and improving the effectiveness of REDD+ finance, taking into account a wide variety of sources, including ways to 1 Dec. 1/CP.16, Appendix I para. 2, see http://unfccc.int/resource/docs/2010/cop16/eng/07a01.pdf
1
REDD+Reducing Emissions from Deforestation and forest Degradation
+Conservation of forest carbon stocksSustainable management of forestsEnhancement of forest carbon stocks
=
Peruvian cloud forest. © AJancso, 2012. Used under license from Shutterstock.com

in Peru through spatial analysis 2
incentivize the achievement of ‘non-carbon benefits’2. These discussions provide an opportunity to highlight the many possible advantages of REDD+, which could support wide adoption of the mechanism.
Peru has a strong potential for achieving multiple benefits from REDD+, due to the importance of forests as part of the country’s natural heritage and as a key resource for the economic and spiritual well-being of local communities, particularly in the Amazon region. In addition to being a major carbon store and sink for carbon dioxide from the atmosphere, Peru’s forests provide a wide range of other ecosystem services. These include regulating hydrological flows and the supply of clean water, protecting against soil erosion and resulting sedimentation, providing timber and non-timber forest products, offering habitat for species that contribute to pollination and natural pest control, and enhancing the scenic beauty and recreational value of the landscape. The importance of forests is also recognized in the context of the national initiative for valuation of the country’s natural heritage, including biodiversity and ecosystem goods and services3. Deforestation and forest degradation in Peru not only threaten the continued availability of these natural assets, but may also increase the country’s vulnerability to climate change.
Thus, planning for a variety of benefits from REDD+ can help the country to align REDD+ objectives with existing policy objectives related to the management of natural resources and socio-economic development. One of the aims of Peru’s emerging National Strategy on Forests and Climate Change (see section 2) is to create synergies between different instruments, strategies and planning documents,
2 Dec. 1/CP.18, para. 25-29, see http://unfccc.int/resource/docs/2012/cop18/eng/08a01.pdf3 See http://www.minam.gob.pe/patrimonio-natural/proyectos-de-valoracion-del-patrimonio-natural/# (accessed 2 October 2014)
in order to reduce emissions and enhance carbon stocks, as well as to create co-benefits related to biodiversity, ecosystem services, livelihoods, and social inclusion, among others.
Spatial information can be of great relevance to the development of strategies and implementation plans for REDD+, as the suitability of different areas for specific types of REDD+ actions, as well as for competing land uses, varies. The biophysical, socio-economic and cultural conditions that determine the possible benefits and risks are also unevenly distributed in space (see section 4).
The present report shows some examples of how analyses of spatial data can support REDD+ planning processes and coherent implementation of different policies related to the use of land and natural resources. It presents the outcomes of a series of spatial analyses to support multiple benefits from REDD+ that were conducted jointly by the United Nations Environment Programme World Conservation Monitoring Centre (UNEP-WCMC) and Peru’s Ministry for the Environment (MINAM, through its REDD+ MINAM Project) in 2014. The report also draws on other recent work that has been carried out in Peru as part of the preparations for REDD+ at the national level, including a study on potential priority areas for REDD+, and explains how the results presented can feed back into these ongoing processes.
It is hoped that the document will serve to promote the preparations for REDD+ in Peru, by highlighting some of the potential benefits that can be achieved through REDD+ actions, exploring the possible contributions that REDD+ can make to the achievement of other policy goals and commitments, and providing inspiration for future work on these issues.
Involving local communities in planning processes is important for the success of initiatives addressing the management of forests and natural resources. Discussion on land use zonation in a community in San Martín. © Proyecto REDD+ MINAM.

Promoting environmental and social benefits of REDD+3
2 Preparations for REDD+ in PeruAs an initial step towards preparing for REDD+ implementation in the country, Peru has submitted a REDD+ Readiness Preparation Proposal (R-PP) to the Forest Carbon Partnership Facility (FCPF) in 2011; this was revised in 2013. The R-PP document contains general information about land use patterns, drivers of deforestation, public consultation processes and possible institutional arrangements related to REDD+ within the country. Peru also participates in the Forest Investment Programme (FIP)4, whose principal objective is to assist developing countries in their efforts to reduce emissions from deforestation and forest degradation by providing initial financing for relevant reforms. An Investment Plan for the Forest Investment Programme in Peru (PI-FIP) was prepared in 2013. REDD+-relevant activities supported by the FIP are being undertaken at the national level and in the regions of San Martin and Loreto, Ucayali and Madre de Dios. The findings from these pilot activities and the documents prepared for the FCPF and the FIP have informed the current work on developing a national REDD+ strategy.
Important ongoing processes in the development of an institutional framework for REDD+ include a number of institutional and legal reforms, the establishment of a National Forest Inventory and a system for Measurement, Reporting and Verification (MRV) of forest-based greenhouse gas emissions and removals, as well as the creation of structures 4 The Forest Investment Programme is a programme of the Strategic Climate Fund, one of two funds within the framework of the Climate Investment Funds established by the World Bank and the Regional Development Banks. The aim of the Climate Investment Funds is to support policies, programmes and projects for climate change mitigation and adaptation.
for stakeholder participation and capacity-building. Particular emphasis has been placed on facilitating the informed participation of indigenous communities and other local actors in the development of REDD+ activities. Peru is also engaged in developing a national approach to the UNFCCC safeguards for REDD+. This process can draw on earlier work carried out on the design of a Strategic Environmental and Social Assessment (SESA) to feed into an Environmental and Social Management Framework (ESMF) in accordance with the FCPF’s approach to managing social and environmental risks.
Peru’s efforts to achieve “REDD+ readiness” are closely linked to the ongoing development of a National Strategy on Forests and Climate Change, which includes a National Action Plan for REDD+. This strategy aims to consolidate the progress made in the design of arrangements for REDD+ in Peru, particularly in the broader context of forest management and conservation, as well as efforts to achieve green growth. Simultaneously, the strategy aims to enhance synergies with other instruments from various sectors to reach the ultimate objectives of reducing greenhouse gas emissions and increasing carbon stocks. It is further intended to promote co-benefits related to biodiversity, livelihoods and other ecosystem services. The strategy will set out the legal and institutional framework for the implementation of REDD+ activities at national and subnational levels (through a nested jurisdictional approach). It will also contribute to the development of economic and financial frameworks to promote public and private investments in REDD+.
View of the Huallaga river in San Martín province, Peru. © Proyecto REDD+ MINAM.

in Peru through spatial analysis 4
3 Potential synergies between REDD+ and other environmental policies and strategies in Peru
As described above, REDD+ actions that deliver multiple benefits and avoid social and environmental risks can contribute to a range of policy goals beyond climate change mitigation, including the goals of national strategies and action plans for the implementation of several international environmental agreements. In the case of Peru, national policies that are particularly relevant for REDD+ include those related to climate change mitigation and adaptation and biodiversity conservation.
The National Strategy on Climate Change (ENCC) was first developed in 2003 and later revised in 2009. A second update of the strategy has been developed in draft form and is currently going through the process of approval. The ENCC provides guidance and information on climate change for national, sectoral and regional development plans and projects, including those that relate to REDD+. It recognises that deforestation is a major source of greenhouse gas emissions at the national level. The strategy suggests measures for managing emissions, including by managing forests for increased carbon sequestration, reducing deforestation, and addressing shifting agriculture. Furthermore, the strategy aims to reduce the adverse impacts of climate change through integrated studies on vulnerability and adaptation, information dissemination, as well as a number of practical adaptation approaches such as the protection of vulnerable ecosystems. Among the ecosystems considered to be vulnerable, forests are treated as a priority. Activities based on a more sustainable management of forest ecosystems are also included in the sections of the strategy that are aimed at reducing the vulnerability of socio-economic systems. Some
examples of relevant strategic objectives and targets from Peru’s National Climate Change Strategy are included in Box 1.
It is important to note that the possible synergies between REDD+ and climate change adaptation work in both directions. Changes in physical processes, environmental conditions and natural resources caused by climate change (e.g. changes to temperature, rainfall, glacial melt, etc.) can directly affect forest ecosystems, potentially leading to their degradation or in some cases even causing forest die-back. This provides a potential long term risk to the permanence of results from REDD+ actions and may at the same time threaten long term investment in forestry activities. (See Box 2 for an overview of expected climate change impacts that are relevant to the implementation of REDD+ in Peru.)
Climate change can also cause indirect pressures on forests due to factors like migration of climate-displaced people, and declining agricultural productivity. All of these factors in turn threaten the resilience of ecosystem services from forest landscapes that may include carbon sequestration and storage, as well as other services such as freshwater provision or soil erosion control that form the basis for human livelihoods and well-being. There is thus a serious risk of negative feedback effects between climate change impacts on forests and people. Even adaptation actions that do not directly address forest ecosystems can therefore result in reduced human pressure on forests and help to break this feedback loop, with benefits for REDD+.
Box 1: Selected objectives and targets from the National Climate Change Strategy (ENCC)Strategic Objective 4.3: Reducing the rate of deforestation as a national policy with a results-based indicator by 2010.• Target 4.3.1:Promoting sustainable forest management systems for the settlement of migrant farmers.Strategic Objective 9.1: Reducing the vulnerability of forest ecosystems to climate change.• Target 9.1.1: National programme for prevention, mitigation and containment of forest fires.• Target 9.1.2: Studies to support the integrated management of pests and diseases in forest ecosystems at risk from
climatic stress.• Target 9.1.3: Synergies with the National Action Plan to Combat Desertification in forest ecosystems.Strategic Objective 9.2: Reducing the vulnerability of other ecosystems and socio-economic systems.• Target 9.2.1: Agroforestry systems to reduce the pressure on forests from shifting agriculture.• Target 9.2.2: Proposals for legal norms that allow for the implementation of studies to valuate ecosystem services
from forests.• Target 9.2.3: Forest Management Programmes in mountain ecosystems.• Target 9.2.4: Urban forestry programme.Strategic objective 9.3: Enhance carbon capture in existing ecosystems.• Target 9.3.1: Monitoring of forest management plans.• Target 9.3.2: Reforestation and afforestation programmes.• Target 9.3.3: Support to institutions involved in programmes to prevent deforestation.• Target 9.3.4: Programme for efficient production and use of firewood and other forest products.

Promoting environmental and social benefits of REDD+5
REDD+ in its turn can best fulfill its role in climate change adaptation if activities are designed to enhance ecosystem services that reduce human vulnerability to climate change, such as water regulation and soil erosion control or provision of a wide range of forest products that can support income diversification. In times of hardship the importance of traditional uses of natural systems and resources may increase (for example, the use of non-timber forest products can provide a safety net for people when crops fail). The use of biodiversity and ecosystem services for adaptation (i.e. ecosystem-based adaptation, EbA) rather than hard-infrastructural options can often be combined with actions to conserve and enhance carbon stocks under REDD+.
Ecosystem-based adaptation approaches are currently being promoted in Peru through pilot initiatives addressing both high mountain ecosystems and the Amazonian rainforest.
The national policies for biodiversity conservation are closely linked to Peru’s implementation of the Convention on Biological Diversity (CBD). National implementation of the CBD is guided by the Strategic Plan of the Convention for the period 2011-2020, which has been adopted by all parties to the CBD and is structured around the 20 “Aichi Biodiversity Targets”. Several of these targets have close links
with potential REDD+ activities. For example, Aichi Target 5 calls for the rate of loss of all natural habitats, including forests, to be at least halved and where feasible brought close to zero; this can tie in with REDD+ activities to reduce deforestation. Another example is Aichi Target 12, which aims to prevent the extinction of known threatened species, and to improve and sustain their conservation status, by 2020. REDD+ activities can contribute to achieving this target, especially with regard to forest species, if the actions help to maintain important habitat for these species, or promote their sustainable use.
In response to the adoption of the CBD Strategic Plan at the global level, Peru has initiated a process to revise and update its National Biodiversity Strategy and Action Plan (NBSAP), in a way that reflects the Aichi Biodiversity Targets and translates them into the national context. The draft National Biodiversity Strategy to 2021 and Biodiversity Action Plan 2014-2018 is currently going through the process of approval. It includes a number of targets and activities which could provide synergies with REDD+. For example, Target 7 of the draft NBSAP aims to reduce the degradation of ecosystems, with an emphasis on forests. The NBSAP also contains references to restoring degraded ecosystems, as well as to the sustainable use of biodiversity, which could link to REDD+ activities to enhance forest carbon
Box 2: Expected climate change impacts that are relevant to the implementation of REDD+ in PeruClimate change impacts in Peru are likely to be locally and regionally differentiated, as in addition to global processes there is a strong influence of topography and vegetation cover (GIZ et al. 2011). While annual average temperature has risen over the last 40 years across the whole country and is expected to continue to do so, regionally differentiated changes in rainfall patterns have been observed and are predicted for the future. Climate change is likely to have particularly severe impacts on the Andean region, including high altitude glaciers and the streams fed by them. As glaciers provide a large share of the water requirements of the country, this will have serious implications in terms of water scarcity (MINAM 2010). In the Amazonian region, impacts will be differentiated, but changes to rainfall, temperature and the frequency of extreme events are already being observed, alongside the effects of changing ecological patterns such as changing seasons (GIZ et al. 2011). In a worst case scenario, average temperatures could rise by 2°C as early as 2050, with a drastic reduction of rainfall in the winter months (Beaumont 2011). These changes are likely to influence the flows of provisioning and regulating ecosystem services that underpin the adaptive capacity of Amazonian communities.
Cloud forests such as this one are particularly vulnerable to climate change. In some parts of Peru, rainfall patterns are expected to change, and temperatures will most likely increase, severely threatening these important ecosystems. Picture by Geoff Gallice. (CC BY 2.0). https://flic.kr/p/ejays2

in Peru through spatial analysis 6
stocks and manage forests sustainably. Further actions promoted by the NBSAP in order to improve institutional capacity, public participation, and private sector involvement in natural resource management, could provide synergies with social and governance-related aspects of REDD+ implementation. A more detailed overview of some of the potential synergies between REDD+ actions and the Aichi Biodiversity Targets, as well as the targets and activities of Peru’s NBSAP, can be obtained from Table 1.
Other environmental policy goals that REDD+ actions can contribute to include the sustainable management and conservation of water resources and soils, as set out in Peru’s National Environmental Policy. Addressing these goals also allows for synergies with the National Action Programme to Combat Desertification, which was developed as part of Peru’s implementation of the United Nations Convention to Combat Desertification (UNCCD). Finally, by supporting the continued provision of ecosystem services that are important for the economic activities of private sector stakeholders and local communities, REDD+ can tie in with ongoing efforts to promote sustainable economic development and the transition to an economy that achieves “green growth”5.
If actions to implement REDD+ and other environmental policies are undertaken in a way that is mutually supportive, this can also contribute to addressing the UNFCCC Cancun safeguard (e), which requests that REDD+ measures should be compatible with the conservation of natural forests and biodiversity, and that activities should be used to incentivise the protection of natural forests and their ecosystem services and to enhance other social and environmental benefits. The Aichi Biodiversity Targets offer further complementarity with the Cancun safeguards with regard to stakeholder participation and the effective involvement of indigenous people and local communities (Miles et al. 2013).
At the same time, it is important to keep in mind that the potential synergies do not necessarily extend to all aspects of the policy areas mentioned above. For example, while REDD+ holds promise for biodiversity conservation, and biodiversity conservation actions can support REDD+, it is unlikely that REDD+ actions can fully contribute to the achievement of all of the Aichi Biodiversity Targets. This is because the Targets address ecosystems other than forests, and climate change mitigation actions in forest areas might not
5 See http://www.minam.gob.pe/patrimonio-natural/ministerios-de-ambiente-y-trabajo-lanzaran-este-martes-29-la-iniciativa-page-peru-para-la-promocion-del-crecimiento-verde-en-el-peru/ (accessed 2
October 2014)
necessarily benefit all elements of forest biodiversity. In some situations, REDD+ could even conflict with efforts to meet the Aichi Targets, for example if pressure on forest land was displaced from one area to another, into other ecosystems or across national boundaries.
Conflicts are also possible between REDD+ and climate change adaptation if REDD+ actions are not designed well. For example, large-scale afforestation and reforestation could reduce water flow and availability for other uses, as well as cause damage to downstream ecosystems. REDD+ actions could also entail changes to use rights that might limit communities’ ability to adapt to climate variability by switching between livelihood options. Such risks need to be taken into account in order to ensure that REDD+ contributes to enhancing rather than reducing the adaptive capacity of ecosystems and communities.
Developing coherent and complementary approaches to the implementation of policies related to climate change mitigation, sustainable management of forests and their ecosystem services, and biodiversity conservation can therefore be important to ensure that mutual benefits are achieved and risks avoided.
REDD+ can provide opportunities for conservation of threatened species. The giant otter (Pteronura brasiliensis) is classified as endangered by the IUCN, as its distribution has been greatly reduced and the wild population is estimated to be below 5,000. Picture by Michelle Bender (CC BY-NC-ND 2.0) https://flic.kr/p/fvT59C

Promoting environmental and social benefits of REDD+7
Table 1: Examples of elements of the Aichi Biodiversity Targets and Peru’s NBSAP targets and activities that offer potential linkages with REDD+ actions including the implementation of safeguardsAichi Biodiversity Targets (CBD Decision X/2)
Elements from the National Biodiversity Strategy to 2021 and Action Plan 2014-2018 of Peru
Linkages with REDD+
Target 2: By 2020, at the latest, biodiversity values have been integrated into national and local development and poverty
reduction strategies and planning processes and are being incorporated into national accounting, as appropriate, and reporting systems.
Activity 95: By the end of 2014, have a multisectoral proposal, which is agreed between the levels of government, for the alignment of different instruments of public management related to biodiversity at the national, regional, and local level.Activity 106: By the end of 2017, a study is finalized that aims to incorporate integrated management of biodiversity and the associated ecosystem services in the different instruments for planning including territorial planning. Activity 108: By the end of 2018, proposals for conservation and sustainable use of biodiversity have been included in at least 10 regional development plans. Activity 137: By the end of 2014, an evaluation of governance related to the management of biodiversity in Peru has been carried out that includes an analysis of governance challenges, as well as related recommendations. The activities identified and prioritized in this diagnostic are implemented annually.Activity 138: By the end of 2014, existing spaces for civil society participation have been strengthened (CONADIB, Regional Environmental Commissions, Local Environmental Commissions, Protected Area Management Commissions, Forest Management Commissions, etc.), particularly those in which representatives of indigenous peoples participate, in order to plan and implement decisions on the management of biological diversity together with all relevant actors.
Dec. 1/CP.16, Guidance for REDD+, recommends that REDD+ activities should be implemented in the context of sustainable development and reducing poverty, while responding to climate change.Processes to integrate biodiversity values and REDD+ objectives into various strategies and planning processes could benefit from being implemented in a coordinated manner.Safeguard e): REDD+ actions are to be consistent with the conservation of biological diversity and used to enhance other social and environmental benefits
Target 3: By 2020, at the latest, incentives, including subsidies, harmful to biodiversity are eliminated, phased out or reformed in
order to minimize or avoid negative impacts, and positive incentives for the conservation and sustainable use of biodiversity are developed and applied, consistent and in harmony with the Convention and other relevant international obligations, taking into account national socio economic conditions.
Target 4: By 2021, five ecosystem services have been put into value, ensuring ecosystem integrity and respect for the indigenous peoples involved, and a similar number of competitive bio-business initiatives have been promoted, preferably oriented towards the biocommerce model, bringing two new products with added value to the market.Activity 37: By early 2015, a set of initiatives (such as the Forest Investment Plan – FIP) is being implemented in order to incentivize the valorization of forest ecosystems at the national level, as well as the reduction of deforestation and forest degradation.Activity 41: By early 2016, there is a system for tracking or monitoring of activities or projects of valorization of ecosystem services, as well as a mechanism for monitoring, reporting and valorization related to REDD+ initiatives.Activity 79: By early 2016, activities have been developed to promote incentives that reduce land use change due to inappropriate practices.
Implementation of REDD+ can involve the creation of incentives for the conservation, sustainable management and/or restoration of forest ecosystems.Safeguard e): REDD+ actions are to be used to incentivize the protection and conservation of natural forests and their ecosystem services.
Target 5: By 2020, the rate of loss of all natural habitats, including forests, is at least halved and where feasible brought close to zero, and degradation and fragmentation is significantly reduced.
Target 7: By 2021, the rate of degradation of ecosystems has been reduced by 5%, with a focus on forests and fragile ecosystems.Activity 74: By mid-2015, a study is carried out on the main causes and activities that degrade ecosystems in Peru, and proposals have been developed in order to improve, if necessary, the National System for Environmental Impact Assessment, taking into account mechanisms to avoid, reduce, mitigate or compensate environmental impacts.Activity 77: By early 2016, sectoral, regional and local measures for supervision and control have been implemented to reduce the degradation of ecosystems, including deforestation.Activity 78: By early 2016, measures of supervision and control have been implemented related to illegal activities or economic transactions that cause degradation of biodiversity, considering as a priority inter alia illegal land use change and illegal mining.
Reducing the rate of deforestation and forest degradation contributes directly to REDD+ objectives.
Target 7: By 2020 areas under agriculture, aquaculture and forestry are managed sustainably, ensuring conservation of biodiversity.
Activity 8: By the second half of 2015, at least ten programmes have been implemented to strengthen the capacities of organized users for the integrated sustainable management of ecosystems and wild plant and animal resources, at national, regional and local level, with active participation of indigenous peoples and local populations in general.Activity 35: By the second half of 2015, sustainable management of forest resources and wild animals has been strengthened, by implementing the activities of the National Plan on Forests and Wild Fauna, and prioritizing, among other issues, community forest management.
Sustainable management of forest areas can contribute directly to REDD+ objectives.

in Peru through spatial analysis 8
Aichi Biodiversity Targets (CBD Decision X/2)
Elements from the draft National Biodiversity Strategy to 2021 and Action Plan 2014-2018 of Peru
Linkages with REDD+
Target 11: By 2020, at least 17 per cent of terrestrial and inland water, and 10 per cent of coastal and marine areas, especially
areas of particular importance for biodiversity and ecosystem services, are conserved through effectively and equitably managed, ecologically representative and well connected systems of protected areas and other effective area-based conservation measures, and integrated into the wider landscapes and seascapes.
Target 1: By 2021, sustainable and effective management of biodiversity is consolidated on at least 17 per cent of the terrestrial realm and 10 per cent of the marine realm under specific modalities of conservation and in situ management.
Conservation and sustainable and effective management of forest areas can contribute directly to REDD+ objectives.
Target 14: By 2020, ecosystems that provide essential services, including services related to water, and contribute to health,
livelihoods and well-being, are restored and safeguarded, taking into account the needs of women, indigenous and local communities, and the poor and vulnerable.
Strategic objective 1: Improve the state of biodiversity and maintain the integrity of the ecosystem services it provides.Activity 42: By the end of 2016, a list is developed that enumerates the ecosystems whose conservation is prioritized because of their provision of ecosystem services, and the necessary activities for their conservation have been proposed.Activity 75: By the end of 2015, incentives have been approved that promote the participation of private actors, including local populations and indigenous peoples in particular, in the rehabilitation of degraded ecosystems.Activity 76: By early 2016, a proposal has been agreed across sectors and between levels of government, for a programme aiming at rehabilitation and restoration for five degraded ecosystems at the national level, and its activites have been incorporated in the relevant budget programmes or in public investment projects of the respective sectors and levels of government. The number of degraded ecosystems considered in the programme increases annually.Activity 80: By mid-2016, at least five public-private partnerships have been developed that facilitate the rehabilitation of degraded ecosystems.
Restoration and safeguarding of forest ecosystems contribute directly to REDD+ objectives.Safeguard e): REDD+ actions are to be used to incentivize the protection and conservation of natural forests and their ecosystem services, and to enhance other social and environmental benefits.
Target 15: By 2020, ecosystem resilience and the contribution of biodiversity to carbon stocks has been enhanced,
through conservation and restoration, including restoration of at least 15 per cent of degraded ecosystems, thereby contributing to climate change mitigation and adaptation and to combating desertification.
Activity 34: By early 2015, a National Strategy on Forests and Climate Change is developed, and the necessary activities for its implementation have been initiated.Activity 72 By early 2015, a start has been made on the participatory development of guidelines and policies for the implementation of Nationally Appropriate Mitigation Actions (NAMAs) for the three main economic activities associated with deforestation and forest degradation.
Enhancing the resilience of forest ecosystems through conservation and restoration can contribute directly to REDD+ objectives.Integrating biodiversity conservation, climate change mitigation and adaptation and combating desertification can be a contribution to safeguard a): actions are consistent with the objectives of national forest programmes and relevant international conventions and agreements.
Target 18: By 2020, the traditional knowledge, innovations and practices of indigenous and local communities relevant for
the conservation and sustainable use of biodiversity, and their customary use of biological resources, are respected, subject to national legislation and relevant international obligations, and fully integrated and reflected in the implementation of the Convention with the full and effective participation of indigenous and local communities, at all relevant levels.
Target 12: By 2021, protection, maintenance and rehabilitation of the traditional knowledge and practices of indigenous peoples and local populations with regard to biodiversity have been improved in the context of effective participation of indigenous peoples and local populations.Activity 114: By mid-2015, at least fifteen studies have been carried out, with due information of the relevant indigenous peoples and local populations where appropriate, about ecosystems and species that are important for conservation in Peru, with an emphasis on revalorization of traditional knowledge, which is used in decision-making about the management of biological diversity with the effective participation of indigenous peoples and local populations.
Safeguard c): respect for the knowledge and rights of indigenous peoples and members of local communities.

Promoting environmental and social benefits of REDD+9
4. Using spatial information to support the achievement of multiple environmental and social benefits from REDD+
4.1 Identification of appropriate areas for different types of REDD+ actions
Spatial information can play an important role in REDD+ decision-making at the national level, as well as in planning specific REDD+ actions. Decisions on where and how to implement REDD+ actions can involve reconciling different demands for land use, addressing trade-offs and prioritizing among various potential benefits that could be achieved through REDD+ implementation, and planning to avoid or minimize possible risks.
In this context, map-based approaches can be used, in a first step, to identify areas with a high potential for avoiding emissions or sequestering carbon, based on information about current and potential carbon stocks, forest cover, and future land use demands and deforestation risk. Information on future deforestation risk can also help to assess the potential environmental benefits of REDD+ actions as compared to a business-as-usual scenario. Evaluation of the potential benefits and risks from REDD+ actions in a specific area can be further supported by information on environmental conditions (such as climate, soils and topography), species distributions, the current state of ecosystems, and the socio-economic situation of the local population. Another important input to spatial planning for REDD+ can be to assess the feasibility of different types of REDD+ actions based on parameters like current land use, opportunity and implementation costs, legal designations, or, where such information can be obtained, cultural preferences.
In connection with the development of a National REDD+ Strategy, the Peruvian Ministry of Environment6 is currently engaged in a process to identify and prioritize potential areas for REDD+ implementation through conservation and sustainable use of forests, based on an analysis of available spatial data related to some of the topics mentioned above. The identification of potential areas for REDD+ implementation is carried out in two stages. While the first stage of prioritization takes place at national scale and leads to the identification of priority districts, the second stage is implemented in the form of a collaborative effort between the national government and the relevant regions
6 through the Project REDD+ MINAM and the National Programme for Forest Conservation
where the priority districts are located. The aim of this process is to support the efficient, transparent and systematic targeting of initial REDD+ activities at those areas which have the highest potential for reducing emissions and/or achieving co-benefits.
Factors that have been analyzed so far include:
• current carbon stocks and projections of future deforestation (in order to assess the potential for reducing emissions),
• indicators of pressure and conditions that favour deforestation (in order to assess the main drivers of deforestation and the feasibility of REDD+ interventions),
• indicators of the potential for achieving co-benefits for poverty reduction, biodiversity and water-related ecosystem services.
It is expected that the compiled data and the approach developed for the process of prioritization will be of wider benefit for political decision-making, as they help to visualize the different threats to the forest, as well as the possible consequences in terms of lost resources of not taking timely and appropriate action.
Biodiversity conservation is one of the principal co-benefits that can be associated with REDD+. Ocelot (Leopardus pardalis). © Proyecto REDD+ MINAM.

in Peru through spatial analysis 10
The mapping work presented in this report was designed to support the analysis of potential priority areas for REDD+, by carrying out more detailed spatial analyses on specific topics (e.g. comparison of datasets related to different carbon pools, distribution of endangered and endemic species, and important areas for water-related ecosystem services). Examples of the map layers that have been produced will be presented in the following sections, along with further explanations of their potential use in planning for REDD+ and achieving synergies with biodiversity policies and adaptation to climate change. References to existing datasets from other sources that could feed into the planning process, and suggestions for additional data that could be developed, are also made where relevant. The sections are organized according to the main categories of spatial information that can guide REDD+ planning (as described above).
4.1.1 Information related to the potential for avoiding emissions and/or sequestering carbon
Forests, in particular tropical forests, are vast carbon stores and sinks, immobilizing carbon in their biomass both above-ground (in leaves, branches, and stems) and below-ground (in roots), as well as in the form of soil organic carbon derived from litter decomposition (Trumper et al. 2009, Walker et al. 2011). The biomass and carbon content of forests and other vegetation varies considerably, depending on the type of land cover and ecoregion, and can
be influenced by physical factors (e.g. precipitation, temperature, topography), biological parameters (e.g. species composition and age of the vegetation layer), as well as anthropogenic factors (such as the degree of disturbance or the land use history of the area) (GOFC-GOLD 2013).
Map 1 shows the distribution of different forest types and other ecosystems in Peru. As can be seen from this map, Peru’s diverse topography and climatic conditions give rise to a significant diversity of different types of vegetation cover; this results in large variation in carbon stocks.
Understanding the distribution of current and potential biomass carbon stocks in relation to other forest values and to land-use pressures (indicating future deforestation risk) is important for effective REDD+ planning. Spatial variation in current biomass carbon can indicate variation in potential emissions if areas are converted or degraded. In addition, a comparison between current and potential biomass carbon stocks can help to identify areas where carbon stocks could be enhanced.
In order to assess the potential for avoiding emissions and/or sequestering carbon in a given location, information on carbon stocks needs to be combined with information on land demand for other uses. In terms of reducing emissions, REDD+ actions that successfully reduce deforestation in areas that contain high carbon stores and are also under high pressure will have the largest impact. The amount of pressure that a forest area is likely to experience in the future can be assessed on the basis of deforestation scenarios that take into account the drivers and mechanisms of deforestation. Where such information is not available, a simple visualization of past deforestation patterns and/or data related to the spatial distribution of main drivers of deforestation can at least provide some indication of possible high-risk areas.
In the case of Peru, land use pressures on forests may arise from infrastructure development (roads and expansion of the urban centres), agriculture expansion, mining and oil exploration, as well as illegal mining and coca cultivation (Che Piu and Menton 2013). It has been estimated that emissions from the Land Use, Land Use Change and Forestry sector make up 47.5 % of total emissions at the national level7. Based on figures from the year 2000, conversion of forests in the Amazonian region to agriculture is considered the main source of emissions (MINAM 2010).
7 According to an analysis of results from the first phase of the PLANCC project up to 2009 (distribution of greenhouse gas emissions by sector, see http://www.planccperu.org/), the figure has been reduced to 40.9 % for the forestry sector.
Maintaining forest cover through well-planned REDD+ actions can help ensure access to safe drinking water, an important aspect of the wellbeing of forest-dependent communities. Picture by Serge Saint (CC BY 2.0) https://flic.kr/p/4CrTbq

Promoting environmental and social benefits of REDD+11
Information on land use pressures and past patterns of deforestation or forest degradation can also be useful for assessing the possibilities for enhancement of carbon stocks in areas where current stocks are significantly lower than the potential ones.
Available spatial datasets for Peru that allow an assessment of the carbon benefits that could be achieved through REDD+ actions in different areas include several data layers on current carbon stocks (see also below), a map of forest cover loss between 2001 and 2011 developed by the REDD+ MINAM Project, and a scenario of future deforestation in the Amazon basin up to the year 2021 published by Soares-Filho et al. (2006). There is currently no map of potential carbon stocks; however, it would be possible to develop this in the future by combining a data layer on vegetation zones with typical carbon values per vegetation type derived from literature.
The work carried out under the collaboration between UNEP-WCMC and the REDD+ MINAM Project focussed on exploring the implications of different choices with regard to the carbon pools that are included in a map of current carbon stocks, as well as on assessing the suitability of currently available data for the different carbon pools for inclusion in the analysis.
An understanding of the spatial distribution of carbon stocks can be obtained from maps based on field data and/or remote sensing. There are several global and regional-scale datasets that provide information on biomass carbon stocks for the territory of Peru, based on different data sources and methods (e.g.
Ruesch and Gibbs 2008; Baccini et al. 2012; and Saatchi et al. 2011). Following a review of available data, the dataset developed by Baccini et al. (2012) was chosen as the basis for the analyses presented in this report. It is important to note that the REDD+ MINAM Project has so far been working with national-level data on above-ground tree biomass carbon density as a first approximation, and that improved and complementary information on carbon stock distribution will become available in due course through the National Forest Inventory, which is currently in its first year of implementation.
Starting from the Baccini et al. (2012) data (which are presented in Map 2), a map of above- and below-ground biomass carbon stocks was developed. This was done by applying root-to-shoot ratios to the above-ground biomass carbon values as recommended by the Intergovernmental Panel on Climate Change (IPCC 2006). The resulting map of above- and below-ground biomass carbon stocks is presented in Map 3. As can be seen from Maps 2 and 3, biomass carbon stocks vary significantly across Peru, with large carbon reserves found throughout the Amazonian region8.
In a next step, the effects of including soil organic carbon in the map were explored. In addition to the carbon stored in the roots and shoots of live vegetation, the organic carbon stored in soils represents an important pool, which is mainly composed of partly decayed organic matter. Globally, the soil carbon pool is estimated to be 3.3 times larger than the atmospheric carbon pool, and 4.5 times larger than the carbon pool of living biomass (Lal 2004). Land-use change, certain agricultural practices and erosion can all lead to a loss of carbon from the soil. Managing soil for its carbon stocks by maintaining or restoring natural vegetation and improving agricultural practices may therefore be an important consideration for countries planning and implementing climate change mitigation measures. Unfortunately, wider application of mitigation actions addressing soil carbon is often hindered by the fact that there is still a shortage of reliable data on the specific amount of soil carbon emissions associated with different land uses and land use conversions. Map 4 shows the sum of above-ground, below-ground and soil organic carbon across Peru to illustrate the combined amount of carbon present in these different pools. Data on soil organic carbon were extracted from a global map of soil organic carbon to a depth of 1m (see Hiederer & Köchy 2011), based on the Harmonized World Soil Database (FAO et al. 2009).
8 Note: when comparing the two maps, it should be kept in mind that the thresholds between carbon classes are different on each map, due to the overall higher carbon values on Map 3.
Cattle on recently cleared land in Madre de Dios province. Land-management decisions can have a significant impact on the ability of the soil to store carbon. © Proyecto REDD+ MINAM.

in Peru through spatial analysis
Map 1: Distribution of different types of vegetation cover in Peru
12
Data sources: Vegetation cover: Vegetation cover map of Peru. Ministry for the Environment of Peru (MINAM), 2013.
The distribution of vegetation types across an area can provide a first indication of the spatial differences in biomass carbon stock, with rainforest vegetation typically having particularly high carbon contents.

Promoting environmental and social benefits of REDD+13
Map 2: Above-ground biomass carbon stocks in Peru
Data sources: Biomass carbon: A. Baccini, S J. Goetz, W.S. Walker, N. T. Laporte, M. Sun, D. Sulla-Menashe, J. Hackler, P.S.A. Beck, R. Dubayah, M.A. Friedl, S. Samanta and R. A. Houghton. Estimated carbon dioxide emissions from tropical deforestation improved by carbon-density maps. 2012 Nature Climate Change, http://dx.doi.org/10.1038/NCLIMATE1354, The Woods Hole Research Center.
Among the carbon pools linked to terrestrial vegetation as defined by the IPCC (Penman et al. 2003)i, the carbon contained in above-ground biomass is the easiest to measure. Maps of above-ground biomass carbon are therefore often used as an input to the identification of areas where REDD+ actions could have a large impact on reducing emissions or enhancing carbon stocks.
i Above- and below-ground biomass, dead wood, litter and soil organic matter.

in Peru through spatial analysis 14
Map 3: Above- and below-ground biomass carbon stocks in Peru
Methods and data sources: Biomass carbon: A. Baccini, S J. Goetz, W.S. Walker, N. T. Laporte, M. Sun, D. Sulla-Menashe, J. Hackler, P.S.A. Beck, R. Dubayah, M.A. Friedl, S. Samanta and R. A. Houghton. Estimated carbon dioxide emissions from tropical deforestation improved by carbon-density maps. 2012 Nature Climate Change, http://dx.doi.org/10.1038/NCLIMATE1354, The Woods Hole Research Center. Ecosystem-specific conversion factors (IPCC 2006) were used to add below-ground biomass carbon to this map.
Considering below-ground as well as above-ground biomass carbon stocks can provide a more accurate basis for assessing the amount of carbon per hectare that could be maintained or sequestered through REDD+ actions, as compared to looking at above-ground biomass alone. The ratio between above- and below-ground biomass depends on the vegetation type as well as environmental parameters such as climate and geology.

Promoting environmental and social benefits of REDD+15
Methods and data sources: Biomass carbon: A. Baccini, S J. Goetz, W.S. Walker, N. T. Laporte, M. Sun, D. Sulla-Menashe, J. Hackler, P.S.A. Beck, R. Dubayah, M.A. Friedl, S. Samanta and R. A. Houghton. Estimated carbon dioxide emissions from tropical deforestation improved by carbon -density maps. 2012 Nature Climate Change, http://dx.doi.org/10.1038/NCLIMATE1354, The Woods Hole Research Center. Ecosystem-specific conversion factors (IPCC 2006) were used to add below-ground biomass carbon to this map. Soil carbon: Hiederer, R. and M. Köchy (2011) Global Soil Organic Carbon Estimates and the Harmonized World Soil Database. EUR 25225 EN. EUR Scientific and Technical Research Series ISSN 1831-9424 (online), ISSN 1018-5593 (print), ISBN 978-92-79-23108-7, doi:10.2788/13267
Map 4: Combined biomass and soil organic carbon stocks in Peru (including above- and below-ground biomass carbon as well as soil organic carbon)
Information on soil organic carbon stocks (in addition to biomass carbon) can be particularly relevant for the planning of REDD+ measures that aim to reduce emissions from deforestation, as the conversion of forests to other land uses such as agriculture may cause significant loss of soil carbon. Thus, maintaining forest in an area with high soil organic carbon content may provide larger benefits in terms of avoided emissions than maintaining a comparable forest area on lower carbon soil.

in Peru through spatial analysis 16
The selection of the carbon map that is most appropriate to use for decision-making may depend on what REDD+ actions are being considered, and which carbon pools they will influence. For example, where the aim is to reduce forest clearing or forest degradation resulting from unsustainable logging practices, which can lead to a partial release of soil carbon, a combined map of biomass and soil carbon can be a useful input to the identification of priority areas for intervention. By contrast, taking current soil carbon stocks into account may be less important when deciding on appropriate locations for activities to enhance forest carbon stocks. The accuracy of available soil carbon datasets is another important consideration. As can be seen by comparing Maps 2-49, the spatial resolution of the global soil carbon dataset included in Map 4 is significantly lower than that of the biomass carbon data. It would therefore be preferable to replace the layer with a higher resolution national dataset as soon as this becomes available.In order to illustrate the implications of choosing 9 Note again the difference in carbon class thresholds between the maps.
whether or not to include the soil carbon pool in an analysis to identify priority areas, a comparative ranking of vegetation types in Peru by their carbon stocks was carried out. This was achieved by overlaying the dataset on vegetation cover (see Map 1) with the carbon datasets for above-ground biomass carbon only, as well as for the combined biomass and soil organic carbon stocks, and calculating average current carbon stocks per vegetation type10. The ten vegetation types with the highest values for both analyses are displayed in tables 3 and 4 below.
10 Note that for the purposes of the national MRV system, in line with a proposal developed by the REDD+ MINAM Project in collaboration with other stakeholders, carbon stocks will be measured and reported according to the six subpopulations (land cover classes) provided in the Map of Ecozones developed by the National Forest Inventory. This approach was chosen in order to comply with the principle of coherence set out in the most recent IPCC and UNFCCC guidance (Dec. 13/CP.19). The emission factors associated with the land cover classes have been identified as follows: coastal zone (costa) 8.37 tC/ha, Andean zone (sierra) 31.34 tC/ha, accessible highland forest (selva alta accesible) 84.55 tC/ha, highland forest with difficult access (selva alta de acceso difícil) 98.06 tC/ha, lowland forest (selva baja) 116.74 tC/ha, hydromorphic zone (zona hidromórfica) 70.26 tC/ha.
Table 3: Average above-ground biomass carbon stocks per vegetation type
Vegetation Type Mean above-ground biomass carbon (tonnes/ha)
Rainforest of the medium and low hills 150Palm swamp 148Upper terrace rainforest 143Medium and lower terrace rainforest 139Rainforest of the high hills 139Rainforest on sloping plains 126Montane rainforest 120Hydrophytic grassland 108Sclerophyllous scrubland 106Hydrophytic savannah 87
Table 4: Average combined biomass and soil organic carbon stocks per vegetation type
Vegetation Type Mean total organic carbon (above-ground, below-ground and soil carbon) (tonnes/ha)
Palm swamp 666Hydrophytic grassland 544Medium and lower terrace rainforest 452Upper terrace rainforest 378Rainforest of the medium and low hills 317Sclerophyllous scrubland 316Hydrophytic savannah 311Rainforest of the high hills 289Montane rainforest 268Rainforest on sloping plains 254
Promoting environmental and social benefits of REDD+17
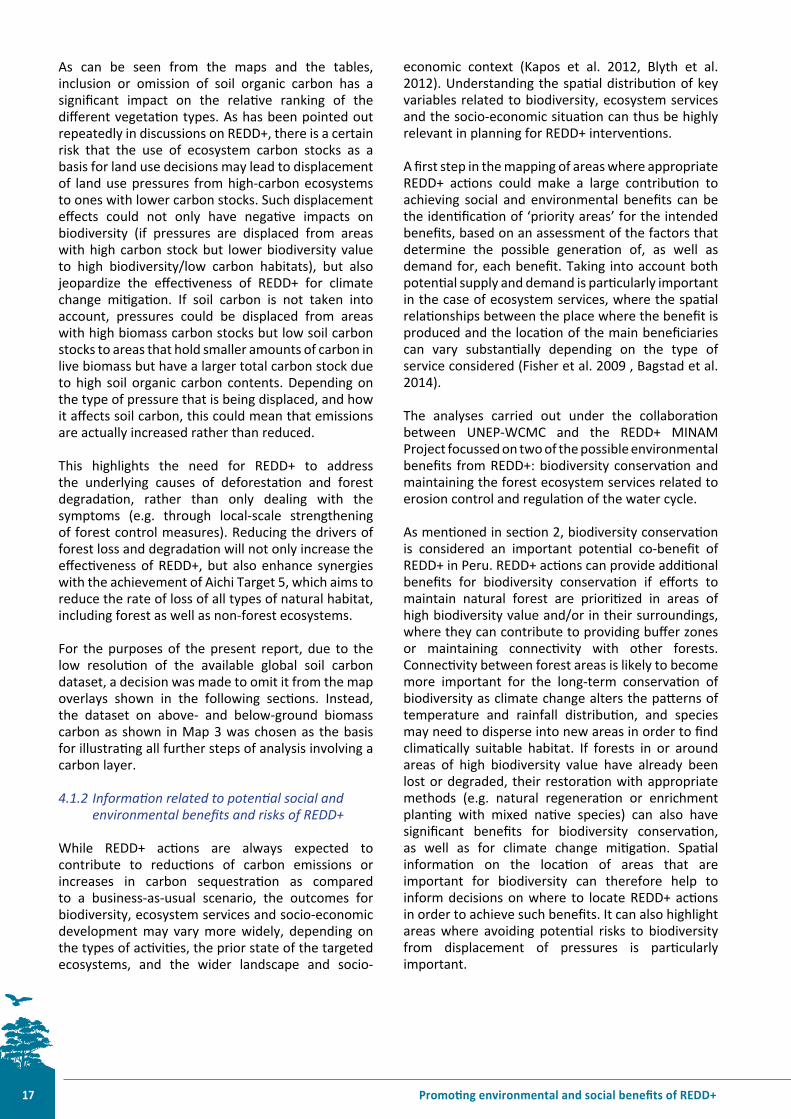
As can be seen from the maps and the tables, inclusion or omission of soil organic carbon has a significant impact on the relative ranking of the different vegetation types. As has been pointed out repeatedly in discussions on REDD+, there is a certain risk that the use of ecosystem carbon stocks as a basis for land use decisions may lead to displacement of land use pressures from high-carbon ecosystems to ones with lower carbon stocks. Such displacement effects could not only have negative impacts on biodiversity (if pressures are displaced from areas with high carbon stock but lower biodiversity value to high biodiversity/low carbon habitats), but also jeopardize the effectiveness of REDD+ for climate change mitigation. If soil carbon is not taken into account, pressures could be displaced from areas with high biomass carbon stocks but low soil carbon stocks to areas that hold smaller amounts of carbon in live biomass but have a larger total carbon stock due to high soil organic carbon contents. Depending on the type of pressure that is being displaced, and how it affects soil carbon, this could mean that emissions are actually increased rather than reduced.
This highlights the need for REDD+ to address the underlying causes of deforestation and forest degradation, rather than only dealing with the symptoms (e.g. through local-scale strengthening of forest control measures). Reducing the drivers of forest loss and degradation will not only increase the effectiveness of REDD+, but also enhance synergies with the achievement of Aichi Target 5, which aims to reduce the rate of loss of all types of natural habitat, including forest as well as non-forest ecosystems.
For the purposes of the present report, due to the low resolution of the available global soil carbon dataset, a decision was made to omit it from the map overlays shown in the following sections. Instead, the dataset on above- and below-ground biomass carbon as shown in Map 3 was chosen as the basis for illustrating all further steps of analysis involving a carbon layer.
4.1.2 Information related to potential social and environmental benefits and risks of REDD+
While REDD+ actions are always expected to contribute to reductions of carbon emissions or increases in carbon sequestration as compared to a business-as-usual scenario, the outcomes for biodiversity, ecosystem services and socio-economic development may vary more widely, depending on the types of activities, the prior state of the targeted ecosystems, and the wider landscape and socio-
economic context (Kapos et al. 2012, Blyth et al. 2012). Understanding the spatial distribution of key variables related to biodiversity, ecosystem services and the socio-economic situation can thus be highly relevant in planning for REDD+ interventions.
A first step in the mapping of areas where appropriate REDD+ actions could make a large contribution to achieving social and environmental benefits can be the identification of ‘priority areas’ for the intended benefits, based on an assessment of the factors that determine the possible generation of, as well as demand for, each benefit. Taking into account both potential supply and demand is particularly important in the case of ecosystem services, where the spatial relationships between the place where the benefit is produced and the location of the main beneficiaries can vary substantially depending on the type of service considered (Fisher et al. 2009 , Bagstad et al. 2014).
The analyses carried out under the collaboration between UNEP-WCMC and the REDD+ MINAM Project focussed on two of the possible environmental benefits from REDD+: biodiversity conservation and maintaining the forest ecosystem services related to erosion control and regulation of the water cycle.
As mentioned in section 2, biodiversity conservation is considered an important potential co-benefit of REDD+ in Peru. REDD+ actions can provide additional benefits for biodiversity conservation if efforts to maintain natural forest are prioritized in areas of high biodiversity value and/or in their surroundings, where they can contribute to providing buffer zones or maintaining connectivity with other forests. Connectivity between forest areas is likely to become more important for the long-term conservation of biodiversity as climate change alters the patterns of temperature and rainfall distribution, and species may need to disperse into new areas in order to find climatically suitable habitat. If forests in or around areas of high biodiversity value have already been lost or degraded, their restoration with appropriate methods (e.g. natural regeneration or enrichment planting with mixed native species) can also have significant benefits for biodiversity conservation, as well as for climate change mitigation. Spatial information on the location of areas that are important for biodiversity can therefore help to inform decisions on where to locate REDD+ actions in order to achieve such benefits. It can also highlight areas where avoiding potential risks to biodiversity from displacement of pressures is particularly important.

in Peru through spatial analysis 18
Due to the immense spatial and temporal variability in the composition of species assemblages and ecosystem complexes, in combination with a scarcity of precise, consistent and up-to-date biodiversity data, it is difficult to measure and map the importance of different areas for biodiversity conservation by using a single indicator. A range of approaches and metrics may be used to represent the spatial distribution and vulnerability of a country’s biodiversity and to identify priority areas for its conservation and management. These approaches may focus on the distribution of particular ecosystems, on overall measures of species richness, or on the distribution of ecosystems and species of conservation concern.
For the purpose of the analyses presented in this report, three complementary datasets were identified as the most suitable options in terms of possible input data for assessing the relative importance of different areas for biodiversity conservation within Peru. These are: the species range data for threatened species compiled by the International Union for the Conservation of Nature (IUCN); a dataset compiled by NatureServe on the ranges of endemic species of the eastern Andes-Amazon region of Peru and Bolivia (i.e. showing the ranges of species that only occur in this region); and the Key Biodiversity Areas dataset compiled by Birdlife International. All three datasets confirm the high significance of Peru’s ecosystems for biodiversity conservation.
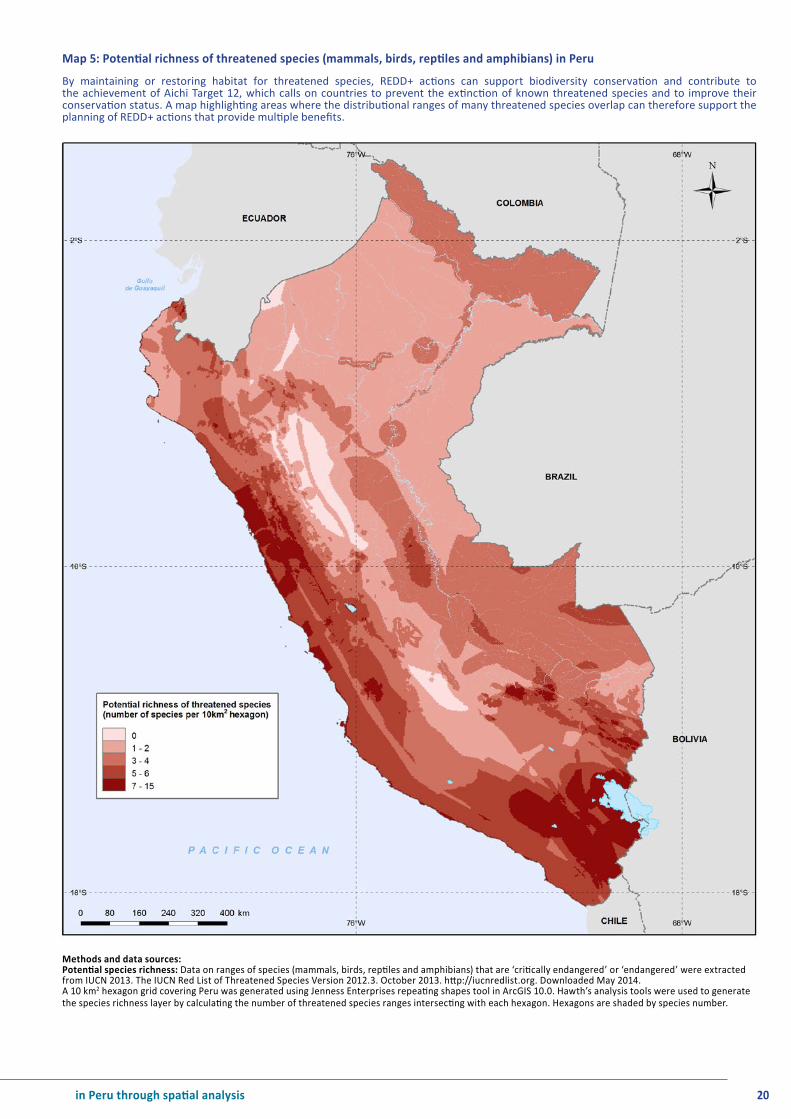
In addition to its outstanding total species richness, Peru is home to a large number of species considered by IUCN (2013) and national sources to be threatened; the fauna and flora of the country also show a high percentage of endemism. Overall, according to the recently updated version of the National Biodiversity Strategy and Action Plan11, Peru hosts more than 20,375 plant species, 515 mammal species, 1,834 bird species and 418 species of reptiles, with new species being discovered frequently. A total of 777 plant species and 492 animal species are considered to be under some level of threat. Out of these, 267 plant species and 186 species of animals are thought to be critically endangered or endangered. Spatial data on the distribution ranges of threatened species as identified by IUCN are available for the terrestrial vertebrates and were used in the analysis presented here.
Map 5 shows the spatial patterns of potential richness in threatened12 animal species for mammals, birds, reptiles and amphibians, based on an overlay of the overall distribution ranges of these species. This map layer can be used as an input to the planning
11 National Biodiversity Strategy to 2021 and Biodiversity Action Plan 2014-2018; this document is currently going through the process of approval.12 IUCN categories ‘critically endangered’ and ‘endangered’
of REDD+ actions that contribute to achieving the Aichi Biodiversity Targets. In particular, it can help to identify areas where REDD+ could contribute towards preventing the extinction of known threatened species and improving species conservation status as foreseen under Aichi Target 1213. In the case of Peru, synergies are also possible with ongoing work carried out in partnership with the Alliance for Zero Extinction (AZE), which aims to support improved management and conservation of the most seriously threatened species in the country.
The distribution ranges of endemic species are another parameter that is considered useful in identifying areas of special importance for biodiversity conservation. This is because the small size of the species’ ranges makes them particularly vulnerable to threats from habitat loss or degradation, and places a particular responsibility for their long-term survival on those who take decisions about the management of the areas in question. Map 6 presents the distribution of potential richness in endemic species of mammals, birds and amphibians for the eastern slope of the Andes-Amazon region of Peru.13 Target 12: By 2020 the extinction of known threatened species has been prevented and their conservation status, particularly of those most in decline, has been improved and sustained.
Forest in Piura region, Peru. Dry forest is a typical example of a vegetation type that is home to a unique community of plants and animals and provides important ecosystem services, but contains relatively low carbon stocks if compared to tropical rainforests. It can therefore be important to avoid the displacement of deforestation pressures to these ecosystems. © Proyecto REDD+ MINAM.

Promoting environmental and social benefits of REDD+
As can be seen by comparing Maps 5 and 6, the distribution patterns of threatened and endemic species in the Andean and Amazonian regions of Peru do not show a high degree of correlation. This can be explained by the fact that some endemic species are currently common within the areas where they occur (and therefore not acutely threatened), and a number of threatened species’ ranges extend into neighbouring countries (which is why they do not count as endemic). This suggests that the information derived from the two datasets should be treated as complementary, and where possible, both should be considered in REDD+ planning. Areas holding threatened species that also have small distribution ranges should receive priority attention.
A way to combine the information on potential richness of threatened species with information on their range sizes is to calculate an index of “biodiversity importance” reflecting the potential richness and range size rarity14 of threatened species. This index takes account of both the number of species ranges that overlap in a grid cell or other area unit, and the overall size of those species ranges. The index value will be highest for units that fall within the distribution area of many species of restricted range, and lowest for units where the few species that are potentially present are also widely distributed. Map 7 shows the results of calculating the Biodiversity Importance Index based on the distributions of threatened vertebrate species occurring in Peru.
For the purposes of REDD+ planning, the information on priority areas for social and environmental benefits should be combined with other data layers, such as data on carbon stocks, current extent of forests and deforestation risk, in order to gauge the extent of potential synergies and identify areas of possible conflict. For example, REDD+ actions that aim to reduce deforestation in areas with high carbon stocks that harbour large numbers of threatened species can be expected to yield strong benefits for biodiversity conservation as well as climate change mitigation. On the other hand, for areas where concentrations of threatened species occur in forest types with low carbon stock, monitoring of land use change may be an important precaution to ensure that any pressures displaced by REDD+ actions do not have adverse impacts on biodiversity. Finally, low carbon areas with a low current value for biodiversity could be a priority for REDD+ actions that aim to enhance forest carbon stocks, for example through forest restoration.
14 In this context, ‘range size rarity’ is defined as the quality of having a small area of distribution. The term is used to avoid confusion with other possible meanings of the word ‘rarity’, e.g. when referring to species that are limited to a highly specific habitat type that occurs in small patches, but may be present with a low density over a large geographical area.
Map 8 shows the result of overlaying the Biodiversity Importance Index dataset with information on current biomass carbon stocks and clipping it to the potential distribution area of natural forest vegetation as indicated by the vegetation cover map of Peru (Map 1). Areas with high values of the Biodiversity Importance Index that coincide with high carbon stocks appear on the map in dark red. High biodiversity value areas with low carbon stocks are shown in dark green. Building on the information about the potential distribution of different forest types from Map 1 and information about recent deforestation (currently available for the Amazonian region only), a next step of analysis could focus on further characterization of the high biodiversity–low carbon areas. This could help to differentiate between forest areas with naturally low carbon stock (which should receive special attention in efforts to avoid displacement of pressures) and forest areas with potentially high carbon stocks that have been affected by deforestation and forest degradation. With regard to the latter type of areas, it may be possible to design REDD+ actions in a way that supports the restoration of biodiversity-rich forests and the conservation of remaining tracts of the original forest cover.
As mentioned above, the third information source that was explored as a possible basis for prioritizing important areas for biodiversity conservation is the Key Biodiversity Areas (KBA) dataset. KBAs are sites of global significance for the conservation of biodiversity, identified nationally based on internationally agreed criteria related to vulnerability (presence of threatened species) and irreplaceability (overall importance of a site for achieving conservation of individual threatened species – e.g. a site scores high for irreplaceability if a significant proportion of the global population of certain species occurs within it) (Eken et al. 2004). Key Biodiversity Areas identified based on these criteria include Important Bird and Biodiversity Areas (IBAs, BirdLife 2013) and Alliance for Zero Extinction sites (the ranges of single-site endemics). KBAs provide another option for identifying areas where REDD+ could deliver conservation benefits and areas where reducing the risks of adverse impacts should be a priority. The relationship of Key Biodiversity Areas in Peru with current biomass carbon stocks is shown in Map 9.
19
in Peru through spatial analysis 20
Map 5: Potential richness of threatened species (mammals, birds, reptiles and amphibians) in Peru
Methods and data sources: Potential species richness: Data on ranges of species (mammals, birds, reptiles and amphibians) that are ‘critically endangered’ or ‘endangered’ were extracted from IUCN 2013. The IUCN Red List of Threatened Species Version 2012.3. October 2013. http://iucnredlist.org. Downloaded May 2014. A 10 km2 hexagon grid covering Peru was generated using Jenness Enterprises repeating shapes tool in ArcGIS 10.0. Hawth’s analysis tools were used to generate the species richness layer by calculating the number of threatened species ranges intersecting with each hexagon. Hexagons are shaded by species number.
By maintaining or restoring habitat for threatened species, REDD+ actions can support biodiversity conservation and contribute to the achievement of Aichi Target 12, which calls on countries to prevent the extinction of known threatened species and to improve their conservation status. A map highlighting areas where the distributional ranges of many threatened species overlap can therefore support the planning of REDD+ actions that provide multiple benefits.

Promoting environmental and social benefits of REDD+21
Map 6: Potential richness of endemic species (mammals, birds and amphibians) on the eastern slope of the Andes-Amazon region of Peru
Methods and data sources: Potential species richness: The data on ranges of endemic species (mammals, birds and amphibians) are based on Young, BE, Beck S, Córdova J, Embert D, Franke I, Hernandez P, Herzog S, Pacheco V, Timaná M, Tovar C, and Vargas J. 2007. Digital distribution maps of species endemic to the east slope of the Andes in Peru and Bolivia. NatureServe, Arlington, Virginia, USA. Data provided by NatureServe in collaboration with the Conservation Data Centre (CDC) of the National Agrarian University – La Molina, the Natural History Museum of the National University of San Marcos, and many participating natural history museums and herbaria. See: http://www.natureserve.org/conservation-tools/data-maps-tools/modeled-distribution-maps-species-endemic-east-slope-andes-peru A 10 km2 hexagon grid covering Peru was generated using Jenness Enterprises repeating shapes tool in ArcGIS 10.0. Hawth’s analysis tools were used to generate the species richness layer by calculating the number of endemic species ranges intersecting with each hexagon. Hexagons are shaded by species number.
Endemic species are often particularly vulnerable to habitat loss because of their comparatively small distribution ranges. As a consequence, conservation of endemic species is included among the goals of biodiversity policies in many countries. Information on endemic species distributions – alongside information on threatened species as shown on Map 5 - can thus be another valuable input to the identification of suitable locations for REDD+ actions that also contribute to biodiversity conservation.

in Peru through spatial analysis 22
Map 7: Biodiversity Importance Index based on potential richness and range size rarity of threatened species in Peru
Methods and data sources: Species range data: Data on ranges of species (mammals, birds, reptiles and amphibians) that are ‘critically endangered’ or ‘endangered’ were extracted from IUCN 2013. The IUCN Red List of Threatened Species Version 2012.3. October 2013. http://iucnredlist.org. Downloaded May 2014. Biodiversity Importance Index: Ranges of threatened species were overlaid with a 50 km2 hexagon grid covering Peru. This analysis was undertaken in Quantum GIS, using the QMarxan plugin to generate the hexagon grid. (Trevor Wiens, 2013. QMarxan plugin for Quantum GIS. Apropos Information Systems Inc. http://aproposinfosystems.com). Then, for every species, and every 50 km2 hexagon, the proportion of the species’ total range that falls within that hexagon was calculated. This was done by dividing the area of the hexagon covered by that species’ range, by the total global range area for that species. Next, the Biodiversity Importance Index was calculated by adding these values together for all species within that hexagon, to obtain an index that represents both how many species ranges overlap with that hexagon, and how restricted the species ranges are to that hexagon.
The Biodiversity Importance Index shown on this map combines information on the number of threatened species occurring in an area with information on the size of these species’ distributional ranges. High index values show that an area holds a large number of threatened species and/or that the average distribution ranges of the threatened species present in the area are small. The index map can be used to identify areas where REDD+ actions could make a particularly high contribution to the conservation of threatened species in line with Aichi Biodiversity Target 12. Due to the inclusion of range size information it may be an even more efficient prioritization tool than a map based only on numbers of threatened species ranges per area (cp. Map 5).

Promoting environmental and social benefits of REDD+23
Methods and data sources:Species range data: Data on ranges of species (mammals, birds, reptiles and amphibians) that are ‘critically endangered’ or ‘endangered’ were extracted from IUCN 2013. The IUCN Red List of Threatened Species Version 2012.3. October 2013. http://iucnredlist.org. Downloaded May 2014. Biodiversity Importance Index: See Map 7 for description of Biodiversity Importance Index calculation method. Index values were split into five classes. The splits were based on the original natural breaks classification that has been used to present the data in Map 7.Biomass carbon: A. Baccini, S J. Goetz, W.S. Walker, N. T. Laporte, M. Sun, D. Sulla-Menashe, J. Hackler, P.S.A. Beck, R. Dubayah, M.A. Friedl, S. Samanta and R. A. Houghton. Estimated carbon dioxide emissions from tropical deforestation improved by carbon-density maps. 2012 Nature Climate Change, http://dx.doi.org/10.1038/NCLIMATE1354, The Woods Hole Research Center. Ecosystem-specific conversion factors (IPCC 2006) were used to add below-ground biomass carbon to this map. Biomass carbon stock values were split into 5 classes using quantiles (see Map 3 for class breaks).Distribution of forest vegetation types: Vegetation cover map of Peru. Ministry for the Environment of Peru (MINAM), 2013.
Map 8: Biodiversity Importance Index for threatened species in relation to biomass carbon stocks within the distribution area of forest vegetation types in PeruBy overlaying the Biodiversity Importance Index dataset (see Map 7) with data on biomass carbon stocks (see Map 3), a map can be generated that allows easy visual identification of areas where high carbon stocks coincide with high value for biodiversity conservation. If forests in these areas come under threat, they could be a priority object for REDD+ actions to avoid deforestation. Clipping the map to the distribution area of forest vegetation types (see Map 1) can further help to distinguish between naturally forest-free areas and areas that are (or could be) forested but hold low carbon stock. REDD+ actions that will have an impact on areas of high biodiversity value and low carbon stock within the forest zone should be planned with special care to avoid potential risks to biodiversity.

in Peru through spatial analysis 24
Map 9: Key Biodiversity Areas (KBAs) in relation to biomass carbon stocks in Peru
Methods and data sources: Key Biodiversity Areas: Key Biodiversity Areas (KBAs) of the world including Important Bird Areas (IBAs) and Alliance for Zero Extinction sites (AZEs) compiled by BirdLife International and Conservation International, October 2012. For further information please contact [email protected] carbon: A. Baccini, S J. Goetz, W.S. Walker, N. T. Laporte, M. Sun, D. Sulla-Menashe, J. Hackler, P.S.A. Beck, R. Dubayah, M.A. Friedl, S. Samanta and R. A. Houghton. Estimated carbon dioxide emissions from tropical deforestation improved by carbon-density maps. 2012 Nature Climate Change, http://dx.doi.org/10.1038/NCLIMATE1354, The Woods Hole Research Center. Ecosystem-specific conversion factors (IPCC 2006) were used to add below-ground biomass carbon to this map.
Key Biodiversity Areas are areas that have been identified through a systematic process based on best available data as providing important habitat for rare and endangered species. Information on KBAs can thus be used in conjunction with or as an alternative to information on the distributional ranges of threatened or endemic species (cp. Maps 5-7) in order to identify areas that are of special importance for biodiversity conservation. KBAs that coincide with areas of high biomass carbon stock could be among the priority locations for REDD+ actions, especially where there is an imminent risk of deforestation or forest degradation.

Promoting environmental and social benefits of REDD+25
Figure 2: Input layers used in assessing the importance of forest for soil erosion control and water regulation(Top left: slope classes; top right: classification of areas based on average precipitation during the wettest month; bottom left: catchment areas upstream of hydroelectric and other dams; bottom right: current forest cover)

in Peru through spatial analysis 26
In addition to biodiversity conservation, ecosystem services related to the regulation of the hydrological cycle are another potential co-benefit of REDD+ that is highlighted in Peru’s emerging National Strategy on Forests and Climate Change (see section 2).
Forests, especially those on slopes, play an important role in stabilizing soils and maintaining their role in regulating water flow. Deforestation and forest degradation on slopes may diminish the rate of water infiltration and cause greater surface runoff after heavy rains, leading to soil erosion and sedimentation of the eroded material in downstream areas. The reduced capacity of soils to retain water can also magnify downstream flood risk, as well as the risk of water shortages during periods of low precipitation. The transport and sedimentation of eroded material in streams and water bodies reduces water quality and can cause damage to infrastructure such as water storage facilities and hydroelectric power plants.
Maintaining or enhancing forest carbon stocks in priority areas for water regulation and soil erosion control through REDD+ could contribute to Aichi Target 14, which stipulates that by 2020, ecosystems that provide essential services should be restored and safeguarded, taking into account the needs of women, indigenous and local communities, and the poor and vulnerable. Such actions could also contribute to Aichi Target 15, which calls for the enhancement of ecosystem resilience and the contribution of biodiversity to carbon stocks through conservation and restoration activities, with a view to contributing to climate change mitigation and adaptation and to combating desertification. The impacts of climate change are likely to increase the importance of water-related ecosystem services in Peru, as a growing intensity and frequency of extreme climatic events, such as those related to the El Niño phenomenon, are expected (MINAM 2010). Maintaining and improving the capacity of ecosystems to provide these services is therefore an important option for ecosystem-based adaptation actions.
As part of the collaboration between UNEP-WCMC and the REDD+ MINAM Project, an analysis to identify important areas for water regulation and soil erosion control has been carried out. This was done by developing an index which combines three criteria: slope, precipitation during the wettest month, and the
presence of downstream features with the potential to be adversely affected by sedimentation (in this case, hydroelectric and other dams). The method was customized to facilitate potential integration of the results into the identification of priority areas for REDD+ implementation in Peru. In a first step, wettest month precipitation per cell (split into 5 classes) was combined with data generated for slope (split into 5 classes), in order to assess potential erosion risk in the absence of forest cover. The result was combined with a layer highlighting those slopes that are located in the catchments upstream of dams, in order to reflect the amount of damage that could be caused by soil erosion and sedimentation. Based on a weighted index derived from these input layers, the final map of priority areas for water regulation and soil erosion control was created. This map assigns the highest priority to areas where high rainfall combines with steep slopes within catchments above dams and embankments. Areas with a slope of less than 4% were excluded from the analysis of catchments and categorized by default as ‘very low priority’, as it was considered that these areas have a very low risk of soil erosion and loss of hydrological functions, which means that there is no significant risk of damage even if sensitive infrastructure is present.
In a subsequent step, the map of important areas was clipped to current forest cover in the Amazonian region so as to indicate areas where maintaining existing forest may be of particular importance for water-related ecosystem services (see the illustration of intermediate steps of analysis in figure 2 and the final result in Map 10).
Map 11 shows an overlay of the identified priority areas for water regulation and erosion control with carbon stocks, and Map 12 shows where the priority areas are coinciding with areas of projected future deforestation (2011 – 2021). This information can help to identify those areas where the potential for synergies between maintaining carbon stocks and achieving co-benefits for water-related ecosystem services is highest. Such areas could be among the priority locations for REDD+ actions. Further analyses of areas that have already lost forest cover in important catchments where erosion risk is high could be useful in identifying potential locations for reforestation or forest restoration.

Promoting environmental and social benefits of REDD+27
Map 10: Importance of existing forest in the Amazonian region of Peru for soil erosion control and water regulation
Methods and data sources: The relative importance of the forest areas for erosion control and water regulation has been evaluated as a function of slope, rainfall and the presence of hydroelectrical stations and dams downstream of the forest, as the latter are important assets that could be adversely affected by the processes of soil erosion and sedimentation. Areas with high values of slope and precipitation (based on precipitation of the wettest month, see illustration of input layers in Figure 2) are identified as those that have the greatest potential risk of erosion and loss of hydrological functions. This information is combined with the analysis of the catchments upstream of the hydroelectrical stations and dams in order to assess the importance of the areas for soil erosion control and water regulation, integrating the two criteria of risk of disruption of ecological functions and potential impacts of sedimentation on the functioning of the hydroelectrical stations and dams. The layer was then clipped to current forest cover in the Amazonian region in order to show the areas where the importance of existing forest for preventing soil erosion and regulating water flows is greatest. Slope: Lehner, B., Verdin, K., Jarvis, A. (2008): New global hydrography derived from spaceborne elevation data. Eos, Transactions, AGU, 89(10): 93-94. See: http://hydrosheds.cr.usgs.gov/ Precipitation: WorldClim http://www.worldclim.org/. Hydroelectrical dams and other dams: Ministry of Energy and Mines of Peru (MINEM), 2013. Forest cover: Map of remaining forest cover in the Amazonian region in 2011. Ministry for the Environment of Peru (MINAM), 2013.
This map highlights areas where forests are currently providing important ecosystem services through the stabilization of soils and the regulation of water flows, preventing damage to various assets including hydroelectrical stations and dams. REDD+ actions that reduce deforestation or forest degradation in these areas could contribute to Aichi Biodiversity Targets 14 and 15, which call on countries to safeguard ecosystems that provide essential services, and to enhance ecosystem resilience. They could also provide benefits for climate change adaptation, as more variable and unpredictable rainfall is expected to increase the value of the forests’ regulating functions in the future.

in Peru through spatial analysis 28
Map 11: Importance of forest in the Amazonian region of Peru for soil erosion control and water regulation in relation to biomass carbon
Methods and data sources: See Map 10 for description of data sources and methodology used to assess the importance of forests for erosion control and water regulation.Biomass carbon: A. Baccini, S J. Goetz, W.S. Walker, N. T. Laporte, M. Sun, D. Sulla-Menashe, J. Hackler, P.S.A. Beck, R. Dubayah, M.A. Friedl, S. Samanta and R. A. Houghton. Estimated carbon dioxide emissions from tropical deforestation improved by carbon-density maps. 2012 Nature Climate Change, http://dx.doi.org/10.1038/NCLIMATE1354, The Woods Hole Research Center. Ecosystem-specific conversion factors (IPCC 2006) were used to add below-ground biomass carbon to this map.
This map combines the layer on forest areas that are important for stabilizing soils and regulating water flows (see Map 10) with data on biomass carbon stocks (see Map 3). It can be used to identify forest areas that hold high carbon stocks as well as high value for the provision of regulating ecosystem services. In order to single out those important forest areas that are most at risk from deforestation, and should therefore receive special attention in the planning of REDD+ actions, the map should be considered together with Map 12.
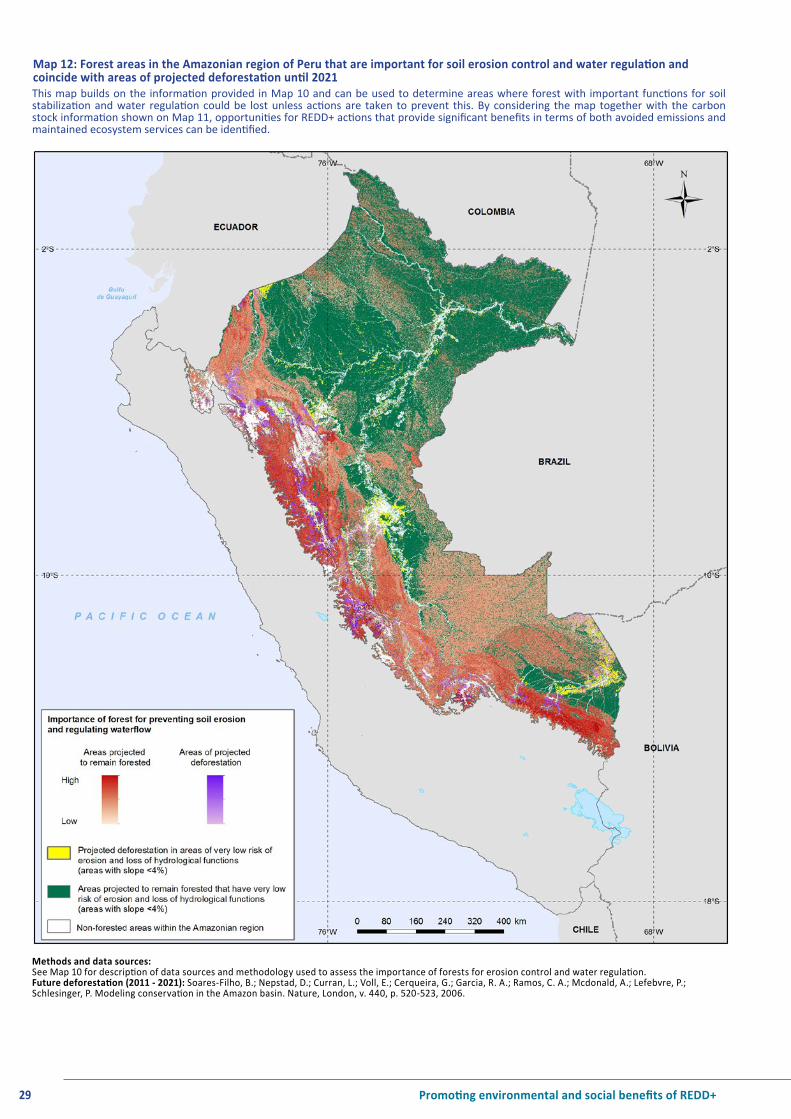
Promoting environmental and social benefits of REDD+29
Methods and data sources: See Map 10 for description of data sources and methodology used to assess the importance of forests for erosion control and water regulation.Future deforestation (2011 - 2021): Soares-Filho, B.; Nepstad, D.; Curran, L.; Voll, E.; Cerqueira, G.; Garcia, R. A.; Ramos, C. A.; Mcdonald, A.; Lefebvre, P.; Schlesinger, P. Modeling conservation in the Amazon basin. Nature, London, v. 440, p. 520-523, 2006.
Map 12: Forest areas in the Amazonian region of Peru that are important for soil erosion control and water regulation and coincide with areas of projected deforestation until 2021This map builds on the information provided in Map 10 and can be used to determine areas where forest with important functions for soil stabilization and water regulation could be lost unless actions are taken to prevent this. By considering the map together with the carbon stock information shown on Map 11, opportunities for REDD+ actions that provide significant benefits in terms of both avoided emissions and maintained ecosystem services can be identified.

in Peru through spatial analysis 30
Data sources: Opportunity costs: Map of opportunity costs per district produced under the Forest Investment Programme. Forest Investment Plan of Peru (FIP-PE), 2012. Forest cover loss 2001 – 2011: Map of forest loss 2001 - 2011 in the Amazonian region. Ministry for the Environment of Peru (MINAM), 2013.
Map 13: Distribution of recently deforested areas in the Amazonian region of Peru in relation to typical opportunity cost values at district level of reducing emissions from deforestationThis map can be used to identify areas with low opportunity costs that show high rates of deforestation. Depending on local circumstances and economic trends, such areas could be well suited as a starting point for the implementation of REDD+ actions. Where the potential gains from forest conversion are low, it might be easier than in other regions to develop economically viable approaches to address the drivers that are currently causing forest loss. This could also facilitate the planning of REDD+ actions that provide additional social benefits in terms of poverty reduction.

Promoting environmental and social benefits of REDD+31
4.1.3 Information related to the feasibility of specific REDD+ actions
Further to the identification of areas with a high potential for reducing emissions or sequestering carbon, as well as for achieving additional social and environmental benefits, some legal and socio-economic framework conditions that contribute to determining the feasibility of REDD+ actions in different areas should be considered.
A key element of planning for REDD+ actions is to review the existing legal frameworks on land use and forest management. Maps showing land designations such as protected areas and community lands, as well as agreed use rights such as timber concessions, can inform analyses of the feasibility of certain types of REDD+ actions in specific regions. They can also support an evaluation of the total potential for implementing these types of actions in the country under current conditions. Information on the legal status of forest lands can further assist with analyses on the effectiveness of different designations in supporting the conservation and sustainable management of forests. For example, a recent analysis of the correlations between land designations and deforestation rates in Peru has shown that deforestation rates were highest within ‘non-categorized’ forests, i.e. forests whose legal status is unclear. Unless there are other
decisive factors that co-vary with the distribution of non-categorized forests, this could indicate that clarification of use rights and legal status could be a promising measure to reduce deforestation.
Another type of spatial information that can be relevant for assessing the feasibility of REDD+ actions in a given location is related to the potential implementation and opportunity costs of REDD+. Implementation costs are the direct costs of the REDD+ actions carried out, such as costs for restoration activities, introduction of more sustainable management approaches or awareness-raising. Opportunity costs are the ‘costs’ incurred by foregoing income from alternative (business as usual) forms of forest management. Areas where the opportunity costs of land uses that are compatible with REDD+ (as compared to alternative legally permitted uses) are higher than the potential income that could be generated from REDD+, are likely to be less suited for the implementation of REDD+ actions. On the other hand, areas with low opportunity costs that show high current rates of deforestation could be a priority for REDD+. Map 13 shows an overlay of typical opportunity cost values of maintaining forests per district and areas affected by recent deforestation15.
Finally, if REDD+ is to provide benefits for the livelihoods of forest-dependent communities and communities located in the vicinity of forest areas, spatial information on socio-economic conditions (such as levels of income poverty and unsatisfied basic needs), as well as prevalent occupations and livelihood strategies, can be of great use for REDD+ planning. Depending on how they are designed and implemented, REDD+ actions can impact local communities’ environmental conditions and livelihood opportunities, and their needs must be considered when planning for REDD+. For example, if forests are protected through REDD+ incentives and conversion to agriculture is avoided, but the underlying causes of agricultural conversion (e.g. lack of access to and information on more sustainable land management methods) are not dealt with, it is likely that conversion will be displaced to other ecosystems, and/or local livelihoods will be negatively affected. If designed adequately, REDD+ actions that take into account current livelihood patterns have the potential to contribute to reducing vulnerability and poverty, e.g. through activities linked to the sustainable development of the areas adjacent to forests, addressing land tenure, improvement of forest governance processes and a greater involvement of local communities in decision-making.15 The map of opportunity cost values per district has been developed by the REDD+ MINAM Project with the support of the Forest Investment Programme. Values were calculated in Peruvian Soles per ton of CO2 equivalents based on average income generated from agricultural and pastoral activities in the district and average carbon contents of the forest vegetation. The average income values were obtained through a review of published literature.
Support to alternative livelihood options can increase the potential benefits of REDD+ to local communities, and address the underlying causes of deforestation. Ceramics workshop in Chazuta village, San Martín region. © Proyecto REDD+ MINAM.

in Peru through spatial analysis 32
4.2 Other possible uses of spatial information in the context of REDD+
Spatial information related to the possible social and environmental benefits of REDD+ can also be highly relevant for the development of a country’s approach to the REDD+ safeguards as agreed at the UNFCCC COP in Cancun, including the design of a Safeguards Information System.
As mandated by the UNFCCC decisions on REDD+ safeguards, many countries are currently engaged in the process of developing a Safeguards Information System (SIS), which is intended to provide information on the way the Cancun safeguards are addressed and respected (see Peskett & Todd 2013 for further background). The development of an SIS may involve
the definition of process and impact indicators related to the safeguards, and the identification of potential sources of data for reporting on these indicators. In the context of safeguard e) on enhancing social and environmental benefits from REDD+, spatial information related to priority areas for these benefits can enable the development of indicators based on the location of different types of REDD+ actions (process indicator) and changes in forest cover (impact indicator) in relation to these priority areas.
Information on the distribution of factors that determine the potential for social and environmental benefits can also help in the design of sampling strategies for the collection of data, as well as in the creation of baselines.
5 ConclusionsThe REDD+ process provides a timely opportunity for countries to advance towards a more integrated use of forest landscapes. Appropriate planning based on spatial information can support the achievement of multiple social and environmental benefits that are of value to stakeholders at the local and national level.
Planning for multiple benefits can also take into account the possible synergies between REDD+ and other environmental policies. In the case of Peru, particularly relevant areas for synergy include policy goals related to biodiversity conservation (including the Aichi Biodiversity Targets and their national implementation) and climate change adaptation. Maps like the ones presented in this report can support the identification of areas where activities for a more sustainable management of forest landscapes can be designed to serve more than one policy goal, as well as areas where this may be less easy to achieve. They can thus assist communication
between the institutions and individuals working on each field and support the development of coherent and complementary approaches.
A process to prioritize areas for REDD+ implementation, based on available spatial information on a range of relevant factors, is currently carried out by the REDD+ MINAM Project within the National Forest Conservation Programme. The present report aimed to present some of the rationale behind the work, as well as to contribute to this important effort by presenting more detailed analysis of some of the factors considered. It is hoped that both the maps of priority areas themselves and the collaborative processes and discussions accompanying their creation will facilitate the development of REDD+ actions that have a high potential for reducing emissions and achieving co-benefits, as envisaged by Peru’s emerging National Strategy on Forests and Climate Change.
Rainforest butterflies. © Proyecto REDD+ MINAM.

33
6 ReferencesBaccini, A., Goetz, S. J., Walker, W. S., Laporte, N. T., Sun, M., Sulla-Menashe, D. & Houghton, R. (2012) Estimated carbon dioxide emissions from tropical deforestation improved by carbon-density maps. Nature Climate Change, 2(3):182-185
Bagstad, K.J., Villa, F., Batker, D., Harrison-Cox, J., Voigt, B. & Johnson, G.W. (2014) From theoretical to actual ecosystem services: mapping beneficiaries and spatial flows in ecosystem service assessments. Ecology and Society, 19(2),64
Beaumont, L. J., Pitman, A., Perkins, S., Zimmermann, N. E., Yoccoz, N. G. & Thuiller, W. (2011) Impacts of climate change on the world’s most exceptional ecoregions. Proceedings of the National Academy of Sciences of the United States of America, 108:2306–2311.
Bertzky, M., Ravilious, C., Araujo Navas, A. L., Kapos, V., Carrión, D., Chíu, M. & Dickson, B. (2010) Carbon, biodiversity and ecosystem services: Exploring co-benefits. Ecuador. UNEP WCMC, Cambridge. Ecuador Ministry of Environment, Quito.
BirdLife International (2013) More than 12,000 Important Bird and Biodiversity Areas have been identified on land and at sea. Presented as part of the BirdLife State of the world’s birds website. http://www.birdlife.org/datazone/sowb/casestudy/80. Accessed 17 October 2014
Blyth, S., Ravilious, C., Purwanto, J., Epple, C., Kapos, V., Barus, H., Afkar, H., Setyawan, A. & Bodin, B. (2012) Using spatial information to promote multiple benefits from REDD+ in Indonesia. A compendium of maps for Central Sulawesi Province. Produced by UNEP WCMC (Cambridge) on behalf of The United Nations Collaborative Programme on Reducing Emissions from Deforestation and Forest Degradation in Developing Countries (UN-REDD), Geneva.
Che Piu, H. & Menton, M. (2013) Contexto de REDD+ en Perú: Motores, actores e instituciones. Documentos Ocasionales 90. CIFOR, Bogor.
Eken, G., Bennun, L., Brooks, T. M., Darwall, W., Fishpool, L. D. C., Foster, M. & Tordoff, A. (2004) Key biodiversity areas as site conservation targets. Bioscience, 54(12):1110–1118.
FAO, IIASA, ISRIC, ISS-CAS and JRC (2009). Harmonized World Soil Database (version 1.1). FAO, Rome, Italy and IIASA, Laxenburg, Austria.
Fisher, B., Turner, R.K. & Morling, P. (2009) Defining and classifying ecosystem services for decision making. Ecological Economics, 68(3), 643-653.
Fraser, B. (2014) ‘New rules put nature on balance sheet in Peru’. Thomson Reuters Foundation, 27th May 2014. http://www.trust.org/item/20140526144601-jvm6h/?source=quickview. Accessed on 17 May 2014.
Gamfeldt, L., Snäll, T., Bagchi, R., Jonsson, M., Gustafsson, L., Kjellander, P. & Andren, H. (2013) Higher levels of multiple ecosystem services are found in forests with more tree species. Nature Communications, 4:1340.
GIZ, SERNANP, Reserva Communal El Sira & Ecosira (2011) Adaptive Risk and Vulnerability Management at Conservation Sites (MARISCO) in the Peruvian Amazon. Deutsche Gesellschaft für Internati onale Zusammenarbeit (GIZ) GmbH, Lima.
GOFC-GOLD (2013) A sourcebook of methods and procedures for monitoring and reporting anthropogenic greenhouse gas emissions and removals associated with deforestation, gains and losses of carbon stocks in forests remaining forests, and forestation. GOFC-GOLD Report version COP19-2, GOFC-GOLD Land Cover Project Office, Wageningen University, The Netherlands.
Hiederer, R. & M. Köchy (2011) Global Soil Organic Carbon Estimates and the Harmonized World Soil Database. EUR 25225 EN. Publications Office of the European Union.
Hinsley, A., Entwistle, A. & Pio, D. V. (2014) Does the long-term success of REDD+ also depend on biodiversity? Oryx, (FirstView Oct 2014), 1–6.
Hooper, D. U., Adair, E. C., Cardinale, B. J., Byrnes, J. E. K., Hungate, B. A., Matulich, K. L. & O’Connor, M. I. (2012) A global synthesis reveals biodiversity loss as a major driver of ecosystem change. Nature, 486(7401):105-108.
IPCC (2006) 2006 IPCC Guidelines for National Greenhouse Gas Inventories. Prepared by the National Greenhouse Gas Inventories Programme; Eggleston, H. S., Buendia, L., Miwa, K., Ngara, T. and Tanabe, K. (Eds.) IGES, Japan.
IPCC (2013) Climate Change 2013: The Physical Science Basis. Contribution of Working Group I to the Fifth Assessment Report of the Intergovernmental Panel on Climate Change [Stocker, T.F., D. Qin, G.-K. Plattner, M. Tignor, S.K. Allen, J. Boschung, A. Nauels, Y. Xia, V. Bex and P.M. Midgley (Eds.)]. Cambridge University Press, Cambridge, United Kingdom and New York, NY, USA.
IUCN (2013) The IUCN Red List of Threatened Species Version 2012.3. October 2013. http://iucnredlist.org. Downloaded May 2014.
Kapos, V., Kurz, W. A., Gardner, T., Ferreira, J., Guariguata, M., Koh, L. P. & Van Vliet, N. (2012) Impacts of forest and land management on biodiversity and carbon. In J. A. Parrotta, C. Wildburger, & S. Mansourian (Eds.), Understanding Relationships between Biodiversity, Carbon, Forests and People: The Key to Achieving REDD+ Objectives (IUFRO, 31: 53–80). International Union of Forest Research Organizations (IUFRO), Vienna.
Lal, R. (2004) Soil Carbon Sequestration Impacts on Global Climate Change and Food Security. Science, 304:1623–1627.
Miles, L., Trumper, K., Osti, M., Munroe, R. & Santamaria, C. (2013) REDD+ and the 2020 Aichi Biodiversity Targets; Promoting synergies in international forest conservation effort. UN-REDD Policy Brief 5. The United Nations Collaborative Programme on Reducing Emissions from Deforestation and Forest Degradation in Developing Countries (UN-REDD), Geneva.
Promoting environmental and social benefits of REDD+

in Peru through spatial analysis 34
Ministerio del Ambiente (MINAM) (2010) El Perú y el Cambio Climático, Segunda Comunicación Nacional del Perú a la Convención Marco de las Naciones Unidas sobre Cambio Climático. Ministerio del Ambiente (MINAM), Government of Peru, Lima.
Penman, J., Gytarsky, M., Hiraishi, T., Krug, T., Kruger, D., Pipatti, R., Buendia, L., Miwa, K., Ngara, T., Tanabe, K. & Wagner, F. (2003) Good practice guidance for land use, land-use change and forestry. Intergovernmental Panel on Climate Change.
Peskett, L. & Todd, K.(2013) Putting REDD+ Safeguards and Safeguard Information Systems into Practice. UN-REDD Programme Policy Brief 03. Available from http://www.unredd.net/index.php?option=com_docman&task=doc_download&gid=9167&Itemid=53
Rodríguez, J., Szott, L. & Solano, G. (2014) Elaboración de lineamientos para el desarrollo de la Estrategia Nacional de Bosques y Cambio Climatico. Informe de consultoría. Lima, Perú.
Ruesch, A. S. & Gibbs, H. K. (2008) New IPCC Tier-1 Global Biomass Carbon Map for the Year 2000. Oak Ridge National Laboratory, Carbon Dioxide Information Analysis Center, Tennessee.
Saatchi, S. S., Harris, N. L., Brown, S., Lefsky, M., Mitchard, E. T. A., Salas, W. & Morel, A. (2011) Benchmark map of forest carbon stocks in tropical regions across three continents. Proceedings of the National Academy of Sciences of the United States of America, 108(24):9899–904.
Scharlemann, J. P., Tanner, E. V., Hiederer, R. & Kapos, V. (2014) Global soil carbon: understanding and managing the largest terrestrial carbon pool. Carbon Management, 5(1):81–91.
Soares-Filho, B., Nepstad, D., Curran, L., Voll, E., Cerqueira, G., Garcia, R. A., Ramos, C. A., Mcdonald, A., Lefebvre, P. & Schlesinger, P. (2006) Modeling conservation in the Amazon basin. Nature, London, v. 440:520-523.
Tilman, D., Reich, P. B. & Isbell, F. (2012) Biodiversity impacts ecosystem productivity as much as resources, disturbance, or herbivory. Proceedings of the National Academy of Sciences, 109(26):10394-10397.
Trumper, K., Bertzky, M., Dickson, B., van der Heijden, G., Jenkins, M. & Manning, P. (2009) The Natural Fix? The role of ecosystems in climate mitigation: A UNEP rapid response assessment. UNEP-WCMC, Cambridge.
Walker, W., Baccini, A., Nepstad, M., Horning, N., Knight, D., Braun, E. & Bausch, A. (2011) Field Guide for Forest Biomass and Carbon Estimation. Version 1.0. Woods Hole Research Center, Falmouth, MA.

The goal of REDD+ is to provide incentives for reducing emissions from deforestation and forest degradation, as well as the conservation of forest carbon stocks, sustainable management of forests and the enhancement of forest carbon stocks. If designed and implemented well, such activities can provide a wide range of environmental and social benefits.
This report aims to promote the preparations for REDD+ in Peru, by highlighting some of the potential benefits that can be achieved through REDD+ actions, in addition to the primary aim of climate change mitigation. It presents the results of spatial analyses that can assist decision-makers in planning for REDD+ in a way that generates multiple benefits, and explores the possible contributions that REDD+ can make to the achievement of other policy goals such as the Aichi Biodiversity Targets of the Convention on Biological Diversity, or the objectives of Peru’s National Climate Change Strategy with regard to adaptation.
Contact:UNEP World Conservation Monitoring Centre219 Huntingdon RoadCambridge, CB3 0DL, United KingdomTel: +44 1223 814636Fax: +44 1223 277136E-mail: [email protected]