
Prometheus and Grafana - Cisco...PrometheusandGrafana •Introduction,onpage1...
30
Prometheus and Grafana • Introduction, on page 1 • Enable Prometheus, on page 1 • Add Datasource in Grafana for Prometheus, on page 3 • Grafana, on page 4 • Configure Grafana Users using CLI, on page 4 • Connect to Grafana, on page 5 • Grafana Administrative User, on page 6 • Configure Grafana for First Use, on page 12 • Manual Dashboard Configuration using Grafana, on page 14 • Configure Useful Dashboard Panels, on page 19 • Copy Dashboards and Users to pcrfclient02, on page 21 • Configure Garbage Collector KPIs, on page 22 • Export and Import Dashboards, on page 25 • Export Graph Data to CSV, on page 26 • Session Consumption Report , on page 28 Introduction Prometheus is an application which is a part of monitoring solution in CPS. It is used to actively gather statistics from the running virtual machines and application services. Prometheus application resides on both pcrfclient VMs. It scrapes statistics from collectd exporter after every configured interval and stores in /var/data/Prometheus directory on pcrfclient VMs. To learn more about Prometheus, refer to: https://prometheus.io/docs/introduction/overview/. Enable Prometheus This following sections provides information on how to enable Prometheus on CPS system. • By default, Prometheus is disabled on system. You need to configure Prometheus to start its operation. • You can configure Prometheus using CSV based configurations or API based configurations. Prometheus and Grafana 1
Transcript of Prometheus and Grafana - Cisco...PrometheusandGrafana •Introduction,onpage1...
Prometheus and Grafana
• Introduction, on page 1• Enable Prometheus, on page 1• Add Datasource in Grafana for Prometheus, on page 3• Grafana, on page 4• Configure Grafana Users using CLI, on page 4• Connect to Grafana, on page 5• Grafana Administrative User, on page 6• Configure Grafana for First Use, on page 12• Manual Dashboard Configuration using Grafana, on page 14• Configure Useful Dashboard Panels, on page 19• Copy Dashboards and Users to pcrfclient02, on page 21• Configure Garbage Collector KPIs, on page 22• Export and Import Dashboards, on page 25• Export Graph Data to CSV, on page 26• Session Consumption Report , on page 28
IntroductionPrometheus is an application which is a part of monitoring solution in CPS. It is used to actively gather statisticsfrom the running virtual machines and application services.
Prometheus application resides on both pcrfclient VMs. It scrapes statistics from collectd exporter after everyconfigured interval and stores in /var/data/Prometheus directory on pcrfclient VMs.
To learn more about Prometheus, refer to: https://prometheus.io/docs/introduction/overview/.
Enable PrometheusThis following sections provides information on how to enable Prometheus on CPS system.
• By default, Prometheus is disabled on system. You need to configure Prometheus to start its operation.
• You can configure Prometheus using CSV based configurations or API based configurations.
Prometheus and Grafana1
• By default, statistics granularity is set to 10 seconds. To change it, you need to configure statisticsgranularity. Support is present for both CSV/API based installations.
• After enabling Prometheus, you must add Prometheus data source in Grafana.
• When Prometheus is enabled on the system, existing dashboards created with graphite will not work.You must use Prometheus queries to create new dashboard on the system.
CSV Based Installation Configuration Parameters
Table 1: CSV Based Installation Parameters
DescriptionParameter
This parameter is used to enable/disable Prometheus in CPS.
Default: disabled
Possible Values: enabled, disabled
enable_prometheus
This parameter is used to configure statistics granularity in seconds.
Default: 10 seconds
Possible Values: Positive Number
stats_granularity
For example, in case of CSV based installations, you can configure Configuration.csv with the followingparameters to enable Prometheus on Cluster Manager:cat /var/qps/config/deploy/csv/Configuration.csv | tail -5db_authentication_admin_passwd,72261348A44594381D2E84ADDD1E6D9A,db_authentication_passwd_encryption,true,db_authentication_readonly_passwd,72261348A44594381D2E84ADDD1E6D9A,enable_prometheus,enabled,stats_granularity,1,
After configuring the parameters, run the following commands to import the new configuration to VMs:/var/qps/install/current/scripts/import/import_deploy.sh/var/qps/install/current/scripts/upgrade/reinit.sh
API Based Installation Parameters
Table 2: API Based Installation Parameters
DescriptionParameter
This parameter is used to enable/disable Prometheus in CPS.
Default: disabled
Possible Values: enabled, disabled
enablePrometheus
This parameter is used to configure statistics granularity in seconds.
Default: 10 seconds
Possible Values: Positive Number
statsGranularity
Prometheus and Grafana2
Prometheus and GrafanaEnable Prometheus
In case of API based installations, you need to use api/system/config/config PATCH API from ClusterManager.
For example:cat prom.yamlenablePrometheus: "enabled"statsGranularity: "1"curl -i -X PATCH http://installer:8458/api/system/config/config -H "Content-Type:application/yaml" --data-binary @prom.yamlHTTP/1.1 200 OKDate: Fri, 20 Apr 2018 08:38:20 GMTContent-Length: 0
Add Datasource in Grafana for Prometheus
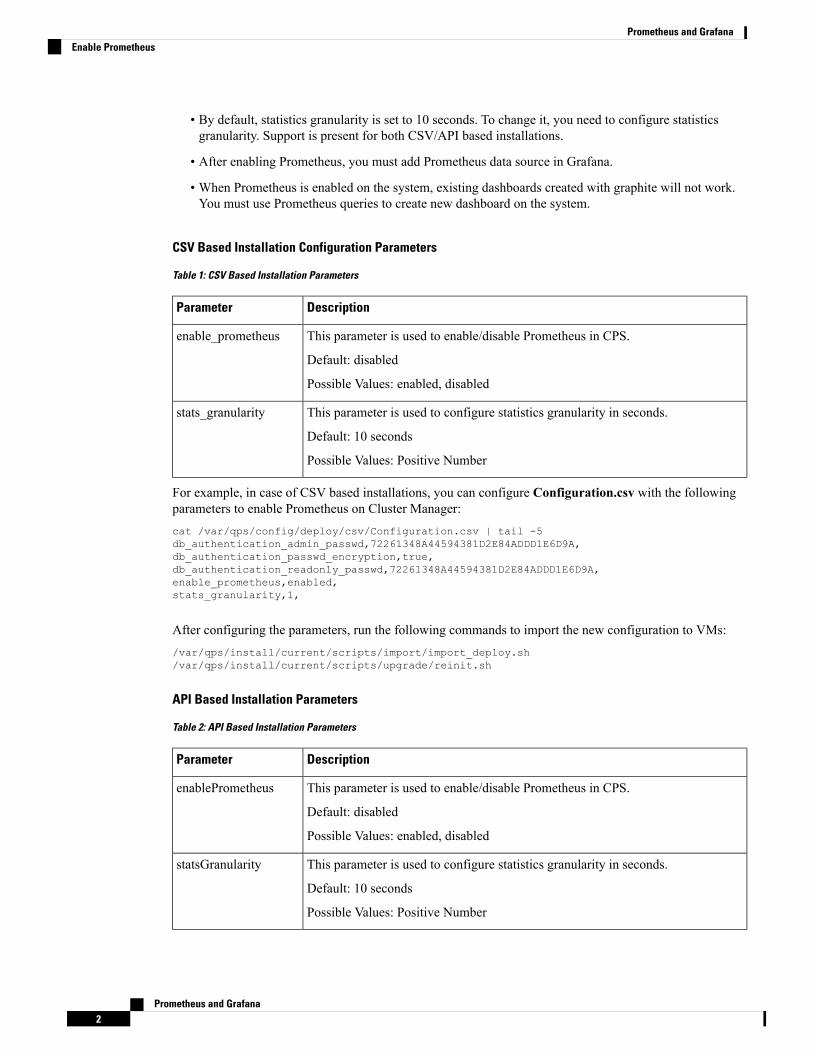
Step 1 Login to Grafana with admin credentials.Step 2 Click on the Grafana logo to open the sidebar menu.
Figure 1: Sidebar Menu
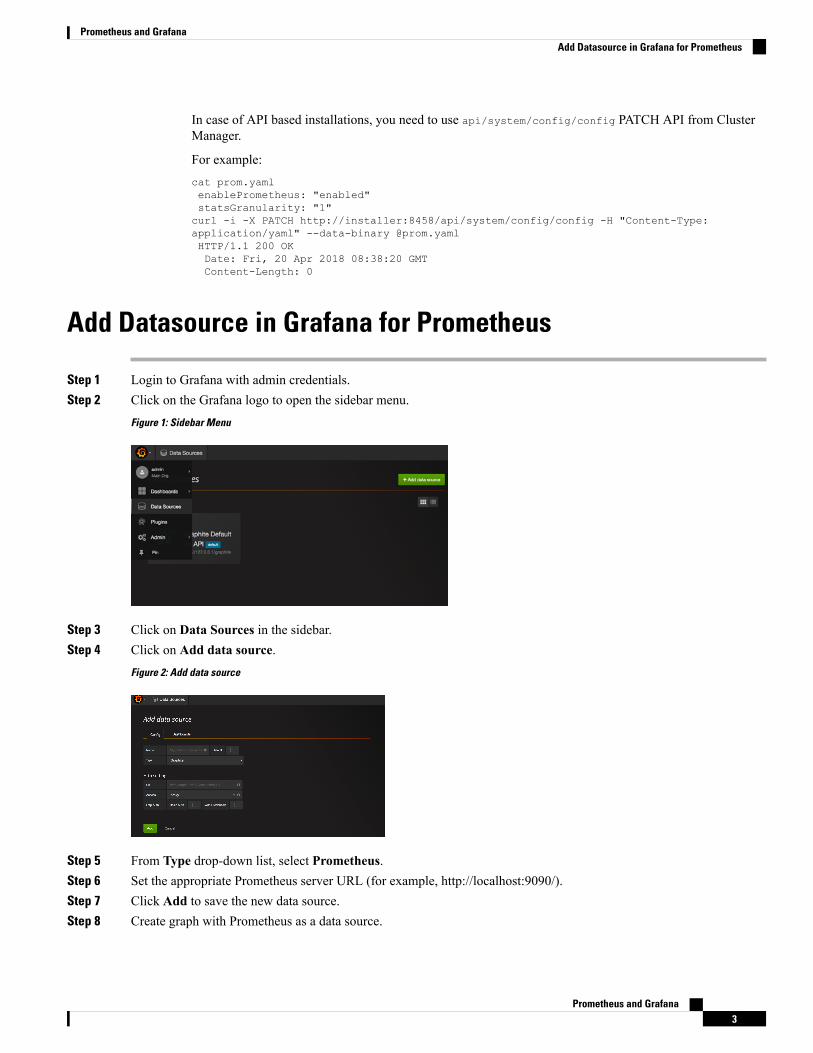
Step 3 Click on Data Sources in the sidebar.Step 4 Click on Add data source.
Figure 2: Add data source
Step 5 From Type drop-down list, select Prometheus.Step 6 Set the appropriate Prometheus server URL (for example, http://localhost:9090/).Step 7 Click Add to save the new data source.Step 8 Create graph with Prometheus as a data source.
Prometheus and Grafana3
Prometheus and GrafanaAdd Datasource in Grafana for Prometheus
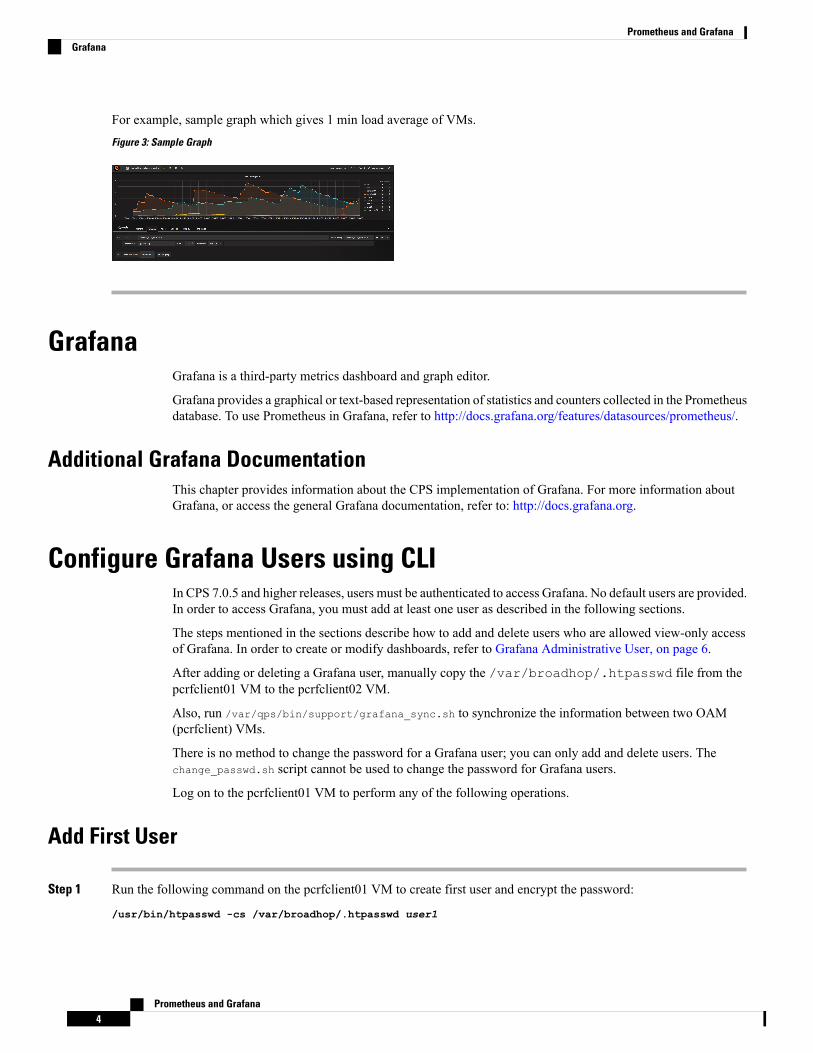
For example, sample graph which gives 1 min load average of VMs.Figure 3: Sample Graph
GrafanaGrafana is a third-party metrics dashboard and graph editor.
Grafana provides a graphical or text-based representation of statistics and counters collected in the Prometheusdatabase. To use Prometheus in Grafana, refer to http://docs.grafana.org/features/datasources/prometheus/.
Additional Grafana DocumentationThis chapter provides information about the CPS implementation of Grafana. For more information aboutGrafana, or access the general Grafana documentation, refer to: http://docs.grafana.org.
Configure Grafana Users using CLIIn CPS 7.0.5 and higher releases, users must be authenticated to access Grafana. No default users are provided.In order to access Grafana, you must add at least one user as described in the following sections.
The steps mentioned in the sections describe how to add and delete users who are allowed view-only accessof Grafana. In order to create or modify dashboards, refer to Grafana Administrative User, on page 6.
After adding or deleting a Grafana user, manually copy the /var/broadhop/.htpasswd file from thepcrfclient01 VM to the pcrfclient02 VM.
Also, run /var/qps/bin/support/grafana_sync.sh to synchronize the information between two OAM(pcrfclient) VMs.
There is no method to change the password for a Grafana user; you can only add and delete users. Thechange_passwd.sh script cannot be used to change the password for Grafana users.
Log on to the pcrfclient01 VM to perform any of the following operations.
Add First User
Step 1 Run the following command on the pcrfclient01 VM to create first user and encrypt the password:
/usr/bin/htpasswd -cs /var/broadhop/.htpasswd user1
Prometheus and Grafana4
Prometheus and GrafanaGrafana
Step 2 When prompted for a password, enter and re-enter the password.
This step creates a password file and forces SHA encryption of the password.
Add Another User
Step 1 Run the following command on the pcrfclient01 VM to create another user:
/usr/bin/htpasswd -s /var/broadhop/.htpasswd user2
Step 2 When prompted for a password, enter and re-enter the password.
This step creates a password file and forces SHA encryption of the password.
Delete a User
Run the following command on the pcrfclient01 VM:
/usr/bin/htpasswd -D /var/broadhop/.htpasswd user2
Connect to GrafanaUse the following URL to access Grafana.
• HA: https://<lbvip01>:9443/grafana
• All in One: http://<ip>:80/grafana
When prompted, enter the username and password of a user you created in Configure Grafana Users usingCLI, on page 4.
Prometheus and Grafana5
Prometheus and GrafanaAdd Another User
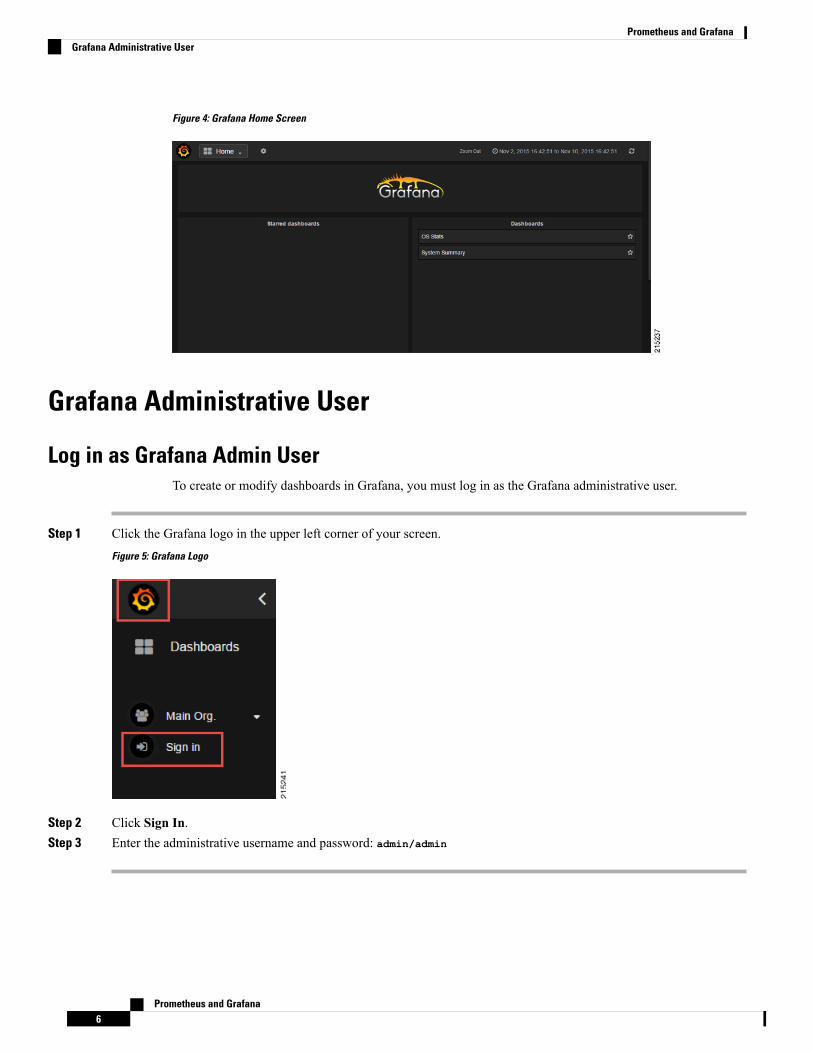
Figure 4: Grafana Home Screen
Grafana Administrative User
Log in as Grafana Admin UserTo create or modify dashboards in Grafana, you must log in as the Grafana administrative user.
Step 1 Click the Grafana logo in the upper left corner of your screen.Figure 5: Grafana Logo
Step 2 Click Sign In.Step 3 Enter the administrative username and password: admin/admin
Prometheus and Grafana6
Prometheus and GrafanaGrafana Administrative User
Change Grafana Admin User Credentials
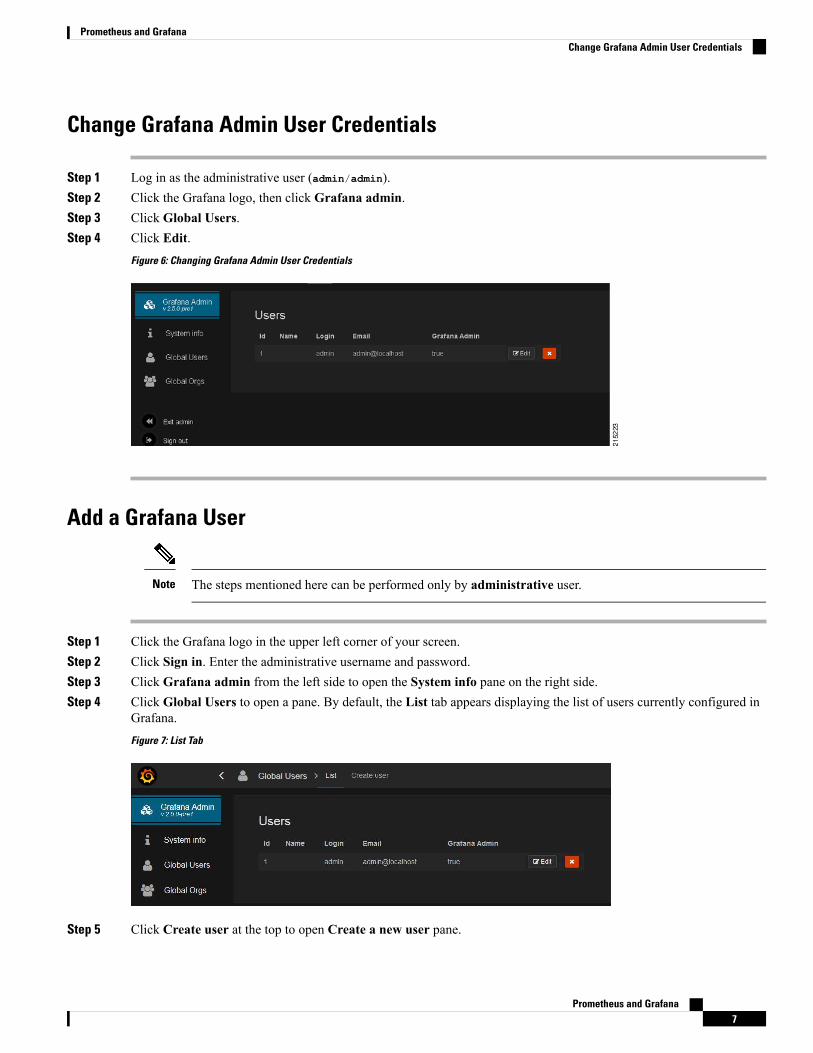
Step 1 Log in as the administrative user (admin/admin).Step 2 Click the Grafana logo, then click Grafana admin.Step 3 Click Global Users.Step 4 Click Edit.
Figure 6: Changing Grafana Admin User Credentials
Add a Grafana User
The steps mentioned here can be performed only by administrative user.Note
Step 1 Click the Grafana logo in the upper left corner of your screen.Step 2 Click Sign in. Enter the administrative username and password.Step 3 Click Grafana admin from the left side to open the System info pane on the right side.Step 4 Click Global Users to open a pane. By default, the List tab appears displaying the list of users currently configured in
Grafana.Figure 7: List Tab
Step 5 Click Create user at the top to open Create a new user pane.
Prometheus and Grafana7
Prometheus and GrafanaChange Grafana Admin User Credentials
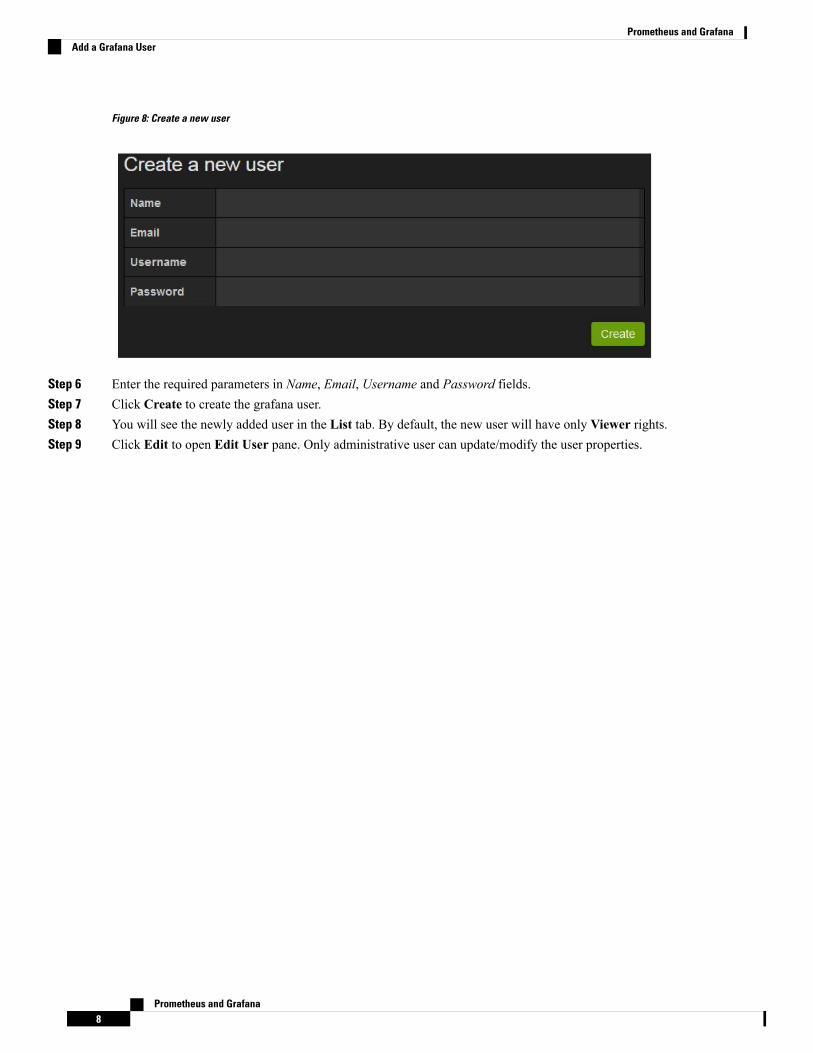
Figure 8: Create a new user
Step 6 Enter the required parameters in Name, Email, Username and Password fields.Step 7 Click Create to create the grafana user.Step 8 You will see the newly added user in the List tab. By default, the new user will have only Viewer rights.Step 9 Click Edit to open Edit User pane. Only administrative user can update/modify the user properties.
Prometheus and Grafana8
Prometheus and GrafanaAdd a Grafana User
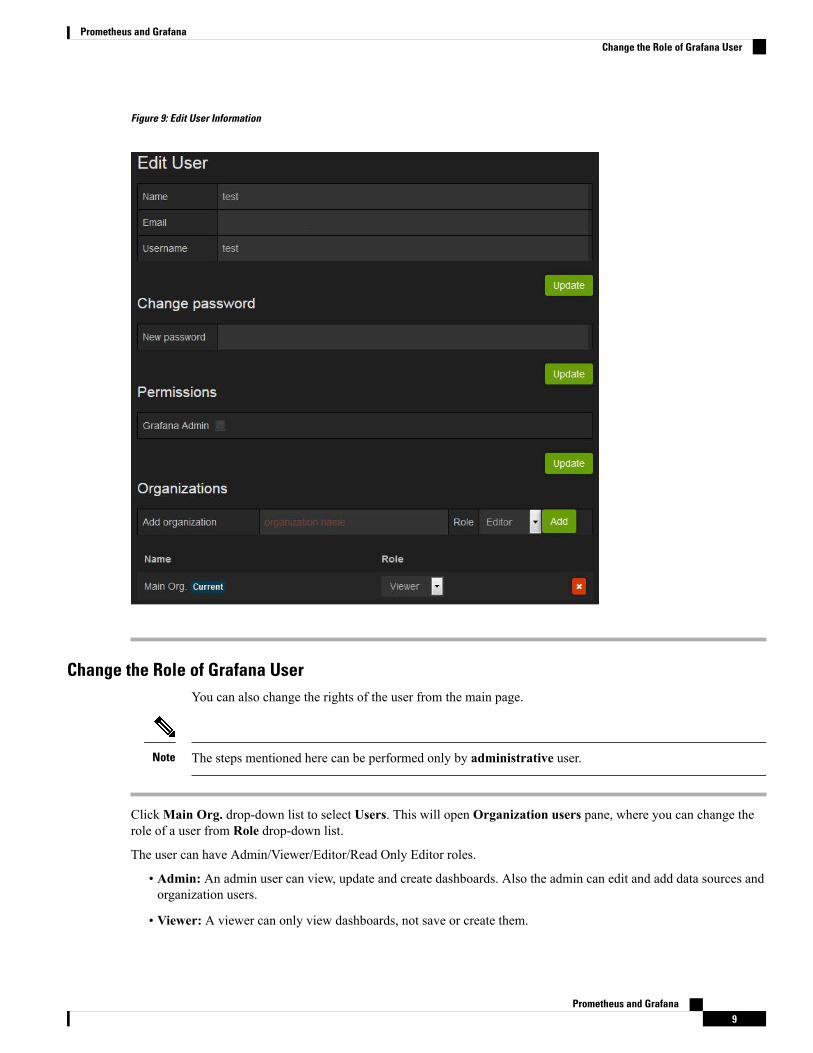
Figure 9: Edit User Information
Change the Role of Grafana UserYou can also change the rights of the user from the main page.
The steps mentioned here can be performed only by administrative user.Note
ClickMain Org. drop-down list to select Users. This will open Organization users pane, where you can change therole of a user from Role drop-down list.
The user can have Admin/Viewer/Editor/Read Only Editor roles.
• Admin: An admin user can view, update and create dashboards. Also the admin can edit and add data sources andorganization users.
• Viewer: A viewer can only view dashboards, not save or create them.
Prometheus and Grafana9
Prometheus and GrafanaChange the Role of Grafana User
• Editor: An editor can view, update and create dashboards.
• Read Only Editor: This role behaves just like the Viewer role. The only difference is that you can edit graphs andqueries but not save dashboards. The Viewer role has been modified in Grafana 2.1 so that users assigned this rolecan no longer edit panels.
Add an OrganizationGrafana supports multiple organizations in order to support a wide variety of deployment models, includingusing a single Grafana instance to provide service to multiple potentially untrusted Organizations.
In many cases, Grafana will be deployed with a single Organization. Each Organization can have one or moreData Sources. All Dashboards are owned by a particular Organization.
The steps mentioned here can be performed only by administrative user.Note
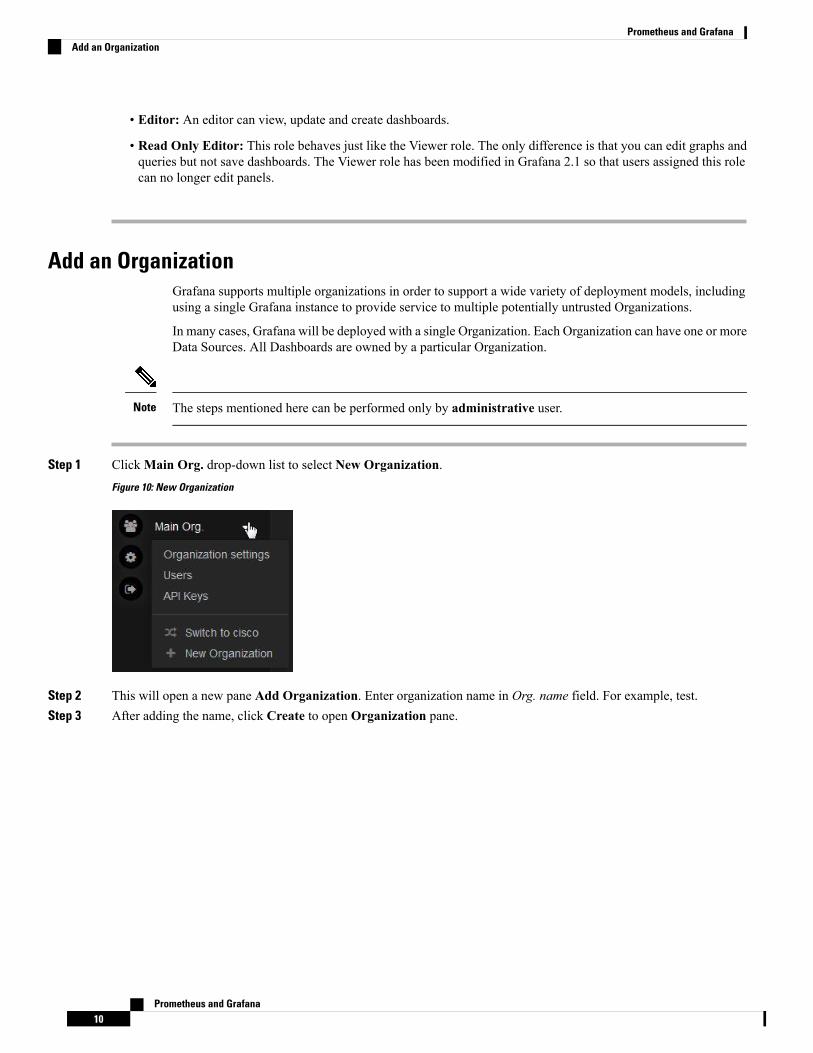
Step 1 ClickMain Org. drop-down list to select New Organization.Figure 10: New Organization
Step 2 This will open a new pane Add Organization. Enter organization name in Org. name field. For example, test.Step 3 After adding the name, click Create to open Organization pane.
Prometheus and Grafana10
Prometheus and GrafanaAdd an Organization
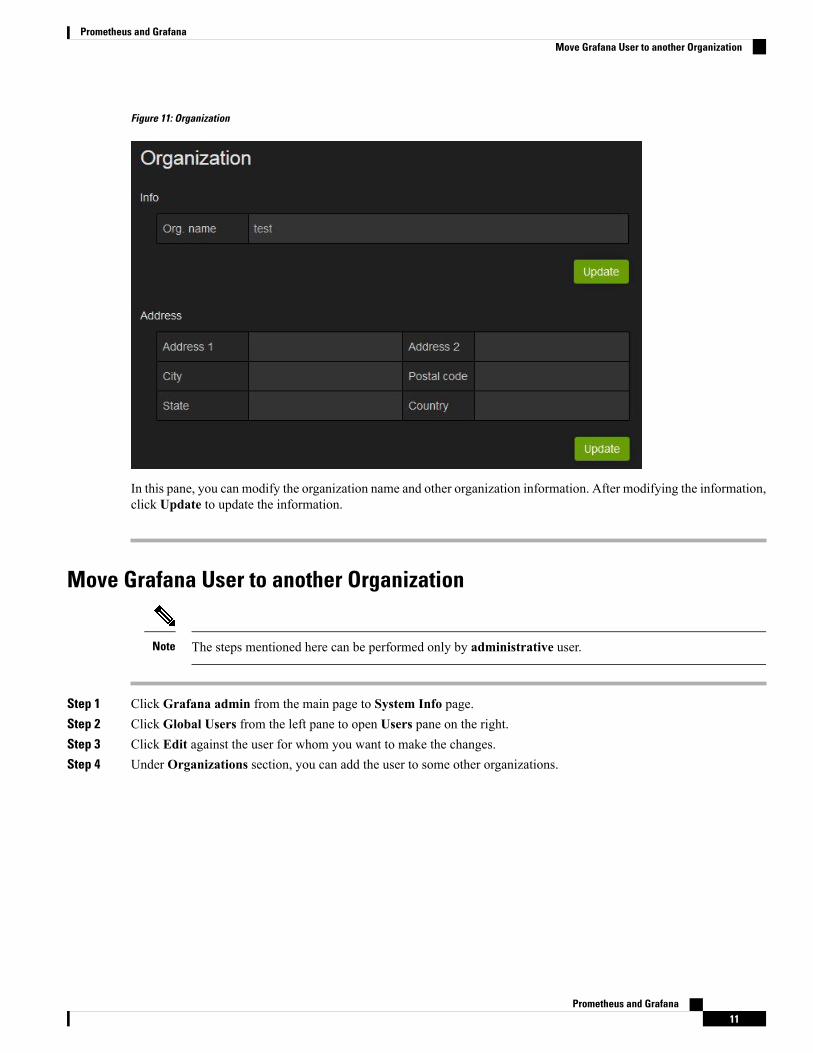
Figure 11: Organization
In this pane, you can modify the organization name and other organization information. After modifying the information,click Update to update the information.
Move Grafana User to another Organization
The steps mentioned here can be performed only by administrative user.Note
Step 1 Click Grafana admin from the main page to System Info page.Step 2 Click Global Users from the left pane to open Users pane on the right.Step 3 Click Edit against the user for whom you want to make the changes.Step 4 Under Organizations section, you can add the user to some other organizations.
Prometheus and Grafana11
Prometheus and GrafanaMove Grafana User to another Organization
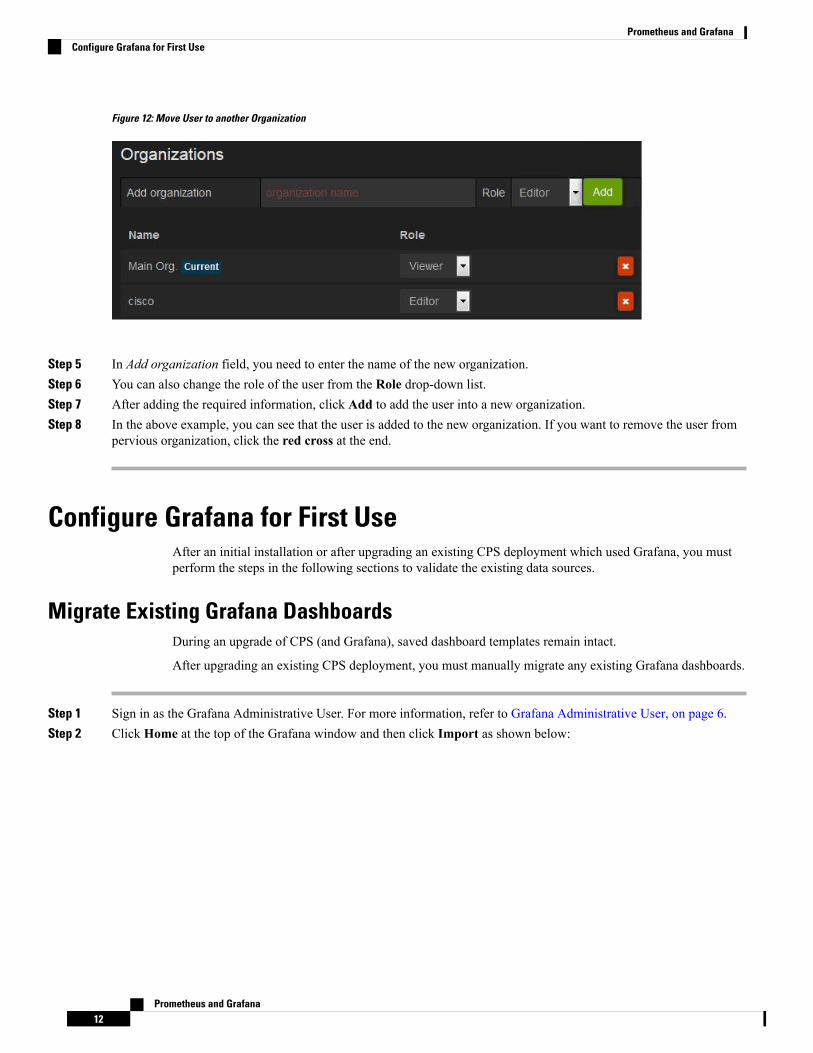
Figure 12: Move User to another Organization
Step 5 In Add organization field, you need to enter the name of the new organization.Step 6 You can also change the role of the user from the Role drop-down list.Step 7 After adding the required information, click Add to add the user into a new organization.Step 8 In the above example, you can see that the user is added to the new organization. If you want to remove the user from
pervious organization, click the red cross at the end.
Configure Grafana for First UseAfter an initial installation or after upgrading an existing CPS deployment which used Grafana, you mustperform the steps in the following sections to validate the existing data sources.
Migrate Existing Grafana DashboardsDuring an upgrade of CPS (and Grafana), saved dashboard templates remain intact.
After upgrading an existing CPS deployment, you must manually migrate any existing Grafana dashboards.
Step 1 Sign in as the Grafana Administrative User. For more information, refer to Grafana Administrative User, on page 6.Step 2 Click Home at the top of the Grafana window and then click Import as shown below:
Prometheus and Grafana12
Prometheus and GrafanaConfigure Grafana for First Use
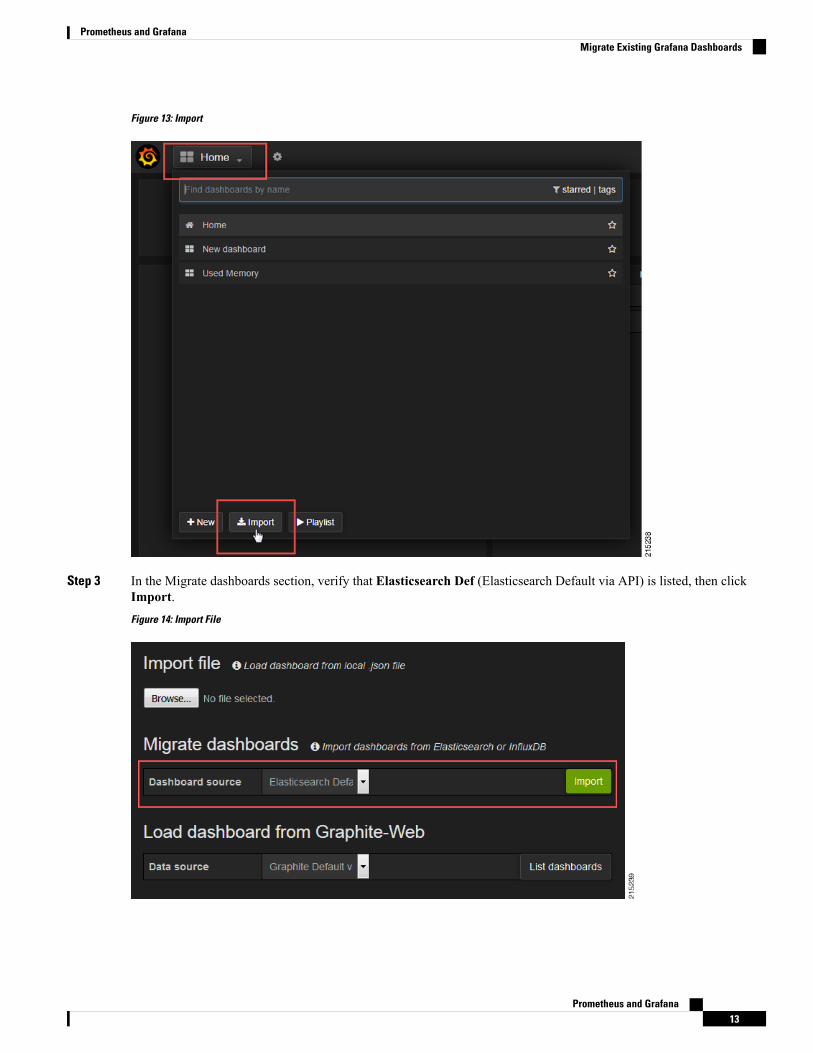
Figure 13: Import
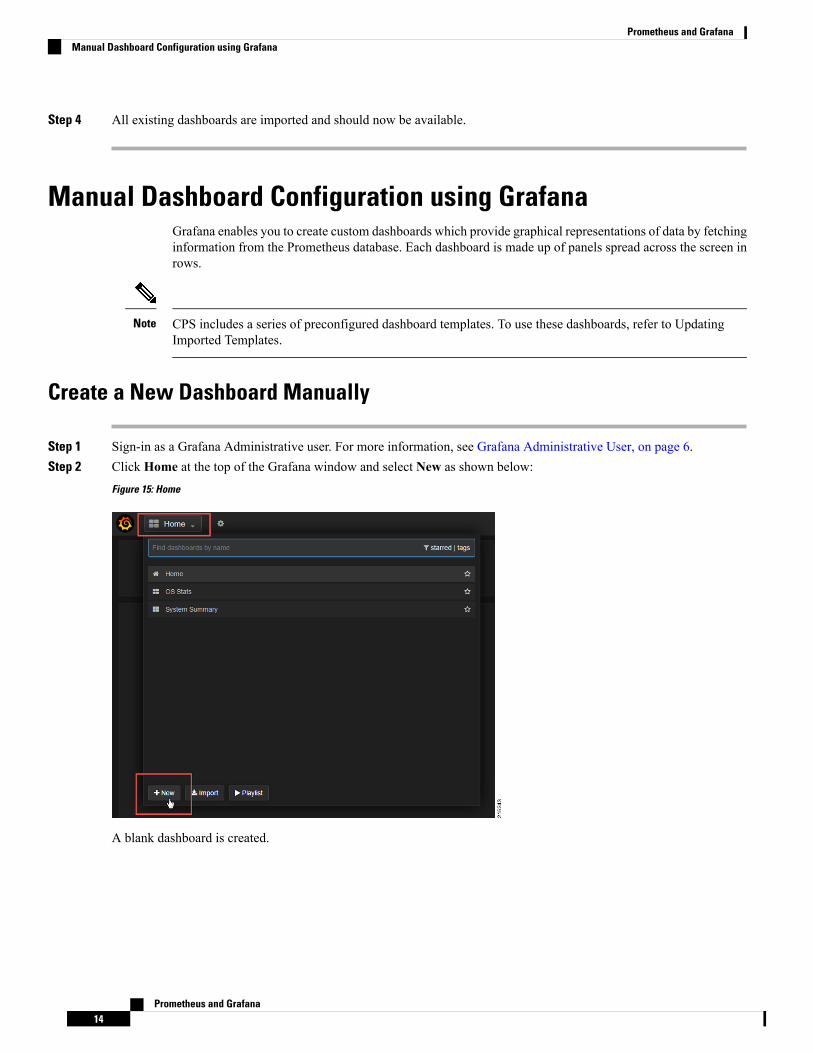
Step 3 In the Migrate dashboards section, verify that Elasticsearch Def (Elasticsearch Default via API) is listed, then clickImport.Figure 14: Import File
Prometheus and Grafana13
Prometheus and GrafanaMigrate Existing Grafana Dashboards
Step 4 All existing dashboards are imported and should now be available.
Manual Dashboard Configuration using GrafanaGrafana enables you to create custom dashboards which provide graphical representations of data by fetchinginformation from the Prometheus database. Each dashboard is made up of panels spread across the screen inrows.
CPS includes a series of preconfigured dashboard templates. To use these dashboards, refer to UpdatingImported Templates.
Note
Create a New Dashboard Manually
Step 1 Sign-in as a Grafana Administrative user. For more information, see Grafana Administrative User, on page 6.Step 2 Click Home at the top of the Grafana window and select New as shown below:
Figure 15: Home
A blank dashboard is created.
Prometheus and Grafana14
Prometheus and GrafanaManual Dashboard Configuration using Grafana
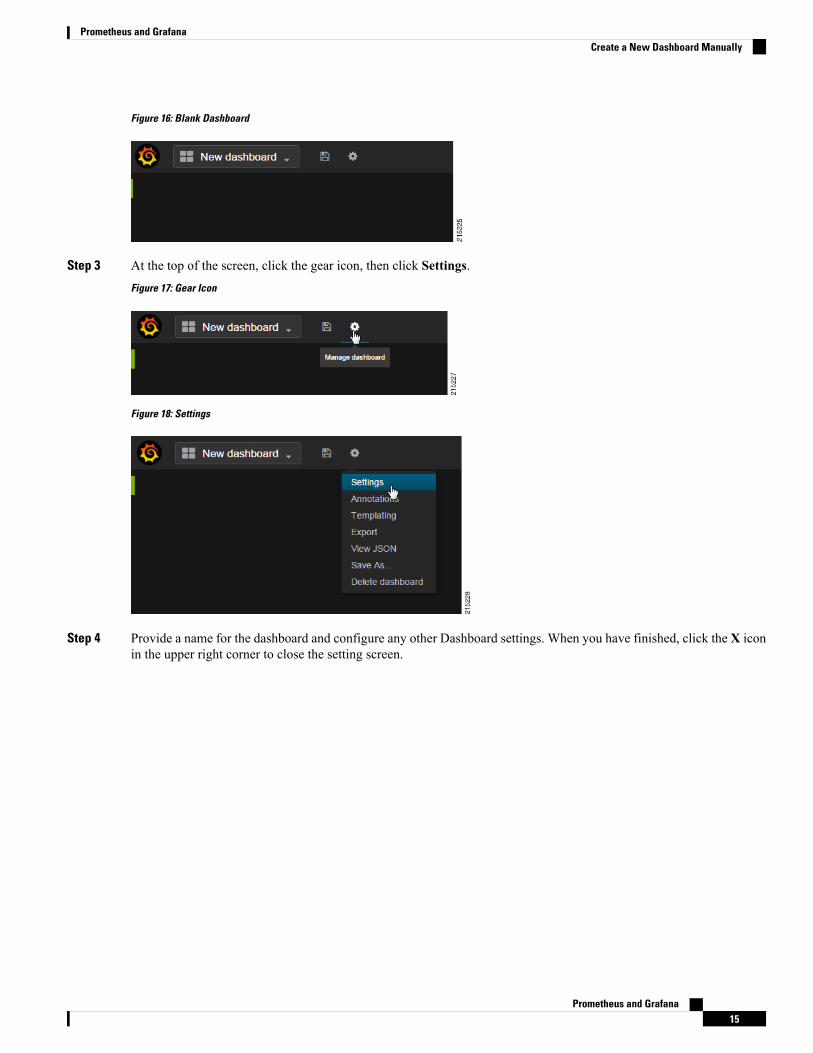
Figure 16: Blank Dashboard
Step 3 At the top of the screen, click the gear icon, then click Settings.Figure 17: Gear Icon
Figure 18: Settings
Step 4 Provide a name for the dashboard and configure any other Dashboard settings. When you have finished, click the X iconin the upper right corner to close the setting screen.
Prometheus and Grafana15
Prometheus and GrafanaCreate a New Dashboard Manually
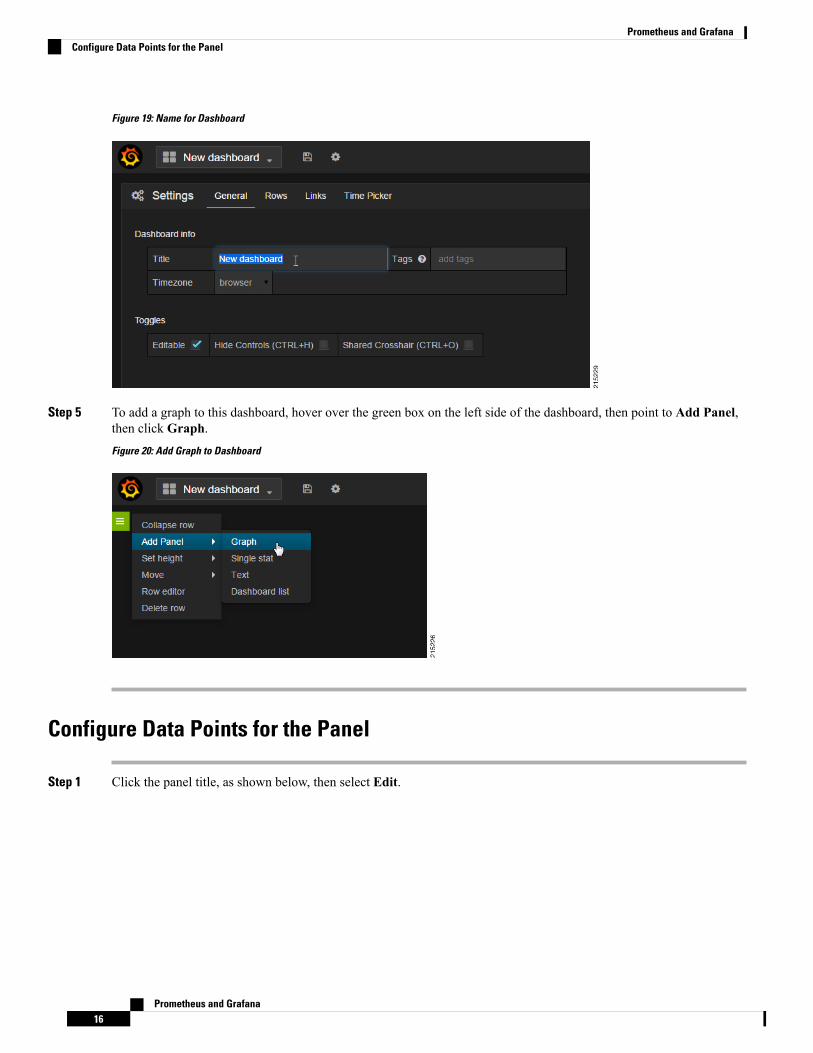
Figure 19: Name for Dashboard
Step 5 To add a graph to this dashboard, hover over the green box on the left side of the dashboard, then point to Add Panel,then click Graph.Figure 20: Add Graph to Dashboard
Configure Data Points for the Panel
Step 1 Click the panel title, as shown below, then select Edit.
Prometheus and Grafana16
Prometheus and GrafanaConfigure Data Points for the Panel
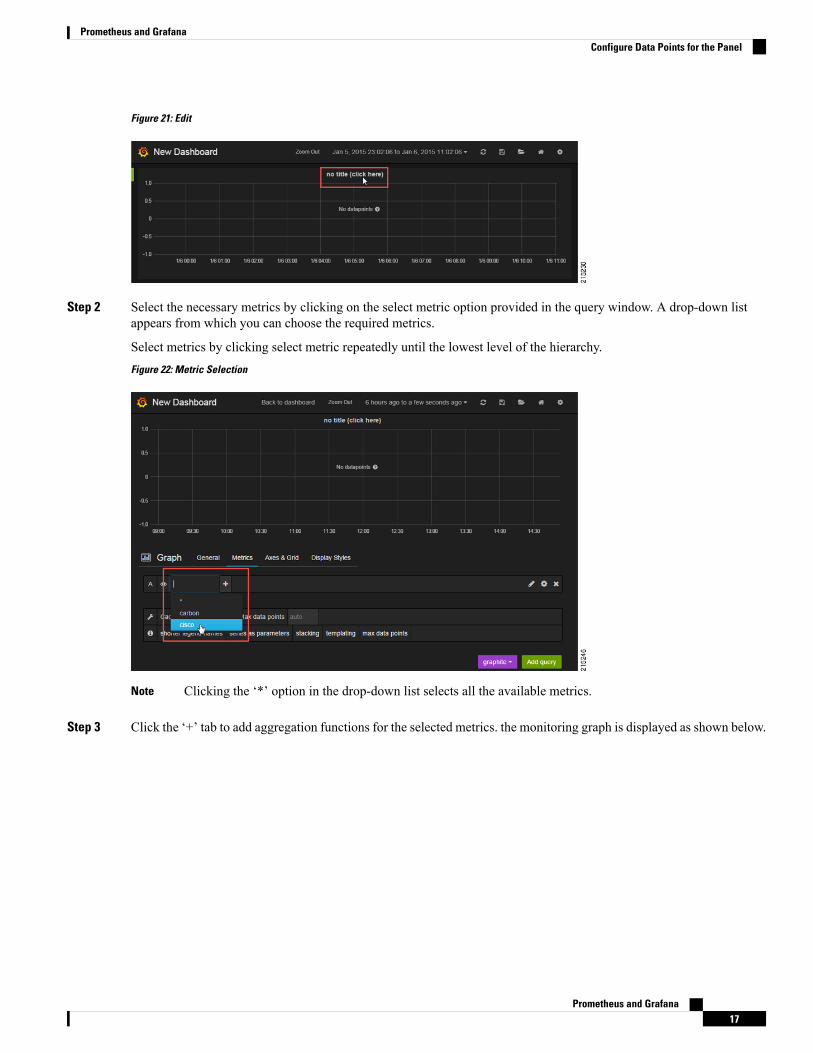
Figure 21: Edit
Step 2 Select the necessary metrics by clicking on the select metric option provided in the query window. A drop-down listappears from which you can choose the required metrics.
Select metrics by clicking select metric repeatedly until the lowest level of the hierarchy.Figure 22: Metric Selection
Clicking the ‘*’ option in the drop-down list selects all the available metrics.Note
Step 3 Click the ‘+’ tab to add aggregation functions for the selected metrics. the monitoring graph is displayed as shown below.
Prometheus and Grafana17
Prometheus and GrafanaConfigure Data Points for the Panel
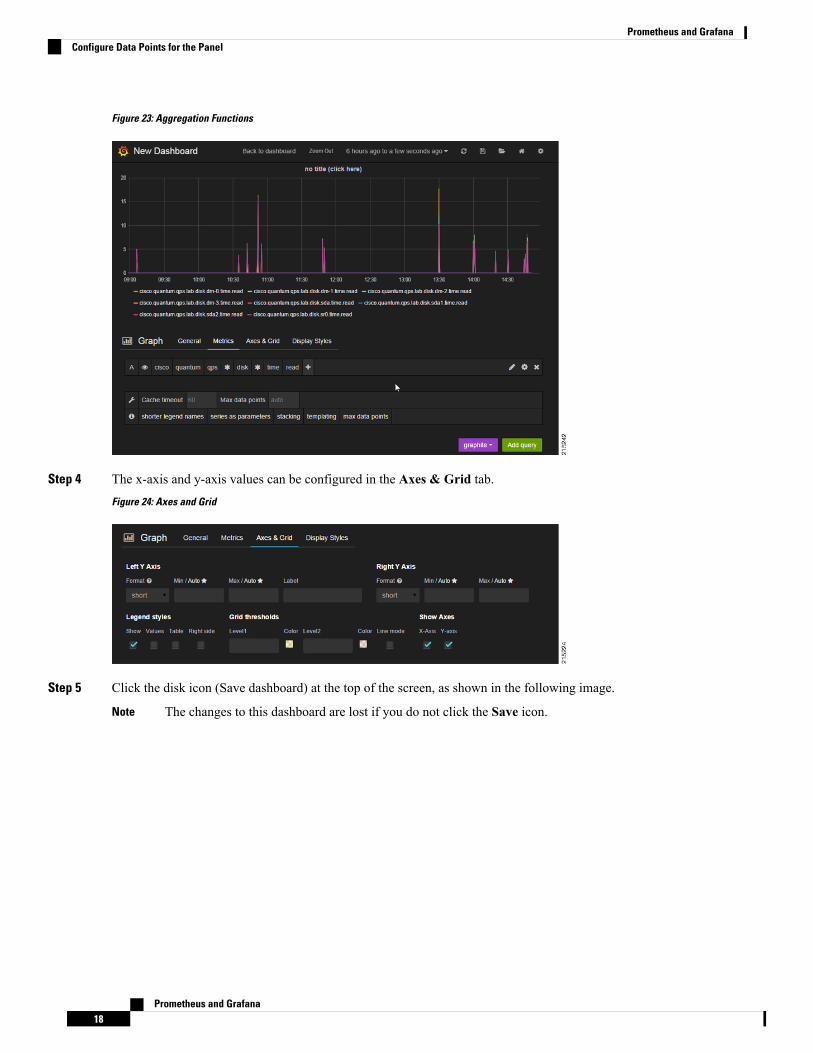
Figure 23: Aggregation Functions
Step 4 The x-axis and y-axis values can be configured in the Axes & Grid tab.Figure 24: Axes and Grid
Step 5 Click the disk icon (Save dashboard) at the top of the screen, as shown in the following image.
The changes to this dashboard are lost if you do not click the Save icon.Note
Prometheus and Grafana18
Prometheus and GrafanaConfigure Data Points for the Panel
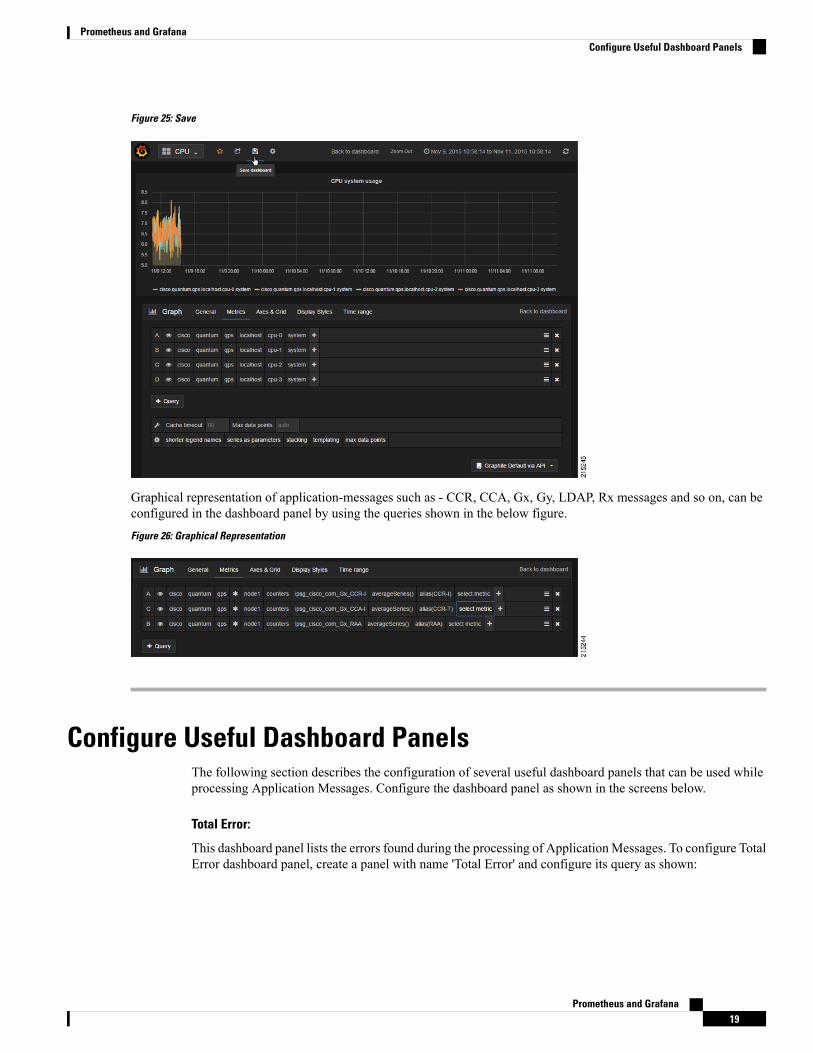
Figure 25: Save
Graphical representation of application-messages such as - CCR, CCA, Gx, Gy, LDAP, Rx messages and so on, can beconfigured in the dashboard panel by using the queries shown in the below figure.Figure 26: Graphical Representation
Configure Useful Dashboard PanelsThe following section describes the configuration of several useful dashboard panels that can be used whileprocessing Application Messages. Configure the dashboard panel as shown in the screens below.
Total Error:
This dashboard panel lists the errors found during the processing of ApplicationMessages. To configure TotalError dashboard panel, create a panel with name 'Total Error' and configure its query as shown:
Prometheus and Grafana19
Prometheus and GrafanaConfigure Useful Dashboard Panels
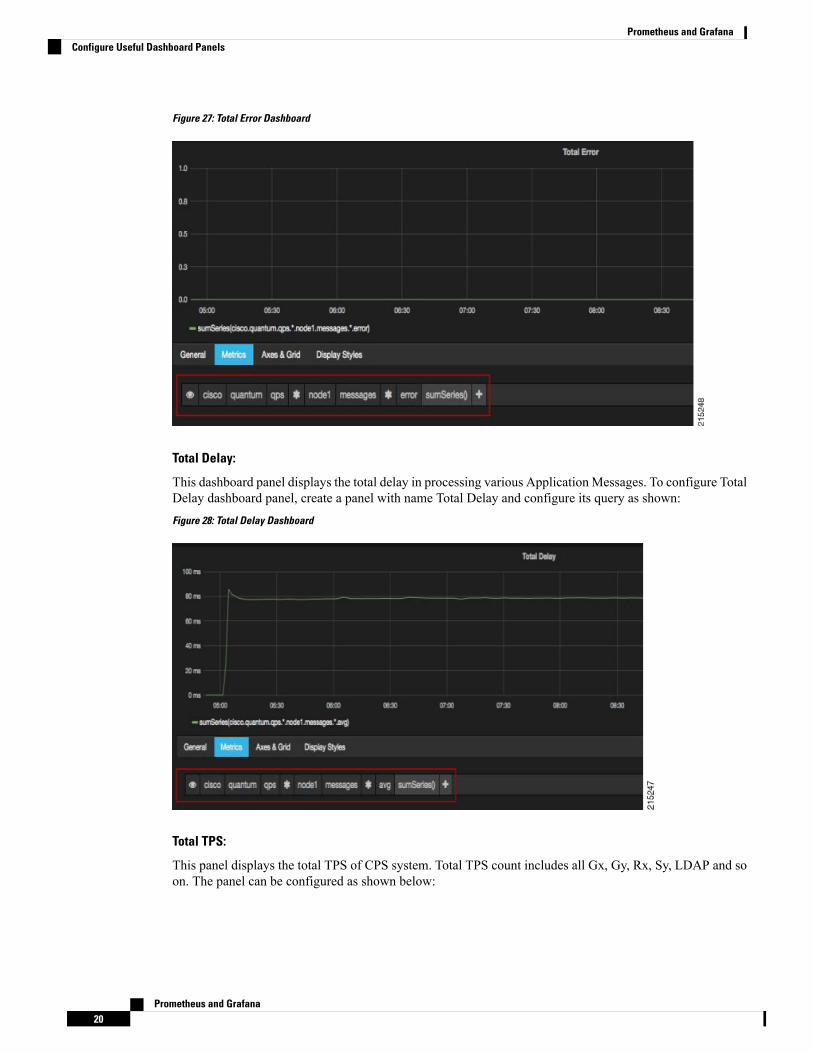
Figure 27: Total Error Dashboard
Total Delay:
This dashboard panel displays the total delay in processing various Application Messages. To configure TotalDelay dashboard panel, create a panel with name Total Delay and configure its query as shown:Figure 28: Total Delay Dashboard
Total TPS:
This panel displays the total TPS of CPS system. Total TPS count includes all Gx, Gy, Rx, Sy, LDAP and soon. The panel can be configured as shown below:
Prometheus and Grafana20
Prometheus and GrafanaConfigure Useful Dashboard Panels
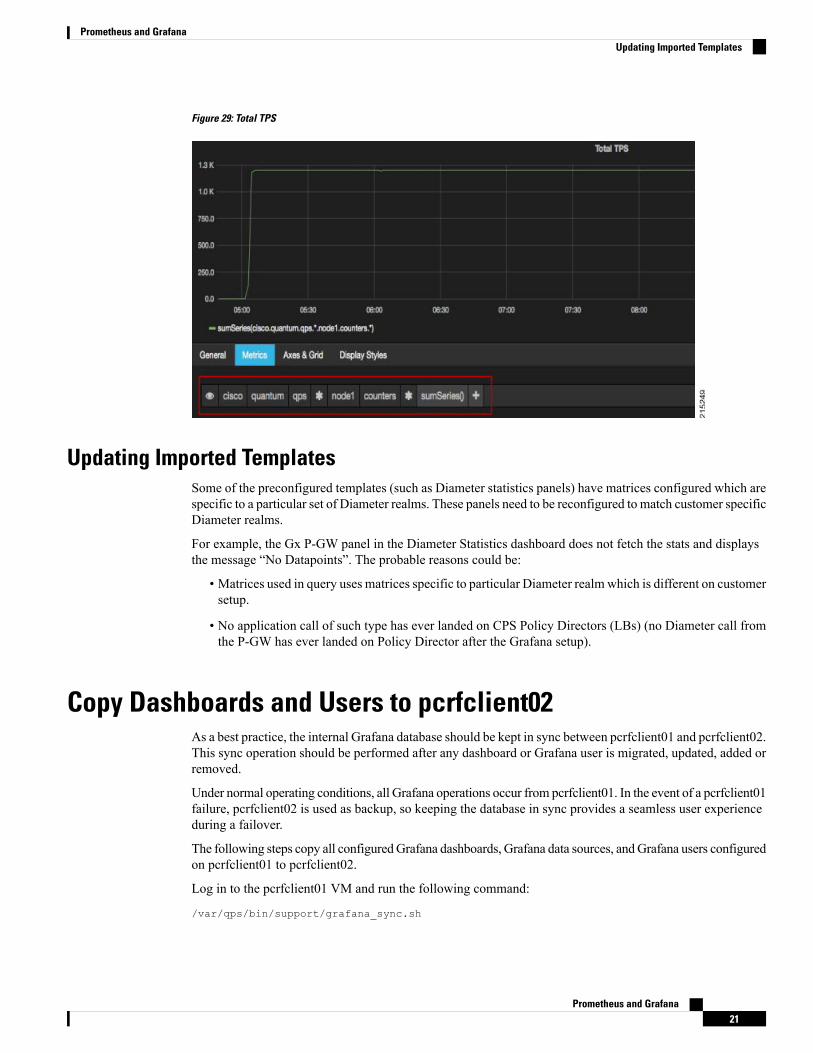
Figure 29: Total TPS
Updating Imported TemplatesSome of the preconfigured templates (such as Diameter statistics panels) have matrices configured which arespecific to a particular set of Diameter realms. These panels need to be reconfigured to match customer specificDiameter realms.
For example, the Gx P-GW panel in the Diameter Statistics dashboard does not fetch the stats and displaysthe message “No Datapoints”. The probable reasons could be:
• Matrices used in query uses matrices specific to particular Diameter realmwhich is different on customersetup.
• No application call of such type has ever landed on CPS Policy Directors (LBs) (no Diameter call fromthe P-GW has ever landed on Policy Director after the Grafana setup).
Copy Dashboards and Users to pcrfclient02As a best practice, the internal Grafana database should be kept in sync between pcrfclient01 and pcrfclient02.This sync operation should be performed after any dashboard or Grafana user is migrated, updated, added orremoved.
Under normal operating conditions, all Grafana operations occur from pcrfclient01. In the event of a pcrfclient01failure, pcrfclient02 is used as backup, so keeping the database in sync provides a seamless user experienceduring a failover.
The following steps copy all configuredGrafana dashboards, Grafana data sources, andGrafana users configuredon pcrfclient01 to pcrfclient02.
Log in to the pcrfclient01 VM and run the following command:
/var/qps/bin/support/grafana_sync.sh
Prometheus and Grafana21
Prometheus and GrafanaUpdating Imported Templates
As a precaution, the existing database on pcrfclient02 is saved as a backup in the /var/lib/grafana directory.
Configure Garbage Collector KPIsThe following sections describe the steps to configure Garbage Collector (GC) KPIs in Grafana:
• Backend changes: Changes in the collectd configuration so that GC related KPIs will be collected bycollectd and stored in graphite database.
• Frontend changes: Changes in Grafana GUI for configuring metrics for GC graph.
Backend ChangesCheck if the following changes are already present in the jmxplugin.conf file. If already configured, then skipthis section and move to configuring the Grafana dashboard.
Step 1 Edit/etc/puppet/modules/qps/templates/collectd_worker/collectd.d/jmxplugin.conf onthe Cluster Manager VM as described in the following steps.
Step 2 Verify that the JMX plugin is enabled. The following lines must be present in the jmxplugin.conf file.JVMARG has path for jmx jar
JVMARG
-Djava.class.path=/usr/share/collectd/java/collectd-api.jar/usr/share/collectd/java/generic-jmx.jar
And GenericJMX plugin is loaded
LoadPlugin org.collectd.java.GenericJMX
Step 3 Add anMbean entry for garbage collector mbean in GenericJMX plugin so that statistics from this mbean will be collected.
# Garbage collector information<MBean "garbage_collector">
ObjectName "java.lang:type=GarbageCollector,*"InstancePrefix "gc-"InstanceFrom "name"
<Value>Type "invocations"#InstancePrefix ""#InstanceFrom ""Table falseAttribute "CollectionCount"
</Value><Value>
Type "total_time_in_ms"InstancePrefix "collection_time"#InstanceFrom ""Table falseAttribute "CollectionTime"
</Value></MBean>
Step 4 For every “Connection” block in jmxplugin.conf file add the entry for garbage collector mbean.
Prometheus and Grafana22
Prometheus and GrafanaConfigure Garbage Collector KPIs
For example:<Connection>InstancePrefix "node1."
ServiceURL "service:jmx:rmi:///jndi/rmi://localhost:9053/jmxrmi"Collect "garbage_collector"Collect "java-memory"Collect "thread"Collect "classes"Collect "qns-counters"Collect "qns-actions"Collect "qns-messages"</Connection>]
Step 5 Save the changes to the jmxplugin.conf file then synchronize the changes to all CPS VMs as follows:a) Go to the /var/qps/install/current/scripts/build/ directory on the Cluster Manager and execute
the following script:
./build_puppet.sh
b) Go to the /var/qps/install/current/scripts/upgrade/ directory on the ClusterManager and executethe following command:./reinit.sh
c) Restart the collectd service on all VMs by running the following command on each VM in the CPS cluster:monit restart collectd
Frontend ChangesThe frontend changes must be done in the Grafana GUI.
Step 1 Create a new Grafana dashboard. For more information, see Manual Dashboard Configuration using Grafana, on page14.
Step 2 In theMetrics tab of the new dashboard, configure queries for GC related KPIs.
The query needs to be configured in the following format:cisco.quantum.qps.<hostname>.node*. gc*.total_time_in_ms-collection_time
cisco.quantum.qps.<hostname>.node*.gc*.invocations
where, <hostname> is regular expression for the name of hosts from which KPI needs to be reported.
If this is a CPS All in One (AIO) deployment, the hostname is “lab”.
If this is a High Availability (HA) CPS deployment, KPIs need to be reported from all Policy Server (QNS) VMs.
Assuming the Policy Server (QNS) VMs have “qns” in their hostname, then a regular expression would be *qns*. Thiswould report data for all VMs that have a hostname containing “qns” (qns01 qns02 and so on).
• AIO Setup
Prometheus and Grafana23
Prometheus and GrafanaFrontend Changes
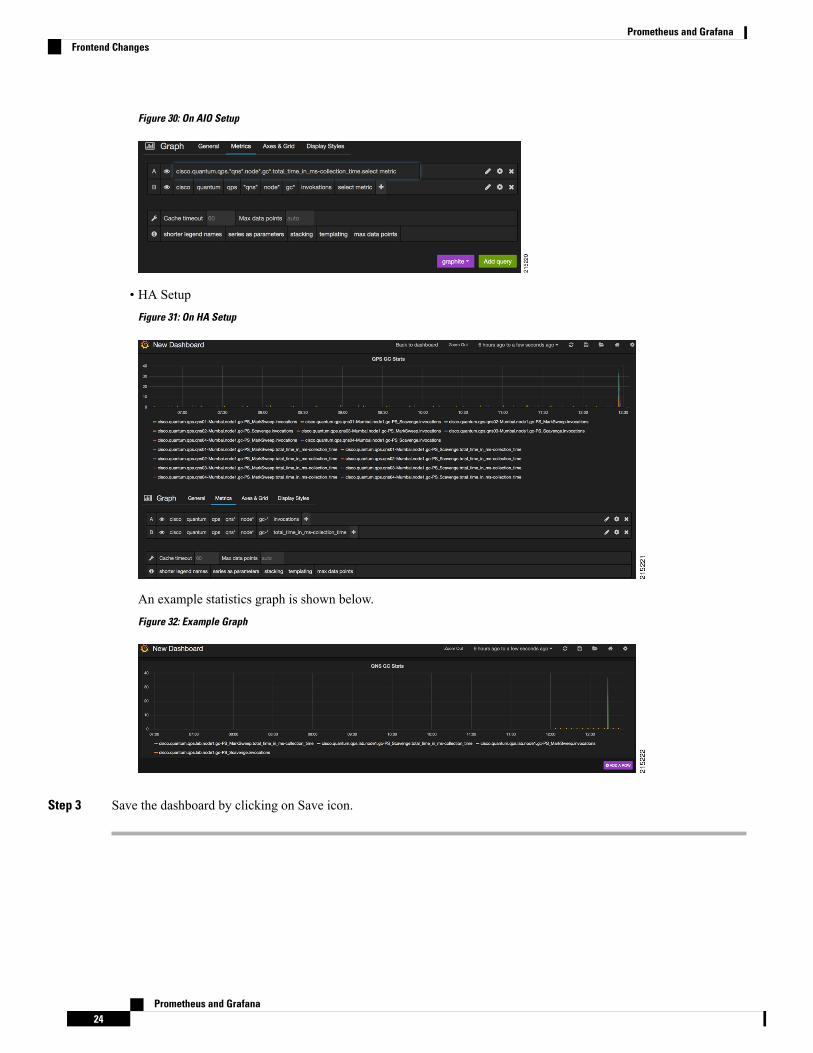
Figure 30: On AIO Setup
• HA SetupFigure 31: On HA Setup
An example statistics graph is shown below.Figure 32: Example Graph
Step 3 Save the dashboard by clicking on Save icon.
Prometheus and Grafana24
Prometheus and GrafanaFrontend Changes
Export and Import DashboardsExisting dashboard templates can be exported and imported between environments. This is useful for sharingGrafana dashboards with others.
Export DashboardThis topic describes how to export a dashboard configuration to a file.
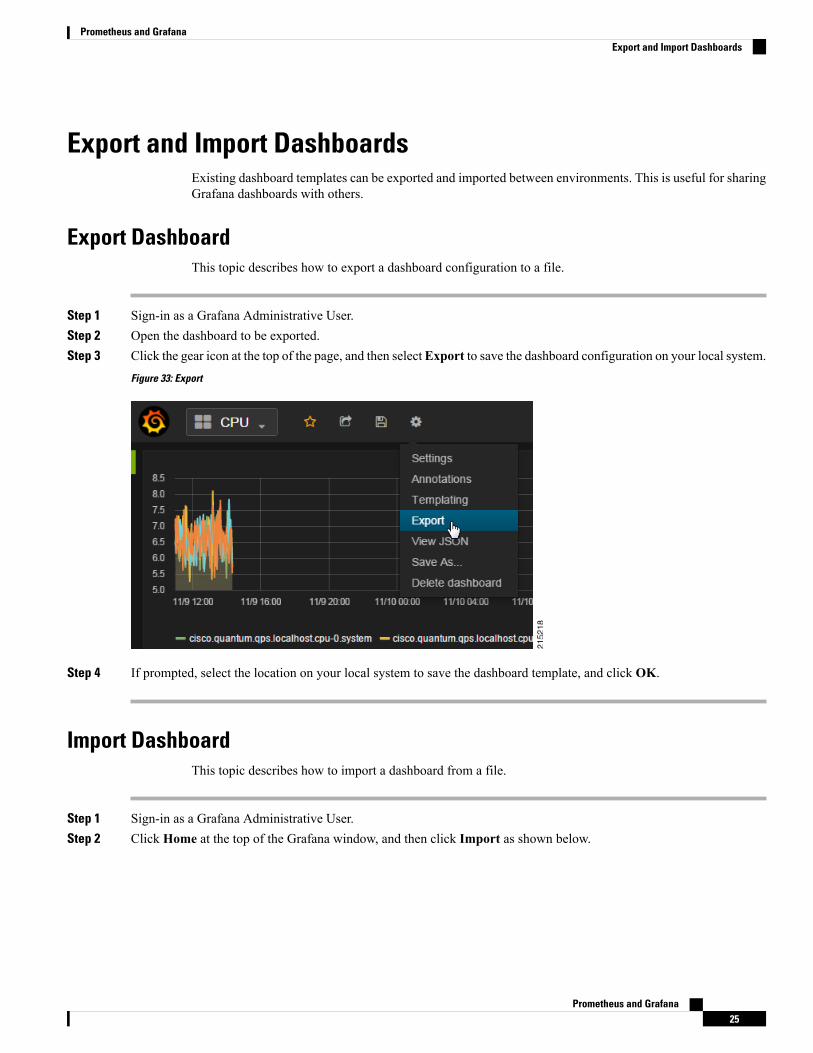
Step 1 Sign-in as a Grafana Administrative User.Step 2 Open the dashboard to be exported.Step 3 Click the gear icon at the top of the page, and then selectExport to save the dashboard configuration on your local system.
Figure 33: Export
Step 4 If prompted, select the location on your local system to save the dashboard template, and click OK.
Import DashboardThis topic describes how to import a dashboard from a file.
Step 1 Sign-in as a Grafana Administrative User.Step 2 Click Home at the top of the Grafana window, and then click Import as shown below.
Prometheus and Grafana25
Prometheus and GrafanaExport and Import Dashboards
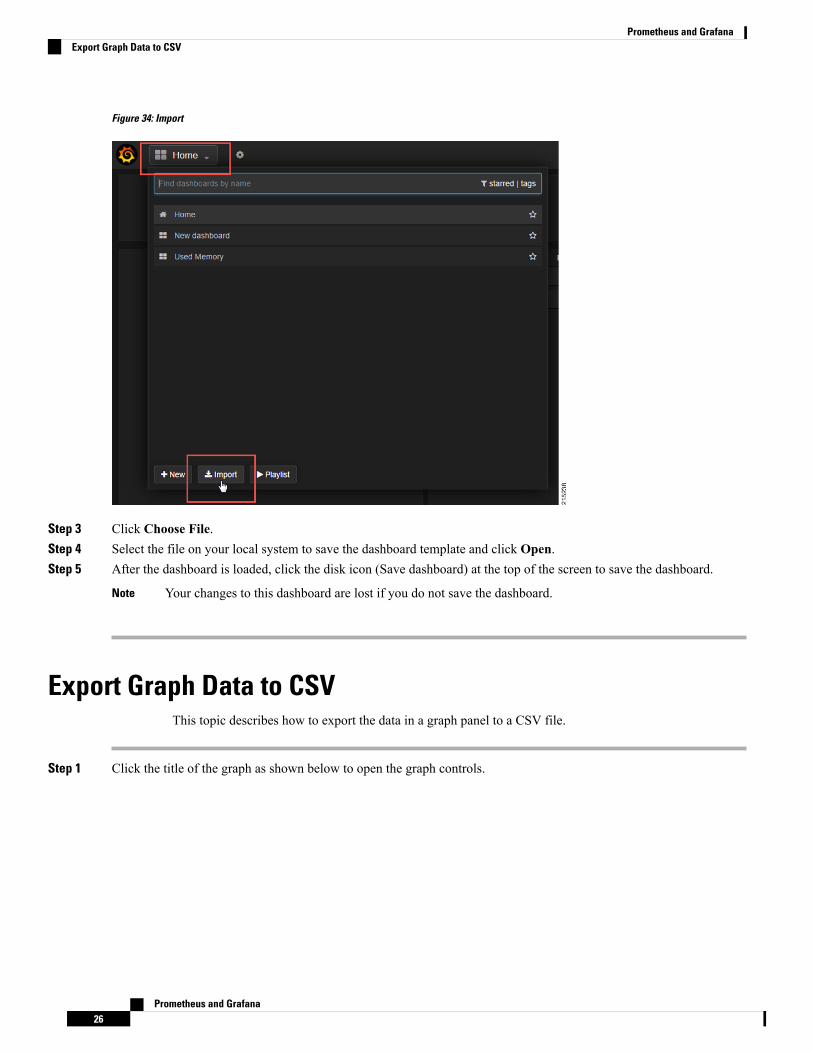
Figure 34: Import
Step 3 Click Choose File.Step 4 Select the file on your local system to save the dashboard template and click Open.Step 5 After the dashboard is loaded, click the disk icon (Save dashboard) at the top of the screen to save the dashboard.
Your changes to this dashboard are lost if you do not save the dashboard.Note
Export Graph Data to CSVThis topic describes how to export the data in a graph panel to a CSV file.
Step 1 Click the title of the graph as shown below to open the graph controls.
Prometheus and Grafana26
Prometheus and GrafanaExport Graph Data to CSV
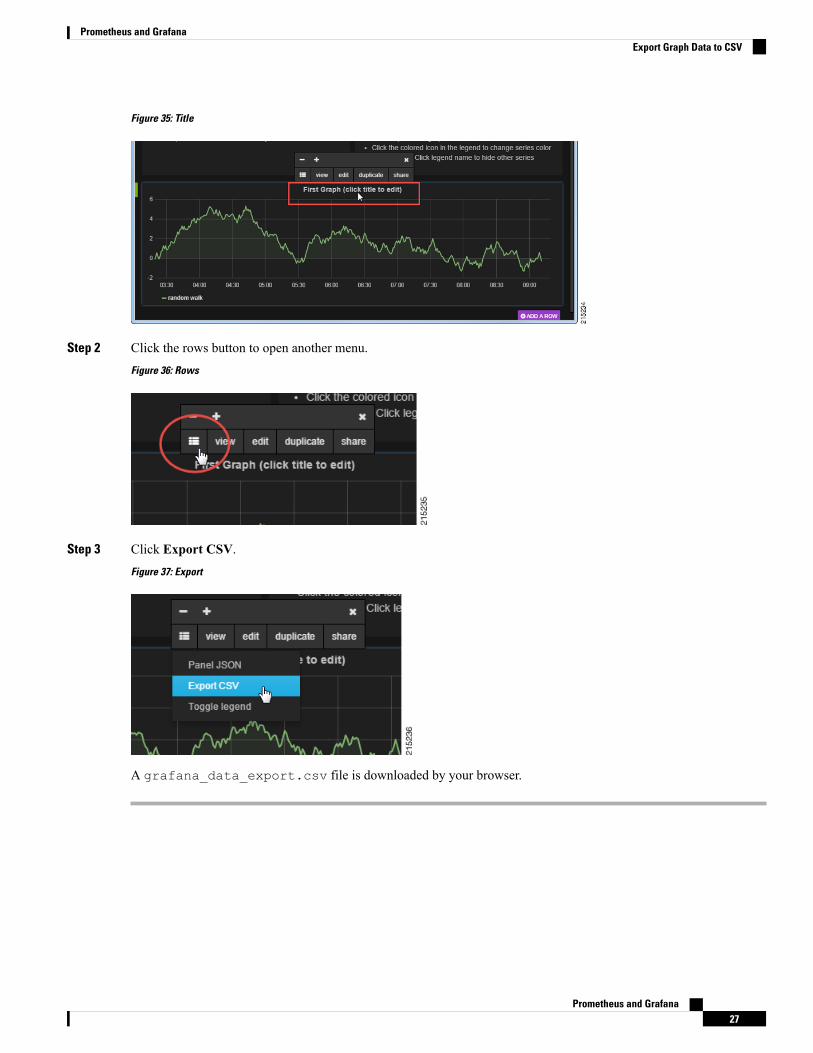
Figure 35: Title
Step 2 Click the rows button to open another menu.Figure 36: Rows
Step 3 Click Export CSV.Figure 37: Export
A grafana_data_export.csv file is downloaded by your browser.
Prometheus and Grafana27
Prometheus and GrafanaExport Graph Data to CSV
Session Consumption Report
IntroductionThis feature generates the session consumption report and stores the data into a separate log. The total numberof sessions limited by the license, the total number of active sessions, and total transactions per second aredocumented at regular time intervals into the log. The core license number is derived from the license filethat has the total number of sessions limited by the license. The active session count and the transaction counthas been taken from Grafana using the graphite query. A single entity of the feature mainly prints the currenttime stamp with the statistics values.
Data CollectionThe session and TPS count is collected from the graphite API with a JSON response. The JSON response isthen parsed to get the counter, which is then logged into the consolidated log. The sample URL and the JSONresponse are given below:> curl“http://localhost:8008/render?target=cisco.quantum.qps.pcrfclient01.set_session_count_total.records&from=-20second&until=-0hour&format=json”> [{"target":"cisco.quantum.qps.localhost.set_session_count_total.records", "datapoints": [[3735.42,1455148210], [3748.0, 1455148220]]}]> curl“http://localhost:8008/render?target=sumSeries(cisco.quantum.*.*.node*.messages.e2e*.success)&from=-20second&until=-0hour&format=json”> [{"target":"sumSeries(cisco.quantum.*.*.node*.messages.e2e*.success)", "datapoints": [[2345.34324,1455148210], [2453.23445453,1455148220]]}]
LoggingData logging is done using the logback mechanism. The consolidated data that is generated is stored in aseparate log file named consolidated-sessions.log inside the /var/log/broadhop directoryalong with other logs. The data entries are appended to the log every 90 seconds. The logs generated aredetailed and have the counter name and the current value with the time stamp.
PerformanceThe codebase pulls the JSON response from the Graphite API. The overhead by the codebase adds an averageof 350 ms of time.
Log RotationA log rotation policy is applied on the logs generated for the session Consumption Report. The file sizelimitation for each log file is 100 MB. The limitation on number of log files is 5. The logs get rotated afterreaching the limitations. One file contains a little more than two years of data, so five such files can contain10 years of data until the first file get replaced.
Prometheus and Grafana28
Prometheus and GrafanaSession Consumption Report
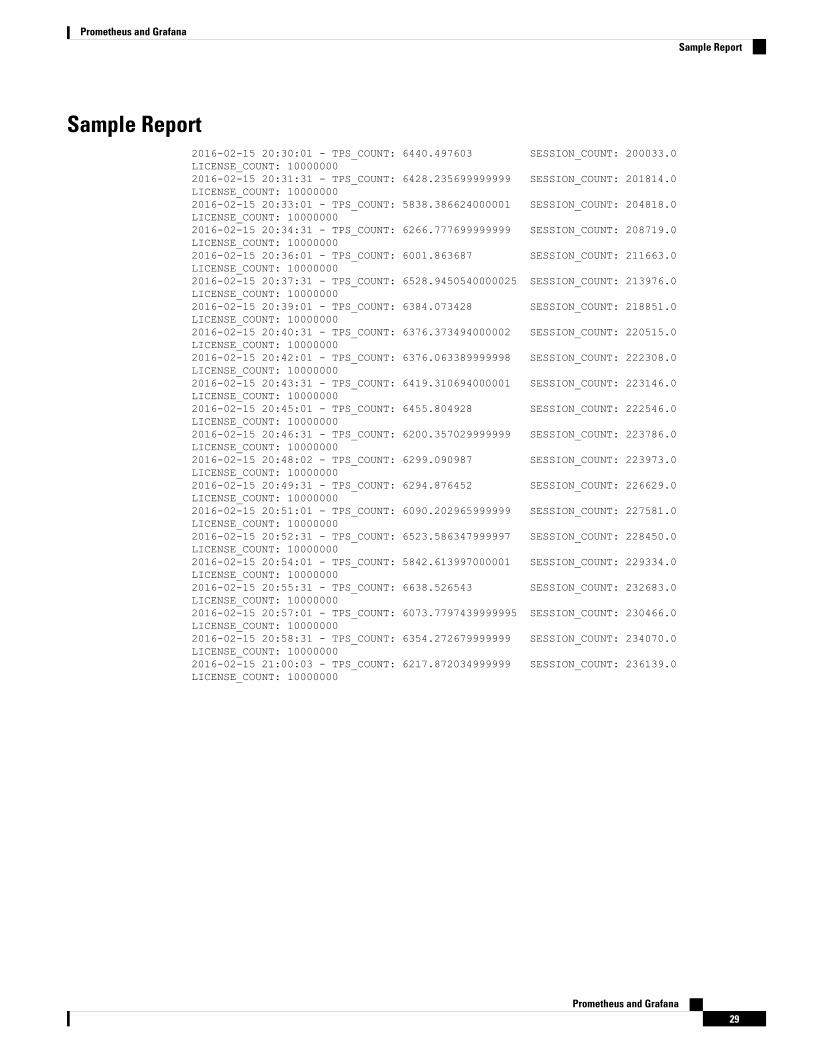
Sample Report2016-02-15 20:30:01 - TPS_COUNT: 6440.497603 SESSION_COUNT: 200033.0LICENSE_COUNT: 100000002016-02-15 20:31:31 - TPS_COUNT: 6428.235699999999 SESSION_COUNT: 201814.0LICENSE_COUNT: 100000002016-02-15 20:33:01 - TPS_COUNT: 5838.386624000001 SESSION_COUNT: 204818.0LICENSE_COUNT: 100000002016-02-15 20:34:31 - TPS_COUNT: 6266.777699999999 SESSION_COUNT: 208719.0LICENSE_COUNT: 100000002016-02-15 20:36:01 - TPS_COUNT: 6001.863687 SESSION_COUNT: 211663.0LICENSE_COUNT: 100000002016-02-15 20:37:31 - TPS_COUNT: 6528.9450540000025 SESSION_COUNT: 213976.0LICENSE_COUNT: 100000002016-02-15 20:39:01 - TPS_COUNT: 6384.073428 SESSION_COUNT: 218851.0LICENSE_COUNT: 100000002016-02-15 20:40:31 - TPS_COUNT: 6376.373494000002 SESSION_COUNT: 220515.0LICENSE_COUNT: 100000002016-02-15 20:42:01 - TPS_COUNT: 6376.063389999998 SESSION_COUNT: 222308.0LICENSE_COUNT: 100000002016-02-15 20:43:31 - TPS_COUNT: 6419.310694000001 SESSION_COUNT: 223146.0LICENSE_COUNT: 100000002016-02-15 20:45:01 - TPS_COUNT: 6455.804928 SESSION_COUNT: 222546.0LICENSE_COUNT: 100000002016-02-15 20:46:31 - TPS_COUNT: 6200.357029999999 SESSION_COUNT: 223786.0LICENSE_COUNT: 100000002016-02-15 20:48:02 - TPS_COUNT: 6299.090987 SESSION_COUNT: 223973.0LICENSE_COUNT: 100000002016-02-15 20:49:31 - TPS_COUNT: 6294.876452 SESSION_COUNT: 226629.0LICENSE_COUNT: 100000002016-02-15 20:51:01 - TPS_COUNT: 6090.202965999999 SESSION_COUNT: 227581.0LICENSE_COUNT: 100000002016-02-15 20:52:31 - TPS_COUNT: 6523.586347999997 SESSION_COUNT: 228450.0LICENSE_COUNT: 100000002016-02-15 20:54:01 - TPS_COUNT: 5842.613997000001 SESSION_COUNT: 229334.0LICENSE_COUNT: 100000002016-02-15 20:55:31 - TPS_COUNT: 6638.526543 SESSION_COUNT: 232683.0LICENSE_COUNT: 100000002016-02-15 20:57:01 - TPS_COUNT: 6073.7797439999995 SESSION_COUNT: 230466.0LICENSE_COUNT: 100000002016-02-15 20:58:31 - TPS_COUNT: 6354.272679999999 SESSION_COUNT: 234070.0LICENSE_COUNT: 100000002016-02-15 21:00:03 - TPS_COUNT: 6217.872034999999 SESSION_COUNT: 236139.0LICENSE_COUNT: 10000000
Prometheus and Grafana29
Prometheus and GrafanaSample Report

Prometheus and Grafana30
Prometheus and GrafanaSample Report