
ProM Framework Tutorial - Kursused · ProM Framework Tutorial Authors: ... tems in hospitals). ......
51
ProM Framework Tutorial Authors: Ana Karla Alves de Medeiros ([email protected]) A.J.M.M. (Ton) Weijters ([email protected]) Technische Universiteit Eindhoven Eindhoven, The Netherlands February 2008
Transcript of ProM Framework Tutorial - Kursused · ProM Framework Tutorial Authors: ... tems in hospitals). ......
ProM Framework Tutorial
Authors:
Ana Karla Alves de Medeiros([email protected])
A.J.M.M. (Ton) Weijters([email protected])
Technische Universiteit EindhovenEindhoven, The Netherlands
February 2008

ii
Date Summary of Modification
November 2007 Initial version.February 2008 Figures and text have been updated to fit ProM 4.2.
Contents
1 Introduction 1
1.1 Common Questions . . . . . . . . . . . . . . . . . . . . . . . . 11.2 Process Mining . . . . . . . . . . . . . . . . . . . . . . . . . . 21.3 Running Example . . . . . . . . . . . . . . . . . . . . . . . . . 51.4 Getting Started . . . . . . . . . . . . . . . . . . . . . . . . . . 6
2 Inspecting and Cleaning an Event Log 7
2.1 Inspecting the Log . . . . . . . . . . . . . . . . . . . . . . . . 72.2 Cleaning the Log . . . . . . . . . . . . . . . . . . . . . . . . . 11
3 Questions Based on an Event Log Only 17
3.1 Mining the Control-Flow Perspective . . . . . . . . . . . . . . 173.2 Mining Case-Related Information . . . . . . . . . . . . . . . . 203.3 Mining Organizational-Related Information . . . . . . . . . . . 223.4 Verifying Properties . . . . . . . . . . . . . . . . . . . . . . . . 29
4 Questions Based on a Process Model Plus an Event Log 33
4.1 Conformance Checking . . . . . . . . . . . . . . . . . . . . . . 334.2 Performance Analysis . . . . . . . . . . . . . . . . . . . . . . . 354.3 Decision Point Analysis . . . . . . . . . . . . . . . . . . . . . . 40
5 Conclusions 45

iv CONTENTS
Chapter 1
Introduction
This document shows how to use the ProM tool to answer some of the com-mon questions that managers have about processes in organizations. Thequestions are listed in Section 1.1. To answer these questions, we use theprocess mining plug-ins supported in the ProM tool. This tool is open-source and it can be downloaded at www.processmining.org. For the readerunfamiliar with process mining, Section 1.2 provides a concise introduction.All the questions listed in Section 1.1 are answered based on an event logfrom the running example described in Section 1.3. Finally, we advice youto have the ProM tool at hand while reading this document. This way youcan play with the tool while reading the explanations. Section 1.4 explainshow to get started with ProM.
1.1 Common Questions
The questions that managers usually have about processes in organizationsare:
1. What is the most frequent path for every process model?
2. How is the distribution of all cases over the different paths through theprocess?
3. How compliant are the cases (i.e. process instances) with the deployedprocess models? Where are the problems? How frequent is the (non-)compliance?
4. What are the routing probabilities for each split task (XOR or ORsplit/join points)?
5. What is the average/minimum/maximum throughput time of cases?
2 Introduction
6. Which paths take too much time on average? How many cases followthese routings? What are the critical sub-paths for these paths?
7. What is the average service time for each task?
8. How much time was spent between any two tasks in the process model?
9. How are the cases actually being executed?
10. What are the business rules in the process model?
11. Are the rules indeed being obeyed?
12. How many people are involved in a case?
13. What is the communication structure and dependencies among people?
14. How many transfers happen from one role to another role?
15. Who are important people in the communication flow? (the most fre-quent flow)
16. Who subcontract work to whom?
17. Who work on the same tasks?
We show how to use ProM to answer these questions in chapters 3 and 4.
1.2 Process Mining
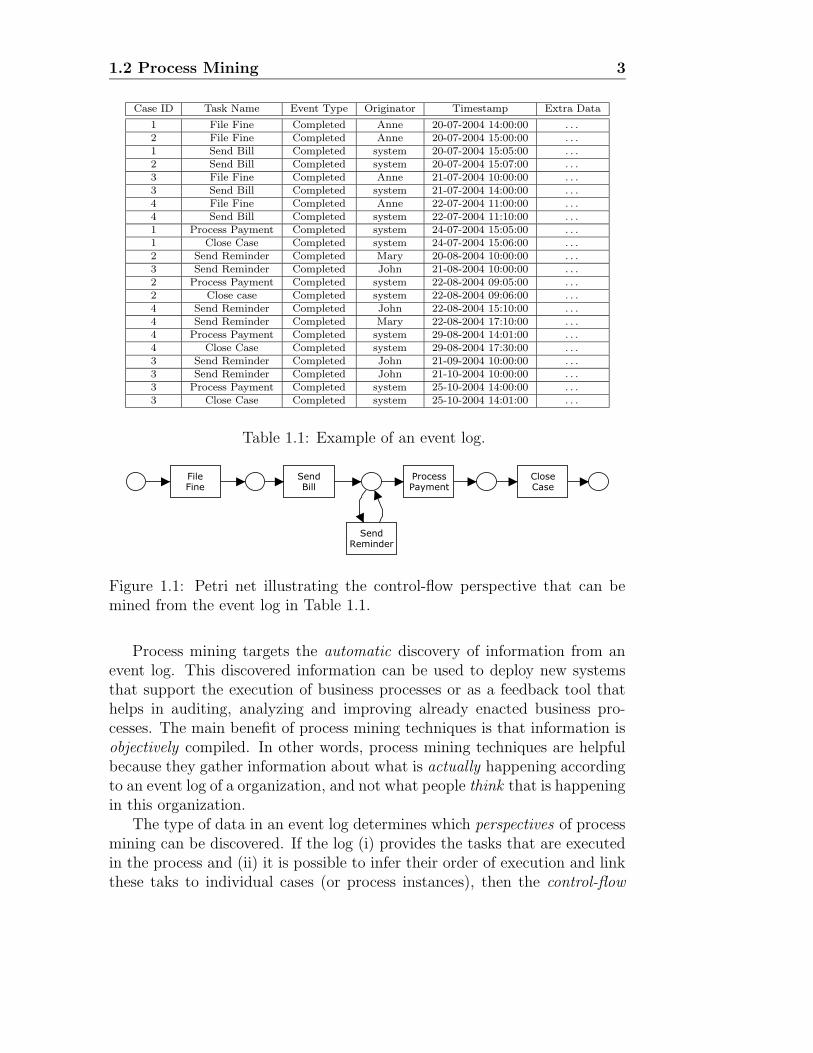
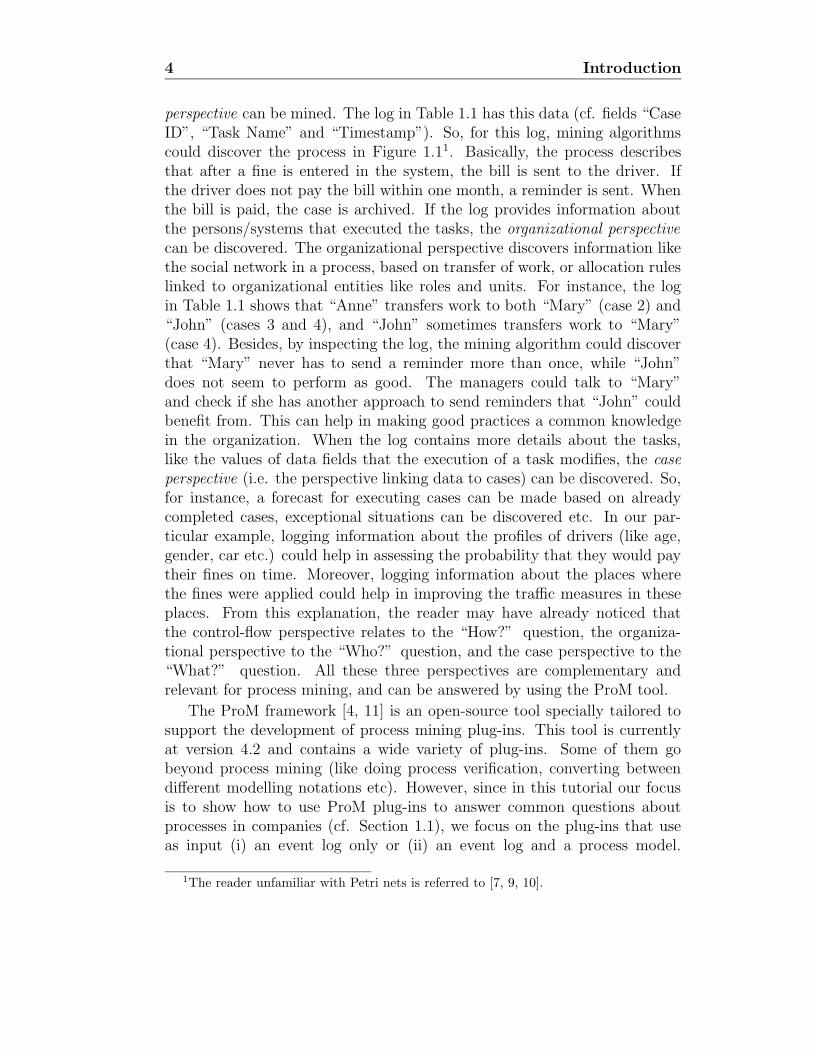
Nowadays, most organizations use information systems to support the execu-tion of their business processes [8]. Examples of information systems support-ing operational processes are Workflow Management Systems (WMS) [5, 6],Customer Relationship Management (CRM) systems, Enterprise ResourcePlanning (ERP) systems and so on. These information systems may con-tain an explicit model of the processes (for instance, workflow systems likeStaffware [3], COSA [1], etc.), may support the tasks involved in the processwithout necessarily defining an explicit process model (for instance, ERPsystems like SAP R/3 [2]), or may simply keep track (for auditing purposes)of the tasks that have been performed without providing any support for theactual execution of those tasks (for instance, custom-made information sys-tems in hospitals). Either way, these information systems typically supportlogging capabilities that register what has been executed in the organiza-tion. These produced logs usually contain data about cases (i.e. processinstances) that have been executed in the organization, the times at whichthe tasks were executed, the persons or systems that performed these tasks,and other kinds of data. These logs are the starting point for process min-ing, and are usually called event logs . For instance, consider the event log inTable 1.1. This log contains information about four process instances (cases)of a process that handles fines.
1.2 Process Mining 3
Case ID Task Name Event Type Originator Timestamp Extra Data
1 File Fine Completed Anne 20-07-2004 14:00:00 . . .
2 File Fine Completed Anne 20-07-2004 15:00:00 . . .
1 Send Bill Completed system 20-07-2004 15:05:00 . . .
2 Send Bill Completed system 20-07-2004 15:07:00 . . .
3 File Fine Completed Anne 21-07-2004 10:00:00 . . .
3 Send Bill Completed system 21-07-2004 14:00:00 . . .
4 File Fine Completed Anne 22-07-2004 11:00:00 . . .
4 Send Bill Completed system 22-07-2004 11:10:00 . . .
1 Process Payment Completed system 24-07-2004 15:05:00 . . .
1 Close Case Completed system 24-07-2004 15:06:00 . . .
2 Send Reminder Completed Mary 20-08-2004 10:00:00 . . .
3 Send Reminder Completed John 21-08-2004 10:00:00 . . .
2 Process Payment Completed system 22-08-2004 09:05:00 . . .
2 Close case Completed system 22-08-2004 09:06:00 . . .
4 Send Reminder Completed John 22-08-2004 15:10:00 . . .
4 Send Reminder Completed Mary 22-08-2004 17:10:00 . . .
4 Process Payment Completed system 29-08-2004 14:01:00 . . .
4 Close Case Completed system 29-08-2004 17:30:00 . . .
3 Send Reminder Completed John 21-09-2004 10:00:00 . . .
3 Send Reminder Completed John 21-10-2004 10:00:00 . . .
3 Process Payment Completed system 25-10-2004 14:00:00 . . .
3 Close Case Completed system 25-10-2004 14:01:00 . . .
Table 1.1: Example of an event log.
FileFine
SendBill
ProcessPayment
CloseCase
SendReminder
Figure 1.1: Petri net illustrating the control-flow perspective that can bemined from the event log in Table 1.1.
Process mining targets the automatic discovery of information from anevent log. This discovered information can be used to deploy new systemsthat support the execution of business processes or as a feedback tool thathelps in auditing, analyzing and improving already enacted business pro-cesses. The main benefit of process mining techniques is that information isobjectively compiled. In other words, process mining techniques are helpfulbecause they gather information about what is actually happening accordingto an event log of a organization, and not what people think that is happeningin this organization.
The type of data in an event log determines which perspectives of processmining can be discovered. If the log (i) provides the tasks that are executedin the process and (ii) it is possible to infer their order of execution and linkthese taks to individual cases (or process instances), then the control-flow
4 Introduction
perspective can be mined. The log in Table 1.1 has this data (cf. fields “CaseID”, “Task Name” and “Timestamp”). So, for this log, mining algorithmscould discover the process in Figure 1.11. Basically, the process describesthat after a fine is entered in the system, the bill is sent to the driver. Ifthe driver does not pay the bill within one month, a reminder is sent. Whenthe bill is paid, the case is archived. If the log provides information aboutthe persons/systems that executed the tasks, the organizational perspectivecan be discovered. The organizational perspective discovers information likethe social network in a process, based on transfer of work, or allocation ruleslinked to organizational entities like roles and units. For instance, the login Table 1.1 shows that “Anne” transfers work to both “Mary” (case 2) and“John” (cases 3 and 4), and “John” sometimes transfers work to “Mary”(case 4). Besides, by inspecting the log, the mining algorithm could discoverthat “Mary” never has to send a reminder more than once, while “John”does not seem to perform as good. The managers could talk to “Mary”and check if she has another approach to send reminders that “John” couldbenefit from. This can help in making good practices a common knowledgein the organization. When the log contains more details about the tasks,like the values of data fields that the execution of a task modifies, the caseperspective (i.e. the perspective linking data to cases) can be discovered. So,for instance, a forecast for executing cases can be made based on alreadycompleted cases, exceptional situations can be discovered etc. In our par-ticular example, logging information about the profiles of drivers (like age,gender, car etc.) could help in assessing the probability that they would paytheir fines on time. Moreover, logging information about the places wherethe fines were applied could help in improving the traffic measures in theseplaces. From this explanation, the reader may have already noticed thatthe control-flow perspective relates to the “How?” question, the organiza-tional perspective to the “Who?” question, and the case perspective to the“What?” question. All these three perspectives are complementary andrelevant for process mining, and can be answered by using the ProM tool.
The ProM framework [4, 11] is an open-source tool specially tailored tosupport the development of process mining plug-ins. This tool is currentlyat version 4.2 and contains a wide variety of plug-ins. Some of them gobeyond process mining (like doing process verification, converting betweendifferent modelling notations etc). However, since in this tutorial our focusis to show how to use ProM plug-ins to answer common questions aboutprocesses in companies (cf. Section 1.1), we focus on the plug-ins that useas input (i) an event log only or (ii) an event log and a process model.
1The reader unfamiliar with Petri nets is referred to [7, 9, 10].
1.3 Running Example 5
information system
( process ) model
event logs
models analyzes
discovery
records events , e . g . , messages ,
transactions , etc .
specifies configures implements
analyzes
supports / controls
extension
conformance
“world”
people machines
organizations components
business processes
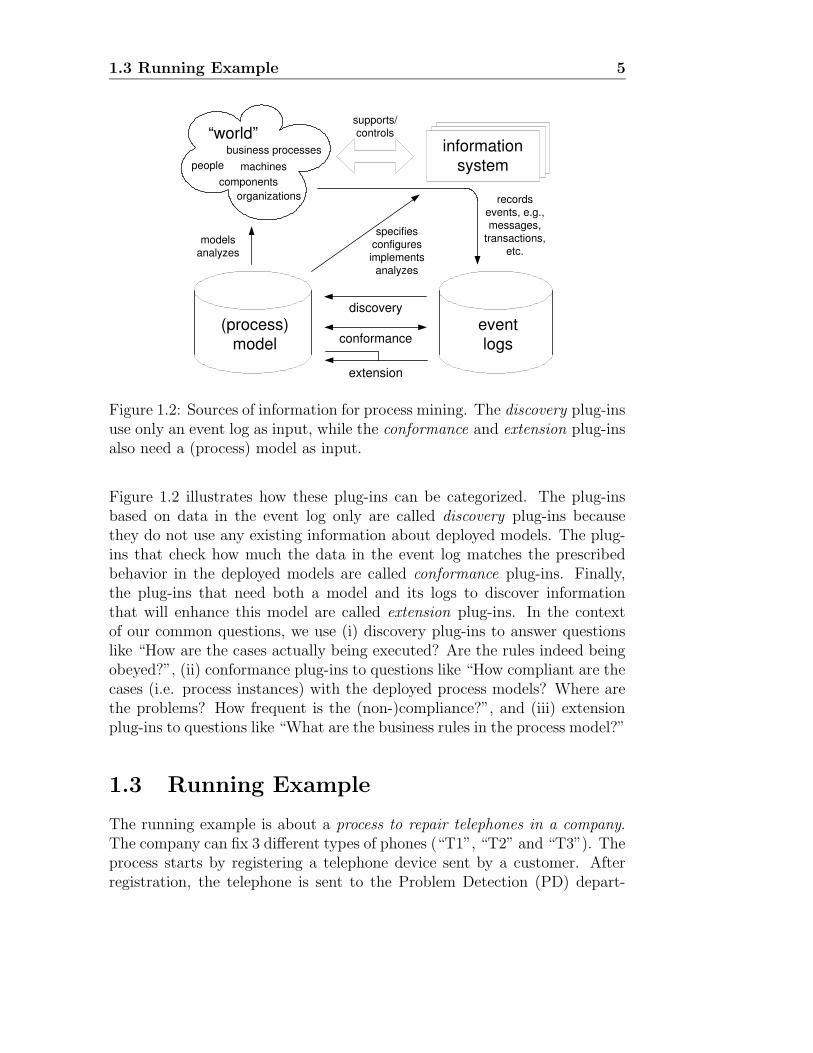
Figure 1.2: Sources of information for process mining. The discovery plug-insuse only an event log as input, while the conformance and extension plug-insalso need a (process) model as input.
Figure 1.2 illustrates how these plug-ins can be categorized. The plug-insbased on data in the event log only are called discovery plug-ins becausethey do not use any existing information about deployed models. The plug-ins that check how much the data in the event log matches the prescribedbehavior in the deployed models are called conformance plug-ins. Finally,the plug-ins that need both a model and its logs to discover informationthat will enhance this model are called extension plug-ins. In the contextof our common questions, we use (i) discovery plug-ins to answer questionslike “How are the cases actually being executed? Are the rules indeed beingobeyed?”, (ii) conformance plug-ins to questions like “How compliant are thecases (i.e. process instances) with the deployed process models? Where arethe problems? How frequent is the (non-)compliance?”, and (iii) extensionplug-ins to questions like “What are the business rules in the process model?”
1.3 Running Example
The running example is about a process to repair telephones in a company.The company can fix 3 different types of phones (“T1”, “T2” and “T3”). Theprocess starts by registering a telephone device sent by a customer. Afterregistration, the telephone is sent to the Problem Detection (PD) depart-
6 Introduction
ment. There it is analyzed and its defect is categorized. In total, there are10 different categories of defects that the phones fixed by this company canhave. Once the problem is identified, the telephone is sent to the Repairdepartment and a letter is sent to the customer to inform him/her about theproblem. The Repair (R) department has two teams. One of the teams canfix simple defects and the other team can repair complex defects. However,some of the defect categories can be repaired by both teams. Once a repairemployee finishes working on a phone, this device is sent to the Quality As-surance (QA) department. There it is analyzed by an employee to check ifthe defect was indeed fixed or not. If the defect is not repaired, the telephoneis again sent to the Repair department. If the telephone is indeed repaired,the case is archived and the telephone is sent to the customer. To save onthroughput time, the company only tries to fix a defect a limited number oftimes. If the defect is not fixed, the case is archived anyway and a brandnew device is sent to the customer.
1.4 Getting Started
To prepare for the next chapters, you need to do the following:
1. Install the ProM tool. This tool is freely available atprom.sourceforge.net. Please download and run the respective instal-lation file for your operating system.
2. Download the two log files for the running example. These logs filesare located at(i) tabu.tm.tue.nl/wiki/ media/tutorial/repairexample.zip and(ii) tabu.tm.tue.nl/wiki/ media/tutorial/repairexamplesample2.zip.
Chapter 2
Inspecting and Cleaning an
Event Log
Before applying any mining technique to an event log, we recommend you tofirst get an idea of the information in this event log. The main reason for thisis that you can only answer certain questions if the data is in the log. Forinstance, you cannot calculate the throughput time of cases if the log doesnot contain information about the times (timestamp) in which tasks wereexecuted. Additionally, you may want to remove unnecessary informationfrom the log before you start the mining. For instance, you may be interestedin mining only information about the cases that are completed. For ourrunning example (cf. Section 1.3), all cases without an archiving task as thelast one are still running cases and should not be considered. The cleaningstep is usually a projection of the log to consider only the data you areinterested in. Thus, in this chapter we show how you can inspect and clean(or pre-process) an event log in ProM. Furthermore, we show how you cansave the results of the cleaned log, so that you avoid redoing work.
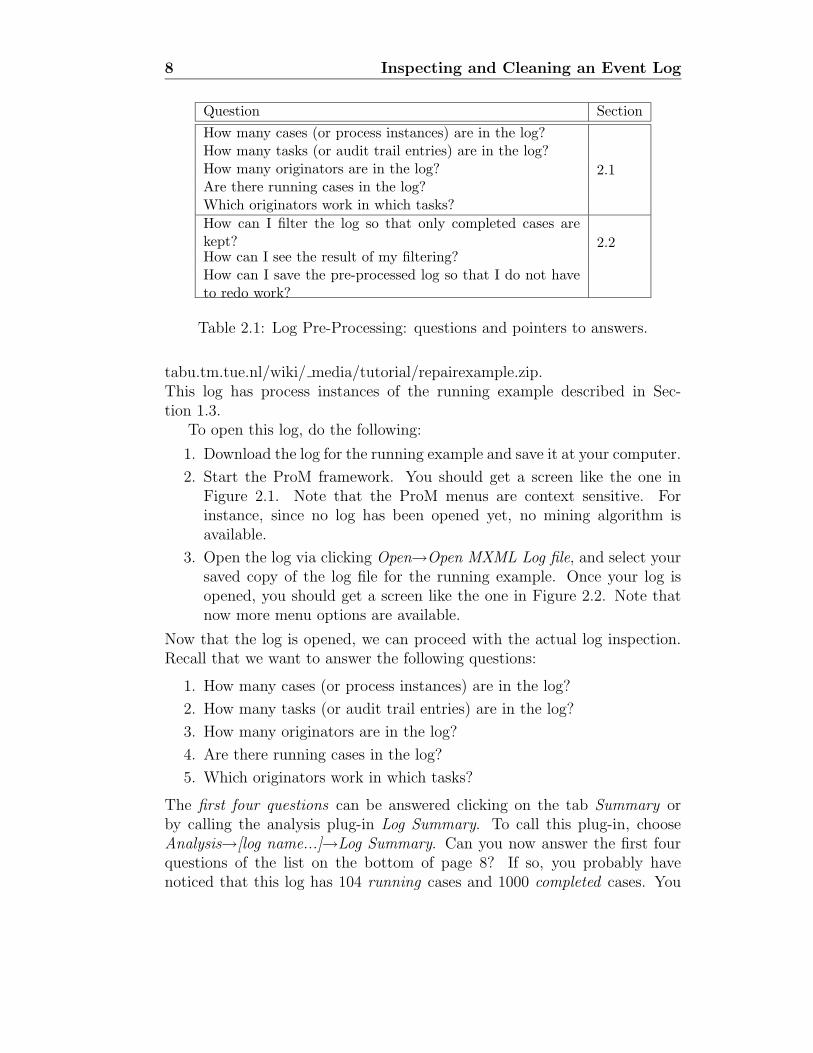
The questions answered in this chapter are summarized in Table 2.1.As you can see, Section 2.1 shows how to answer questions related to loginspection and Section 2.2 explains how to filter an event log and how tosave your work. Note that the list of questions in Table 2.1 is not exhaustive,but they are enough to give you an idea of the features offered by ProM forlog inspection and filtering.
2.1 Inspecting the Log
The first thing you need to do to inspect or mine a log is to load it intoProM. In this tutorial we use the log at the location:
8 Inspecting and Cleaning an Event Log
Question Section
How many cases (or process instances) are in the log?
2.1
How many tasks (or audit trail entries) are in the log?How many originators are in the log?Are there running cases in the log?Which originators work in which tasks?
How can I filter the log so that only completed cases arekept? 2.2How can I see the result of my filtering?How can I save the pre-processed log so that I do not haveto redo work?
Table 2.1: Log Pre-Processing: questions and pointers to answers.
tabu.tm.tue.nl/wiki/ media/tutorial/repairexample.zip.This log has process instances of the running example described in Sec-tion 1.3.
To open this log, do the following:
1. Download the log for the running example and save it at your computer.
2. Start the ProM framework. You should get a screen like the one inFigure 2.1. Note that the ProM menus are context sensitive. Forinstance, since no log has been opened yet, no mining algorithm isavailable.
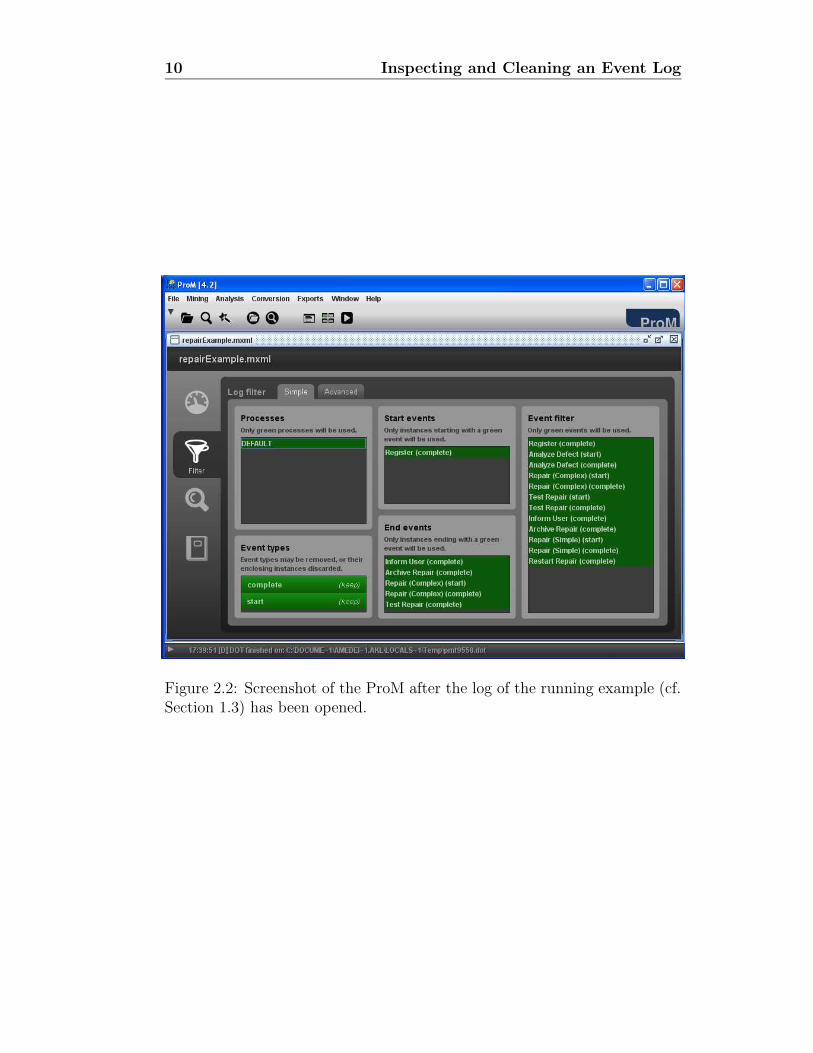
3. Open the log via clicking Open→Open MXML Log file, and select yoursaved copy of the log file for the running example. Once your log isopened, you should get a screen like the one in Figure 2.2. Note thatnow more menu options are available.
Now that the log is opened, we can proceed with the actual log inspection.Recall that we want to answer the following questions:
1. How many cases (or process instances) are in the log?
2. How many tasks (or audit trail entries) are in the log?
3. How many originators are in the log?
4. Are there running cases in the log?
5. Which originators work in which tasks?
The first four questions can be answered clicking on the tab Summary orby calling the analysis plug-in Log Summary. To call this plug-in, chooseAnalysis→[log name...]→Log Summary. Can you now answer the first fourquestions of the list on the bottom of page 8? If so, you probably havenoticed that this log has 104 running cases and 1000 completed cases. You
2.1 Inspecting the Log 9
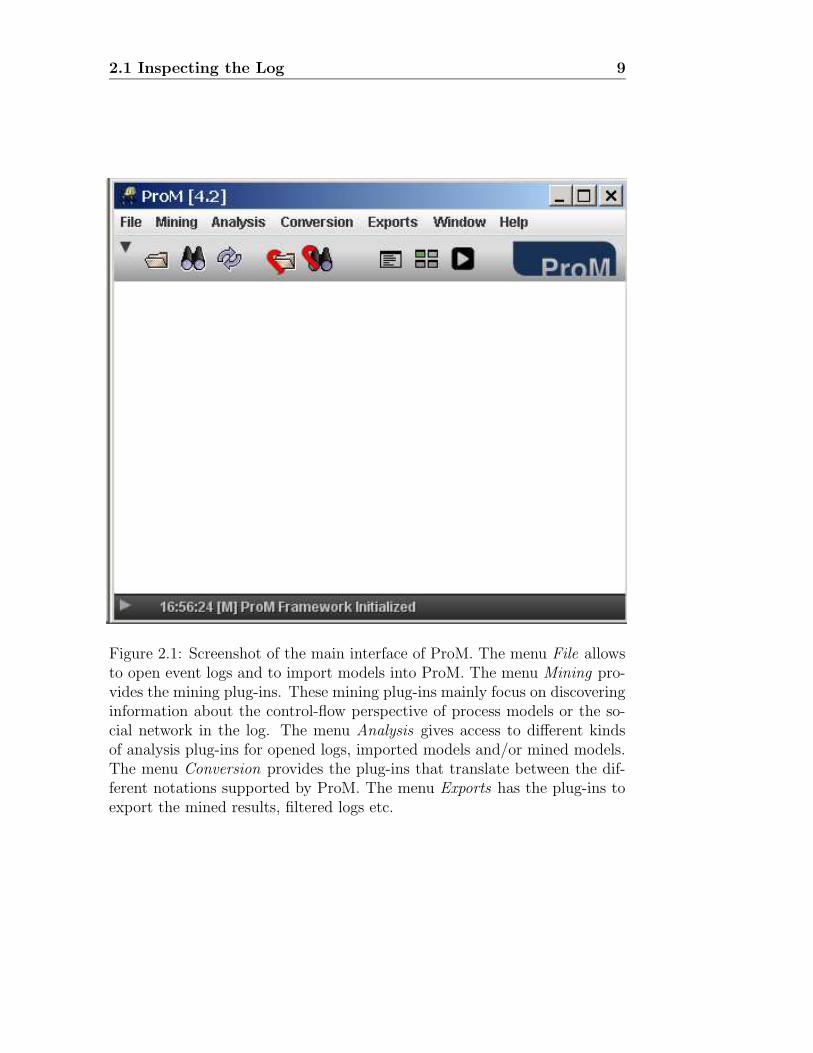
Figure 2.1: Screenshot of the main interface of ProM. The menu File allowsto open event logs and to import models into ProM. The menu Mining pro-vides the mining plug-ins. These mining plug-ins mainly focus on discoveringinformation about the control-flow perspective of process models or the so-cial network in the log. The menu Analysis gives access to different kindsof analysis plug-ins for opened logs, imported models and/or mined models.The menu Conversion provides the plug-ins that translate between the dif-ferent notations supported by ProM. The menu Exports has the plug-ins toexport the mined results, filtered logs etc.
10 Inspecting and Cleaning an Event Log
Figure 2.2: Screenshot of the ProM after the log of the running example (cf.Section 1.3) has been opened.
2.2 Cleaning the Log 11
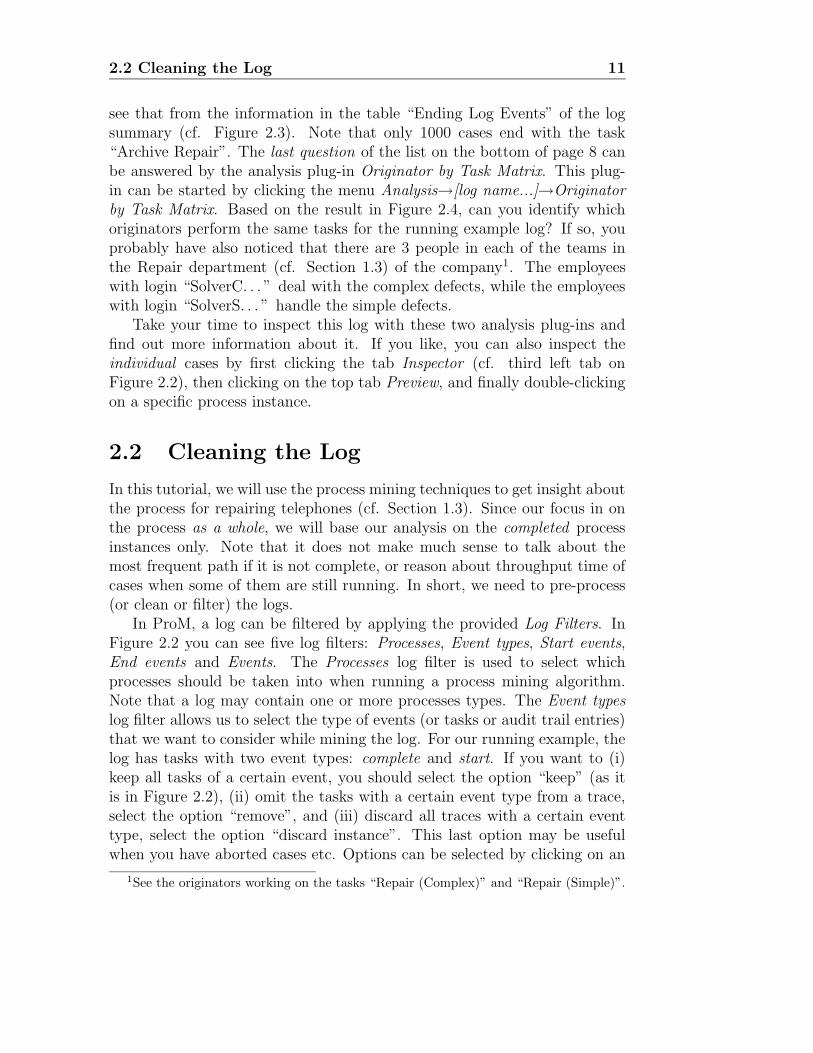
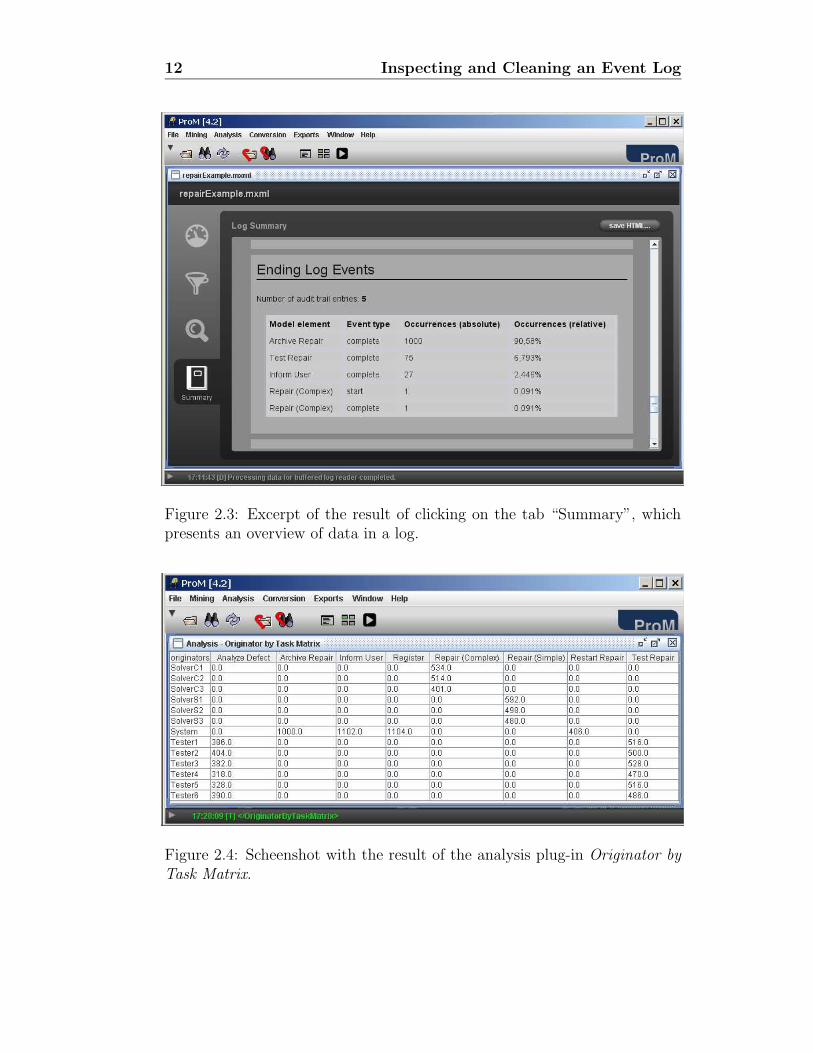
see that from the information in the table “Ending Log Events” of the logsummary (cf. Figure 2.3). Note that only 1000 cases end with the task“Archive Repair”. The last question of the list on the bottom of page 8 canbe answered by the analysis plug-in Originator by Task Matrix. This plug-in can be started by clicking the menu Analysis→[log name...]→Originatorby Task Matrix. Based on the result in Figure 2.4, can you identify whichoriginators perform the same tasks for the running example log? If so, youprobably have also noticed that there are 3 people in each of the teams inthe Repair department (cf. Section 1.3) of the company1. The employeeswith login “SolverC. . . ” deal with the complex defects, while the employeeswith login “SolverS. . . ” handle the simple defects.
Take your time to inspect this log with these two analysis plug-ins andfind out more information about it. If you like, you can also inspect theindividual cases by first clicking the tab Inspector (cf. third left tab onFigure 2.2), then clicking on the top tab Preview, and finally double-clickingon a specific process instance.
2.2 Cleaning the Log
In this tutorial, we will use the process mining techniques to get insight aboutthe process for repairing telephones (cf. Section 1.3). Since our focus in onthe process as a whole, we will base our analysis on the completed processinstances only. Note that it does not make much sense to talk about themost frequent path if it is not complete, or reason about throughput time ofcases when some of them are still running. In short, we need to pre-process(or clean or filter) the logs.
In ProM, a log can be filtered by applying the provided Log Filters. InFigure 2.2 you can see five log filters: Processes, Event types, Start events,End events and Events. The Processes log filter is used to select whichprocesses should be taken into when running a process mining algorithm.Note that a log may contain one or more processes types. The Event typeslog filter allows us to select the type of events (or tasks or audit trail entries)that we want to consider while mining the log. For our running example, thelog has tasks with two event types: complete and start. If you want to (i)keep all tasks of a certain event, you should select the option “keep” (as itis in Figure 2.2), (ii) omit the tasks with a certain event type from a trace,select the option “remove”, and (iii) discard all traces with a certain eventtype, select the option “discard instance”. This last option may be usefulwhen you have aborted cases etc. Options can be selected by clicking on an
1See the originators working on the tasks “Repair (Complex)” and “Repair (Simple)”.
12 Inspecting and Cleaning an Event Log
Figure 2.3: Excerpt of the result of clicking on the tab “Summary”, whichpresents an overview of data in a log.
Figure 2.4: Scheenshot with the result of the analysis plug-in Originator byTask Matrix.
2.2 Cleaning the Log 13
event type. The Start events filters the log so that only the traces (or cases)that start with the indicated tasks are kept. The End Events works in asimilar way, but the filtering is done with respect to the final tasks in the logtrace. The Event filter is used to set which events to keet in the log.
From the description of our running example, we know that the completedcases are the ones that start with a task to register the phone and end witha task to archive the instance. Thus, to filter the completed cases, you needto execute the following procedure:
1. Include the event types selection as in Figure 2.2. I.e., “keep” all thecomplete and start event types;
2. Select the task “Register (complete)” as the start event ;
3. Select the task “Archive Repair (complete)” as the final event.
If you now inspect the log (cf. Section 2.1), for instance, by clicking on theleft tab Summary, you will notice that the log contains fewer cases (Canyou say how many?) and all the cases indeed start with the task “Register(complete)” and finish with the task “Archive Repair (complete)”.
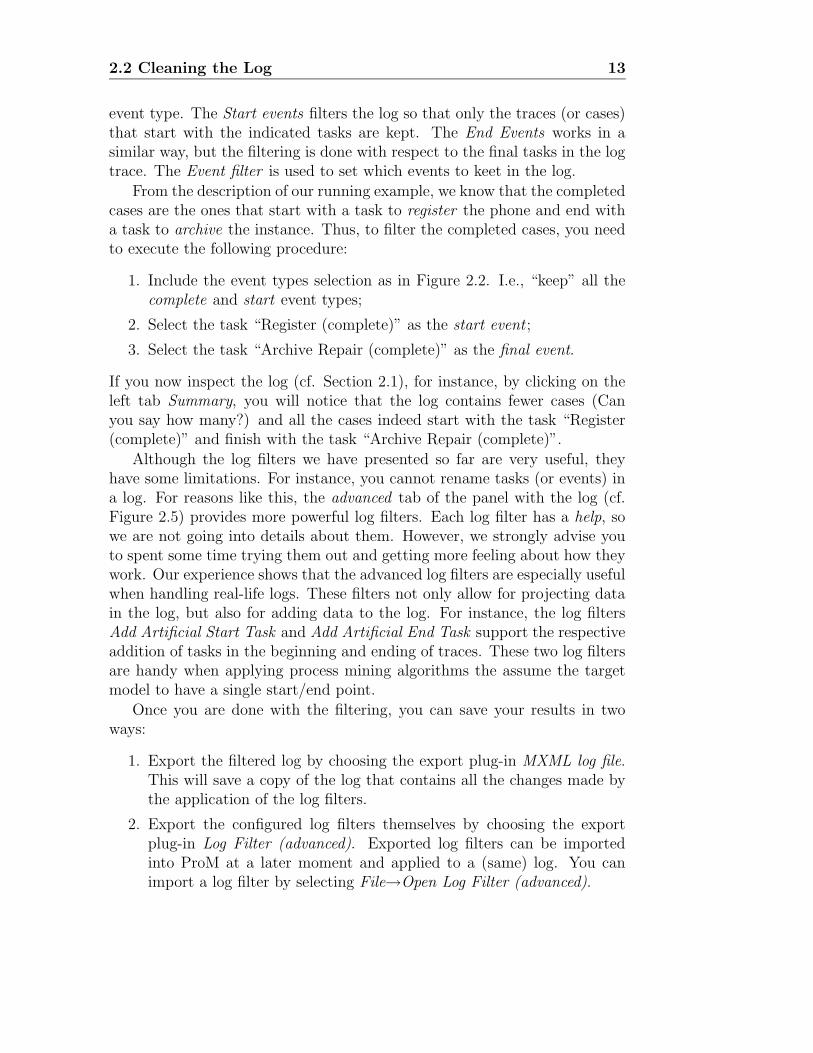
Although the log filters we have presented so far are very useful, theyhave some limitations. For instance, you cannot rename tasks (or events) ina log. For reasons like this, the advanced tab of the panel with the log (cf.Figure 2.5) provides more powerful log filters. Each log filter has a help, sowe are not going into details about them. However, we strongly advise youto spent some time trying them out and getting more feeling about how theywork. Our experience shows that the advanced log filters are especially usefulwhen handling real-life logs. These filters not only allow for projecting datain the log, but also for adding data to the log. For instance, the log filtersAdd Artificial Start Task and Add Artificial End Task support the respectiveaddition of tasks in the beginning and ending of traces. These two log filtersare handy when applying process mining algorithms the assume the targetmodel to have a single start/end point.
Once you are done with the filtering, you can save your results in twoways:
1. Export the filtered log by choosing the export plug-in MXML log file.This will save a copy of the log that contains all the changes made bythe application of the log filters.
2. Export the configured log filters themselves by choosing the exportplug-in Log Filter (advanced). Exported log filters can be importedinto ProM at a later moment and applied to a (same) log. You canimport a log filter by selecting File→Open Log Filter (advanced).
14 Inspecting and Cleaning an Event Log
Figure 2.5: Scheenshot of the Advanced Log Filters in ProM.

2.2 Cleaning the Log 15
If you like, you can export the filtered log for our running example. Can youopen this exported log into ProM? What do you notice by inspecting thislog? Note that your log should only contain 1000 cases and they should allstart and end with a single task.

16 Inspecting and Cleaning an Event Log
Chapter 3
Questions Answered Based on
an Event Log Only
Now that you know how to inspect and pre-process an event log (cf. Chap-ter 2), we proceed with showing how to answer the questions related to thediscovery ProM plug-ins (cf. Figure 1.2). Recall that a log is the only inputfor these kinds of plug-ins.
The questions answered in this chapter are summarized in Table 2.1.Section 3.1 shows how to mine the control-flow perspective of process mod-els. Section 3.2 explains how to mine information regarding certain as-pects of cases. Section 3.3 describes how to mine information related to theroles/employees in the event log 1. Section 3.4 shows how to use temporallogic to verify if the cases in a log satisfy certain (required) properties.
3.1 Mining the Control-Flow Perspective of
a Process
The control-flow perspective of a process establishes the dependencies amongits tasks. Which tasks precede which other ones? Are there concurrent tasks?Are there loops? In short, what is the process model that summarizes theflow followed by most/all cases in the log? This information is importantbecause it gives you feedback about how cases are actually being executed inthe organization.
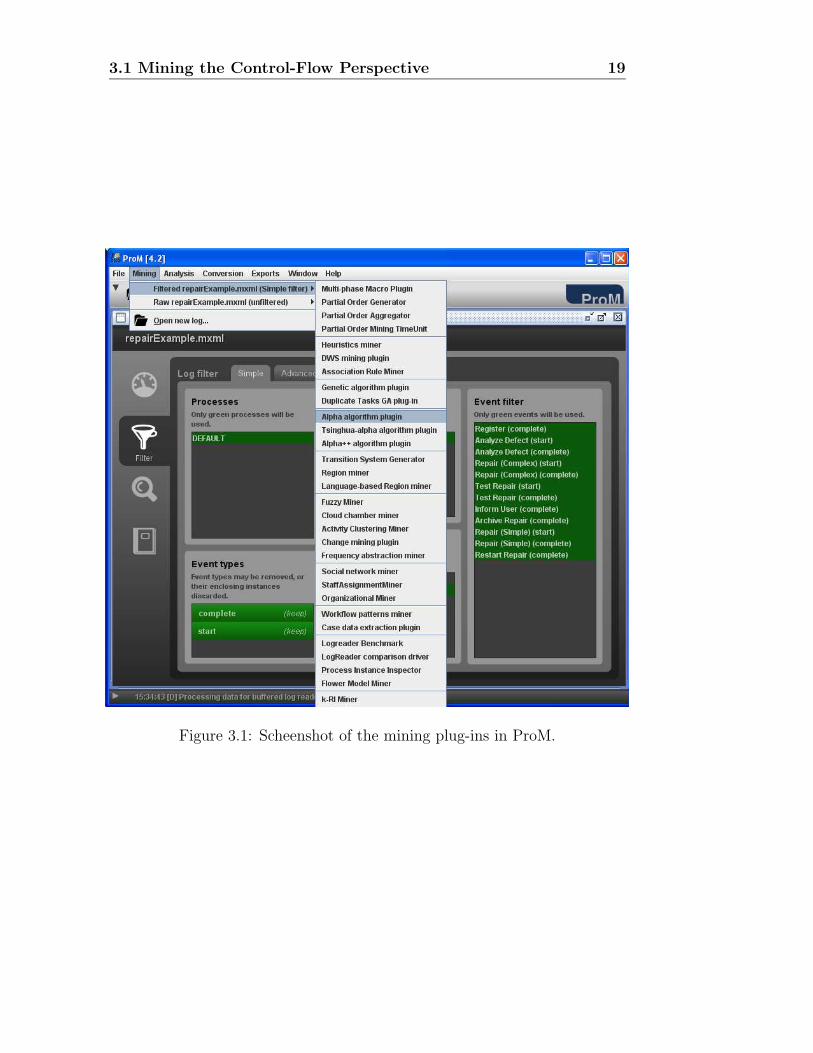
ProM supports various plug-ins to mine the control-flow perspective ofprocess models, as shown in Figure 3.1. In this tutorial, we will use the
1More technically, these plug-ins require the originator field to be present in the eventlog.
18 Questions Based on an Event Log Only
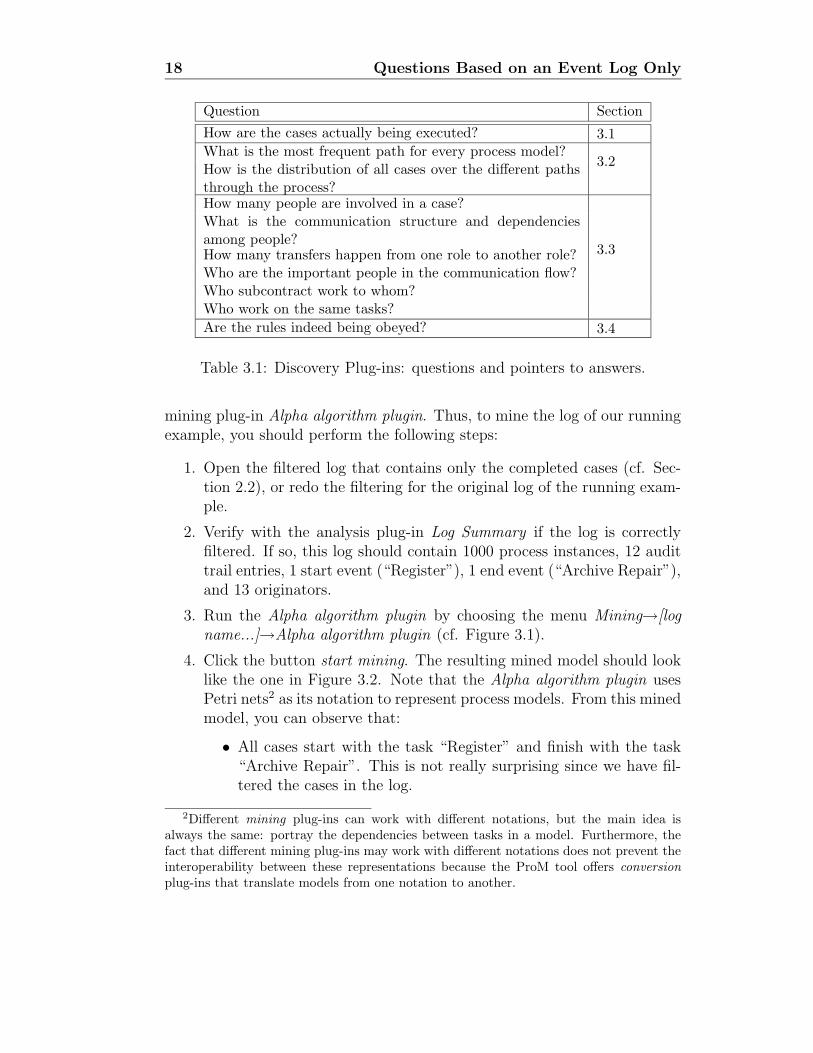
Question Section
How are the cases actually being executed? 3.1What is the most frequent path for every process model?
3.2How is the distribution of all cases over the different pathsthrough the process?How many people are involved in a case?
3.3
What is the communication structure and dependenciesamong people?How many transfers happen from one role to another role?Who are the important people in the communication flow?Who subcontract work to whom?Who work on the same tasks?
Are the rules indeed being obeyed? 3.4
Table 3.1: Discovery Plug-ins: questions and pointers to answers.
mining plug-in Alpha algorithm plugin. Thus, to mine the log of our runningexample, you should perform the following steps:
1. Open the filtered log that contains only the completed cases (cf. Sec-tion 2.2), or redo the filtering for the original log of the running exam-ple.
2. Verify with the analysis plug-in Log Summary if the log is correctlyfiltered. If so, this log should contain 1000 process instances, 12 audittrail entries, 1 start event (“Register”), 1 end event (“Archive Repair”),and 13 originators.
3. Run the Alpha algorithm plugin by choosing the menu Mining→[logname...]→Alpha algorithm plugin (cf. Figure 3.1).
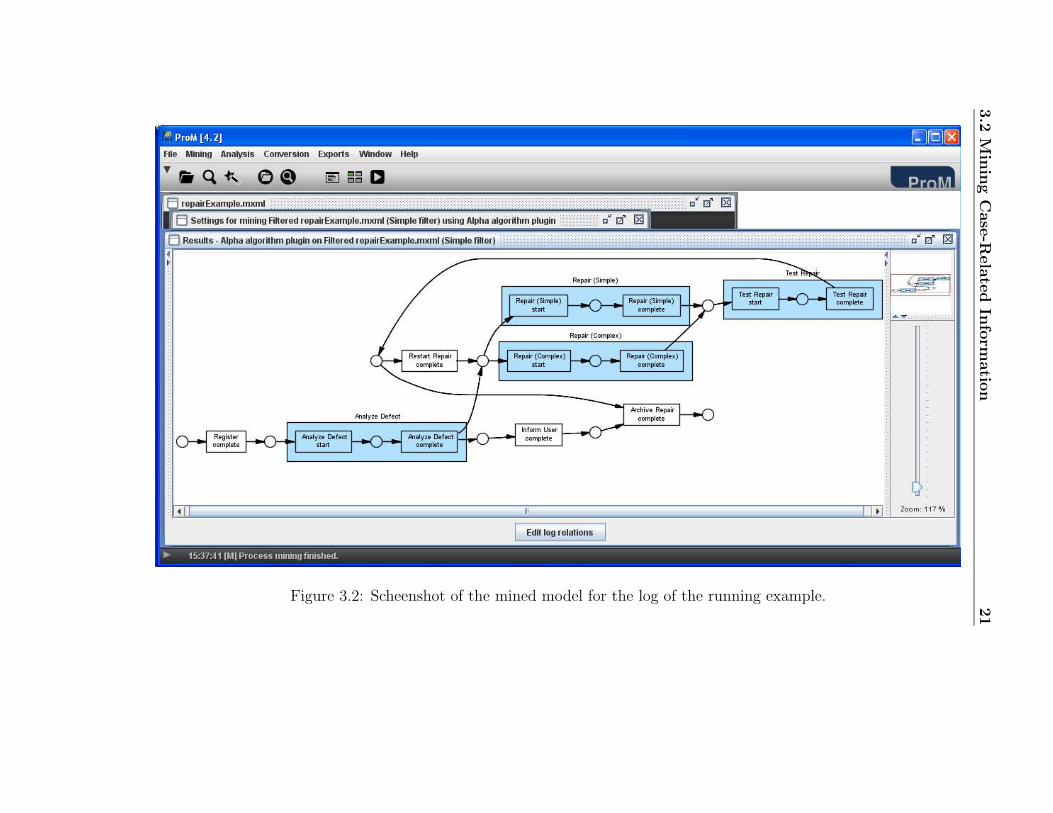
4. Click the button start mining. The resulting mined model should looklike the one in Figure 3.2. Note that the Alpha algorithm plugin usesPetri nets2 as its notation to represent process models. From this minedmodel, you can observe that:
• All cases start with the task “Register” and finish with the task“Archive Repair”. This is not really surprising since we have fil-tered the cases in the log.
2Different mining plug-ins can work with different notations, but the main idea isalways the same: portray the dependencies between tasks in a model. Furthermore, thefact that different mining plug-ins may work with different notations does not prevent theinteroperability between these representations because the ProM tool offers conversion
plug-ins that translate models from one notation to another.
3.1 Mining the Control-Flow Perspective 19
Figure 3.1: Scheenshot of the mining plug-ins in ProM.
20 Questions Based on an Event Log Only
• After the task Analyze Defect completes, some tasks can occur inparallel: (i) the client can be informed about the defect (see task“Inform User”), and (ii) the actual fix of the defect can be startedby executing the task Repair (Complete) or Repair (Simple).
• The model has a loop construct involving the repair tasks.
Based on these remarks, we can conclude that the cases in our runningexample log have indeed been executed as described in Section 1.3.
5. Save the mined model by choosing the menu option Exports→SelectedPetri net→Petri Net Kernel file. We will need this exported model inChapter 4.
6. If you prefer to visualize the mined model in another representation,you can convert this model by invoking one of the menu option Conver-sion. As an example, you can convert the mined Petri net to an EPCby choosing the menu option Conversion→Selected Petri net→LabeledWF net to EPC.
As a final note, although in this section we mine the log using the Alphaalgorithm plugin, we strongly recommend you to try other plug-ins as well.The main reason is that the Alpha algorithm plugin is not robust to logs thatcontain noisy data (like real-life logs typically do). Thus, we suggest youhave a look at the help of the other plug-ins before choosing for a specificone. In our case, we can hint that we have had good experience while usingthe mining plug-ins Multi-phase Macro plugin, Heuristics miner and Geneticalgorithm plugin to real-life logs.
3.2 Mining Case-Related Information about
a Process
Do you want know the most frequent path for our running example? Or thedistribution of all cases over the different paths through the process? Thenyou should use the analysis plug-in Performance Sequence Diagram Analysis.As an illustration, in the context of our running example, one would expectthat paths without the task “Restart Repair” (i.e., situations in which thedefect could not be fixed in the first try) should be less frequent than theones with this task. But is this indeed the current situation? Questions likethis will be answered while executing the following procedure:
1. Open the filtered log that contains only the completed cases (cf. Sec-tion 2.2).
3.2
Min
ing
Case
-Rela
ted
Info
rm
atio
n21
Figure 3.2: Scheenshot of the mined model for the log of the running example.
22 Questions Based on an Event Log Only
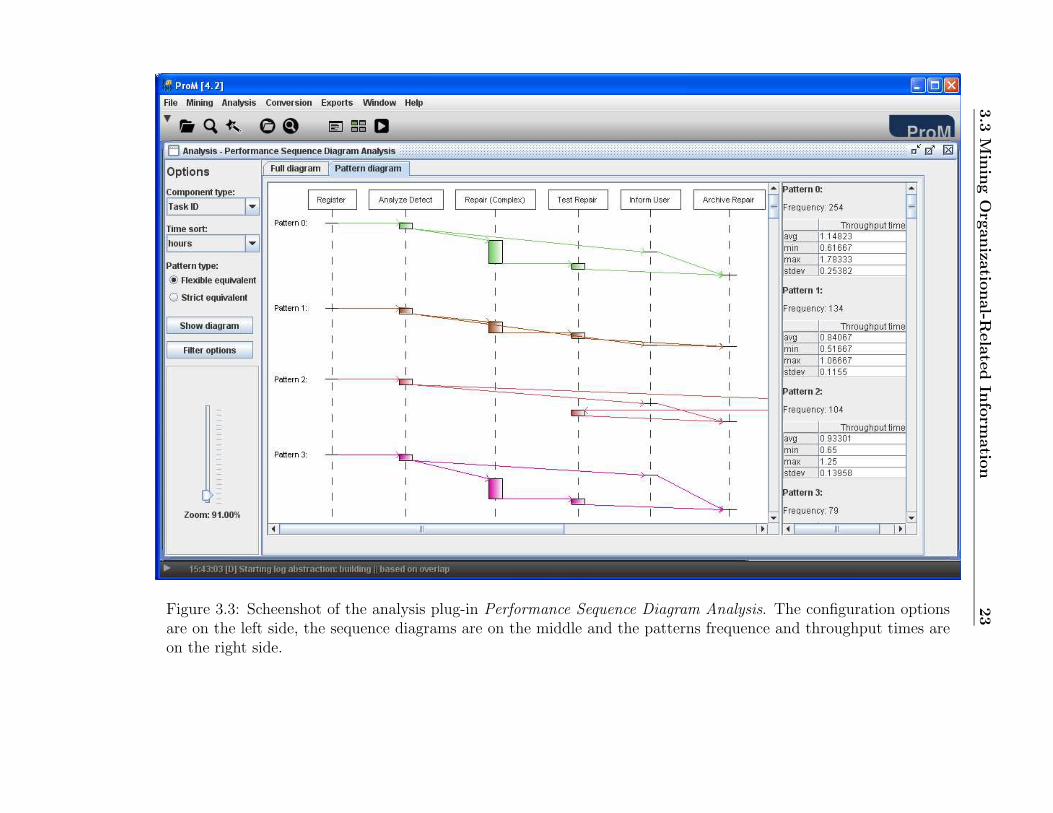
2. Run the Performance Sequence Diagram Analysis by choosing the menuAnalysis→[log name...]→Performance Sequence Diagram Analysis.
3. Select the tab Pattern diagram and click on the button Show diagram.You should get a screen like the one in Figure 3.3.
Take your time to inspect the results (i.e., the sequence patterns andtheir throughput times). Can you answer our initial questions now?If so, you have probably notice that the 73,5% of the defects could befixed in the first attempt3.
4. Now, how about having a look at the resources? Which employees areinvolved in the most frequent patterns? In which sequence do theyinteract? To see that, just choose “Originator” as the Component typeand click on the button Show diagram.
Take your time to have a look at the other options provided by this plug-in.For instance, by clicking on the button Filter options you can select specificmined patterns etc.
3.3 Mining Organizational-Related Informa-
tion about a Process
In this section we answer questions regarding the social (or organizational)aspect of a company. The questions are:
• How many people are involved in a specific case?
• What is the communication structure and dependencies among people?
• How many transfers happen from one role to another role?
• Who are important people in the communication flow? (the most fre-quent flow)
• Who subcontracts work to whom?
• Who work on the same tasks?
These and other related questions can be answered by using the miningplug-ins Social Network Miner and Organizational Miner, and the analysisplug-in Analyze Social Network. In the following we explain how to answereach question in the context of our running example.
To know the people that are involved in a specific case or all the cases inthe log, you can use the analysis plug-in Log Summary (cf. Section 2.1). For
3See patterns 0 to 6, notice that the task “Restart Repair” does not belong to thesepatterns. Furthermore, the sum of the occurrences of these patterns is equal to 735.
3.3
Min
ing
Organiz
atio
nal-R
ela
ted
Info
rm
atio
n23Figure 3.3: Scheenshot of the analysis plug-in Performance Sequence Diagram Analysis. The configuration options
are on the left side, the sequence diagrams are on the middle and the patterns frequence and throughput times areon the right side.
24 Questions Based on an Event Log Only
instance, to check which people are involved in the process instance 120 ofour example log, you can do the following:
1. Open the filtered log (cf. Section 2.2) for the running example.
2. Click on the left tab Inspector.
3. Click on the top tab Preview.
4. Right-click on the panel Process Instance and click on Find....
5. In the dialog Find, field “Text to find”, type in 120 and click “OK”.This option highlights the process instance in the list.
6. Double-click the process instance 120.
7. Visualize the log summary for this process instance by choosing themenu option Analysis→Previewed Selection. . .→Log Summary.
You can see who work on the same tasks by using the analysis plug-in Origi-nator by Task Matrix, or by running the mining plug-in Organizational Miner.For instance, to see the roles that work for the same tasks in our examplelog, you can do the following:
1. Open the filtered log (cf. Section 2.2) for the running example.
2. Select the menu option Mining→Filtered. . .→Organizational Miner,choose the options “Doing Similar Task” and “Correlation Coefficient”,and click on start mining.
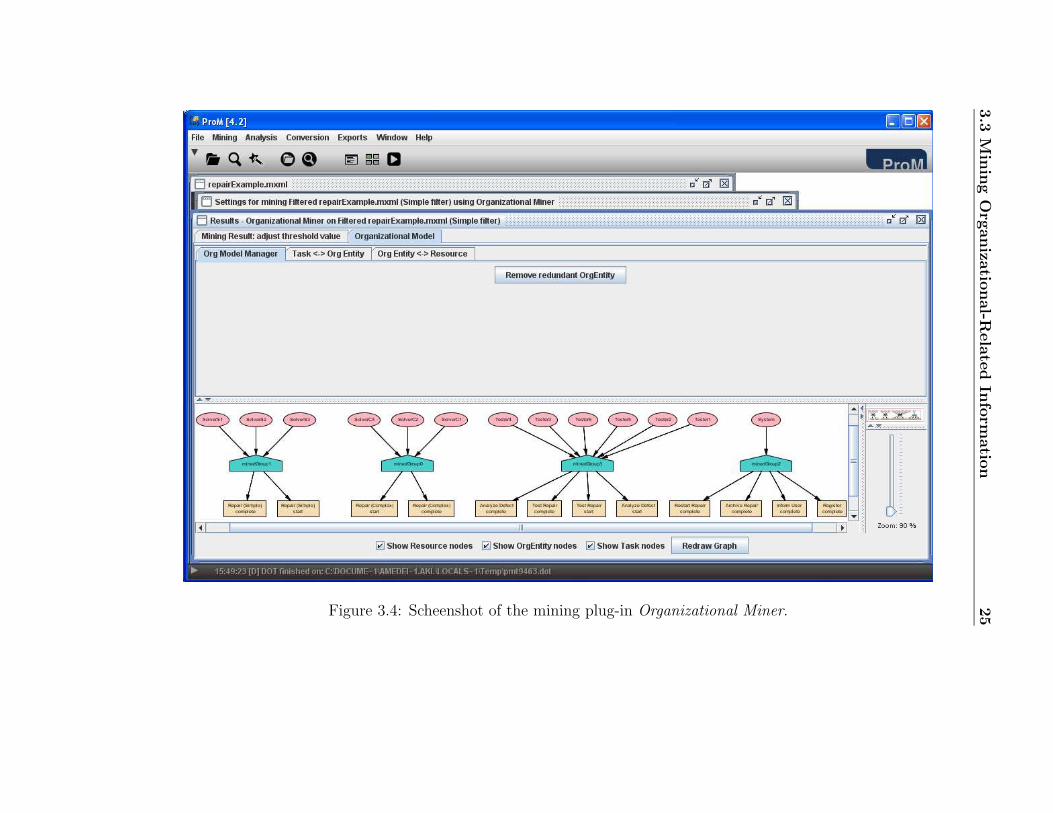
3. Select the tab Organizational Model. You should get a screen like theone in Figure 3.4. Take you time to inspect the information providedat the bottom of this screen. Noticed that the automatically generatedorganizational model shows that the people with the role “Tester. . . ”work on the tasks “Analyze Defect” and “Test Repair”, and so on.If you like, you can edit these automatically generated organizationalmodel by using the functionality provided at the other two tabs Tasks<->Org Entity and Org Entity<->Resource. Note that organizationalmodels can be exported and used as input for other organizational-related mining and analysis plug-ins.
The other remaining questions of the list on page 22 are answered by usingthe mining plug-in Social Network in combination with the analysis plug-inAnalyze Social Network. For instance, in the context of our running example,we would like to check if there are employees that outperform others. Byidentifying these employees, one can try to make the good practices (or wayof working) of these employees a common knowledge in the company, sothat peer employees also benefit from that. In the context of our runningexample, we could find out which employees are better at fixing defects.
3.3
Min
ing
Organiz
atio
nal-R
ela
ted
Info
rm
atio
n25Figure 3.4: Scheenshot of the mining plug-in Organizational Miner.
26 Questions Based on an Event Log Only
From the process description (cf. Section 1.3) and from the mined model inFigure 3.2, we know that telephones which were not repaired are again sentto the Repair Department. So, we can have a look on the handover of workfor the task performed by the people in this department. In other words,we can have a look on the handover of work for the tasks Repair (Simple)and Repair (Complex). One possible way to do so is to perform the followingsteps:
1. Open the log for the running example.
2. Use the advanced log filter Event Log Filter (cf. Section 2.2) to filterthe log so that only the task “Repair (Simple) (start)”, “Repair (Sim-ple) (complete)”, “Repair (Complex) (start)” and “Repair (Complex)(complete)” are kept. (Hint: Use the analysis plug-in Log Summary tocheck if the log is correctly filtered!).
3. Run the Social Network Miner by choosing the menu option Mining→Filtered. . .→Social network miner.
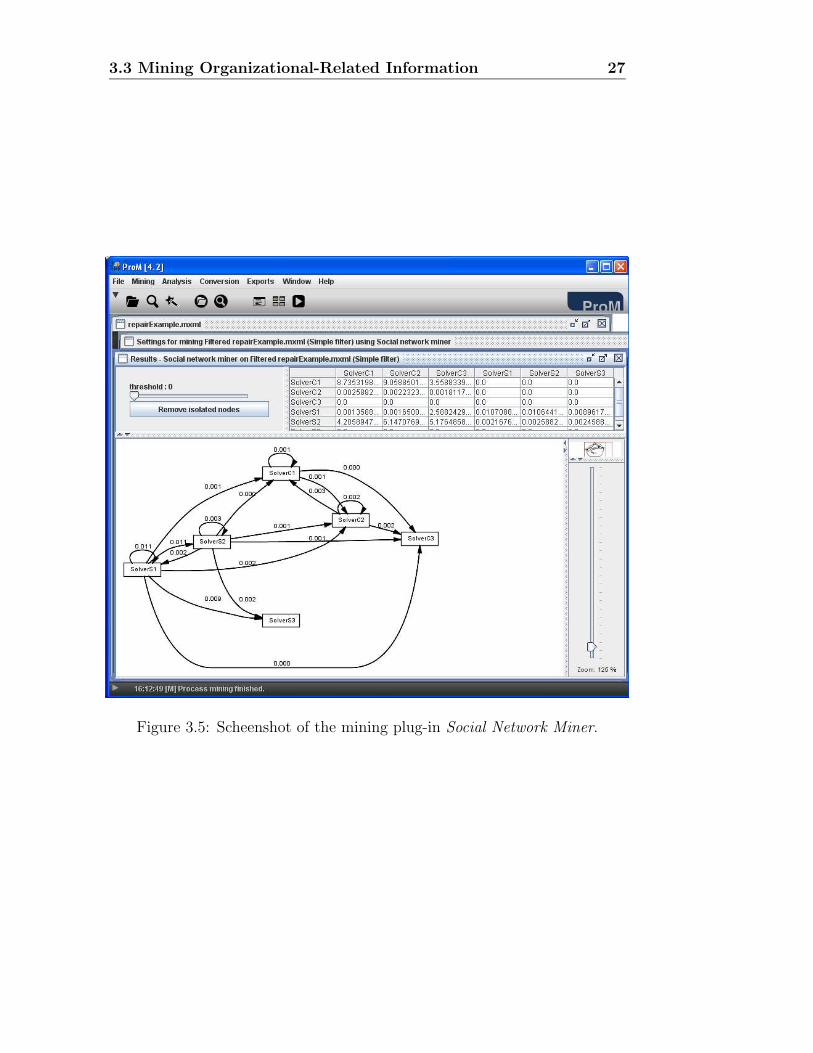
4. Select the tab Handover of work, and click the button start mining.You should get a result like the one in Figure 3.5. We could alreadyanalyze this result, but we will use the analysis plug-in Analyze SocialNetwork to do so. This analysis plug-in provides a more intuitive userinterface. This is done on the next step.
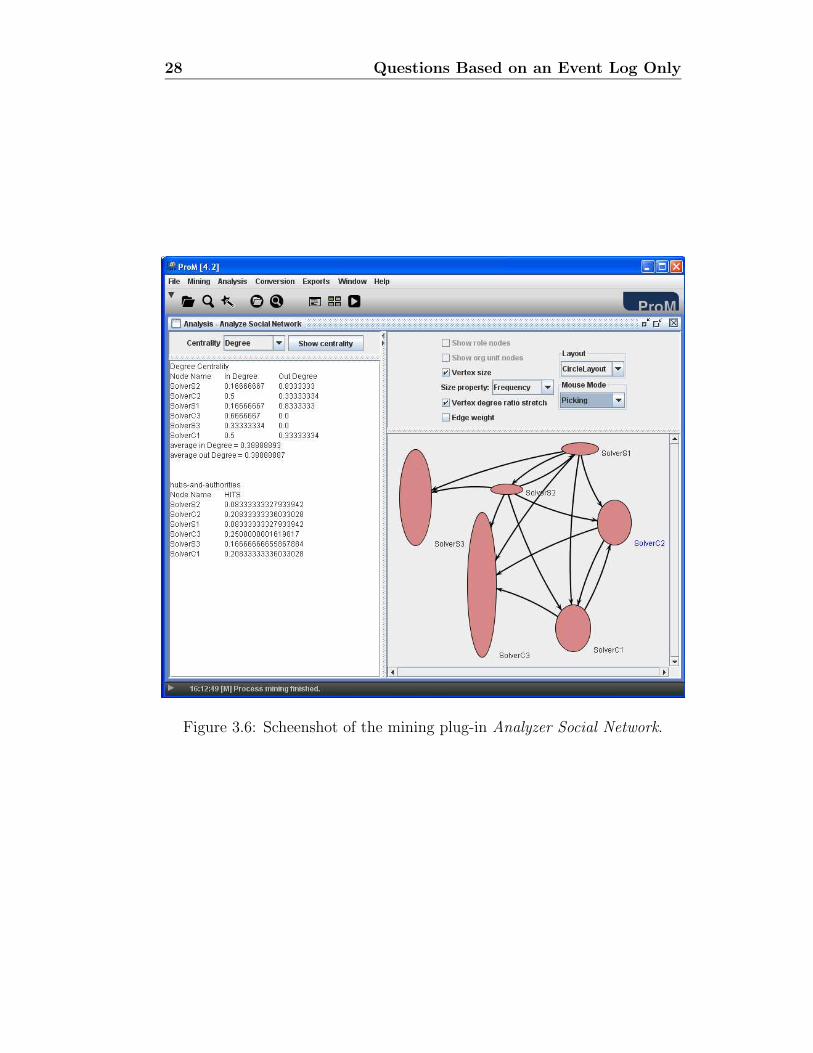
5. Run the Analyze Social Network by choosing the menu option Analysis→SNA→Analyze Social Network. Select the options “Vertex size”, “Ver-tex degree ratio stretch” and set Mouse Mode to “Picking” (so youcan use the mouse to re-arrange the nodes in the graph). The result-ing graph (cf. Figure 3.6) shows which employees handed over workto other employees in the process instances of our running example.By looking at this graph, we can see that the employees with roles“SolverS3” and “SolverC3” outperform the other employees becausethe telephones these two employees fix always pass the test checks and,therefore, are not re-sent to the Repair Department (since no other em-ployee has to work on the cases involving “SolverS3” and “SolverC4”).The oval shape of the nodes in the graph visually expresses the rela-tion between the in and out degree of the connections (arrows) betweenthese nodes. A higher proportion of ingoing arcs lead to more verticaloval shapes while higher proportions of outgoing arcs produce morehorizontal oval shapes. From this remark, can you tell which employeehas more problems to fix the defects?
Take you time to experiment with the plug-ins explained in the procedureabove. Can you now answer the other remaining questions?
3.3 Mining Organizational-Related Information 27
Figure 3.5: Scheenshot of the mining plug-in Social Network Miner.
28 Questions Based on an Event Log Only
Figure 3.6: Scheenshot of the mining plug-in Analyzer Social Network.
3.4 Verifying Properties 29
As a final remark, we point out that the results produced by the SocialNetwork mining plug-in can be exported to more powerful tools like AGNA4
and NetMiner5, which are especially tailored to analyze social networks andprovide more powerful user interfaces.
3.4 Verifying Properties in an Event Log
It is often the case that processes in organizations should obey certain rulesor principles. One common example is the “Four-eyes principle” which de-termines that a same person cannot execute certain tasks (e.g., make thebudget and approve it). These kinds of principles or rules are often used toensure quality of the delivered products and/or to avoid frauds. One way tocheck if these rules are indeed being obeyed is to audit the log that registerswhat has happened in a organization. In ProM, auditing of a log is providedby the analysis plug-in Default LTL Checker Plugin6.
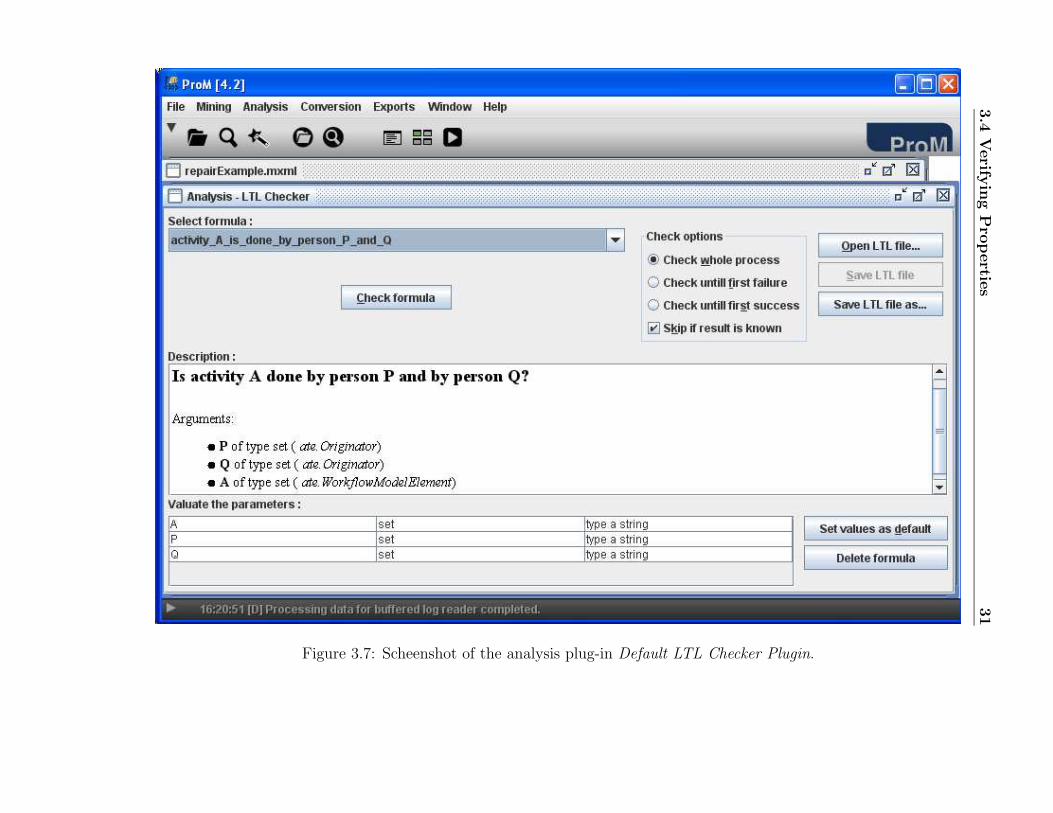
From the description of our running example (cf. Section 1.3), we knowthat after a try to fix the defect, the telephone should be tested to check ifit is indeed repaired. Thus, we could use the Default LTL Checker Pluginto verify the property: Does the task “Test Repair” always happen after thetasks “Repair (Simple)” or “Repair (Complex)” and before the task “ArchiveRepair”? We do so by executing the following procedure:
1. Open the filtered log (cf. Section 2.2) for the running example.
2. Run the Default LTL Checker Plugin by selecting the menu optionAnalysis→[log name...]→Default LTL Checker Plugin. You should geta screen like the one in Figure 3.7.
3. Select the formula “eventually activity A then B then C”.
4. Give as values: (i) activity A = Repair (Simple), (ii) activity B = TestRepair and (iii) activity C = Archive Repair. Note that the LTL plug-in is case sensitive. So, make sure you type in the task names as theyappear in the log.
5. Click on the button Check. The resulting screen should show the logsplit into two parts: one with the cases that satisfy the property (orformula) and another with the cases that do not satisfy the property.Note that the menu options now also allow you to do mining, analysisetc. over the split log. For instance, you can apply again the LTLplug-in over the incorrect process instances to check if the remaining
4http://agna.gq.nu5http://www.netminer.com/6LTL stands for Linear Temporal Logic.
30 Questions Based on an Event Log Only
instances refer to situations in which the task “Repair (Complex)” wasexecuted. Actually, this is what we do in the next step.
6. Run the Default LTL Checker Plugin over the Incorrect Process In-stances by choosing Analysis→Incorrect Instances (573)→Default LTLChecker Plugin.
7. Select the same formula and give the same input as in steps 3 and 4above. However, this time use activity A = Repair (Complex).
8. Click on the button Check. Note that all 573 cases satisfy the formula.So, there are not situations in which a test does not occur after a repair.
A more straightforward way of checking this property would be to give asinput to the parameter “A”, in Step 4, the string “Repair (Simple) | Repair(Complex)”. In this case, the separator “|” is used to indicate that theparameter “A” can assume the value Repair (Simple) or Repair (Complex).
Take your time to experiment with the LTL plug-in. Can you identifywhich pre-defined formula you could use to check for the “Four-eyes princi-ple”?
In this section we have shown how to use the pre-defined formulae ofthe LTL analysis plug-in to verify properties in a log. However, you canalso define your own formulae and import them into ProM. The tutorial thatexplains how to do so is provided together with the documentation for theProM tool7.
7For Windows users, please see Start→Programs→Documentation→All
Documentation→LTLChecker-Manual.pdf.
3.4
Verify
ing
Propertie
s31
Figure 3.7: Scheenshot of the analysis plug-in Default LTL Checker Plugin.

32 Questions Based on an Event Log Only
Chapter 4
Questions Answered Based on
a Process Model Plus an Event
Log
In this section we explain the ProM analysis plug-in that are used to answerthe questions in Table 4.1. These plug-ins differ from the ones in Chapter 3because they require a log and a (process) model as input (cf. Figure 1.2).Section 4.1 explains a conformance ProM plug-in that detects discrepanciesbetween the flows prescribed in a model and the actual process instances(flows) in a log. Sections 4.2 and 4.3 describe extension ProM plug-ins thatrespectively extend the models with performance characteristics and businessrules.
4.1 Conformance Checking
Nowadays, companies usually have some process-aware information system(PAIS) [8] to support their business process. However, these process modelsmay be incomplete because of reasons like: one could not think of all possiblescenarios while deploying the model; the world is dynamic and the way em-ployees work may change but the prescribed process models are not updatedaccordingly; and so on. Either way, it is always useful to have a tool thatprovides feedback about this.
The ProM analysis plug-in that checks how much process instances in alog match a model and highlights discrepancies is the Conformance Checker.As an illustration, we are going to check the exported mined model (cf.Section 3.1, page 20) for the log of the running example against a new logprovided by the company. Our aim is to check how compliant this new log
34 Questions Based on a Process Model Plus an Event Log
Question Section
How compliant are the cases (i.e. process instances) with thedeployed process models? Where are the problems? Howfrequent is the (non-) compliance?
4.1
What are the routing probabilities for each slipt/join task?
4.2What is the average/minimum/maximum throughput timeof cases?Which paths take too much time on average? How manycases follow these routings? What are the critical sub-pathsfor these routes?What is the average service time for each task?How much time was spent between any two tasks in theprocess model?What the the business rules in the process model? 4.3
Table 4.1: Conformance and Extension Plug-ins: questions and pointers toanswers.
is with the prescribed model. The procedure is the following:
1. Open the log “repairexamplesample2.zip”. This log can be downloadedfrom tabu.tm.tue.nl/wiki/ media/tutorial/repairexamplesample2.zip.
2. Open the exported PNML model that you created while executing theprocedure on page 20.
3. Check if the automatically suggested mapping from the tasks in thelog to the tasks in the model is correct. If not, change the mappingaccordingly.
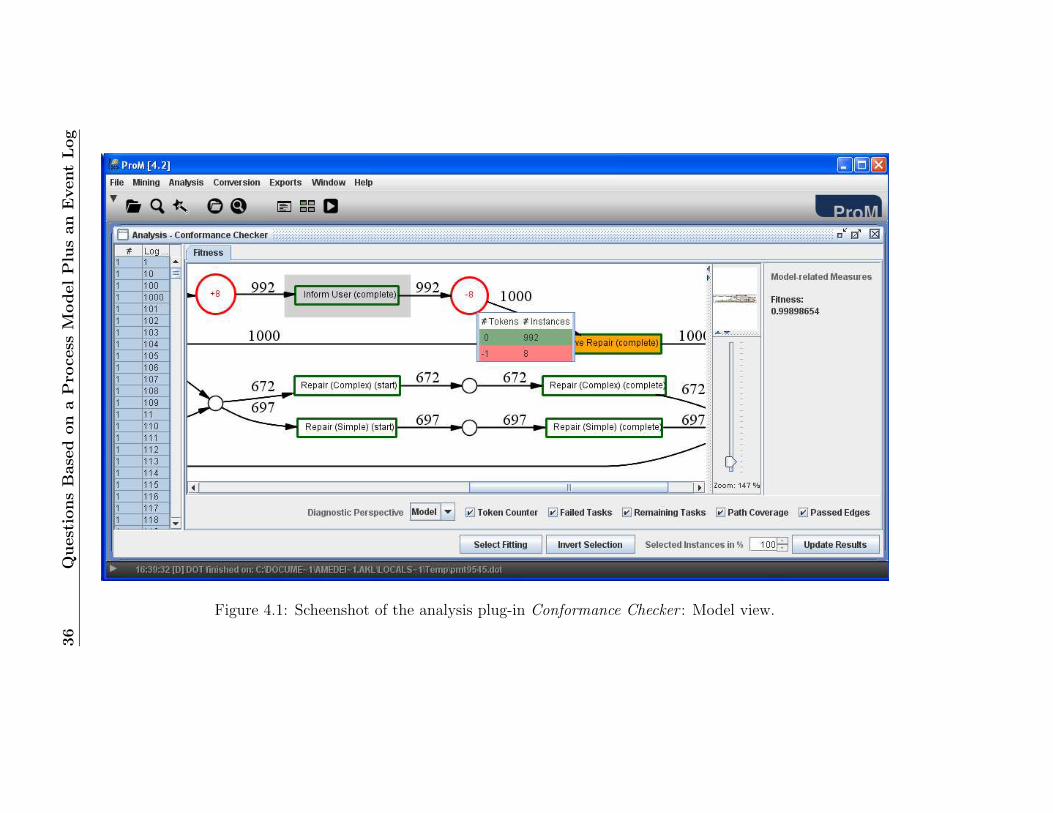
4. Run the Conformance Checker plug-in by choosing the menu optionAnalysis→Selected Petri net→Conformance Checker.
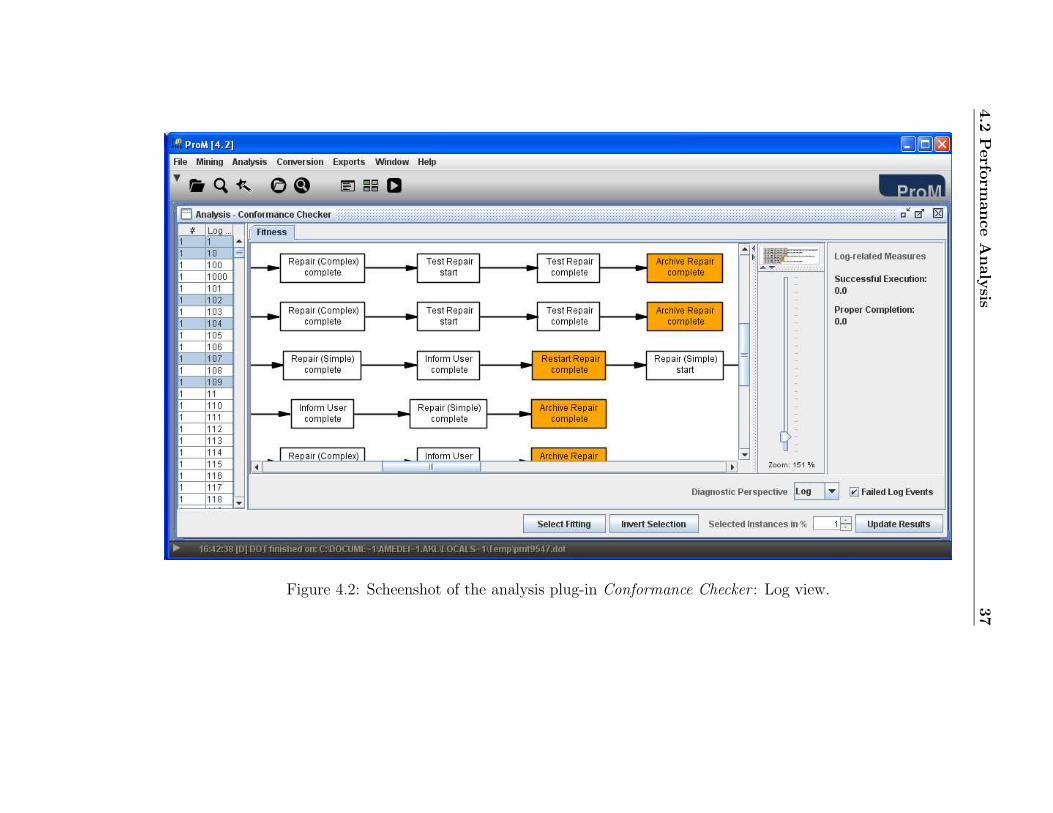
5. Deselect the options “Precision” and “Structure”1, and click the buttonStart analysis. You should get results like the ones shown in figures 4.1and 4.2, which respectively show screenshots of the model and log di-agnostic perspective of the Conformance Checker plug-in. These twoperspectives provide detailed information about the problems encoun-tered during the log replay. The model perspective diagnoses informa-tion about token counter (number of missing/left tokens), failed tasks(tasks that were not enabled), remaining tasks (tasks that remainedenabled), path coverage (the tasks and arcs that were used during thelog replay) and passed edges (how often every arc in the model was
1These are more advanced features that we do not need while checking for compliance.Thus, we will turn them off for now.
4.2 Performance Analysis 35
used during the log replay). The log perspective indicates the points ofnon-compliant behavior for every case in the log.
Take your time to have a look at the results. Can you tell how many tracesare not compliant with the log? What are the problems? Have all the devicesbeen tested after the repair took places? Is the client always being informed?
4.2 Performance Analysis
Like the Conformance Checker (cf. Section 4.1), the plug-in PerfomanceAnalysis with Petri net also requires a log and a Petri net as input2. The maindifference is that this plug-in focuses on analyzing time-related aspects of theprocess instances. In other words, this plug-in can answer the questions:
• What are the routing probabilities for each slipt/join task?
• What is the average/minimum/maximum throughput time of cases?
• Which paths take too much time on average? How many cases followthese routings? What are the critical sub-paths for these routes?
• What is the average service time for each task?
• How much time was spent between any two tasks in the process model?
To run the Perfomance Analysis with Petri net analysis plug-in for the logof our running example, perform the following steps:
1. Open the filtered log (cf. Section 2.2) for the running example.
2. Open the exported PNML model that you created while executing theprocedure on page 20.
3. Run the Perfomance Analysis with Petri net analysis plug-in by select-ing the menu option Analysis→Selected Petri net→Performance Anal-ysis with Petri net.
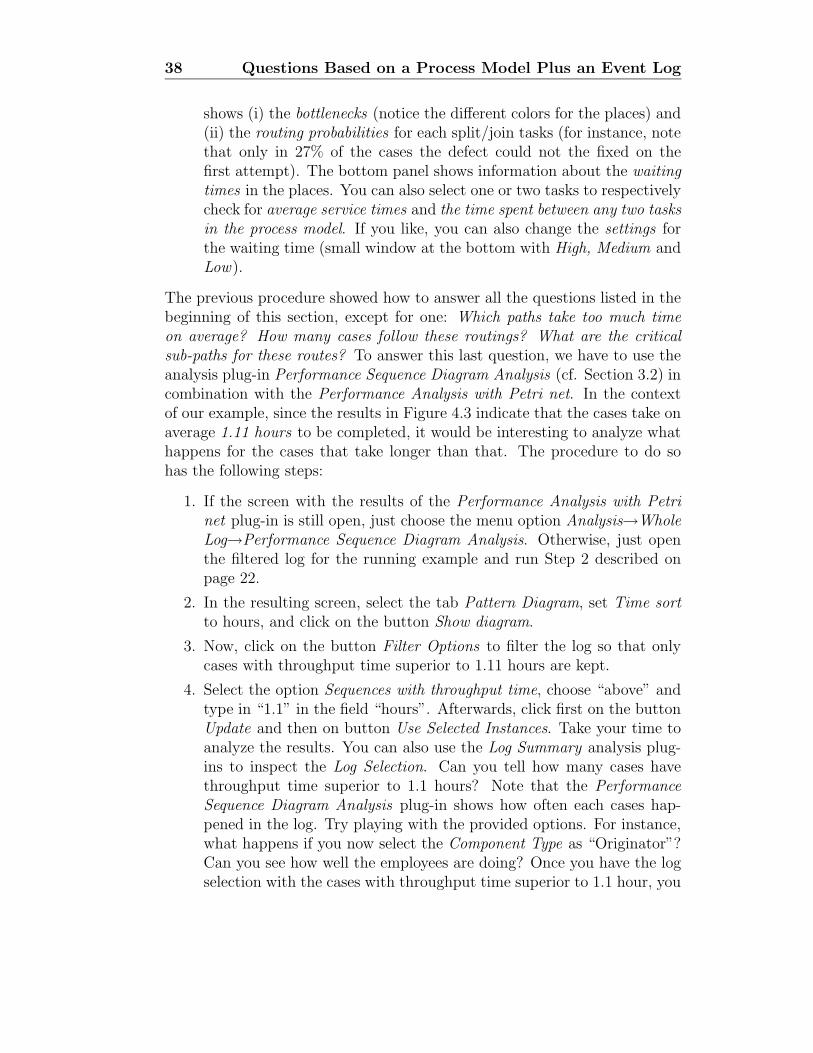
4. Set the field Times measured in to “hours” and click on the buttonStart analysis. The plug-in will start replaying and log and computingthe time-related values. When it is ready, you should see a screen likethe one in Figure 4.3.
5. Take your time to have a look at these results. Note that the right-side panel provides information about the average/minimum/maximumthroughtput times. The central panel (the one with the Petri net model)
2If the model you have is not a Petri net but another one of the supported formats,you can always use one of the provided conversion plug-in to translate your model to aPetri net.
36
Quest
ions
Base
don
aP
rocess
ModelP
lus
an
Event
Log
Figure 4.1: Scheenshot of the analysis plug-in Conformance Checker : Model view.
4.2
Perfo
rm
ance
Analy
sis37
Figure 4.2: Scheenshot of the analysis plug-in Conformance Checker : Log view.
38 Questions Based on a Process Model Plus an Event Log
shows (i) the bottlenecks (notice the different colors for the places) and(ii) the routing probabilities for each split/join tasks (for instance, notethat only in 27% of the cases the defect could not the fixed on thefirst attempt). The bottom panel shows information about the waitingtimes in the places. You can also select one or two tasks to respectivelycheck for average service times and the time spent between any two tasksin the process model. If you like, you can also change the settings forthe waiting time (small window at the bottom with High, Medium andLow).
The previous procedure showed how to answer all the questions listed in thebeginning of this section, except for one: Which paths take too much timeon average? How many cases follow these routings? What are the criticalsub-paths for these routes? To answer this last question, we have to use theanalysis plug-in Performance Sequence Diagram Analysis (cf. Section 3.2) incombination with the Performance Analysis with Petri net. In the contextof our example, since the results in Figure 4.3 indicate that the cases take onaverage 1.11 hours to be completed, it would be interesting to analyze whathappens for the cases that take longer than that. The procedure to do sohas the following steps:
1. If the screen with the results of the Performance Analysis with Petrinet plug-in is still open, just choose the menu option Analysis→WholeLog→Performance Sequence Diagram Analysis. Otherwise, just openthe filtered log for the running example and run Step 2 described onpage 22.
2. In the resulting screen, select the tab Pattern Diagram, set Time sortto hours, and click on the button Show diagram.
3. Now, click on the button Filter Options to filter the log so that onlycases with throughput time superior to 1.11 hours are kept.
4. Select the option Sequences with throughput time, choose “above” andtype in “1.1” in the field “hours”. Afterwards, click first on the buttonUpdate and then on button Use Selected Instances. Take your time toanalyze the results. You can also use the Log Summary analysis plug-ins to inspect the Log Selection. Can you tell how many cases havethroughput time superior to 1.1 hours? Note that the PerformanceSequence Diagram Analysis plug-in shows how often each cases hap-pened in the log. Try playing with the provided options. For instance,what happens if you now select the Component Type as “Originator”?Can you see how well the employees are doing? Once you have the logselection with the cases with throughput time superior to 1.1 hour, you
4.2
Perfo
rm
ance
Analy
sis39
Figure 4.3: Scheenshot of the analysis plug-in Performance Analysis with Petri net.
40 Questions Based on a Process Model Plus an Event Log
can check for critical sub-paths by doing the remaining steps in thisprocedure.
5. Open exported PNML model that you created while executing the pro-cedure on page 20, but this time link it to the selected cases by choosingthe menu option File→Open PNML file→With:Log Selection. If nec-essary, change the automatically suggested mappings and click on thebutton OK. Now the imported PNML model is linked to the processinstances with throughput times superior to 1.1 hours.
6. Run the analysis plug-in Performance Analysis with Petri net to dis-cover the critical sub-paths for these cases. Take your time to analysethe results. For instance, can you see that now 43% of the defects couldnot be fixed on the first attempt?
Finally, we suggest you spend some time reading the Help documentationof this plug-in because it provides additional information to what we haveexplained in this section. Note that the results of this plug-in can also beexported.
4.3 Decision Point Analysis
To discover the business rules (i.e. the conditions) that influence the pointsof choice in a model, you can use the Decision Point Analysis plug-in. Forinstance, in the context of our running example, we could investigate whichdefect types (cf. Section 1.3) are fixed by which team. The procedure to doso has the following steps:
1. Open the filtered log (cf. Section 2.2) for the running example.
2. Open the exported PNML model that you created while executing theprocedure on page 20.
3. Run the Decision Point Analysis plug-in by selecting the menu optionAnalysis→Selected Petri net→Decision Point Analysis.
4. Double-click the option “Choice 3 place 2”. This will select the pointof choice between execution the task “Repair (Complex)” or “Repair(Simple)”3.
5. Select the tab Attributes and set the options: (i) Attribute selectionscope = “all before”, (ii) change the Attribute type of the field de-fectType to “numeric”, and (iii) change the Attribute type of the field
3Note: If your option “Choice 3 place 2” does not correspond to the point of choicewe refer to in the model, please identify the correct option on your list. The importantthing in this step is to select the correct point of choice in the model.
4.3 Decision Point Analysis 41
numberRepairs to “numeric”. Afterwards, click on the button Updateresults. This analysis plug-in will now invoke a data mining algorithm(called J48) that will discover which fields in the log determine thechoice between the different branches in the model.
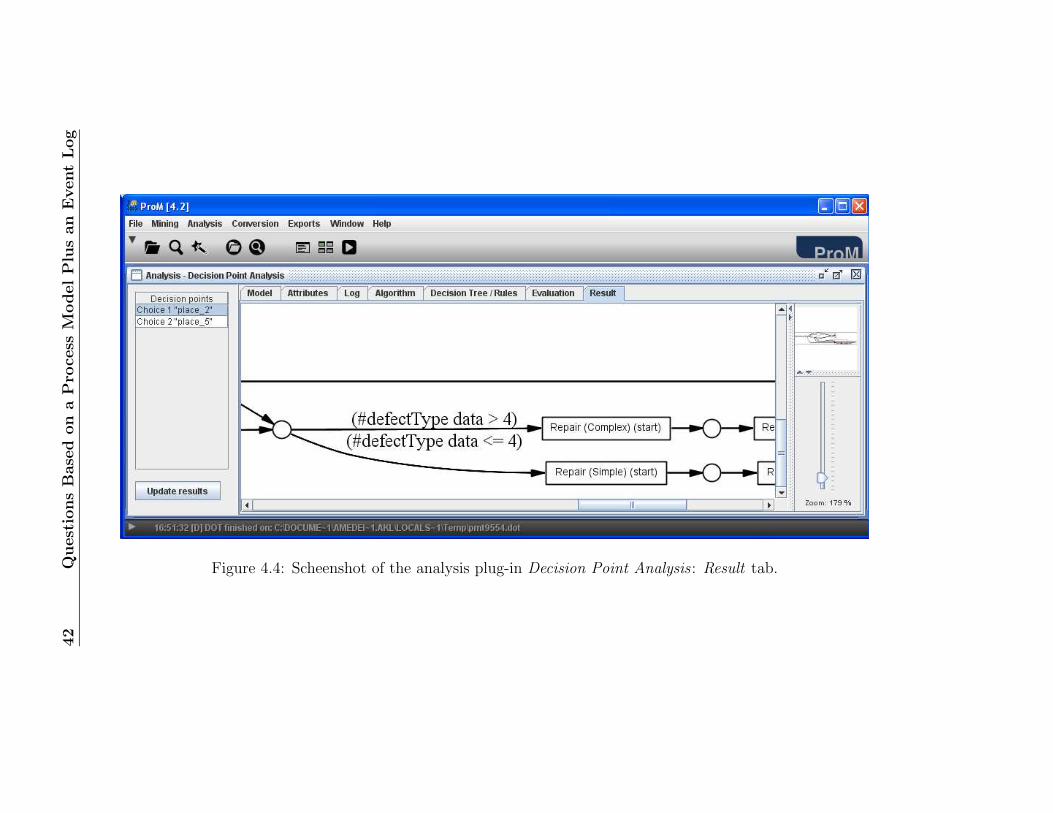
6. Select the tab Result to visualize the mined rules (cf. Figure 4.4).Note that cases with a defect types from 1 to 4 4 are routed to thetask “Repair (Simple)” and the ones with defect type bigger than 4 arerouted to the task “Repair (Complex)”. This is the rule that coversthe majority of the cases in the log. However, it does not mean thatall the cases follow this rule. To check for this, you have to performthe next step.
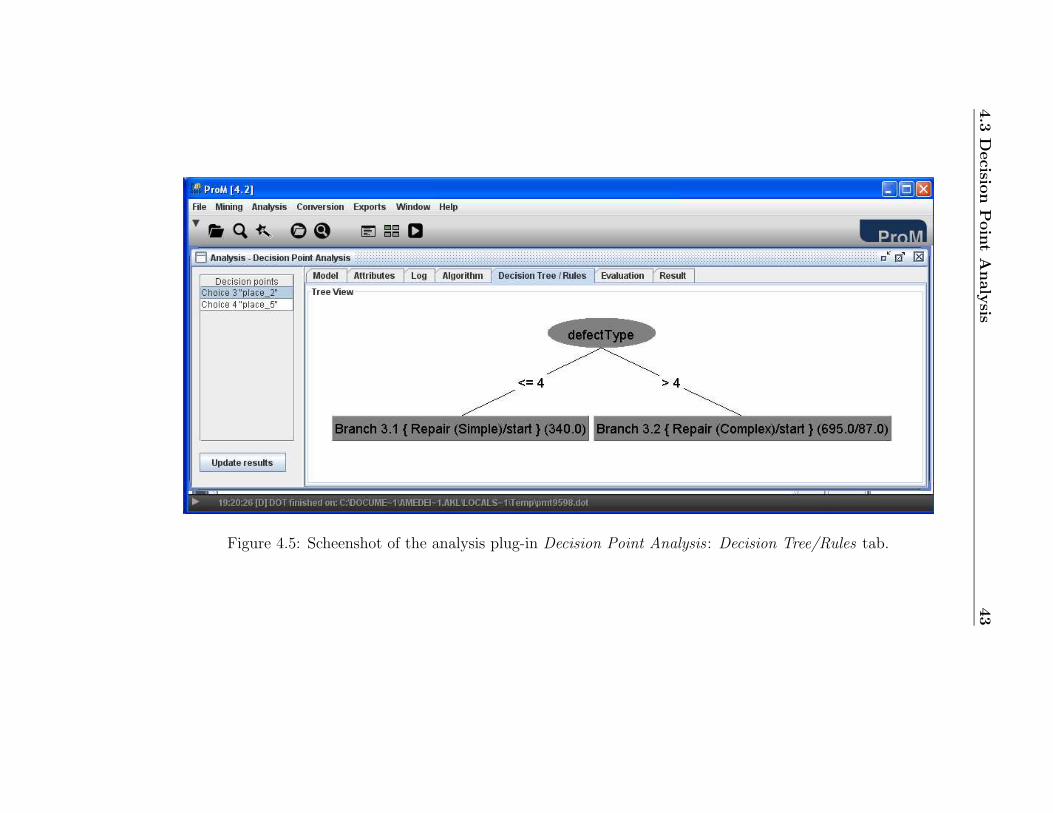
7. Select the tab Decision Tree/Rules (cf. Figure 4.5). Remark the text(695.0/87.0) inside the box for the task “Repair (Complex)”. Thismeans that according to the discovered business rules, 695 cases shouldhave been routed to the task “Repair (Complex)” because their defecttype was bigger than 4. However, 87 of these cases are misclassifiedbecause they were routed to the task “Repair (Simple)”. Thus, theautomatically discovered business rules describe the conditions thatapply to the majority of the cases, but it does not mean that all thecases will fit these rules. Therefore, we recommend you to always checkfor the results in the tab Decision Tree/Rules as well. In our case, theseresult makes sense because, from the description of the running example(cf. Section 1.3), we know that some defect types can be fixed by bothteams.
To get more insight about the Decision Point Analysis, we suggest you spendsome time reading its Help documentation because it provides additionalinformation that was not covered in this section. As for the many ProMplug-ins, the mined results (the discovered rules) can also be exported.
4From the problem description (cf. Section 1.3), we know that there are 10 types ofdefects.
42
Quest
ions
Base
don
aP
rocess
ModelP
lus
an
Event
Log
Figure 4.4: Scheenshot of the analysis plug-in Decision Point Analysis : Result tab.
4.3
Decisio
nPoin
tA
naly
sis43
Figure 4.5: Scheenshot of the analysis plug-in Decision Point Analysis : Decision Tree/Rules tab.

44 Questions Based on a Process Model Plus an Event Log
Chapter 5
Conclusions
This tutorial showed how to use the different ProM plug-ins to answer com-mon questions about process models (cf. Section 1.1). Since our focus wason this set of question, we have not covered many of the other plug-ins thatare in ProM. We hope that the subset we have shown in this tutorial will helpyou in finding your way in ProM. However, if you are interested, you couldhave a further look in plug-ins to verify (process) models and detect potentialproblems (by using the analysis plug-ins Check correctness of EPC, WoflanAnalysis or Petri net Analysis), quantify (from 0% until 100%) how muchbehavior two process models have in common with respect to a given even log(by using the analysis plug-in Behavioral Precision/Recall), create simulationmodels with the different mined perspectives (by using the export plug-in CPNTools) etc. The ProM tool can be downloaded at www.processmining.org.

46 Conclusions
Bibliography
[1] COSA Business Process Management. http://www.cosa-bpm.com/.
[2] SAP. http://www.sap.com/.
[3] Staffware Process Suite. http://www.staffware.com/.
[4] W.M.P. van der Aalst, B.F. van Dongen, C.W. Gunther, R.S. Mans,A.K. Alves de Medeiros, A. Rozinat, V. Rubin, M. Song, H.M.W. Ver-beek, and A.J.M.M. Weijters. ProM 4.0: Comprehensive Support forReal Process Analysis. In J. Kleijn and A. Yakovlev, editors, Applicationand Theory of Petri Nets and Other Models of Concurrency (ICATPN2007), volume 4546 of LNCS, pages 484–494. Springer-Verlag, Berlin,2007.
[5] W.M.P. van der Aalst and K.M. van Hee. Workflow Management: Mod-els, Methods, and Systems. MIT press, Cambridge, MA, 2002.
[6] Workflow Management Coalition. WFMC Home Page.http://www.wfmc.org.
[7] J. Desel and J. Esparza. Free Choice Petri Nets, volume 40 of CambridgeTracts in Theoretical Computer Science. Cambridge University Press,Cambridge, UK, 1995.
[8] M. Dumas, W.M.P. van der Aalst, and A.H. ter Hofstede, editors.Process-Aware Information Systems: Bridging People and SoftwareThrough Process Technology. John Wiley & Sons Inc, 2005.
[9] T. Murata. Petri Nets: Properties, Analysis and Applications. Proceed-ings of the IEEE, 77(4):541–580, April 1989.
[10] W. Reisig and G. Rozenberg, editors. Lectures on Petri Nets I: BasicModels, volume 1491 of Lecture Notes in Computer Science. Springer-Verlag, Berlin, 1998.
[11] H.M.W. Verbeek, B.F. van Dongen, J. Mendling, and W.M.P. van derAalst. Interoperability in the ProM Framework. In T. Latour and M. Pe-tit, editors, Proceedings of the CAiSE’06 Workshops and Doctoral Con-sortium, pages 619–630, Luxembourg, June 2006. Presses Universitairesde Namur.


![2012-13 Prom Dress Code[2] › userfiles › 127 › 2012-13 Prom Dress Code(1).pdfForest Park High School Prom 2013 Prom Dress Code To: Prom participants From: Jeff Jessee, Principal](https://static.fdocuments.in/doc/165x107/5f284715184c880cdb06d74d/2012-13-prom-dress-code2-a-userfiles-a-127-a-2012-13-prom-dress-code1pdf.jpg)