Project Title MECHANISM OF THERMAL RUNAWAY IN VRLA ...project title mechanism of thermal runaway in...
40
Project Title MECHANISM OF THERMAL RUNAWAY IN VRLA BATTERIES AND METHODS TO SUPPRESS IT FINAL TECHNICAL REPORT BY PROF. DETCHKO PAVLOV (PRINCIPAL INVESTIGATOR) FULL MEMBER OF THE BULGARIAN ACADEMY OF SCIENCES (DECEMBER 2004) UNITED STATES ARMY EUROPEAN RESEARCH OFFICE OF THE U.S. ARMY LONDON, ENGLAND CONTRACT NUMBER: N62558-03-M-0805 CONTRACTOR: CENTRAL LABORATORY OF ELECTROCHEMICAL POWER SOURCES (CLEPS), LEAD-ACID BATTERIES DEPARTMENT APPROVED FOR PUBLIC RELEASE; DISTRIBUTION UNLIMITED
Transcript of Project Title MECHANISM OF THERMAL RUNAWAY IN VRLA ...project title mechanism of thermal runaway in...
Project Title
MECHANISM OF THERMAL RUNAWAY IN VRLA BATTERIES
AND METHODS TO SUPPRESS IT
FINAL TECHNICAL REPORT
BY
PROF. DETCHKO PAVLOV (PRINCIPAL INVESTIGATOR) FULL MEMBER OF THE BULGARIAN ACADEMY OF SCIENCES
(DECEMBER 2004)
UNITED STATES ARMY
EUROPEAN RESEARCH OFFICE OF THE U.S. ARMY
LONDON, ENGLAND
CONTRACT NUMBER: N62558-03-M-0805
CONTRACTOR: CENTRAL LABORATORY OF ELECTROCHEMICAL POWER SOURCES (CLEPS), LEAD-ACID BATTERIES DEPARTMENT
APPROVED FOR PUBLIC RELEASE; DISTRIBUTION UNLIMITED
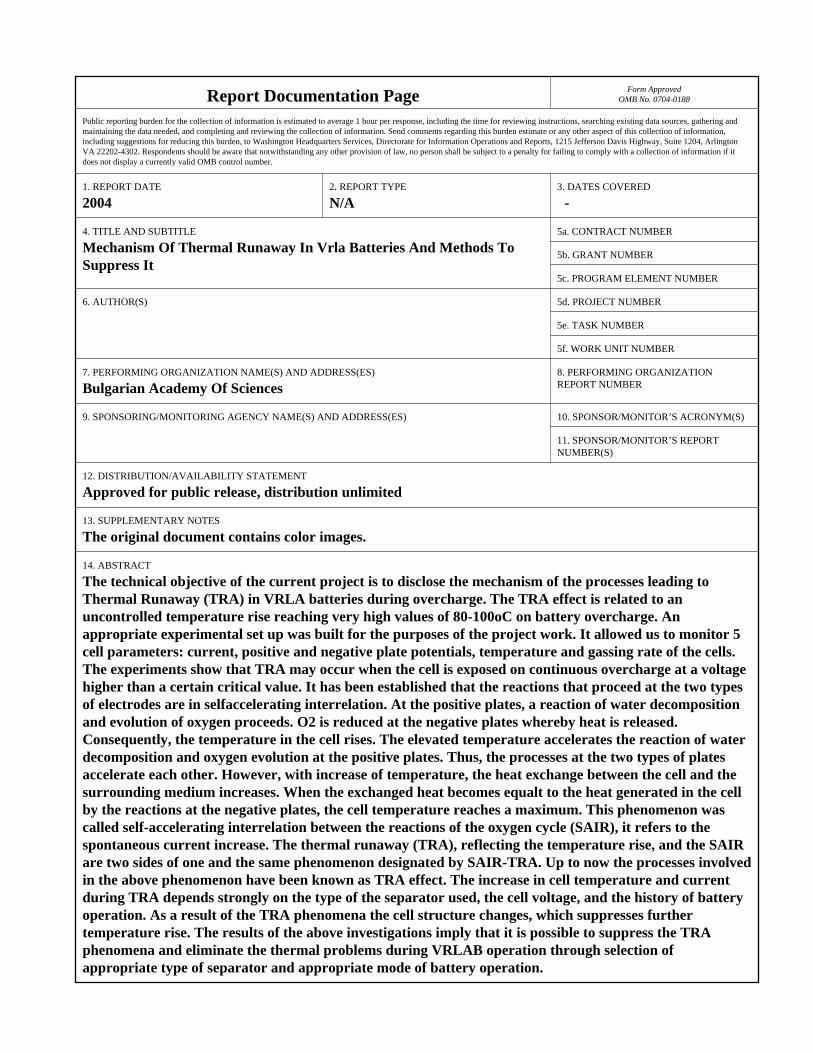
Report Documentation Page Form ApprovedOMB No. 0704-0188
Public reporting burden for the collection of information is estimated to average 1 hour per response, including the time for reviewing instructions, searching existing data sources, gathering andmaintaining the data needed, and completing and reviewing the collection of information. Send comments regarding this burden estimate or any other aspect of this collection of information,including suggestions for reducing this burden, to Washington Headquarters Services, Directorate for Information Operations and Reports, 1215 Jefferson Davis Highway, Suite 1204, ArlingtonVA 22202-4302. Respondents should be aware that notwithstanding any other provision of law, no person shall be subject to a penalty for failing to comply with a collection of information if itdoes not display a currently valid OMB control number.
1. REPORT DATE 2004
2. REPORT TYPE N/A
3. DATES COVERED -
4. TITLE AND SUBTITLE Mechanism Of Thermal Runaway In Vrla Batteries And Methods ToSuppress It
5a. CONTRACT NUMBER
5b. GRANT NUMBER
5c. PROGRAM ELEMENT NUMBER
6. AUTHOR(S) 5d. PROJECT NUMBER
5e. TASK NUMBER
5f. WORK UNIT NUMBER
7. PERFORMING ORGANIZATION NAME(S) AND ADDRESS(ES) Bulgarian Academy Of Sciences
8. PERFORMING ORGANIZATIONREPORT NUMBER
9. SPONSORING/MONITORING AGENCY NAME(S) AND ADDRESS(ES) 10. SPONSOR/MONITOR’S ACRONYM(S)
11. SPONSOR/MONITOR’S REPORT NUMBER(S)
12. DISTRIBUTION/AVAILABILITY STATEMENT Approved for public release, distribution unlimited
13. SUPPLEMENTARY NOTES The original document contains color images.
14. ABSTRACT The technical objective of the current project is to disclose the mechanism of the processes leading toThermal Runaway (TRA) in VRLA batteries during overcharge. The TRA effect is related to anuncontrolled temperature rise reaching very high values of 80-100oC on battery overcharge. Anappropriate experimental set up was built for the purposes of the project work. It allowed us to monitor 5cell parameters: current, positive and negative plate potentials, temperature and gassing rate of the cells.The experiments show that TRA may occur when the cell is exposed on continuous overcharge at a voltagehigher than a certain critical value. It has been established that the reactions that proceed at the two typesof electrodes are in selfaccelerating interrelation. At the positive plates, a reaction of water decompositionand evolution of oxygen proceeds. O2 is reduced at the negative plates whereby heat is released.Consequently, the temperature in the cell rises. The elevated temperature accelerates the reaction of waterdecomposition and oxygen evolution at the positive plates. Thus, the processes at the two types of platesaccelerate each other. However, with increase of temperature, the heat exchange between the cell and thesurrounding medium increases. When the exchanged heat becomes equalt to the heat generated in the cellby the reactions at the negative plates, the cell temperature reaches a maximum. This phenomenon wascalled self-accelerating interrelation between the reactions of the oxygen cycle (SAIR), it refers to thespontaneous current increase. The thermal runaway (TRA), reflecting the temperature rise, and the SAIRare two sides of one and the same phenomenon designated by SAIR-TRA. Up to now the processes involvedin the above phenomenon have been known as TRA effect. The increase in cell temperature and currentduring TRA depends strongly on the type of the separator used, the cell voltage, and the history of batteryoperation. As a result of the TRA phenomena the cell structure changes, which suppresses furthertemperature rise. The results of the above investigations imply that it is possible to suppress the TRAphenomena and eliminate the thermal problems during VRLAB operation through selection ofappropriate type of separator and appropriate mode of battery operation.
15. SUBJECT TERMS
16. SECURITY CLASSIFICATION OF: 17. LIMITATION OF ABSTRACT
SAR
18. NUMBEROF PAGES
38
19a. NAME OFRESPONSIBLE PERSON
a. REPORT unclassified
b. ABSTRACT unclassified
c. THIS PAGE unclassified
Standard Form 298 (Rev. 8-98) Prescribed by ANSI Std Z39-18
2
TABLE OF CONTENTS
Page
ABSTRACT 3
INTRODUCTION 4
EXPERIMENTAL SET-UP 5
1. Experimental cells 5
2. Equipment used 6
3. Model cells 6
4. Research approach 7
EXPERIMENTAL RESULTS AND DISCUSSION
8
1. Thermal phenomena in cells with AGM separators 8
2. Thermal phenomena in MAGM cells 18
3. Temperature dependence of cell voltage and of positive and negative plate potentials
22
4. Analyses of the active materials after the polarization tests 25
5. Chemical and electrochemical reactions involved in the oxygen cycle and proceeding at the two types of electrodes
30
CONCLUSIONS 34
What should be done within a next stage of investigations of the SAIR-TRA phenomenon?
36
LITERATURE CITED 37
3
ABSTRACT
The technical objective of the current project is to disclose the mechanism of the
processes leading to Thermal Runaway (TRA) in VRLA batteries during overcharge.
The TRA effect is related to an uncontrolled temperature rise reaching very high
values of 80-100oC on battery overcharge. An appropriate experimental set up was
built for the purposes of the project work. It allowed us to monitor 5 cell parameters:
current, positive and negative plate potentials, temperature and gassing rate of the
cells. The experiments show that TRA may occur when the cell is exposed on
continuous overcharge at a voltage higher than a certain critical value. It has been
established that the reactions that proceed at the two types of electrodes are in self-
accelerating interrelation. At the positive plates, a reaction of water decomposition
and evolution of oxygen proceeds. O2 is reduced at the negative plates whereby heat
is released. Consequently, the temperature in the cell rises. The elevated
temperature accelerates the reaction of water decomposition and oxygen evolution at
the positive plates. Thus, the processes at the two types of plates accelerate each
other. However, with increase of temperature, the heat exchange between the cell
and the surrounding medium increases. When the exchanged heat becomes equalt
to the heat generated in the cell by the reactions at the negative plates, the cell
temperature reaches a maximum. This phenomenon was called “self-accelerating
interrelation between the reactions of the oxygen cycle (SAIR)”, it refers to the
spontaneous current increase. The thermal runaway (TRA), reflecting the
temperature rise, and the SAIR are two sides of one and the same phenomenon
designated by SAIR-TRA. Up to now the processes involved in the above
phenomenon have been known as TRA effect.
The increase in cell temperature and current during TRA depends strongly on the
type of the separator used, the cell voltage, and the history of battery operation. As a
result of the TRA phenomena the cell structure changes, which suppresses further
temperature rise.
The results of the above investigations imply that it is possible to suppress the TRA
phenomena and eliminate the thermal problems during VRLAB operation through
selection of appropriate type of separator and appropriate mode of battery operation.
Keywords: lead-acid battery, thermal runaway, oxygem cycle, valve-regulated lead-
acid battery, thermal effects in lead-acid batteries
4
INTRODUCTION
VRLA batteries comprise two electrochemical systems: (a) the Pb/PbSO4 and
PbO2/PbSO4 system that accumulates and generates energy, and (b) the H2O/O2
and O2/H2O oxygen cycle, which operates during battery overcharge. As all
electrochemical processes involved in the oxygen cycle are temperature dependent,
the phenomenon known as "thermal runaway" (TRA) occurs. As discussed in our 2nd
and 3rd Interim Reports, the TRA effect occurs on polarization at constant voltage.
Under such conditions, the current increases with time of constant voltage
polarization, which leads to temperature rise in the cell and hence accelerates the
electrochemical processes. These processes are influenced by the type and
properties of the separator used. That is why we performed investigations with two
types of separators: absorptive glass mat (AGM) and AGM modified with polymeric
emulsion (MAGM). The present Final Report compares the evolution of TRA
phenomena in cells with AGM and MAGM separators.
All experiments were performed with fully charged cells in which only the reactions of
the oxygen cycle proceed. As the TRA effect occurs on constant voltage polarization
of the cells, we conducted investigations at different, but constant, voltages. The
changes in 6 cell parameters were followed with time of polarization. These changes
were induced by both the heat effects of the reactions and the Joule heat. The
dependence of cell temperature on current density was selected as the generalized
function. On completion of the above series of thermal investigations of the cells, a
series of polarization tests was performed to determine the temperature coefficients
of the reactions involved in the oxygen cycle at the positive and at the negative
plates.
In an attempt to establish the influence of the TRA effect on the active masses we
performed various analyses aimed to determine the phase composition and structure
of the positive and negative active masses as well as their crystal morphology. The
obtained results of these analyses for the cells with different separators will be
compared in this report.
5
EXPERIMENTAL SET-UP [1]
1. Experimental cells
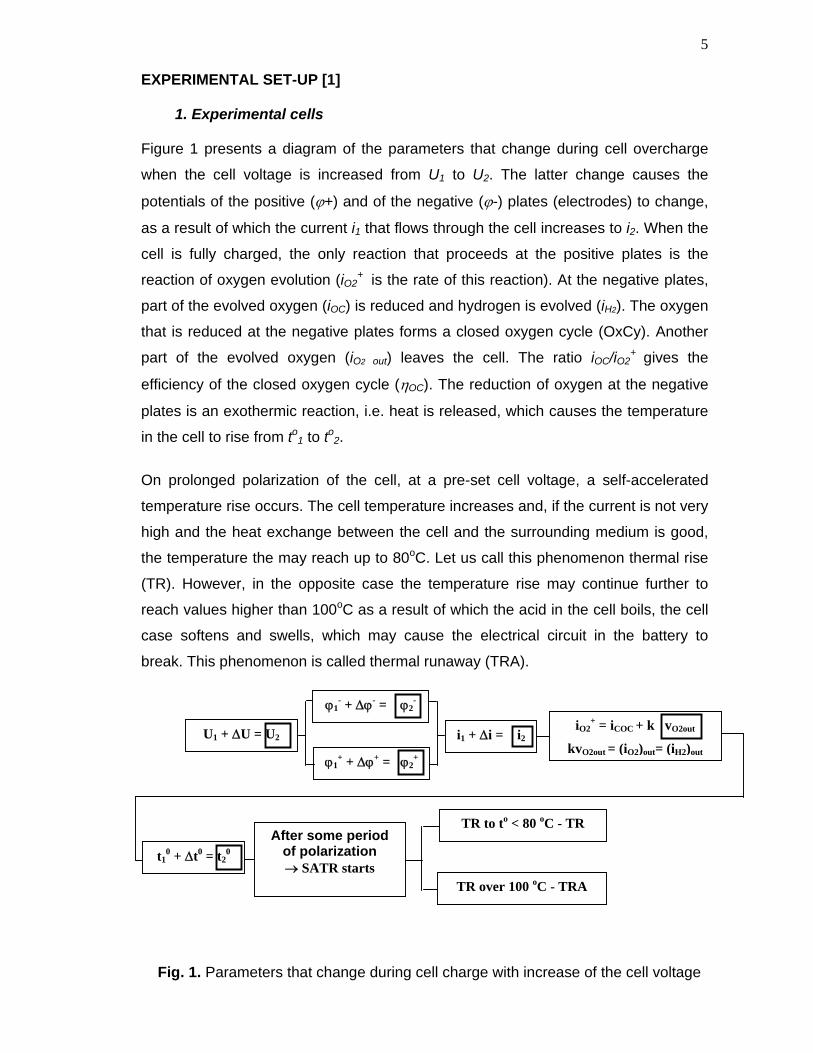
Figure 1 presents a diagram of the parameters that change during cell overcharge
when the cell voltage is increased from U1 to U2. The latter change causes the
potentials of the positive (+) and of the negative (-) plates (electrodes) to change,
as a result of which the current i1 that flows through the cell increases to i2. When the
cell is fully charged, the only reaction that proceeds at the positive plates is the
reaction of oxygen evolution (iO2+ is the rate of this reaction). At the negative plates,
part of the evolved oxygen (iOC) is reduced and hydrogen is evolved (iH2). The oxygen
that is reduced at the negative plates forms a closed oxygen cycle (OxCy). Another
part of the evolved oxygen (iO2 out) leaves the cell. The ratio iOC/iO2+ gives the
efficiency of the closed oxygen cycle (OC). The reduction of oxygen at the negative
plates is an exothermic reaction, i.e. heat is released, which causes the temperature
in the cell to rise from to1 to to2.
On prolonged polarization of the cell, at a pre-set cell voltage, a self-accelerated
temperature rise occurs. The cell temperature increases and, if the current is not very
high and the heat exchange between the cell and the surrounding medium is good,
the temperature the may reach up to 80oC. Let us call this phenomenon thermal rise
(TR). However, in the opposite case the temperature rise may continue further to
reach values higher than 100oC as a result of which the acid in the cell boils, the cell
case softens and swells, which may cause the electrical circuit in the battery to
break. This phenomenon is called thermal runaway (TRA).
Fig. 1. Parameters that change during cell charge with increase of the cell voltage
U1 + U = U2
1+ + + = 2
+
i1 + i = i2 iO2
+ = iCOC + k vO2out
kvO2out = (iO2)out= (iH2)out
t10 + t0 = t2
0
After some period of polarization SATR starts
TR to to < 80 oC - TR
TR over 100 oC - TRA
1- + - = 2
-
6
In an attempt to identify the phenomena that proceed on thermal rise and thermal
runaway we measured the following cell parameters (marked with bold squares in
Fig.1) and monitored how they change with the time of polarization:
U – cell voltage
+ - positive plate potential vs. Ag/Ag2SO4 reference electrode
- - negative plate potential vs. Ag/Ag2SO4 reference electrode
i – current flowing through the cell
to – cell temperature
dVout/dt - rate of gas leaving the cell
Vout = VO2 out + VH2 out – total volume of gas released from the cell for the time of
polarization
2. Equipment used [2]
Bitrode SCN 10-5 test modules were used to maintain constant current or
constant voltage in the model cells.
The potentials of the positive and of the negative plates were measured versus a
specially designed and constructed Ag/Ag2SO4 reference electrode.
A 16-channel computerized data acquisition system was specially designed and
constructed to collect the data from the measuring instruments.
The changes in cell temperature were monitored through thermocouples
mounted in the cells and the obtained data were continuously collected and
saved in a computer.
When the cell valves opened, the rate of the released gas was measured with the
help of a computerized gassing rate monitoring (GRM) system (own design).
3. Model cells
Model cells 2V/4Ah were assembled using specially designed and produced
transparent polymer cases, positive and negative plates with grids cast from PbSn
alloy. The plates were formed and dried (the negative ones in nitrogen atmosphere),
then they were weighed and mounted dry charged in the cells. AGM separators
(Hollingsworht & Vose) and modified AGM (MAGM) separators developed in our
laboratory were used. The separators were inserted between the plates under
7
compression so that their thickness was reduced by 7 оr 22%. Each cell was outfitted
with a valve, a Ag/Ag2SO4 reference electrode and a thermocouple. The gas leaving
the cell through the valve was forced to pass through a flow meter (the GRM
system).
4. Research approach
Two series of experimental cells were manufactured: one with AGM and the other
one with MAGM separators. Two series of experiments (tests) were performed as
follows:
(a) The first series of experiments (tests) was aimed to investigate the cycle life
performance of AGM and MAGM cells as well as the influence of cell polarization
at constant voltage and constant current. The results of these investigations were
discussed in detail in our 2nd Interim Report [2].
(b) The second series of experiments (tests) with AGM and MAGM cells was aimed
to investigate the mechanism of the thermal runaway phenomenon itself. A
detailed description of the behaviour of the MAGM cells under test was presented
in our 3rd Interim Report [3]. In the present Final Report we will disclose the
mechanism of the TRA effect on grounds of the test results for two experimental
cells, one with AGM and the other one with MAGM separators. The test results
for the remaining 4 AGM cells and 7 MAGM cells are analogous, so they will not
be discussed in this report. The behaviour of these cells is indicative not only of
the processes that occur on thermal runaway, but also of the influence of the
separator on these processes.
8
EXPERIMENTAL RESULTS AND DISCUSSION
1. Thermal phenomena in cells with AGM separators
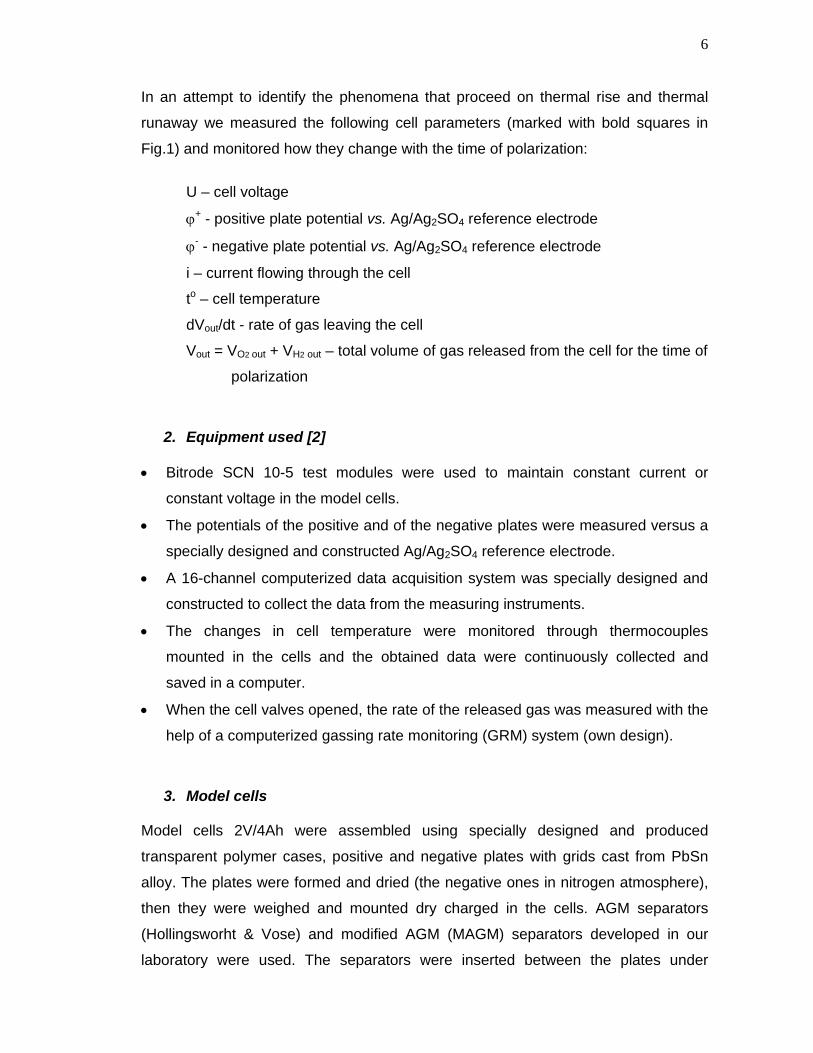
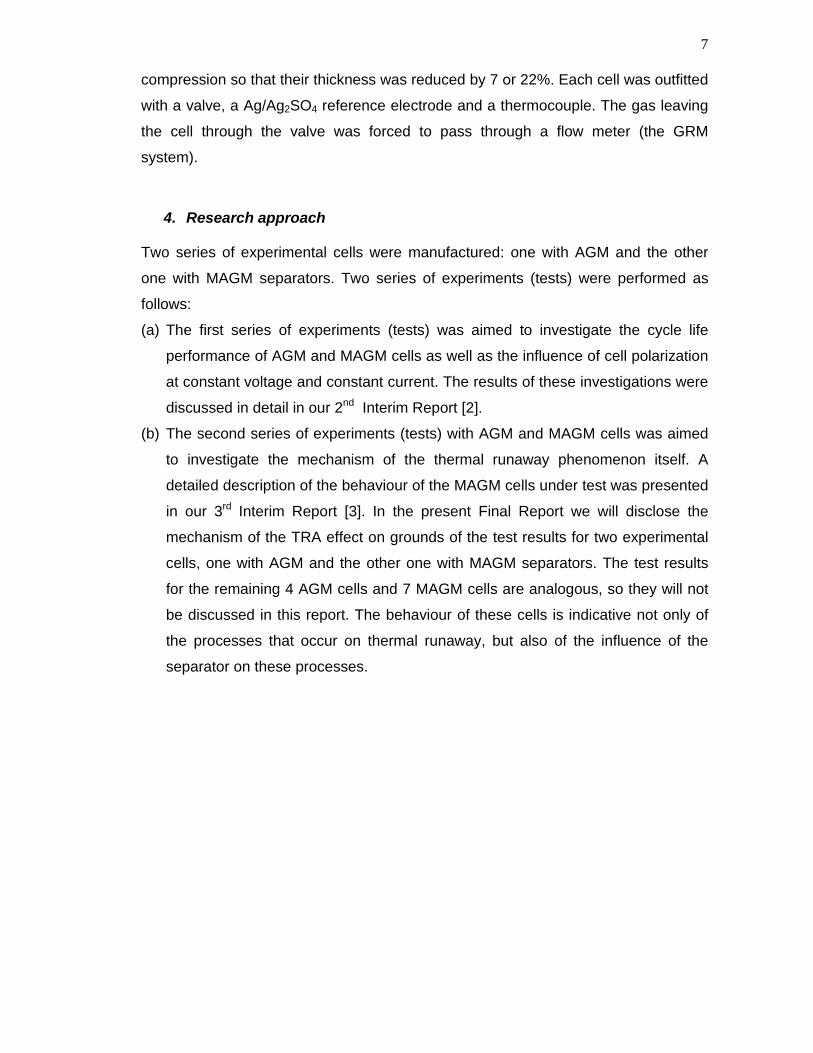
Figure 2 shows the changes in the five measured parameters on polarization of the
AGM cell at constant voltage of 2.50 V (Fig. 2A), 2.45 V (Fig. 2B) and 2.40 V (Fig.
2C), respectively.
C402, TR1U = 2,50 V
0
2
4
6
8
10
0:00 0:02 0:04 0:06 0:08 0:10 0:12 0:14 0:16 0:18 0:20 0:22 0:24Step Time / hh:mm
Cu
rren
t / A
1,7
1,9
2,1
2,3
2,5
2,7
Vo
ltag
e /
V
Current
Voltage
C402, TR1U = 2,50 V
1
1,1
1,2
1,3
1,4
1,5
0:00 0:02 0:04 0:06 0:08 0:10 0:12 0:14 0:16 0:18 0:20 0:22 0:24Step Time / hh:mm
PP
po
ten
tia
l / V
-1,5
-1,4
-1,3
-1,2
-1,1
-1
NP
po
ten
tial
/ V
positve plate
negatve plate
C402, TR1U = 2,50 V
0
10
20
30
40
50
60
70
0:00 0:02 0:04 0:06 0:08 0:10 0:12 0:14 0:16 0:18 0:20 0:22 0:24Step Time / hh:mm
T /
oC
0
10
20
30
40
50
60
70
gas
sin
g r
ate
/ m
in-1
Temperature
gassing rate
Fig. 2a. Changes in U, I, +, -, To and gassing rate during polarization of the cell at different constant voltages: 2.50 V (Fig. 2a); 2.45 V (Fig. 2b) and 2.40 (Fig. 2c).
9
C402, TR1U = 2,45 V
0
2
4
6
8
10
0:00 0:06 0:12 0:18 0:24 0:30 0:36 0:42 0:48Step Time / hh:mm
Cu
rre
nt
/ A
1,7
1,9
2,1
2,3
2,5
2,7
Vo
lta
ge
/ V
Current
Voltage
C402, TR1U = 2,40 V
0
2
4
6
8
10
0:00 1:00 2:00 3:00 4:00 5:00 6:00 7:00Step Time / hh:mm
Cu
rre
nt
/ A
1,7
1,9
2,1
2,3
2,5
2,7
Vo
ltag
e / V
Current
Voltage
C402, TR1U = 2,45 V
1
1,1
1,2
1,3
1,4
1,5
0:00 0:06 0:12 0:18 0:24 0:30 0:36 0:42 0:48Step Time / hh:mm
PP
po
ten
tia
l / V
-1,5
-1,4
-1,3
-1,2
-1,1
-1
NP
po
ten
tial
/ V
positve plate
negatve plate
C402, TR1U = 2,40 V
1
1,1
1,2
1,3
1,4
1,5
0:00 1:00 2:00 3:00 4:00 5:00 6:00 7:00Step Time / hh:mm
PP
po
ten
tial /
V
-1,5
-1,4
-1,3
-1,2
-1,1
-1
NP
po
ten
tial /
V
positve plate
negatve plate
C402, TR1U = 2,45 V
0
10
20
30
40
50
60
0:00 0:06 0:12 0:18 0:24 0:30 0:36 0:42 0:48Step Time / hh:mm
T /
oC
0
10
20
30
40
50
60
70G
assi
ng
rat
e / m
in-1Temperature
gassing rate
C402, TR1U = 2,40 V
0
10
20
30
40
50
60
70
80
0:00 1:00 2:00 3:00 4:00 5:00 6:00 7:00Step Time / hh:mm
T /
oC
0
10
20
30
40
gassin
g r
ate
/ m
in-1
Temperature
gassing rate
Fig. 2b. Fig. 2c.
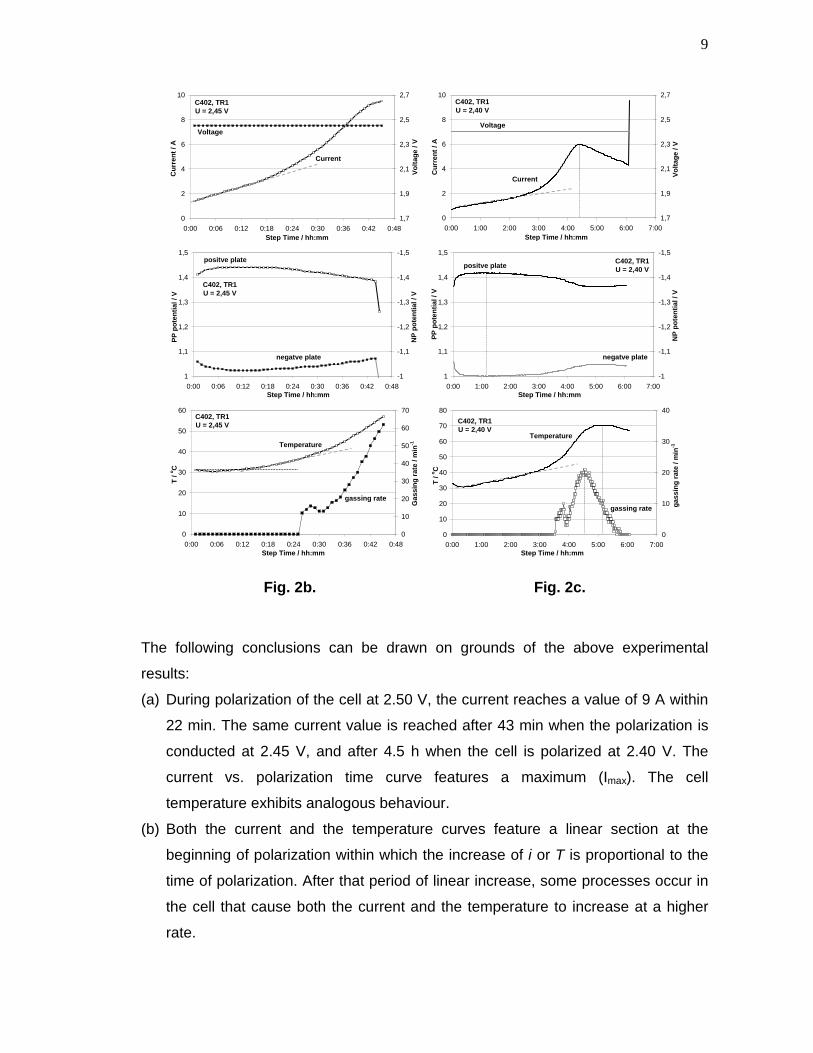
The following conclusions can be drawn on grounds of the above experimental
results:
(a) During polarization of the cell at 2.50 V, the current reaches a value of 9 A within
22 min. The same current value is reached after 43 min when the polarization is
conducted at 2.45 V, and after 4.5 h when the cell is polarized at 2.40 V. The
current vs. polarization time curve features a maximum (Imax). The cell
temperature exhibits analogous behaviour.
(b) Both the current and the temperature curves feature a linear section at the
beginning of polarization within which the increase of i or T is proportional to the
time of polarization. After that period of linear increase, some processes occur in
the cell that cause both the current and the temperature to increase at a higher
rate.
10
(c) On cell polarization at 2.40 V (Fig. 2C), several maximums appear in the curves:
first the + peak in the +/t curve occurs with the corresponding - minimum in the
-/t curve, followed by the imax in the current transient and the maximum in the
gassing rate/time curve, and finally the Tmax in the temperature curve. This
behaviour of the measured parameters indicates that on polarization of the cell at
constant voltage (U), the processes involved in the oxygen cycle (OxCy) pass
through different stages to reach a certain steady state.
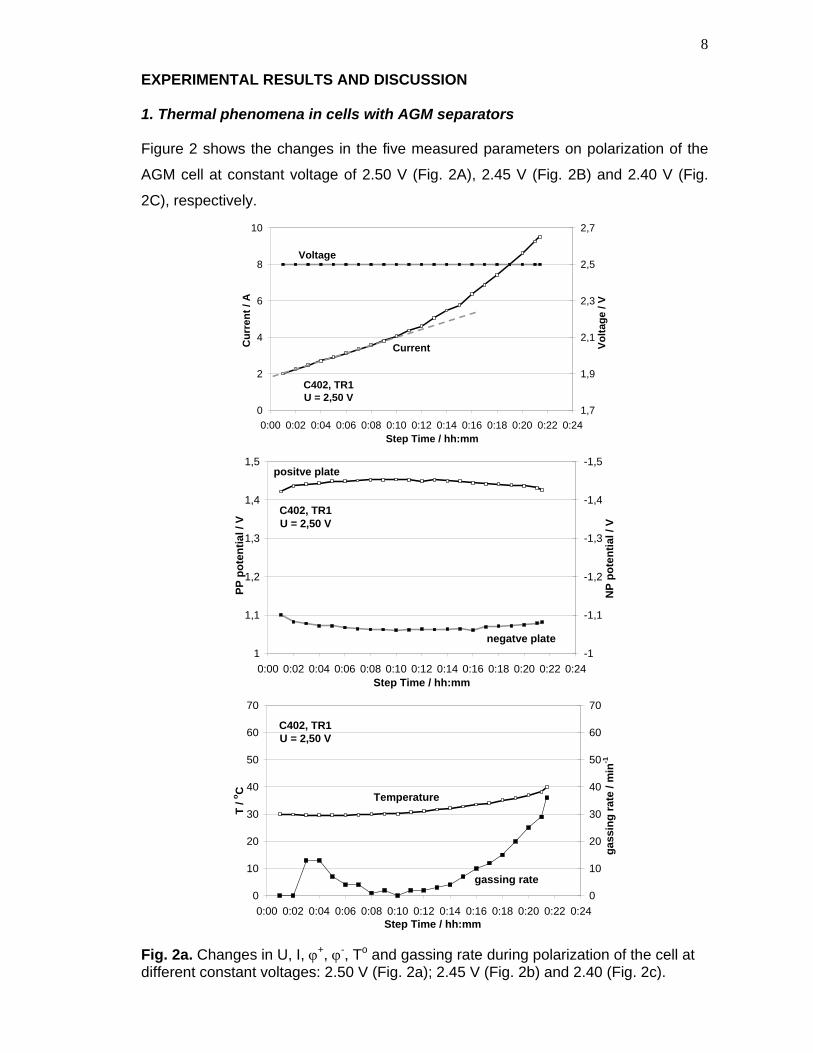
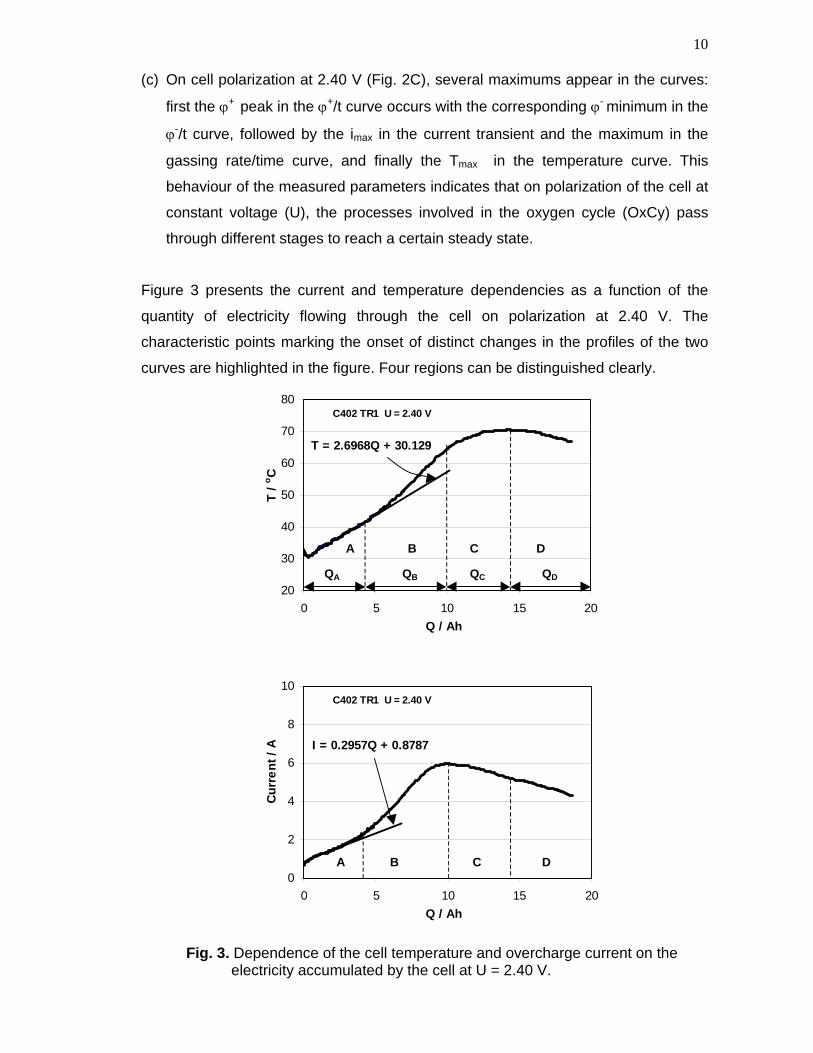
Figure 3 presents the current and temperature dependencies as a function of the
quantity of electricity flowing through the cell on polarization at 2.40 V. The
characteristic points marking the onset of distinct changes in the profiles of the two
curves are highlighted in the figure. Four regions can be distinguished clearly.
T = 2.6968Q + 30.129
20
30
40
50
60
70
80
0 5 10 15 20
Q / Ah
T /
oC
C402 TR1 U = 2.40 V
QA
A B C D
QB QC QD
I = 0.2957Q + 0.8787
0
2
4
6
8
10
0 5 10 15 20
Q / Ah
Cu
rre
nt
/ A
C402 TR1 U = 2.40 V
A B C D
Fig. 3. Dependence of the cell temperature and overcharge current on the electricity accumulated by the cell at U = 2.40 V.
11
Region A (Fig. 3). Electric current flows through the cell generating Joule heat and
some exothermal chemical reactions proceed which also generate heat. These heat
effects cause the cell temperature to rise following a linear dependence on the
quantity of electricity flowing through the cell, Q.
T = 2.70 Q + 20.12 (A)
The elevated temperate accelerates the electrochemical and chemical reactions as a
result of which the current increases also following a linear dependence on the
quantity of electricity:
i = 0.30 Q + 0.88 (B) The above linear profile of the temperature increase continues until a quantity of
electricity QA is introduced into the cell.
Region B (Fig. 3). When a QA quantity of electricity flows through the cell, some
processes start which lead to an increase in current i greater than the one predicted
by the linear equation. This current increase continues until the maximum value Imax
is reached. During this time a quantity of electricity QB flows through the cell. Faster
current increase is possible only if the accelerated electrochemical reactions on one
of the electrodes causes the reactions on the other electrode to proceed at a higher
rate, too, i.e. when the reactions at the two electrodes are interrelated. The reactions
that proceed at the negative electrode (oxygen reduction) are associated with heat
release. The latter causes the cell temperature to increase, which in turn accelerates
the reactions at the positive electrode (water decomposition and oxygen evolution).
The evolution of more oxygen at the positive plate results in a more intense oxygen
flow towards the negative plate. Hence, the rate of oxygen reduction at the negative
plate will increase and so will the amount of released heat, too. The latter will cause
further temperature rise. Thus, the processes proceeding at the two types of
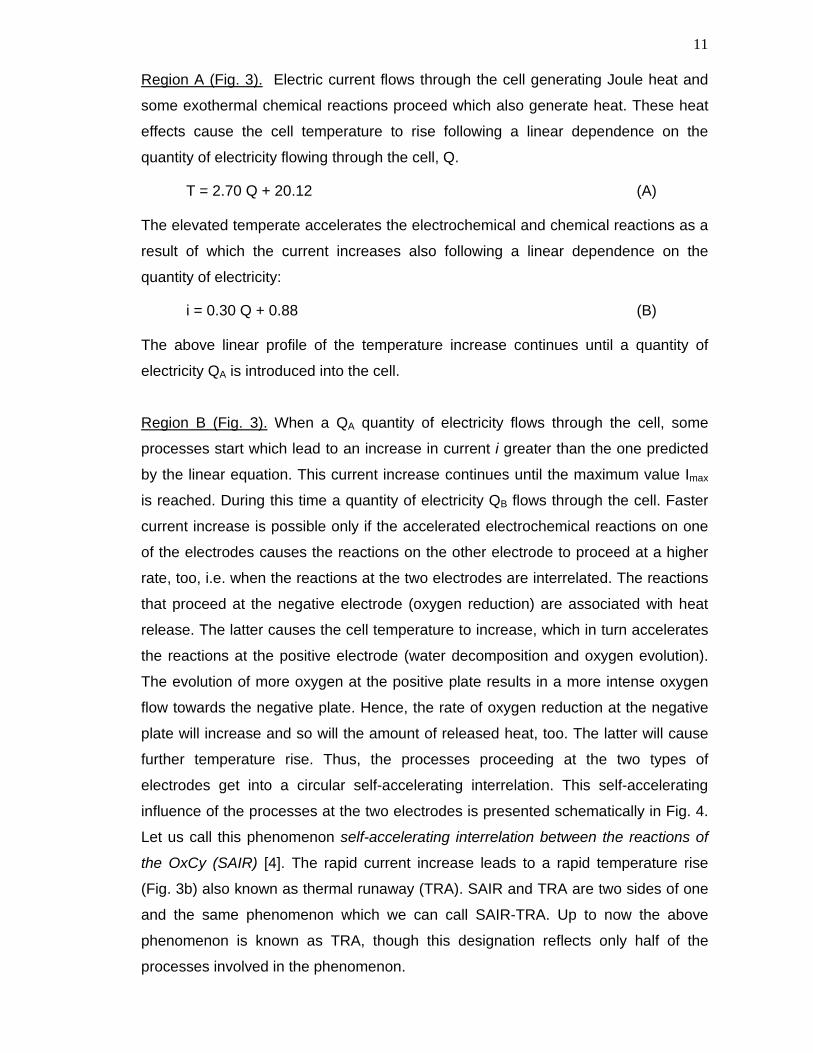
electrodes get into a circular self-accelerating interrelation. This self-accelerating
influence of the processes at the two electrodes is presented schematically in Fig. 4.
Let us call this phenomenon self-accelerating interrelation between the reactions of
the OxCy (SAIR) [4]. The rapid current increase leads to a rapid temperature rise
(Fig. 3b) also known as thermal runaway (TRA). SAIR and TRA are two sides of one
and the same phenomenon which we can call SAIR-TRA. Up to now the above
phenomenon is known as TRA, though this designation reflects only half of the
processes involved in the phenomenon.
12
Fig. 4. Schematic representation of the self-accelerating interrelations between
the reactions of the oxygen cycle in a VRLA cell. Region C (Fig. 3). The cell temperature increases further after region B, when
another 5.0 Ah flow through the cell, to reach the maximum value Tmax. Within this
region C, which takes more than an hour, the current decreases from 6 to 5 A and
hence the Joule heat decreases, too. However, the cell temperature continues to
rise. It follows then that the temperature increase is a result of the heat effects of the
reactions involved in the oxygen cycle. After a quantity of electricity QC flows through
the cell, the cell temperature reaches its maximum value Tmax. The latter is
determined by (depends on?) the following phenomenon. With increase of
temperature in the cell, the difference between the cell temperature and the
temperature of the surrounding medium increases. Hence, the heat flow that leaves
the cell increases, too. When the heat leaving the cell per unit time equals the heat
generated by the reactions in the cell per unit time, the cell temperature reaches its
maximum value Tmax. The fact that imax and Tmax are reached when different
quantities of electricity have passed through the cell indicates unequivocally that
temperature increase is due to the heat effects of some chemical reactions of oxygen
reduction. When QC quantity of electricity flows through the cell, its temperature
begins to decrease with further decrease of the current.
Region D (Fig. 3). Within this region, both the current and the temperature decrease
reaching stationary values. During this period, too, there is an interrelation between
the processes that occur at the two electrodes. The lower current flowing through the
cell within the D region decreases the oxygen flow that is generated at the positive
plate. On reduction of this oxygen, less heat will be generated per unit time. The heat
rate of O2 reduction
Joule heat
Heat Т > 0
O2 flow, mO2
rate of O2 evolution +
13
leaving the cell per unit time will be greater than the generated one and hence the
cell temperature will decrease. Consequently, the rate of the reactions of oxygen
evolution at the positive plate will be slowed down. Thus, the interrelation between
the processes ocurrign at the two electrodes will have a negative effect. This
phenomenon will continue until the heat generated in the cell per unit time becomes
equal to the heat leaving the cell per unit time. Only then will the stationary stage of
the OxCy begin.
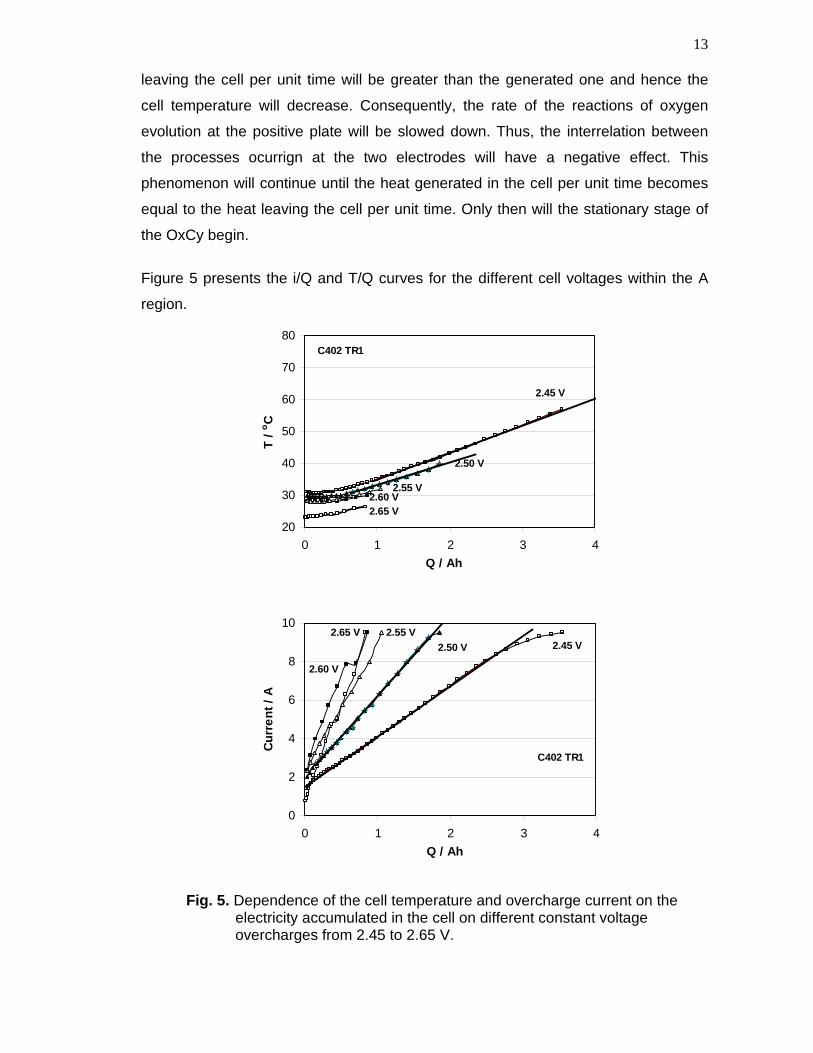
Figure 5 presents the i/Q and T/Q curves for the different cell voltages within the A
region.
20
30
40
50
60
70
80
0 1 2 3 4
Q / Ah
T /
oC
2.65 V2.60 V
2.55 V
2.50 V
2.45 V
C402 TR1
0
2
4
6
8
10
0 1 2 3 4
Q / Ah
Cu
rre
nt
/ A
2.65 V
2.60 V
2.55 V
2.50 V 2.45 V
C402 TR1
Fig. 5. Dependence of the cell temperature and overcharge current on the electricity accumulated in the cell on different constant voltage
overcharges from 2.45 to 2.65 V.
14
Table 1: Parameters of the equation: y = a + b*x for the cell current and temperature at different polarization voltages
U, V b(T) a(T) b(I) a(I)
2.45 8.5 26.3 2.6 1.45
2.5 7 26.3 4.3 1.96
2.55 5.1 26.7 6.7 2.26
2.65 5 22.2 10.1 0.7
It can be seen form the data in Fig. 5 and Table 1 that the slope of the linear equation
for cell temperature b decreases with increase of the cell voltage U. The constant a in
the same equation depends but slightly on the cell polarization voltage. The slope of
the linear section in the i/Q curves increases with increase of the applied voltage.
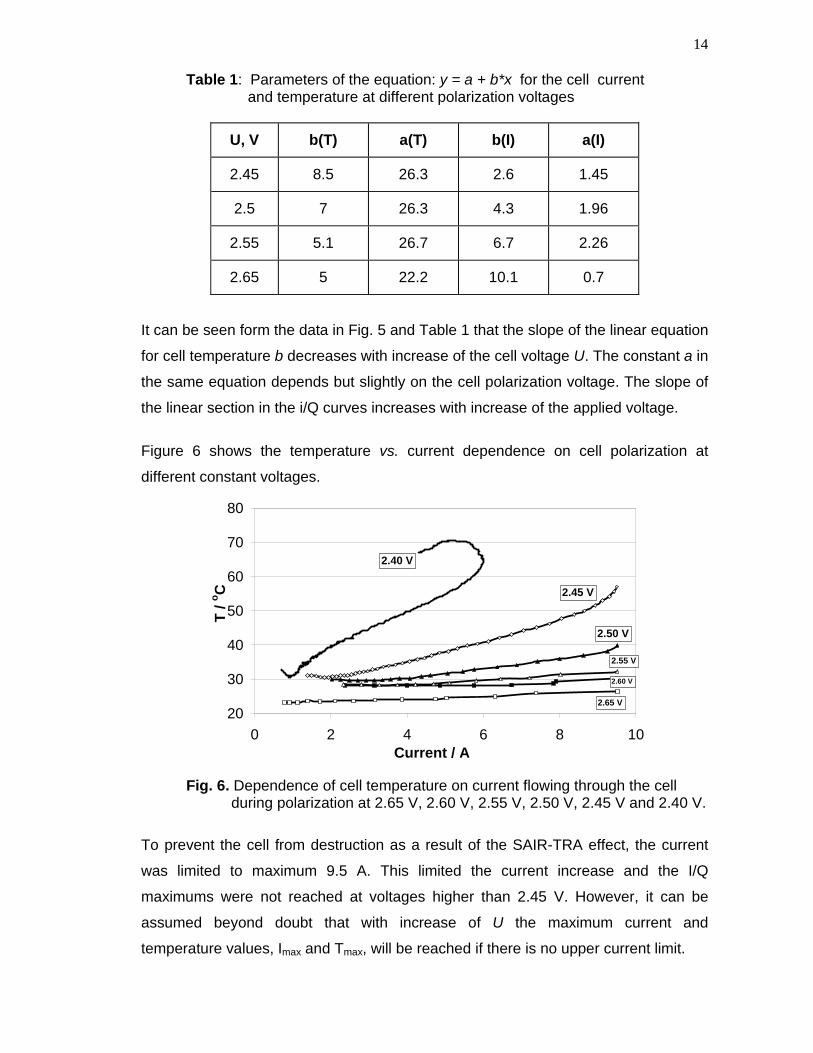
Figure 6 shows the temperature vs. current dependence on cell polarization at
different constant voltages.
20
30
40
50
60
70
80
0 2 4 6 8 10Current / A
T /
oC
2.40 V
2.45 V
2.50 V
2.55 V
2.65 V
2.60 V
Fig. 6. Dependence of cell temperature on current flowing through the cell during polarization at 2.65 V, 2.60 V, 2.55 V, 2.50 V, 2.45 V and 2.40 V.
To prevent the cell from destruction as a result of the SAIR-TRA effect, the current
was limited to maximum 9.5 A. This limited the current increase and the I/Q
maximums were not reached at voltages higher than 2.45 V. However, it can be
assumed beyond doubt that with increase of U the maximum current and
temperature values, Imax and Tmax, will be reached if there is no upper current limit.
15
Within the same range of current values (from 2 to 9.5 A), the cell temperature
increases with decrease in cell voltage. This finding is related to the quantity of
electricity that flows through the cell as well as with changes in the structures of the
interfaces of the two electrodes with the separator. Probably, the latter influence the
rates of the chemical reactions that proceed at the two interfaces.
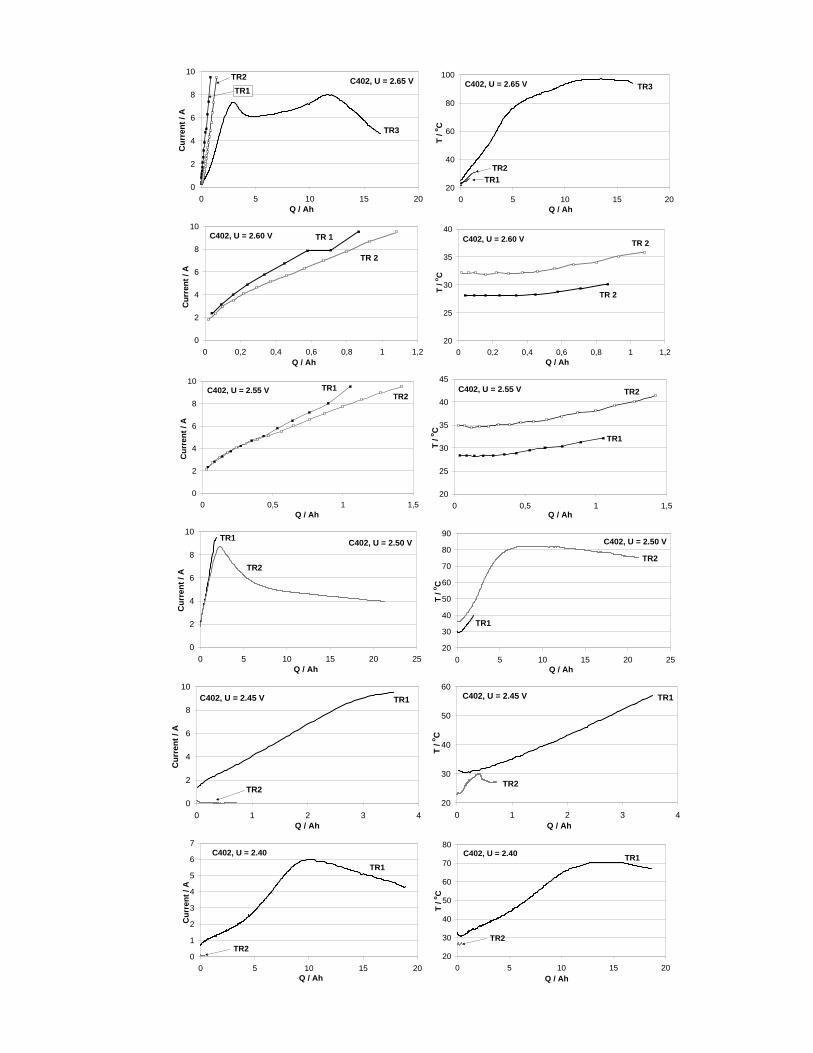
In order to establish the effect of cell polarization voltage and quantity of electricity on
the structure of the active masses and of the separators, we performed two series of
polarization tests varying the polarization voltage between 2.65 V and 2.40 V at 50
mV steps. Between the two series of tests, the cell was subjected to 10 charge-
discharge cycles. Some of the results of the first series of tests were presented in the
previous figures. Figure 7a juxtaposes the cell temperature and current
dependencies on the quantity of electricity for the two series of tests as well as for
the third polarization run at 2.65 V after completion of the second series of tests. The
aim of these tests was to determine the conditions for the appearance of the current
maximum in the SAIR current transients and of the Tmax in the TRA temperature
curves.
During the first series of polarization tests (TR1) with current limited to I < 9.5 A, the
maximum in the i/Q curve appears after 10 Ah of electricity have passed through the
cell (i.e. after 6.5 h of polarization) at 2.40 V and Imax = 6.0 A, Tmax = 70oC. During the
second series of polarization tests (TR2), the maximum in the current curve appears
after 2.5 Ah of electricity have passed through the cell (i.e. 30 min of polarization) at
2.50 V and Imax = 8.8 A, Tmax = 82oC. And finally, a current peak (Imax = 6.6 A)
appears at QI = 2.50 Ah during the third polarization run at 2.65 V and a second peak
(Imax = 8.0 A) appears at QII = 12.5 Ah, Tmax = 96oC. The above results indicate that
the SAIR-TRA phenomenon starts after definite structures of the positive and
negative active masses, of the separator and of the interface active mass/separator
are formed in the cell. An interesting finding is that these structures change for each
of the above series of tests tending to impede the SAIR-TRA phenomena and the
latter occur at higher cell polarization voltages but after introduction of smaller
quantity of electricity into the cell. This finding implies that it is possible to develop a
technology for suppressing the SAIR-TRA phenomena within acceptable limits or
even for eliminating them. Thus, the harmful thermal effects in valve-regulated lead-
acid batteries will be avoided.
C402, U = 2.65 V
0
2
4
6
8
10
0 5 10 15 20Q / Ah
Cu
rren
t /
A
TR3
TR2
TR1
C402, U = 2.65 V
20
40
60
80
100
0 5 10 15 20Q / Ah
T /
oC
TR1
TR2
TR3
C402, U = 2.60 V
0
2
4
6
8
10
0 0,2 0,4 0,6 0,8 1 1,2Q / Ah
Cu
rren
t /
A
TR 2
TR 1
C402, U = 2.60 V
20
25
30
35
40
0 0,2 0,4 0,6 0,8 1 1,2Q / Ah
T /
oC
TR 2
TR 2
C402, U = 2.55 V
0
2
4
6
8
10
0 0,5 1 1,5Q / Ah
Cu
rren
t / A
TR1TR2
C402, U = 2.55 V
20
25
30
35
40
45
0 0,5 1 1,5Q / Ah
T / o
CTR1
TR2
C402, U = 2.50 V
0
2
4
6
8
10
0 5 10 15 20 25Q / Ah
Cu
rren
t /
A
TR1
TR2
C402, U = 2.50 V
20
30
40
50
60
70
80
90
0 5 10 15 20 25Q / Ah
T /
oC
TR1
TR2
C402, U = 2.45 V
0
2
4
6
8
10
0 1 2 3 4Q / Ah
Cu
rren
t /
A
TR1
TR2
C402, U = 2.45 V
20
30
40
50
60
0 1 2 3 4Q / Ah
T /
oC
TR1
TR2
C402, U = 2.40
0
1
2
3
4
5
6
7
0 5 10 15 20Q / Ah
Cu
rren
t /
A
TR1
TR2
C402, U = 2.40
20
30
40
50
60
70
80
0 5 10 15 20Q / Ah
T /
oC
TR1
TR2
C402, U = 2.65 V
0
2
4
6
8
10
0:00 1:00 2:00 3:00 4:00Step Time / hh:mm
Cu
rren
t / A
TR1 Current_A TR2 Current_A TR2 Current_A
TR1 TR2
TR3
C402, U = 2.50 V
0
2
4
6
8
10
0:00 1:00 2:00 3:00 4:00 5:00Step Time / hh:mm
Cu
rren
t /
A
TR1
TR2
C402, U = 2.60 V
0
2
4
6
8
10
0:00 0:02 0:05 0:08 0:11 0:14Step Time
Cu
rre
nt
/ A
C402, U = 2.45 V
0
2
4
6
8
10
0:00 2:00 4:00 6:00 8:00 10:00 12:00 14:00 16:00
Cu
rren
t /
A
TR1
0
0,1
0,2
0,3
0:00 2:00 4:00 6:00 8:00 10:00 12:00 14:00 16:00Step Time / hh:mm
TR2
C402, U = 2.55 V
0
2
4
6
8
10
0:00 0:02 0:05 0:08 0:11 0:14 0:17Step Time / hh:mm
Cu
rren
t /
A
TR1 TR2
C402, U = 2.40 V
0
2
4
6
8
0:00 1:00 2:00 3:00 4:00 5:00 6:00 7:00 8:00 9:00Cu
rren
t /
ATR1
0
0,1
0,2
0:00 1:00 2:00 3:00 4:00 5:00 6:00 7:00 8:00 9:00Step Time / hh:mm
TR2
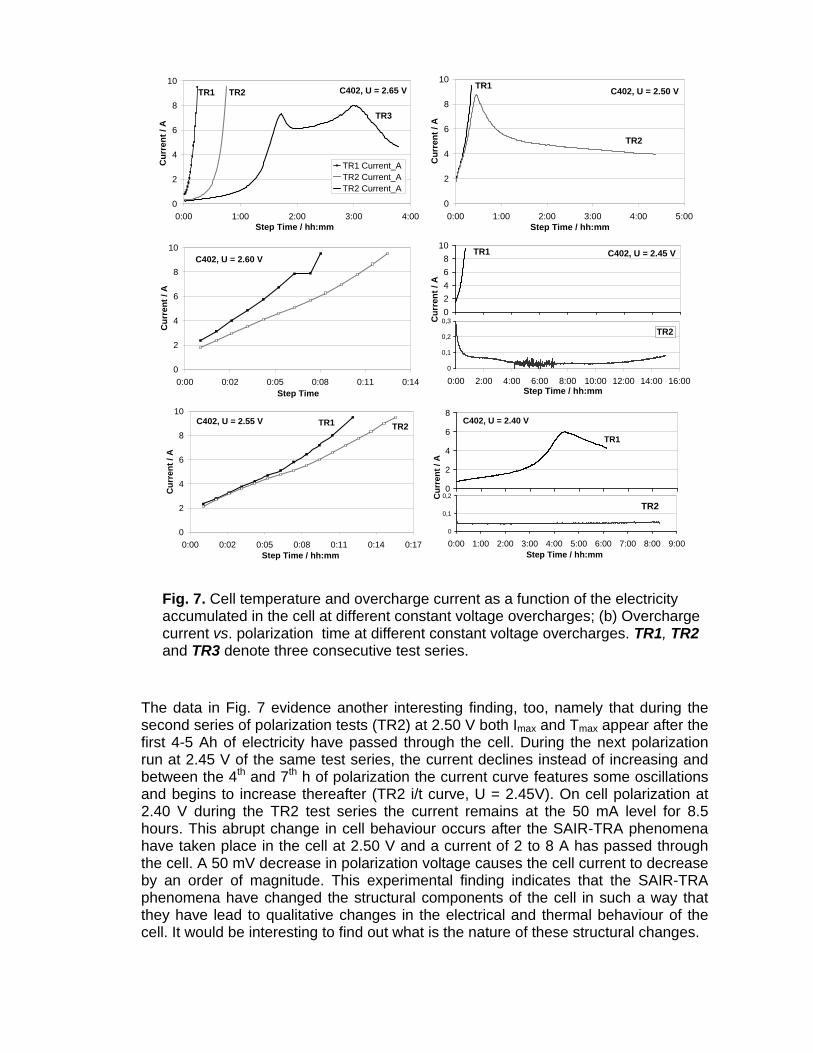
Fig. 7. Cell temperature and overcharge current as a function of the electricity accumulated in the cell at different constant voltage overcharges; (b) Overcharge current vs. polarization time at different constant voltage overcharges. TR1, TR2 and TR3 denote three consecutive test series.
The data in Fig. 7 evidence another interesting finding, too, namely that during the second series of polarization tests (TR2) at 2.50 V both Imax and Tmax appear after the first 4-5 Ah of electricity have passed through the cell. During the next polarization run at 2.45 V of the same test series, the current declines instead of increasing and between the 4th and 7th h of polarization the current curve features some oscillations and begins to increase thereafter (TR2 i/t curve, U = 2.45V). On cell polarization at 2.40 V during the TR2 test series the current remains at the 50 mA level for 8.5 hours. This abrupt change in cell behaviour occurs after the SAIR-TRA phenomena have taken place in the cell at 2.50 V and a current of 2 to 8 A has passed through the cell. A 50 mV decrease in polarization voltage causes the cell current to decrease by an order of magnitude. This experimental finding indicates that the SAIR-TRA phenomena have changed the structural components of the cell in such a way that they have lead to qualitative changes in the electrical and thermal behaviour of the cell. It would be interesting to find out what is the nature of these structural changes.
18
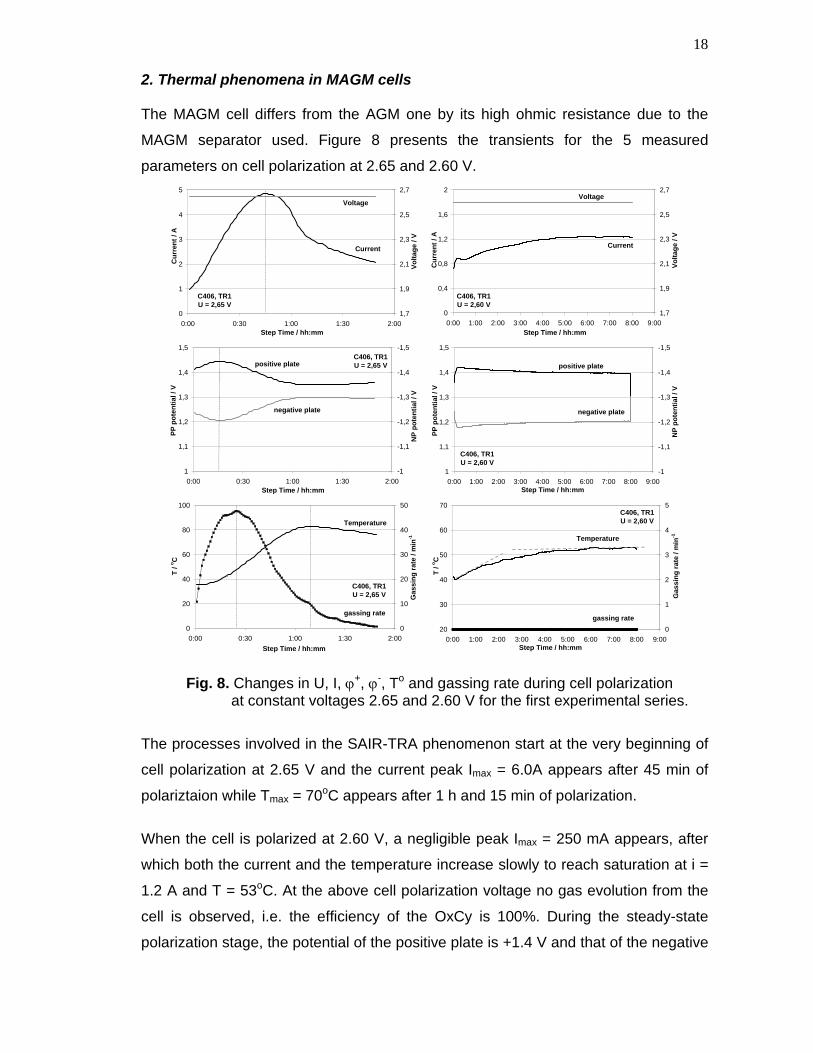
2. Thermal phenomena in MAGM cells The MAGM cell differs from the AGM one by its high ohmic resistance due to the
MAGM separator used. Figure 8 presents the transients for the 5 measured
parameters on cell polarization at 2.65 and 2.60 V.
C406, TR1U = 2,65 V
0
1
2
3
4
5
0:00 0:30 1:00 1:30 2:00Step Time / hh:mm
Cu
rren
t / A
1,7
1,9
2,1
2,3
2,5
2,7
Vo
lta
ge
/ V
Current
Voltage
C406, TR1U = 2,60 V
0
0,4
0,8
1,2
1,6
2
0:00 1:00 2:00 3:00 4:00 5:00 6:00 7:00 8:00 9:00Step Time / hh:mm
Cu
rren
t / A
1,7
1,9
2,1
2,3
2,5
2,7
Vo
ltag
e /
V
Current
Voltage
C406, TR1U = 2,65 V
1
1,1
1,2
1,3
1,4
1,5
0:00 0:30 1:00 1:30 2:00Step Time / hh:mm
PP
po
ten
tial
/ V
-1,5
-1,4
-1,3
-1,2
-1,1
-1
NP
po
ten
tia
l / V
positive plate
negative plate
C406, TR1U = 2,60 V
1
1,1
1,2
1,3
1,4
1,5
0:00 1:00 2:00 3:00 4:00 5:00 6:00 7:00 8:00 9:00Step Time / hh:mm
PP
po
ten
tial
/ V
-1,5
-1,4
-1,3
-1,2
-1,1
-1
NP
po
ten
tia
l / V
positive plate
negative plate
C406, TR1U = 2,65 V
0
20
40
60
80
100
0:00 0:30 1:00 1:30 2:00
Step Time / hh:mm
T /
oC
0
10
20
30
40
50
Gassin
g r
ate
/ m
in-1
Temperature
gassing rate
C406, TR1U = 2,60 V
20
30
40
50
60
70
0:00 1:00 2:00 3:00 4:00 5:00 6:00 7:00 8:00 9:00Step Time / hh:mm
T /
oC
0
1
2
3
4
5
Gassin
g r
ate
/ m
in-1Temperature
gassing rate
Fig. 8. Changes in U, I, +, -, To and gassing rate during cell polarization at constant voltages 2.65 and 2.60 V for the first experimental series.
The processes involved in the SAIR-TRA phenomenon start at the very beginning of
cell polarization at 2.65 V and the current peak Imax = 6.0A appears after 45 min of
polariztaion while Tmax = 70oC appears after 1 h and 15 min of polarization.
When the cell is polarized at 2.60 V, a negligible peak Imax = 250 mA appears, after
which both the current and the temperature increase slowly to reach saturation at i =
1.2 A and T = 53oC. At the above cell polarization voltage no gas evolution from the
cell is observed, i.e. the efficiency of the OxCy is 100%. During the steady-state
polarization stage, the potential of the positive plate is +1.4 V and that of the negative
19
plate is –1.2 V, i.e. high enough to keep the electrodes fully charged. Further cell
polarization within this test series was continued at 2.40 V at 50 mV steps.
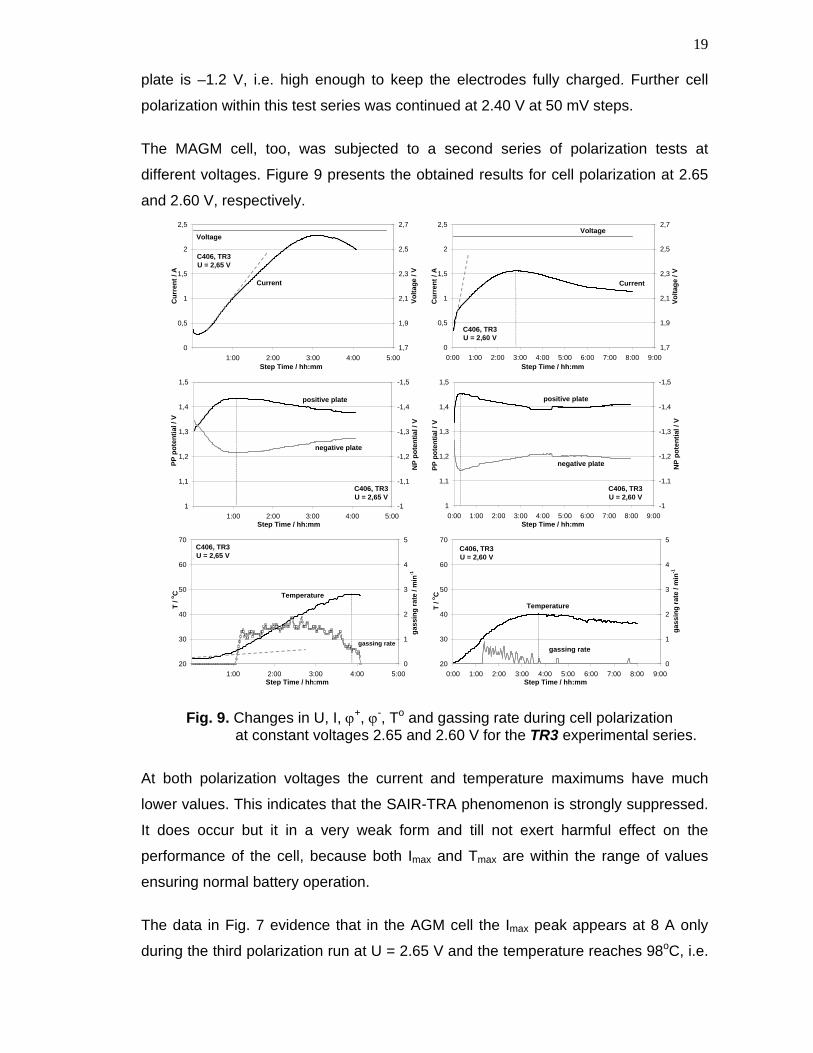
The MAGM cell, too, was subjected to a second series of polarization tests at
different voltages. Figure 9 presents the obtained results for cell polarization at 2.65
and 2.60 V, respectively.
C406, TR3U = 2,65 V
0
0,5
1
1,5
2
2,5
1:00 2:00 3:00 4:00 5:00Step Time / hh:mm
Cu
rren
t / A
1,7
1,9
2,1
2,3
2,5
2,7
Vo
lta
ge
/ V
Current
Voltage
C406, TR3U = 2,60 V
0
0,5
1
1,5
2
2,5
0:00 1:00 2:00 3:00 4:00 5:00 6:00 7:00 8:00 9:00Step Time / hh:mm
Cu
rren
t / A
1,7
1,9
2,1
2,3
2,5
2,7
Vo
ltag
e /
V
Current
Voltage
C406, TR3U = 2,65 V
1
1,1
1,2
1,3
1,4
1,5
1:00 2:00 3:00 4:00 5:00Step Time / hh:mm
PP
po
ten
tial /
V
-1,5
-1,4
-1,3
-1,2
-1,1
-1
NP
po
ten
tial /
V
positive plate
negative plate
C406, TR3U = 2,60 V
1
1,1
1,2
1,3
1,4
1,5
0:00 1:00 2:00 3:00 4:00 5:00 6:00 7:00 8:00 9:00Step Time / hh:mm
PP
po
ten
tial
/ V
-1,5
-1,4
-1,3
-1,2
-1,1
-1
NP
po
ten
tial /
V
positive plate
negative plate
C406, TR3U = 2,65 V
20
30
40
50
60
70
1:00 2:00 3:00 4:00 5:00Step Time / hh:mm
T /
oC
0
1
2
3
4
5
gass
ing
rate
/ m
in-1
Temperature
gassing rate
C406, TR3U = 2,60 V
20
30
40
50
60
70
0:00 1:00 2:00 3:00 4:00 5:00 6:00 7:00 8:00 9:00Step Time / hh:mm
T /
oC
0
1
2
3
4
5
gassin
g r
ate
/ m
in-1
Temperature
gassing rate
Fig. 9. Changes in U, I, +, -, To and gassing rate during cell polarization at constant voltages 2.65 and 2.60 V for the TR3 experimental series.
At both polarization voltages the current and temperature maximums have much
lower values. This indicates that the SAIR-TRA phenomenon is strongly suppressed.
It does occur but it in a very weak form and till not exert harmful effect on the
performance of the cell, because both Imax and Tmax are within the range of values
ensuring normal battery operation.
The data in Fig. 7 evidence that in the AGM cell the Imax peak appears at 8 A only
during the third polarization run at U = 2.65 V and the temperature reaches 98oC, i.e.

20
a value beyond the range of normal battery operation. Both the AGM and the MAGM
cells are assembled with the same types of plates. The only difference between the
two cells is the type of separator used. It can be concluded then, that through
appropriate selection of the separator for VRLA cells the SAIR-TRA phenomenon
can be suppressed to such levels that the cell temperature would not exceed the
zone of normal battery operation.
Figure 10 juxtaposes the dependencies of the current vs. time of polarization and vs.
quantity of electricity flowing through the cell as well as the T/Q dependencies for the
two series of polarization tests. It can be seen from the data in the figure that the Imax
peak has shifted towards higher Q values during the second series of polarization
tests and the peak is lower and flatter. The rapid increase in current (di/dt) results in
higher Imax and Tmax peaks. The i/Q curves at 2.65 V evidence that both (dI/dt) and
Imax depend on the pre-history of the cell. The SAIR-TRA phenomenon changes the
structure in the cell in such a way that both (di/dt) and Imax are lower during the
subsequent polarization run at the same voltage. This inference is illustrated
indirectly by the voltage decrease observed in Fig. 8. Below 2.55 V polarization
voltage, no signs of the SAIR-TRA effect are evident. At the same time the oxygen
cycle current declines abruptly. This implies that the SAIR-TRA phenomenon creates
a memory through the structural changes that occur in the cell.
C406, U = 2.65 V
0
1
2
3
4
5
6
0:00 1:00 2:00 3:00 4:00 5:00 6:00Step Time / hh:mm
Cu
rren
t /
A
TR 2
TR 1
C406, U = 2.55 V0
0,2
0,4
0,6
0,8
1
0:00 2:00 4:00 6:00 8:00 10:00 12:00 14:00 16:00Step Time / hh:mm
Cu
rren
t /
A TR 2
TR 1
C406, U = 2.60 V
0
0,5
1
1,5
2
0:00 2:00 4:00 6:00 8:00Step Time / hh:mm
Cu
rren
t /
A
TR 1
TR 2
C406, U = 2.50 V
0
0,1
0,2
0,3
0,4
0,5
0,6
0,7
0:00 2:00 4:00 6:00 8:00 10:00 12:00 14:00 16:00Step Time / hh:mm
Cu
rren
t /
A TR 2
TR 1
Fig. 10a. Dependence of the overcharge current on time at different constant voltage overcharges: at 2.65 and 2.60 V.

21
C406, U = 2.65 V
0
1
2
3
4
5
0 1 2 3 4 5 6 7Q / Ah
Cu
rren
t /
A
TR 1
TR 2
C406, U = 2.65 V
20
30
40
50
60
70
80
90
0 1 2 3 4 5 6 7Q / Ah
T /
oC
TR 1
TR 2
C406, U = 2.60 V
0
0,5
1
1,5
2
2,5
0 1 2 3 4 5 6 7 8 9 10 11Q / Ah
Cu
rren
t /
A
TR 2
TR 1
C406, U = 2.60 V
20
30
40
50
60
0 1 2 3 4 5 6 7 8 9 10 11Q / Ah
T /
oC
TR 1
TR 2
C406, U = 2.55 V0
0,2
0,4
0,6
0,8
1
0 2 4 6 8 10 12Q / Ah
Cu
rren
t /
A
TR1
TR2
C406, U = 2.55 V
20
25
30
35
40
45
50
0 2 4 6 8 10Q / Ah
T /
oC
TR 2
TR 1
C406, U = 2.50 V
0
0,1
0,2
0,3
0,4
0,5
0,6
0,7
0 2 4 6 8 10Q / Ah
Cu
rren
t /
A TR 2
TR 1
C406, U = 2.50 V
20
25
30
35
40
45
0 2 4 6 8 10Q / Ah
T /
oC
TR 2
TR 1
Fig. 10b. Dependence of cell temperature and overcharge current on the electricity accumulated in the cell at different constant voltage overcharges: at 2.65 and 2.60 V. TR1 and TR3 denote two consecutive experimental series.
22
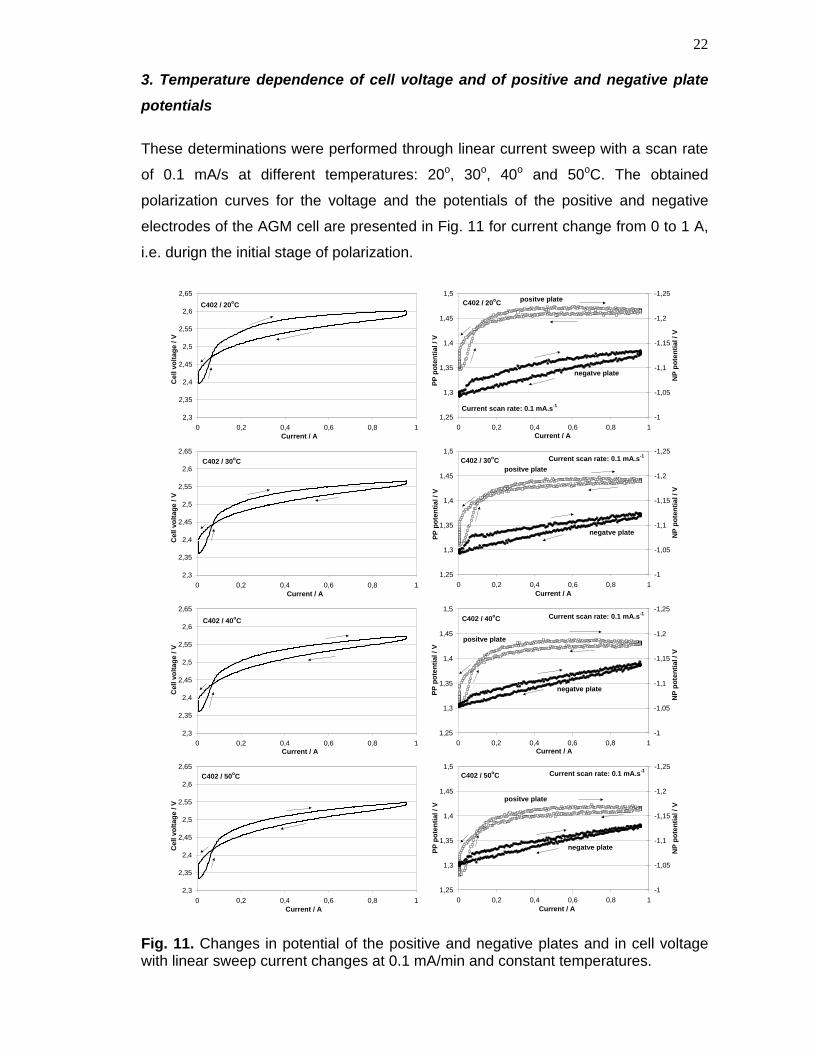
3. Temperature dependence of cell voltage and of positive and negative plate
potentials
These determinations were performed through linear current sweep with a scan rate
of 0.1 mA/s at different temperatures: 20o, 30o, 40o and 50oC. The obtained
polarization curves for the voltage and the potentials of the positive and negative
electrodes of the AGM cell are presented in Fig. 11 for current change from 0 to 1 A,
i.e. durign the initial stage of polarization.
C402 / 20oC
2,3
2,35
2,4
2,45
2,5
2,55
2,6
2,65
0 0,2 0,4 0,6 0,8 1Current / A
Cell
volt
ag
e / V
C402 / 20oC
1,25
1,3
1,35
1,4
1,45
1,5
0 0,2 0,4 0,6 0,8 1Current / A
PP
po
ten
tia
l / V
-1,25
-1,2
-1,15
-1,1
-1,05
-1
NP
po
ten
tia
l / V
Current scan rate: 0.1 mA.s-1
positve plate
negatve plate
C402 / 30oC
2,3
2,35
2,4
2,45
2,5
2,55
2,6
2,65
0 0,2 0,4 0,6 0,8 1Current / A
Cell
volt
ag
e /
V
C402 / 30oC
1,25
1,3
1,35
1,4
1,45
1,5
0 0,2 0,4 0,6 0,8 1Current / A
PP
po
ten
tial
/ V
-1,25
-1,2
-1,15
-1,1
-1,05
-1
NP
po
ten
tia
l / V
Current scan rate: 0.1 mA.s-1
positve plate
negatve plate
C402 / 40oC
2,3
2,35
2,4
2,45
2,5
2,55
2,6
2,65
0 0,2 0,4 0,6 0,8 1Current / A
Cell
volt
ag
e / V
C402 / 40oC
1,25
1,3
1,35
1,4
1,45
1,5
0 0,2 0,4 0,6 0,8 1Current / A
PP
po
ten
tia
l / V
-1,25
-1,2
-1,15
-1,1
-1,05
-1
NP
po
ten
tia
l / V
Current scan rate: 0.1 mA.s-1
positve plate
negatve plate
C402 / 50oC
2,3
2,35
2,4
2,45
2,5
2,55
2,6
2,65
0 0,2 0,4 0,6 0,8 1Current / A
Cell
volt
ag
e /
V
C402 / 50oC
1,25
1,3
1,35
1,4
1,45
1,5
0 0,2 0,4 0,6 0,8 1Current / A
PP
po
ten
tial
/ V
-1,25
-1,2
-1,15
-1,1
-1,05
-1
NP
po
ten
tia
l / V
Current scan rate: 0.1 mA.s-1
positve plate
negatve plate
Fig. 11. Changes in potential of the positive and negative plates and in cell voltage with linear sweep current changes at 0.1 mA/min and constant temperatures.
23
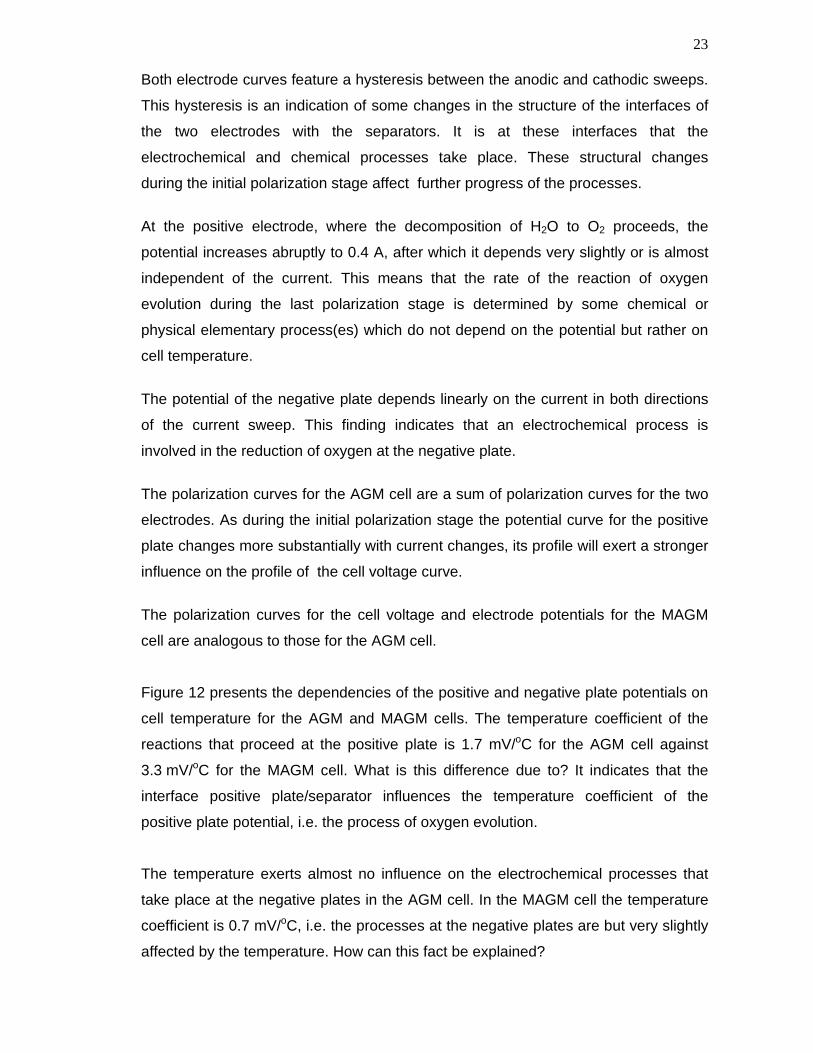
Both electrode curves feature a hysteresis between the anodic and cathodic sweeps.
This hysteresis is an indication of some changes in the structure of the interfaces of
the two electrodes with the separators. It is at these interfaces that the
electrochemical and chemical processes take place. These structural changes
during the initial polarization stage affect further progress of the processes.
At the positive electrode, where the decomposition of H2O to O2 proceeds, the
potential increases abruptly to 0.4 A, after which it depends very slightly or is almost
independent of the current. This means that the rate of the reaction of oxygen
evolution during the last polarization stage is determined by some chemical or
physical elementary process(es) which do not depend on the potential but rather on
cell temperature.
The potential of the negative plate depends linearly on the current in both directions
of the current sweep. This finding indicates that an electrochemical process is
involved in the reduction of oxygen at the negative plate.
The polarization curves for the AGM cell are a sum of polarization curves for the two
electrodes. As during the initial polarization stage the potential curve for the positive
plate changes more substantially with current changes, its profile will exert a stronger
influence on the profile of the cell voltage curve.
The polarization curves for the cell voltage and electrode potentials for the MAGM
cell are analogous to those for the AGM cell.
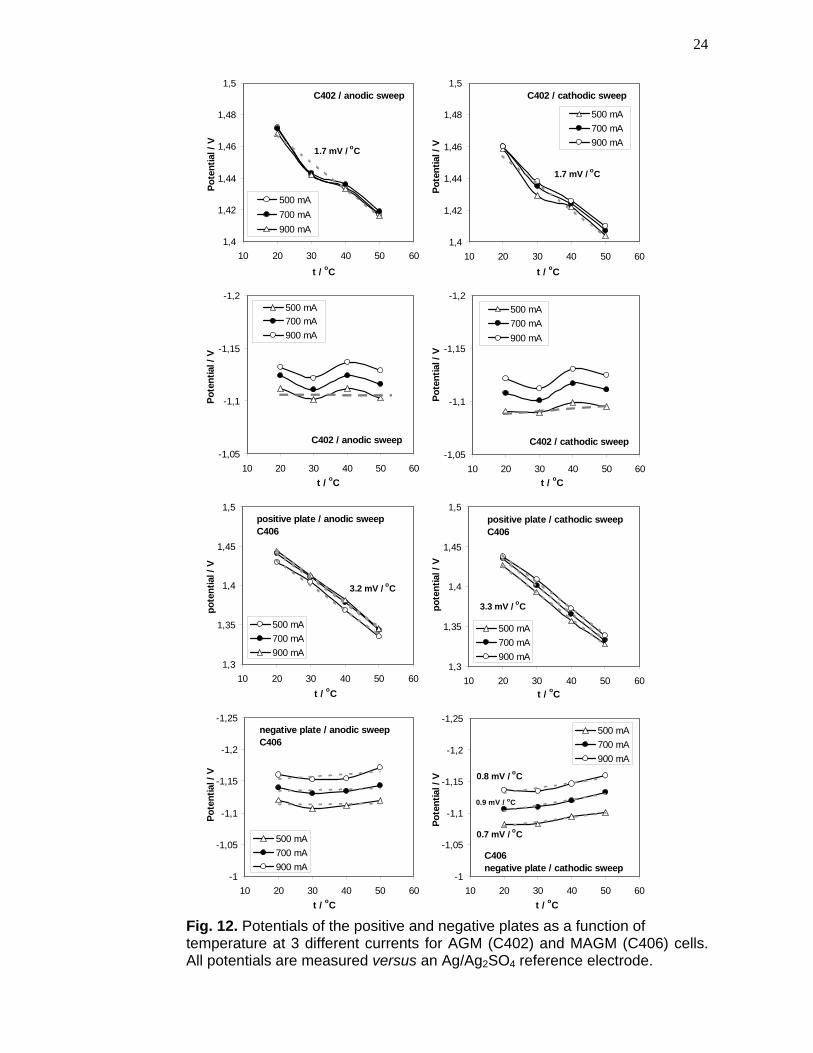
Figure 12 presents the dependencies of the positive and negative plate potentials on
cell temperature for the AGM and MAGM cells. The temperature coefficient of the
reactions that proceed at the positive plate is 1.7 mV/oC for the AGM cell against
3.3 mV/oC for the MAGM cell. What is this difference due to? It indicates that the
interface positive plate/separator influences the temperature coefficient of the
positive plate potential, i.e. the process of oxygen evolution.
The temperature exerts almost no influence on the electrochemical processes that
take place at the negative plates in the AGM cell. In the MAGM cell the temperature
coefficient is 0.7 mV/oC, i.e. the processes at the negative plates are but very slightly
affected by the temperature. How can this fact be explained?
24
C402 / anodic sweep
1,4
1,42
1,44
1,46
1,48
1,5
10 20 30 40 50 60
t / oC
Po
ten
tial
/ V
500 mA
700 mA
900 mA
1.7 mV / oC
C402 / cathodic sweep
1,4
1,42
1,44
1,46
1,48
1,5
10 20 30 40 50 60
t / oC
Po
ten
tial
/ V
500 mA
700 mA
900 mA
1.7 mV / oC
C402 / anodic sweep
-1,2
-1,15
-1,1
-1,05
10 20 30 40 50 60
t / oC
Po
ten
tial
/ V
500 mA
700 mA
900 mA
C402 / cathodic sweep
-1,2
-1,15
-1,1
-1,05
10 20 30 40 50 60
t / oC
Po
ten
tial
/ V
500 mA
700 mA
900 mA
positive plate / anodic sweepC406
1,3
1,35
1,4
1,45
1,5
10 20 30 40 50 60
t / oC
po
ten
tial
/ V
500 mA
700 mA
900 mA
3.2 mV / oC
positive plate / cathodic sweepC406
1,3
1,35
1,4
1,45
1,5
10 20 30 40 50 60
t / oC
po
ten
tial
/ V
500 mA
700 mA
900 mA
3.3 mV / oC
negative plate / anodic sweepC406
-1,25
-1,2
-1,15
-1,1
-1,05
-1
10 20 30 40 50 60
t / oC
Po
ten
tial
/ V
500 mA
700 mA
900 mAC406negative plate / cathodic sweep
-1,25
-1,2
-1,15
-1,1
-1,05
-1
10 20 30 40 50 60
t / oC
Po
ten
tial
/ V
500 mA
700 mA
900 mA
0.7 mV / oC
0.9 mV / oC
0.8 mV / oC
Fig. 12. Potentials of the positive and negative plates as a function of temperature at 3 different currents for AGM (C402) and MAGM (C406) cells. All potentials are measured versus an Ag/Ag2SO4 reference electrode.
25
The rate limiting stages in the reaction of oxygen reduction at the negative plate are
the diffusion of O2 through the thin liquid film (TLF) covering the lead surface and the
electron transfer [5]. On temperature rise, the amount of O2 dissolved in the TLF
decreases, i.e. the reagent’s concentration decreases. On the other hand, the rate of
oxygen diffusion through the TLF increases at elevated temperatures. Thus, the two
temperature effects compensate each other and hence the potential of the negative
plates will be independent of (AGM cell) or will depend but slightly (MAGM cell) on
the temperature in the cell.
Figure 12 evidences that at constant cell temperature the current flowing through the
negative plate, i.e. the rates of the reactions of oxygen reduction and of hydrogen
evolution, depend on the plate potential. In order to increase the current, the potential
of the negative plate should be increased. This means that the rates of the above
processes at the negative plate depend on some electrochemical elementary
process(es).
Generally said, the data in Fig. 12 indicate that the nature and structure of the
separator used in VRLA cells exert an influence on the processes that take place at
the interfaces of the two types of plates with the separators, the separator influence
being very strong on the processes at the interface positive plate/separator. The
influence of the separator on the processes at the negative plate is weaker.
4. Analyses of the active materials after the polarization tests
4.1. Active block
AGM cell. The concentration of H2SO4 in the AGM separator pores is 1.33 g/cm3.
Severe electrolyte deficiency is observed throughout the whole separator volume.
The positive and negative plates are in good condition.
MAGM cell. The H2SO4 concentration in the MAGM separator pores is 1.30 g/cm3.
The positive active mass is a bit soft. The active mass in the upper part of the
negative plate is lighter in colour than the lower part of the plate.
4.2. Phase composition of the active masses
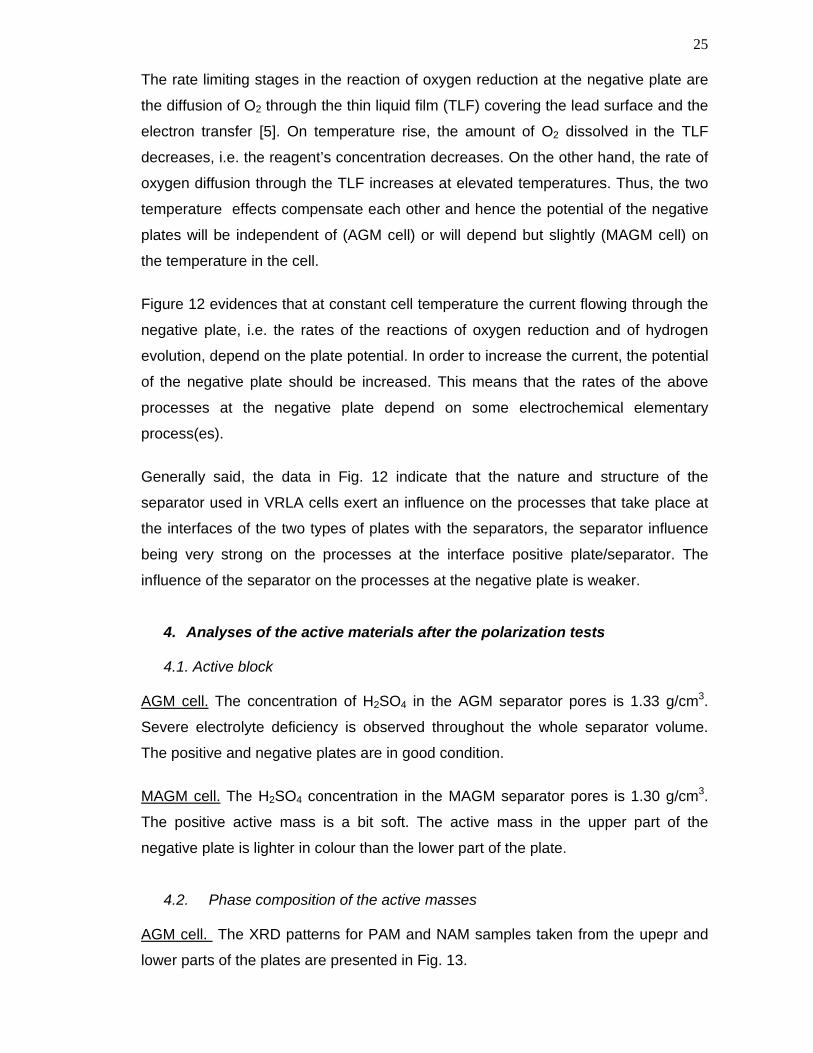
AGM cell. The XRD patterns for PAM and NAM samples taken from the upepr and
lower parts of the plates are presented in Fig. 13.
26
Fig. 13. XRD patterns for PAM samples from the upper and lower parts
of the positive and negative plates of the AGM cell.
The positive active mass is composed of PbO2 with negligible amounts of PbSO4
and PbO2, too. The content of PbSO4 and of PbO2 in the lower part of the cell is
higher than in the upper part. As has been established in an earlier study of ours [6]
at H2SO4 concentrations above 1.28 g/cm3, considerable amounts of PbO2 and
PbSO4 crystals form, and the acid concentration in the separator of the investigated
cell is 1.33 g/cm3.
The negative active mass comprises Pb and about 33% of PbSO4 in the upper part
of the plate, whereas in the lower part the content of PbSO4 is about 26% and 3BS
(ca. 13%) and PbO2 (ca. 77%) are also detected.
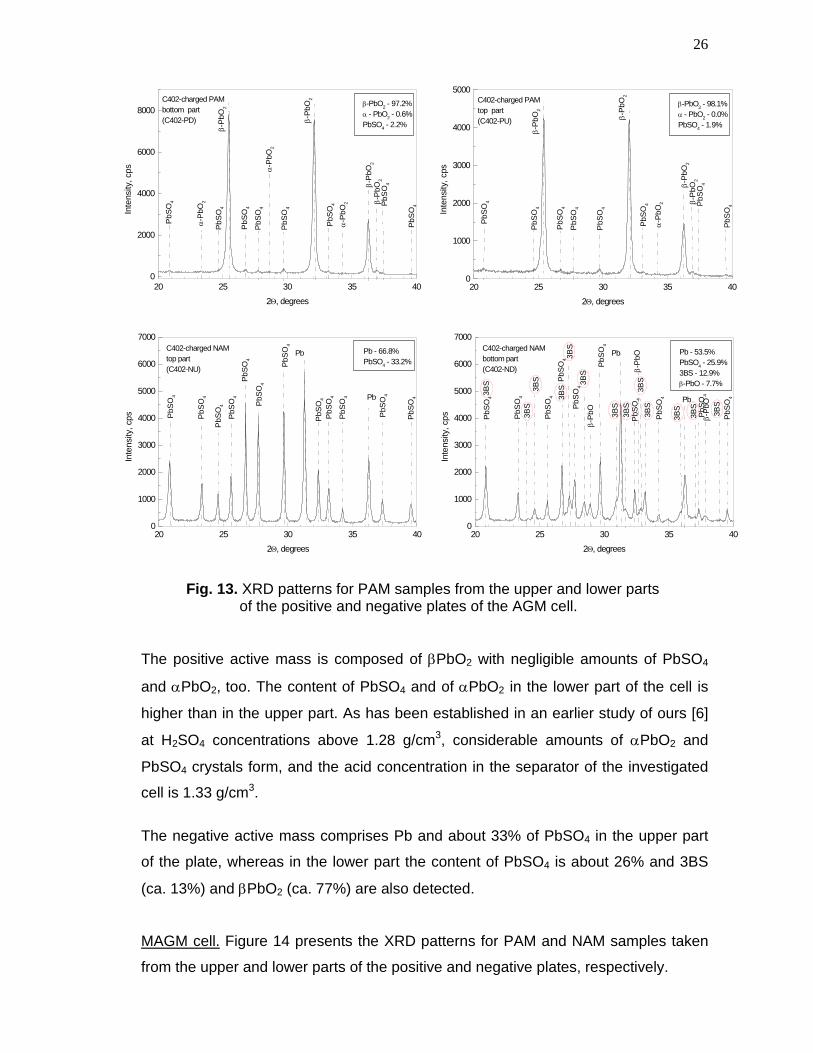
MAGM cell. Figure 14 presents the XRD patterns for PAM and NAM samples taken
from the upper and lower parts of the positive and negative plates, respectively.
20 25 30 35 400
1000
2000
3000
4000
5000
PbS
O4
-PbO2 - 98.1%
- PbO2 - 0.0%
PbSO4 - 1.9%
C402-charged PAMtop part(C402-PU)
PbS
O4
PbS
O4
PbS
O4
PbS
O4
PbS
O4
PbS
O4
PbS
O4 -
PbO
2
-P
bO2
-P
bO2
-P
bO2
-P
bO2
Inte
nsity
, cps
2, degrees
20 25 30 35 400
2000
4000
6000
8000
PbS
O4
-PbO2 - 97.2% - PbO2 - 0.6%PbSO4 - 2.2%
C402-charged PAMbottom part(C402-PD)
PbS
O4
PbS
O4
PbS
O4
PbS
O4
PbS
O4
PbS
O4
PbS
O4
-P
bO2
-P
bO2
-P
bO2
-P
bO2
-P
bO2
-P
bO2
-P
bO2
Inte
nsity
, cps
2, degrees
20 25 30 35 400
1000
2000
3000
4000
5000
6000
7000
PbS
O4
PbS
O4
Pb - 66.8%PbSO
4 - 33.2%
C402-charged NAMtop part(C402-NU)
PbS
O4
PbS
O4
PbS
O4
PbS
O4
Pb
PbS
O4
PbS
O4
PbS
O4
PbS
O4
PbS
O4 Pb
PbS
O4
Inte
nsity
, cps
2, degrees
20 25 30 35 400
1000
2000
3000
4000
5000
6000
7000
3BS
-P
bO
-P
bO
-P
bO 3BS
Pb - 53.5%PbSO
4 - 25.9%
3BS - 12.9%-PbO - 7.7%
C402-charged NAMbottom part(C402-ND)
PbS
O4
PbS
O4
PbS
O4
3BS
3BS
3BS
3BS
3BS
PbS
O4
3BS
3BS
3BS
3BS3B
S
Pb
PbS
O4
PbS
O4
PbS
O4
PbS
O4
PbS
O4 Pb
PbS
O4
Inte
nsity
, cps
2, degrees
3BS
27
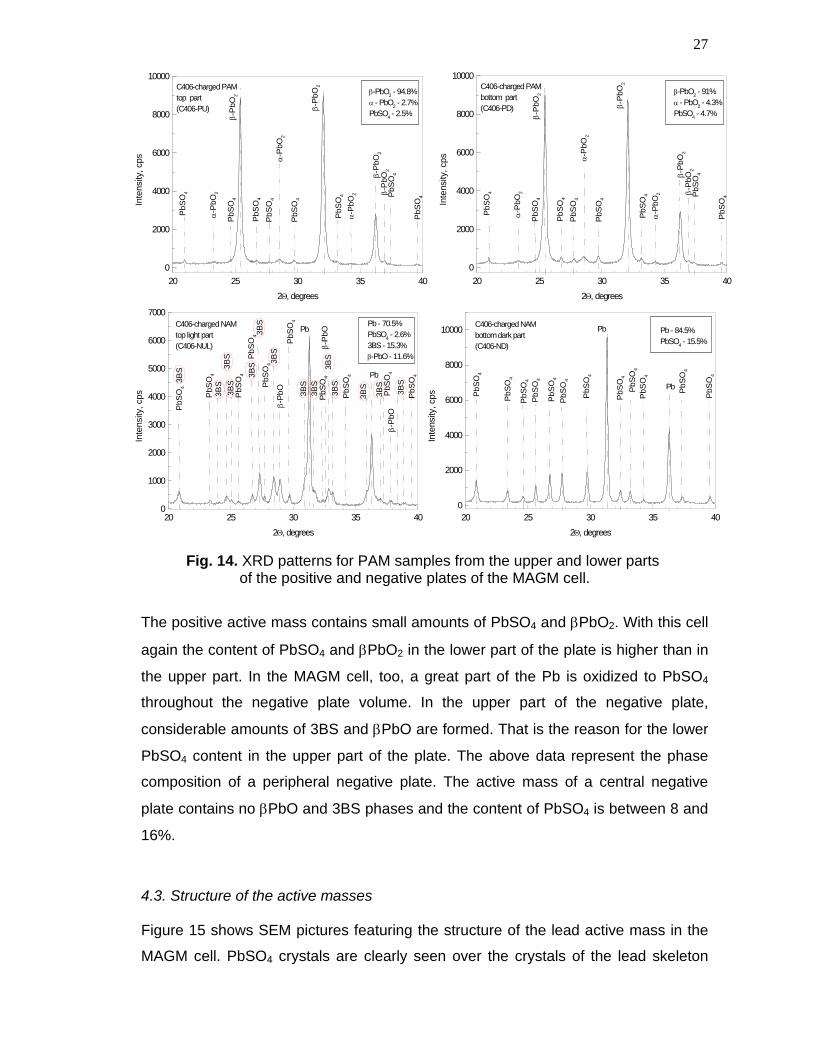
Fig. 14. XRD patterns for PAM samples from the upper and lower parts of the positive and negative plates of the MAGM cell.
The positive active mass contains small amounts of PbSO4 and PbO2. With this cell
again the content of PbSO4 and PbO2 in the lower part of the plate is higher than in
the upper part. In the MAGM cell, too, a great part of the Pb is oxidized to PbSO4
throughout the negative plate volume. In the upper part of the negative plate,
considerable amounts of 3BS and PbO are formed. That is the reason for the lower
PbSO4 content in the upper part of the plate. The above data represent the phase
composition of a peripheral negative plate. The active mass of a central negative
plate contains no PbO and 3BS phases and the content of PbSO4 is between 8 and
16%.
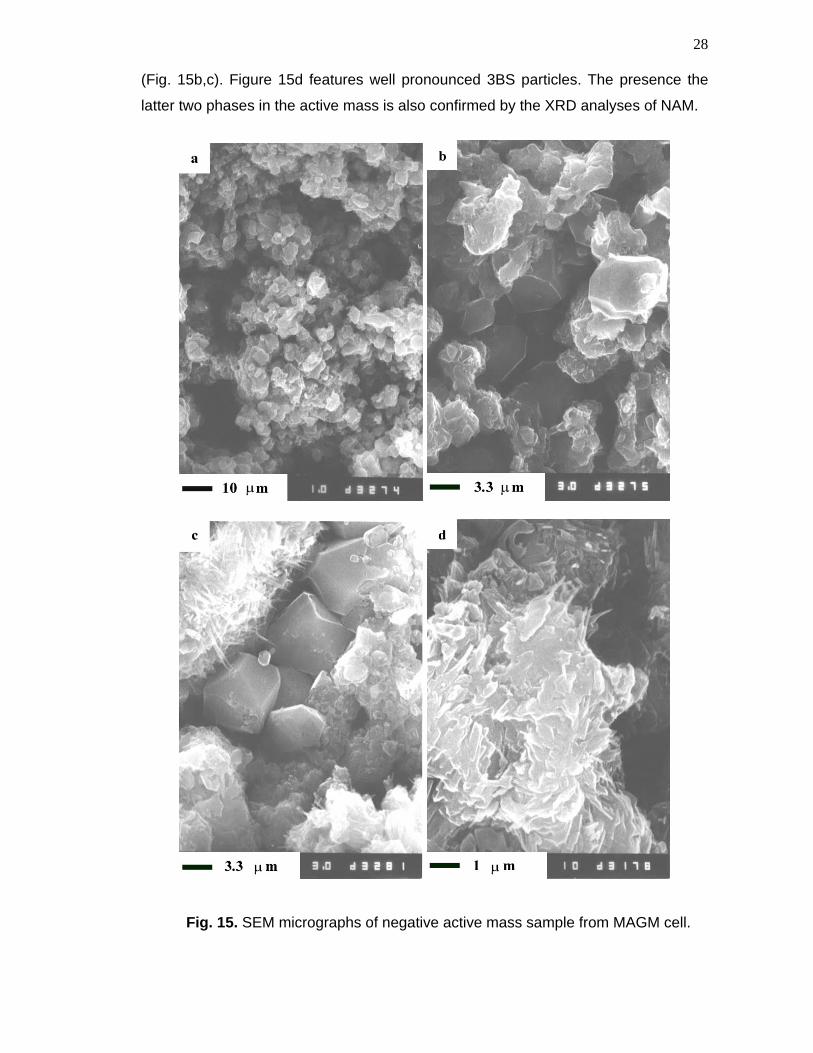
4.3. Structure of the active masses Figure 15 shows SEM pictures featuring the structure of the lead active mass in the
MAGM cell. PbSO4 crystals are clearly seen over the crystals of the lead skeleton
20 25 30 35 40
0
2000
4000
6000
8000
10000
PbS
O4
-PbO2 - 94.8%
- PbO2 - 2.7%PbSO
4 - 2.5%
C406-charged PAMtop part(C406-PU)
PbS
O4
PbS
O4
PbS
O4
PbS
O4
PbS
O4
PbS
O4
PbS
O4
-P
bO2
-P
bO2
-P
bO2
-P
bO2
-P
bO2
-P
bO2
-P
bO2
Inte
nsity
, cps
2, degrees
20 25 30 35 40
0
2000
4000
6000
8000
10000
PbS
O4
-PbO2 - 91%
- PbO2 - 4.3%
PbSO4 - 4.7%
C406-charged PAMbottom part(C406-PD)
PbS
O4
PbS
O4
PbS
O4
PbS
O4
PbS
O4
PbS
O4
PbS
O4
-P
bO2
-P
bO2
-P
bO2
-P
bO
2
-P
bO2
-P
bO2
-P
bO2
Inte
nsity
, cps
2, degrees
20 25 30 35 400
1000
2000
3000
4000
5000
6000
7000
3BS
-P
bO
-P
bO
-P
bO
3BS
Pb - 70.5%PbSO
4 - 2.6%
3BS - 15.3%-PbO - 11.6%
C406-charged NAMtop light part(C406-NUL)
PbS
O4
PbS
O4
PbS
O4
3BS
3BS
3BS
3BS
3BS
PbS
O4
3BS
3BS
3BS
3B
S
3BS
3BS
Pb
PbS
O4
PbS
O4
PbS
O4
PbS
O4
Pb
SO
4 Pb
PbS
O4
Inte
nsity
, cps
2, degrees
3BS
20 25 30 35 400
2000
4000
6000
8000
10000 Pb - 84.5%PbSO
4 - 15.5%
PbS
O4
PbS
O4
PbS
O4
Pb
SO
4
PbS
O4
Pb
SO
4
Pb
PbS
O4
Pb
SO
4
Pb
SO
4
PbS
O4
PbS
O4
Pb
PbS
O4
C406-charged NAMbottom dark part(C406-ND)
Inte
nsity
, cps
2, degrees
28
(Fig. 15b,c). Figure 15d features well pronounced 3BS particles. The presence the
latter two phases in the active mass is also confirmed by the XRD analyses of NAM.
Fig. 15. SEM micrographs of negative active mass sample from MAGM cell.
29
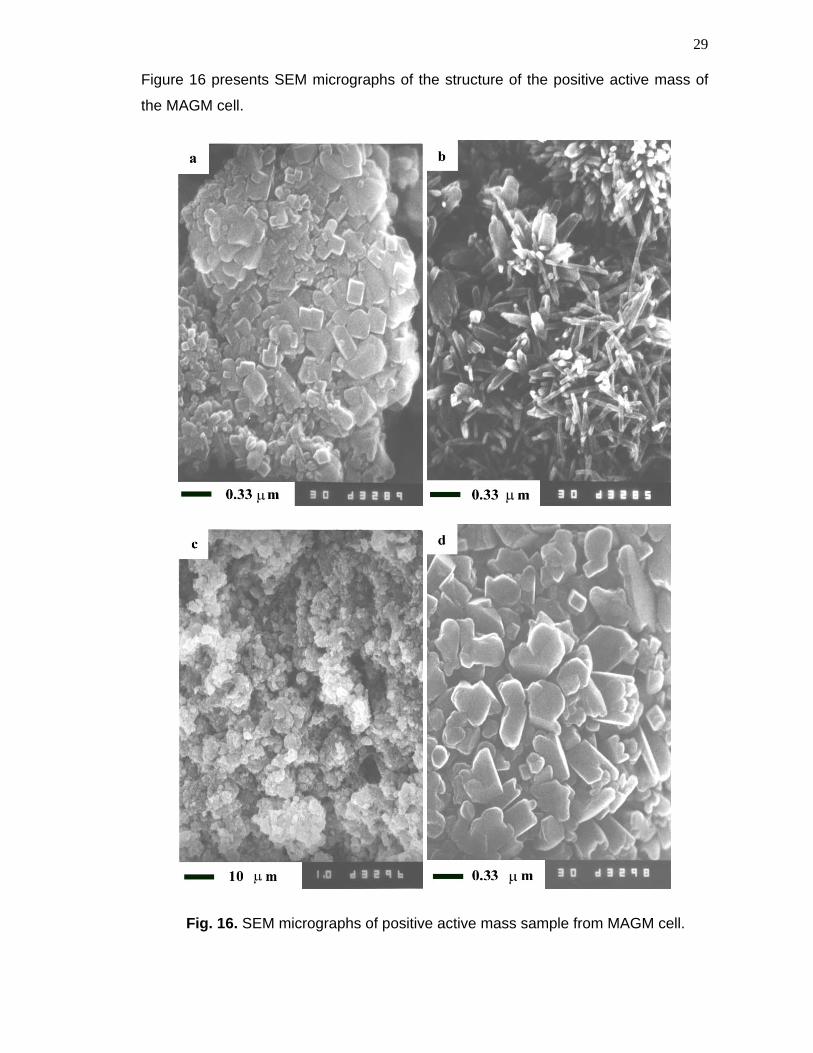
Figure 16 presents SEM micrographs of the structure of the positive active mass of
the MAGM cell.
Fig. 16. SEM micrographs of positive active mass sample from MAGM cell.
30
The PbO2 particles have crystal (Fig. 16a,d), dendrite (Fig. 16c) or oval (Fig. 16d)
shapes. As a rule, crystal PbO2 particles are formed in H2SO4 solutions with
densities higher than 1.29 g/cm3 [6]. Particles with oval shapes are formed when
considerable part of their volume is hydrated. In the latter case the hydrated (gel)
zones are responsible for the oval shape of the particles. The positive and negative
active masses in the AGM cell have similar structure and crystal morphology as
those in the MAGM cell.
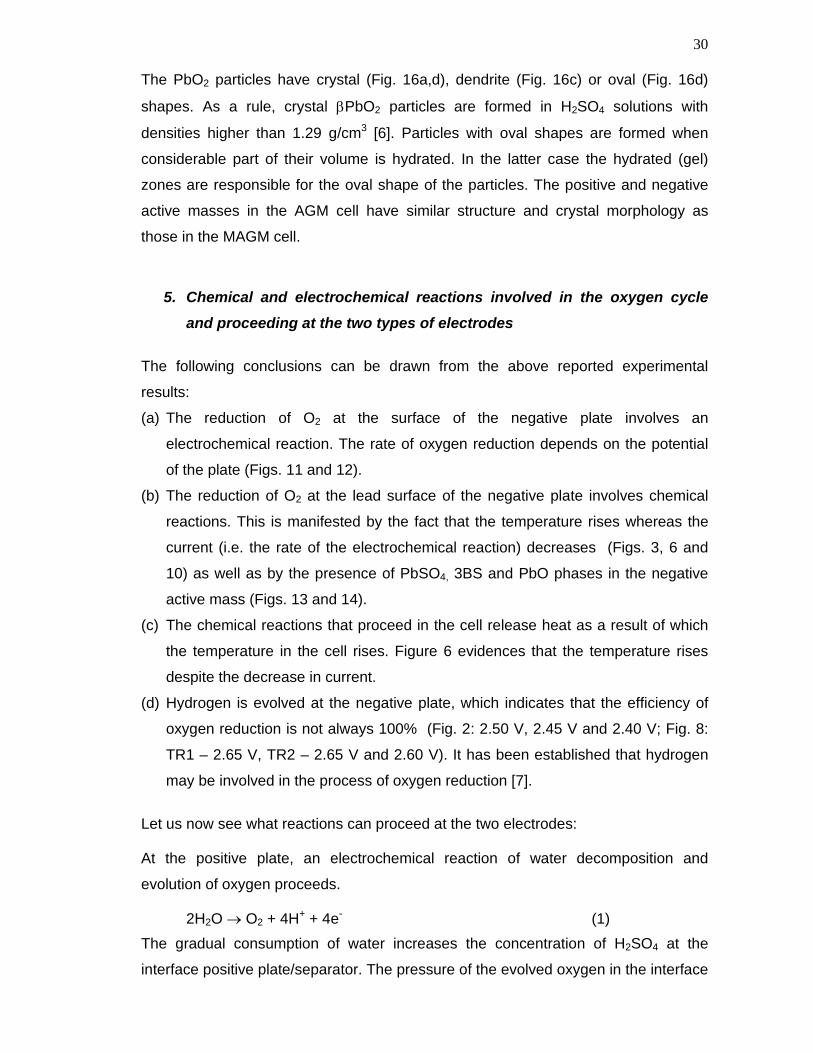
5. Chemical and electrochemical reactions involved in the oxygen cycle
and proceeding at the two types of electrodes
The following conclusions can be drawn from the above reported experimental
results:
(a) The reduction of O2 at the surface of the negative plate involves an
electrochemical reaction. The rate of oxygen reduction depends on the potential
of the plate (Figs. 11 and 12).
(b) The reduction of O2 at the lead surface of the negative plate involves chemical
reactions. This is manifested by the fact that the temperature rises whereas the
current (i.e. the rate of the electrochemical reaction) decreases (Figs. 3, 6 and
10) as well as by the presence of PbSO4, 3BS and PbO phases in the negative
active mass (Figs. 13 and 14).
(c) The chemical reactions that proceed in the cell release heat as a result of which
the temperature in the cell rises. Figure 6 evidences that the temperature rises
despite the decrease in current.
(d) Hydrogen is evolved at the negative plate, which indicates that the efficiency of
oxygen reduction is not always 100% (Fig. 2: 2.50 V, 2.45 V and 2.40 V; Fig. 8:
TR1 – 2.65 V, TR2 – 2.65 V and 2.60 V). It has been established that hydrogen
may be involved in the process of oxygen reduction [7].
Let us now see what reactions can proceed at the two electrodes: At the positive plate, an electrochemical reaction of water decomposition and
evolution of oxygen proceeds.
2H2O O2 + 4H+ + 4e- (1)
The gradual consumption of water increases the concentration of H2SO4 at the
interface positive plate/separator. The pressure of the evolved oxygen in the interface
31
layer increases and an oxygen flow moves through the separator to the negative
plate. Another oxygen flow leaves the active block thus increasing the gas pressure
above this block. When this pressure exceeds a definite value, the cell vent opens
and the gas leaves the cell.
At the negative plate, oxygen may be reduced through several mechanisms, which
are discussed below. All these mechanisms result in the formation of water.
Consequently, the H2SO4 concentration in the lead active mass pores decreases.
5.1. Electrochemical mechanism of oxygen reduction with no involvement of
the lead surface
According to this mechanism the following reaction proceeds:
O2 + 2H+ + 2e- H2O2 (2)
This reaction is known to be a fast one and to proceed when oxygen is reduced on
Hg substrate [8], Ag-Au [9,10], Ag-Cu-Hg [11], Au [12], Pt and platinated Pt [13], Hg
[14] and Ni [15]. There is no reason to assume that Pb will be an exception. The
formation of H2O2 on oxygen reduction has been established through the reduction of
O2 enriched with 18O isotope [16]. The same percent contents of 18O-18O and 18O-16O
have been found in H2O2 as in the initial (primary) oxygen. Hence, the conclusion has
been drawn that the O-O bond in the oxygen molecule does not break during
reduction of O2 to H2O2.
H2O2 is in a strongly reducing medium in lead surface/TLF layer. So it may be further
reduced by the following mechanisms:
(a) electrochemical mechanism
H2O2 + 2H+ +2e- 2H2O2 (3)
This is a slow reaction and proceeds at considerable overvoltages. This reaction has
been investigated for Hg [8,17,18], Pt [113,19] and gold [12] substrates. It has been
established that the reduction involves non-dissociated H2O2 molecules.
However, beside through reaction (3), H2O2 may be reduced also through the
following chemical reactions and at a high rate at that. All these reactions release
32
heat which accelerates further the rates of the chemical reactions. The following
substances serve as reducers:
(b) reduction with hydrogen participation [5] – parallel to reaction (2) a reaction of
hydrogen evolution proceeds at the lead surface:
2H+ + 2e- 2H (4)
Part of the evolved hydrogen () forms molecules and leaves the cell together with an
equivalent amount of oxygen that has not reacted by reaction (2). The rate of this gas
flow is measured with the help of a flowmeter.
2H H2 (5)
Another part of the evolved hydrogen (1-) reacts with H2O2 through the following
chemical reaction:
2(1-) H + (1-) H2O2 2(1-) H2O (6)
Hydrogen atoms are a strong reducer and H2O2 is a strong oxidizer. Both products
are formed simultaneously at the lead surface and react with each other as a result of
which heat is released. The ratio between the rates of reactions (5) and (6) determine
the efficiency of the oxygen cycle. If the rate of reaction (6) is much higher than that
of reaction (5), the efficiency of the oxygen cycle is high and vice versa.
(c) reaction between H2O2 and Pb
H2O2 oxidizes the lead surface throught he following chemical reaction:
H2O2 + Pb PbO + H2O (7)
Heat is released by this reaction. PbO may be reduced to Pb through the
electrochemical reaction
PbO + 2H+ + 2e- Pb + H2O (8)
whereby water is formed and the lead surface is rebuilt. In the above case the Pb
surface plays a catalytic role by accelerating the reduction of H2O2.
However, PbO may also react with H2SO4 forming PbSO4 and releasing heat.
PbO + H2SO4 PbSO4 + H2O (9)
PbSO4 is reduced to Pb through the electrochemical reaction of charge:
33
PbSO4 + 2H+ + 2e- Pb + H2SO4 (10)
Reactions (8) and (9) are in competition. Reaction (10) may proceed at a low rate
and though the plate is discharged, certain amounts of PbSO4, PbO and basic lead
sulfates may form in the negative active mass as a result of reactions (7) and (9).
These are indeed detected by the XRD analyses (Figs. 13 and 14).
5.2. Chemical mechanism of oxygen reduction through oxidation of the lead
surface
The oxygen oxidizes the lead surface, whereby heat is released:
O2 + 2Pb 2PbO (11)
Then PbO may be reduced through the electrochemical reaction (8) or be sulphated
(reaction (9)) and the obtained PbSO4 may then be reduced through reaction (10).
Figures 11 and 12 evidence that the reduction of O2 at the negative plate proceeds
through an electrochemical reaction (e.g. reaction 2). Then the obtained H2O2 is
involved in various chemical and electrochemical reactions. So if reaction (11) does
proceed, it has but a very small share in the overall process of oxygen reduction.
All chemical reactions involved in the above described mechanisms are associated
with heat release. Depending on the conditions at the interface plate/separator, the
various reactions will compete with each other. Thus for example reactions (2) and
(11), reactions (8) and (9), etc. As a result of this competition, different amounts of
heat will be released and hence the SAIR-TRA effect will manifest itself to different
extents and the OxCy will have different efficiency. The occurrence of reactions in
which Pb is involved is also demonstrated by the considerable amounts of PbSO4,
3BS and PbO phases detected in the negative active mass. The retarded reduction
of the above compounds leads to discharge of the negative plate. On the other hand,
the reduced efficiency of the oxygen cycle results in water loss and in partial
discharge of the negative plate. This is often observed with stationary batteries.
On the other hand, the creation of conditions facilitating the chemical reactions leads
to the SAIR-TRA effect. The flow of strong current through the cell, when the SAIR
process take place, generates more Joule heat, which added to the heat effects of
the above reactions, contributes further to the generation of heat in the cell.
34
CONCLUSIONS
1. Appropriate equipment has been designed and constructed for monitoring 6
parameters of the lead-acid cell during operation of the oxygen cycle.
2. It has been established that thermal problems occur in the battery on constant
voltage overcharge above a definite voltage. Under the above conditions, after a
certain quantity of electricity has passed through the cell, the processes at the
positive and at the negative plates get into a self-accelerating interrelation. As a
result of this interrelation the current increases reaching a maximum value imax
within a certain period of time. Parallel to the increase in current, the cell
temperature rises, too, until a maximum value Tmax. The imax and Tmax peaks
appear after different quantities of electricity flow through the cell and they
represent “the two sides of a coin”, i.e. the two sides of one and the same
phenomenon: SAIR (self-accelerating interrelation between the reactions of the
OxCy) reflects the current increase and TRA (thermal runwaway) – the
temperature rise. So we could designate the overall phenomenon as SAIR-TRA.
3. The mechanism of the SAIR-TRA phenomenon has been disclosed. Four stages
of this phenomenon have been distinguished and the processes involved in each
of these stages have been identified and the interrelation between these
processes has been studied.
4. It has been established that the intensity of the SAIR-TRA phenomenon depends
on the voltage applied to the cell, the type of separator used and the pre-history
of the cell before the occurrence of the phenomenon. Through appropriate
selection of the above parameters during the cell design process, it is possible to
slow down or suppress the SAIR-TRA phenomenon to such an extent as to
prevent the current and temperature from rising beyond the range of values
ensuring normal battery operation.
5. The temperature coefficients of the potentials of the positive and negative plates
have been determined under conditions of operative oxygen cycle. The
temperature coefficient of the positive plate potential is found to be between 1.7
and 3.5 mV/oC, whereas that of the negative plate potential is very small or equal
to zero. This latter value is attributed to the influence of temperature on the
dissolution of oxygen in the H2SO4 solution covering the lead surface of the
negative plate and to its diffusion through the thin liquid film covering the lead
surface.
35
6. It has been established that at lower efficiencies of the oxygen cycle, some
process may take place at the negative plates that may limit the capacity of these
plates and hence the battery capacity will decline. This effect of the OxCy on the
performance of the battery can be avoided through selection of appropriate mode
of battery operation as well as through some technological improvements.
General conclusion: All planned activities within the Work Program of the present
Project have been completed successfully and the end goal of the project has been
achieved.
36
What should be done within a next stage of investigations
of the SAIR-TRA phenomenon?
The basic mechanism of the processes causing the SAIR-TRA effect has been
disclosed within the present project. Future research efforts should be focused in two
directions:
I. Oxygen cycle
To find methods to control the SAIR-TRA phenomenon. To achieve this aim it is
necessary:
(a) to perform thermodynamic investigations of the OxCy processes and to identify
the reactions with the smallest thermal effect;
(b) to find separators that can suppress the SAIR-TRA phenomenon within normal
battery operation limits.
II. Lead-acid batteries
To establish the influence of the OxCy processes on the performance characteristics
of the battery through:
(a) determining the changes caused by the SAIR-TRA phenomenon on battery
performance (mainly on capacity);
(b) finding battery design solutions to reduce (suppress) the SAIR-TRA effect on
battery performance.
Our laboratory, the Lead-Acid Batteries Department of the Institute of
Electrochemistry and Energy Systems (former CLEPS), has all necessary
equipment, hardware and software, as well as highly qualified and experienced
research personnel, capable of achieving the above goals within a period of 2-3
years. If the US Army European Research Office is interested, we are ready to
negotiate on the scope, term and cost of a second stage of the TRA Project.
The present report will be submitted for publication in the Journal of Power Sources
after minor revision.
37
Literature cited
1. Project title “Mechanism of thermal runaway in VRLA batteries and methods to
suppress it”, 1st Interim Report, Jan. 2004.
2. Project title “Mechanism of thermal runaway in VRLA batteries and methods to
suppress it”, 2nd Interim Report, May 2004.
3. Project title “Mechanism of thermal runaway in VRLA batteries and methods to
suppress it”, 3rd Interim Report, Oct. 2004.
4. D. Pavlov, J. Power Sources, 64 (1997) 131.
5. A. Kirchev, D. Pavlov, B. Monahov, J. Power Sources, 113 (2003) 245.
6. D. Pavlov, A. Kirchev, M. Stoycheva, B. Monahov, J. Power Sources, 137 (2004)
288.
7. D. Pavlov, A. Kirchev, B. Monahov, J. Power Sources, (in press).
8. J. Heyrowsky, Cas. cesk. Lekarn., 7 (1927) 242.
9. A.I. Krasilshtikov, J. Phys. Chem. (rus), 21 (1947) 849.
10. A.I. Krasilshtikov, J. Phys. Chem. (rus), 23 (1949) 332.
11. G. Siver, B.N. Kabanov, J. Phys. Chem. (rus), 22 (1948) 53.
12. I.M. Kolthoff, J. Jordan, J. Am. Chem. Soc., 47 (1952) 4801.
13. S. Winkelmann, Z. Elektrochem., 60 (1956) 731.
14. M.V. Stackelberg, Polarographische Arbeitsmethoden, Berlin, 1950, s. 172.
15. A.I. Krasilshtikov, B.A. Abdreeva, J. Phys. Chem. (rus), 27 (1953) 389.
16. M.C. Davies, M. Clark, E. Yeger, F. Hovorka, J. Electrochem. Soc., 106 (1959)
56.
17. J.O’M. Bockris, L.F. Oldfild, Trans. Faraday Soc., 51 (1955) 248.
18. A.I. Krasilshtikov, J. Phys. Chem. (rus), 26 (1952) 216.
19. R. Gerischer, H. Gerischer, Z. phys. Chem. (N.F.), 6 (1956) 178.
38
Annex 1
ARL–ERO RESEARCH PROJECT STATEMENT
Project title: “MECHANISM OF THERMAL RUNAWAY IN VRLA BATTERIES
AND METHODS TO SUPPRESS IT”
CONTRACT NUMBER: N62558-03-M-0805 Contractor Name: Central Laboratory of Electrochemical Power Sources (CLEPS) Lead-Acid Batteries Dept. Address: Acad. G. Bonchev street, block 10, Sofia 1113, Bulgaria
Phone: +359 2 718651 Fax: +359 2 731552
Total amount funded: $50,000.00 for 12 months Expenditures to date: $50,000.00 for Interim Reports No.1, No. 2, No. 3 and
Final Report
Unused funds remaining: $0.00
Principal Investigator: Prof. DETCHKO PAVLOV Address: Central Laboratory of Electrochemical Power Sources (CLEPS) Lead-Acid Batteries Dept. Acad.G. Bonchev street, block 10, Sofia 1113, Bulgaria
Signature: ……………………….. Date: 10.12.2004